3.1. Global Change Assessment Model
GCAM is an integrated assessment model with interlinked representation of the economy, energy, agriculture, land use, emission, climate, and water system. It was developed by the Joint Global Change Research Institute (JGCRI), a joint research group between the Pacific Northwest National Laboratory (PNNL) and the University of Maryland [
15,
16,
17]. GCAM has been widely used to evaluate the impacts of socioeconomic development, climate policy, technology and resource development, and energy policies. For example, it has been used to analyze energy and climate issues, and has contributed to high-level modeling and assessment forums, such as the Intergovernmental Panel on Climate Change (IPCC) and the Energy Modeling Forum (EMF).
The energy system in GCAM is composed of many interconnected sectors. Each sector produces outputs that utilize several technologies that differ in cost, efficiency, and input fuels. The technologies within a sector compete with each other, in order to satisfy the output demand of that sector [
18]. The technology competition in GCAM is governed by the logit-type equation, which was originally developed by McFadden [
19].
GCAM is an equilibrium model that seeks to balance supply and demand across the markets of goods. The main “goods” here are energy, agriculture products, and—when the carbon policy is applied—carbon. In general, the algorithm to find the model solution is to: (1) choose a set of initial energy prices; (2) calculate the model resource supplies; (3) calculate the end-use demands; (4) calculate the energy (fuel) needed to satisfy the end-use demands; (5) check if the supplies equal the demands; and (6) solve the model by minimizing the difference between supply and demand by changing the price sets, and iterate the steps, until the given tolerance level is achieved.
3.2. Energy Balance of Ethiopia
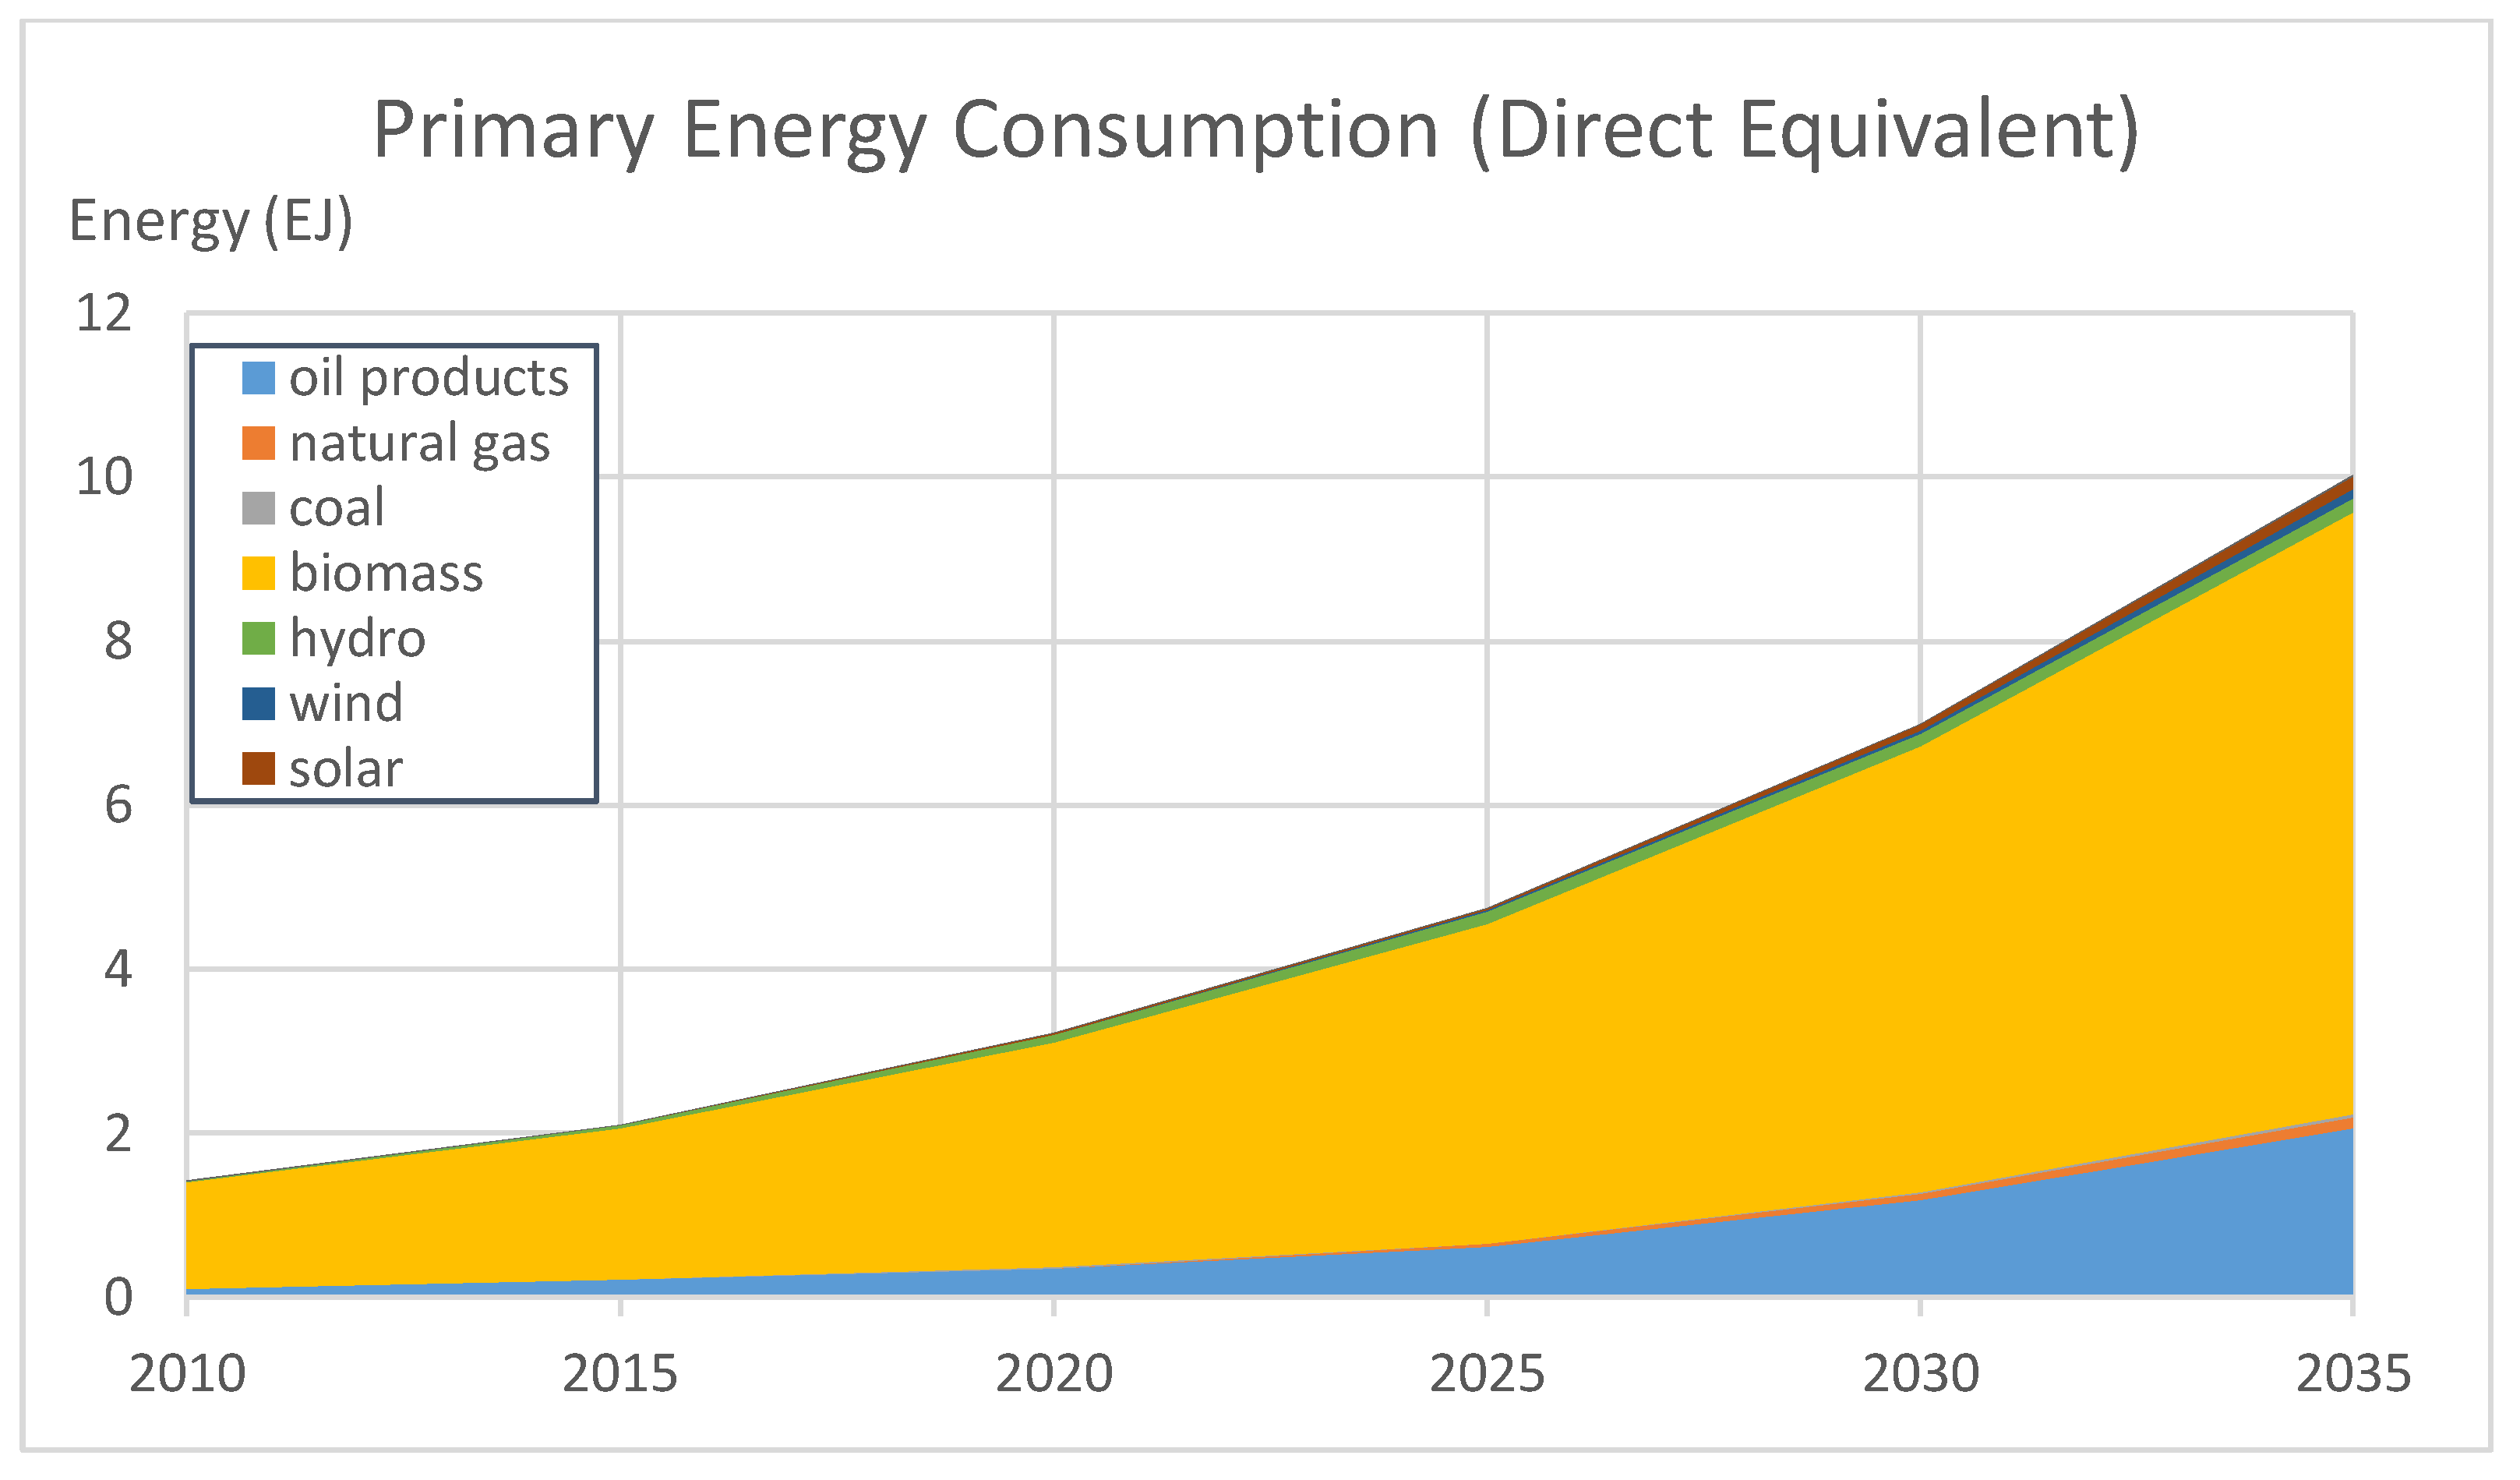
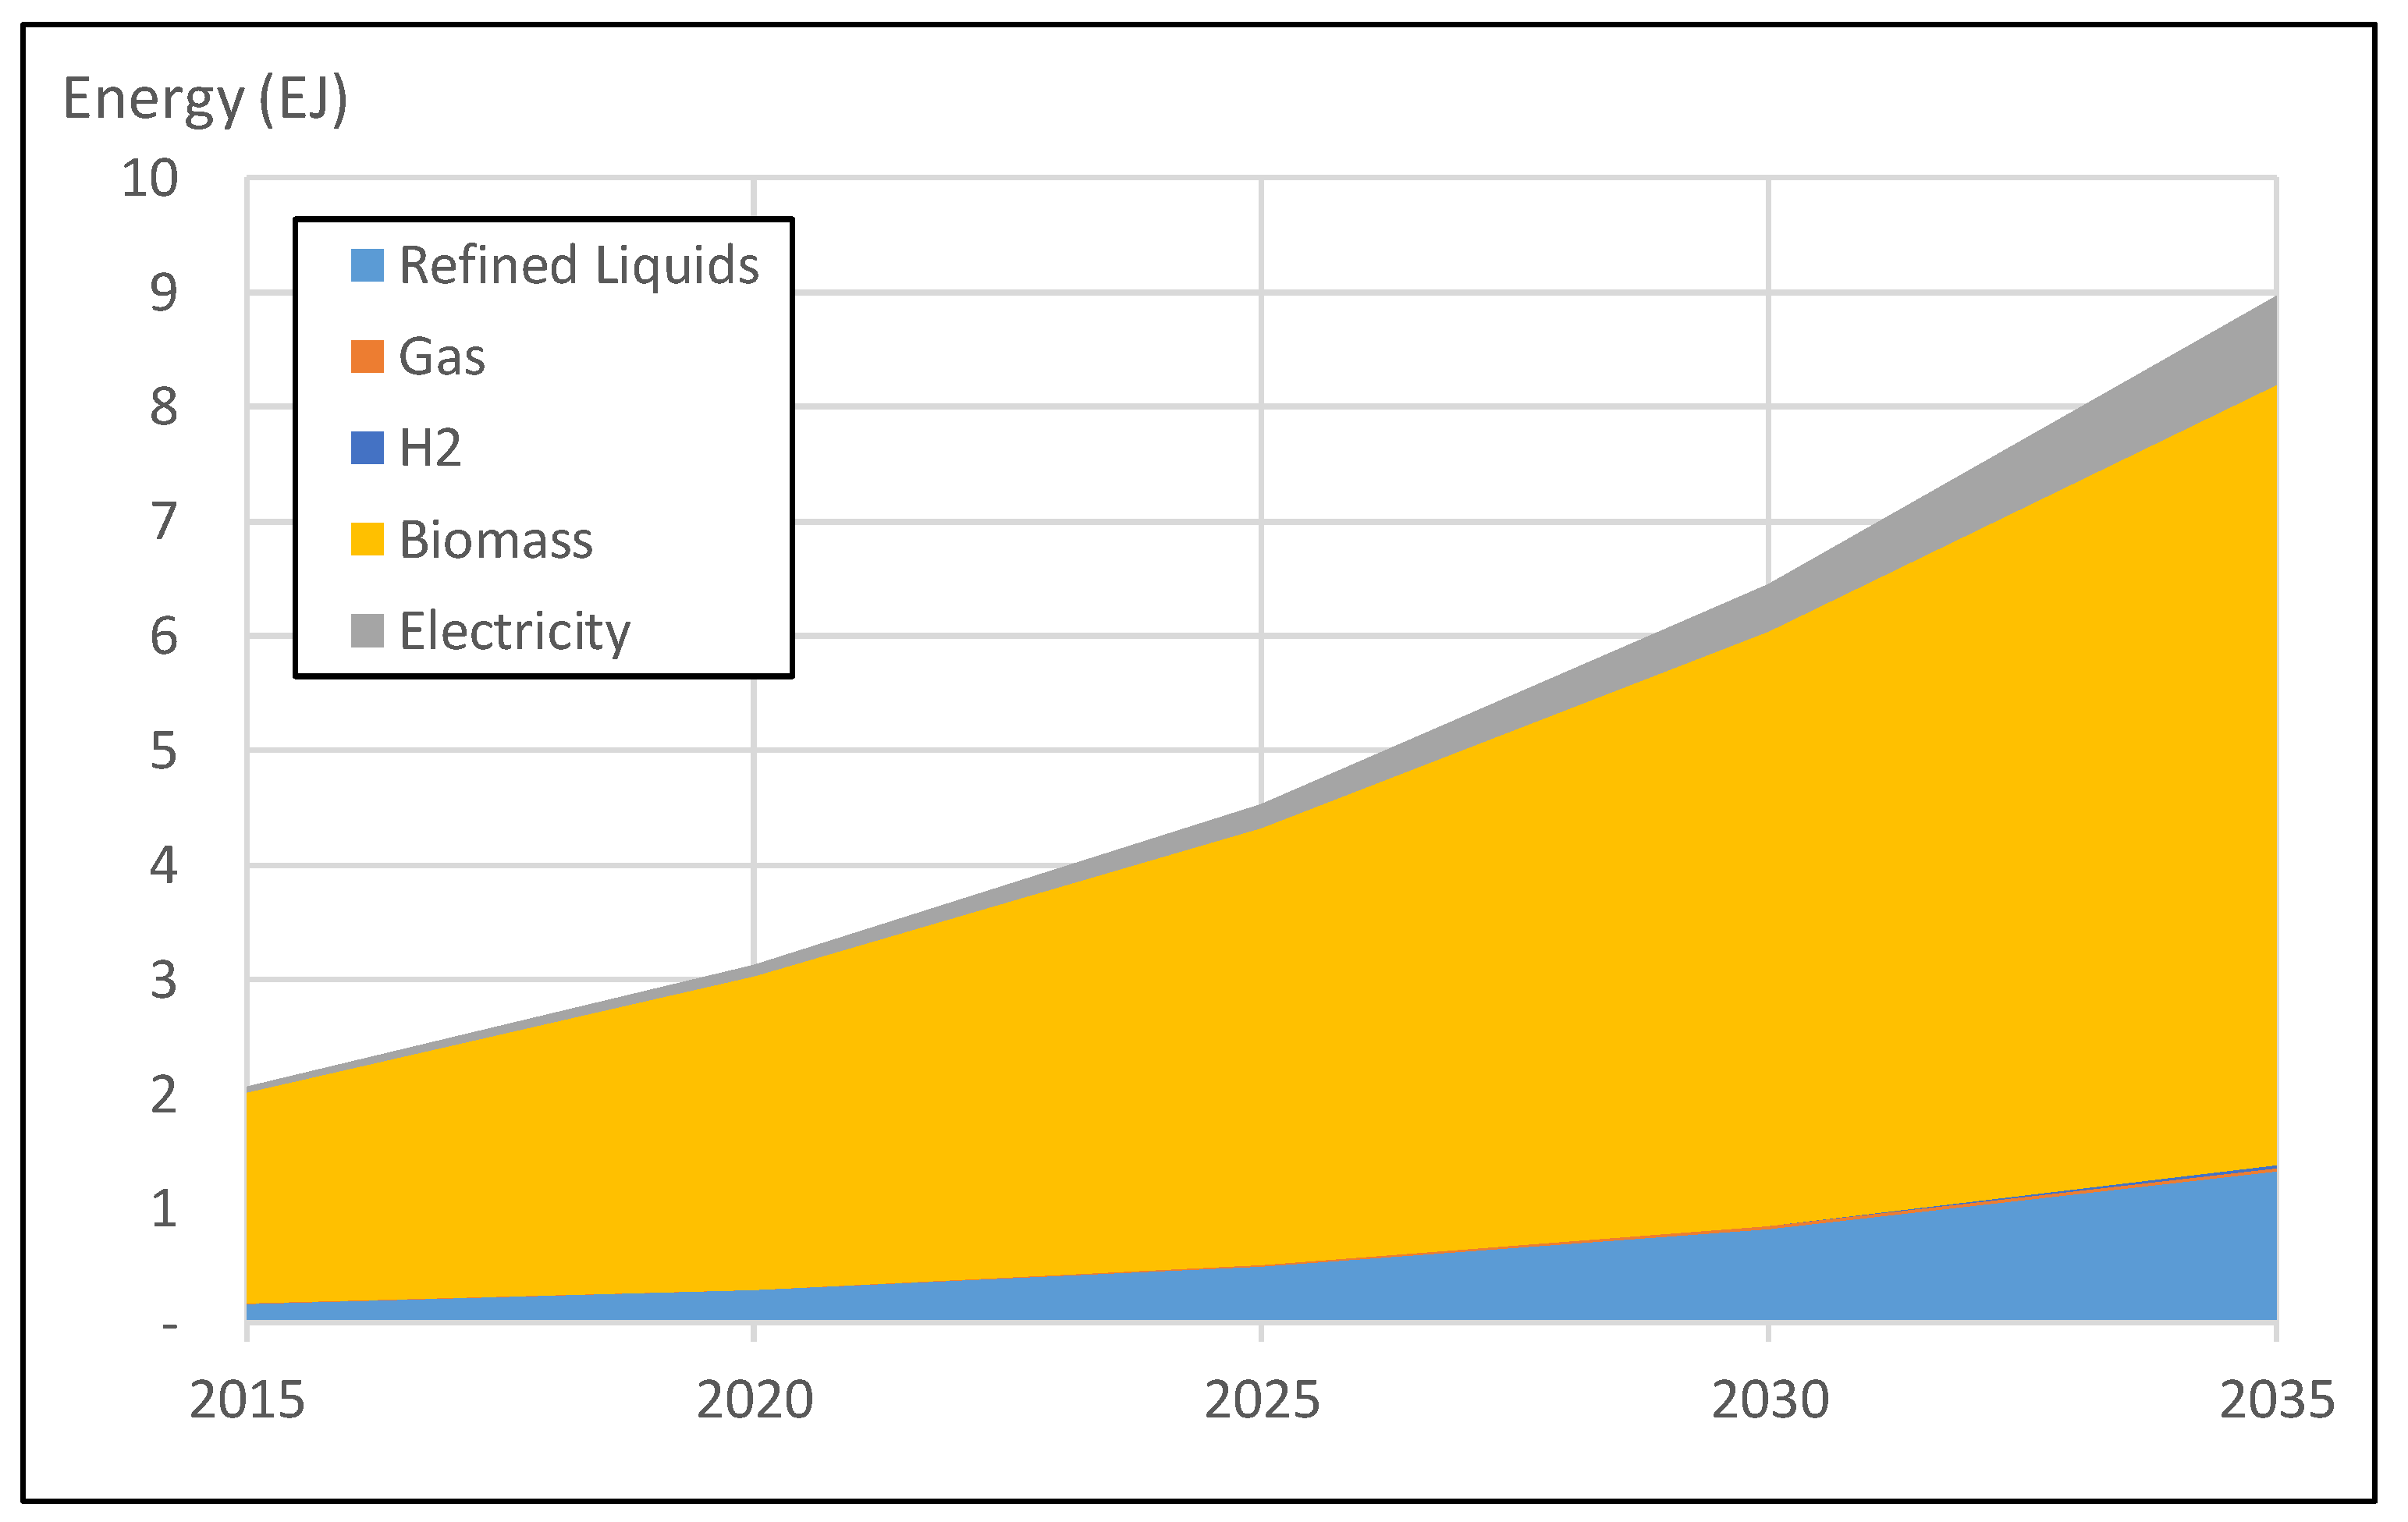
Based on the energy balance provided by the Ethiopian government, in the 2014–2015 period, it is shown that 90.14% of the total final energy consumption in Ethiopia is consumed in the household sector. Within the household sector, 98.3% of the total final energy comes from primary and delivered biomass energy. It can also be seen that 99.2% of the total final primary biomass energy is being consumed in households. From the total final energy consumption, 86.74% comes from the primary biomass energy [
20]. Please note that although the exact numbers are not the same as those of the IEA Energy Balance, the structure of this local data gathered from the Ministry of Water, Infrastructure and Energy of Ethiopia (MOWIE) [
20] in principle agrees with its IEA counterpart. For example, the biomass energy use in final energy use is high in both IEA (90%) and MOWIE (86%), and the same applies with biomass utilization in the household (99% in the case of IEA, and 98% in the case of MOWIE). It is also worth noting that the period covered in each energy balance is different, since the Ethiopia report covers July 2014–June 2015, instead of the full period of 2015. These data indicate that the other sectors (commercial, industry, transportation) consume less primary biomass energy in their mixture.
However, it must be noted that in GCAM, the data from the IEA energy balance is used to provide the historical trend for detailed energy products and flows (flow in the energy balance table indicates the elements of row, showing the flow of energy including production, transformation, and final usage type), for most, if not all, of the countries. This is due to the global nature of GCAM. For this study, the chosen approach is to utilize the IEA version of the Ethiopian energy balance to construct the base of the national model. Then, the detailed domestic energy balance, as well as other locally available information (surveys, documents, reports), are used for further augmentation of the model whenever necessary. It must also be noted that although the industry, transportation, and power sectors are modeled for this study, the whole discussion in this study is focused on the building sector and biomass utilization.
3.3. Building Sector in Ethiopia
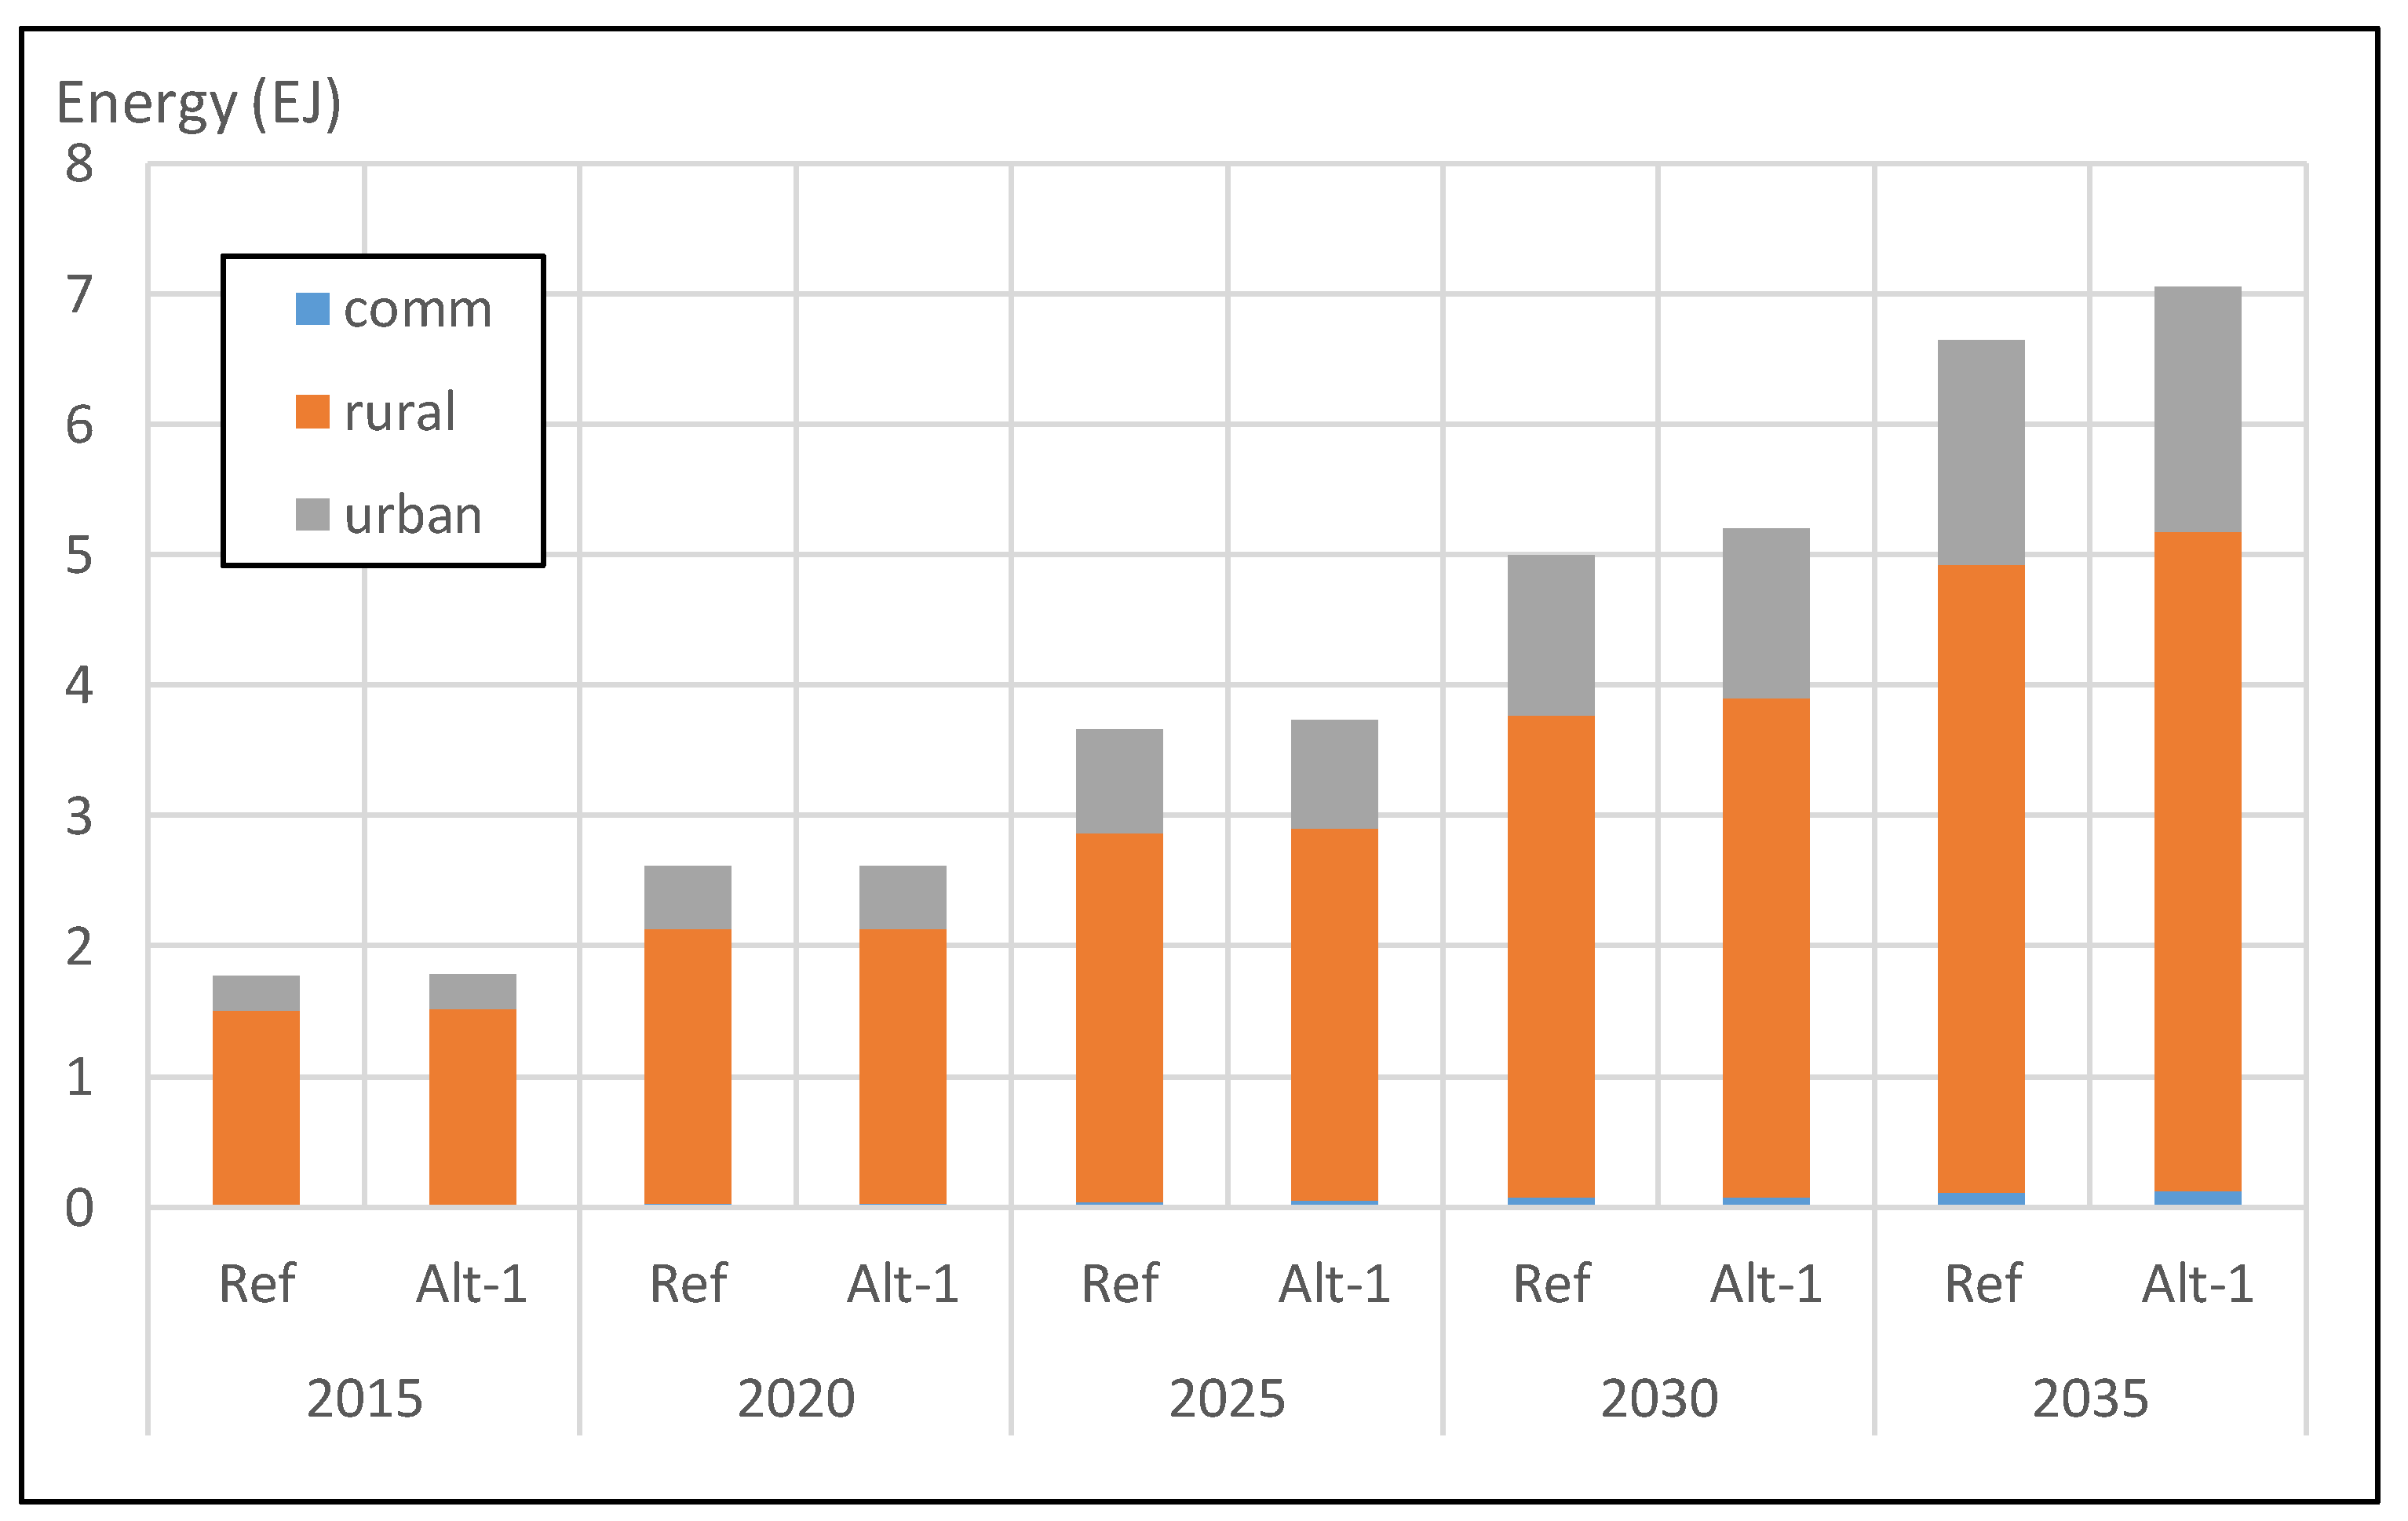
The building sector modeling of GCAM-Ethiopia is focused on the household and commercial/other consumers’ part of Ethiopia’s energy balance. For the detailed building sector modeling in GCAM-Ethiopia, additional information, such as the energy consumption by energy service type (heating, cooling, cooking, lighting, etc.) for both urban and rural areas are required. The general idea is to divide the building sector into residential (which is further divided into urban and rural areas), and commercial buildings. It is assumed that the rural commercial area is quite small in size, and the data is expected to be even more difficult to gather. As such, a single representation of the commercial sector is chosen.
One piece of information is extracted from a national survey [
21], which summarizes the percentage distribution of households by the source of energy for lighting and cooking, divided into urban and rural, as shown in
Table 1. In the case of lighting, the various forms of electricity (private, shared, and battery) are aggregated into electricity, while “Firewood” and “Other” are combined into biomass. In the case of cooking, most of the fuels (collected firewood, purchased firewood, charcoal, leaves/dung cakes, and others) are combined into biomass, while butane gas is changed to gas.
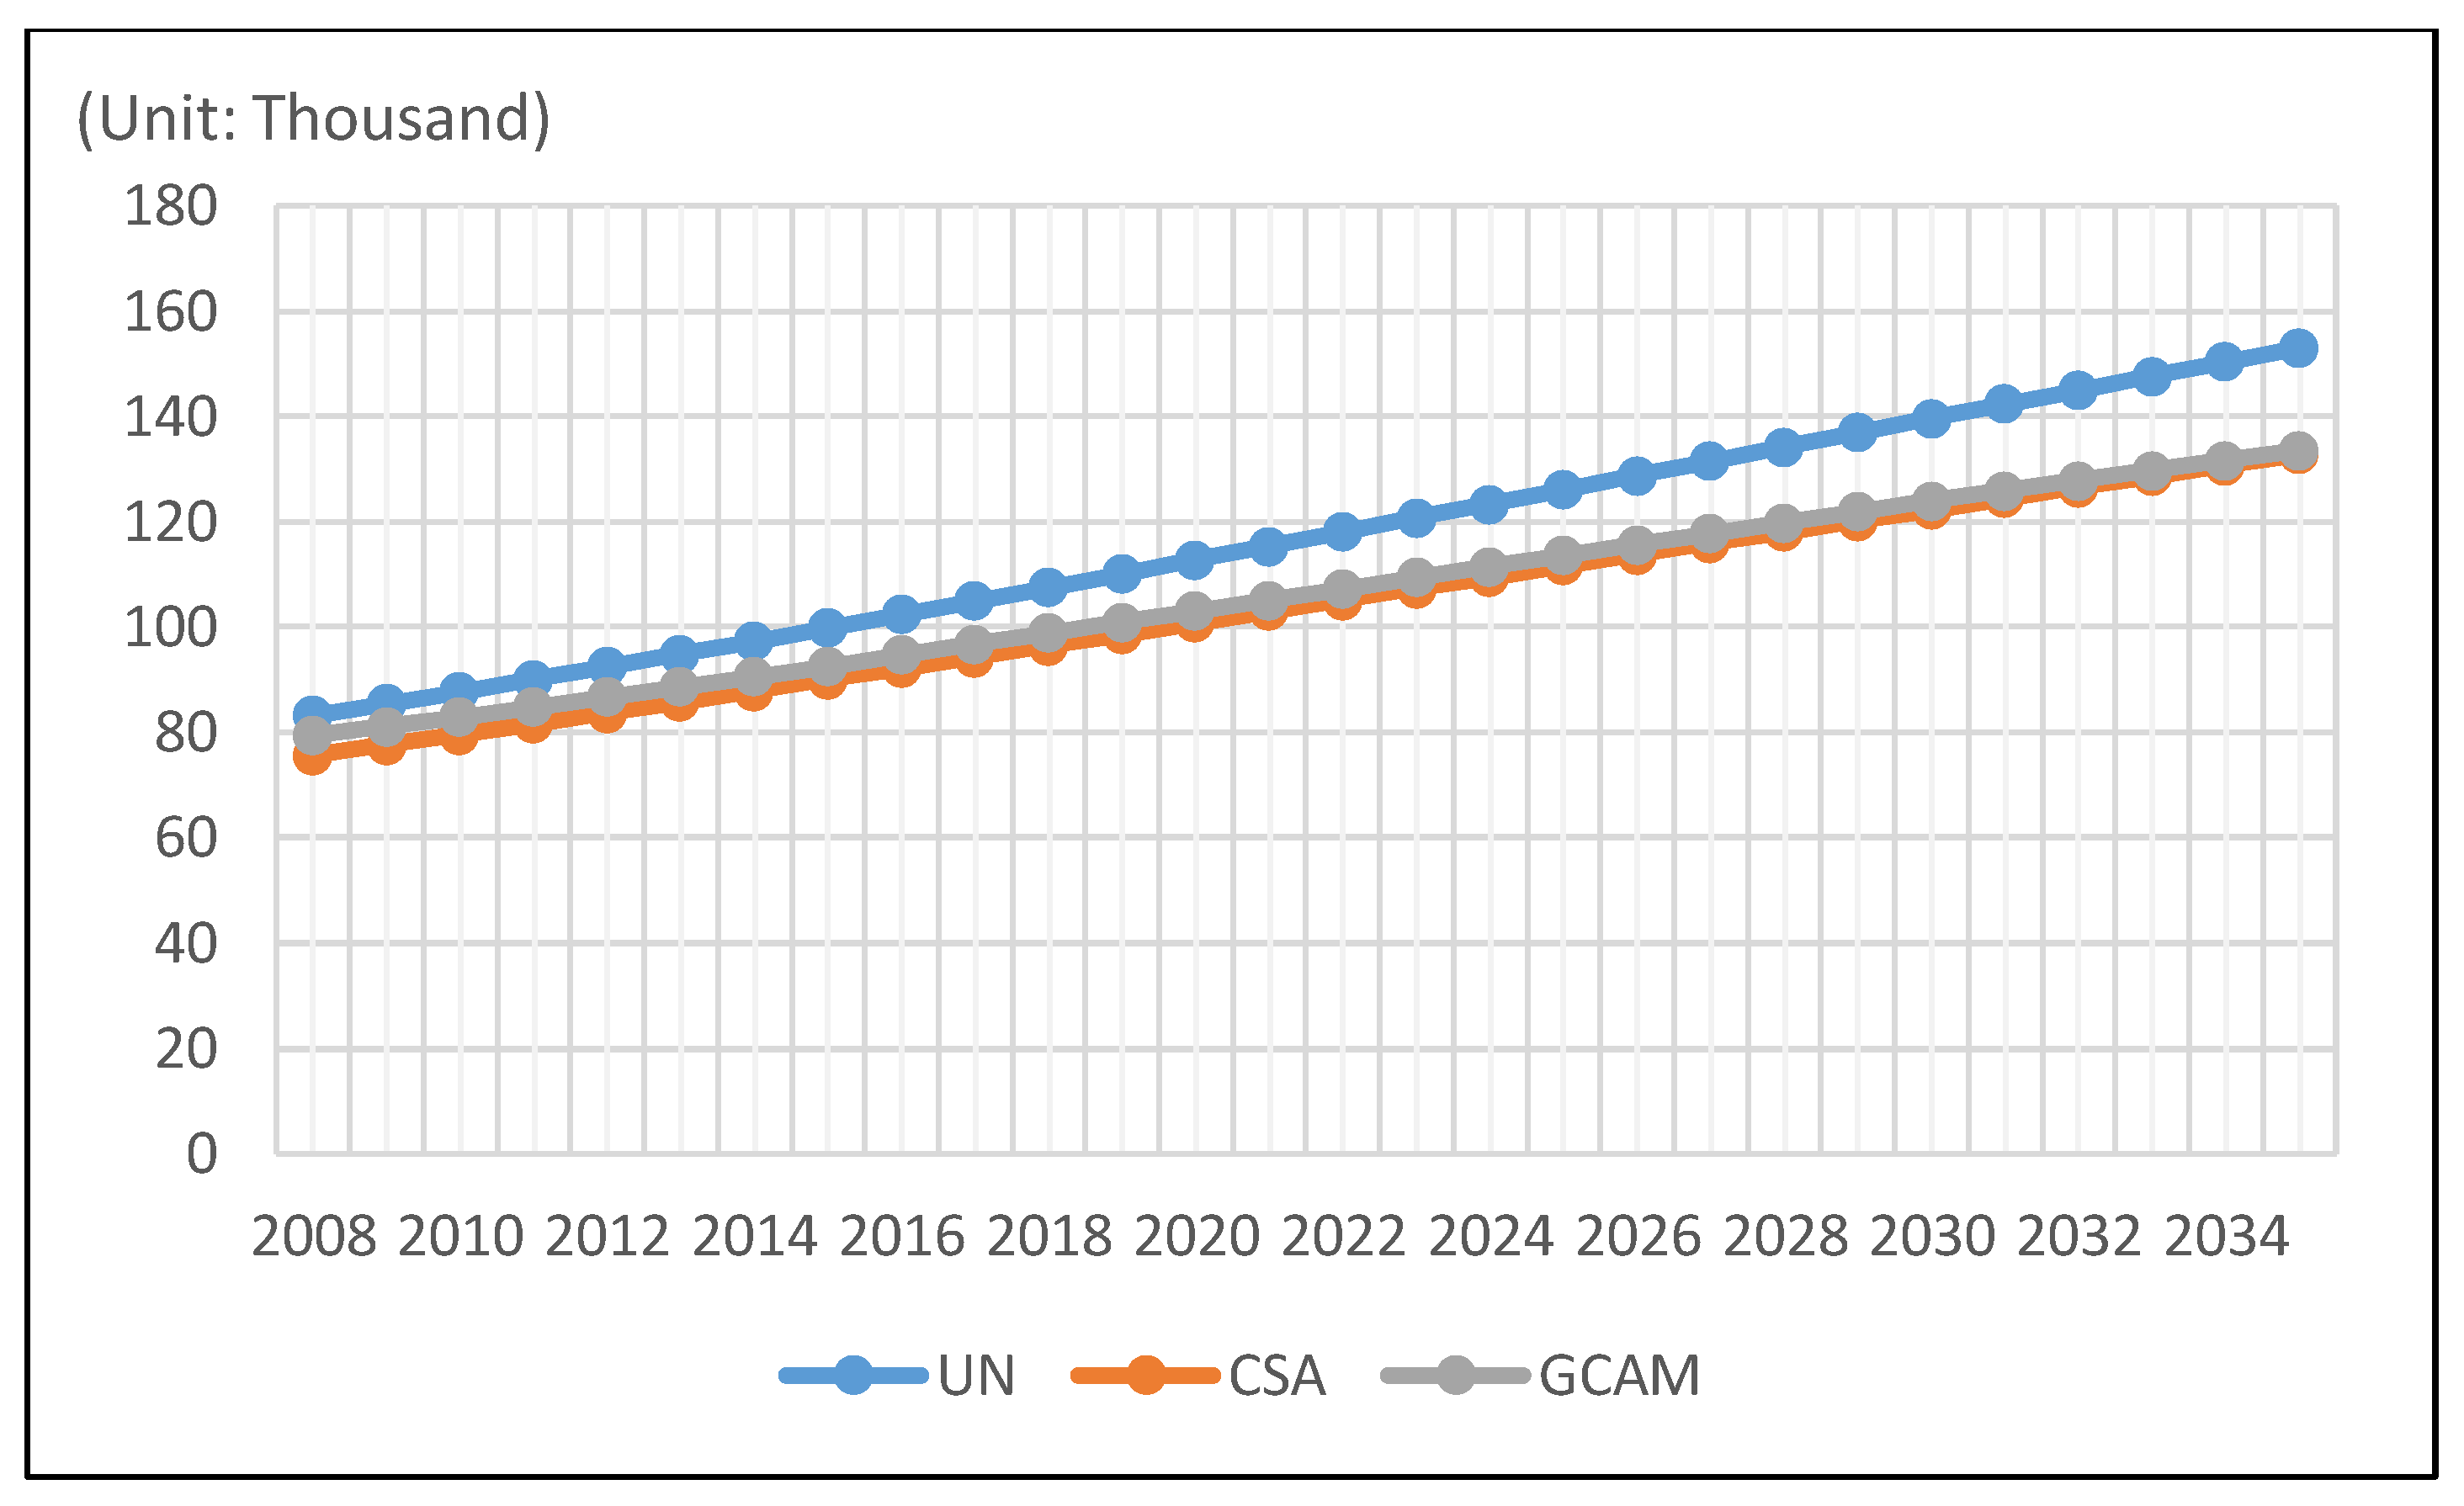
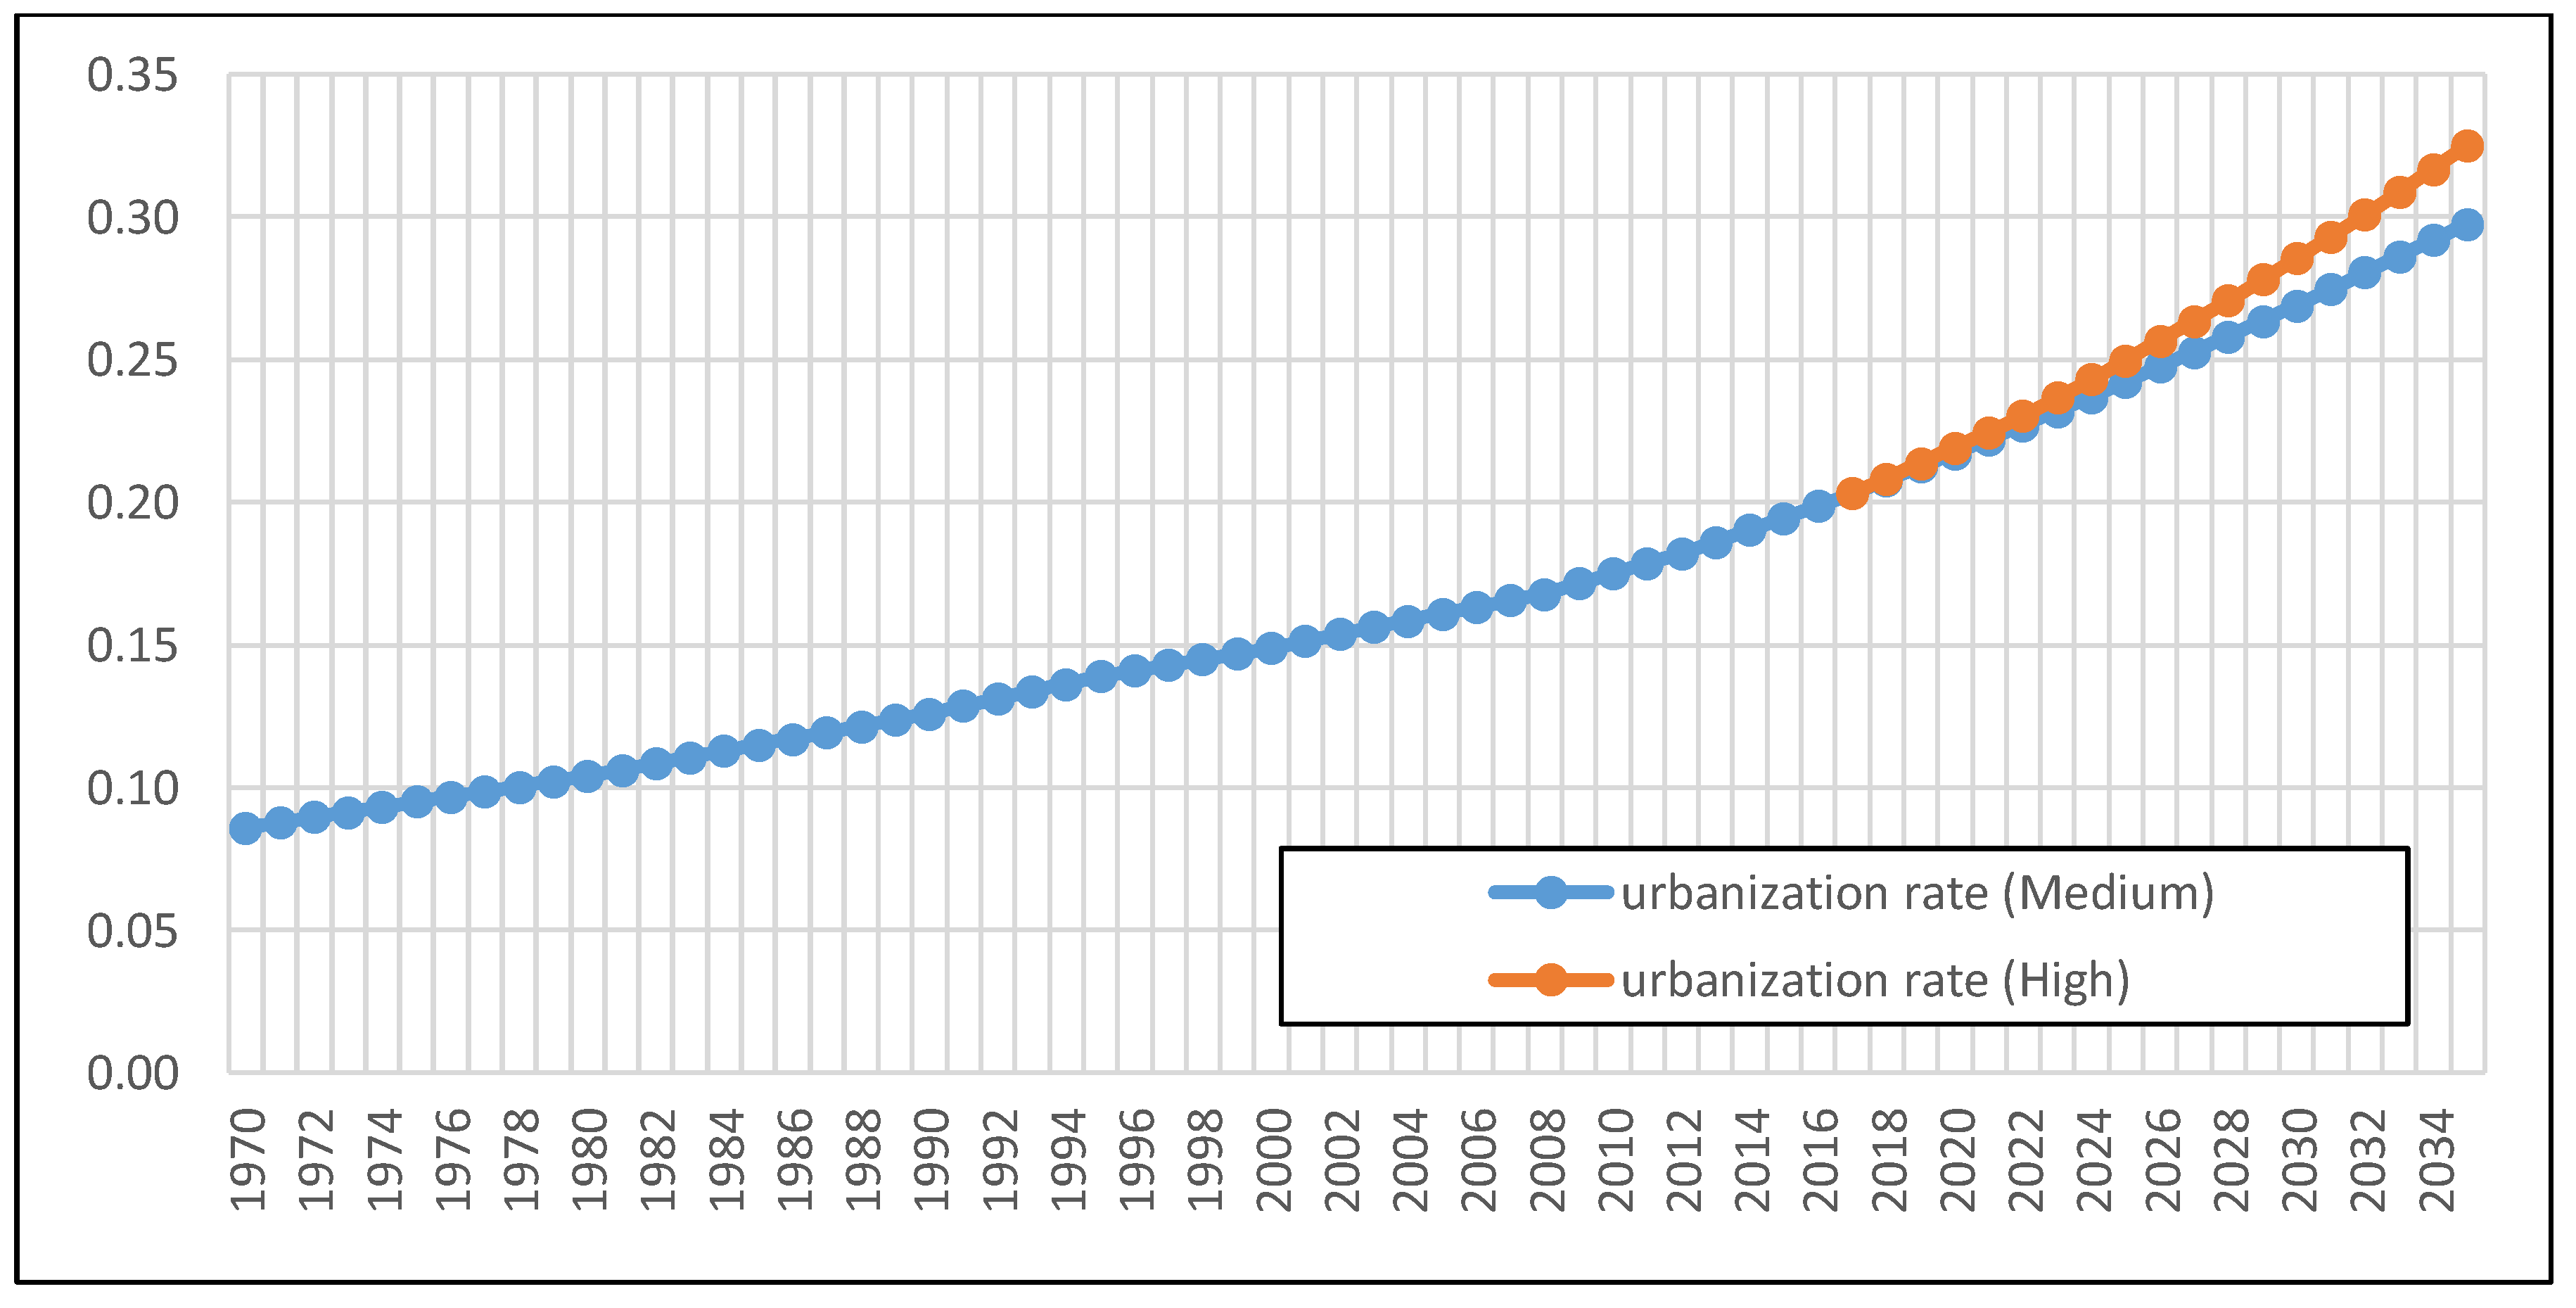
Another piece of information is the “urban population and urbanization level of 2007 and 2012 by regional states” table, which comes from the Central Statistical Agency (CSA)’s 2007 census and projection by a consultant [
22], as shown in
Table 2.
Since the given information is limited, a couple of additional assumptions are made: first it is assumed that the building sector does not consume energy for heating and cooling. Meanwhile, it is assumed that hot water technology is only required for commercial buildings, especially for hotels (it is noted that not all government buildings in the capital city, Addis Ababa, have air conditioners installed; the same applies to most of the hotels). Residential buildings are assumed to not yet require hot water. Another assumption is made to allocate all LPG and refinery gas usage in the residential sector to cooking in urban regions.
According to MoWIE [
20], biomass accounts for 89.3% of the total final energy consumption. In particular, for residential sector energy consumption, 98.3% is accounted for by biomass. Documentation on the survey result of cooking and lighting energy consumption (
Table 1) only reports the percentage of energy product consumption pattern. That is, information on the physical quantity of the energy use, either in kcal, KTOE, or TJ, is not available. The same for the urban versus rural energy consumption. Therefore, the per capita energy consumption of urban and rural areas cannot be calculated based on the given information. Several other studies, such as Shanko and Lankew [
23], only provide information on the percentage of usage based on local surveys, instead of nationally aggregated energy consumption.
A closer examination of Mulugetta [
11] provides some information on this issue: Providing examples clearly differentiates the total final energy consumption of urban and rural areas. The urban vs. rural area final energy consumptions are 892 and 11,814 KTOE, respectively, showing the urban energy consumption is only 7.55% of that of the rural. This case is based on the population of 56.4 million with an urbanization rate of 13%, showing an urban population of only 15.1% of the rural population. With
and
denoting
E,
P,
U, and
R as energy consumption, population, urban, and rural, respectively, urban per capita energy consumption for the given case, per capita energy consumption of urban to rural, is found to be 0.5 (This value can vary between countries. For example, Chaturvedy et al. [
24] reported that in India, the urban energy consumption per capita is larger than that of urban area. Meanwhile, Yu, et al. [
25] reported that in China, the urban energy consumption per capita is only around 0.366 of its rural counterpart.):
Another report from Wolde-Ghiorgis [
12] shows similar information in 1996. The data reported here suggests that out of 644,749 TJ (15,399 KTOE) energy consumption in the household sector, 602,184 TJ (14,383 KTOE) comes from rural households, while the urban residential sector consumes 42,565 TJ (1017 KTOE). This shows that urban energy consumption is still low in comparison to that of rural, which is at 7.07%. However, as mentioned above, there is no recent information for Ethiopia that is reliable enough to be used in this study.
Instead of using a readily available compact dataset, through a combination of the information on per capita energy consumption with the survey results on energy consumption pattern [
21], and utilization of the energy balance table [
5], it is possible to disaggregate the energy balance table for urban and rural cases. However, several assumptions are required, considering the lack of information on energy consumption. One of such assumptions is taken to calculate the 2010 value of urban/rural energy consumption ratio from the value found in Mulugetta [
11], which is 0.5. The assumption is that urbanization would increase the energy consumption per capita in the urban areas by the same rate, while the rural area energy consumption per capita is held constant. Based on this calculation, the ratio of urban/rural energy consumption per capita is calculated to be 0.69.
In addition, the energy services required by each sector assume that there is no heating and cooling demand for both the residential (urban, rural) and commercial sectors. Also, it is assumed that there is no hot water for the residential sector, only in the commercial sector.
Regarding the consumed fuels, another assumption is that ‘LPG and refinery gas’ consumption in the residential areas is assigned exclusively for cooking service in urban areas.
Figure 1 shows the general construction process of building energy consumption data for the base year. It must be noted that in GCAM, the base year used is 2010.
Table 3 is then created based on the above design. Orange-highlighted data are taken directly from the energy balance. Such data is used as the anchor for the disaggregation process.


