Nonlinear Autoregressive Neural Network Models for Prediction of Transformer Oil-Dissolved Gas Concentrations

 ,
,
Abstract
:1. Introduction
2. Related Theory
2.1. Artificial Neural Network
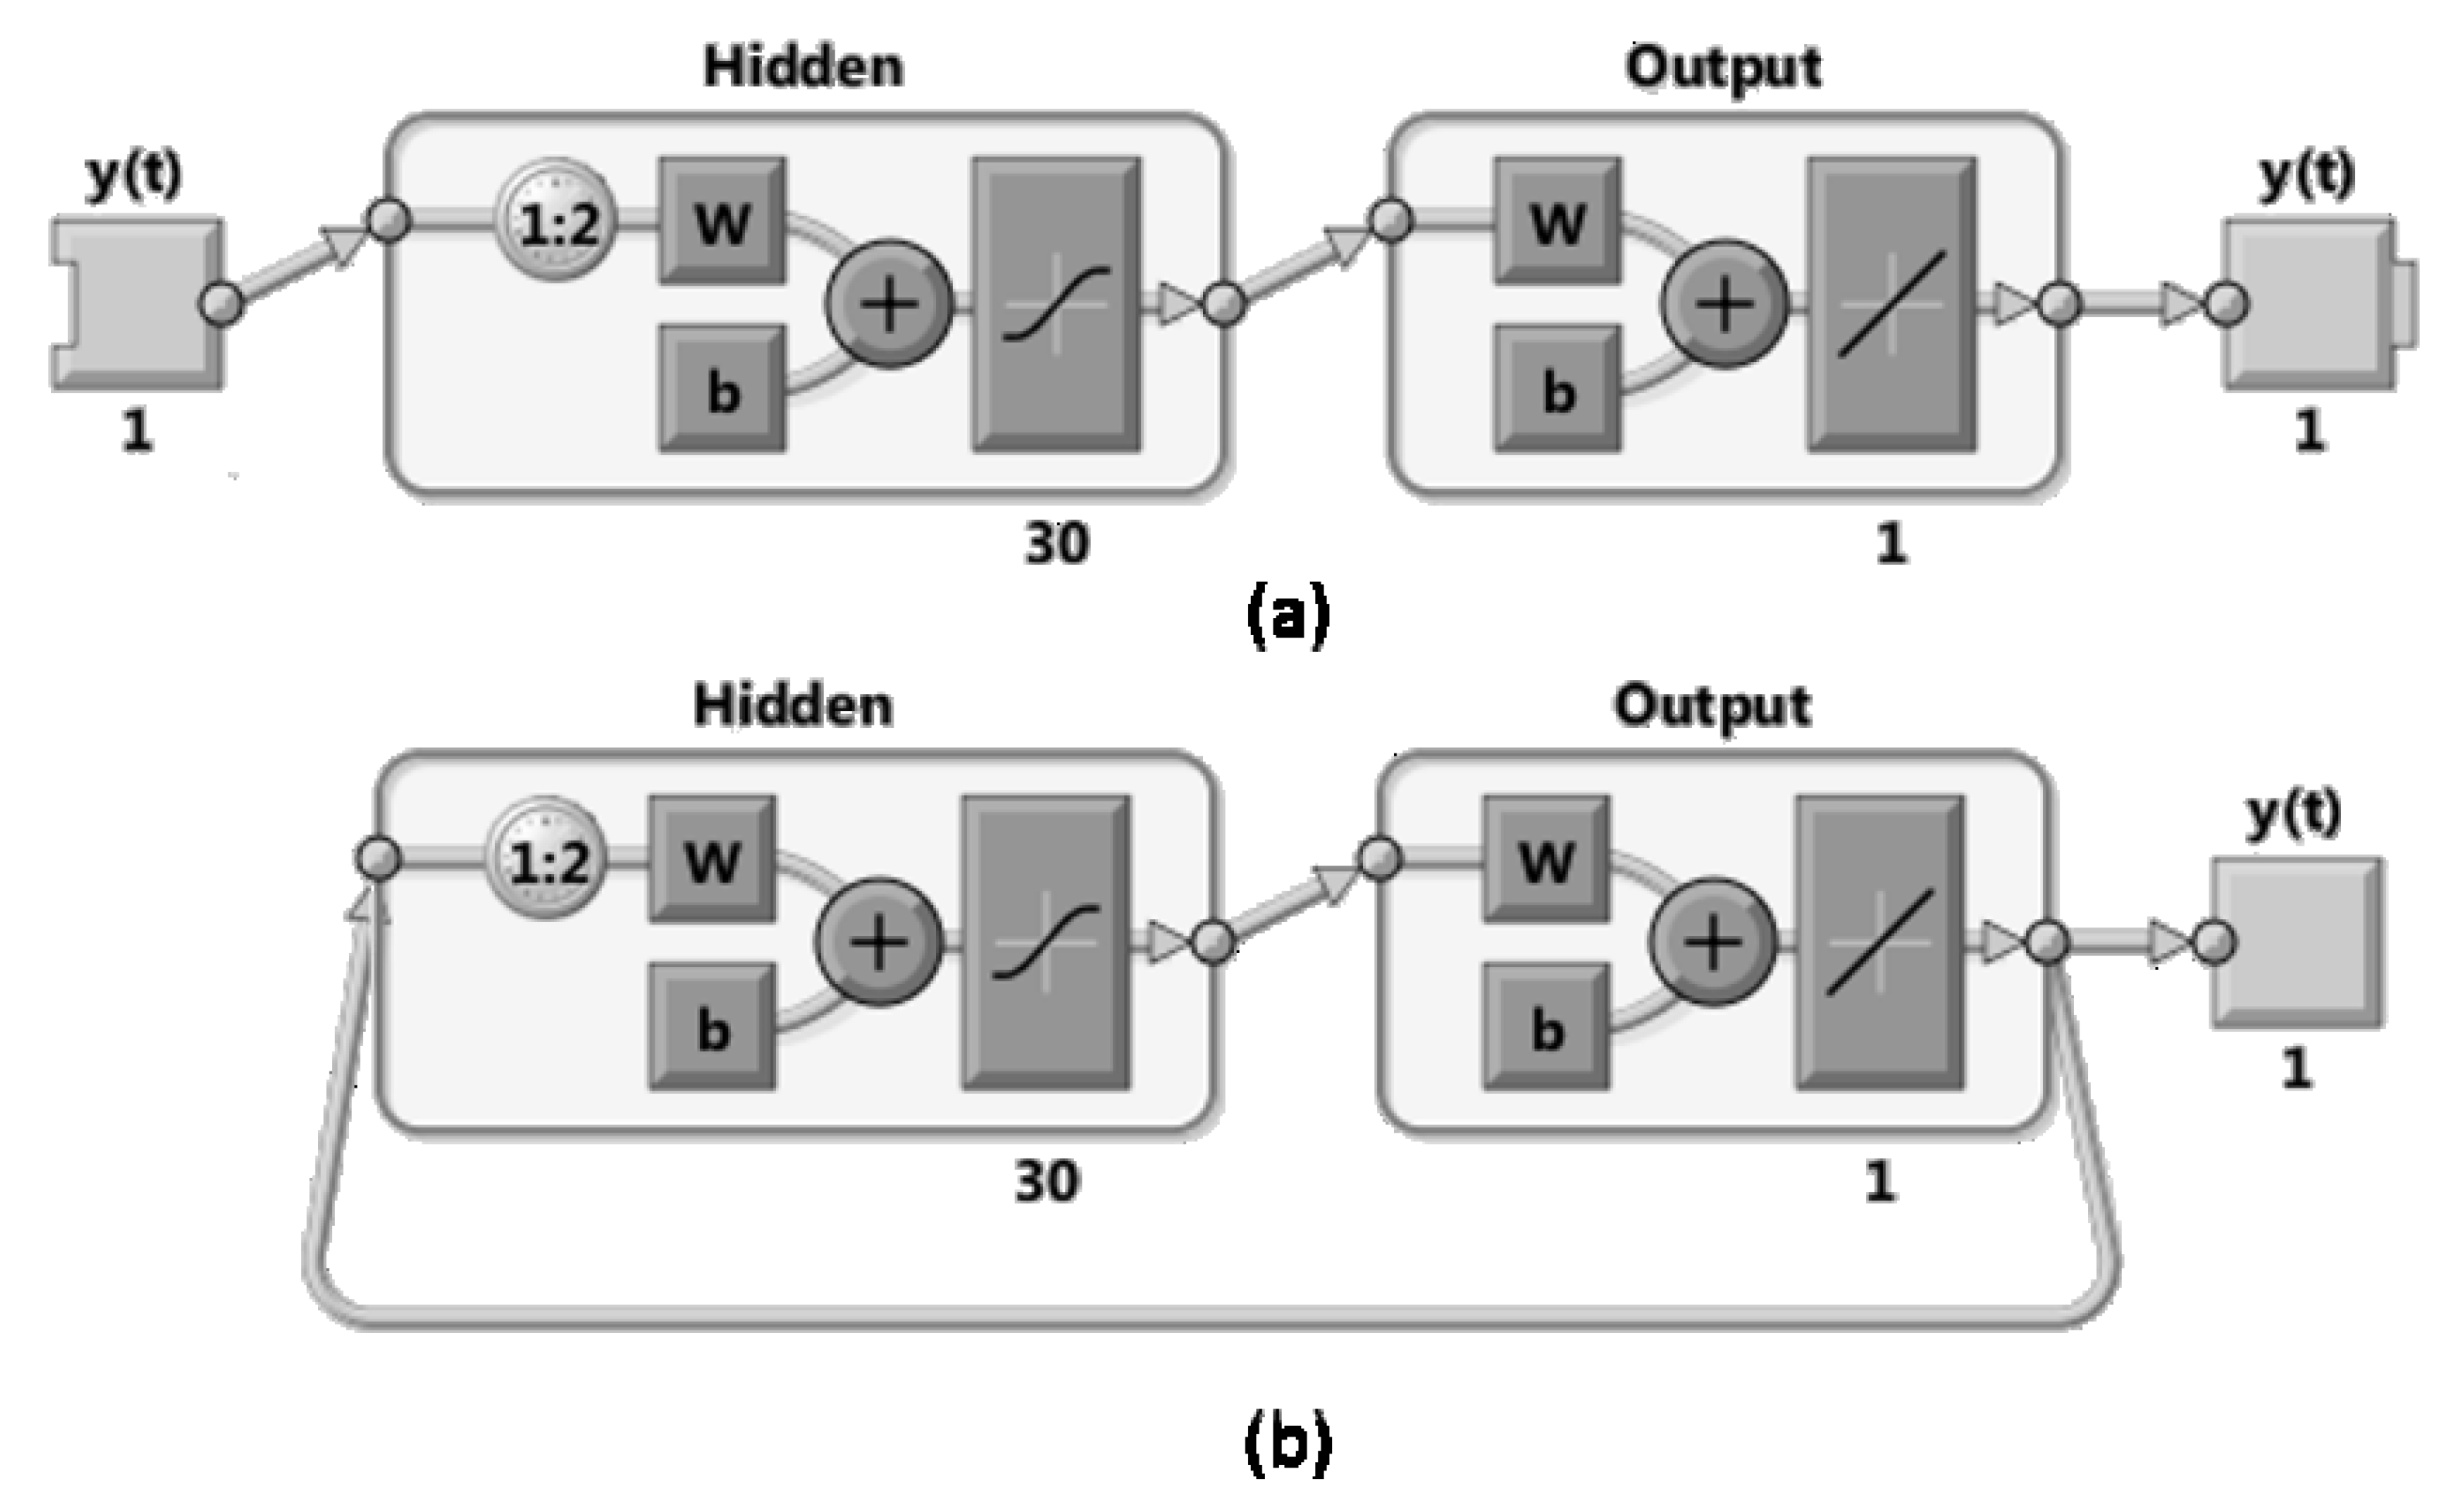
Nonlinear Autoregressive Neural Network
2.2. Discrete Wavelet Transform
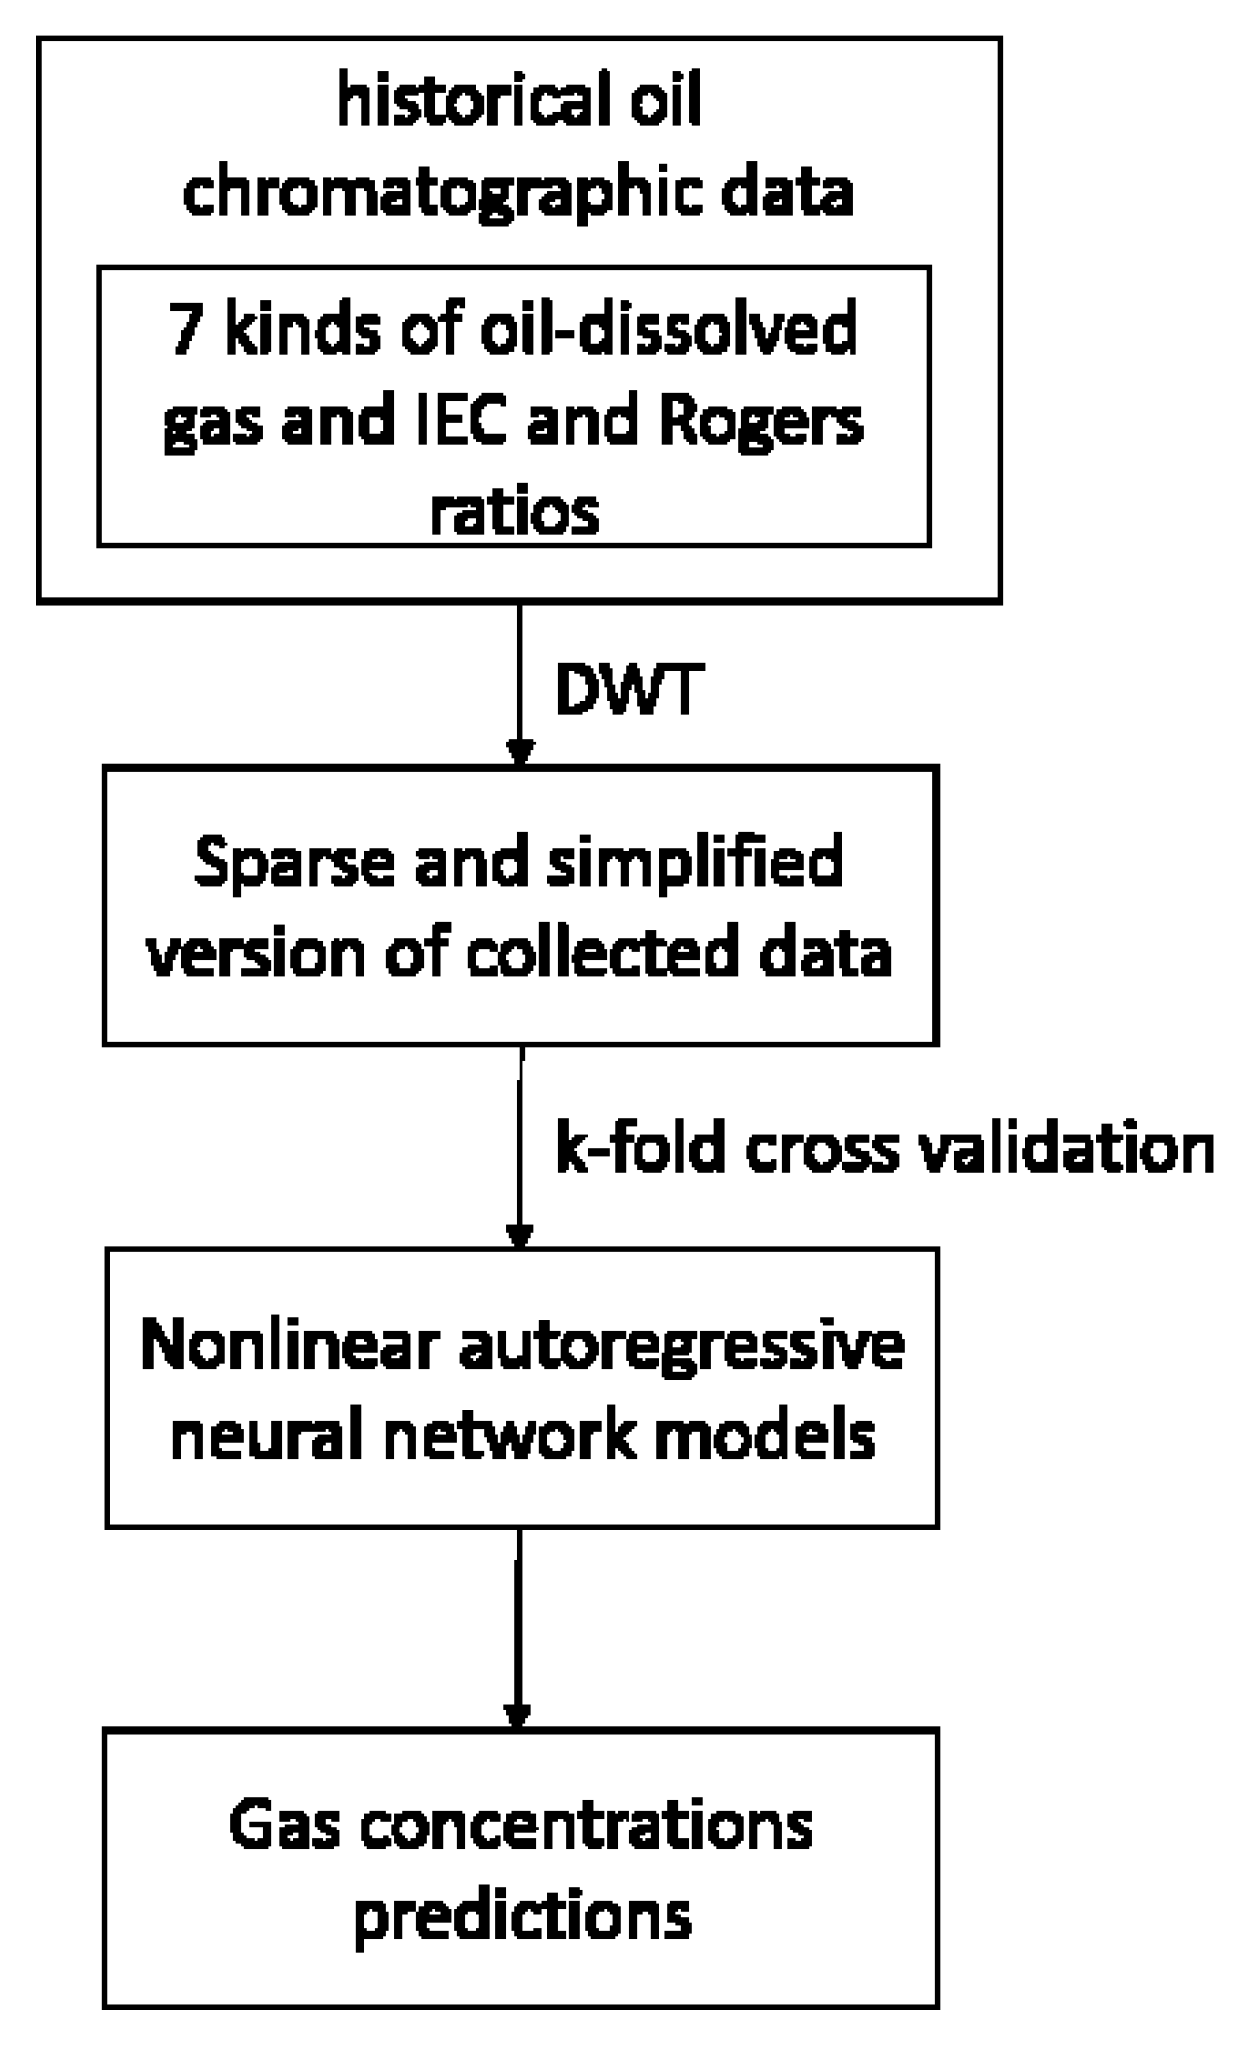
3. The Proposed Prediction Model
Prediction of In-Oil Gas Concentrations
- (a)
- The relative percentage error between target and predicted values (avg_err)
- (b)
- The maximum relative error (max_err)in which N is number of data samples, and are target and predicted value, respectively.
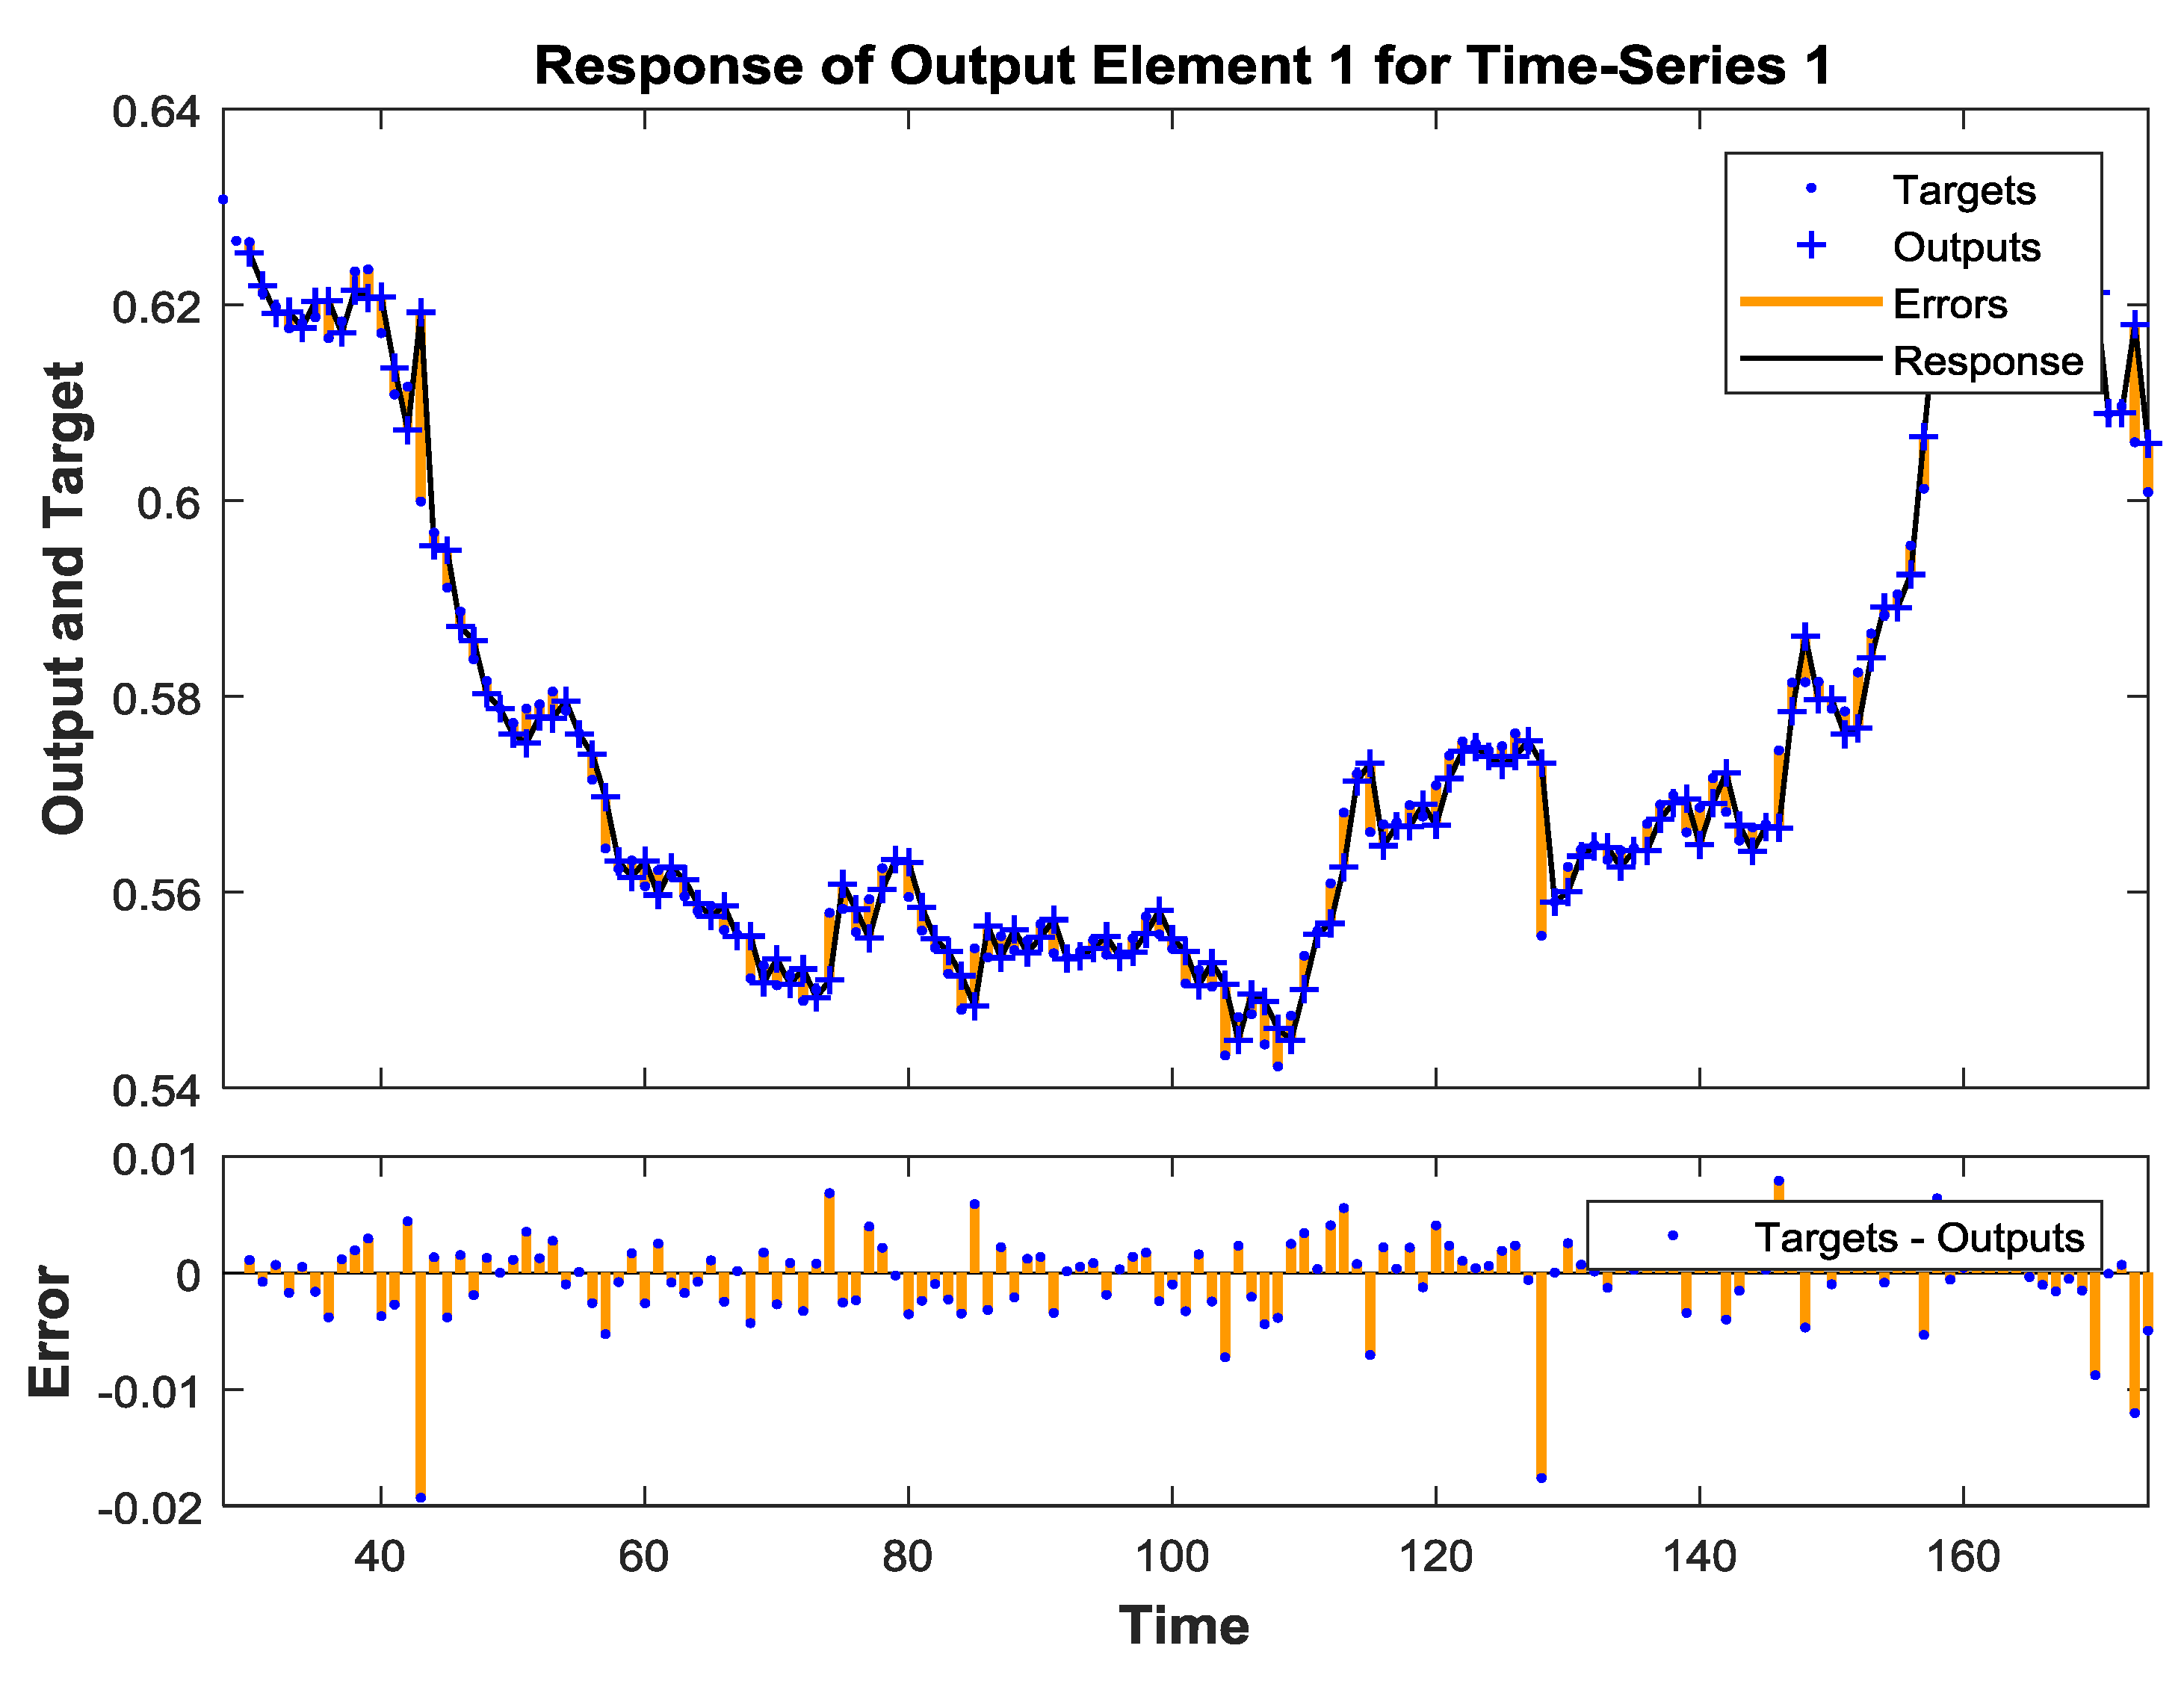
4. Numerical Results
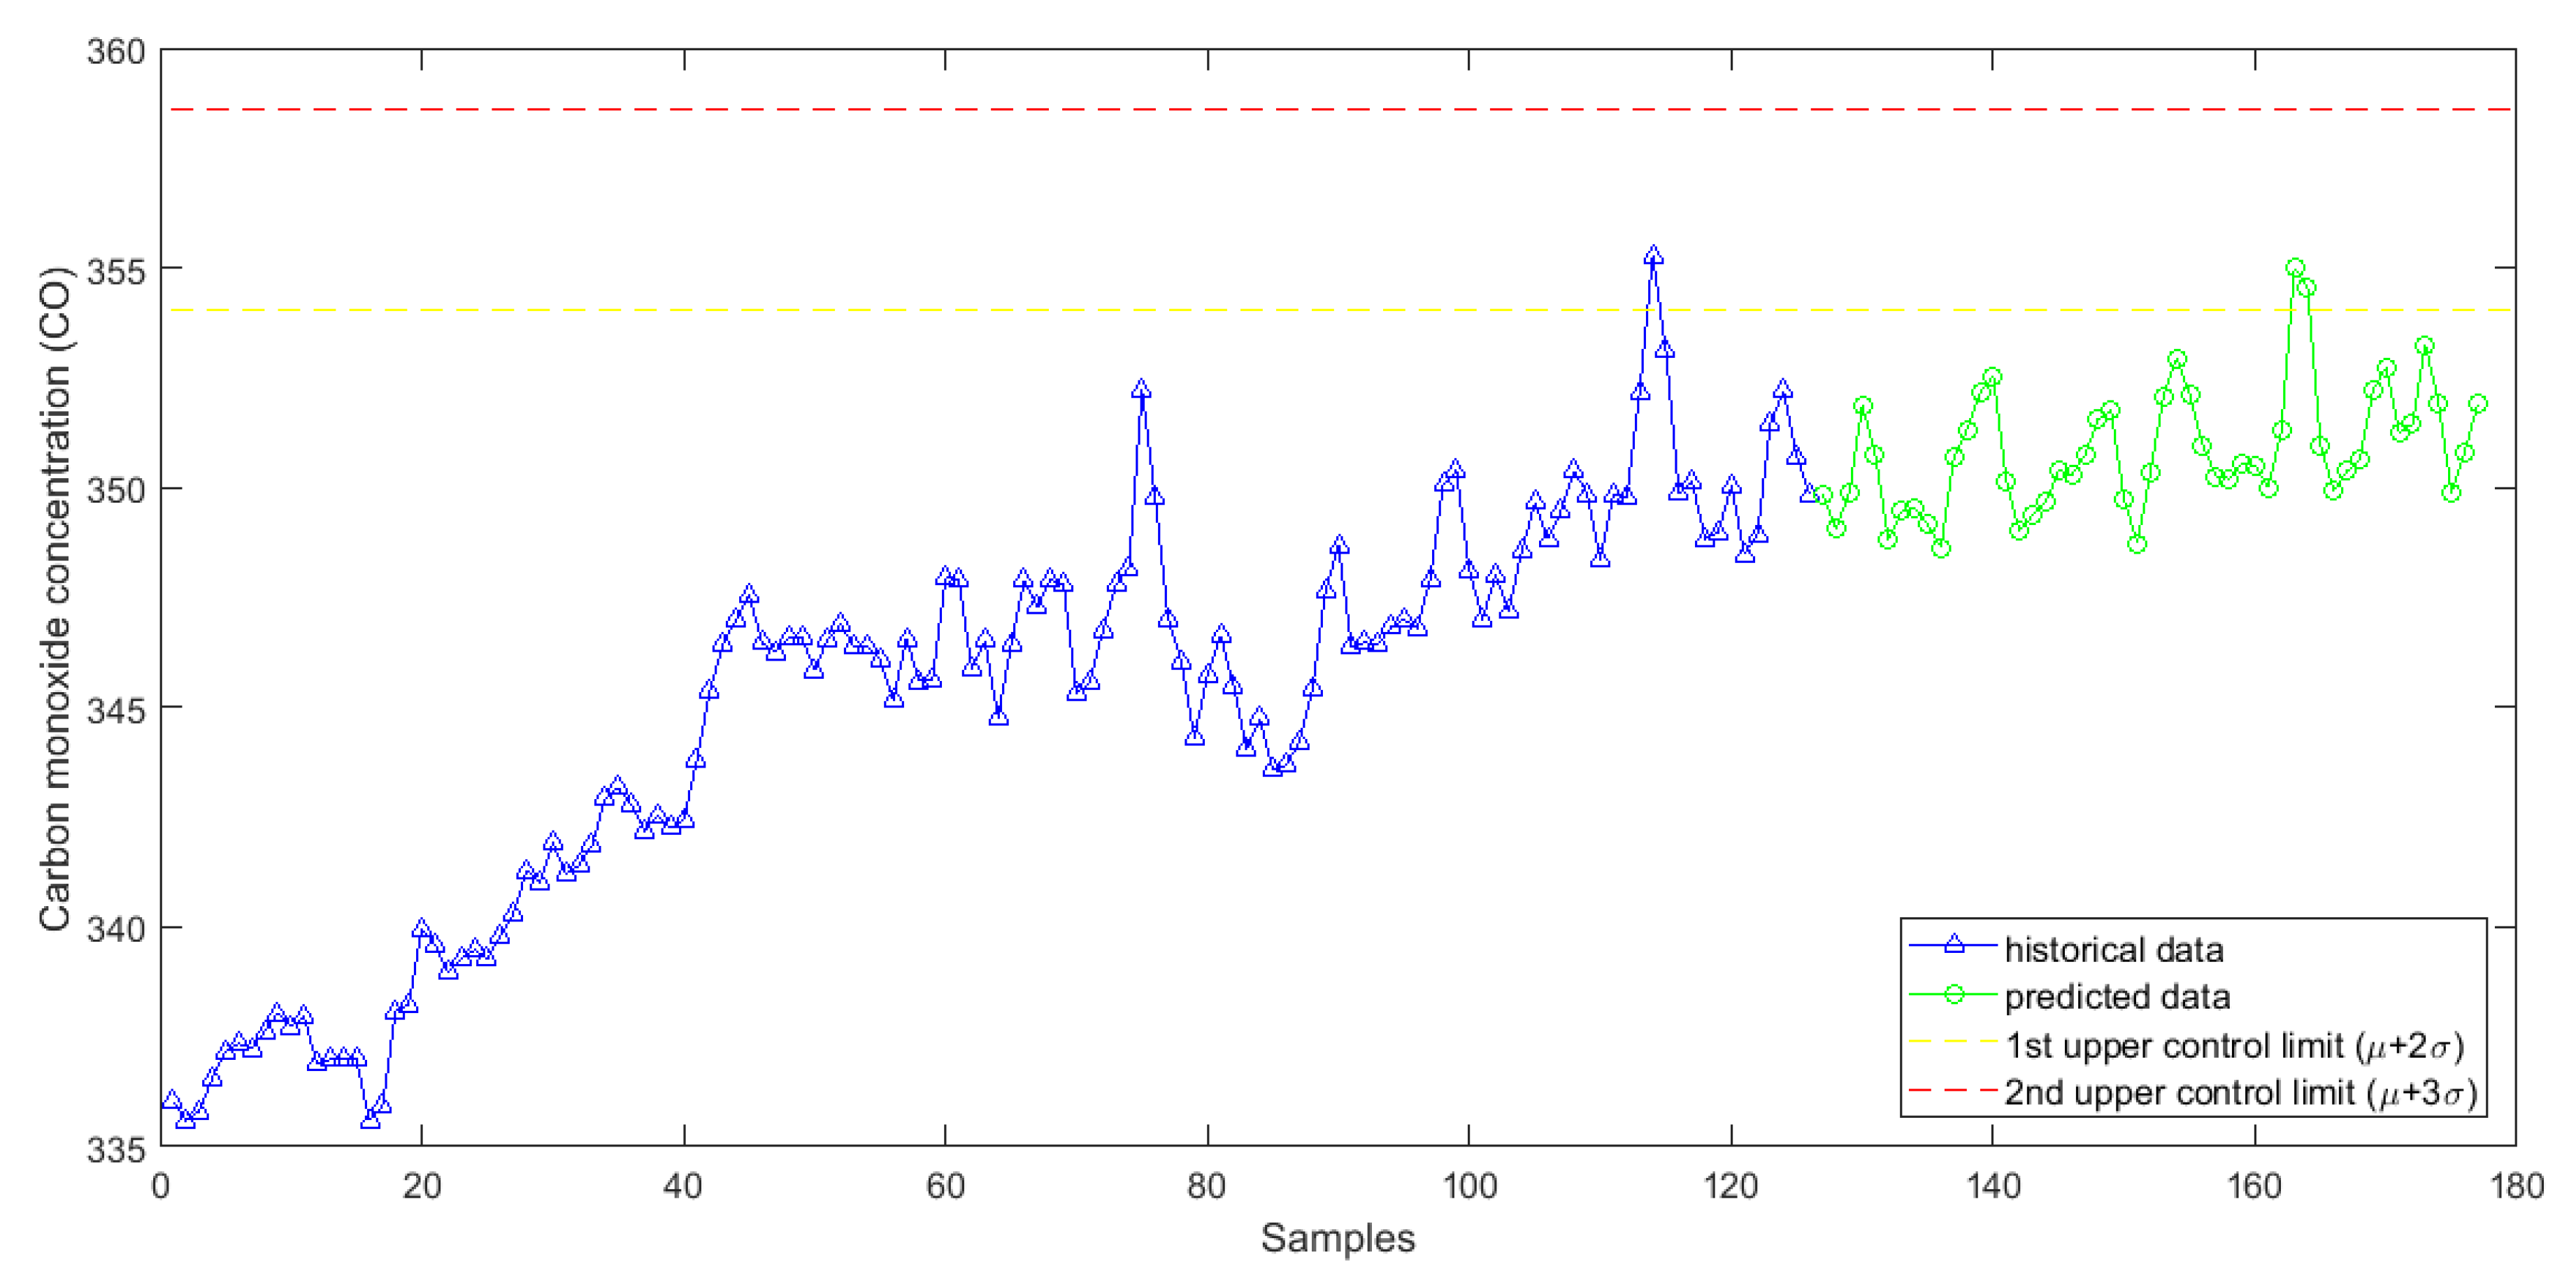
Application in the Transformer Fault Diagnosis Analysis
5. Discussion
6. Conclusions
Author Contributions
Funding
Conflicts of Interest
Nomenclature
| DGA | dissolved gas analysis |
| ANN | artificial neural network |
| EPS | expert system |
| AI | artificial intelligence |
| SVM | support vector machine |
| MLP | multi-layer perceptron |
| BP | back propagation |
| BPNN | back propagation neural network |
| GRNN | generalized regression neural network |
| ML | machine learning |
| IEC | International Electrotechnical Commission |
| IEEE | Institute of Electrical and Electronics Engineers |
| D | time delay parameter |
| H2 | hydrogen gas |
| CO | carbon monoxide gas |
| CO2 | carbon dioxide gas |
| CH4 | methane gas |
| C2H | acetylene gas |
| C2H4 | ethylene gas |
| C2H6 | ethane gas |
| NAR | Nonlinear autoregressive neural network |
| NARX | Nonlinear autoregressive neural network with an external time series |
| DWT | Discrete wavelet transform |
| Mse | mean squared error |
| R | coefficient of determination |
| KPCA | kernel principal component analysis |
| FFOA | fruit fly optimization algorithm |
| Db | Daubechies wavelets |
| Sym | Symlets wavelets |
| Coif | Coiflets |
| ARMA | autoregressive moving average model |
| ARIMA | autoregressive integrated moving average models |
| SARIMA | seasonal autoregressive integrated moving average model |
| ARCH | Autoregressive model for conditional heteroscedasticity |
| GARCH | generalized autoregressive conditional heteroscedasticity |
References
- Godina, R.; Rodrigues, E.M.G.; Matias, J.C.O.; Catalão, J.P.S. Effect of Loads and Other Key Factors on Oil-Transformer Ageing: Sustainability Benefits and Challenges. Energies 2015, 8, 12147–12186. [Google Scholar] [CrossRef] [Green Version]
- Wang, X.; Tang, C.; Huang, B.; Hao, J.; Chen, G. Review of Research Progress on the Electrical Properties and Modification of Mineral Insulating Oils Used in Power Transformers. Energies 2018, 11, 487. [Google Scholar] [CrossRef]
- Peng, L.; Fu, Q.; Zhao, Y.; Qian, Y.; Chen, T.; Fan, S. A Non-Destructive Optical Method for the DP Measurement of Paper Insulation Based on the Free Fibers in Transformer Oil. Energies 2018, 11, 716. [Google Scholar] [CrossRef]
- Cheng, L.; Yu, T. Dissolved Gas Analysis Principle-Based Intelligent Approaches to Fault Diagnosis and Decision Making for Large Oil-Immersed Power Transformers: A Survey. Energies 2018, 11, 913. [Google Scholar] [CrossRef]
- Bacha, K.; Souahlia, S.; Gossa, M. Power transformer fault diagnosis based on dissolved gas analysis by support vector machine. Electr. Power Syst. 2012, 83, 73–79. [Google Scholar] [CrossRef]
- Chen, W.G.; Chen, X.; Peng, S.Y.; Li, J. Canonical correlation between partial discharges and gas formation in transformer oil paper insulation. Energies 2012, 5, 1081–1097. [Google Scholar] [CrossRef]
- Xiang, C.M.; Zhou, Q.; Li, J.; Huang, Q.D.; Song, H.Y.; Zhang, Z.T. Comparison of dissolved gases in mineral and vegetable insulating oils under typical electrical and thermal faults. Energies 2016, 9, 312. [Google Scholar] [CrossRef]
- Haroldo, D.F., Jr.; João, G.S.C.; Jose, L.M.O. A review of monitoring methods for predictive maintenance of electric power transformers based on dissolved gas analysis. Renew. Sustain. Energy Rev. 2015, 46, 201–209. [Google Scholar]
- Faiz, J.; Soleimani, M. Dissolved gas analysis evaluation in electric power transformers using conventional methods a review. IEEE Trans. Dielectr. Electr. Insul. 2017, 24, 1239–1248. [Google Scholar] [CrossRef]
- Lin, J.; Sheng, G.; Yan, Y.; Dai, J.; Jiang, X. Prediction of Dissolved Gas Concentrations in Transformer Oil Based on the KPCA-FFOA-GRNN Model. Energies 2018, 11, 1–13. [Google Scholar] [CrossRef]
- IEC 60599: Interpretation of the Analysis of Gases in Transformers and Other Oil-Filled Electrical Equipment in Service. 1978. Available online: https://webstore.iec.ch/publication/23317 (accessed on 12 January 2018).
- IEEE Std C57.104-1991. Guide For Loading Mineral-Oil-Immersed Transformers and Step Voltage Regulators. 2011. Available online: https://ieeexplore.ieee.org/document/6166928 (accessed on 12 January 2018).
- Yongbo, T.; Juan, F.A. Prediction method Dissolved Gas Content in Transformer Oil Based on KTA-SVM. Control Eng. China 2017, 24, 2263–2267. [Google Scholar]
- Zhang, S.; Bai, Y.; Wu, G.; Yao, Q. The forecasting model for time series of transformer DGA data based on WNN-GNN-SVM combined algorithm. In Proceedings of the 2017 1st International Conference on Electrical Materials and Power Equipment (ICEMPE), Xi’an, China, 14–17 May 2017; pp. 292–295. [Google Scholar]
- Wang, Z.; Liu, Y.; Griffin, P.J. A combined ANN and expert system tool for transformer fault diagnosis. IEEE Trans. Power Deliv. 2000, 13, 1224–1229. [Google Scholar] [CrossRef]
- Islam, S.M.; Wu, T.; Ledwich, G. A novel fuzzy logic approach to transformer fault diagnosis. IEEE Trans. Dielectr. Electr. Insul. 2000, 7, 177–186. [Google Scholar] [CrossRef]
- Dias, C.G.; Pereira, F.H. Broken Rotor Bars Detection in Induction Motors Running at Very Low Slip Using a Hall Effect Sensor. IEEE Sens. J. 2018, 18, 4602–4613. [Google Scholar] [CrossRef]
- Schimit, P.H.T.; Pereira, F.H. Disease spreading in complex networks: A numerical study with Principal Component Analysis. Expert Syst. Appl. 2018, 97, 41–50. [Google Scholar] [CrossRef]
- Jensen, A.; la Cour-Harbo, A. Ripples in Mathematics: The Discrete Wavelet Transform; Springer: Berlin, Germany, 2001. [Google Scholar]
- Haykin, S. Neural Networks: A Comprehensive Foundation, 2nd ed.; Pearson Prentice Hall: Hamilton, ON, Canada, 1999. [Google Scholar]
- Suganthi, S.; Murugesan, K.; Raghavan, S. ANN model of RF MEMS lateral SPDT switches for millimeter wave applications. J. Microw. Optoelectron. Electro-Magn. Appl. 2012, 11, 130–143. [Google Scholar] [CrossRef]
- Banookh, A.; Barakati, S.M. Optimal design of double folded stub microstrip filter by neural network modelling and particle swarm optimization. J. Microw. Optoelectron. Electromagn. Appl. 2012, 11, 204–213. [Google Scholar] [CrossRef] [Green Version]
- Islam, M.P.; Morimoto, T. Non-linear autoregressive neural network approach for inside air temperature prediction of a pillar cooler. Int. J. Green Energy 2017, 14, 141–149. [Google Scholar] [CrossRef]
- Caswell, J.M. A Nonlinear Autoregressive Approach to Statistical Prediction of Disturbance Storm Time Geomagnetic Fluctuations Using Solar Data. J. Signal Inf. Process. 2014, 5, 42–53. [Google Scholar] [CrossRef]
- Pereira, F.H.; Grassi, F.; Nabeta, S.I. A surrogate based two-level genetic algorithm optimization through wavelet transform. IEEE Trans. Magn. 2015, 51, 1–4. [Google Scholar] [CrossRef]
- Li, H.; Yang, R.; Wang, C.; He, C. Investigation on Planetary Bearing Weak Fault Diagnosis Based on a Fault Model and Improved Wavelet Ridge. Energies 2018, 11, 1286. [Google Scholar] [CrossRef]
- Wang, X.; Xu, J.; Zhao, Y. Wavelet Based Denoising for the Estimation of the State of Charge for Lithium-Ion Batteries. Energies 2018, 11, 1144. [Google Scholar] [CrossRef]
- Sweldens, W. The lifting scheme: A custom-design construction of biorthogonal wavelets. Appl. Comput. Harmon. Anal. 1994, 3, 186–200. [Google Scholar] [CrossRef]
- Liu, H.; Shi, J. Applying ARMA-GARCH approaches to forecasting short-term electricity prices. Energy Econ. 2013, 37, 152–166. [Google Scholar] [CrossRef]


| d | mse | R |
|---|---|---|
| 2 | 0.0000007 | 0.99 |
| 3 | 0.0000010 | 0.99 |
| 4 | 0.0000007 | 0.99 |
| 5 | 0.0000006 | 0.99 |
| 6 | 0.0000005 | 0.99 |
| 7 | 0.0000006 | 0.99 |
| 8 | 0.0000008 | 0.99 |
| 9 | 0.0000008 | 0.99 |
| 10 | 0.0000008 | 0.99 |
| Wavelet | mse | R | avg_err (%) | max_err (%) |
|---|---|---|---|---|
| sym2 | 0.0000004 | 0.99 | 0.06 | 0.34 |
| sym3 | 0.0000010 | 0.99 | 0.08 | 0.50 |
| sym4 | 0.0000007 | 0.99 | 0.08 | 0.52 |
| db1 | 0.0000007 | 0.99 | 0.15 | 1.02 |
| db3 | 0.0000010 | 0.99 | 0.08 | 0.52 |
| db5 | 0.0000002 | 0.99 | 0.03 | 0.19 |
| coif1 | 0.0000011 | 0.99 | 0.10 | 0.60 |
| coif3 | 0.0000004 | 0.99 | 0.06 | 0.35 |
| coif5 | 0.0000003 | 0.99 | 0.04 | 0.28 |
| Gas Type | avg_err (%) | max_err (%) |
|---|---|---|
| H2 | 0.46 | 6.03 |
| CO | 0.08 | 0.79 |
| CO2 | 0.06 | 0.34 |
| CH4 | 0.10 | 0.89 |
| C2H6 | 0.29 | 2.34 |
| C2H4 | 0.32 | 3.11 |
| C2H2 | 0.33 | 2.37 |
| Gas Type | avg_err (%) | max_err (%) |
|---|---|---|
| CH4/H2 | 0.58 | 3.35 |
| C2H2/C2H4 | 2.02 | 10.48 |
| C2H4/C2H6 | 0.66 | 9.82 |
| Prediction Model | avg_err (%) | max_err (%) |
|---|---|---|
| NAR–DWT | 0.32 | 3.11 |
| KPCA-FFOA-GRNN | 3.27 | 11.34 |
| FFOA-GRNN | 5.04 | 12.81 |
| KPCA-GRNN | 7.09 | 15.14 |
| GRNN | 7.93 | 14.06 |
| BPNN | 8.72 | 19.52 |
| SVM | 4.21 | 10.65 |
| GM | 6.69 | 15.77 |
| AIC | 9.15 | 22.33 |
| BIC | 18.4 | 40.87 |
© 2018 by the authors. Licensee MDPI, Basel, Switzerland. This article is an open access article distributed under the terms and conditions of the Creative Commons Attribution (CC BY) license (http://creativecommons.org/licenses/by/4.0/).
Share and Cite
Pereira, F.H.; Bezerra, F.E.; Junior, S.; Santos, J.; Chabu, I.; Souza, G.F.M.d.; Micerino, F.; Nabeta, S.I. Nonlinear Autoregressive Neural Network Models for Prediction of Transformer Oil-Dissolved Gas Concentrations. Energies 2018, 11, 1691. https://doi.org/10.3390/en11071691
Pereira FH, Bezerra FE, Junior S, Santos J, Chabu I, Souza GFMd, Micerino F, Nabeta SI. Nonlinear Autoregressive Neural Network Models for Prediction of Transformer Oil-Dissolved Gas Concentrations. Energies. 2018; 11(7):1691. https://doi.org/10.3390/en11071691
Chicago/Turabian StylePereira, Fabio Henrique, Francisco Elânio Bezerra, Shigueru Junior, Josemir Santos, Ivan Chabu, Gilberto Francisco Martha de Souza, Fábio Micerino, and Silvio Ikuyo Nabeta. 2018. "Nonlinear Autoregressive Neural Network Models for Prediction of Transformer Oil-Dissolved Gas Concentrations" Energies 11, no. 7: 1691. https://doi.org/10.3390/en11071691
APA StylePereira, F. H., Bezerra, F. E., Junior, S., Santos, J., Chabu, I., Souza, G. F. M. d., Micerino, F., & Nabeta, S. I. (2018). Nonlinear Autoregressive Neural Network Models for Prediction of Transformer Oil-Dissolved Gas Concentrations. Energies, 11(7), 1691. https://doi.org/10.3390/en11071691