Detection Method for Soft Internal Short Circuit in Lithium-Ion Battery Pack by Extracting Open Circuit Voltage of Faulted Cell

1
Department of Electrical Engineering, Pohang University of Science and Technology, Pohang 37673, Korea
2
Department of Creative-IT Engineering, Pohang University of Science and Technology, Pohang 37673, Korea
*
Author to whom correspondence should be addressed.
†
These authors contributed equally to this work.
Energies 2018, 11(7), 1669; https://doi.org/10.3390/en11071669
Submission received: 8 June 2018
/
Revised: 18 June 2018
/
Accepted: 25 June 2018
/
Published: 27 June 2018
(This article belongs to the Special Issue Intelligent Control in Energy Systems)
Abstract
:Early detection of internal short circuit which is main cause of thermal runaway in a lithium-ion battery is necessary to ensure battery safety for users. As a promising fault index, internal short circuit resistance can directly represent degree of the fault because it describes self-discharge phenomenon caused by the internal short circuit clearly. However, when voltages of individual cells in a lithium-ion battery pack are not provided, the effect of internal short circuit in the battery pack is not readily observed in whole terminal voltage of the pack, leading to difficulty in estimating accurate internal short circuit resistance. In this paper, estimating the resistance with the whole terminal voltages and the load currents of the pack, a detection method for the soft internal short circuit in the pack is proposed. Open circuit voltage of a faulted cell in the pack is extracted to reflect the self-discharge phenomenon obviously; this process yields accurate estimates of the resistance. The proposed method is verified with various soft short conditions in both simulations and experiments. The error of estimated resistance does not exceed 31.2% in the experiment, thereby enabling the battery management system to detect the internal short circuit early.
1. Introduction
Lithium-ion batteries are widely used as a power source in electric devices and electric vehicles [1,2], due to their high power density, high energy efficiency and excellent cycle stability [3,4]. The demand for them is expected to rise continuously in the coming years [5,6]. However, safety concerns related to the lithium-ion batteries still remain [7,8,9] because hazardous incidents such as fire accidents in the Boeing 787-8 aircraft [10] and battery failures in the Samsung Note7 [11] have been frequently reported by media [12]. The main cause of these two events is internal short circuit (ISCr) in the lithium-ion batteries. The ISCr can be caused by manufacturing defects [13,14] and various types of abuse such as overcharge [15,16] and overdischarge [17]. Furthermore, when a magnitude of ISCr resistance () is lower than a particular value [18], a temperature of the battery exceeds a certain point due to the ISCr [19,20,21]. Then, the battery may experience thermal runaway with a fire and can even explode [22,23,24,25]. Therefore, the detection of soft ISCr, which has a large magnitude of the , is more necessary than the detection of hard ISCr with a small magnitude of the for user safety to prevent the lithium-ion battery from causing hazardous events such as the thermal runaway.
Recently, for these reasons, methods for detecting the ISCr have been suggested [26,27]. When the ISCr happens in the battery cell, terminal voltage of the cell decreases rapidly and then temperature of the cell increases drastically; these two characteristics can be used as pre-determined thresholds for detecting the ISCr [26]. However, to obtain the threshold values, prior ISCr-test with the batteries were required. Besides the threshold-based method, a detection algorithm based on an equivalent circuit model of the battery has been introduced [27]. Using variation of estimated parameters in both the equivalent circuit model and the energy balance equation, the method for detecting the ISCr was verified with large magnitude of the , which was larger than 10 [27]; the 10 is considered to be the minimum value which must be detected early before occurrence of the thermal runaway [23,27]. However, this algorithm was verified with only one type of current profile and the similar parameter variation may not be obtained depending on various other current profiles due to absence of the in the equivalent circuit model.
The is regarded as a promising fault index for detecting the ISCr because it can describe self-discharge phenomenon caused by the ISCr in the equivalent circuit model with [28,29] and represent heat generated by the ISCr [30]. Therefore, the ISCr detection methods, which directly use the as the fault index, have been introduced [29,31,32,33]. With measurement data of the self-discharge current and the terminal voltage of the battery with ISCr in the particular experiment configuration, the can be calculated correctly [29,31]. However, these experimental methods cannot be used as on-board ISCr detection when the restricted experiment system is not configured in actual application environment. Therefore, after analyzing the self-discharge phenomenon caused by the ISCr, the equation for calculating the was derived and then the (1∼20 ) was estimated to detect the ISCr [32]. However, the accuracy of the estimated from two different load current profiles was low, because the in the equivalent circuit model was not used to estimate open circuit voltage (OCV) of the battery with ISCr. To overcome this error, the previously estimated in the model was used to update the model iteratively and to estimate the OCV, and then the next estimated (5∼50 ) became accurate enough to detect the ISCr [33].
For a large capacity and a high power, a lithium-ion battery pack, where many battery cells are connected, is used in actual applications such as electric vehicles and energy storage system for the grid [34,35]. Studies for detecting the ISCr in the battery pack have been suggested [36,37,38]. The ISCr of the battery pack was detected based on the correlation coefficient of terminal voltages of individual cells [36], and the deviations of both state of charge (SOC) and heat generation power were used to detect the ISCr in the pack [37]. However, these two methods were verified with only the hard ISCr having a magnitude of (0.36 for [36] and 0.35∼2.4 for [37], respectively), which is small enough to cause the dangerous incidents such as the thermal runaway in the cell [30]. Especially, temperature data of the individual cells were needed to detect the hard ISCr correctly [37]. Magnitude, differential value and fluctuation of estimated model parameters were acquired to detect the ISCr with a wide range of (1 ∼100 ) after estimating the parameters in the mean-difference model of the battery pack [38]. These three detection methods for the battery pack have a common constraint: all terminal voltages of the individual cells in the battery pack must be provided.
If many battery cells are connected in series in the battery pack, many channels with high accuracy and high sample rate for measuring all the individual cell voltages increase the cost of battery management system (BMS). In addition, a data storage unit, needed to save and monitor the measurement data, can lead to increasing the cost of BMS [39]. Furthermore, depending on the applications of the battery pack and the BMS with various topologies, the individual cell voltages may not be provided with high precision and high sample rate and may not be saved due to the cost of the BMS [40,41]. When the data of individual cell voltages are not provided from the BMS, the ISCr detection methods for the pack [36,37,38] have trouble in deriving the properties of the faulted battery from the battery pack, resulting in problem of detecting the ISCr of the cell in the pack. Therefore, an algorithm for detecting the soft ISCr with load currents and whole terminal voltages of the battery pack is necessary definitely. Moreover, considering data computation, using the whole terminal voltage for diagnosing the ISCr in the battery pack is more efficient than using all individual cell voltages.
This paper proposes a method for detecting the soft ISCr in the lithium-ion battery pack, where normal batteries and a battery with ISCr are connected in series, with the load currents and the whole terminal voltages of the pack. To reflect the effect of ISCr in the battery pack clearly, the OCV of the faulted cell is extracted from the pack with ISCr. The proposed algorithm estimates the SOC of the battery pack with the extended Kalman filter (EKF) to increase accuracy of the pack SOC. Then, the SOC of the normal cell is obtained with the Coulomb counting method and a stable initial value, which is determined from the estimated SOC of the pack. Using the SOC estimates of the pack and the normal cell, the OCV of the battery cell with ISCr in the pack can be obtained; this shows the self-discharge phenomenon caused by the ISCr obviously. As a result, the can be estimated accurately, and the soft ISCr in the battery pack can be detected. To verify the proposed method, various soft ISCr cases were configured for simulation and experiment, and two load current profiles: dynamic stress test (DST) and urban dynamometer driving schedules (UDDS) were used.
The remainder of this paper is organized as follows: the proposed algorithm is carried out in Section 2; the configurations of simulation and experiment are introduced in Section 3; the results of the proposed algorithm and the discussions are presented in Section 4; the conclusions of this study and the outline of future work are summarized in Section 5.
2. Method Description
2.1. Overall Scheme for ISCr Detection Algorithm
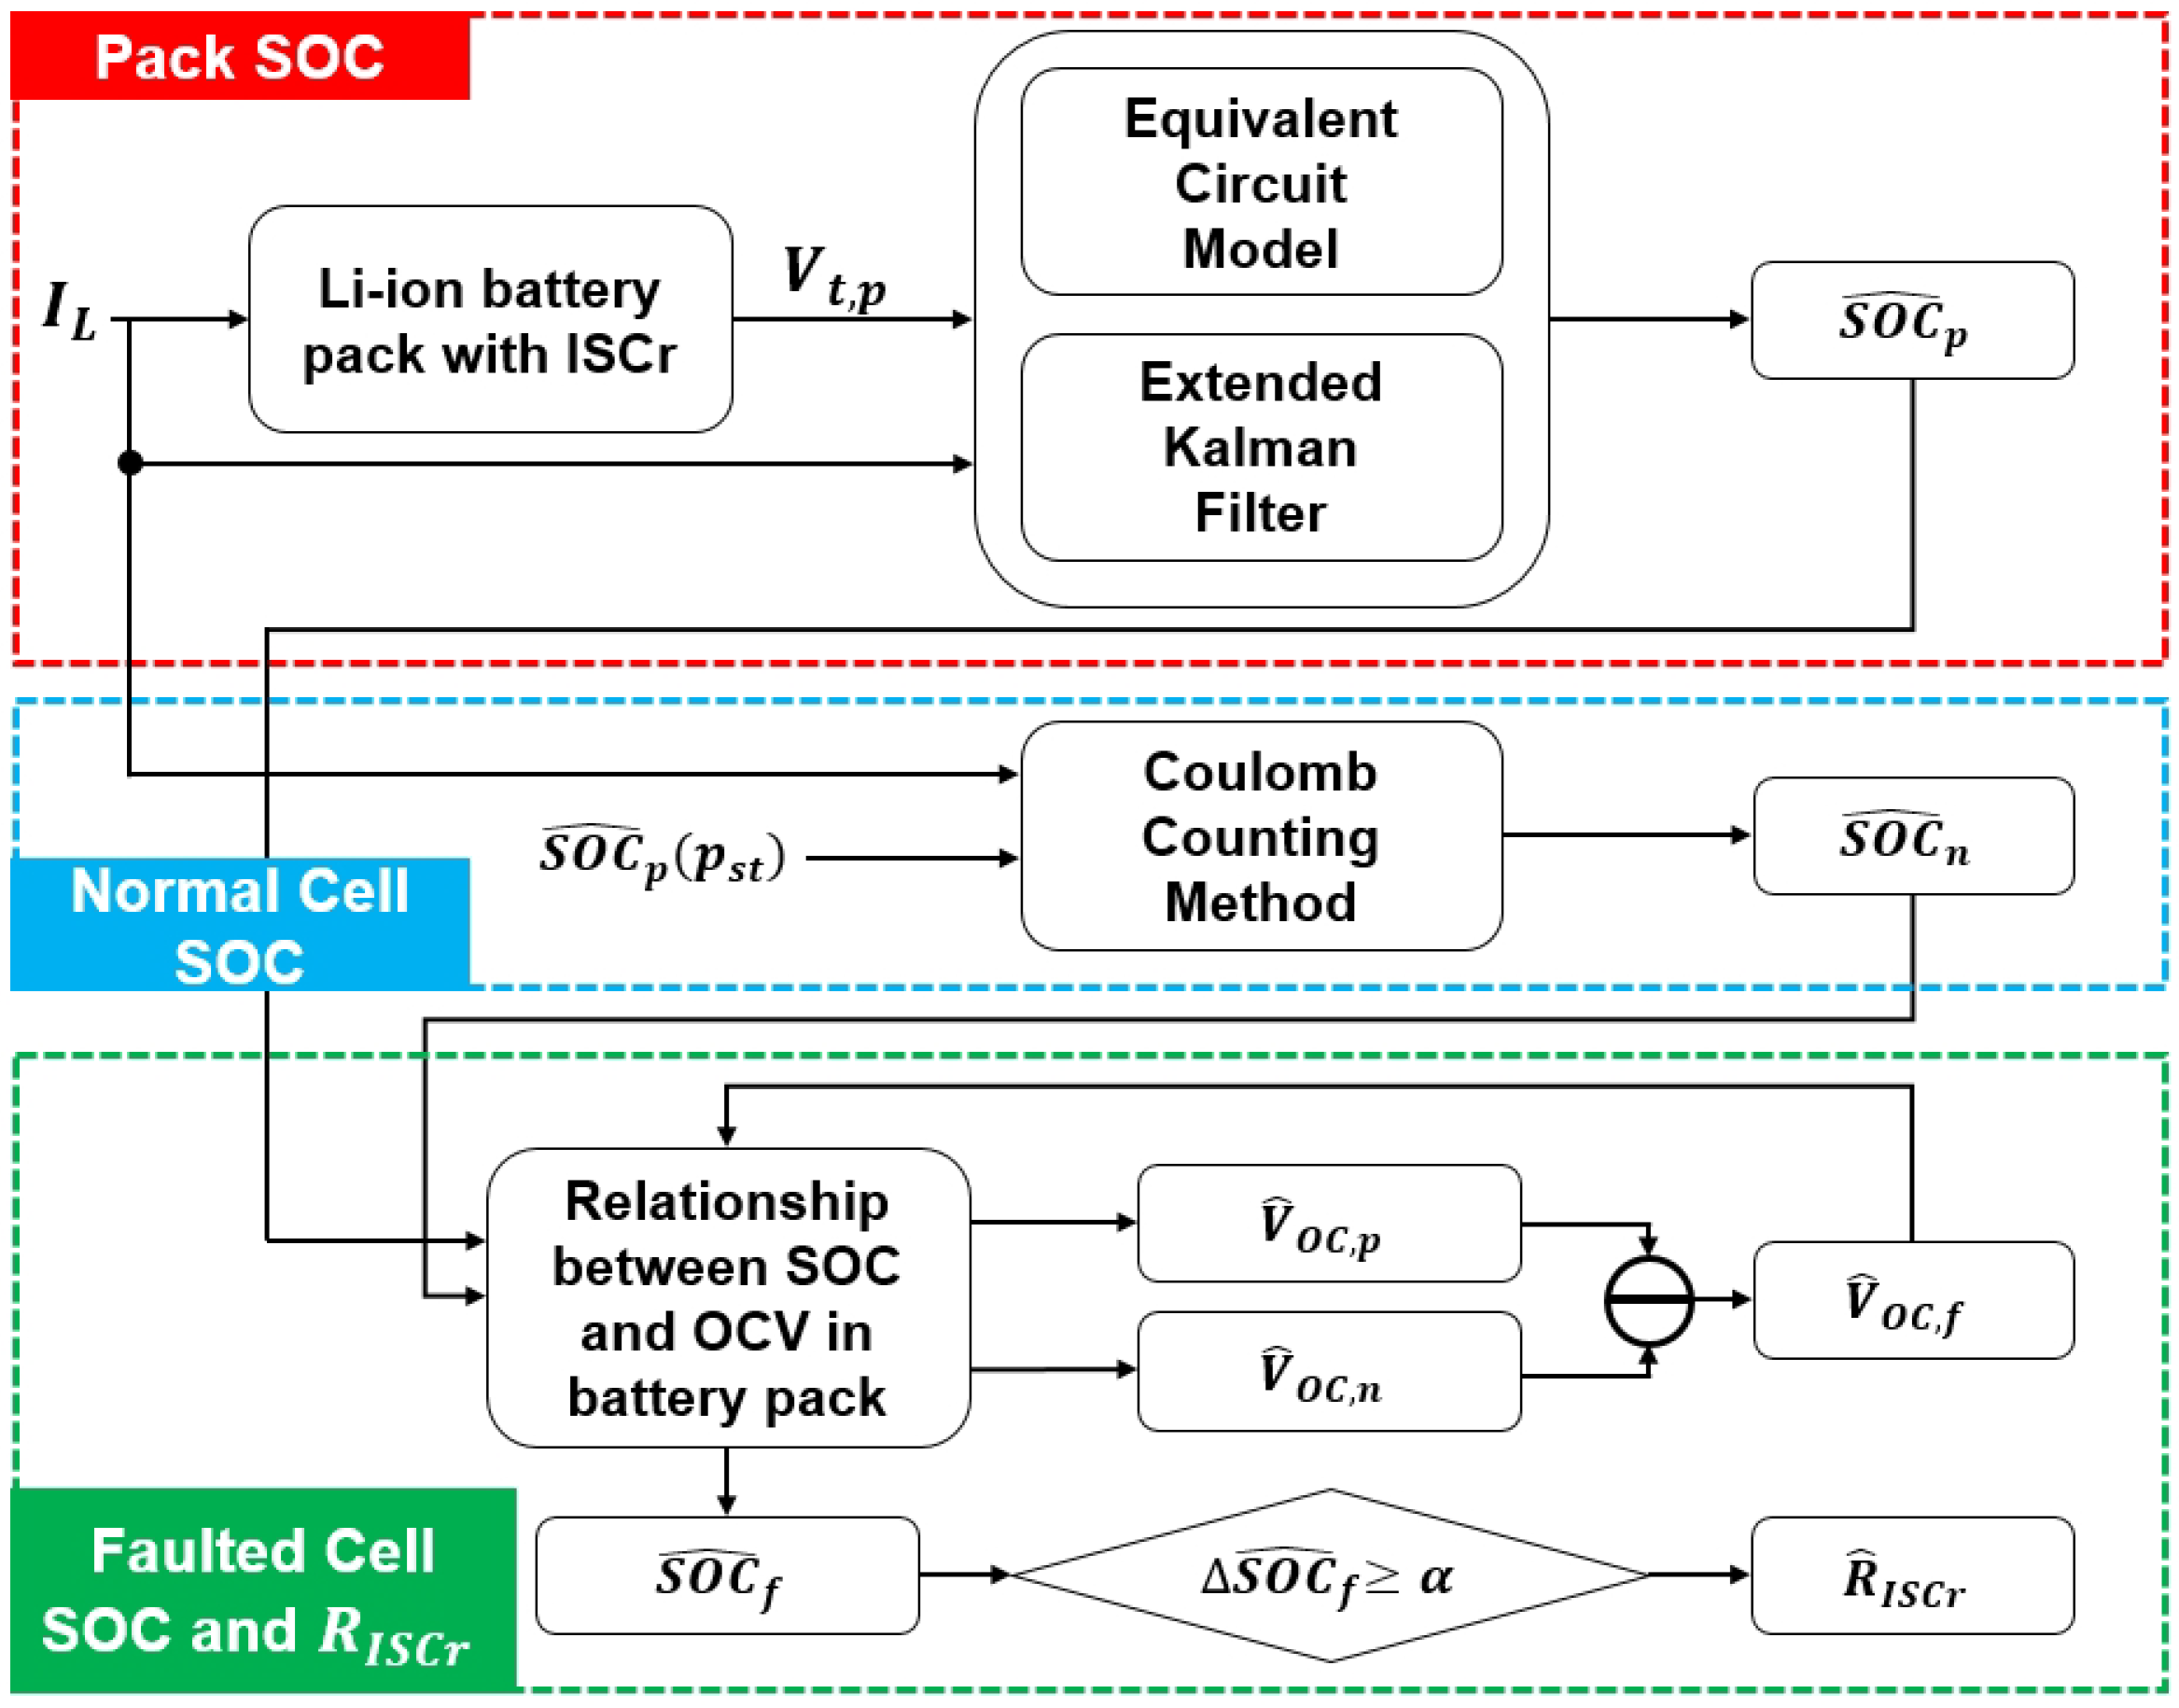
To detect the soft ISCr in the battery pack, the proposed method estimates the of the faulted cell using the whole terminal voltages and the load currents of the pack. As a fault index, the estimated can directly inform the user of degree of the ISCr in the pack. If the soft ISCr having a large magnitude of the is detected, the BMS can give enough time to cope with the ISCr fault. The overall scheme of the proposed algorithm is depicted in Figure 1, which comprises of four estimation steps: estimating pack SOC (); normal cell SOC (); faulted cell SOC () and .
When the ISCr occurs in a single battery cell, abnormal properties such as the decrease in terminal voltage and the increase in battery temperature are easily observed [42,43]. Hence, measured terminal voltage, current and temperature of the battery cell can be used to detect the ISCr. However, when an ISCr occurs in the battery pack, which only provides the load currents and the whole terminal voltages of the battery pack, the decrease in the whole terminal voltage caused by the ISCr in the battery pack is not obeserved conspicuously. Thus, additional decrease in the , induced by the self-discharge current in the faulted cell, should be extracted to ensure the high accuracy of estimates. First of all, using the equivalent circuit model of the battery pack with ISCr and the EKF algorithm, the is estimated. As a second step, the can be calculated by the Coulomb counting method with a initial value of the which is obtained with the estimated . Then, using the estimated SOCs of both the battery pack and the normal cells, the OCV of the faulted cell and the are obtained at the third and fourth estimation steps. Once the difference between the initial and present estimates is more than a certain value, which is determined as 0.1 (10% of the total capacity of the cell) and discussed in Section 4.6, the of the faulted cell in the battery pack can be estimated and used to detect the soft ISCr in the pack as the fault index.
2.2. Equivalent Circuit Model of Battery Pack with ISCr
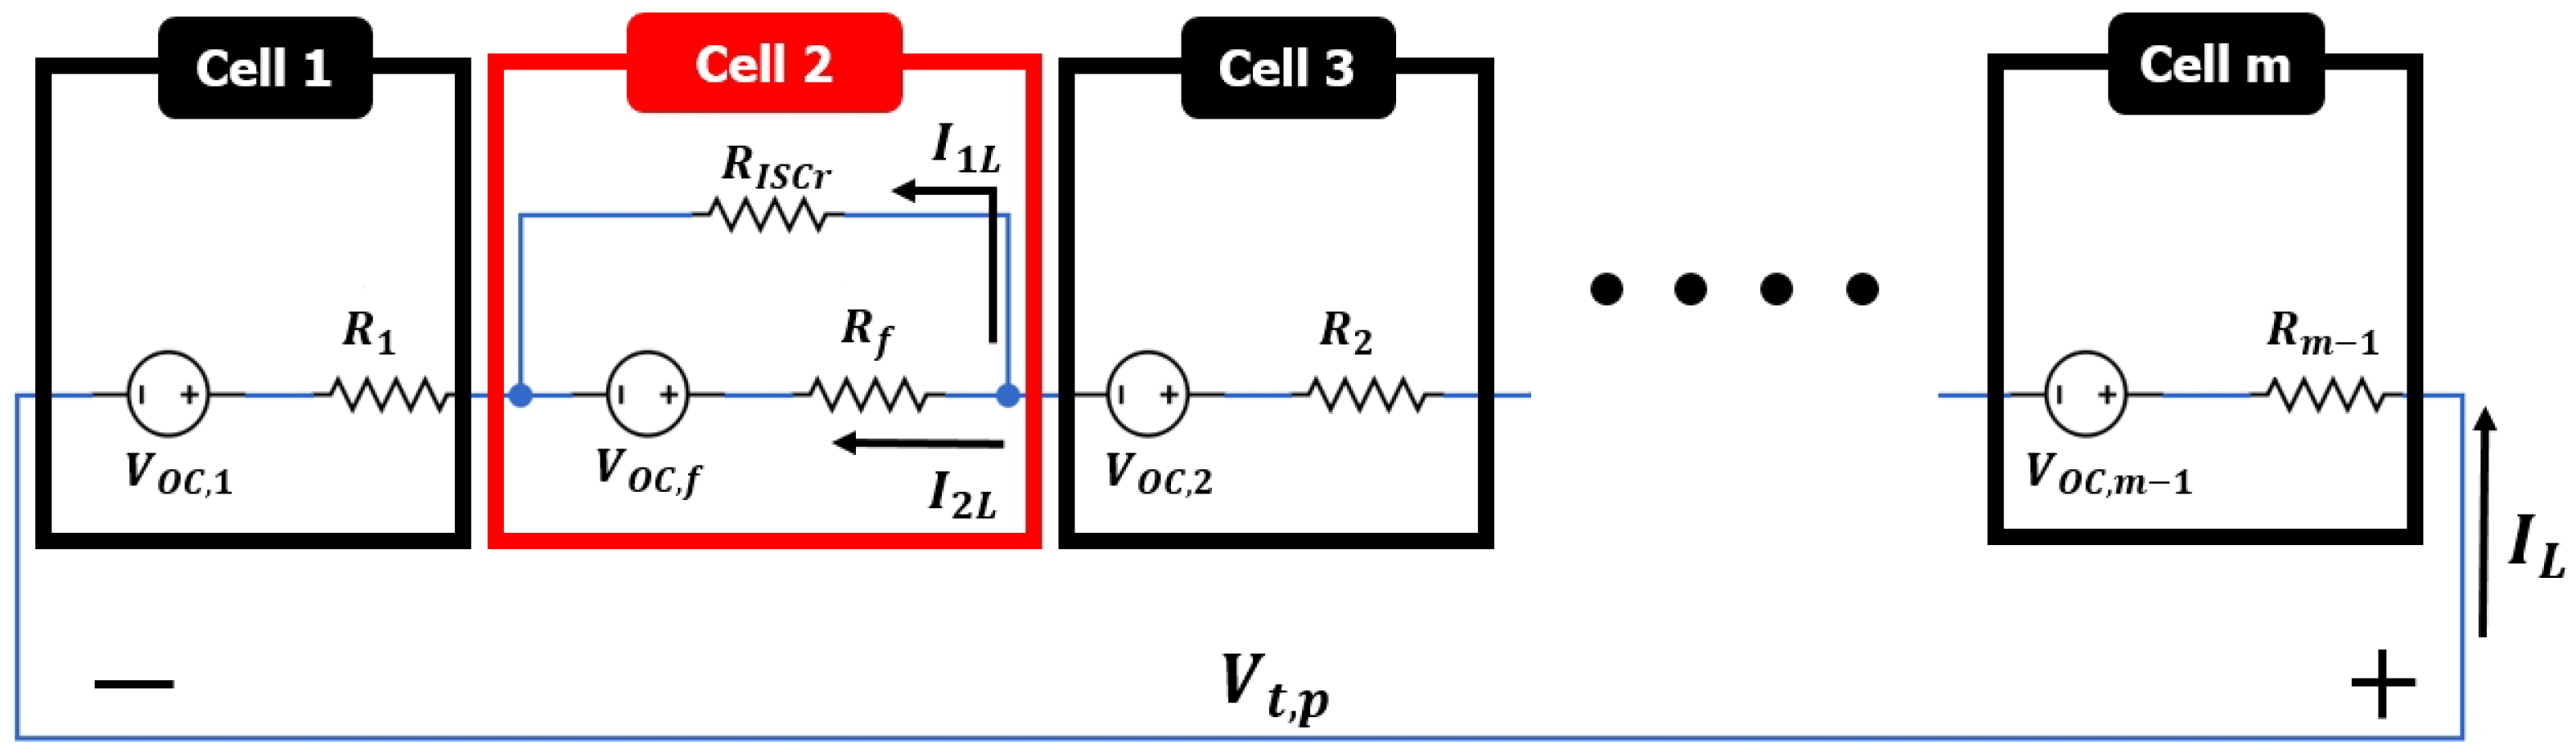
In Figure 2, the battery pack consists of several normal battery cells and one faulted battery cell, and the whole terminal voltage and the load current are described, where m is the number of cells connected in series in the pack. The normal cell is represented by a simple equivalent circuit model [29] composed of the OCV () and an internal resistance R. The sum of s and Rs of normal cells described in Equations (1) and (2) is used to express the model of normal cells with discretization step in Equation (3), and the sum of the terminal voltages of the normal cells can be induced by Ohm’s law in Equation (3) [44].
The cell with ISCr is represented by the simple model with the , which is connected with the model of the normal cell in parallel [29,38]. The subscript f is used particularly in parameters associated with the faulted cell. The is divided into two currents which are the self-discharge current flowing through the and residual current (Equation (4)), and is the terminal voltage of the faulted cell. The faulted cell model is described in Equations (5) and (6) [33,38]. To represent the model of the battery pack with ISCr, the is obtained by adding the and the , as shown in Equation (7).
2.3. Estimation of Pack SOC Using EKF
The EKF algorithm is a common method to estimate accurate SOC because the estimates are not affected by measurement noise dominantly due to properties of the battery system reflected in the state space model [45,46,47]. In this paper, the EKF algorithm is used to estimate the correctly. After assuming that in the model of battery pack with ISCr (Equation (7)), the simplified can be expressed with battery pack OCV () and whole internal resistance which is the sum of and in Equation (8). The recursive least squares (RLS) algorithm is used to identify the parameter of the normal battery model [48]. Using the RLS algorithm, the is obtained from the and the of the normal battery pack. Then, the estimated is used to configure the state space model of battery pack with ISCr in the EKF algorithm. When the is positive during battery pack charging and negative during discharging, in recursive discrete-time form, the is calculated with the Coulomb counting method [44] in Equation (9), where is the charging and discharging efficiency, is the sample period and is the nominal capacity of the normal battery pack. In this study, the charging and discharging efficiency is defined as 1.
To estimate the using the EKF algorithm, the corresponding equations are listed in Table 1, where is the , is the , is the , k is the sample index, and and are the zero mean Gaussian noise with covariance of Q and T.
2.4. Estimation of Normal Cell SOC
After starting to estimate the , the imprecise can be obtained for several seconds because of the incorrectly assumed initial value of the . Thus, the estimated obtained from the stable point , where is lower than a certain small value, is used to estimate the , and the is the sample index. By assuming that the equals to the at the stable point, the next can be calculated with the and the Coulomb counting method described in Equation (9).
2.5. Estimation of OCV and SOC for Faulted Cell
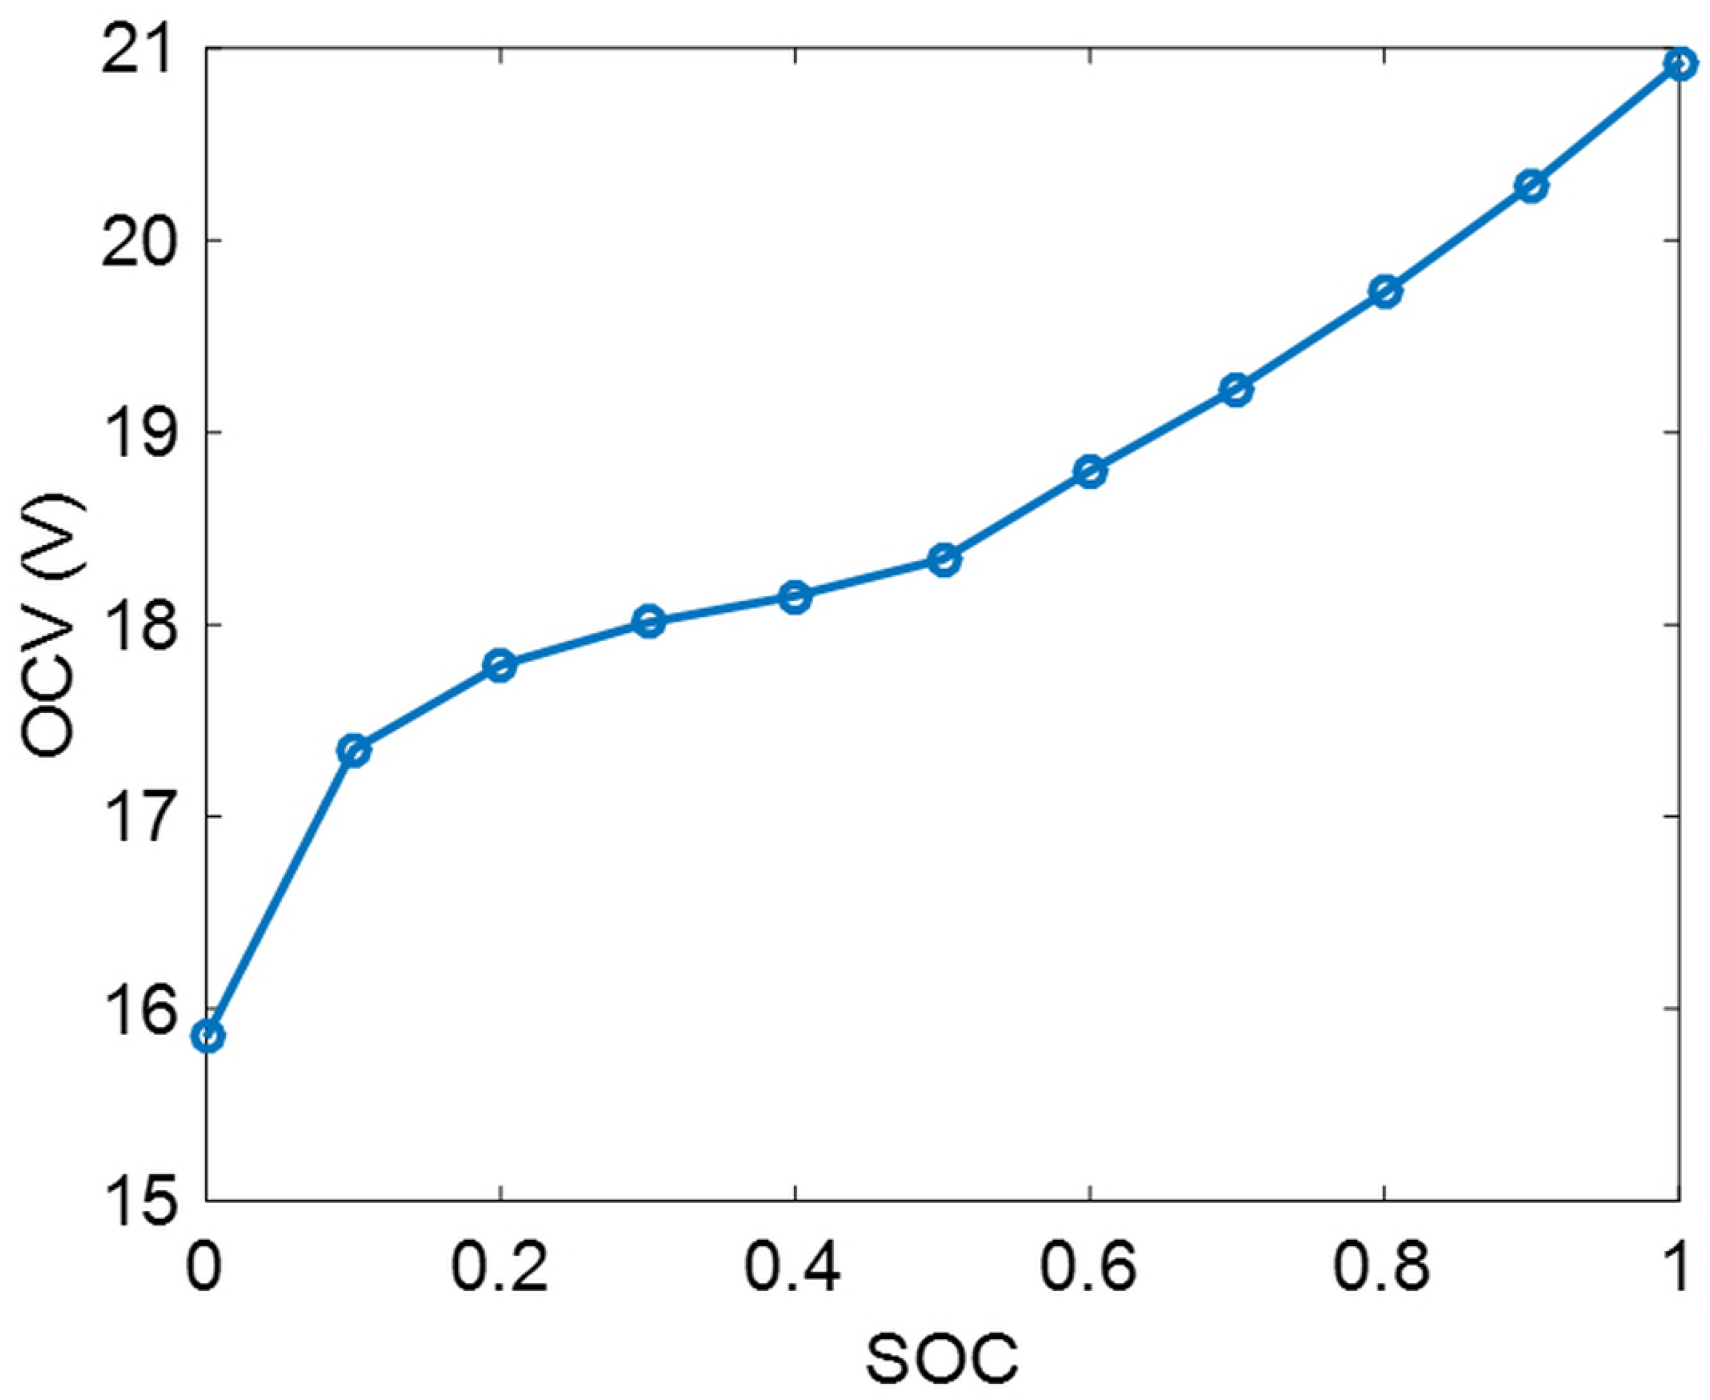
The relationship between OCV and SOC of the normal battery pack (Figure 3) obtained from the prior test [49] is essential for conducting the proposed algorithm. The fully charged battery pack is rested for 3600 s to obtain the OCV, which is equal to the terminal voltage, at 100% SOC. Then the battery pack is discharged with 0.5C (1 A) for 720 s to set 90% SOC, where the C (C-rate) is defined as the charge and discharge current of the battery, and then rested for 3600 s to get the OCV at 90% SOC. By repeating the process, the relationship between OCV and SOC can be obtaind. Using the relationship, the and the can be acquired and are expressed in Equations (10) and (11), where h is the function representing the relationship. By subtracting s from the , the is calculated. In sequence, the is obtained from the inverse function of h (Equation (12)).
In the process of using the to obtain the , the accuracy of is dependent on the slope from the relationship between OCV and SOC; i.e., in the range from 100% SOC to 50% SOC with the steep slope from the relationship a small error is caused by error of the , while a large error can be induced by the same error of the in the range from 50% SOC to 10% SOC with the gradual slope. To avoid this problem, the data of and were used to conduct the proposed algorithm until the estimated .
2.6. Calculation of
Using the self-discharge phenomenon [32,33], the can be estimated with the estimated . To formulate Equation (16) for calculating the , the Coulomb counting method is used with respect to the . is used in Equation (13), because the faulted cell is discharged from the instead of the .
To delete the unknown terms, and , the th equation in Equation (13) is subtracted from the kth equation in Equation (13), and then the is replaced with . In Equation (14), is used instead of the because the is not provided measurement data from the battery pack with ISCr.
The estimated from Equation (14) using a short interval between k and is vulnerable to errors of the estimated because the slight variation of the estimated in a short interval cannot reflect dominant self-discharge phenomenon from the ISCr. Therefore, the interval must be extended by adding the th equations in Equation (14) to the kth equations in Equation (14) (); i.e., the is estimated once the difference between the initial estimated SOC () and present estimated SOC () is more than 0.1, which is 10% of the total capacity of the cell.
The self-discharge phenomenon from the ISCr can be explained with the last term of Equation (15). For the normal battery cell with , the last term can be approximated to zero. However, when the ISCr occurs in the cell, the non-zero last term represents an additional decline in the SOC of the faulted cell due to the self-discharge current. Consequently, the estimated () can be obtained with Equation (16) after Equation (15) is rearranged.
2.7. Parallel Processing of Proposed Algorithm
Once the is obtained, the is used in Equation (16) to calculate the continuously. If error exists in the , the error can affect the accuracy of . Therefore, it is necessary to estimate s from the various positions and apply these estimated s to the ISCr fault index. Based on the estimates of , if the difference between and is more than or equal to , the proposed methods are carried out sequentially and implemented in parallel with previously executed method to diversify the stable point of estimated SOC of the faulted cell. In this paper, four proposed methods were executed additionally in parallel.
3. Simulation and Experiment
3.1. Simulation Configuration
The simulation model of the battery pack with ISCr was configured with MATLAB/Simulink (MATLAB R2017b, MathWorks, Natick, MA, USA) [50]. In both simulation and experiment configuration, the battery pack was composed of four normal battery cells and a faulted battery cell with ISCr. A first-order RC model [51], where the RC represents a parallel resistor-capacitor sub-circuit, was utilized to describe the normal cell in the battery pack. The parameters for the first-order RC model were estimated with the RLS algorithm [48] and the experimental data of terminal voltage and load current, measured when the normal cell was discharged by load current profiles. The normal cell is same with the cell in the battery pack of the experimental environment. In this study, two load current profiles such as the DST and the UDDS were used to verify the proposed method in simulation and experiment. Prior characteristic tests for obtaining the capacity and the relationship between OCV and SOC of the normal cell were conducted, and these two data were also used for the simulation configuration. The simulation model of the ISCr-faulted cell was represented by connecting the with the normal model in parallel. In this study, various resistance values such as 50 , 30 , 20 , 10 and 5 were used to represent diverse ISCr fault conditions.
3.2. Experimental Configuration
Figure 4 shows the experimental set-up for the ISCr tests with the battery packs. Two identical battery packs, A and B, were used to acquire the experimental data. The battery packs were tested in a thermal chamber, and the ambient temperature was maintained at 25 ± 1 °C. The important specifications of the cell are shown in Table 2. The prior tests for battery packs were conducted to obtain the capacities and the relationship between OCV and SOC. Based on the nominal capacity in Table 2, for capacity test, the packs were charged with the constant-current constant-voltage (CC-CV) protocol. For all experiments including the prior tests and the ISCr fault tests, when the batteries were charged, the CC-CV protocol was used. Charge-current was 0.5C (1 A) with upper cutoff-voltage 4.2 V in the CC mode, and cutoff-current was 0.05C (0.1 A) in the CV mode. Then, the packs were discharged with 0.5C as CC discharging [52]. The discharged capacities were regarded as true capacities. The measured true capacities of the battery packs, 2.1974 Ah and 2.1949 Ah for pack A and B, respectively, were used for acquiring the correct relationship between OCV and SOC. To check the distribution of capacities of cells in the pack, the capacity test was conducted for individual cells. As a result, the mean and standard deviation are 2.1944 Ah and 0.0062, respectively, for pack A; and 2.1959 Ah and 0.0071, respectively, for pack B.
The experiments of the battery packs were conducted using a battery test device (Regenerative Battery Pack Test System 17020, Chroma, Taoyuan, Taiwan) with the sample period of 0.1 s. The five 10 resistances, which have ±5% tolerance, were used to make various true s. Their measured true values were 49.91 , 29.98 , 20.00 , 10.02 and 5.00 , and were used to calculate relative errors of the fault index. These resistances were connected with one of the cells in the pack in parallel to represent the ISCr, and a switch was used to initiate the ISCr faults in the packs when the load current profiles were applied to the packs. For the ISCr experiments, the initial SOC of the pack was set to 90% after the pack was charged and rested for 3600 s. Subsequently, the DST current profile was used to discharge the pack A until its SOC reaches 10% of its total capacity to prevent the pack from being over-discharged, while the UDDS current profile was used for the pack B.
4. Results and Discussions
4.1. Terminal Voltages of Pack
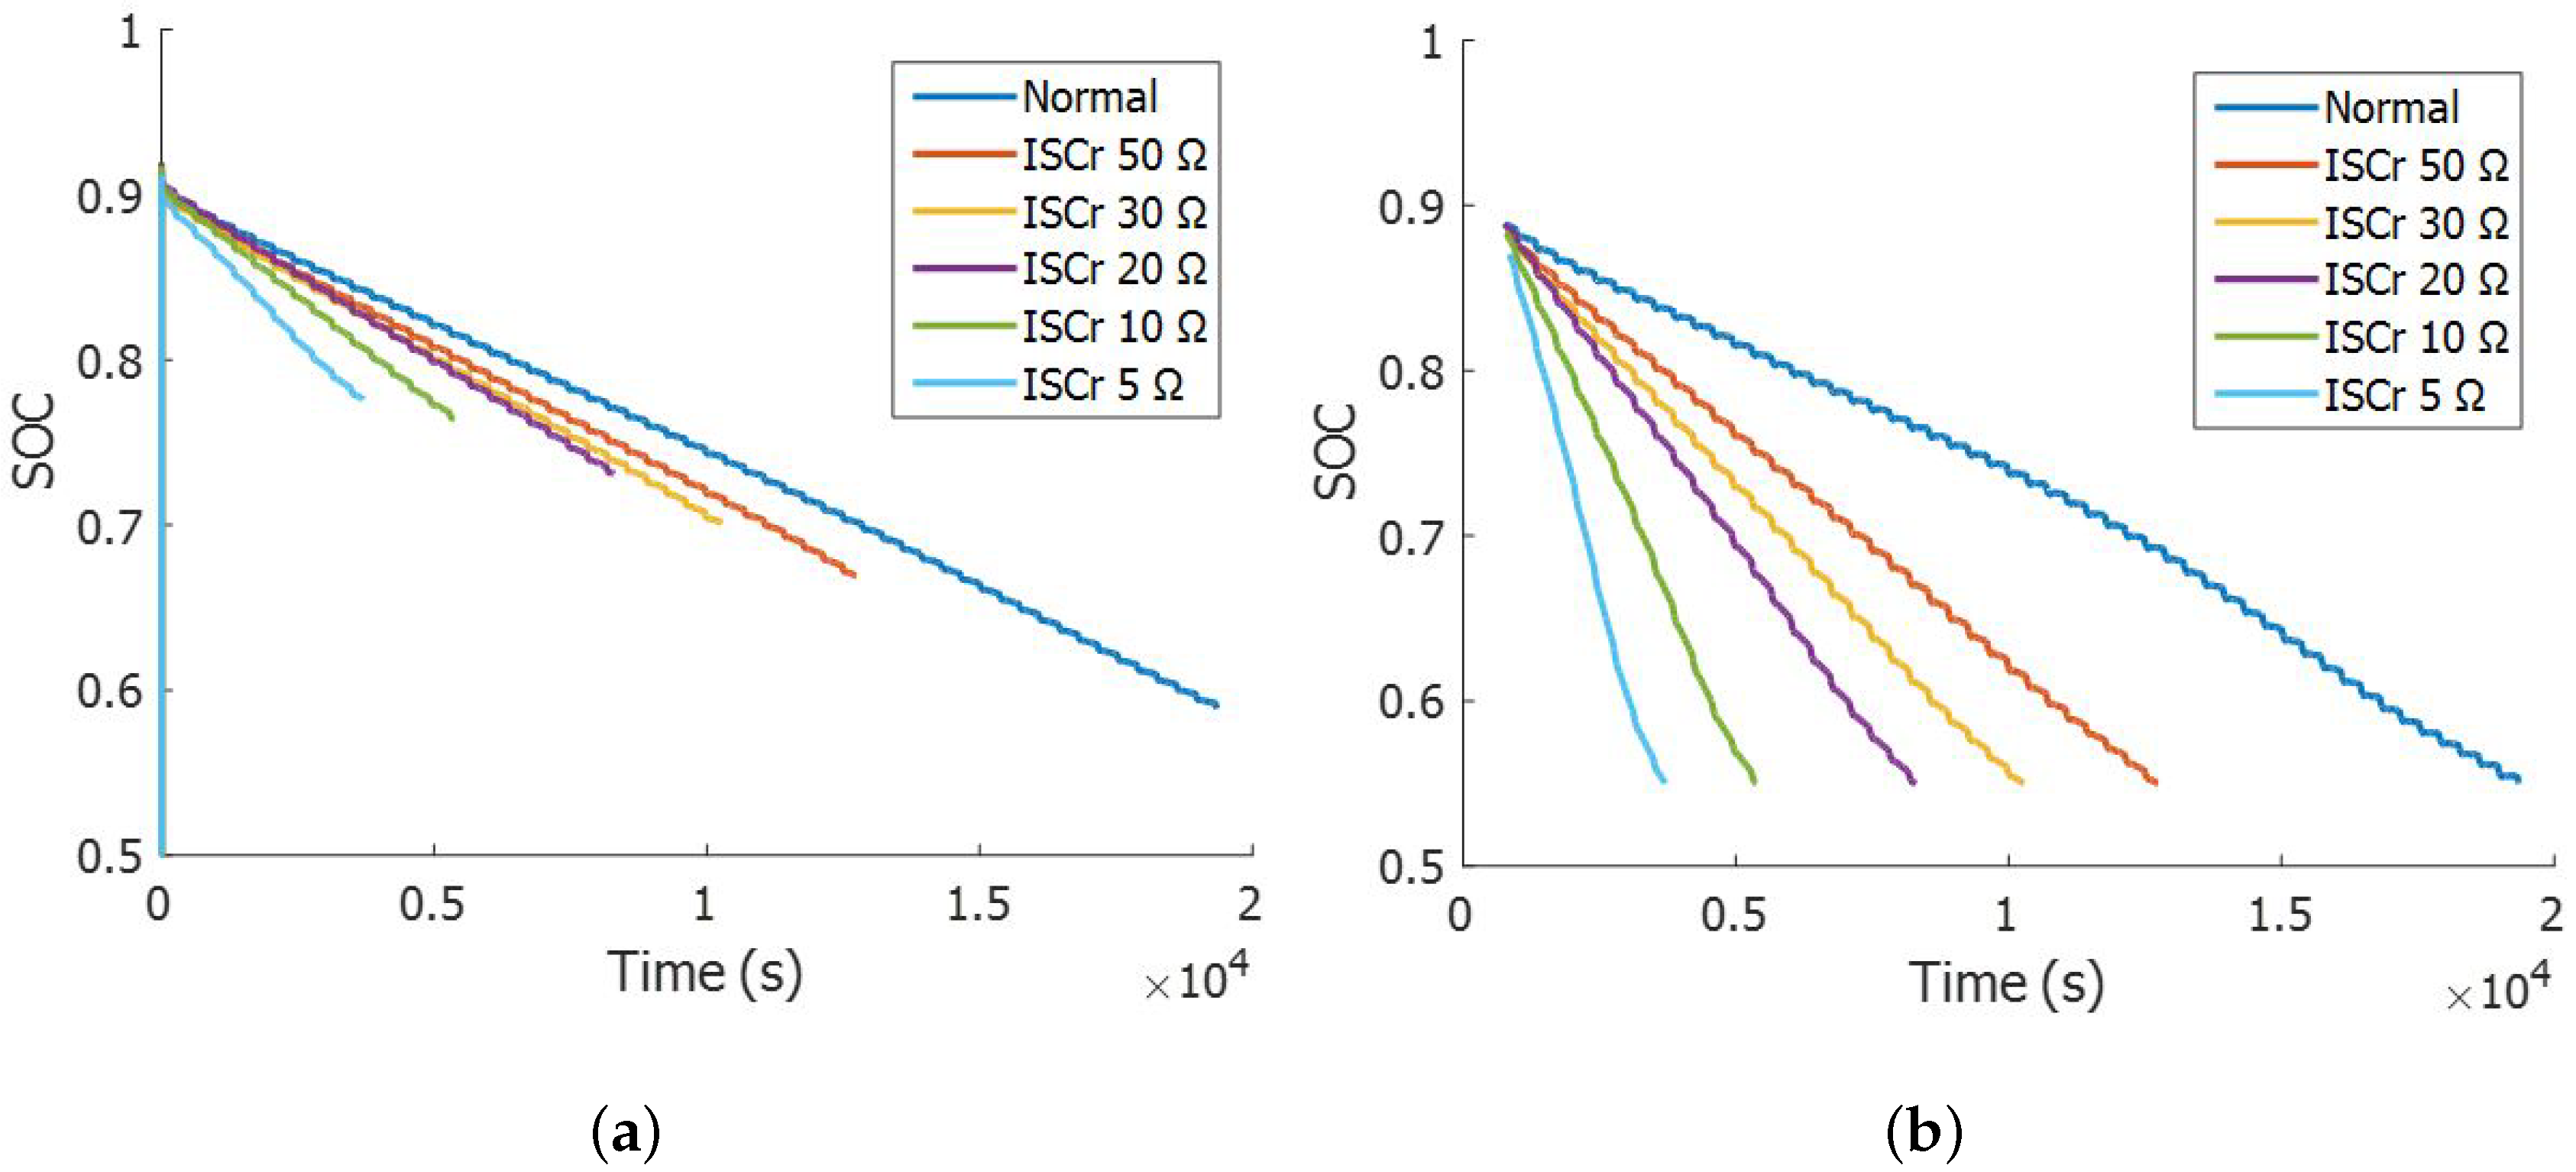
Figure 5 depicts the terminal voltages of battery pack A and B in the experiments depending on the magnitudes of . The terminal voltages of the packs were measured until the pack SOC reached 10%. As the magnitude of is small, the terminal voltages decreased rapidly compared with the voltages of the normal battery pack, leading to rapid termination of experiments for the battery packs with ISCr. The additional decline in terminal voltages caused by the self-discharge phenomenon of the ISCr was not observed clearly. In addition, because the terminal voltages of the packs were affected by waveforms of load current profiles in common, the terminal voltages fluctuated and the slight difference of voltages between the normal pack and the pack with ISCr was not monitored readily. Therefore, it was difficult to detect the soft ISCr directly with only the measurment data of terminal voltages of the packs.
4.2. Estimation Results of SOCs for Pack and Faulted Cell
As illustrated in Figure 6a, the initial values of estimates were 0.5 due to the initially assumed value of the , and the estimated s of the battery pack with ISCr decreased faster than that of the normal battery pack. However, the difference between the normal and others with various ISCr fault cases did not reflect significantly the effect of self-discharge from the ISCr in the battery pack, consequently leading to inaccurate estimates of the . Thus, deriving the properties of the faulted cell from the pack with ISCr was necessary to observe the effect of ISCr clearly. The estimated is described in Figure 6b with the specific range from 90% SOC to 55% SOC. There were no estimated values of before the was reached, because the was calculated after the was reached. Please note that by extracting the with these and from the pack with ISCr, the effect of the self-discharge phenomenon, which is not dominantly observed in the (Figure 6a), becomes enlarged noticeably in the (Figure 6b).
4.3. Estimated s from Parallel Processing
When the battery pack A was connected with true (49.91 ) and discharged with the DST current profile, the s were estimated from different four stable points of estimated SOC of the faulted cell () using the parallel processing (Figure 7). Although the four proposed methods were executed additionally in parallel with the firstly implemented method to diversify the s, the number of s can be different in accordance with the ISCr fault conditions in the pack; i.e., even though the four proposed algorithms are added sequentially in all ISCr fault cases, new s may not be extracted because of the condition, where the was obtained if the was lower than the certain small value () in Section 2.4. In the case of the experiment with the true (49.91 ), the 1st stable point were obtained from the firstly executed method, while the three stable points were extracted from the the four added algorithms. Figure 7 shows the slightly different s for the true (49.91 ). Although the obtained from the 4th stable point was most accurate among them in this case, the order of accuracy of s from the diverse stable points was changed depending on various ISCr fault cases. Therefore, to reflect all s in an ISCr fault condition, mean value () of them was used as the fault index in simulation and experiment results.
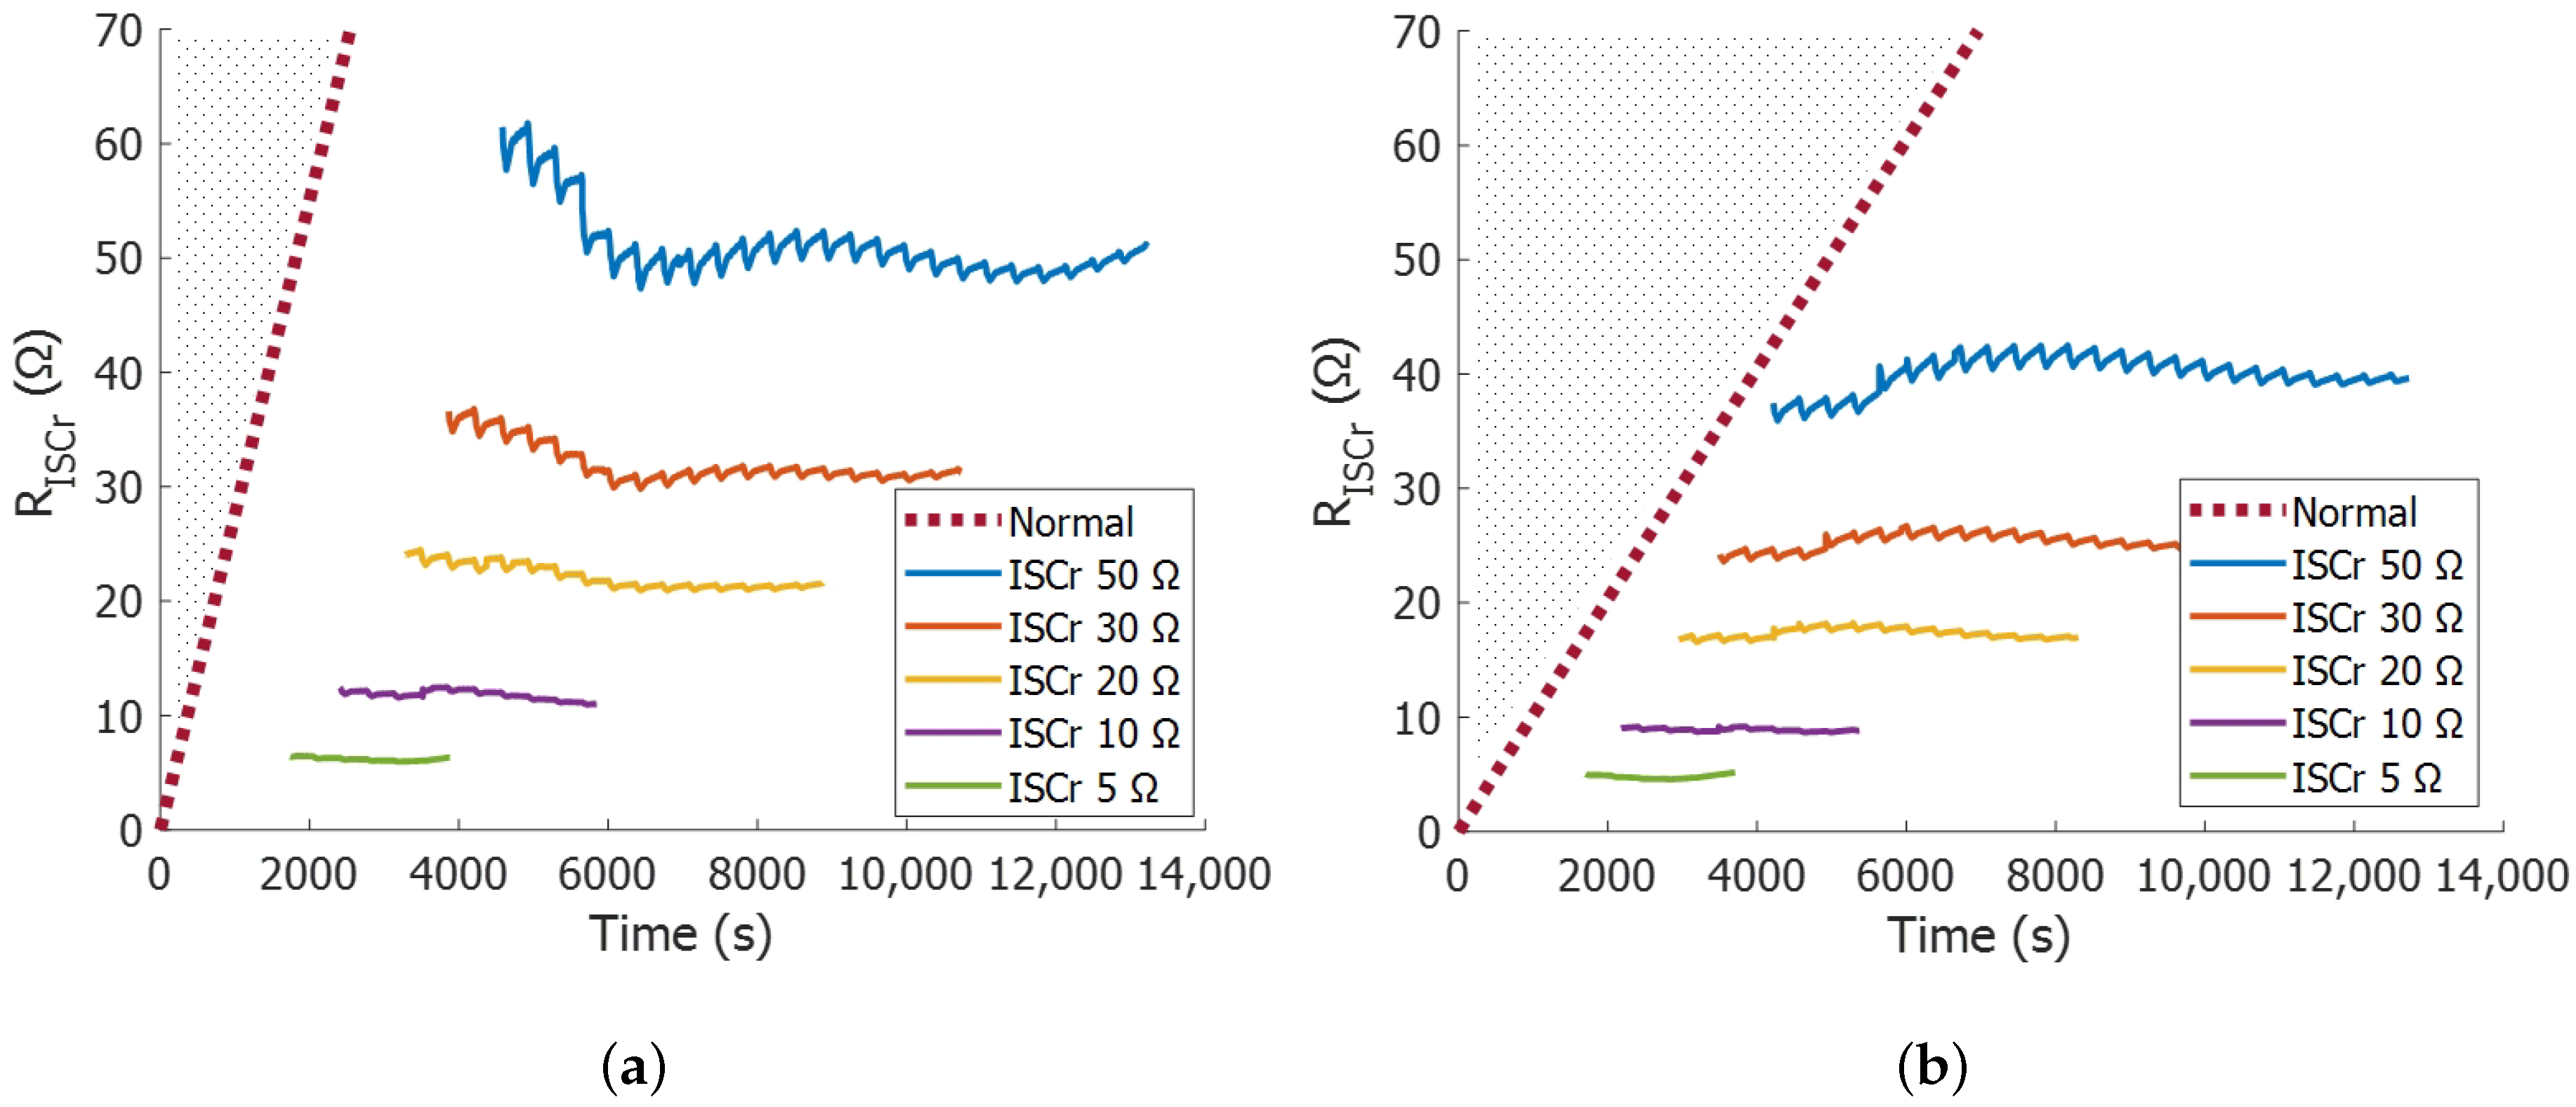
4.4. Estimation Results of in Simulation
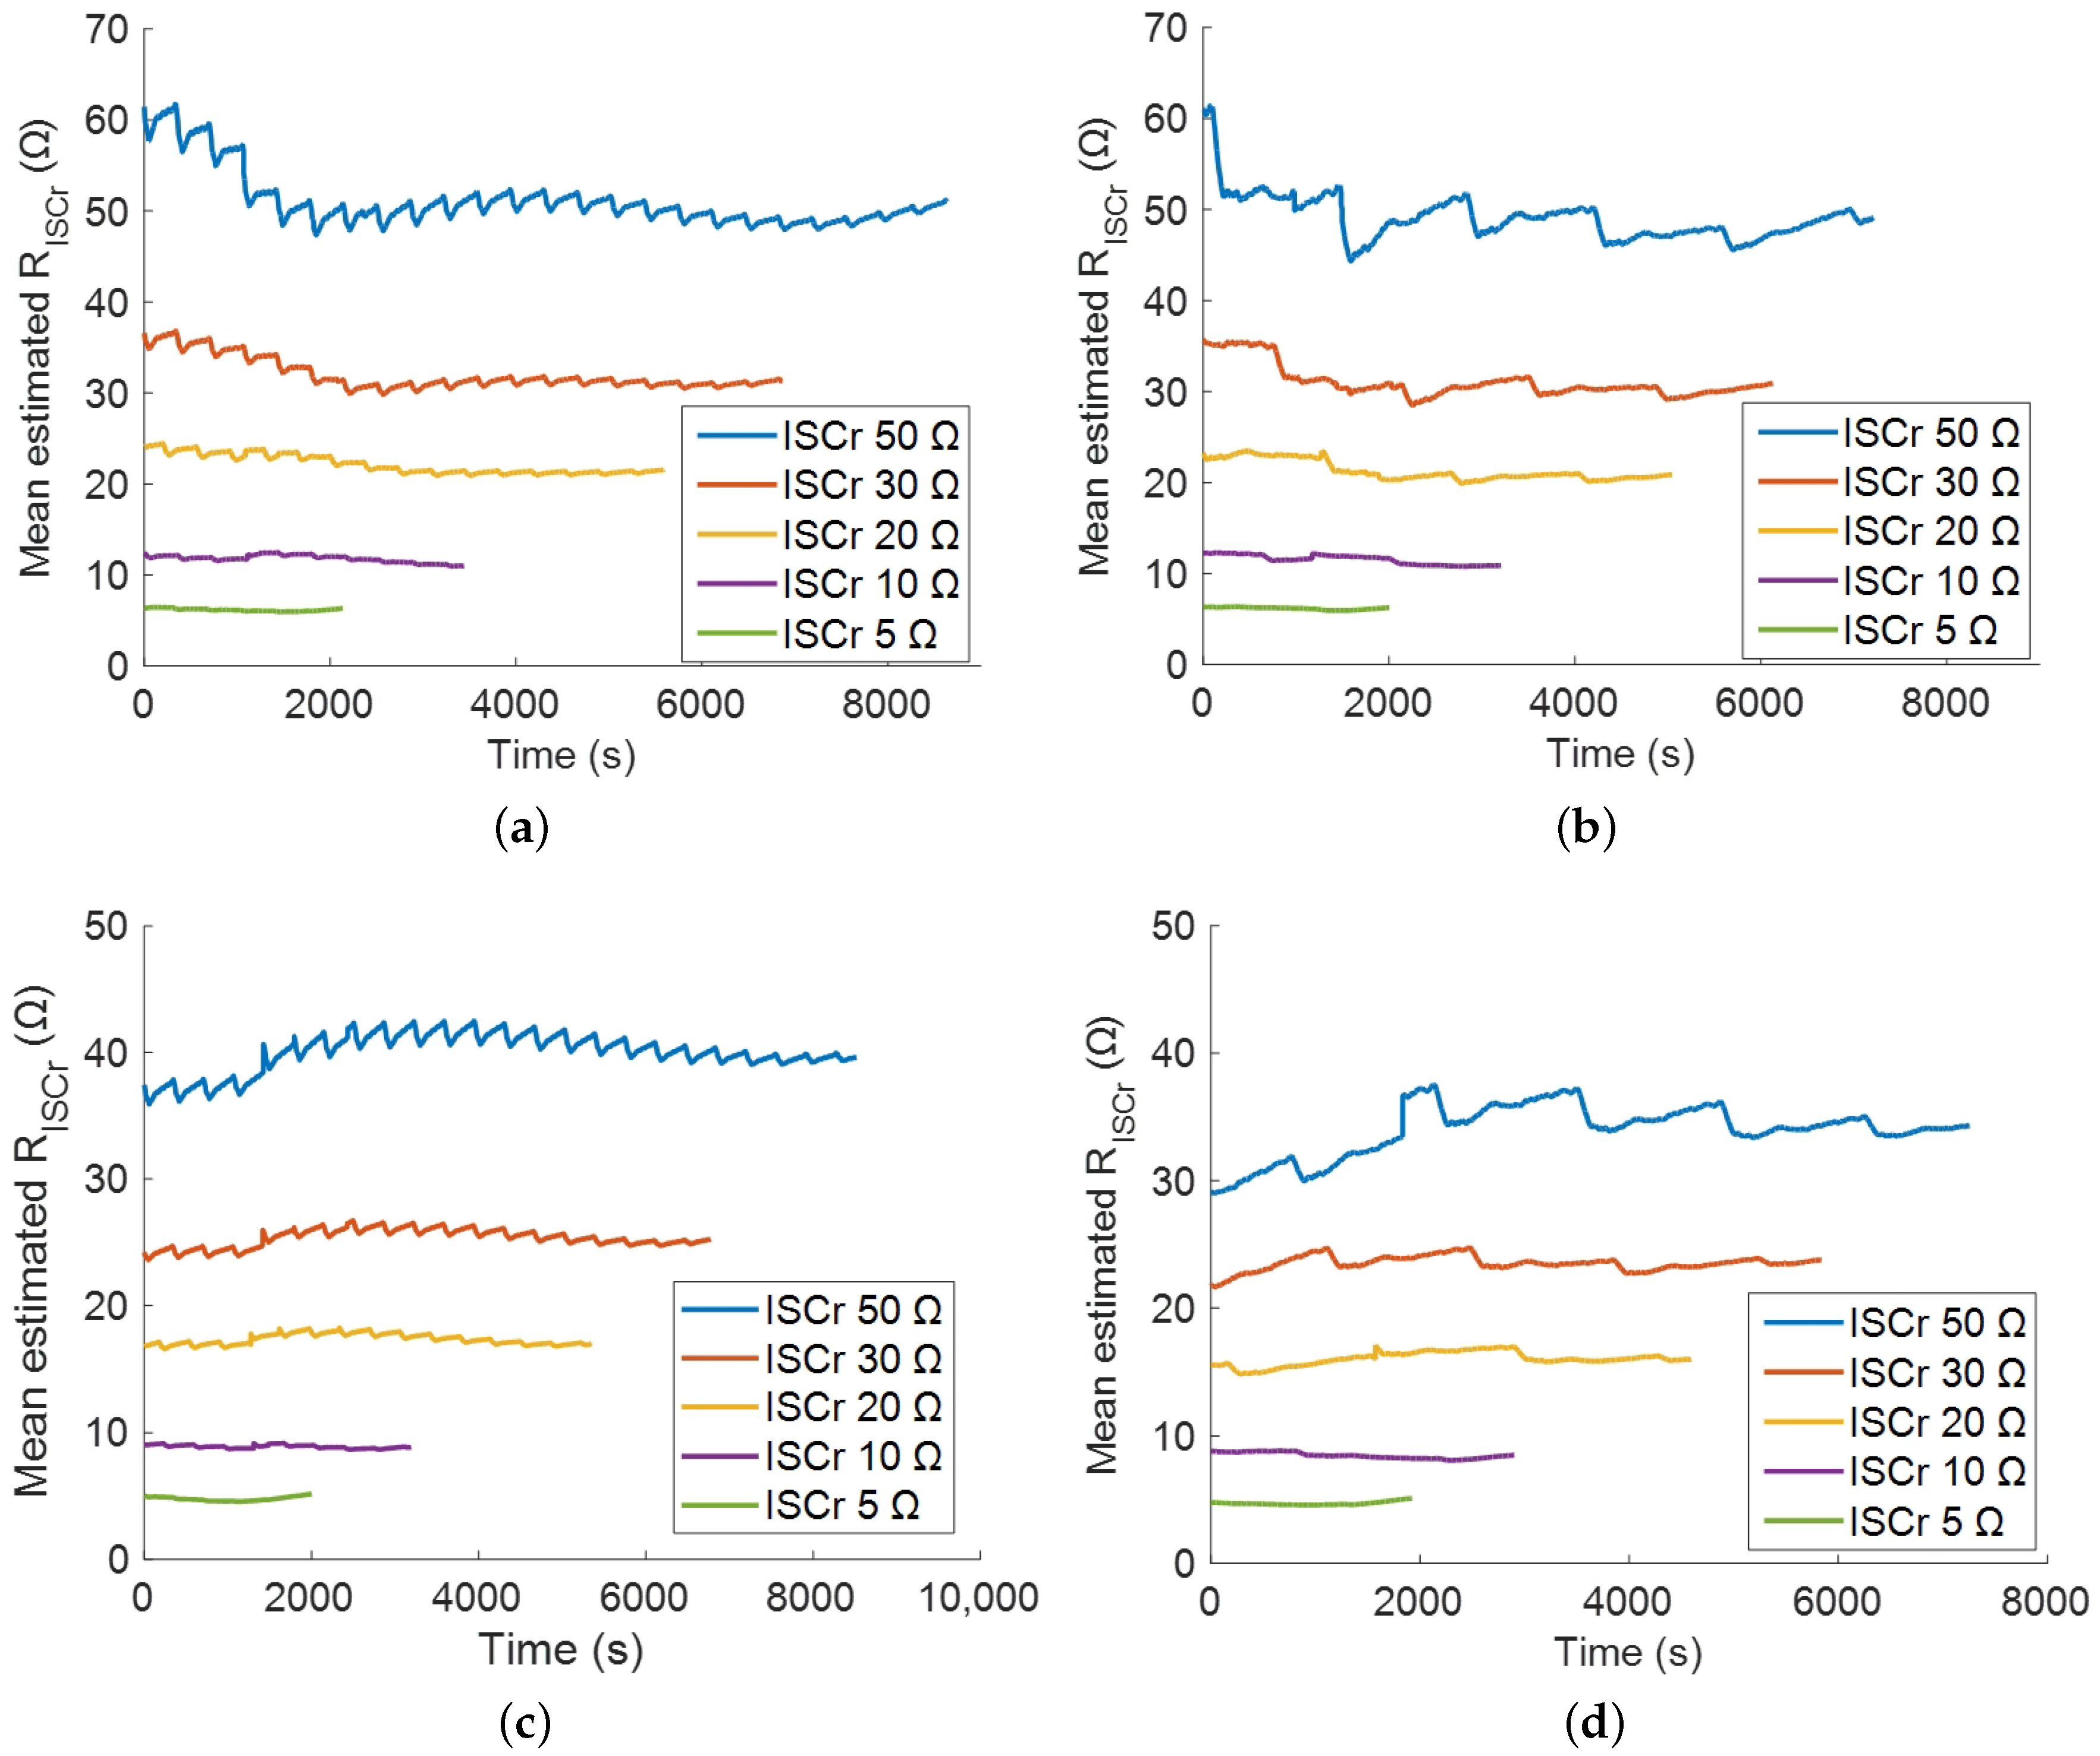
Figure 8a shows the s with different ISCr fault conditions when the DST current profile was applied to the pack with ISCr, and Figure 8b depicts the s obtained from the UDDS current profile. The s in the specific range from 90% SOC to 55% SOC are described in Figure 8. Depending on the various ISCr fault cases, the and the 1st stable point, where the starts to be obtained, were different. Thus, the different start points for estimating the s are aligned to zero in Figure 8, and the time of x-axis represents the total time used to obtain the with the s. Estimation results from two different current profiles were similar, and the values of slightly fluctuated because they were affected by waveforms of the current profiles.
The in Equation (16) is estimated with difference between the and the , which reflects the self-discharge phenomenon caused by the ISCr. At the same time, to discharge the pack, the difference between the and the becomes large as the magnitude of is small (Figure 6b). In addition, the large difference can be obtained from long discharge time. The large difference between the and the is insensitive to errors of estimated , leading to accurate estimates of the . In cases of ISCr 50 , 30 and 20 , compared to cases of ISCr 10 and 5 , large errors of the , caused by errors of estimated , occur in the early stage for estimating the because of subtle difference between the and the in short discharge time. However, the s in cases of ISCr 50 , 30 and 20 gradually approach true s because the difference between the and the becomes large gradually as the pack is discharged, resulting in the dominant effect of the self-discharge phenomenon compared with that of the estimation errors of . It is also the reason that the is used as the fault index, which was calculated with the s for the different stable points in the parallel processing considering errors caused by the position of . Although the large difference was obtained for each cases ISCr 10 and 5 , the still had errors, because using the instead of the in Equation (16) greatly affected the estimates compared to the cases of ISCr 50 , 30 and 20 ; i.e., while the was similar with the for ISCr 50 , 30 and 20 , the difference between the and the became large in cases of ISCr 10 and 5 , leading to large errors of the .
To evaluate the accuracy of the , relative errors of the estimates were calculated with Equation (17). The relative errors of the final values in s (final relative error) with the various ISCr fault conditions are shown in Table 3. It should be noted that the final relative errors are less than or equal to 10% except for the ISCr 5 case. Even though the final relative errors of ISCr 5 in the DST and the UDDS were about 26%, the ISCr fault (5 ) can be detected with the . In addition, although the magnitude of (10 ) is regarded as the minimum value which must be detected early [23,27], the (5 ) in the cell cannot sufficiently increase the temperature of the battery which is too low to cause the thermal runaway [30,37]. The reason that the magnitude of the is 5 and more for verification is to show that the proposed algorithm can be applied to detection of the soft ISCr. If the proposed method detects various soft ISCr faults, we can conclude that there is sufficient time to provide against the thermal runaway in the battery pack.
4.5. Estimation Results of in Experiment
Figure 8c,d show the estimation results of the in the experiment with the DST and the UDDS current profiles. The tendency of the obtained in experimental results was similar to that of the simulation due to the reasons explained in Section 4.4. In addition, the simplified model of the battery pack with ISCr, which was induced by assuming (Equation (8)), was validated, because all estimated s were indeed much greater than the in both simulation and experiment.
In particular, the main difference between simulation results and experimental results was that the relative errors in the experiment increased (Table 4) because in all ISCr faults cases, the s in the experiment were generally under-estimated compared to those of the simulation. Contrary to the configuration of the simulation, the characteristics of individual cells in the experiment, such as capacity, internal resistance, and relationship between OCV and SOC, were not identical. Due to both the model difference and measurement noise, the errors of estimates of the experiment increased compared to that of the simulation, leading to large errors of the estimated in the experiment. This large errors of estimates increased the values of the denominator in Equation (16); this was main cause to incur the under-estimation of in the experiment. Meanwhile, in case of ISCr 5 , the final relative errors in the experiments decreased compared to the results of simulation, because the s for ISCr 5 with large relative errors in the simulation became close to the true value of by the under-estimation in the experiment. Although the relative errors of the experiment increased compared to those of the simulation, the obtained was accurate enough to be used as the fault index to detect the soft ISCr before the thermal runaway occurs in the battery pack, and to classify the various ISCr fault conditions.
4.6. Other Discussions
For the normal battery pack, the self-discharge current cannot flow through and the faulted cell is discharged by the load current . Therefore, the is represented as Equation (18) with the , and the equation for obtaining the for the normal battery pack () can simply be expressed with both the measured and the (Equation (19)) which is the difference value between the estimated and the true .
When the is estimated with the DST load currents and the whole terminal voltages of the normal battery pack in the specific region, the maximum value and relative error of the were 0.0197 and 3.6%, respectively, for the simulation; and were 0.0502 and 8.4%, respectively, for the experiment. Actually, in Section 4.5 as the reason for the under-estimation of in the experiment, it was checked that the error of estimated for the experiment was larger than it for the simulation. These two maximum errors were used to calculate the for the normal cases in both simulation and experiment. Due to the non-zero value of , the obtained monotonically increased. In Figure 9, the dotted lines show s of the normal battery pack in the specific region and represent reliable maximum values of s for all ISCr fault cases. If the obtained exists in the region above the dotted line, the are determined as unreliable estimation values, while the region under the dotted line is defined as the reliable estimation region of the .
From the stable point , sufficient time to obtain reliable is necessary. If the is obtained when the k is very close to the in Equation (16), the can be located in the region above the dotted line, because the values of the dotted line are small in the early stage shown in Figure 9 and the obtained for ISCr fault cases can be affected by both the estimation errors of and measurement noise in the and the . Thus, in the proposed method, the was estimated once the difference between the and the was more than or equal to 0.1; this condition guaranteed that the s in various ISCr faults of simulation and experiment exist in the reliable estimation region.
When a battery pack is manufactured with used lithium-ion cells, a variation in the characteristics of individual cells in the pack becomes large [41], resulting in large error of estimates. However, the battery pack made with used cells can be operated with balanced voltage and SOC due to the proper screening process in configuring the battery pack [53]. Therefore, the proposed method can be applied in both fresh and reused battery pack.
If an ambient temperature in operation environment of the battery varies and the battery model which does not reflect thermal properties of the battery is used to estimate the SOC, errors of estimated SOC become large [54,55,56,57], leading to large error of estimates. Although in this study the proposed method focused on detecting the soft ISCr at constant temperature, depending on real applications the ambient temperature can be changed [58]. Therefore, detection of ISCr in the battery under varing ambient temperature is a maningful and interesting subject of reaserch as a future work.
5. Conclusions
In this paper, a method for detecting the ISCr early in the lithium-ion battery pack was introduced. The battery pack with ISCr was represented with the equivalent circuit model with the and the EKF algorithm was used to estimate accurately. The OCV of the faulted cell was derived from the battery pack with ISCr to reflect the self-discharge phenomenon caused by the ISCr in the battery pack clearly, because the effect of ISCr in the battery pack was not observed in both the and the obviously. Using the Coulomb counting method and the stable initial value of the , obtained from the estimated , the was calculated. The and the were acquired from the relationship between OCV and SOC of the normal battery pack, and then the was calculated with these two OCV values. Subsequently, the (5∼50 ) of the battery pack with ISCr was estimated accurately using the self-discharge phenomenon in the . The proposed algorithm was verified for various soft ISCr fault conditions such as diverse magnitudes of true and two load current profiles in both the simulation and the experiment. In addition, through estimating the from the normal battery pack and analyzing it, it was checked that estimated s in the various fault cases were reliable. Using the proposed algorithm, the was estimated with high accuracy, and the soft ISCr in the battery pack can be detected using the as the fault index. Our future research will focus on increasing the accuracy of the estimates and extending the availability of our proposed algorithm to both the aged battery pack and the battery under varing ambient temperature.
Author Contributions
M.S. suggested the main idea of this paper and constructed the proposed detection technique. T.G. contributed the mathematical modeling and thoroughly reviewed the paper. M.P. conducted the experiments and thoroughly reviewed the paper. S.W.K. supervised the work and finally reviewed the paper.
Funding
This research was funded by the National Research Foundation of Korea (NRF) grant funded by the Korea government (MSIT) grant number [2018R1A2B6005522], MSIT: Ministry of Science and ICT.
Acknowledgments
This work was supported by the National Research Foundation of Korea (NRF) grant funded by the Korea government (MSIT), MSIT: Ministry of Science and ICT (2018R1A2B6005522).
Conflicts of Interest
The authors declare no conflict of interest.
Nomenclature
| Symbols | |
| RISCr | ISCr resistance, Ω |
| Vt | Terminal voltage, V |
| IL | Load current, A |
| VOC | OCV, V |
| R | Internal resistance, Ω |
| I1L | Self-discharge current, A |
| I2L | Residual current, A |
| η | Charging and discharging efficiency |
| Δt | Sample period |
| Cn | Nominal capacity |
| h | Function of relation between OCV ans SOC |
| h−1 | Inverse function of h |
| є | Difference error |
| x | EKF state variable |
| y | EKF output variable |
| u | EKF input variable |
| w, v | EKF process/measurement errors |
| Q, T | EKF covariances of Gaussian noise |
| A | EKF state transition matrix |
| C | EKF observation matrix |
| P | EKF error covariance matrix |
| L | EKF Kalman gain |
| f | EKF state update function |
| g | EKF output update function |
| pst | Stable point, sample index |
| Subscripts | |
| p | battery pack |
| f | faulted cell |
| n | normal cell |
| k | iterration index |
| j | cell index |
| m | number of cells in the pack |
| 1, 2, 3, 4 | 1st, 2nd, 3rd, 4th stable points |
| Abbreviations | |
| ISCr | Internal short circuit |
| OCV | Open circuit voltage |
| SOC | State of charge |
| BMS | Battery management system |
| EKF | Extended Kalman filter |
| DST | Dynamic stress test |
| UDDS | Urban dynamometer driving schedule |
| CC-CV | Constant-current constant-voltage |
References
- Capasso, C.; Veneri, O.T. Experimental analysis on the performance of lithium based batteries for road full electric and hybrid vehicles. Appl. Energy 2014, 136, 921–930. [Google Scholar] [CrossRef]
- Panchal, S.; Rashid, M.; Long, F.; Mathew, M.; Fraser, R.; Fowler, M. Degradation Testing and Modeling of 200 Ah LiFePO4 Battery for EV; SAE Technical Paper; SAE: Warrendale, PA, USA, 2018. [Google Scholar]
- Tarascon, J.M.; Armand, M. Issues and challenges facing rechargeable lithium batteries. In Materials for Sustainable Energy: A Collection of Peer-Reviewed Research and Review Articles from Nature Publishing Group; World Scientific: Hackensack, NJ, USA, 2011; pp. 171–179. [Google Scholar]
- Deng, D.; Kim, M.G.; Lee, J.Y.; Cho, J. Green energy storage materials: Nanostructured TiO2 and Sn-based anodes for lithium-ion batteries. Energy Environ. Sci. 2009, 2, 818–837. [Google Scholar] [CrossRef]
- Nykvist, B.; Nilsson, M. Rapidly falling costs of battery packs for electric vehicles. Nat. Clim. Chang. 2015, 5, 329. [Google Scholar] [CrossRef]
- Pillot, C. Battery market development for consumer electronics, automotive, and industrial: Materials requirements and trends. In Proceedings of the 5th Israeli Power Sources Conference, Herzelia, Israel, 21 May 2015; pp. 1–40. [Google Scholar]
- Tsujikawa, T.; Yabuta, K.; Arakawa, M.; Hayashi, K. Safety of large-capacity lithium-ion battery and evaluation of battery system for telecommunications. J. Power Sources 2013, 244, 11–16. [Google Scholar] [CrossRef]
- Abada, S.; Marlair, G.; Lecocq, A.; Petit, M.; Sauvant-Moynot, V.; Huet, F. Safety focused modeling of lithium-ion batteries: A review. J. Power Sources 2016, 306, 178–192. [Google Scholar] [CrossRef] [Green Version]
- Gao, Z.; Chin, C.S.; Chiew, J.H.K.; Jia, J.; Zhang, C. Design and Implementation of a Smart Lithium-Ion Battery System with Real-Time Fault Diagnosis Capability for Electric Vehicles. Energies 2017, 10, 1503. [Google Scholar] [CrossRef]
- Kolly, J.M.; Panagiotou, J.; Czech, B.A. The Investigation of a Lithium-Ion Battery Fire Onboard a Boeing 787 by the US National Transportation Safety Board; Safety Research Corporation of America: Dothan, AL, USA, 2013; pp. 1–18. [Google Scholar]
- Samsung Investigation Reveals New Details about Note7 Battery Failures. Available online: https://consumerist.com/2017/01/22/samsung-investigation-reveals-new-details-about-note7-battery-failures/ (accessed on 12 June 2018).
- Lisbona, D.; Snee, T. A review of hazards associated with primary lithium and lithium-ion batteries. Process Saf. Environ. Prot. 2011, 89, 434–442. [Google Scholar] [CrossRef]
- Cai, W.; Wang, H.; Maleki, H.; Howard, J.; Lara-Curzio, E. Experimental simulation of internal short circuit in Li-ion and Li-ion-polymer cells. J. Power Sources 2011, 196, 7779–7783. [Google Scholar] [CrossRef]
- Wu, Y.; Saxena, S.; Xing, Y.; Wang, Y.; Li, C.; Yung, W.K.; Pecht, M. Analysis of Manufacturing-Induced Defects and Structural Deformations in Lithium-Ion Batteries Using Computed Tomography. Energies 2018, 11, 925. [Google Scholar] [CrossRef]
- Maleki, H.; Howard, J.N. Internal short circuit in Li-ion cells. J. Power Sources 2009, 191, 568–574. [Google Scholar] [CrossRef]
- Leising, R.A.; Palazzo, M.J.; Takeuchi, E.S.; Takeuchi, K.J. A study of the overcharge reaction of lithium-ion batteries. J. Power Sources 2001, 97, 681–683. [Google Scholar] [CrossRef]
- Maleki, H.; Howard, J.N. Effects of overdischarge on performance and thermal stability of a Li-ion cell. J. Power Sources 2006, 160, 1395–1402. [Google Scholar] [CrossRef]
- Kriston, A.; Pfrang, A.; Döring, H.; Fritsch, B.; Ruiz, V.; Adanouj, I.; Boon-Brett, L. External short circuit performance of Graphite-LiNi1/3Co1/3Mn1/3O2 and Graphite-LiNi0.8Co0.15Al0.05O2 cells at different external resistances. J. Power Sources 2017, 361, 170–181. [Google Scholar] [CrossRef]
- Santhanagopalan, S.; Ramadass, P.; Zhang, J.Z. Analysis of internal short-circuit in a lithium ion cell. J. Power Sources 2009, 194, 550–557. [Google Scholar] [CrossRef]
- Spotnitz, R.; Muller, R.P. Simulation of abuse behavior of lithium-ion batteries. Electrochem. Soc. Interface 2012, 21, 57–60. [Google Scholar] [CrossRef]
- Xu, J.; Wu, Y.; Yin, S. Investigation of effects of design parameters on the internal short-circuit in cylindrical lithium-ion batteries. RSC Adv. 2017, 7, 14360–14371. [Google Scholar] [CrossRef] [Green Version]
- Wang, Q.; Ping, P.; Zhao, X.; Chu, G.; Sun, J.; Chen, C. Thermal runaway caused fire and explosion of lithium ion battery. J. Power Sources 2012, 208, 210–224. [Google Scholar] [CrossRef]
- Feng, X.; Fang, M.; He, X.; Ouyang, M.; Lu, L.; Wang, H.; Zhang, M. Thermal runaway features of large format prismatic lithium ion battery using extended volume accelerating rate calorimetry. J. Power Sources 2014, 255, 294–301. [Google Scholar] [CrossRef]
- Jhu, C.Y.; Wang, Y.W.; Wen, C.Y.; Shu, C.M. Thermal runaway potential of LiCoO2 and Li(Ni1/3Co1/3Mn1/3)O2 batteries determined with adiabatic calorimetry methodology. Appl. Energy 2012, 100, 127–131. [Google Scholar] [CrossRef]
- Zavalis, T.G.; Behm, M.; Lindbergh, G. Investigation of short-circuit scenarios in a lithium-ion battery cell. J. Electrochem. Soc. 2012, 159, A848–A859. [Google Scholar] [CrossRef]
- Xia, B.; Mi, C.; Chen, Z.; Robert, B. Multiple cell lithium-ion battery system electric fault online diagnostics. In Proceedings of the Transportation Electrification Conference and Expo (ITEC), Dearborn, MI, USA, 14–17 June 2015; pp. 1–7. [Google Scholar]
- Feng, X.; Weng, C.; Ouyang, M.; Sun, J. Online internal short circuit detection for a large format lithium ion battery. Appl. Energy 2016, 161, 168–180. [Google Scholar] [CrossRef] [Green Version]
- Kim, G.H.; Smith, K.; Ireland, J.; Pesaran, A. Fail-safe design for large capacity lithium-ion battery systems. J. Power Sources 2012, 210, 243–253. [Google Scholar] [CrossRef]
- Guo, R.; Lu, L.; Ouyang, M.; Feng, X. Mechanism of the entire overdischarge process and overdischarge-induced internal short circuit in lithium-ion batteries. Sci. Rep. 2016, 6, 30248. [Google Scholar] [CrossRef] [PubMed] [Green Version]
- Feng, X.; He, X.; Lu, L.; Ouyang, M. Analysis on the Fault Features for Internal Short Circuit Detection Using an Electrochemical-Thermal Coupled Model. J. Electrochem. Soc. 2018, 165, A155–A167. [Google Scholar] [CrossRef]
- Sazhin, S.V.; Dufek, E.J.; Gering, K.L. Enhancing Li-Ion Battery Safety by Early Detection of Nascent Internal Shorts. J. Electrochem. Soc. 2017, 164, A6281–A6287. [Google Scholar] [CrossRef]
- Seo, M.; Goh, T.; Koo, G.; Park, M.; Kim, S.W. Detection of internal short circuit in Li-ion battery by estimating its resistance. In Proceedings of the 4th IIAE International Conference on Intelligent Systems and Image Processing (ICISIP2016), Kyoto, Japan, 8–12 September 2016; pp. 212–217. [Google Scholar]
- Seo, M.; Goh, T.; Park, M.; Koo, G.; Kim, S.W. Detection of Internal Short Circuit in Lithium Ion Battery Using Model-Based Switching Model Method. Energies 2017, 10, 76. [Google Scholar] [CrossRef]
- Chen, H.; Cong, T.N.; Yang, W.; Tan, C.; Li, Y.; Ding, Y. Progress in electrical energy storage system: A critical review. Prog. Nat. Sci. 2009, 19, 291–312. [Google Scholar] [CrossRef]
- Hesse, H.C.; Schimpe, M.; Kucevic, D.; Jossen, A. Lithium-Ion Battery Storage for the Grid—A Review of Stationary Battery Storage System Design Tailored for Applications in Modern Power Grids. Energies 2017, 10, 2107. [Google Scholar] [CrossRef]
- Xia, B.; Shang, Y.; Nguyen, T.; Mi, C. A correlation based fault detection method for short circuits in battery packs. J. Power Sources 2017, 337, 1–10. [Google Scholar] [CrossRef]
- Feng, X.; Pan, Y.; He, X.; Wang, L.; Ouyang, M. Detecting the internal short circuit in large-format lithium-ion battery using model-based fault-diagnosis algorithm. J. Energy Storage 2018, 18, 26–39. [Google Scholar] [CrossRef]
- Ouyang, M.; Zhang, M.; Feng, X.; Lu, L.; Li, J.; He, X.; Zheng, Y. Internal short circuit detection for battery pack using equivalent parameter and consistency method. J. Power Sources 2015, 294, 272–283. [Google Scholar] [CrossRef]
- Lu, L.; Han, X.; Li, J.; Hua, J.; Ouyang, M. A review on the key issues for lithium-ion battery management in electric vehicles. J. Power Sources 2013, 226, 272–288. [Google Scholar] [CrossRef]
- Andrea, D. Battery Management Systems for Large Lithium-Ion Battery Packs; Artech House: Norwood, MA, USA, 2010. [Google Scholar]
- Väyrynen, A.; Salminen, J. Lithium ion battery production. J. Chem. Thermodyn. 2012, 46, 80–85. [Google Scholar] [CrossRef]
- Zhao, W.; Luo, G.; Wang, C.Y. Modeling nail penetration process in large-format Li-ion cells. J. Electrochem. Soc. 2015, 162, A207–A217. [Google Scholar] [CrossRef]
- Zhao, R.; Liu, J.; Gu, J. Simulation and experimental study on lithium ion battery short circuit. Appl. Energy 2016, 173, 29–39. [Google Scholar] [CrossRef]
- Plett, G.L. Extended Kalman filtering for battery management systems of LiPB-based HEV battery packs: Part 3. State and parameter estimation. J. Power Sources 2004, 134, 277–292. [Google Scholar] [CrossRef]
- Tong, S.; Klein, M.P.; Park, J.W. On-line optimization of battery open circuit voltage for improved state-of-charge and state-of-health estimation. J. Power Sources 2015, 293, 416–428. [Google Scholar] [CrossRef]
- Hussein, A.A.H.; Batarseh, I. State-of-charge estimation for a single Lithium battery cell using Extended Kalman Filter. In Proceedings of the Power and Energy Society General Meeting, Detroit, MI, USA, 24–29 July 2011; pp. 1–5. [Google Scholar]
- Wang, D.; Bao, Y.; Shi, J. Online Lithium-Ion Battery Internal Resistance Measurement Application in State-of-Charge Estimation Using the Extended Kalman Filter. Energies 2017, 10, 1284. [Google Scholar] [CrossRef]
- He, H.; Zhang, X.; Xiong, R.; Xu, Y.; Guo, H. Online model-based estimation of state-of-charge and open-circuit voltage of lithium-ion batteries in electric vehicles. Energy 2012, 39, 310–318. [Google Scholar] [CrossRef]
- Xing, Y.; He, W.; Pecht, M.; Tsui, K.L. State of charge estimation of lithium-ion batteries using the open-circuit voltage at various ambient temperatures. Appl. Energy 2014, 113, 106–115. [Google Scholar] [CrossRef]
- Yao, L.W.; Aziz, J.A.; Kong, P.Y.; Idris, N.R.N. Modeling of lithium-ion battery using MATLAB/simulink. In Proceedings of the 2013 39th Annual Conference of the IEEE Industrial Electronics Society, Vienna, Austria, 10–13 November 2013; pp. 1729–1734. [Google Scholar]
- Liaw, B.Y.; Nagasubramanian, G.; Jungst, R.G.; Doughty, D.H. Modeling of lithium ion cells—A simple equivalent-circuit model approach. Solid State Ionics 2004, 175, 835–839. [Google Scholar]
- Wang, J.; Purewal, J.; Liu, P.; Hicks-Garner, J.; Soukazian, S.; Sherman, E.; Verbrugge, M.W. Degradation of lithium ion batteries employing graphite negatives and nickel–cobalt–manganese oxide+ spinel manganese oxide positives: Part 1, aging mechanisms and life estimation. J. Power Sources 2014, 269, 937–948. [Google Scholar] [CrossRef]
- Kim, J.; Shin, J.; Chun, C.; Cho, B.H. Stable configuration of a Li-ion series battery pack based on a screening process for improved voltage/SOC balancing. IEEE Trans. Power Electron. 2012, 27, 411–424. [Google Scholar] [CrossRef]
- Madani, S.S.; Schaltz, E.; Knudsen Kær, S. Review of Parameter Determination for Thermal Modeling of Lithium Ion Batteries. Batteries 2018, 4, 20. [Google Scholar] [CrossRef]
- Chin, C.S.; Gao, Z. State-of-Charge Estimation of Battery Pack under Varying Ambient Temperature Using an Adaptive Sequential Extreme Learning Machine. Energies 2018, 11, 711. [Google Scholar] [CrossRef]
- Gao, Z.; Chin, C.S.; Woo, W.L.; Jia, J. Integrated equivalent circuit and thermal model for simulation of temperature-dependent LiFePO4 battery in actual embedded application. Energies 2017, 10, 85. [Google Scholar] [CrossRef]
- Gao, Z.C.; Chin, C.S.; Toh, W.D.; Chiew, J.; Jia, J. State-of-Charge Estimation and Active Cell Pack Balancing Design of Lithium Battery Power System for Smart Electric Vehicle. J. Adv. Transp. 2017, 2017. [Google Scholar] [CrossRef]
- Panchal, S.; Mcgrory, J.; Kong, J.; Fraser, R.; Fowler, M.; Dincer, I.; Agelin-Chaab, M. Cycling degradation testing and analysis of a LiFePO4 battery at actual conditions. Int. J. Energy Res. 2017, 41, 2565–2575. [Google Scholar] [CrossRef]
Figure 1.
The scheme of the proposed algorithm.

Figure 2.
Equivalent circuit model of the lithium-ion battery pack with internal short circuit (ISCr).
Figure 2.
Equivalent circuit model of the lithium-ion battery pack with internal short circuit (ISCr).

Figure 3.
Relationship between open circuit voltage (OCV) and state of charge (SOC) of the normal battery pack.
Figure 3.
Relationship between open circuit voltage (OCV) and state of charge (SOC) of the normal battery pack.

Figure 4.
Experimental configuration for ISCr tests.
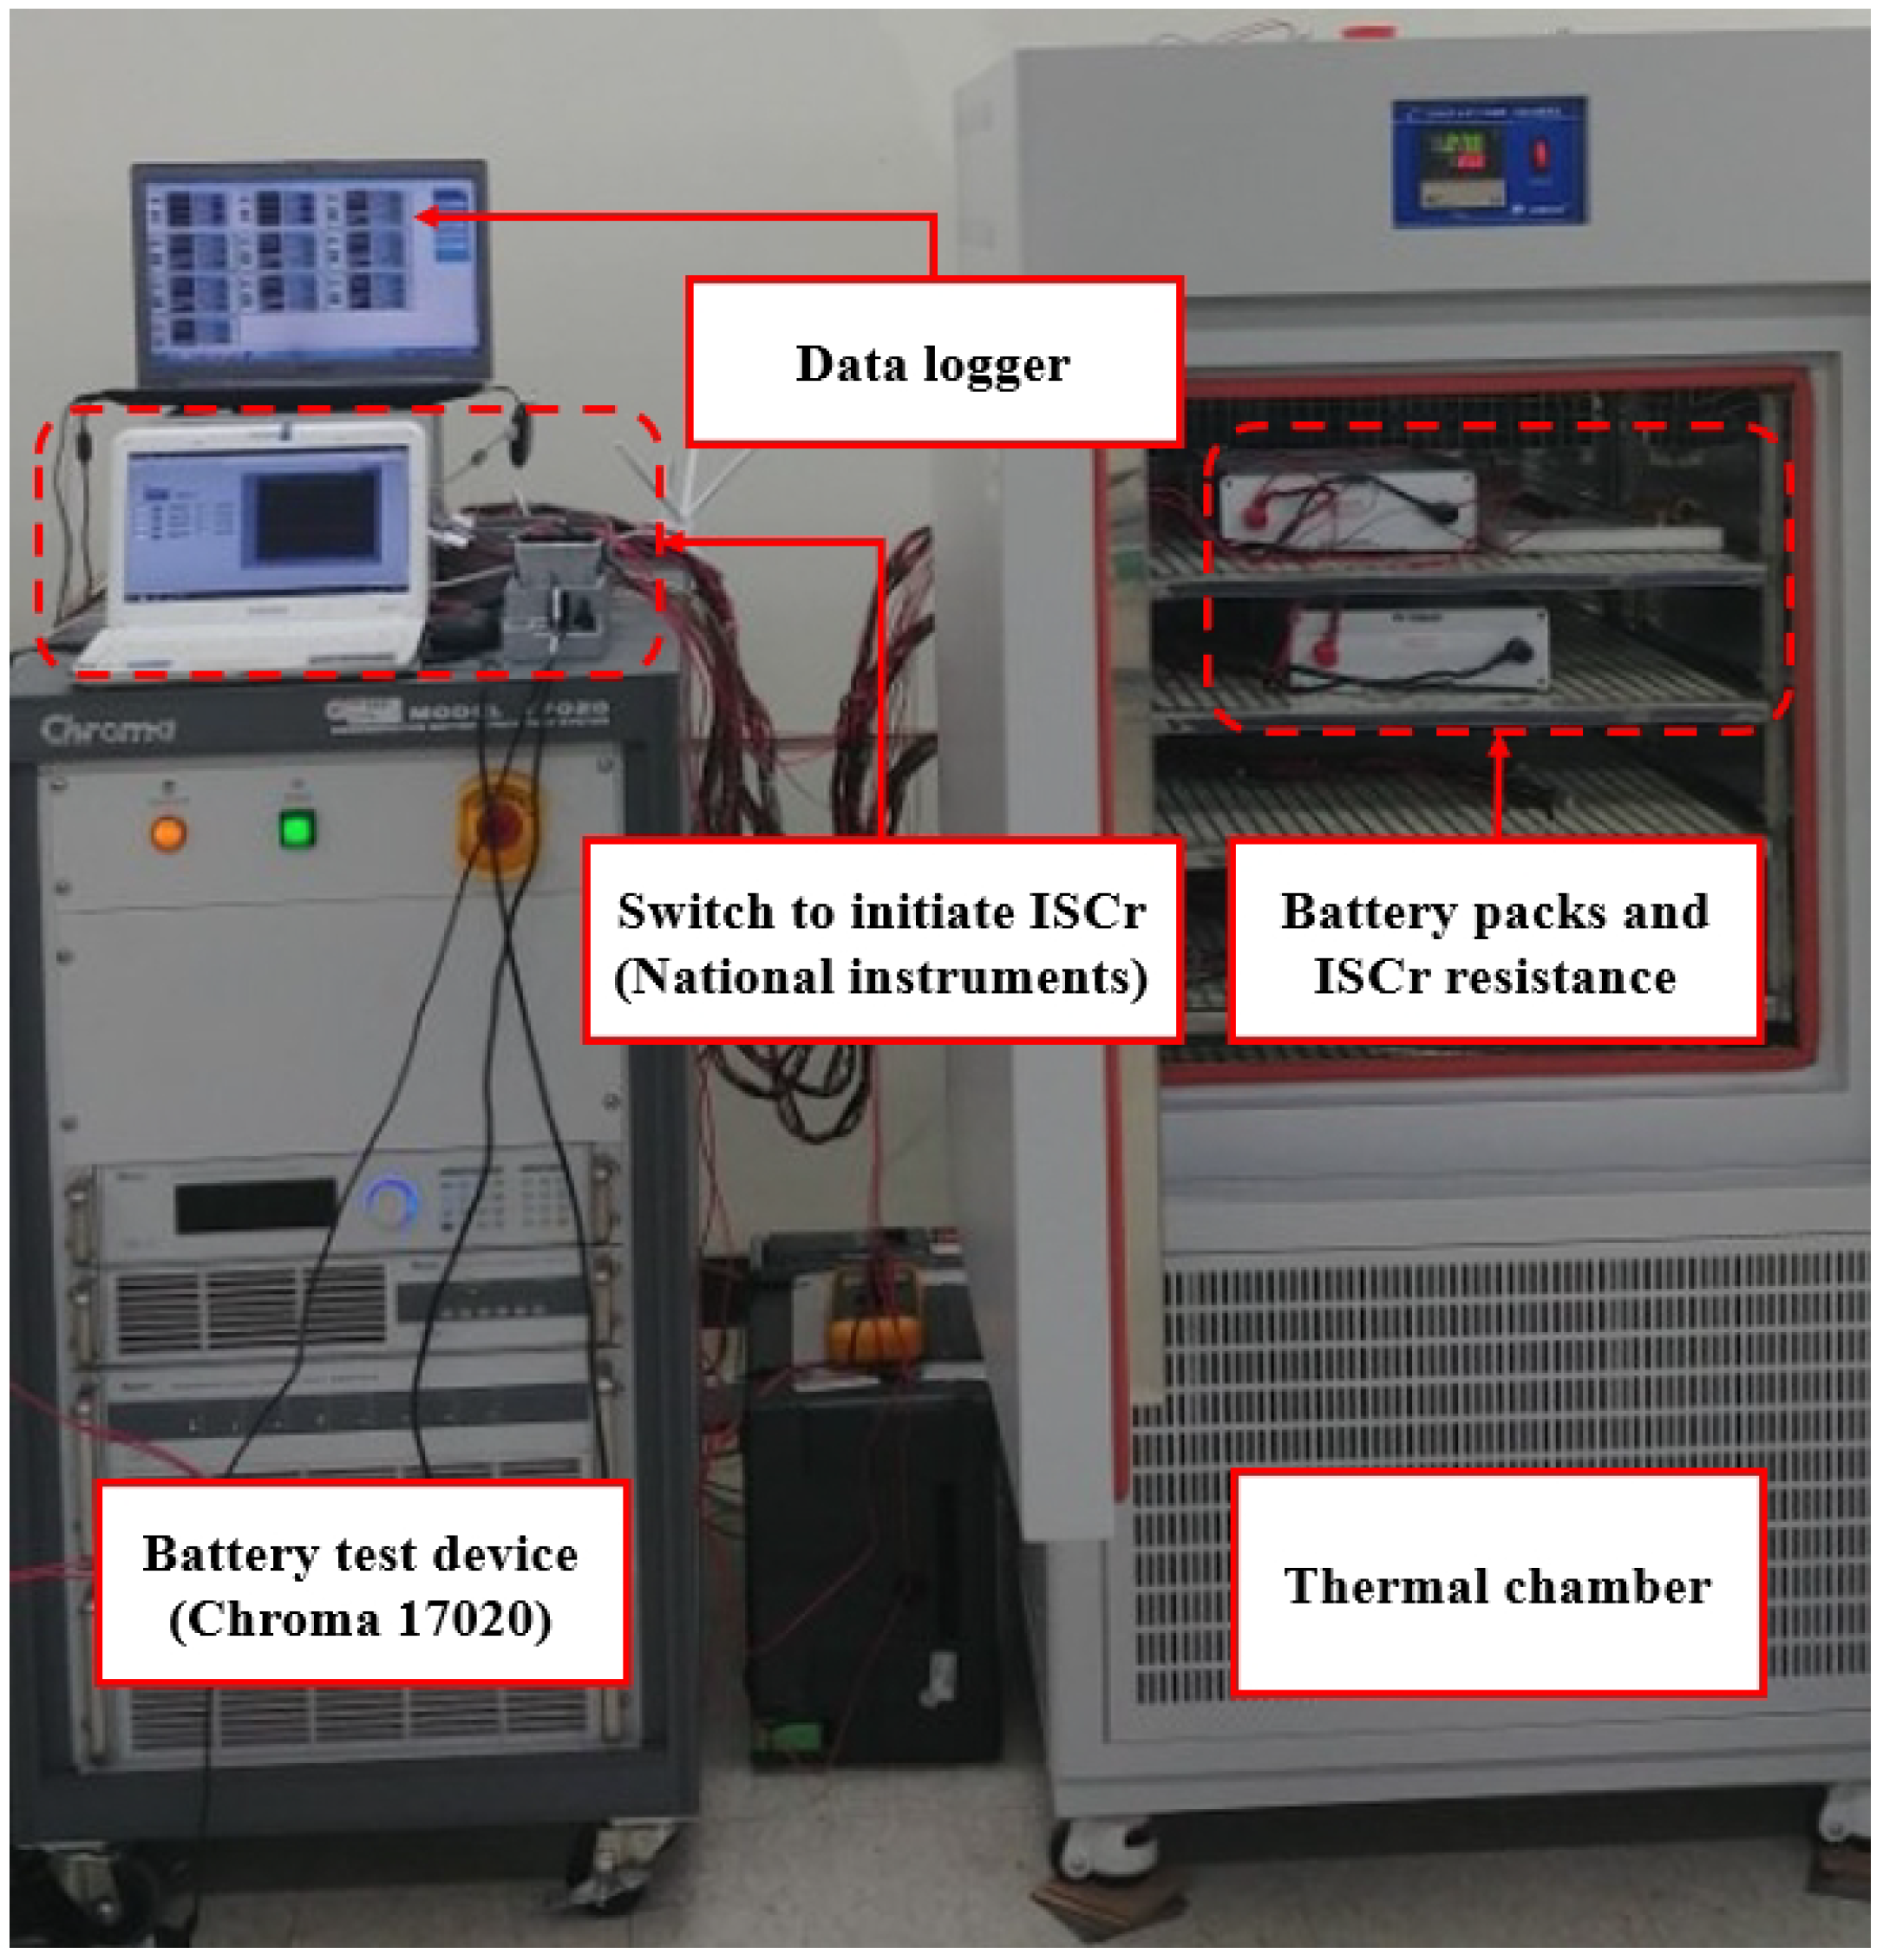
Figure 5.
Terminal voltages of battery packs with different s in experiment with (a) dynamic stress test (DST) current profile, and (b) urban dynamometer driving schedules (UDDS) current profile.
Figure 5.
Terminal voltages of battery packs with different s in experiment with (a) dynamic stress test (DST) current profile, and (b) urban dynamometer driving schedules (UDDS) current profile.
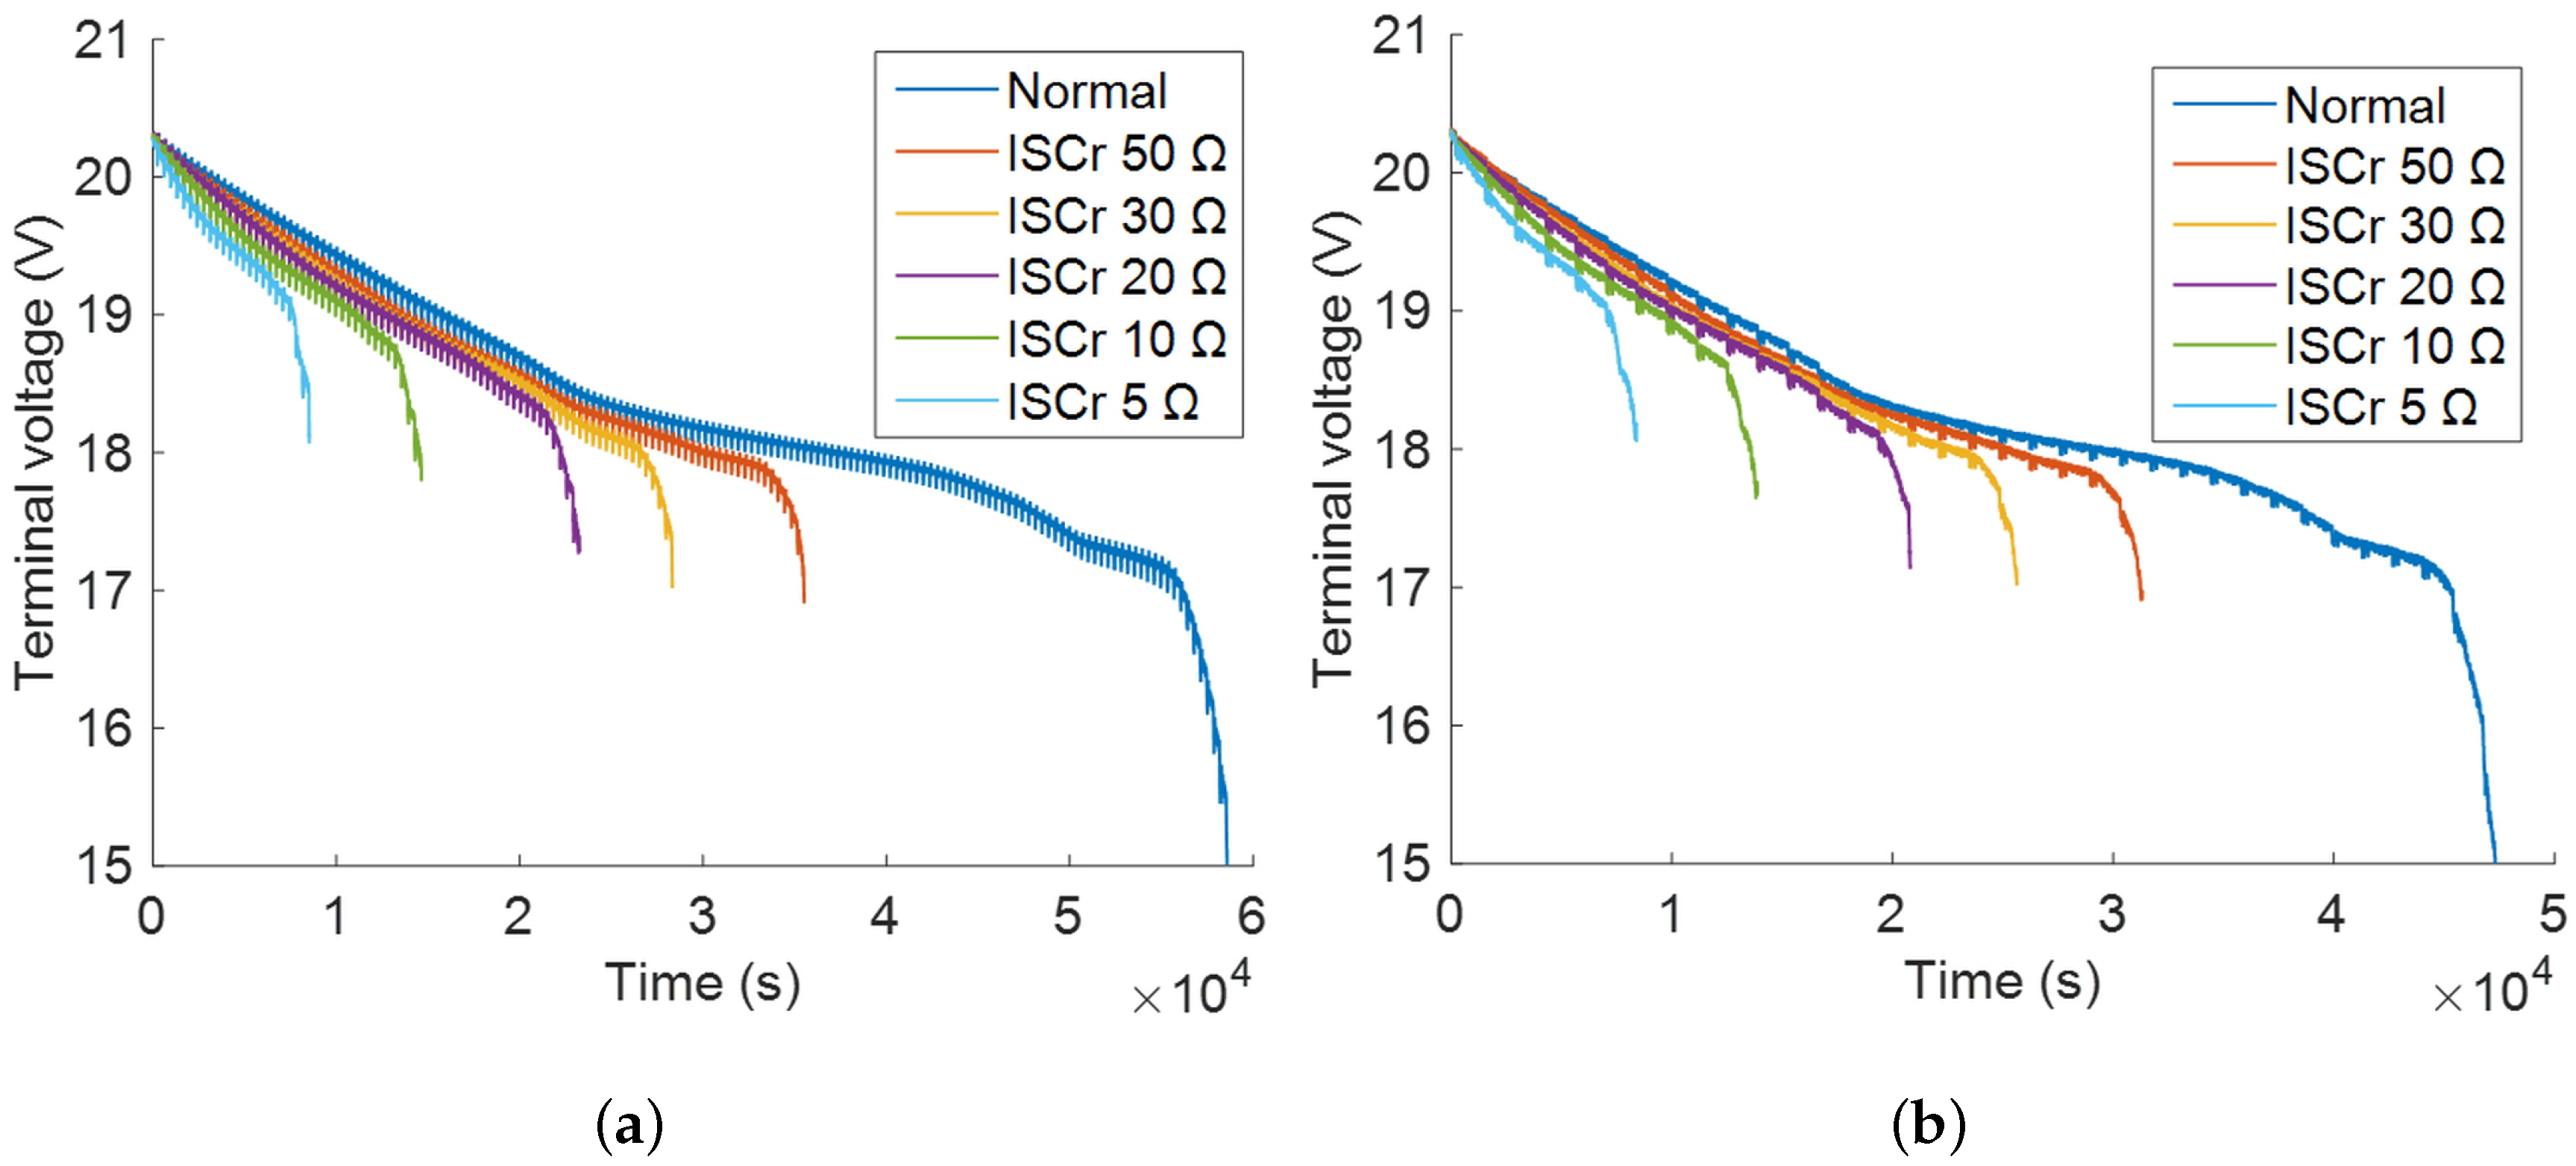
Figure 6.
Estimated SOCs with different s in experiment with DST current profile: (a) battery pack and (b) faulted battery cell.
Figure 6.
Estimated SOCs with different s in experiment with DST current profile: (a) battery pack and (b) faulted battery cell.

Figure 7.
Estimated s from different stable points in experiment with true 49.91 and DST current profile.
Figure 7.
Estimated s from different stable points in experiment with true 49.91 and DST current profile.
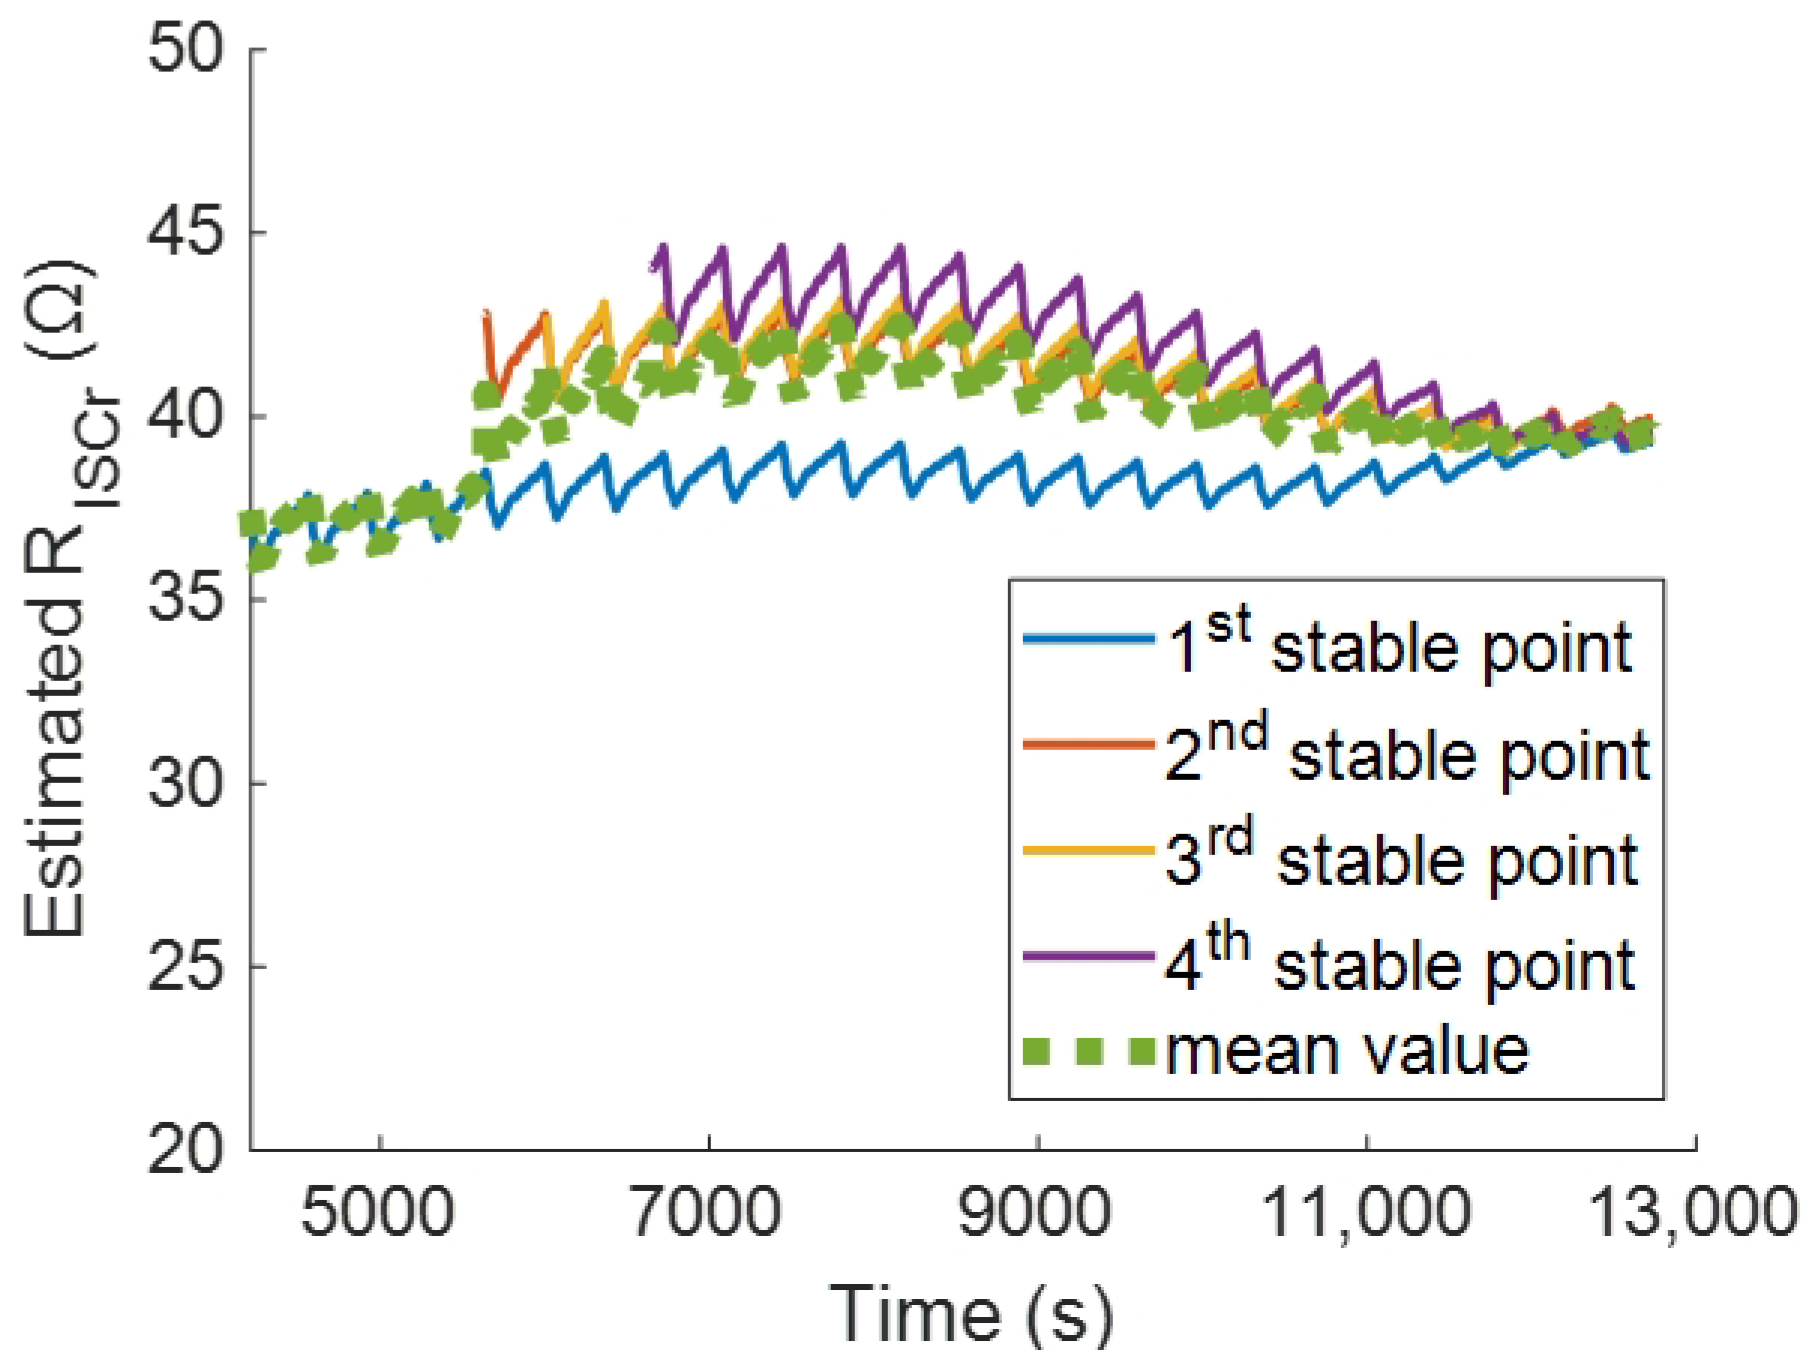
Figure 8.
Estimated s from the various ISCr fault cases in simulations: (a) DST current profile and (b) UDDS current profile and in experiments: (c) DST current profile and (d) UDDS current profile.
Figure 8.
Estimated s from the various ISCr fault cases in simulations: (a) DST current profile and (b) UDDS current profile and in experiments: (c) DST current profile and (d) UDDS current profile.

Figure 9.
Reliable maximum in simulation and experiment with normal battery pack and DST current profile: (a) simulation and (b) experiment.
Figure 9.
Reliable maximum in simulation and experiment with normal battery pack and DST current profile: (a) simulation and (b) experiment.

| Description | Equation | Step |
|---|---|---|
| State space model | ||
| State transition matrix | ||
| Observation matrix | ||
| Initial assumed values | For | |
| Error covariance matrix Kalman gain | For | |
Table 2.
Tested battery.
| Specification Parameters | Values |
|---|---|
| Model | INR 18650-20R |
| Type | LiNiCoMnO2 |
| Dimension | ⌀18.33 × 64.85 mm |
| Mass | 45.0 g |
| Operating temperature | ∼+75 °C |
| Nominal voltage | 3.6 V |
| Charge cut-off voltage | 4.2 V |
| Discharge cut-off voltage | 2.5 V |
| Nominal capacity | 2.0 Ah |
Table 3.
Final relative errors (%) of in simulation depending on the ISCr faults.
| Discharge Condition | True ISCr Resistance | ||||
|---|---|---|---|---|---|
| 5 Ω | 10 Ω | 20 Ω | 30 Ω | 50 Ω | |
| DST | 26.2 | 9.9 | 7.9 | 4.1 | 2.1 |
| UDDS | 25.4 | 9.0 | 4.4 | 2.9 | 1.7 |
Table 4.
Final relative errors (%) of in experiment depending on the ISCr faults.
| Discharge Condition | True ISCr Resistance | ||||
|---|---|---|---|---|---|
| 5.0 Ω | 10.02 Ω | 20.0 Ω | 29.98 Ω | 49.91 Ω | |
| DST | 3.3 | 11.8 | 15.1 | 15.8 | 20.7 |
| UDDS | 2.2 | 15.4 | 20.1 | 20.7 | 31.2 |
© 2018 by the authors. Licensee MDPI, Basel, Switzerland. This article is an open access article distributed under the terms and conditions of the Creative Commons Attribution (CC BY) license (http://creativecommons.org/licenses/by/4.0/).
Share and Cite
MDPI and ACS Style
Seo, M.; Goh, T.; Park, M.; Kim, S.W. Detection Method for Soft Internal Short Circuit in Lithium-Ion Battery Pack by Extracting Open Circuit Voltage of Faulted Cell. Energies 2018, 11, 1669. https://doi.org/10.3390/en11071669
AMA Style
Seo M, Goh T, Park M, Kim SW. Detection Method for Soft Internal Short Circuit in Lithium-Ion Battery Pack by Extracting Open Circuit Voltage of Faulted Cell. Energies. 2018; 11(7):1669. https://doi.org/10.3390/en11071669
Chicago/Turabian StyleSeo, Minhwan, Taedong Goh, Minjun Park, and Sang Woo Kim. 2018. "Detection Method for Soft Internal Short Circuit in Lithium-Ion Battery Pack by Extracting Open Circuit Voltage of Faulted Cell" Energies 11, no. 7: 1669. https://doi.org/10.3390/en11071669
Note that from the first issue of 2016, this journal uses article numbers instead of page numbers. See further details here.