Impact of Ambient Temperature on Shunt Capacitor Placement in a Distorted Radial Distribution System


Department of Electrical Engineering, Faculty of Engineering, King Saud University, Riyadh 11461, Saudi Arabia
*
Author to whom correspondence should be addressed.
Energies 2018, 11(6), 1585; https://doi.org/10.3390/en11061585
Submission received: 26 May 2018
/
Revised: 14 June 2018
/
Accepted: 14 June 2018
/
Published: 16 June 2018
Abstract
:In electrical distribution systems, shunt capacitors are installed in order to reduce system losses, to enhance the voltage profile, and to free up system capacity. Nevertheless, the installation of shunt capacitors in distribution systems with distorted waveforms will magnify the distortion level of harmonics if they are not set at appropriate locations relative to the harmonics. This paper proposes a hybrid method to determine the placement and sizing of shunt capacitors in distorted radial distribution systems, taking into account the presence of harmonic distortion with consideration of ambient temperature effects, (this technique consists of the fuzzy expert system approach and the Genetic Algorithm method). This hybrid technique is applied to an IEEE 34-bus radial standard distribution system as well as a real distribution system in the Saudi Electricity Company. The simulation results show that harmonic distortion considerably reduces and the efficiency of distribution systems increases with a reduction in power loss and enhancement of voltage regulation.
1. Introduction
The final stage of delivery of electricity from a transmission system to consumers is a distribution system, in which most of the system losses occur due to the flow of heavy currents in distribution lines. Almost 13% of the total generated power is lost in form of losses at the distribution system level [1,2]. The reduction of distribution power and energy losses can be achieved, the voltage profile can be improved within permissible limits, and the total harmonic distortion can be minimized through the installation of capacitor banks. The benefit of installing these capacitors depends on their location and size.
Many hybrid approaches have been presented to solve the placement problem for shunt capacitors. The authors in references [3,4,5,6,7] proposed a hybrid of the Genetic Algorithm (GA) method and the fuzzy logic approach to solve the capacitor placement problem to achieve many benefits, such as reduction of line loss, the improvement of voltage regulation, correction of the power factor, and the maximization of cost savings. The optimal locations for the placement of capacitors are identified using fuzzy set theory and their optimum size is obtained using the Genetic Algorithm. The proposed approach has been applied to different distribution networks. A. Saric et al. [8] used a fuzzy-genetic algorithm technique as an optimization tool for real-time volt-var optimization of a Serbian distribution system. The rules for the fuzzy logic algorithm for power loss and voltage deviation were defined and then combined into the GA environment to increase its speed.
D. Das [9] presented a hybrid amalgamation of fuzzy multi-objective and GA-based approach to optimize the optimal shunt capacitor placement problem. A sensitivity index factor is utilized to detect the critical buses to determine where to place the shunt capacitors. The multi-objective function is maximized using the GA to determine the optimal sizes of the fixed and switched capacitors. The hybrid method was tested on 51-bus and IEEE 69-bus Radial Distribution Systems (RDSs). R. Ranjan and B. Venkatesh [10] suggested an Evolutionary Programming (EP) technique that solves the placement and sizing problems of shunt capacitors together using an on-load tap changer and reactive power sources. The framework of the EP technique involves the use of a fuzzy model for the fitness function in to allow optimization. The suggested fuzzy-EP technique was tested on an IEEE 69-bus test system. S. Saranya et al. [11] presented a fuzzy and differential evolution method. A group of principles given by the fuzzy system is used to optimize the capacitors’ locations and sizes; this is modeled by the objective function to attain the maximum cost savings via the EP technique. The suggested technique is applied to an IEEE 15-bus system.
The authors in references [12,13,14] proposed a fuzzy and PSO technique to solve the capacitor location problem to achieve many benefits, such as voltage profile improvement, power loss reduction, and decreased costs. The proposed technique is tested on an IEEE 69-bus test system. S. Kannan et al. [15] proposed a fuzzy and Hybrid Particle Swarm Optimization (HPSO) technique. The location of the capacitors is specified by a group of rules defined by the Fuzzy Expert System (FES) and its size is obtained using HPSO. The proposed technique was tested on an IEEE 34-bus standard system. M. Prasanna et al. [16] introduced a second edition of the PSO method for capacitor sizing in distribution networks to reduce line losses and improve the voltage profile. The location of the critical buses where the capacitors should be placed is determined by a group of FES rules, and the sizing of these capacitors is represented by the fitness function to get the maximum cost savings.
Many remarkable studies also have been carried out using hybrid systems or algorithms for power management in balance/imbalance distribution systems using either compensation devices, such as a capacitor, or using a distributed generation (DG) during steady state or transient stability conditions. M. Ayoubi et al. [17] proposed a new approach along with a proposed resonance index for capacitor placement that considers harmonics. A sensitivity analysis method is applied to specify the critical buses. Then, the locations and sizes of these capacitors are obtained by a suggested objective function. The proposed approach has been tested on 18-bus and 69-bus IEEE systems. S. Biswas et al. [18] presented an approach for solving the DG placement problem through considering many operation characteristics of a power system. Many benefits, such as a reduction in system losses, an improvement in the voltage profile, minimization of the voltage sag, and harmonic distortion were achieved. Comprehensive results were presented following application on a standard IEEE 33-bus test system using the GA to disclose the proficiency of the proposed approach. T. Ou and C. Hong [19] examined control strategies and the dynamic operation of a hybrid system.
M. Othman et al. [20] redefined the big bang big crunch algorithm to find proper node locations and the actual power range of the DGs for multiple DG placement to minimize power and energy losses in balanced/unbalanced distribution systems. The proposed algorithm was tested on 33-bus and 37-bus test systems. W. Sheng et al. [21] proposed an improvement of the second edition of the non-dominated sorting of GA for optimal multiple DG placement with minimum system losses, voltage regulation, and a maximum stability margin being the objectives. M. Tolba et al. [22] introduced new techniques like HPSO along with a gravitational search algorithm and moth-flame optimization that obtain the optimal location with renewable DG units to reduce system losses and operating costs while improving the voltage stability and profile. The proposed methods have been tested on 33-bus and 69-bus systems.
W. Lin and T. Ou [23] proposed a fault analysis method with hybrid compensation for unbalanced distribution systems to analyze faults using the topological characteristics of these systems along with the proposed hybrid compensation method. T. Ou et al. [24] used a novel intelligent damping controller to improve the transient stability to reduce power fluctuations, and enhance the voltage and damping in a hybrid power multi-system. T. Ou [25,26] also proposed a novel unsymmetrical faults analysis method with hybrid compensation and a direct building algorithm for ground fault analysis in micro-grid distribution systems.
In this paper, a hybrid technique is utilized to identify the placement of shunt capacitors and to compute their sizes in distorted radial distribution systems, considering ambient temperature effects. This technique consists of a FES approach and the GA method. The FES is used to identify the suitable placement of shunt capacitors, while the Genetic Algorithm is utilized to find their sizes. This paper is set out as follows: Section 2 illustrates the problem formulation. The optimal locations of the shunt capacitor are determined using the FES which is shown in Section 3. The GA is utilized to obtain the optimal sizes which is illustrated in Section 4. The results and discussion for two case studies are presented in Section 5. The conclusions are given in Section 6.
2. Problem Formulation
The proposed objective function for optimal capacitor placement is to maximize the cost savings using the following equation [27]:
where, S is the cost savings in dollars per year; is a factor to alter the active power loss to dollars per year; is a factor to alter the energy loss to dollars per year; is a factor to alter the reactive power to dollars per yearl is the difference between the peak power loss before and after capacitor installationl is the difference between the energy loss before and after capacitor installation; and is the injected reactive power in kVAR.
2.1. Load Flow
Load flow studies are the heart of power system analysis. They provide a solution for a power system network during steady state under normal operating conditions which assists in continuous surveillance of the current state of the system. They are utilized in planning, optimization, and stability studies as well. Hence, an efficient and fast load flow method is required.
2.1.1. Fundamental Power Flow
A backward-forward sweep algorithm was used as a load flow tool to compute the fundamental power loss [28]. The total fundamental power loss is defined by
where, is the total fundamental active power loss; are the effective active and reactive power loads at bus q is the voltage at bus q; is the number of system buses; is the number of system branches; and is the resistance at branch k, as shown Figure 1.
2.1.2. Harmonic Power Flow
The harmonic power flow method presented by Y. Baghzouz [29] is used to calculate the harmonic power loss as follows:
- Compute the magnitudes of the bus voltages and their phase angles at the fundamental frequency via the backward-forward sweep method.
- Compute the fundamental currents, harmonic currents, harmonic load admittances, admittances of the installed shunt capacitors, and the feeder admittances using Equations (3) to (7), respectively.
- Calculate the harmonic voltages caused by the nonlinear loads from Equation (8).
- Compute the RMS voltages and the Total Harmonic Distortion (THD) at each bus using Equations (11) and (12), respectively.
The harmonic currents produce harmonic voltages at the buses of the distribution system which lead to an increase in the bus RMS voltages. This incrementally effects the placement of the shunt capacitors.
2.2. Constraints
Equation (1), which is used as the objective function for solving the capacitor placement problem in distribution systems, is subjected to the following constraints:
- The bus voltages must be within their allowable minimum and maximum range limits:where, and
- The power flow () in each distribution line must be less than the maximum limit of power flow in this line ():
- The overall power factor () of the distribution system must be greater than or equal to the lower limit of power factor () of this system as:
- The total injected reactive power () into the distribution system must be less than or equal the total load reactive power () of this system:The standard capacitor size of 150 kVAR is used.
- The waveform distortion of the bus voltages is measured through the maximum total harmonic distortion of the bus voltages as
Bounds for (12) used are as stated by the IEEE-519 standard [30].
2.3. Ambient Temperature Modelling
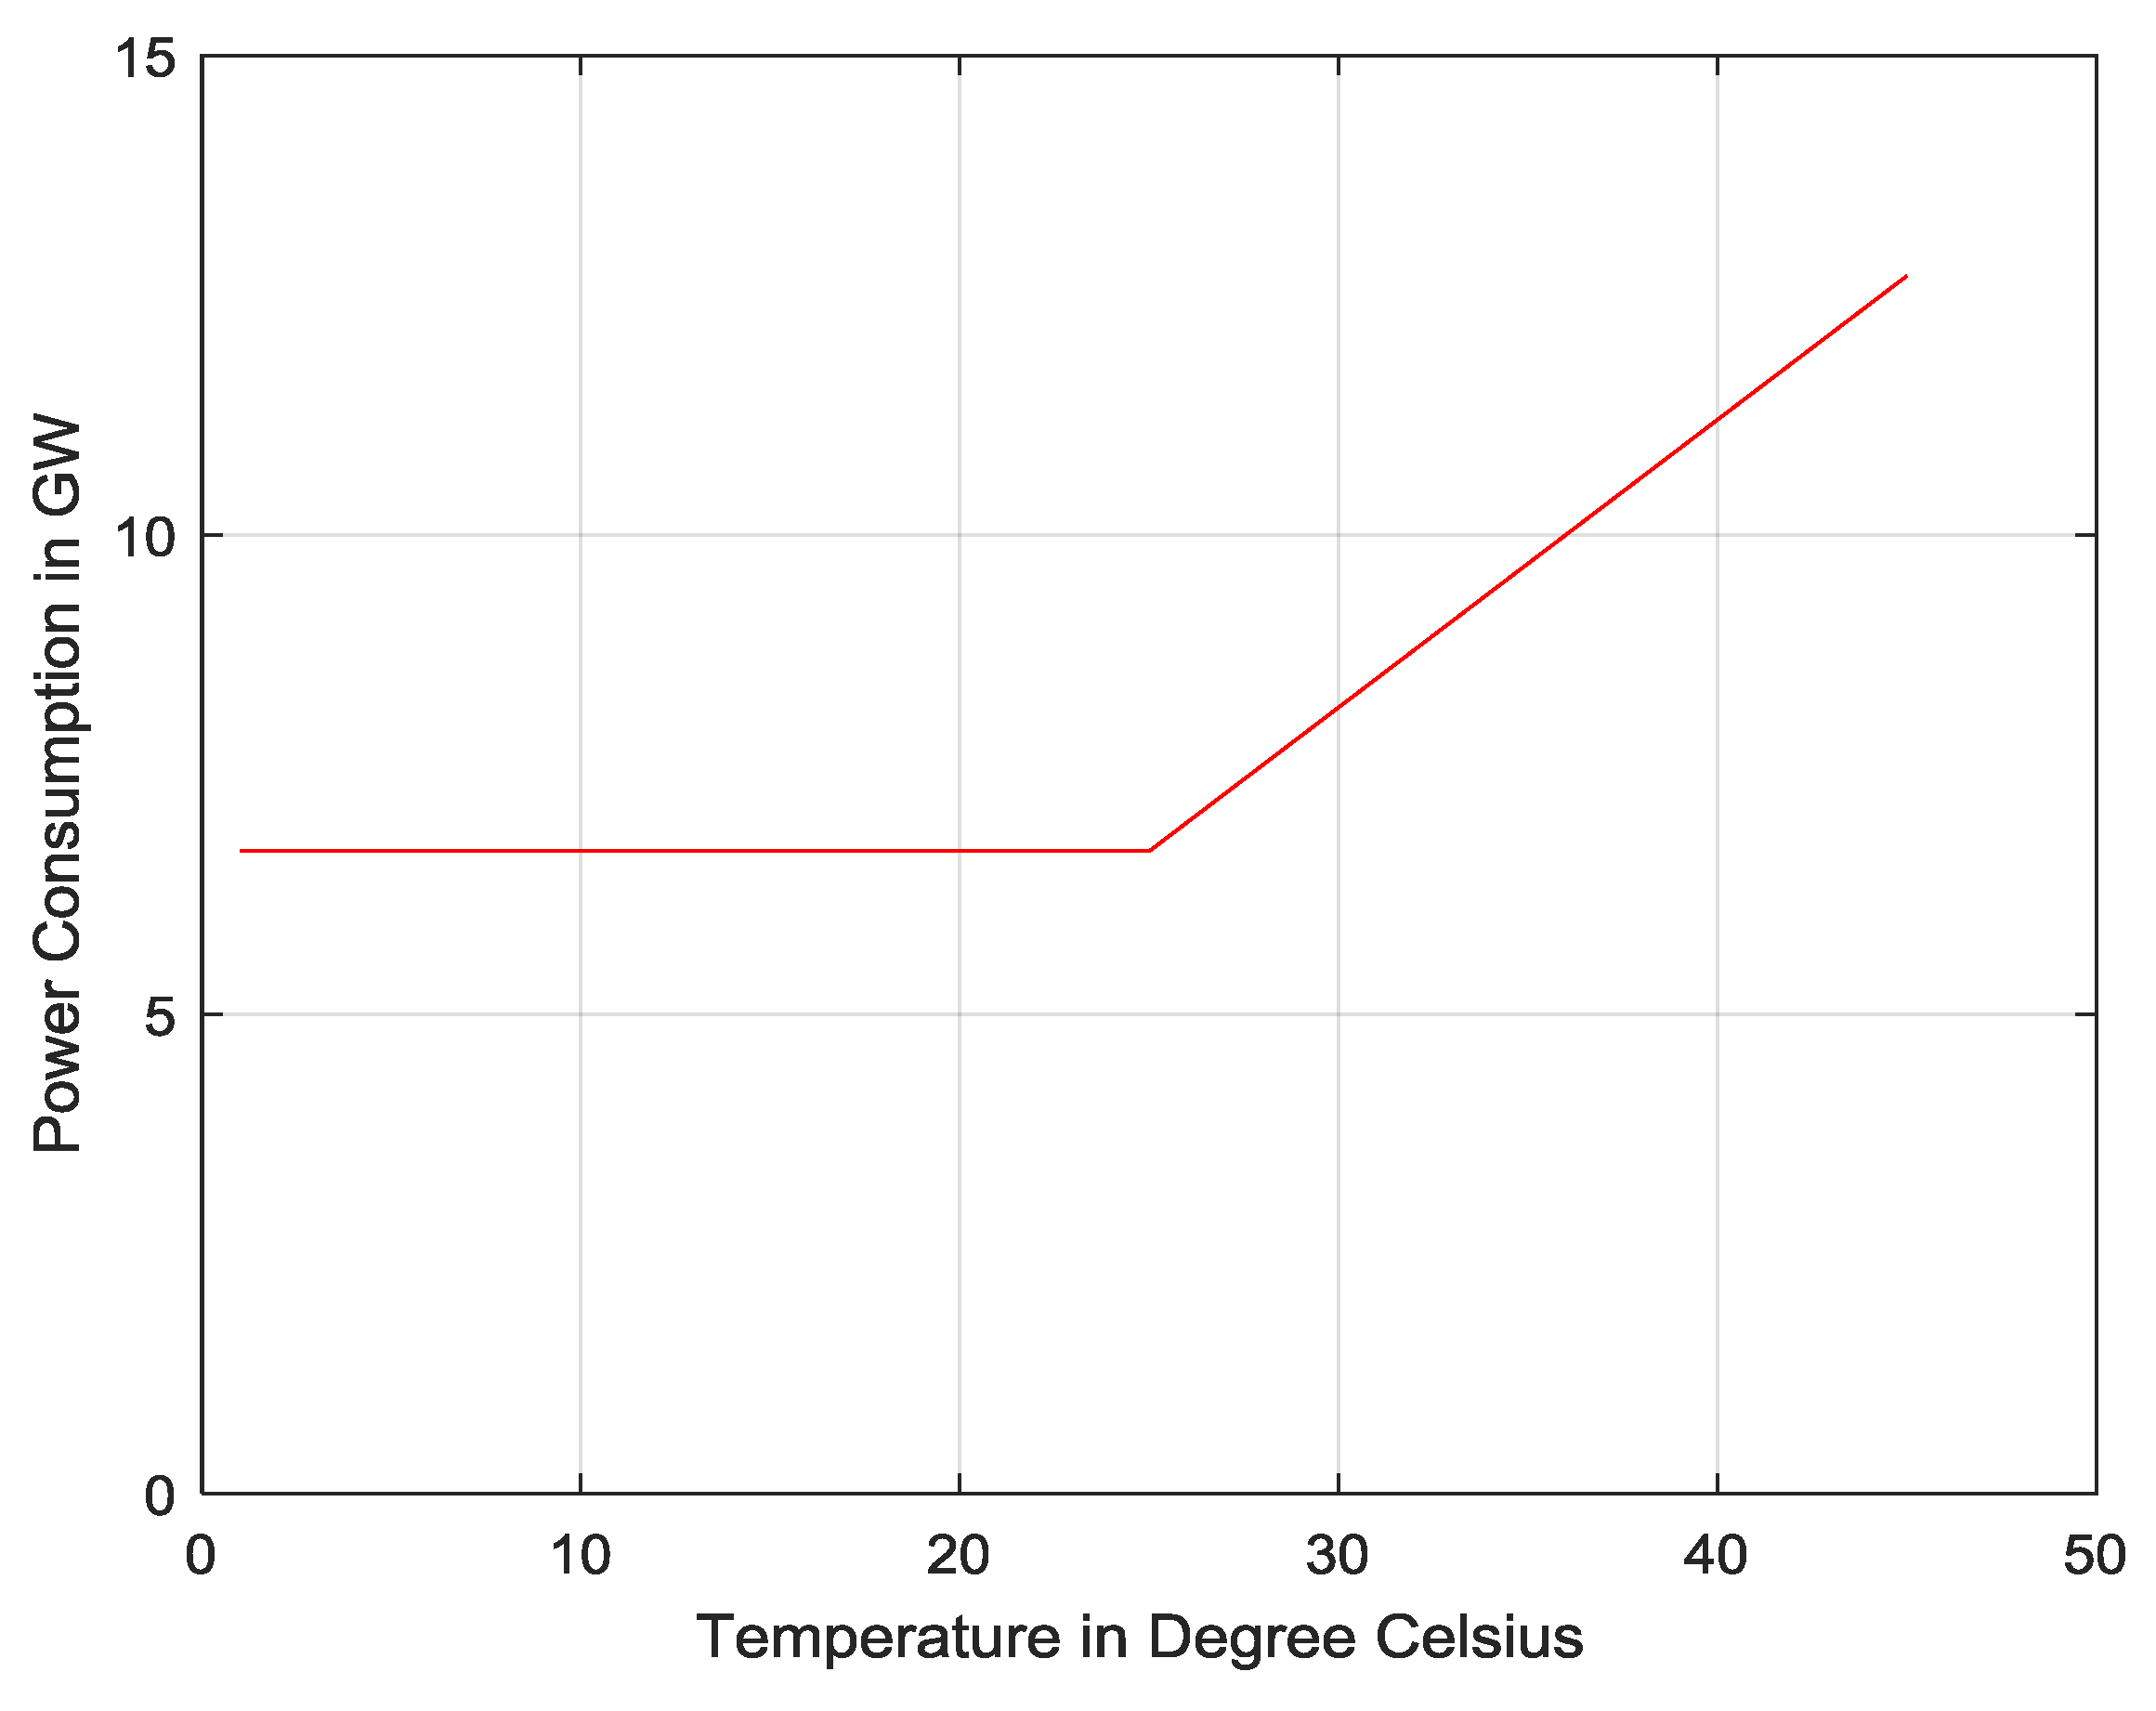
The IEEE 34-bus standard system used in this study is used as a practical distribution system in Riyadh city as well as a real part of Saudi Electricity Company (SEC) distribution system. The power consumption of Riyadh’s region was found to be 6.7 GW in 2016 [31]. This power has increased by 300 MW/°C based on the following equation which was developed from Figure 3:
- The IEEE 34-bus RDS has MW. The slope of increasing power consumption per one degree Celsius can be found by . The relationship between the power consumed by this system and the temperature is
- The SEC’s RDS has MW. The slope of increasing power consumption per one degree Celsius can be found by . The relationship between the power consumed by this system and the temperature is:where, is the power demand for each system; y is the power consumed in MW; and x is the temperature in degrees Celsius (25–45).
The ambient temperature increases the power consumption of the distribution system which leads to poor voltage regulation and more losses in distribution lines. The bus voltage significantly decreases due to the ambient temperature; this is important when solving the capacitor placement problem.
3. Fuzzy Expert System for Capacitor Placement
The fuzzy expert system provides a computational demonstration of empirical knowledge about a particular problem. L. Zadeh suggested the fuzzy logic method in 1965. The fuzzy logic method has been applied in numerous areas of knowledge, typically to solving optimization and control problems [32].
3.1. Methodology
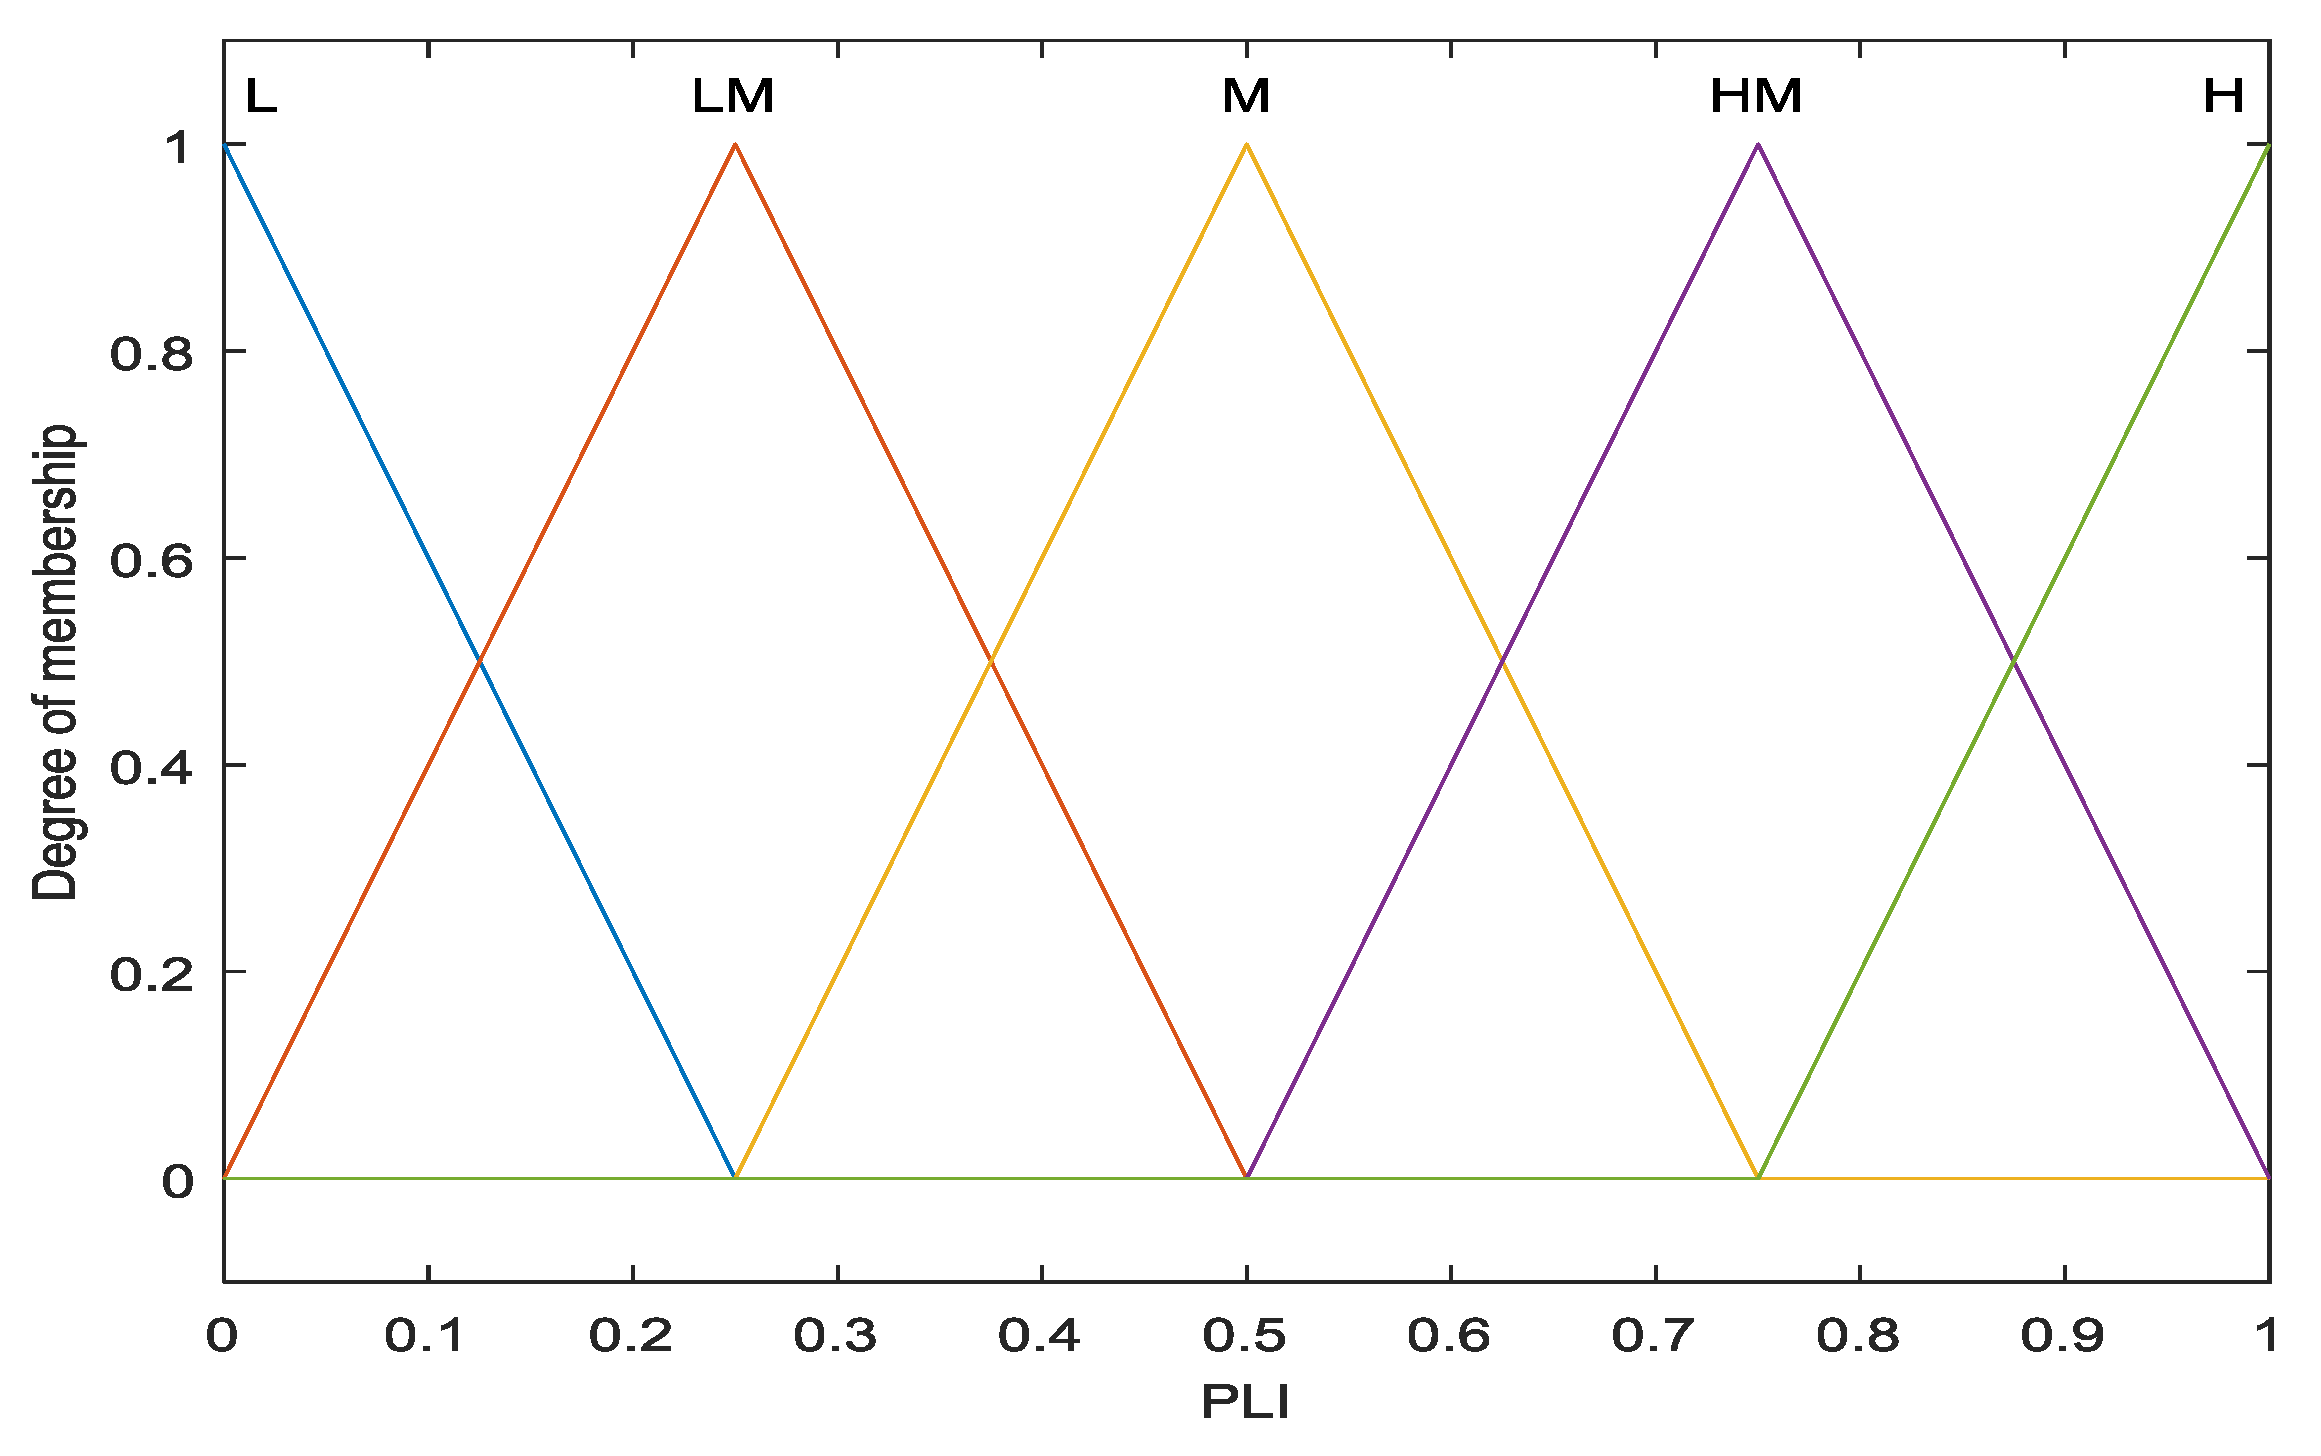
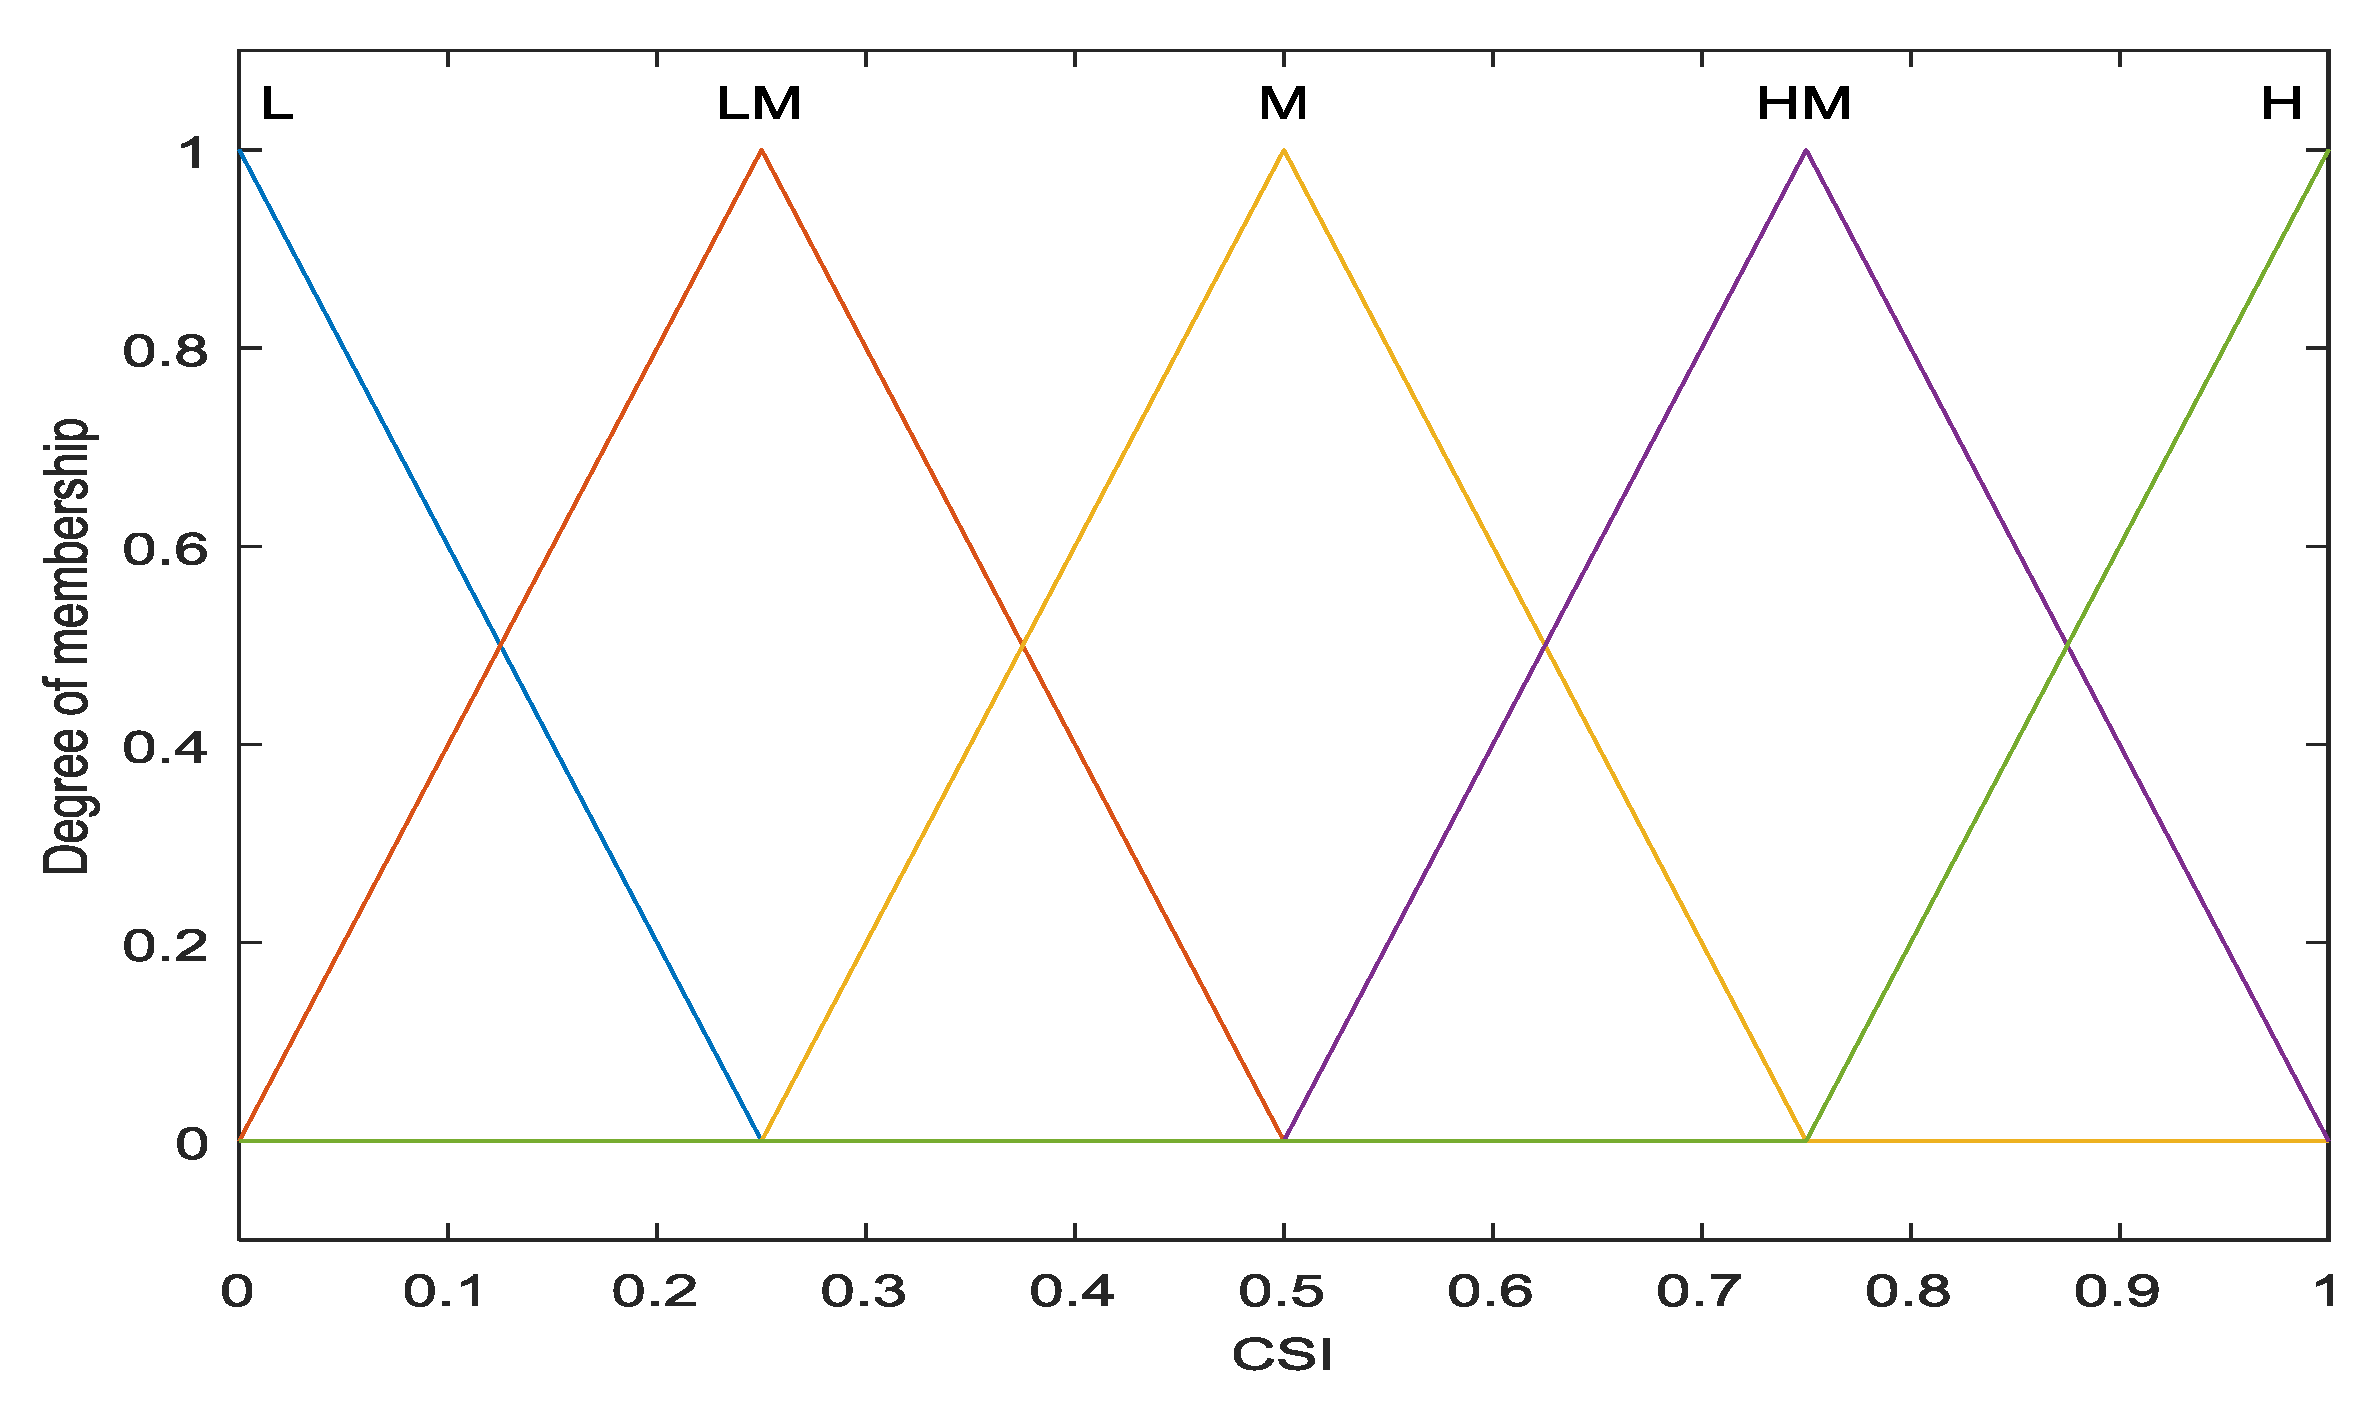
The indices of power loss and bus voltages are the inputs to the FES, while the Capacitor Sensitivity Index (CSI) is its output. Both the Power Loss Index (PLI) and the CSI range from 0 to 1 p.u with five triangular membership functions for each. Meanwhile, the range of bus voltages fluctuates from 0.9 to 1.1 p.u with three trapezoidal and two triangular membership functions, as shown in Figure 4, Figure 5 and Figure 6.
To determine the PLI values, the reduction of the power loss through self-compensation of the reactive power load at each bus is computed using the load flow tool. These reductions of power loss are normalized into a range of (0, 1), where 0 and 1 are the lowest and highest values, respectively. To compute the values of PLI, the following equation is used:
where, LR is the power loss reduction; LMIN is the minimum power loss reduction; LMAX is the maximum power loss reduction; N is a bus number; and LMINN is the minimum power loss reduction at bus N.
To solve the shunt capacitor placement problem, the FES rules identify the optimal locations of the capacitor. These rules are declared as IF premise (antecedent) and THEN conclusion (consequent) statements. In this paper, the input antecedents are the per unit (p.u) bus voltages and the normalized PLI values, and the outputs are the CSI values. The rules are summarized in a matrix form, called a decision matrix, which is given in Table 1. In this work, 25 rules were built. For instance, If PLI is Low–Medium (LM) and Voltage (V) is Low–Medium (LM), then the CSI will be Low–Medium (LM) and so on.
3.2. Fuzzy Expert System Steps
The steps of the FES explain the procedure for identifying the buses that are the most suitable for capacitor placement, as shown in Figure 7.
4. Genetic Algorithm for Capacitor Sizing
The Genetic Algorithm is an Artificial Intelligence (AI) technique based on the evolutionary principle that inspired by natural reproduction [33]. This algorithm is applied on RDS to compute the optimum shunt capacitors’ sizes that aneed to be sited at optimal locations which are identified by FES on a distribution system, so the objective or the fitness function is maximized within a set of constraints.
4.1. Genetic Algorithm Search Space
A search space of a GA contains a population of individuals; each population gives a potential solution to a specified optimization problem. Each individual of this population is coded as a finite vector of length variables. These individuals resemble chromosomes, while the variables are like the chromosomes’ genes. Therefore, the potential solution involves several variables. A fitness value is given for each solution which represents the capability of each individual to survive.
The individual with the optimal fitness score is determined. The GA seeks to utilize eclectic breeding of the solutions to make new offspring or a generation better than the parent generation through merging the information from the parents’ chromosomes. A population of n solutions or individuals associated with their fitness scores is preserved within the search space of GA. Parents are chosen to mate, making an offspring via a propagative plan. Therefore, very fit solutions or individuals have more chances to propagate so that the offspring receive characteristics from each parent.
The individuals or solutions in the population die out and are superseded by new solutions, finally producing new offspring. In this manner, it is anticipated that through successive generations, better solutions will flourish, while the least fit solutions will die out. In the end, after the population of individuals converges and offspring that do not propagate distinctly differ from those in previous generations, the GA itself is said to have approached the objective function’s optimal solution.
4.2. Genetic Algorithm Operators
Once an initial population of the individuals has been randomly produced, the genetic algorithm goes through its three operators:
- Selection normalizes the survival of the fittest.
- Crossover refers to propagation between individuals.
- Mutation makes random alterations.
4.3. Genetic Algorithm Steps
- (1)
- Create a population at candidate buses with random capacitors sizes and set this as Gen= 1.
- (2)
- Use the backward-forward sweep algorithm as a load flow tool to determine the values of the bus voltages and power losses.
- (3)
- Calculate the fitness values of the objective functions.
- (4)
- Choose the parent strings using a roulette wheel selection mechanism.
- (5)
- Execute the crossover and mutation operations on the selected strings to get new strings for the generation of the next offspring.
- (6)
- Repeat steps 2 to 5 until the difference between the best fitness value of the objective function and the average fitness of all possible solutions is less than a specified error.
- (7)
- Print the best fitness of the objective function.
5. Results and Discussion
The proposed technique was tested on two radial distribution systems, consisting of the IEEE 34-bus system and the 7151C-bus system as a part of the SEC distribution system. The locations for placement of the capacitors were identified by FES and their sizes were evaluated using GA. The injection of harmonic currents included harmonics in the order of 3, 5, 7, 11, 13, 17, 19, 23, 25, 29, 31, 35, 37, 41, 43, 47, and 49 at a nominal frequency 60 Hz, where of each load was a nonlinear load. A peak load duration (T) of 2190 hours was used.
5.1. Simulation of the IEEE 34-Bus Radial Distribution Systems
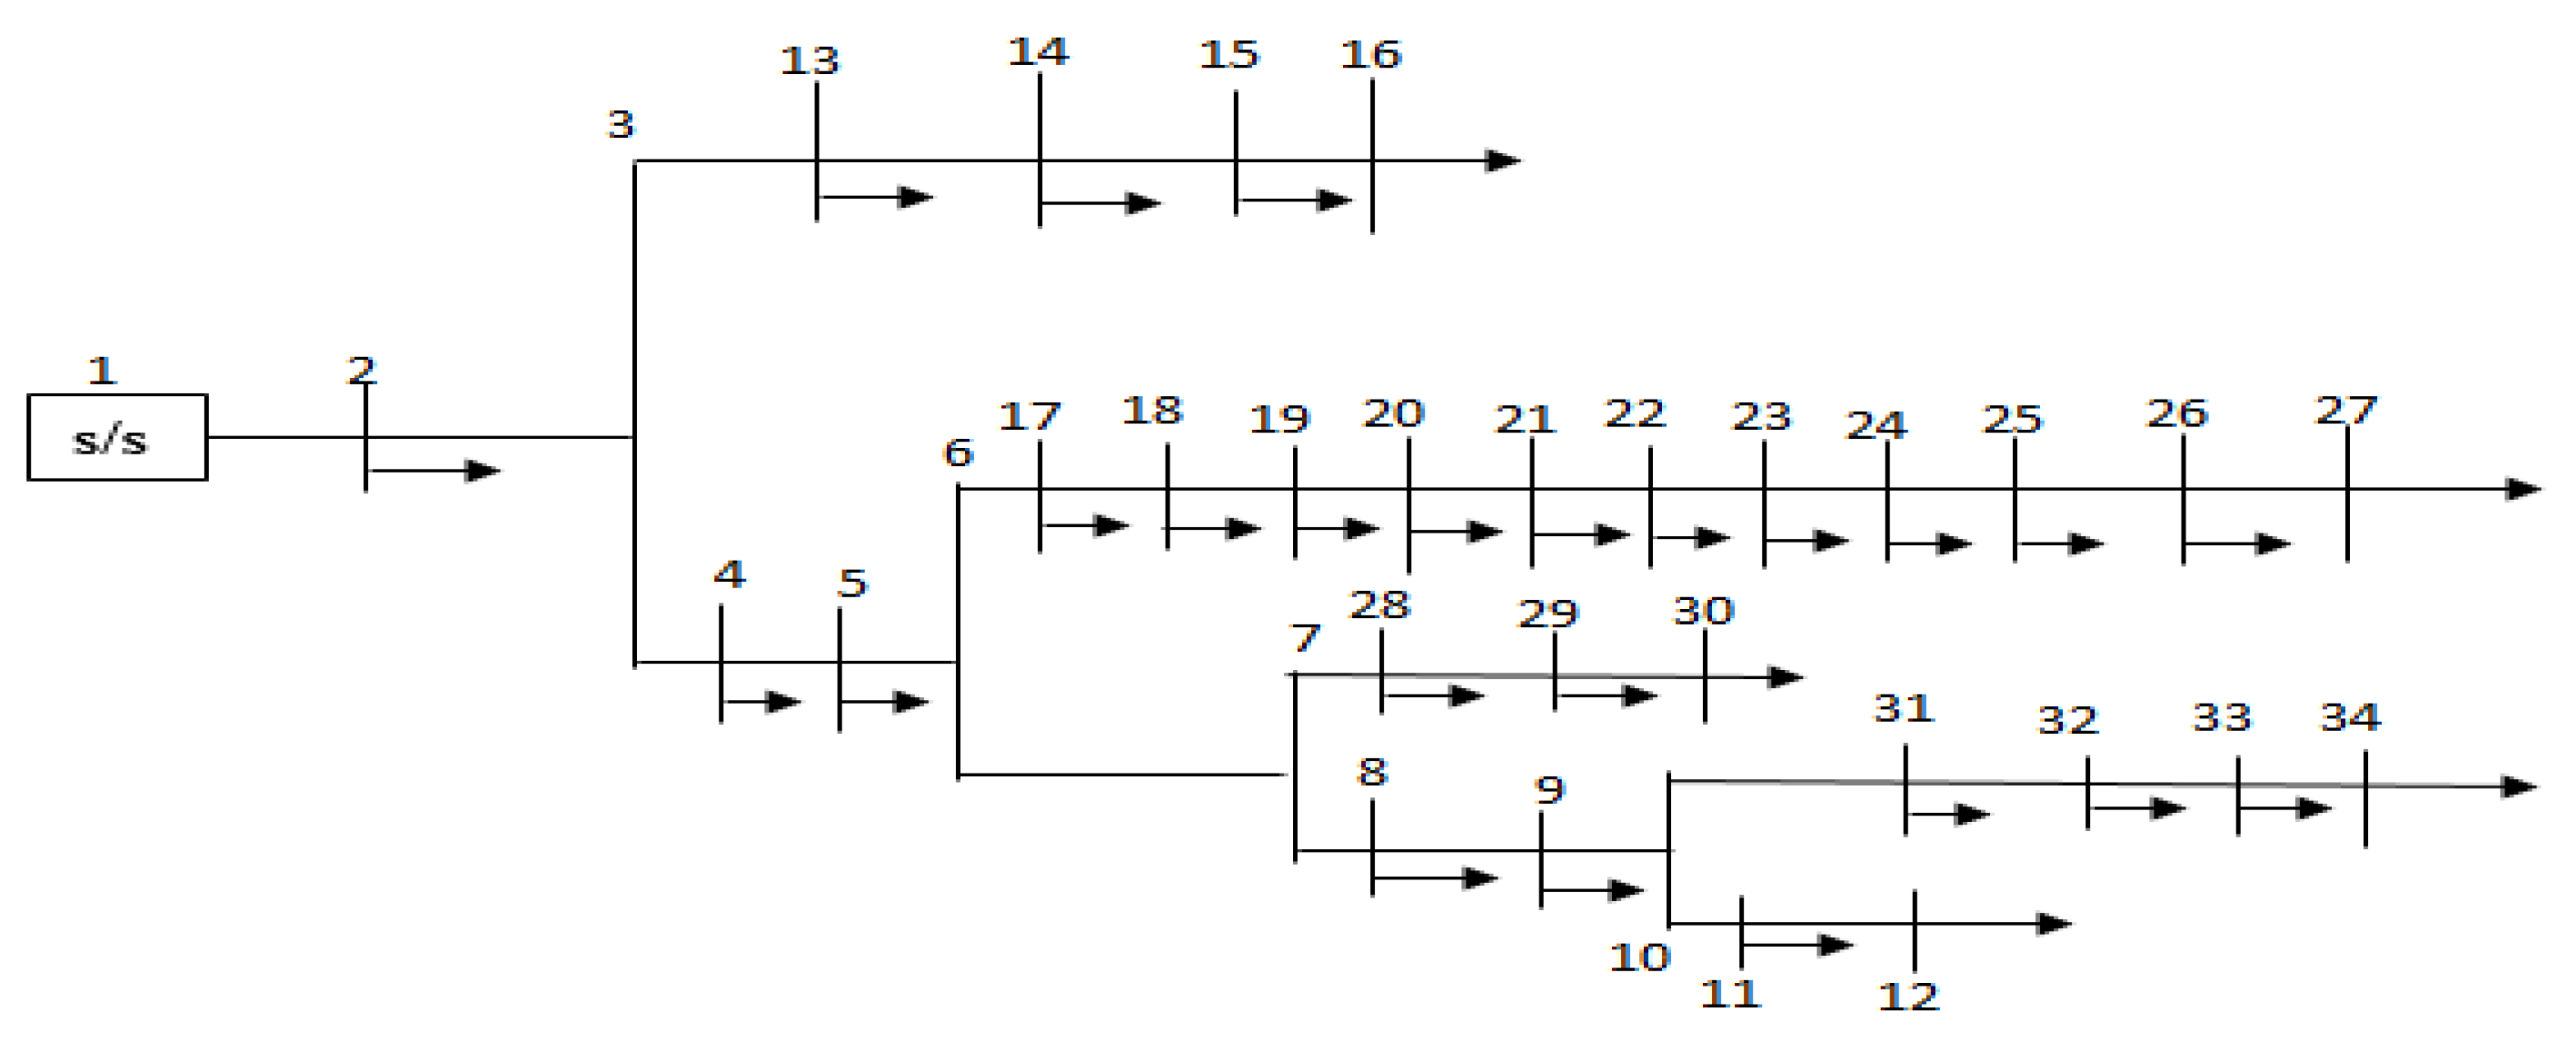
The IEEE 34-bus radial distribution feeder consisted of a slack bus (bus 1), 33 PQ buses, and 33 branches, as shown in Figure 8. Its substation transformer was rated at 5.68 MVA and 11 kV [34].
The ambient temperature effects on this system were studied using Equation (14). Before Capacitor Placement (BCP), the initial average power loss for this system was 515.14 kW. The maximum and minimum average voltages values were 1.02 and 0.9219 p.u, respectively. The total annual average power and energy loss reduction costs were $61,817 and $56,408. After the FES approach was applied to this system, it was observed that the shunt capacitor needed to be installed at five optimal locations, i.e., buses 26, 24, 23, 25 and 22, where the capacitor sensitivity index values were highest, as shown in Figure 9. The capacitor bank size was determined using the Genetic Algorithm. The total average capacitor size installed into this system was 2.10 MVAR which gave a percentage loss reduction of 36.15%. As shown in Figure 10, the voltage constraint was attained when the maximum and minimum values were 1.03 and 0.9554 p.u, respectively. The total annual average power and energy losses costs were $23,334 and $21,292, with an average cost saving of $42,080 where the benefit–cost ratio was 16.5, as illustrated in Table 2. Before capacitor placement, the 34-bus system was severely distorted by the nonlinear loads. The obtained results of THDs at all buses were over 8%. After capacitor placement, the THD was kept within the permissible limits (5%).
5.2. Simulation of the 7151C-Bus RDS
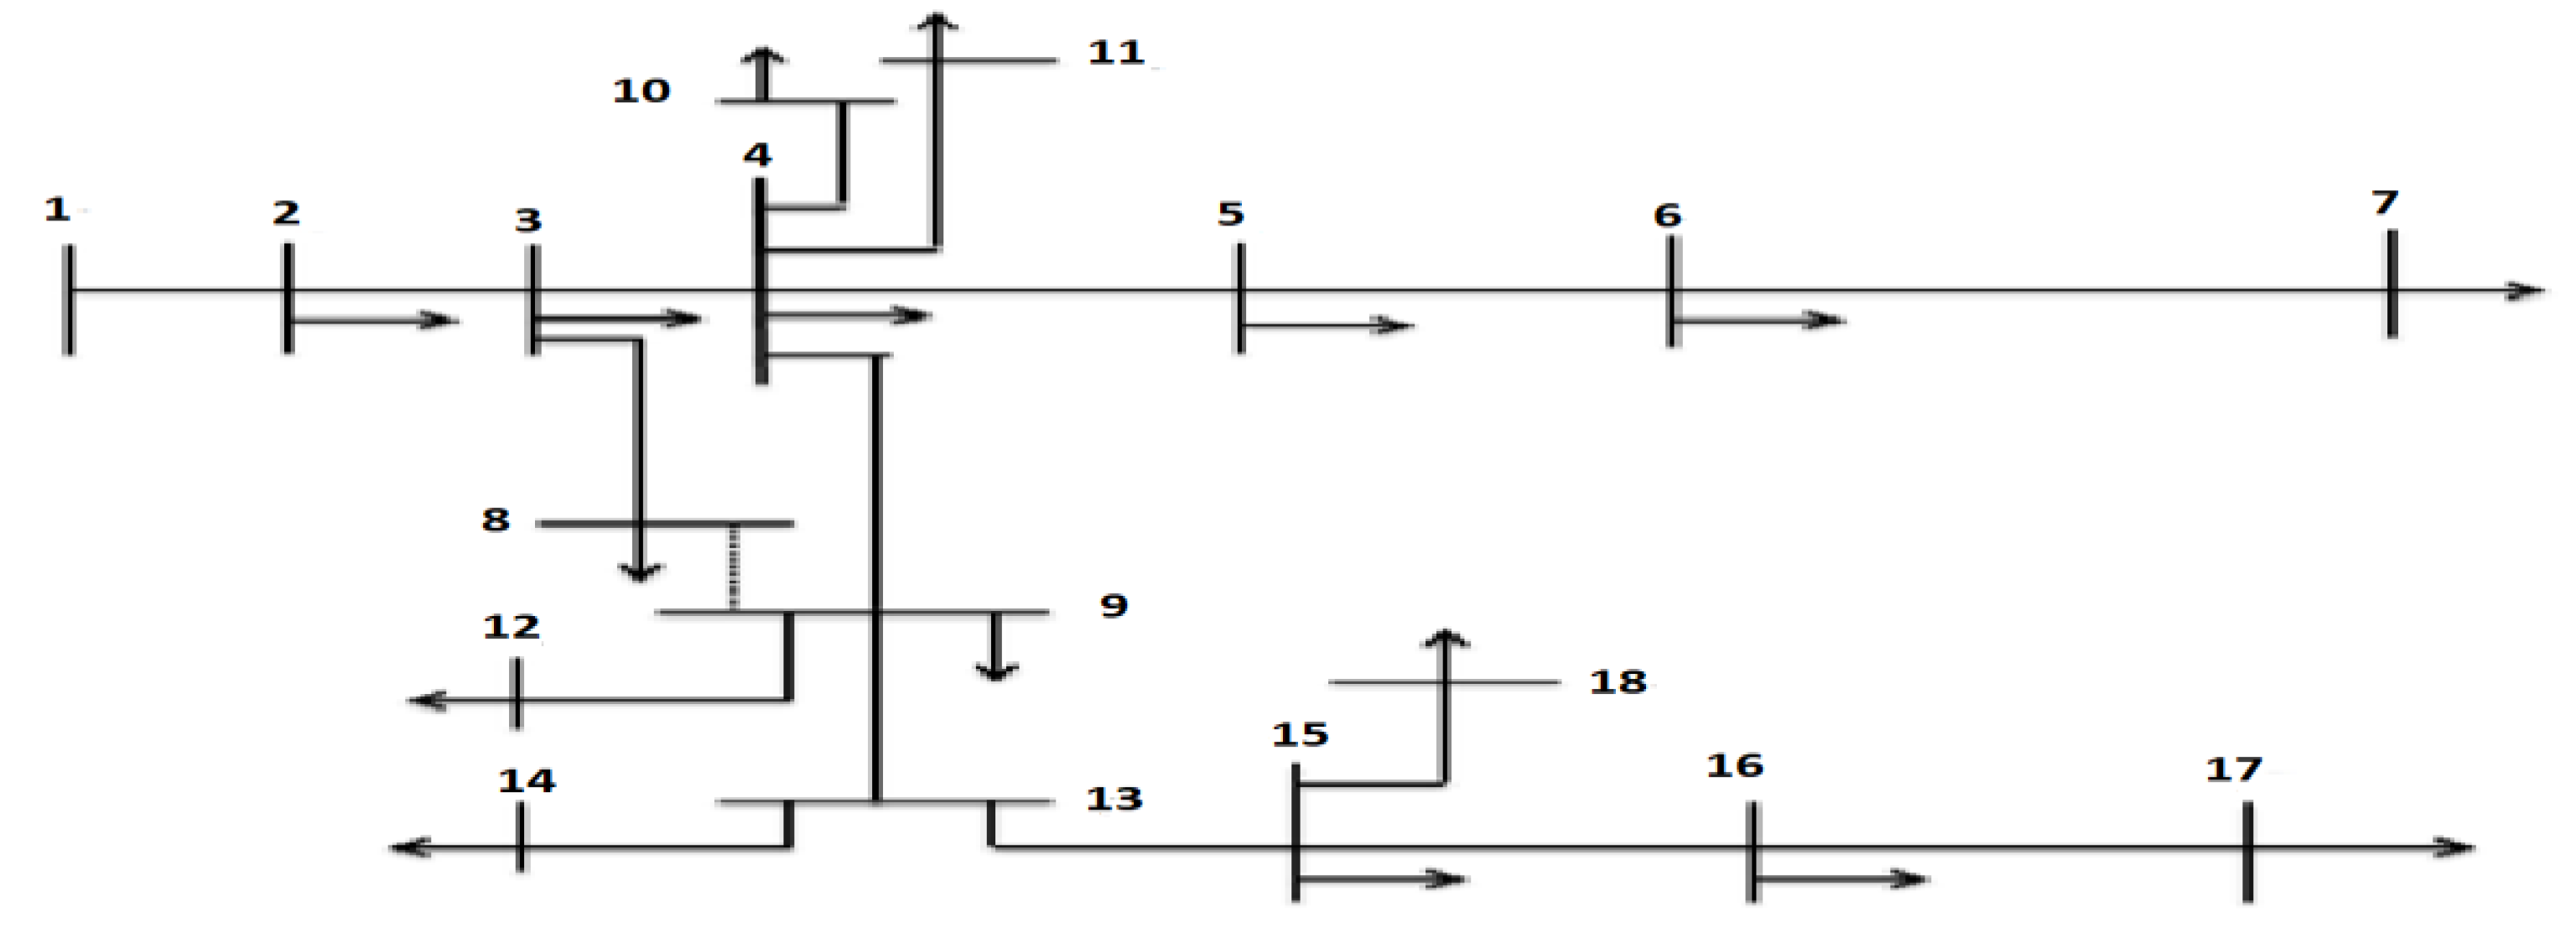
The 7151C bus is a real radial distribution system of the SEC, consisting of a slack bus (bus 1), 16 PQ buses, and 17 branches, as shown in Figure 11. The rating of its nominal substation transformer are 2.96 MVA and 13.8 kV. Its line and load data are given in Table A1.
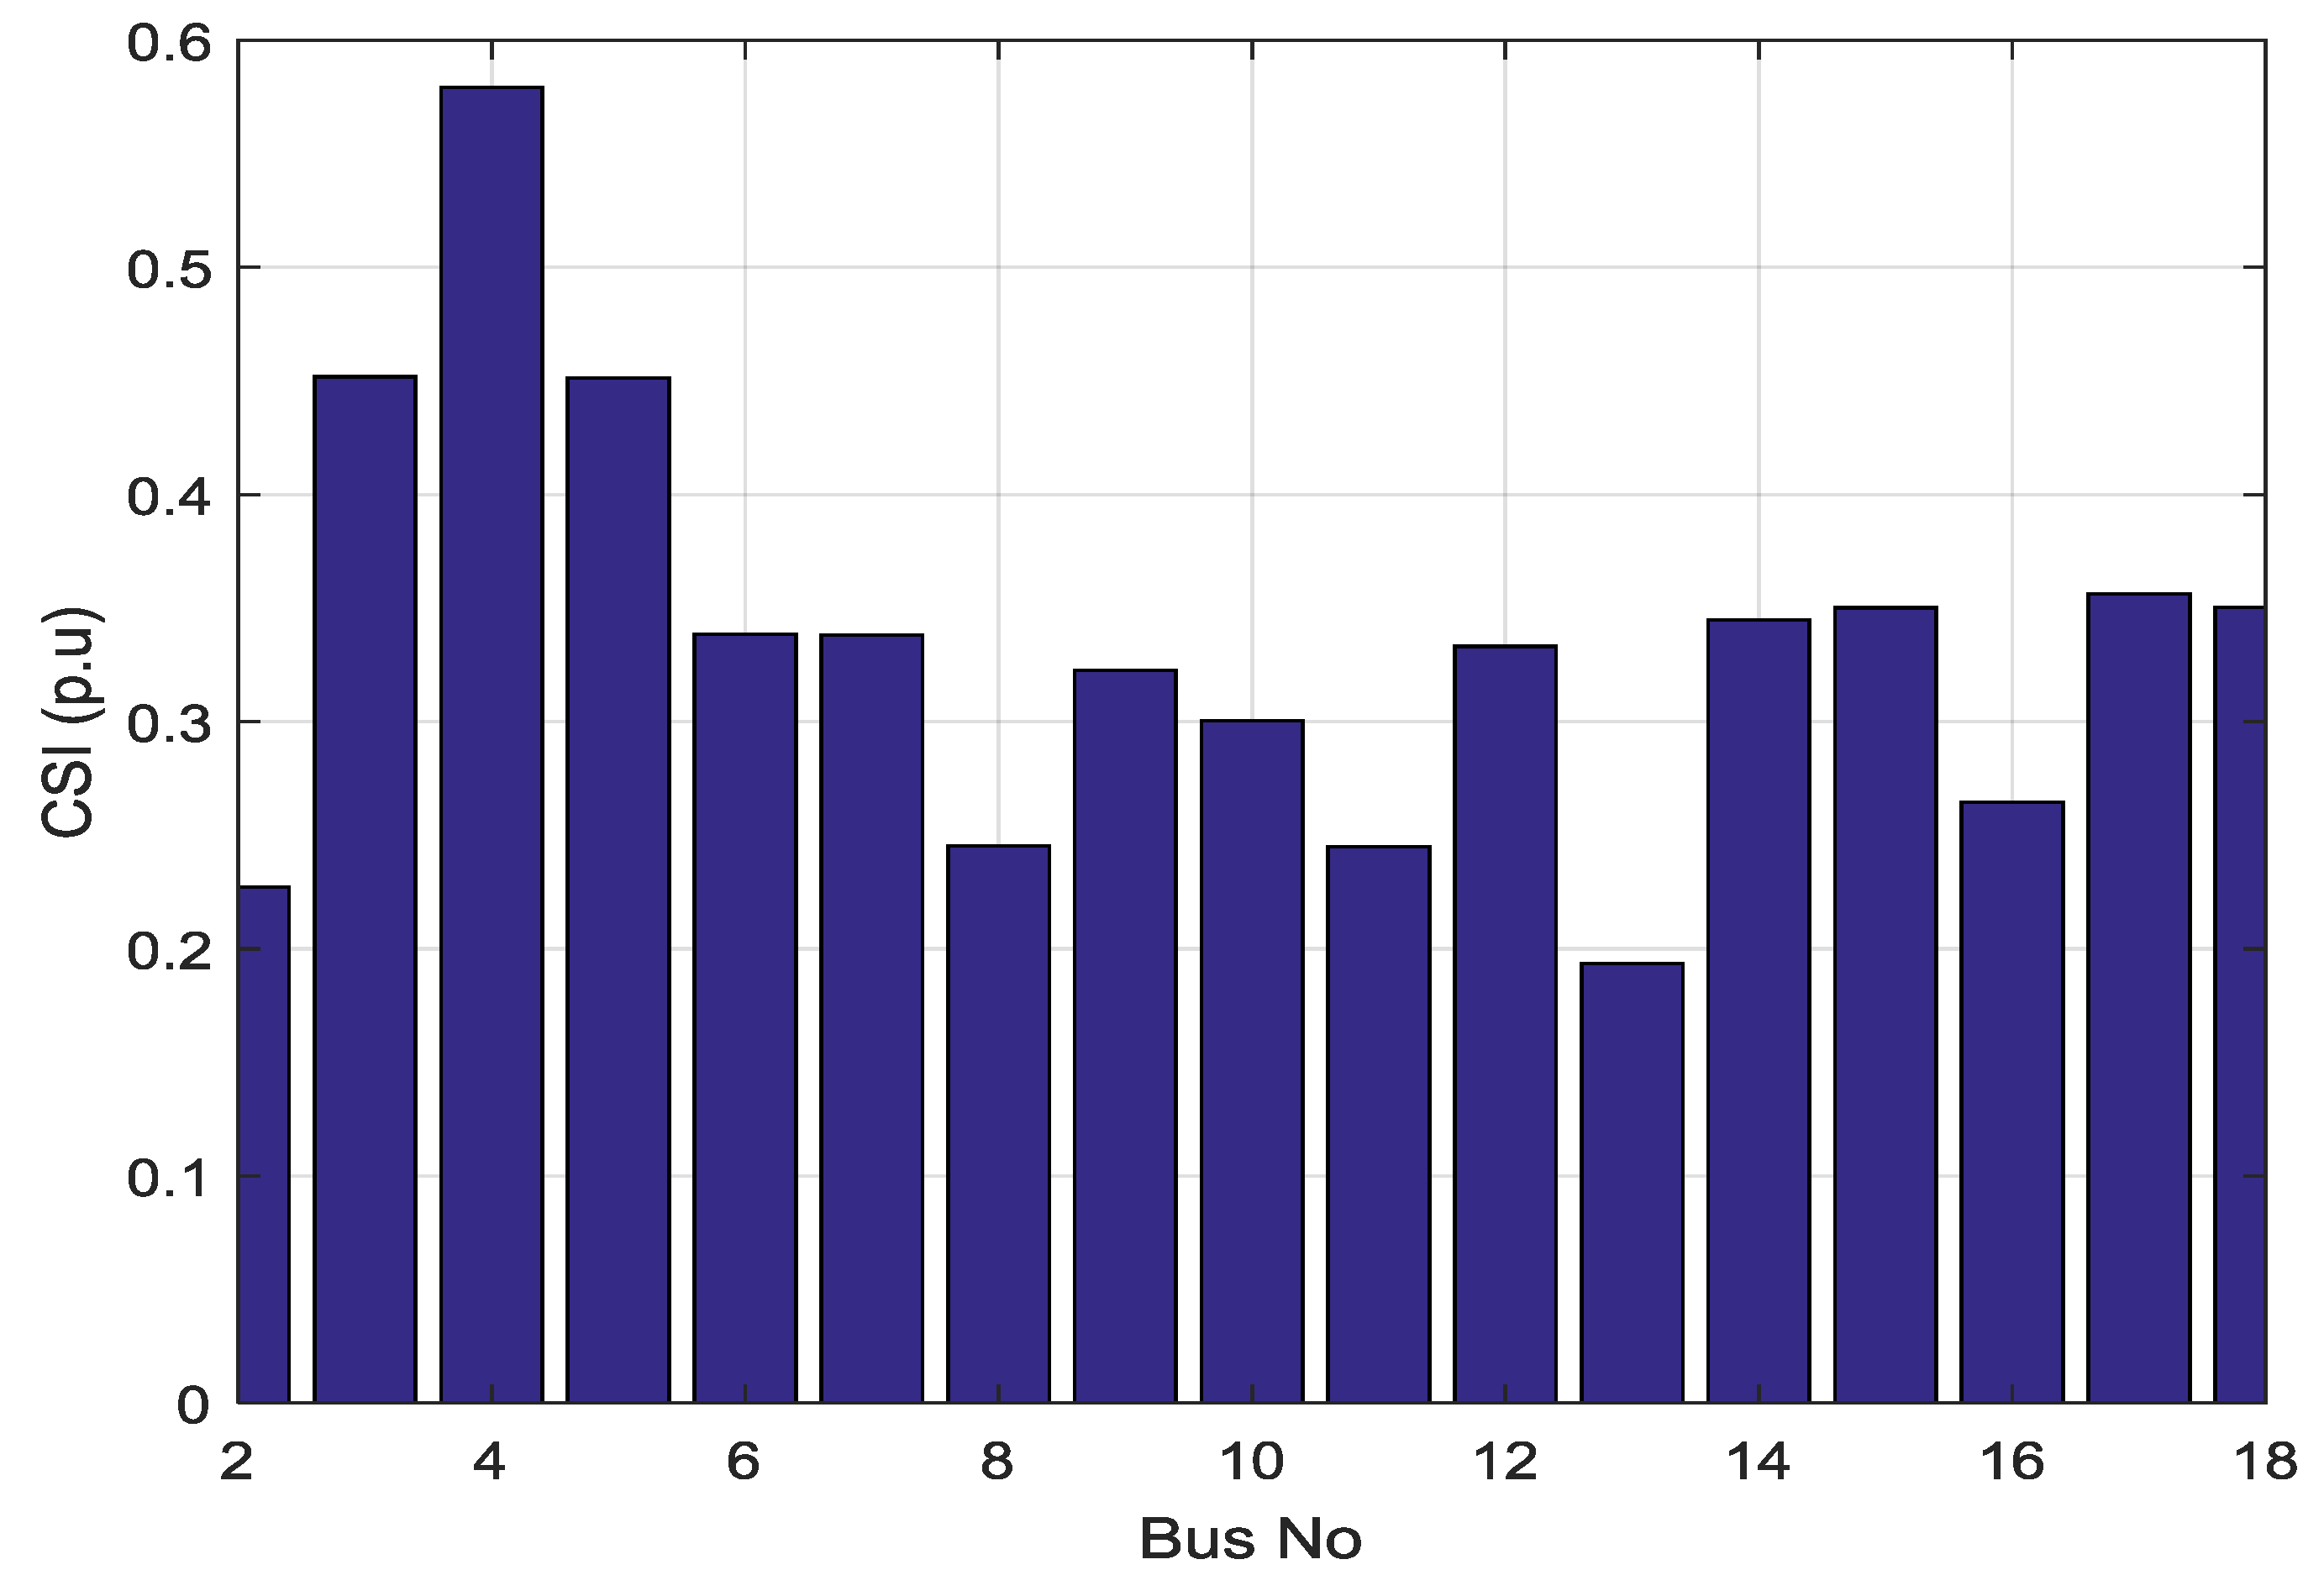
The ambient temperature effects on this system were also studied using Equation (15). Before capacitor placement, the initial average power loss for this system was 137.49 kW. The maximum and minimum average voltages values were 1.03 and 0.9761 p.u, respectively. The total annual average power and energy loss reduction costs were $16,500 and $15,055. After the FES approach had been applied to this system, it was determined that the capacitors should be installed at three optimal locations, i.e., buses 4,3 and 5, where the capacitor sensitivity index values were highest, as shown in Figure 12. The capacitor bank size was calculated using the Genetic Algorithm. The total average capacitor size installed into the system was 1.240 MVAR which gave a percentage loss reduction of 34.35%. Figure 13, shows that the voltage constraint is attained when the maximum and minimum values were 1.0 and 0.9685 p.u, respectively. The total annual average power and energy loss reduction costs were $6000 and $5478 with an average cost saving of $10,128 when the benefit–cost ratio was 7.5, as illustrated in Table 3. Before capacitor placement, the 7151C-bus system was severely distorted by the nonlinear loads. The obtained THD results at all buses were over 7%. After capacitor installation, in this case, the THD was managed within the prescribed limits (5%).
5.3. Limitations
The capacitor placement problem was solved by installation of new capacitor banks with proper size and placement in radial distribution systems. However, there still appears to be some limitations which require further research, such as the high running time of the codes, the limitation of the backward-forward sweep algorithm to radial distribution systems, the assumption that the temperature was 25–45 degrees Celsius which means that it was applied for only summer days, and the assumption that of each load was a nonlinear load only.
6. Conclusions
A hybrid technique consisting of the fuzzy expert system approach and the Genetic Algorithm method was offered for solve the placement problem of a new installed capacitor for an IEEE 34-bus distorted distribution system with consideration of ambient temperature effects. Additionally, a real distribution system of the SEC was used to show the capability of the proposed technique. The FES was used to specify the crucial buses or locations for such placement and the optimum capacitor size was obtained using the Genetic Algorithm method. The results of the simulation revealed that the value of THD did not surpass the maximum allowable level of the harmonic distortion at each bus, the total power and energy losses were reduced, and the voltage profile was improved. The potential cost of power and the energy losses, savings and the benefit–cost ratio were also studied. As a result, the proposed technique provides a potential tool to improve the efficiency of the distribution systems which can help the operators in a smart grid environment with the consideration that temperatures differ from region to region and from one country to another and must be considered to maintain accurate analysis. The proposed technique can be applied for the placement of shunt capacitors in three phase radial or mesh large distribution systems or for the placement of voltage regulators, on-load tap changer transformers, and flexible ac transmission systems in distribution systems.
Author Contributions
The authors contributed equally to this work.
Acknowledgments
The authors would like to thank the Deanship of scientific research for funding and supporting this research through the initiative of DSR Graduate Students Research Support (GSRS). The authors would like also to thank Saudi Electricity Company (Riyadh, Saudi Arabia) for providing the real data for this research.
Conflicts of Interest
The authors declare no conflict of interest.
Appendix A

Table A1.
Data of the 7151C-bus radial distribution system.
| From Bus, i | To Bus, i + 1 | R i, i + 1 (Ω) | X I, I + 1 (Ω) | PL (kW) | QL (kVAR) |
|---|---|---|---|---|---|
| 1 | 2 | 0.804 | 1.16 | 116.2 | 56.3 |
| 2 | 3 | 0.2412 | 0.348 | 464.8 | 225.1 |
| 3 | 4 | 0.402 | 0.58 | 508.5 | 246.3 |
| 4 | 5 | 0.1206 | 0.174 | 290.5 | 140.7 |
| 5 | 6 | 0.1206 | 0.174 | 159.8 | 77.4 |
| 6 | 7 | 0.201 | 0.29 | 101.6 | 49.2 |
| 3 | 8 | 0.1206 | 0.174 | 125.8 | 60.9 |
| 4 | 9 | 0.1608 | 0.232 | 72.6 | 35.2 |
| 4 | 10 | 0.3216 | 0.464 | 48.4 | 23.5 |
| 4 | 11 | 0.402 | 0.580 | 14.5 | 7 |
| 9 | 12 | 0.0965 | 0.1392 | 87.1 | 42.2 |
| 9 | 13 | 0.0161 | 0.0232 | 0 | 0 |
| 13 | 14 | 0.2412 | 0.348 | 145.3 | 70.4 |
| 13 | 15 | 0.201 | 0.29 | 145.3 | 70.4 |
| 15 | 16 | 0.1608 | 0.232 | 14.5 | 7 |
| 16 | 17 | 0.1608 | 0.232 | 193.6 | 93.8 |
| 15 | 18 | 0.3216 | 0.464 | 96.8 | 46.9 |
References
- Rao, R.S.; Narasimham, S.; Ramalingaraju, M. Optimal capacitor placement in a radial distribution system using plant growth simulation algorithm. Int. J. Electr. Power Energy Syst. 2011, 33, 1133–1139. [Google Scholar] [CrossRef]
- Nojavan, S.; Jalali, M.; Zare, K. Optimal allocation of capacitors in radial/mesh distribution systems using mixed integer nonlinear programming approach. Electr. Power Syst. Res. 2014, 107, 119–124. [Google Scholar] [CrossRef]
- Su, C.-T.; Lii, G.-R.; Tsai, C.-C. Optimal capacitor allocation using fuzzy reasoning and genetic algorithms for distribution systems. Math. Comput. Model. 2001, 33, 745–757. [Google Scholar] [CrossRef]
- De Souza, B.A.; Alves, H.N.; Ferreira, H.A. Microgenetic algorithms and fuzzy logic applied to the optimal placement of capacitor banks in distribution networks. IEEE Trans. Power Syst. 2004, 19, 942–947. [Google Scholar] [CrossRef]
- Prasad, P.; Sivanagaraju, S.; Sreenivasulu, N. A fuzzy-genetic algorithm for optimal capacitor placement in radial distribution systems. ARPN J. Eng. Appl. Sci. 2007, 2, 28–32. [Google Scholar]
- Reddy, M.D.; Reddy, V. Optimal capacitor placement using fuzzy and real coded genetic algorithm for maximum savings. J. Theor. Appl. Inf. Technol. 2008, 4, 219–226. [Google Scholar]
- Sreenivasulu, A. Optimal Capacitor Placement for Loss Reduction in Distribution Systems Using Fuzzy and Hybrid Genetic Algorithm. Int. J. Eng. 2013, 2, 3182–3186. [Google Scholar]
- Hsiao, Y.-T.; Chen, C.-H.; Chien, C.-C. Optimal capacitor placement in distribution systems using a combination fuzzy-GA method. Int. J. Electr. Power Energy Syst. 2004, 26, 501–508. [Google Scholar] [CrossRef]
- Gampa, S.R.; Das, D. Optimum placement of shunt capacitors in a radial distribution system for substation power factor improvement using fuzzy GA method. Int. J. Electr. Power Energy Syst. 2016, 77, 314–326. [Google Scholar] [CrossRef]
- Venkatesh, B.; Ranjan, R. Fuzzy EP algorithm and dynamic data structure for optimal capacitor allocation in radial distribution systems. IEE Proc. Gener. Transm. Distrib. 2006, 153, 80–88. [Google Scholar] [CrossRef]
- Saranya, S.G.; Muthukumaran, E.; Kannan, S.M.; Kalyani, S. Optimal Capacitor Placement in Radial Distribution Feeders Using Fuzzy-Differential Evolution. In Proceedings of the 2011 National Conference on Innovations in Emerging Technology (NCOIET), Erode, India, 17–18 February 2011. [Google Scholar]
- Reddy, M.D.; Reddy, V.V. Capacitor placement using fuzzy and particle swarm optimization method for maximum annual savings. ARPN J. Eng. Appl. Sci. 2008, 3, 25–30. [Google Scholar]
- Murthy, K.R.; Raju, M.R.; Rao, G.G. Comparison of Index Vector & Fuzzy-PSO Methods with Respect to Optimal Capacitor Placement in Agricultural Distribution System. In Proceedings of the 16th National Power Systems Conference, Hyderabad, India, 15–17 December 2010. [Google Scholar]
- Isac, S.J.; Kumar, K.S.; Kumar, P.V. Optimal Capacitor Placement in Radial Distribution System to Minimize the Loss Using Fuzzy Logic Control. In Proceedings of the 2013 IEEE International Conference on Smart Structures and Systems (ICSSS), Chennai, India, 28–29 March 2013. [Google Scholar]
- Kannan, S.; Renuga, P.; Monica, A.R.G. Optimal capacitor placement and sizing using combined fuzzy-HPSO method. Int. J. Eng. Sci. Technol. 2010, 2, 75–84. [Google Scholar] [CrossRef]
- Prasanna, M.B.; Kannan, S. Combination of Fuzzy and Second Order PSO Based Capacitor Placement in Radial Distribution Feeder. In Proceedings of the International Conference on Recent Trends in Computational Methods, Communication and Controls (ICON3C 2012), Erode, India, 6–10 April 2012. [Google Scholar]
- Ayoubi, M.; Hooshmand, R.-A.; Esfahani, M.T. Optimal capacitor placement in distorted distribution systems considering resonance constraint using multi-swarm particle swarm optimisation algorithm. IET Gener. Trans. Distrib. 2017, 11, 3210–3221. [Google Scholar] [CrossRef]
- Biswas, S.; Goswami, S.K.; Chatterjee, A. Optimal distributed generation placement in shunt capacitor compensated distribution systems considering voltage sag and harmonics distortions. IET Gener. Trans. Distrib. 2014, 8, 783–797. [Google Scholar] [CrossRef]
- Ou, T.-C.; Hong, C.-M. Dynamic operation and control of microgrid hybrid power systems. Energy 2014, 66, 314–323. [Google Scholar] [CrossRef]
- Othman, M.; El-Khattam, W.; Hegazy, Y.G.; Abdelaziz, A.Y. Optimal placement and sizing of distributed generators in unbalanced distribution systems using supervised big bang-big crunch method. IEEE Trans. Power Syst. 2015, 30, 911–919. [Google Scholar] [CrossRef]
- Sheng, W.; Liu, K.; Liu, Y.; Meng, X.; Li, Y. Optimal placement and sizing of distributed generation via an improved nondominated sorting genetic algorithm II. IEEE Trans. Power Deliv. 2015, 30, 569–578. [Google Scholar] [CrossRef]
- Tolba, M.A.; Rezk, H.; Tulsky, V.; Zaki Diab, A.A.; Abdelaziz, A.Y.; Vanin, A. Impact of Optimum Allocation of Renewable Distributed Generations on Distribution Networks Based on Different Optimization Algorithms. Energies 2018, 11, 245. [Google Scholar] [CrossRef]
- Lin, W.-M.; Ou, T.-C. Unbalanced distribution network fault analysis with hybrid compensation. IET Gener. Trans. Distrib. 2011, 5, 92–100. [Google Scholar] [CrossRef]
- Ou, T.-C.; Lu, K.-H.; Huang, C.-J. Improvement of transient stability in a hybrid power multi-system using a designed NIDC (Novel Intelligent Damping Controller). Energies 2017, 10, 488. [Google Scholar] [CrossRef]
- Ou, T.-C. A novel unsymmetrical faults analysis for microgrid distribution systems. Int. J. Electr. Power Energy Syst. 2012, 43, 1017–1024. [Google Scholar] [CrossRef]
- Ou, T.-C. Ground fault current analysis with a direct building algorithm for microgrid distribution. Int. J. Electr. Power Energy Syst. 2013, 53, 867–875. [Google Scholar] [CrossRef]
- Khalil, T.M.; Youssef, H.K.; Aziz, M.A. Optimal Capacitor Placement on radial Distribution Feeders in Presence of Nonlinear Loads Using Binary Particle Swarm Optimization. In Proceedings of the 19th International Conference on Electricity Distribution, Vienna, Austria, 21–24 May 2007. [Google Scholar]
- El-Ela, A.A.A.; Ei-Sehiemy, R.A.; Kinawy, A.-M.; Mouwafi, M.T. Optimal capacitor placement in distribution systems for power loss reduction and voltage profile improvement. IET Gener. Trans. Distrib. 2016, 10, 1209–1221. [Google Scholar] [CrossRef]
- Baghzouz, Y. Effects of nonlinear loads on optimal capacitor placement in radial feeders. IEEE Trans. Power Deliv. 1991, 6, 245–251. [Google Scholar] [CrossRef]
- Blooming, T.M.; Carnovale, D.J. Application of IEEE Std 519-1992 Harmonic limits. In Proceedings of the Pulp and Paper Industry Technical Conference, Appleton, WI, USA, 18–23 June 2006. [Google Scholar]
- Saudi Electricity Company (SEC). Annual Statistical Booklet for Electricity and Seawater Desalination Industries; Electricity & Cogeneration Regulatory Authority: Riyadh, Saudi Arabia, 2016. [Google Scholar]
- Zadeh, L.A. Fuzzy sets. Inf. Control 1965, 8, 338–353. [Google Scholar] [CrossRef] [Green Version]
- Boone, G.; Chiang, H.-D. Optimal capacitor placement in distribution systems by genetic algorithm. Int. J. Electr. Power Energy Syst. 1993, 15, 155–161. [Google Scholar] [CrossRef]
- Fitriana Suhartati, D.F.U.; Penangsang, O.; Soeprijanto, A. Capacitor Placement and Sizing in Distorted Distribution Systems Using Simplified Direct Search Algorithm. J. Clean Energy Technol. 2014, 2, 317–321. [Google Scholar] [CrossRef]
Figure 1.
Demonstration of two buses in a distribution system.

Figure 2.
Single line diagram of an n-bus unbalanced Radial Distribution System (RDS).

Figure 3.
Relationship between power consumption and temperature in Riyadh city.

Figure 4.
Plot of membership functions for the Power Loss Index (PLI).

Figure 5.
Plot of membership functions for the Voltage Index (V).

Figure 6.
Plot of membership functions for the Capacitor Sensitivity Index (CSI).

Figure 7.
Flowchart of the Fuzzy Expert System Approach.

Figure 8.
The IEEE 34-bus radial distribution system.

Figure 9.
Values of CSI for capacitor placement in the IEEE 34-bus distribution system using the Fuzzy Expert System (FES).
Figure 9.
Values of CSI for capacitor placement in the IEEE 34-bus distribution system using the Fuzzy Expert System (FES).

Figure 10.
Bus voltages for the IEEE 34-bus distribution system: before capacitor installation and after capacitor installation.
Figure 10.
Bus voltages for the IEEE 34-bus distribution system: before capacitor installation and after capacitor installation.

Figure 11.
The 7151C-bus radial distribution system.

Figure 12.
Values of CSI for capacitor placement of the 7151C-bus distribution system using the FES.
Figure 12.
Values of CSI for capacitor placement of the 7151C-bus distribution system using the FES.

Figure 13.
Bus voltages for the 7151C-bus radial distribution system: before capacitor installation and after capacitor installation.
Figure 13.
Bus voltages for the 7151C-bus radial distribution system: before capacitor installation and after capacitor installation.

Table 1.
Decision matrix for Capacitor Sensitivity Index (CSI).
| CSI | V | |||||
|---|---|---|---|---|---|---|
| L | LM | M | HM | H | ||
| PLI | L | LM | LM | L | L | L |
| LM | M | LM | LM | L | L | |
| M | HM | M | LM | L | L | |
| HM | HM | HM | M | LM | L | |
| H | H | HM | M | LM | LM | |
Table 2.
Average results for the IEEE 34-bus Radial Distribution Systems.
| Bus No | BCP (MVAR) | Proposed (MVAR) |
|---|---|---|
| 26 | 0 | 0.320 |
| 24 | 0 | 0.190 |
| 23 | 0 | 0.190 |
| 25 | 0 | 0.200 |
| 22 | 0 | 1.200 |
| Total MVAR | 0 | 2.100 |
| Max. voltage (p.u) | 1.02 | 1.03 |
| Min. voltage (p.u) | 0.9219 | 0.9554 |
| Max. THD | 9.37 | 5 |
| Power losses (kW) | 515.14 | 320.69 |
| Reduction (%) | 0 | 36.15 |
| Capacitor cost ($/year) | 0 | 2550 |
| Power loss reduction cost ($/year) | 61,817 | 23,334 |
| Energy loss reduction cost ($/year) | 56,408 | 21,292 |
| Benefit ($/year) | 0 | 42,080 |
| Benefit–cost ratio | 0 | 16.5 |
Table 3.
Average results for the 7151C-bus RDS.
| Bus No | BCP (MVAR) | Proposed (MVAR) |
|---|---|---|
| 4 | 0 | 0.700 |
| 3 | 0 | 0.110 |
| 5 | 0 | 0.430 |
| Total MVAR | 0 | 1.240 |
| Max. voltage (p.u) | 1.03 | 1 |
| Min. voltage (p.u) | 0.9761 | 0.9685 |
| Max. THD | 8.76 | 4.2 |
| Power losses (kW) | 137.49 | 87.46 |
| Reduction (%) | 0 | 34.35 |
| Capacitor cost ($/year) | 0 | 1350 |
| Power loss reduction cost ($/year) | 16,500 | 6000 |
| Energy loss reduction cost ($/year) | 15,055 | 5478 |
| Benefit ($/year) | 0 | 10,128 |
| Benefit–cost ratio | 0 | 7.5 |
© 2018 by the authors. Licensee MDPI, Basel, Switzerland. This article is an open access article distributed under the terms and conditions of the Creative Commons Attribution (CC BY) license (http://creativecommons.org/licenses/by/4.0/).
Share and Cite
MDPI and ACS Style
Al-Ammar, E.A.; Ghazi, G.A.; Ko, W. Impact of Ambient Temperature on Shunt Capacitor Placement in a Distorted Radial Distribution System. Energies 2018, 11, 1585. https://doi.org/10.3390/en11061585
AMA Style
Al-Ammar EA, Ghazi GA, Ko W. Impact of Ambient Temperature on Shunt Capacitor Placement in a Distorted Radial Distribution System. Energies. 2018; 11(6):1585. https://doi.org/10.3390/en11061585
Chicago/Turabian StyleAl-Ammar, Essam A., Ghazi A. Ghazi, and Wonsuk Ko. 2018. "Impact of Ambient Temperature on Shunt Capacitor Placement in a Distorted Radial Distribution System" Energies 11, no. 6: 1585. https://doi.org/10.3390/en11061585
Note that from the first issue of 2016, this journal uses article numbers instead of page numbers. See further details here.