Article

Influence of Hydrothermal Carbonization on Composition, Formation and Elimination of Biphenyls, Dioxins and Furans in Sewage Sludge

1
Faculty of Resource Management, University of Applied Sciences and Arts (HAWK), 37075 Göttingen, Germany
2
Institute of Chemistry, University of Oldenburg, 26129 Oldenburg, Germany
*
Author to whom correspondence should be addressed.
Energies 2018, 11(6), 1582; https://doi.org/10.3390/en11061582
Submission received: 30 May 2018 / Revised: 12 June 2018 / Accepted: 13 June 2018 / Published: 15 June 2018

Abstract

:
In many areas of application, the influence of hydrothermal carbonization (HTC) on the composition of organic pollutants is still unexplored. In this study, sewage sludge (SS) was carbonized and the input as well as the hydrochar were examined for the organic pollutants: polychlorinated biphenyls (PCB), polychlorinated dibenzo-dioxins (PCDDs), and polychlorinated dibenzo-furans (PCDFs). The process temperatures of carbonization were 200 °C, 220 °C, and 240 °C and the holding time was 5 h for all tests. The total concentration of PCBs was relatively stable for all temperatures, whereas the toxicity equivalent (WHO-TEQ) at 200 °C and 220 °C increases compared to the input material. The strongest impact on toxicity was observed for PCDDs where concentrations were reduced for higher temperatures, whereas the toxicity increases by more than 16 times for temperatures of 240 °C. The concentrations and toxicity of PCDFs were reduced for all carbonization temperatures. In hydrochar from HTC at 240 °C, the limit values for the application of SS in German agriculture have been exceeded. The results indicate that the process conditions for HTC should be controlled also for SS with average contamination if the hydrochar is to be used as material, especially in agriculture.

1. Introduction

Sewage sludge (SS), a residue from waste water treatment plants, is often contaminated with heavy metals, microorganisms and other hazardous substances like persistent organic pollutants (POPs). Therefore, proper and environmentally friendly utilization is required. Many European countries have lowered the limit values for heavy metals, pathogens, and organic micro pollutants for the agricultural use of sewage sludge in order to reduce their dispersion [1,2]. In Germany there is an amount of about 1,850,000 Mg dry mass of sewage sludge per year [3]. It contains more than 50,000 Mg of phosphorus and other nutrients such as nitrogen, magnesium and calcium [4]. Since the disposal on landfills and the agricultural use is more and more limited by legal thresholds, the thermal use in co-incineration or mono incineration has grown up to 54% in 2011 [4].
Hydrothermal carbonization (HTC) is a relatively new method for the treatment of wet biomass, such as sewage sludge. HTC is a thermo-chemical process for the conversion of biomass into a coal like substance called hydrochar [5,6,7,8,9]. At temperatures ranging from 180 °C to 250 °C and pressures of 10 bar to 40 bar, the wet biomass is converted within hours. To produce a resource from the HTC-slurry, the solids are separated from the process water by pressing after the carbonization process. The resulting hydrochar has a calorific value as lignite of about 15 MJ/kg [10,11,12].
A detailed description of the processes that occur during hydrothermal carbonization is still missing due to the inhomogeneous composition of the biomass [13]. The influences of the HTC on chemical composition of individual substances like organic pollutants are only described in few publications [14,15].
The hydrothermal treatment of sewage sludge has different advantages, depending on the utilization of the hydrochar. If the toxic load is low, the hydrochar can still be used in agriculture. After HTC and solid-liquid-separation, the water content is much lower. Furthermore, due to the change in chemical structure of the sludge components, separation requires less energy than for the original SS. Additionally, the hydrochar can have a soil melioration effect [16,17].
If the hydrochar is used as fuel, there is also the advantage of higher transport worthiness from the wastewater treatment plant to the incineration plant. Another significant effect is the raised calorific value. SS with 65% to 75% water content has to be incinerated with additional fuel, while hydrochar from sewage sludge with a calorific value of 9–12 MJ/kg is comparable to lignite and burns on its own. Another advantage is the possibility to use the hydrochar in mono incineration [4]. Additionally, the resulting ash contains a high concentration of phosphorus, so recovery methods can be used more efficiently. Wet sewage sludge usually can only be used in co-incineration because of its low calorific value. Ashes from co-incineration have lower phosphorus concentrations and can contain substances from the other fuels, which makes the phosphorus recovery more inefficient [18].
Phosphorus is a limited resource and an essential nutrient for all forms of life. The natural resources as phosphate rock could be depleted in the coming decades [19]. As an alternative to phosphate-rich rock, sewage sludge can be used as an important, sustainable, and locally available P source [20,21]. For this reason, the German legislators has issued a new regulation requiring the use of the phosphorus contained in sewage sludge for all sewage treatment plants above a certain size [22].
The concentrations of persistent organic pollutants (POPs) in the SS are normally not strongly influenced by the conventional SS treatment techniques like anaerobic digestion. It is often assumed that while using HTC, dioxins do not require further consideration because the so-called “dioxin window”, the range of about 300 °C to 600 °C where a neogenesis of dioxins is possible, is not reached under the given process conditions [23,24]. However, some results show that the profile and composition of the congeners of polychlorinated biphenyls (PCBs), polychlorinated dibenzo-dioxins (PCDDs), and polychlorinated dibenzo-furans (PCDFs) are being modified during the HTC [15].
The aim of this research was to investigate the effects of HTC on the toxicity of sewage sludge regarding the concentration and composition of the organic pollutants PCBs, PCDDs and PCDFs. Although the results do not provide a detailed mechanism of how individual molecules react during HTC, they do provide evidence of the change in the composition of the treated material. To assess the influence of HTC on the toxicity of hydrochars, the pollutant contents of the substrates and the composition of their congeners should be carefully evaluated prior to hydrothermal treatment if pre-pollution is suspected.
To estimate the total impact of PCDD/F emissions to the environment in some countries inventories of the emissions were compiled. Also, for Germany these data are available for 1990–2000, quantified in I-TEQ values [25], and with additional data up to 2016 as WHO-TEQ (including PCDD/Fs and dioxin-like PCBs) from the German Environmental Agency [26]. Both inventories show a strong reduction of airborne PCDD/F emissions between 1990 and 2000/2005. According to [26] the total WHO-TEQ were 806 g in 1990, 332 g in 1995, and 151 g in 2005. From 2010 (123 g) to 2014 (119 g) only a very slight decrease was registered followed by more or less stable values since 2014. In 1990, waste incineration (power generation), followed by sintering plants and non-iron metal production were the main sources, but all with high rates of decline. The emissions from other sources like traffic, residential heating, and steel production remained nearly unchanged. In 2016, the contribution of the energy production sector to the total PCDD/F emission was about 33% [26].
Looking to the situation for sewage sludge there are several data from the 1980s and 1990s available but much less from the recent years. The following values give a brief insight to the level of the PCDD/F load of sewage sludge in some countries in the recent decades. According to Rogers, in Sweden the PCDD/F-TEQ ranged from 381–1067 ng TEQ/kg dry matter (published 1990), mean values for Germany were 1705 ng TEQ/kg dry matter (published 1986), and in the UK 317–1294 ng TEQ/kg dray matter (published 1989) were found [27]. All values were recalculated from PCDD/F-concentrations by the authors using WHO-TEF (2005). The mean value for PCDD/F in sewage sludge in 2001 in the US was 21.7 ng TEQ/kg dry matter, calculated with 1998 WHO-TEF [28]. In Peking the TEQ concentration in 2007 ranged from 3.47–88.24 ng TEQ/kg dry matter (I-TEF) [29]. It could be noticed that the concentration levels in different countries were at similar levels for the same date of investigation but were decreasing significantly in the last decades.
Against the background of the stable PCDD/F emissions at a very low level (in Germany), new technologies such as HTC should ensure not to produce new PDD/Fs and to raise the total emissions. For PCBs there is no long term data base available, but also their emissions have to be considered. Looking at HTC treated material as potential sources for PCDD/Fs, it must be taken into account that usually only airborne emissions are considered, as it was done in the inventories cited above.
PCDDs and PCDFs consist of a dibenzo-p-dioxin or dibenzofuran structure, which can be chlorinated at 8 positions. By the number of 1 to 8 chlorine substituents and the possible isomers for the dibenzo-p-dioxin 75 congeners, and for the dibenzo-p-furan 135 congeners that exist due to the asymmetric dibenzofuran structure. For PCBs, 209 congeners result from a maximum of 10 positions that can be chlorinated. The toxicity of the individual PCDD/F and PCB congeners differs greatly. Since the analytical effort for the determination of all congeners of PCDDS, PCDFs, and PCBs is very high, only the most toxic compounds are determined in accordance with the relevant legal requirements [22]. In order to be able to give a single limit value for the sum of the PCDD/Fs and PCBs, the concentrations of these defined congeners are multiplied by toxicity factors (TEF) based on the most toxic congener 2,3,7,8-TCDD with the factor 1 and the results are added up to a toxicity equivalent (TEQ). The congeners involved are 7 PCDD and 10 PCDF, which are at least chlorinated in 2,3,7, and 8 position and 12 non-ortho and mono-ortho chloro-substituated “dioxin-like” PCBs. The most established system is the WHO-TEF, which contains PCDDs, PCDFs, and PCBs [30]. Less common is the I-TEQ system, which only contains PCDDs and PCDFs [31]. The toxicity factors of both systems differ slightly for single congeners (see Appendix A, Table A1).

2. Results

For the experiments, sewage sludge from a wastewater treatment plant in Germany was used to investigate the concentrations before and after the carbonization process. The contents of PCBs, PCDFs, and PCDDs in the input are in a typical range for sewage sludge and the PCDDs and PCDFs congener pattern found in the current study are similar to the results for hydrothermally carbonized sewage sludge found by Tirler and Basso [15]. According to former studies, they classify the congener pattern as a “natural formation pattern” that differs significantly from those generated by incineration processes.
The results of the analyses of the input sewage sludge and the resulting hydrochars are shown in Table 1. It was assumed that the POPs are bound in the solid and do not pass into the liquid phase. Therefore, the values for the concentration of the PCDDs, PCDFs, and PCBs were corrected based on the dry matter content of the input due to the losses in the HTC-process. Weight losses after HTC were 27%, 29% and 33% based on the dry matter of the input at HTC temperatures of 200 °C, 220 °C, and 240 °C. For concentrations below the quantification limit, values were calculated with half the numerical value of the quantification limit. This has the advantage that even small quantities, which could not be determined, are taken into account when adding up the TEQ values.

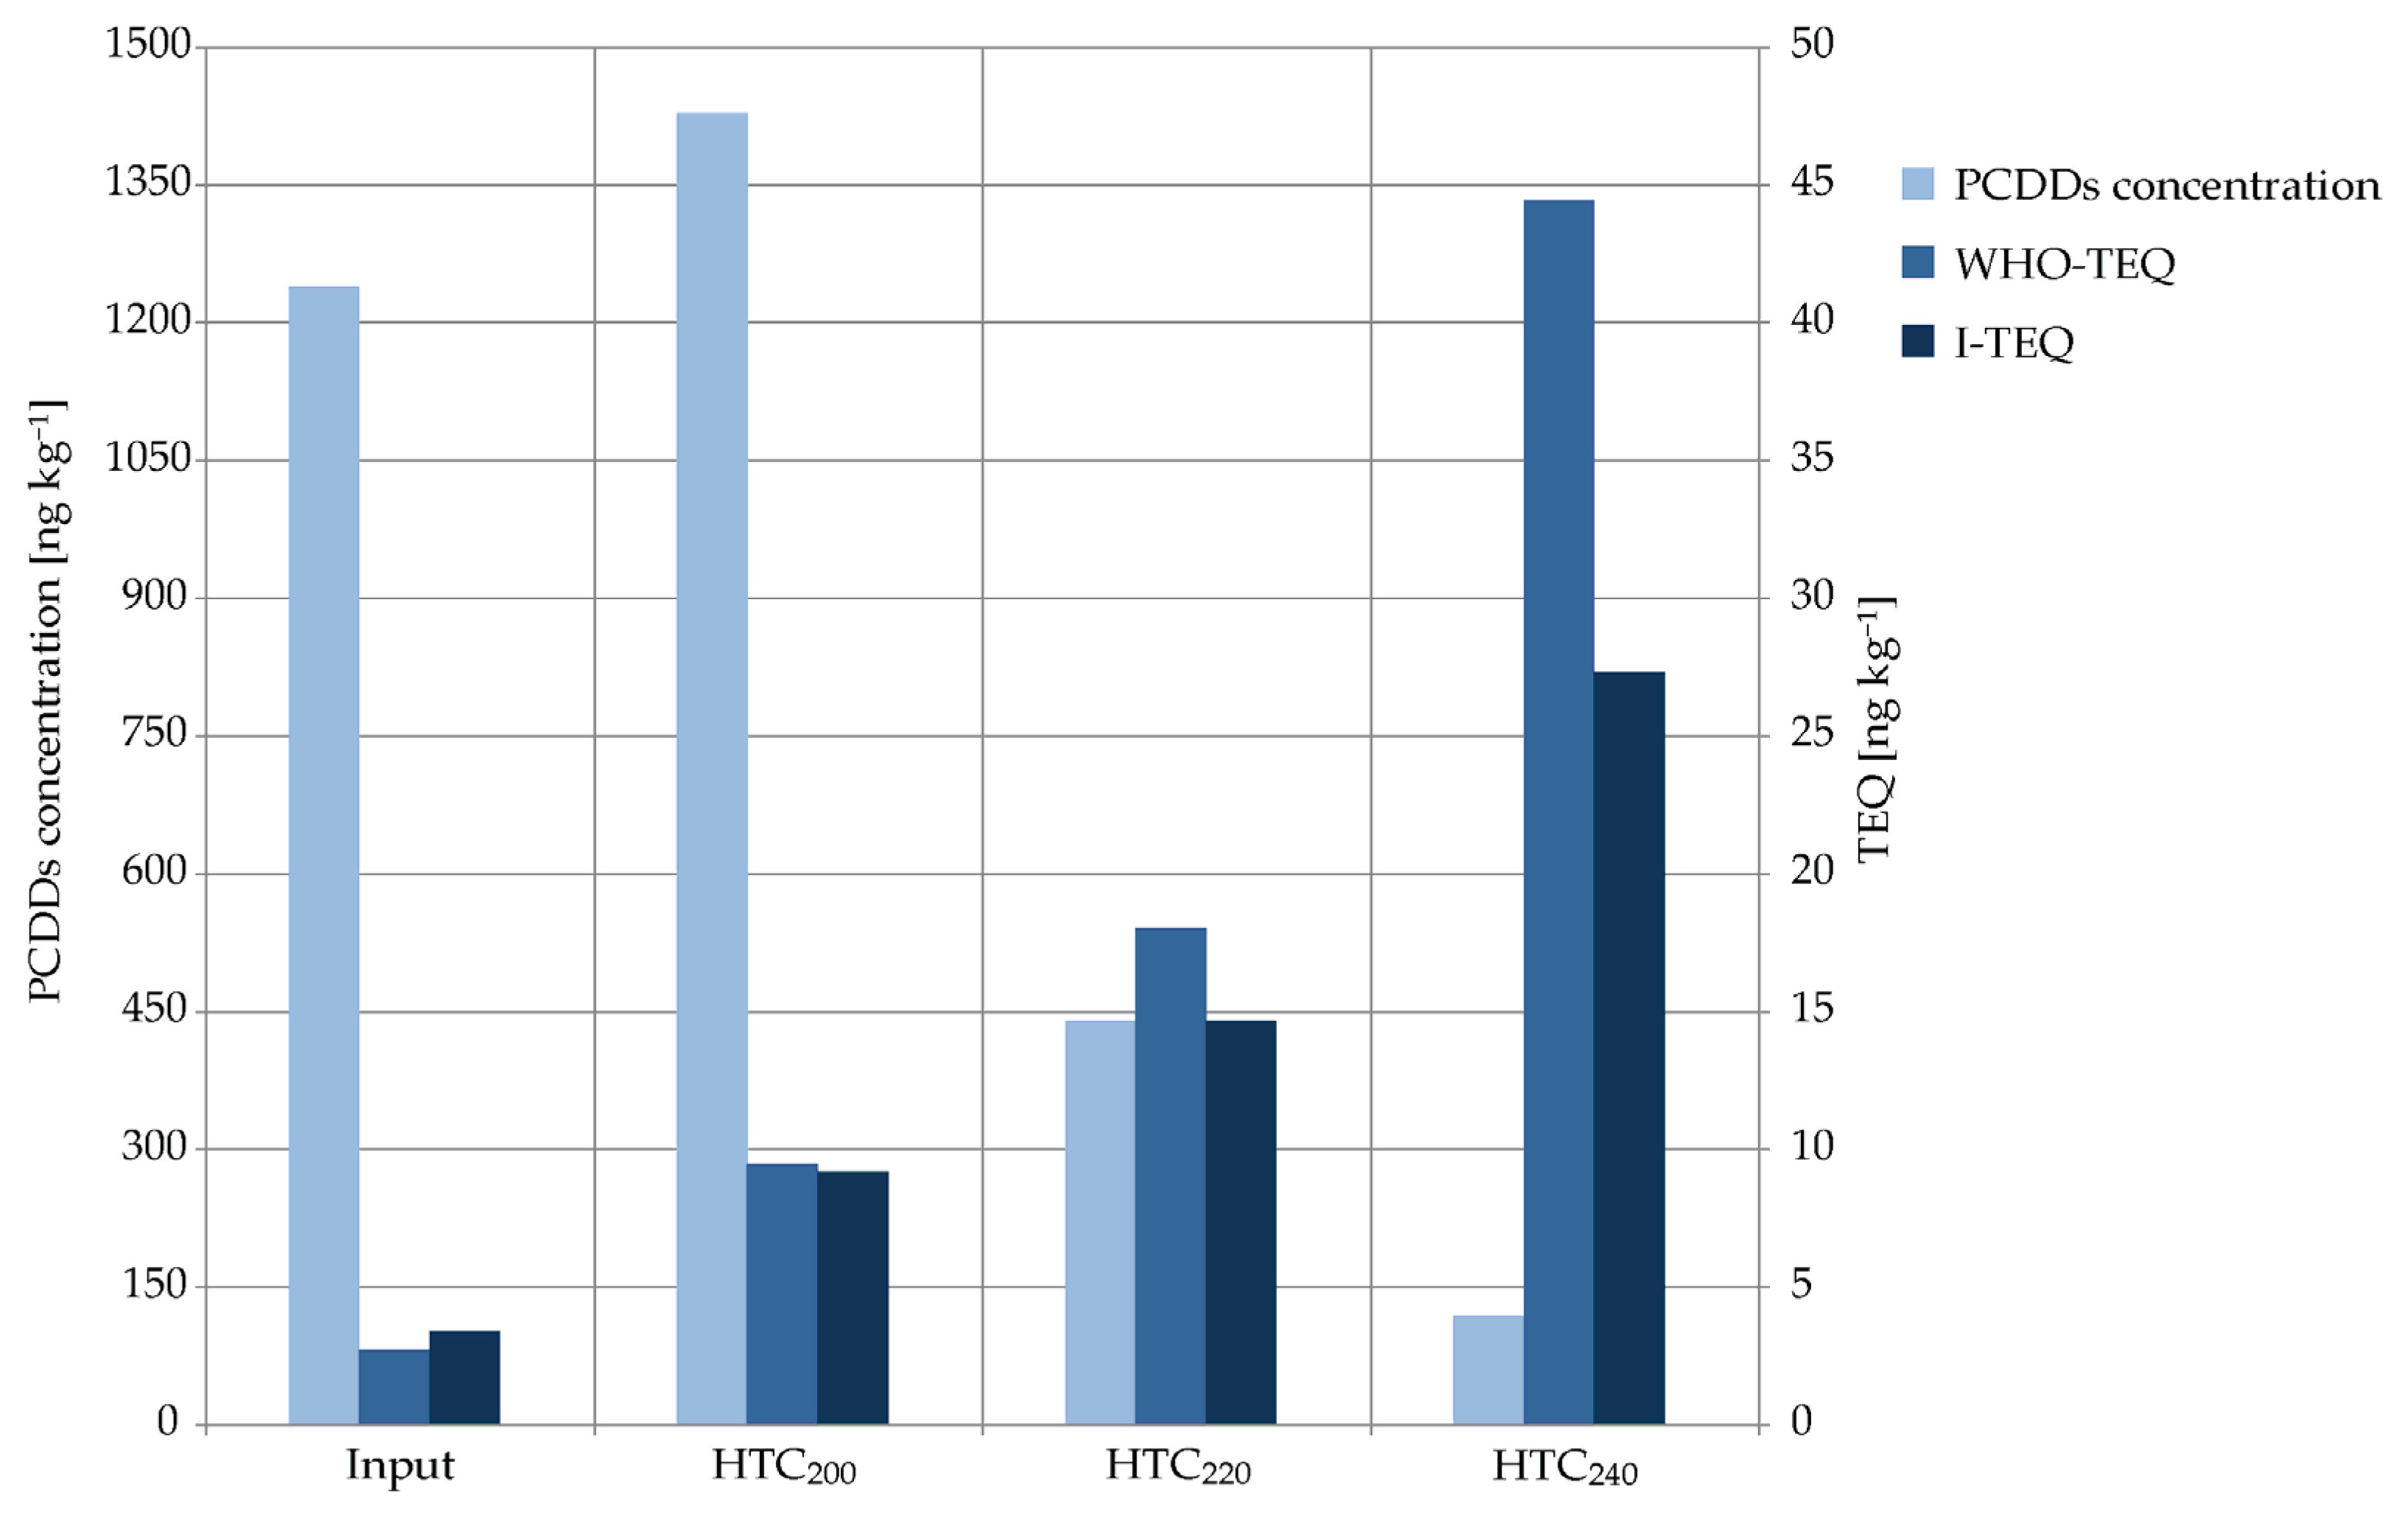
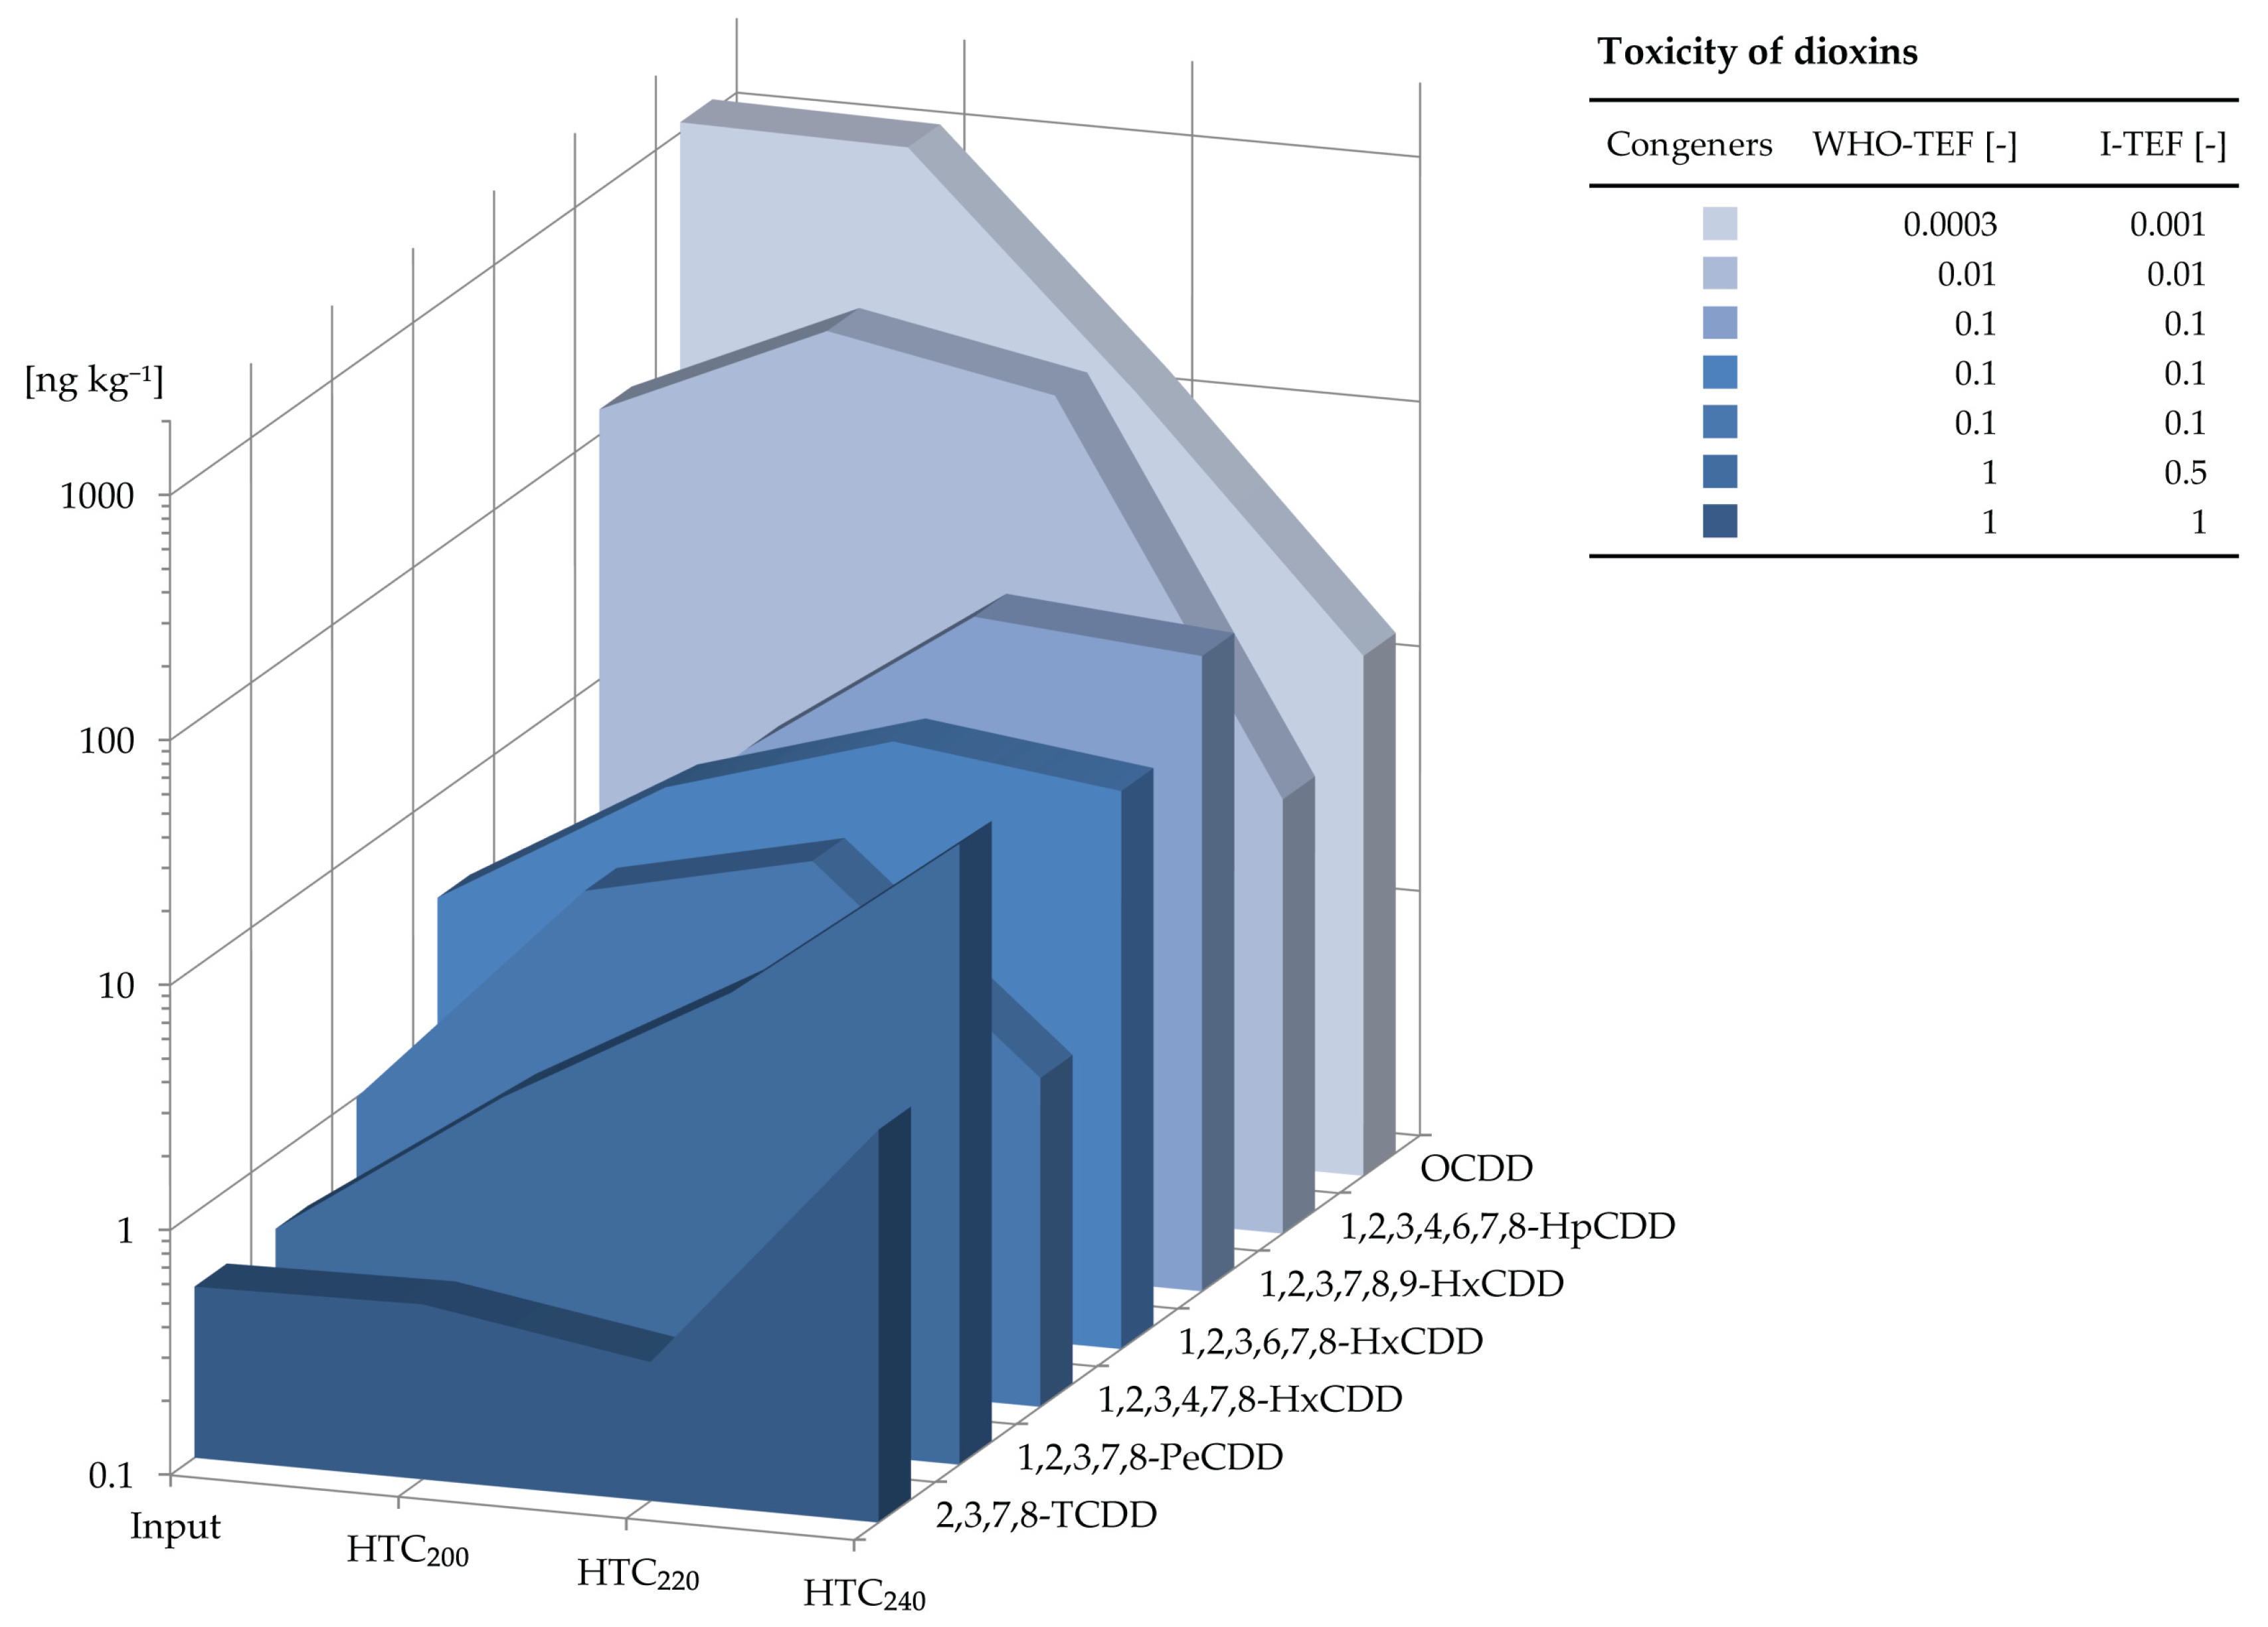
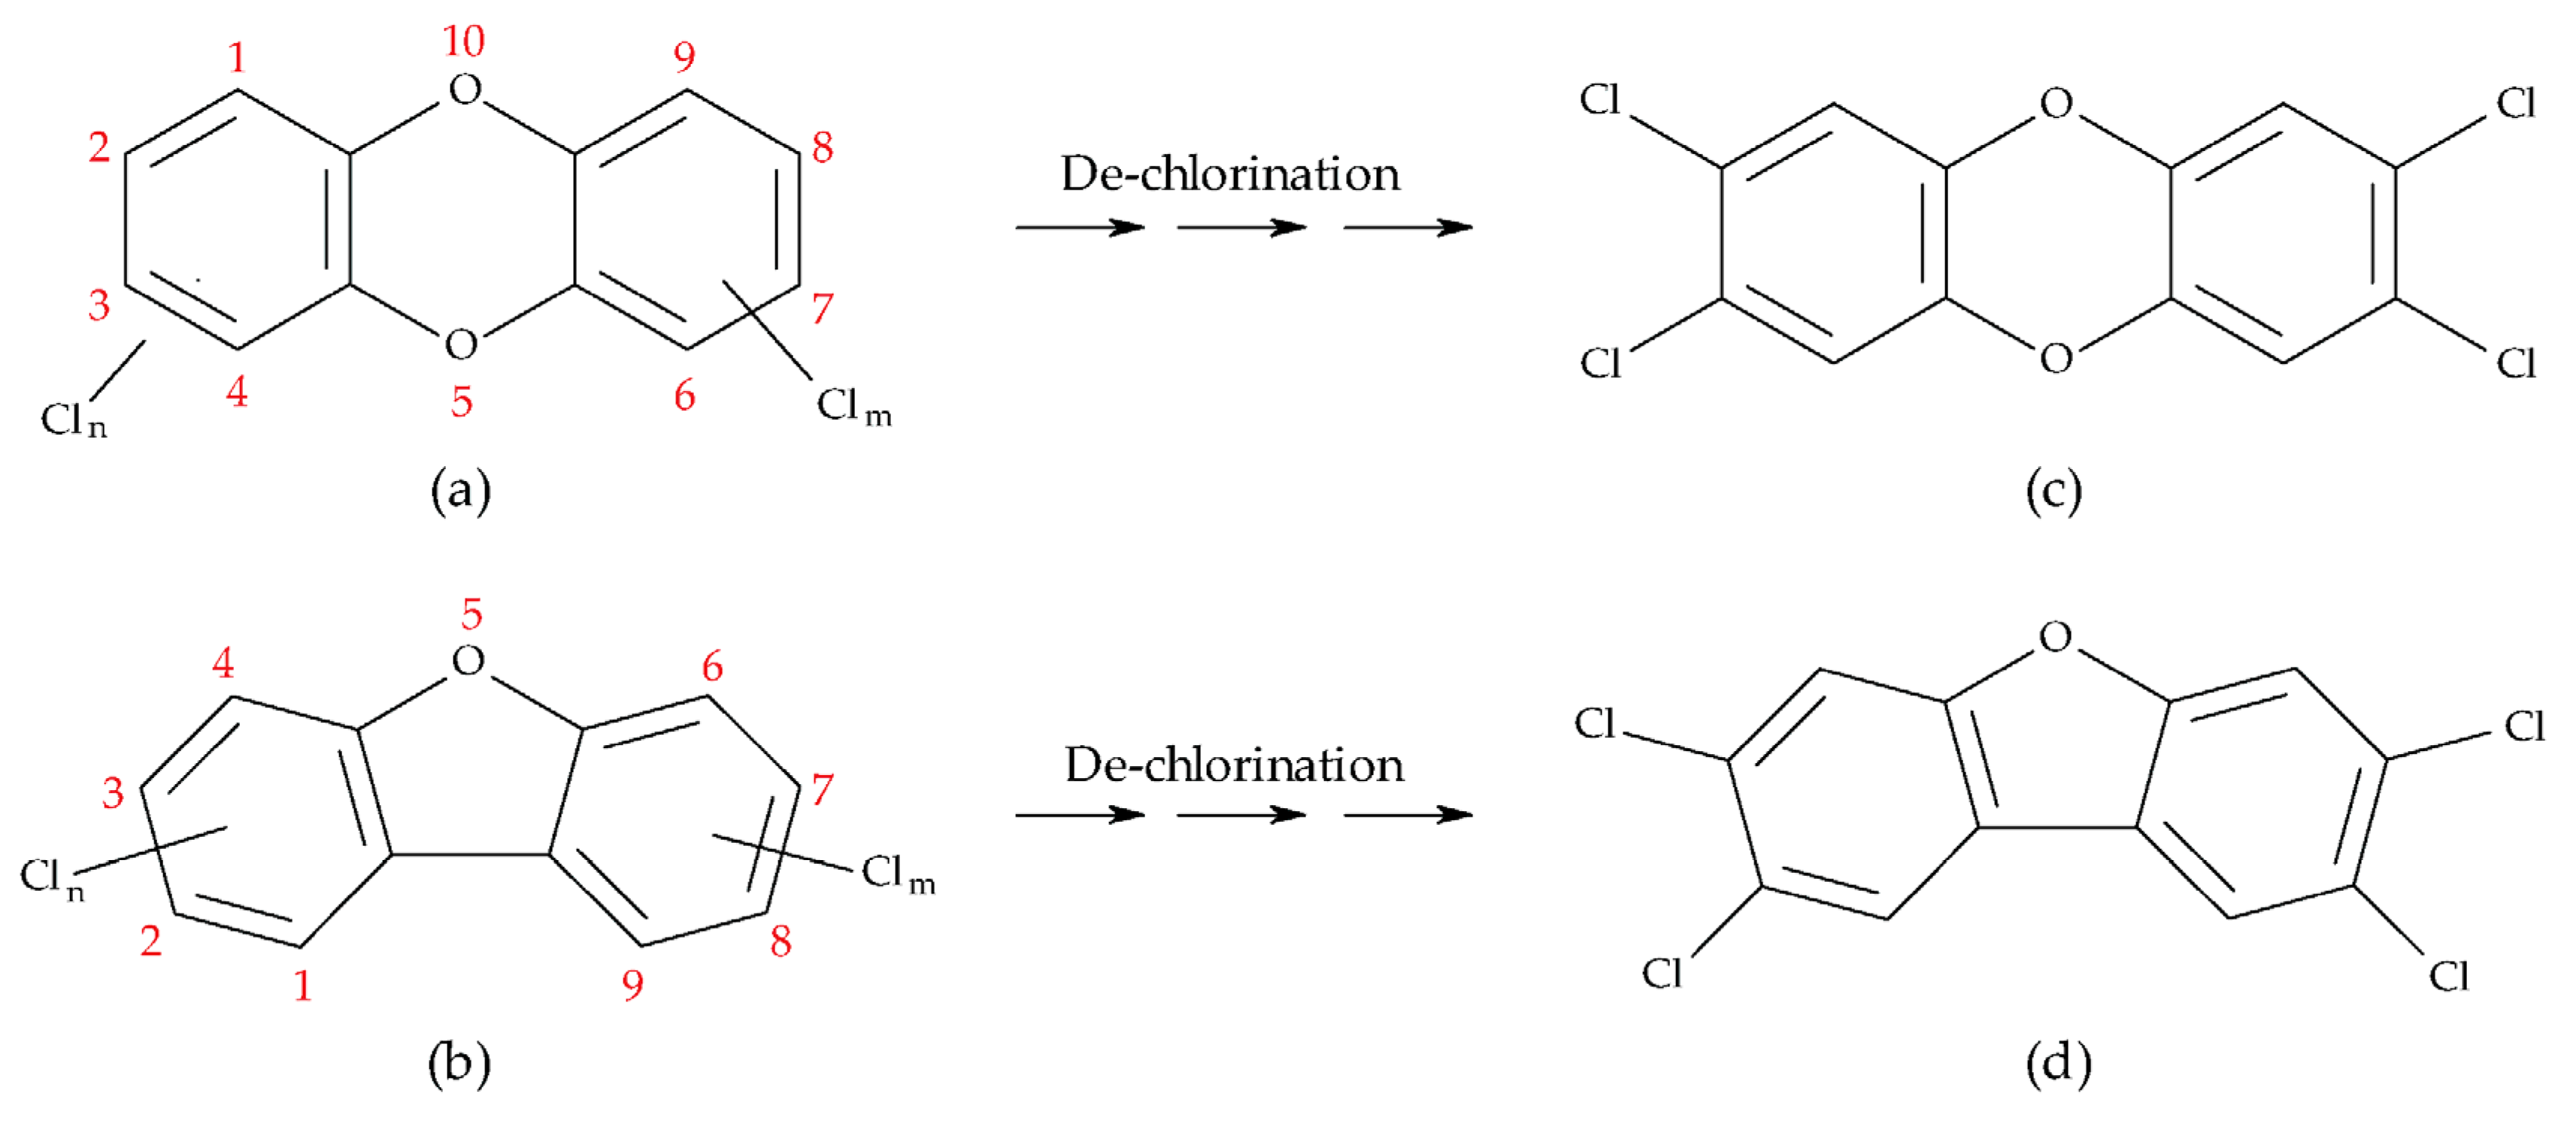
2.1. PCDD-Concentrations and Their Toxicity

The HTC has a strong influence on the concentrations of the different PCDD congeners (Figure 1, Table 1). The concentration of OCDD as the highest chlorinated PCDD is reduced gradually with increasing carbonization temperatures. The 1,2,3,4,6,7,8-HpCDD with 7 chlorinations shows an increase at 200 °C, followed by a decrease at 220 °C and 240 °C. The 3 congeners with 6 chlorinations (HxCDD) show an increase at 200 °C and 220 °C, followed by a decrease at 240 °C. The congener with 5 chlorinations (PeCDD) shows a strong, continuous increase from input to the 240 °C sample. The “Seveso dioxin” (2,3,7,8-TCDD) shows a slight decrease at 220 °C, followed by a strong increase at 240 °C.
Focusing on the toxicity of the PCDDs-contribution, Figure 2 gives a comparison of the sum PCDD concentrations and their toxicity, expressed as WHO-TEQ and I-TEQ. There is a strong shift in the PCDDs concentration profile of the different samples. A slight increase of the concentrations of the seven analyzed PCDDs at 200 °C is followed by a strong decrease at 220 °C and 240 °C. Although there is this strong decrease in the concentrations of the sum of these PCDD congeners by factor 10.5 the toxicity equivalent (WHO-TEQ) increases by factor 16.4.
I-TEQ the values have the same tendency, but are less high. This difference mainly depends on a lower TEF for 1,2,3,7,8-PeCDD in the I-TEF-system (see Appendix A, Table A1).
The results for PCDFs and PCBs are shown in the following figures as sums of the analyzed congeners for each HTC-treatment. Due to the significant lower concentration of PCDFs in the input, and the strong decrease by carbonization, the concentrations of single congeners are often below the limit of quantification. For PCBs the inconsistent change of concentrations of single congeners does not allow a visualization of the results analogously to Figure 1 for PCDDs.

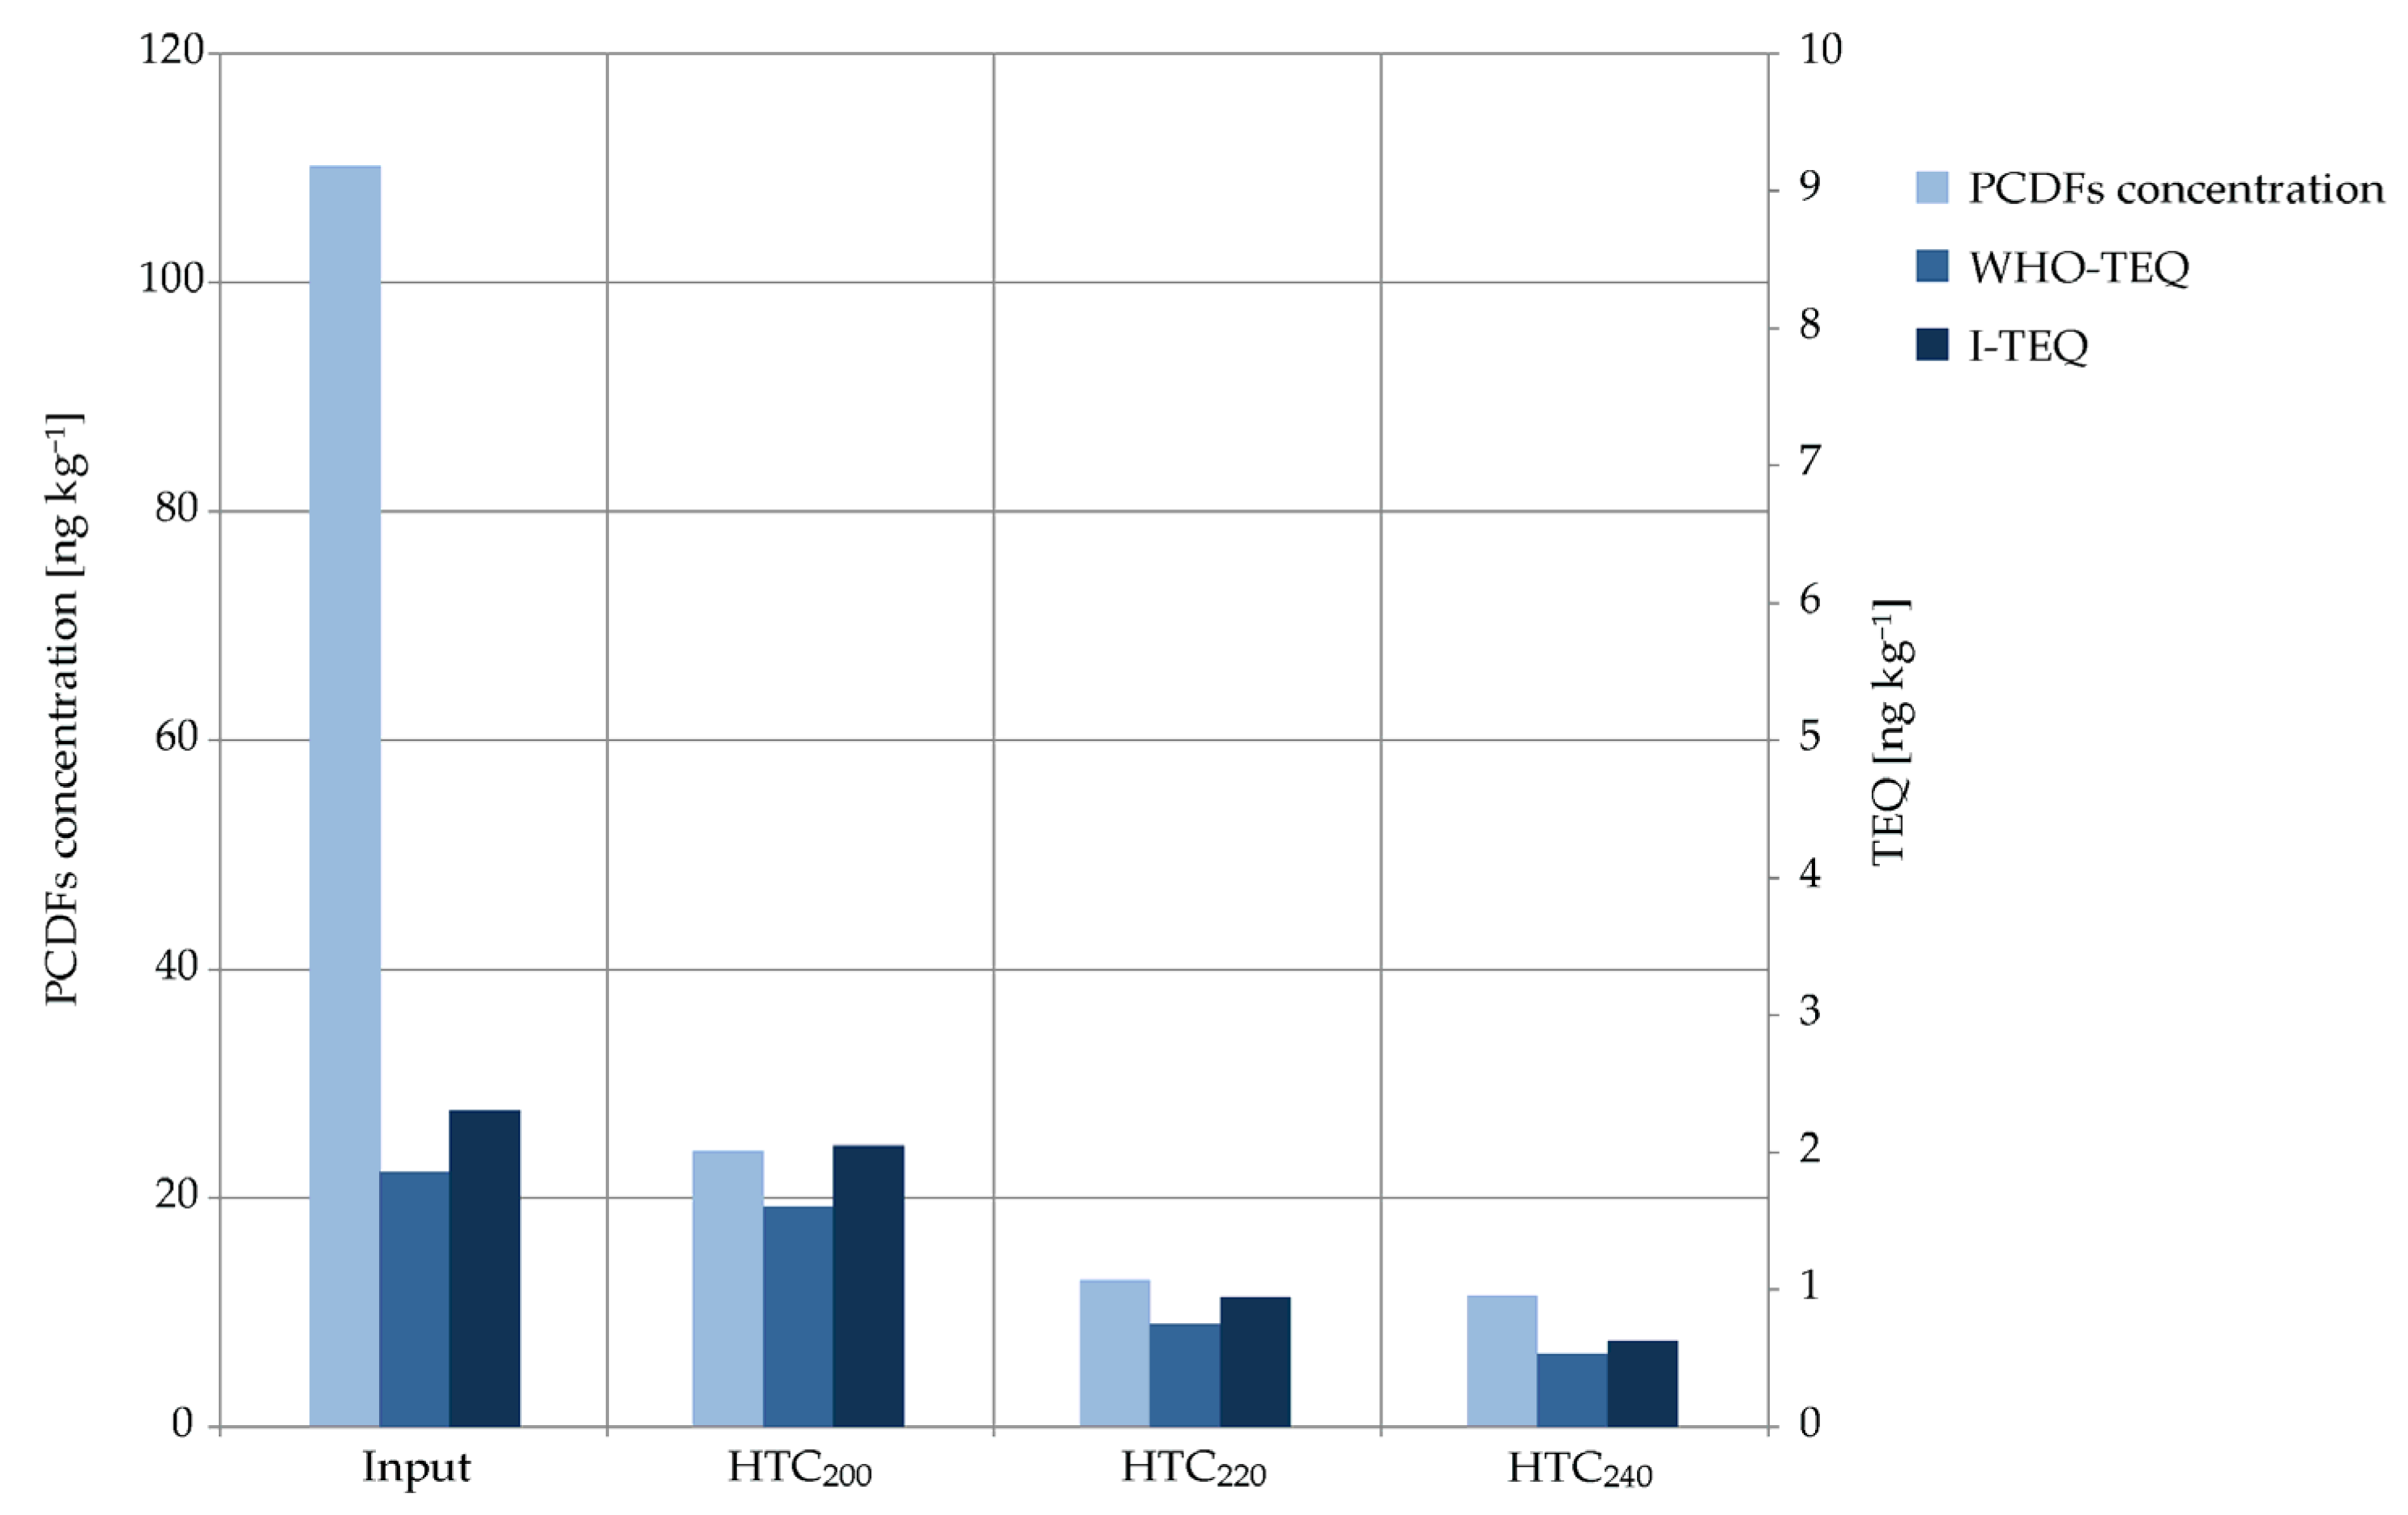
2.2. PCDF-Concentrations and Their Toxicity

Compared to the untreated SS, the concentrations of the sum of the ten PCDFs analyzed after the HTC treatment at 200 °C are already significantly reduced and further reduced at 220 °C and 240 °C (Figure 3). At a treatment temperature of 240 °C the concentration is reduced by factor 9.6 compared to the input material. The toxicity of the PCDFs (WHO-TEQ) also decreases with rising process temperature. At 200 °C the effect is less strong than for the concentration. For hydrochar generated at 220 °C and 240 °C the decrease of concentration and of toxicity correlates much better. At 240 °C, the overall toxicity is decreased by factor 3.5 whereas the toxicity per ng of the analyzed PCDFs increases by factor 2.7. It should be noted that the concentration of several congeners of hydrochars from 220 °C and 240 °C is reduced during the HTC-process below the quantification limits. In these cases, the congeners below the quantification limits were accounted to the TEQ with 50% of the quantification limit numerical value. For samples with low loads, values from quantification limits contribute up to 37% to single TEQs.
For the PCDFs there is a similar change in concentration of the congeners as seen for the PCDDs (Figure 2). The high concentration of highly chlorinated PCDFs decreases strongly. Different to the PCDDs, the concentration of lower chlorinated, higher toxic PCDFs does not increase (Table 1).
For the I-TEQ the toxicity also decrease, but are on a slightly higher level, dependent on the higher TEF for OCDF (see Appendix A, Table A1).

2.3. PCB-Concentrations and Their Toxicity

The total concentration of the twelve analyzed, dioxin-like PCBs is relatively stable regarding the four analyzed samples (Figure 4). Toxicity, however, expressed in WHO-TEQ, varies at different process temperatures. It increases strongly for the 200 °C sample (factor 10.3), is slightly reduced again for 220 °C (factor 6.8) and reaches almost the level of the input at 240 °C.
For the PCB there is no systematic pattern in the change of the concentration of the analyzed congeners. Some PCBs show a strong decrease (i.e., factor 1/33 for PCB 156), others a strong increase (i.e., factor 8 for PCB 169), and some have a relatively stable concentration (i.e., PCB 167) (see Table 1). The change in toxicity of the SS after HTC treatment mainly depends on the increase of the concentration of congener PCB 126 (3,3′,4,4′,5-PeCB) with the highest TEF of 0.1.

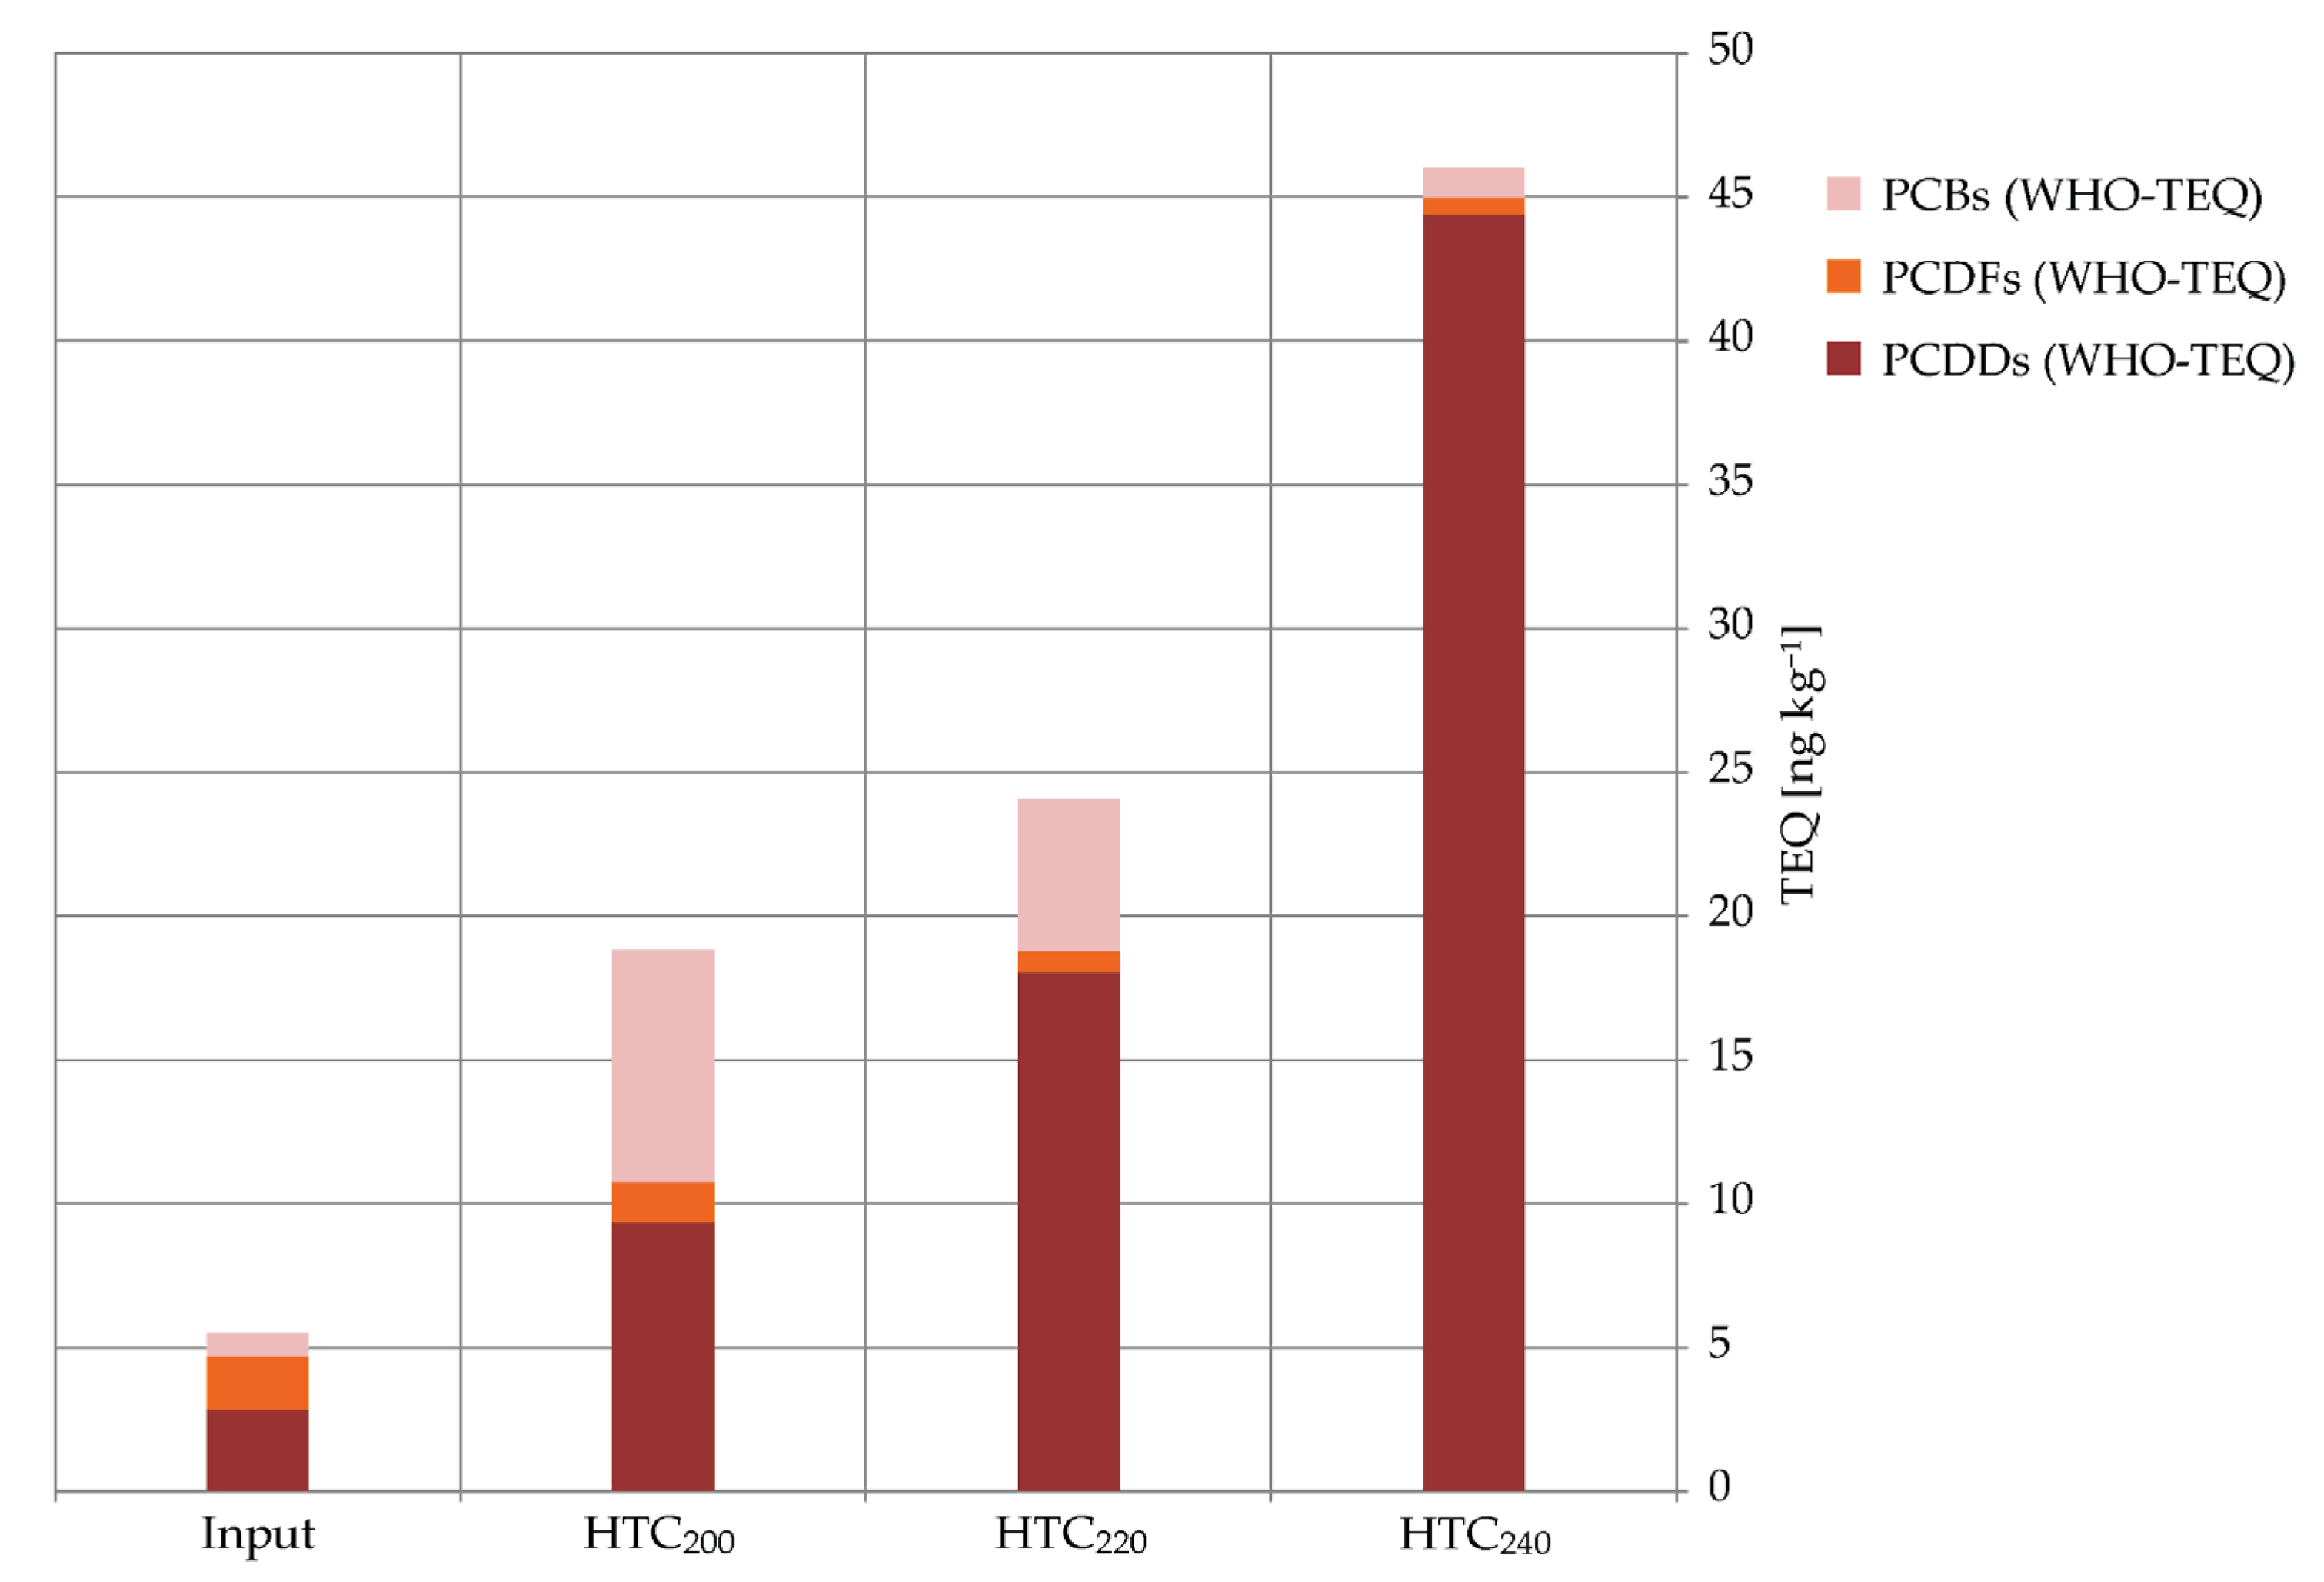
2.4. Total TEQ of the PCBs, PCDFs, and PCDD

The toxicity (WHO-TEQ) of the PCBs, PCDFs, and PCDDs can be summed up to a total TEQ, which is the relevant parameter for the legal limits and summarizes toxicity in a single value. As shown in Figure 5, the total TEQ is increasing from input to the hydrochar carbonized at 200 °C, followed by a slight increase for the material treated at 220 °C and a second significant increase for the HTC material carbonized at 240 °C. In total, the toxicity was about 9 times higher in the hydrochar after treatment at 240 °C compared to the input. Looking at the contribution of different substance groups, obviously the main toxicity derives from PCDDs in all materials. PCDFs contribute significantly less to the total toxicity and their influence is decreasing with increasing HTC temperatures. The PCBs show a different behavior with a very small share of total toxicity in the input and the hydrochar from 240 °C. With 42.2% and 22.0% of the total amount of TEQ significantly higher shares can be seen in the material treated at 200 and 220 °C, respectively.

3. Discussion

In recent years interest in HTC applications has increased and many studies have focused on the process issues, and structural and chemical properties of hydrochar. Investigations on the toxicity of hydrochars, especially the analyses of their contents of POPs, such as PCDD, PCDF and PCB, are often not taken into account. One argument is that there can be no neogenesis because the “dioxin window” of 300 °C to 600 °C is not reached in the HTC process [24]. Further arguments are the high costs for analysis and the low amounts of sample material from lab scale HTC reactors [23].
The results presented in this study show that the total toxicity induced by the HTC process can increase significantly (up to a factor of 9) at typical HTC temperatures of 240 °C and a reaction time of 5 h for the three POPs investigated.
The profile of the PCDD congeners shows a high concentration of highly chlorinated PCDDs with a relatively low toxicity in the input. After HTC at 200 °C, 220 °C and 240 °C the concentration of the highly chlorinated PCDDs (7 or 8 chlorines) is strongly reduced, while the concentration of the less chlorinated, higher toxic PCDDs (4 or 5 chlorines) increases slightly. For the PCDDs the “loss” of toxicity contributed by the highly chlorinated PCDDs is strongly overcompensated by an increase of toxicity from less chlorinated PCDDs in the hydrochars from 240 °C, while the total mass of dioxins is clearly reduced. Figure 6 shows the dechlorination effect for PCDDs which was also recognized by [15].
The profiles of the analyzed PCDFs also show a reduction of the concentration of the highly chlorinated, less toxic congeners (see Figure 1). In this case, however, the concentration of less chlorinated, more toxic PCDFs does not increase significantly. In general, the total TEQ of the PCDFs decreases with rising process temperatures. In Figure 6 the possible dechlorination effect of PCDFs is shown.
The picture is different for PCBs than for PCDDs and PCDFs. There is no strong decrease in mass for the sum of twelve analyzed PCBs. The very strong respectively strong increase of toxicity at material treated at 200 °C and 220 °C almost completely depends on the increased concentration of the most toxic PCB—the PCB 126 (3,3′,4,4′,5-PeCB). Assuming a similar behavior of the PCBs compared to the PCDD/Fs, HTC leads to dechlorination reactions from higher chlorinated PCBs to the more toxic and lower chlorinated congeners. These reactions seem to generate the highest concentrations of the most toxic congeners at 200 °C. The decreasing toxicity with increasing temperatures up to 240 °C indicates further degradation reactions to less toxic congeners.
Hydrochar could be used for different purposes. Using it as a fuel, combustion conditions could be set in a way to destroy PCDD/Fs. If the hydrochar is intended to be spread in the environment; e.g., as a soil conditioner—the contents of PCDD/Fs and PCBs should be controlled and legal regulations have to be considered. In this study, all concentrations and TEQ are normalized to the dry matter content of the input material, but when HTC material is distributed in the environment, the higher concentrations of POPs based on the dry matter of the actual material must be considered.
So far there are very few studies dealing with the change in POPs contamination during the HTC [15,24]. One reason is the demand of a minimum amount of sample material. In this study only the hydrochar was regarded. The amount of process water from the batch experiments was too low to achieve enough dry mass for analysis. The second reason not to analyze the process water was the assumption that PCDD/F and PCB are mainly found absorbed at the surface of solid matter due to their very low water solubility, which is also described in the theoretical model of Basso et al. [32]. Due to the very low solubility of POPs, the amount released into the liquid phase by HTC is ignored because of the higher amount adsorbed on the surface of the hydrochar during the process. Nevertheless the results give a new insight in the behavior of POPs in the HTC process and complement the findings of Tirler and Basso [15].

4. Materials and Methods

The HTC experiments were conducted at the University of Oldenburg (Germany). Laboratory test of the POP-concentrations were performed at the LUFA North-West Institute for soil and environment in Hameln (Germany). Finally, the analysis, interpretation, and presentation of toxicity development during the HTC of sewage sludge were carried out at HAWK-University (Germany).

4.1. HTC-Autoclaves

The HTC batch reactions were performed in stainless steel autoclaves with a polytetrafluoroethylene (PTFE) insert and a volume of 600 mL. After filling, the autoclaves were placed in a temperature-controlled oven for reaction, where they were rotated mechanically to mix the material. For the dewatering of the produced HTC-slurry a self-constructed press test stand was used.

4.2. Sewage Sludge

The sewage sludge analyzed and hydrothermally carbonized was provided by Stadtentwässerung Braunschweig (SE/BS) GmbH (Germany). The wastewater treatment plant “Steinhof” treats approximately 22 million m3 per year. A total of 140,000 inhabitants and 16,000 companies contribute their wastewater to this plant which corresponds to 275,000 population equivalents. The sludge was a digested sludge from the municipal waste water treatment plant in Braunschweig with a dry matter content of 27.8%. Larger quantities were obtained at different times, as storage and durability were to be guaranteed. Compositions and concentrations of the regarded POPs before HTC are given in Table 1.

4.3. Analysis of PCDD/Fs and Coplanar PCBs

To determine the potential change of toxic substances, which can be contained in sewage sludge, PCDD/F and PCBs were analyzed in the original material and after HTC-treatment at various temperatures. Since the main focus of the project was on the development of the HTC process only single determinations of each material were performed.
All samples were dried, homogenized, and spiked with 13C12 standards. Samples were extracted in soxhlet with toluene as a solvent. Afterwards the extracts were cleaned up in different steps. First, a sulphuric silica gel column was used to separate the organic substances. For the second and third clean up steps a carbon filter and an alumina column were used. After the addition of a 13C standard, the concentrated extract was used for GC-MS determination involving isotope dilution. The analysis was done with an Agilent 6890 N gas chromatograph, an Agilent-MSD 5973 N mass spectrometer (Agilent Technologies, Waldbronn, Germany) and a 60 m Agilent DB5-MS column. Further details of sample preparation and analysis are given in [33].
To estimate the toxicological effect of a material due to PCDD/Fs and PCBs contents, a single TEQ value is calculated from the results of the specified analyzed PCDD/F and PCB congeners. Therefore, the concentrations of the specified congeners are multiplied by toxicity equivalent factors (TEF) and the results are summarized to one toxicity equivalent (TEQ). In this study the WHO-TEF (2005) and the I-TEF (see Appendix A, Table A1) were used to allow a better comparison to other studies often using only one of the systems to calculate the PCDD/F-TEQ. Recent investigations usually rely on the WHO-system from 2005 as well as German regulations do. Due to the large number of PCDD/F and PCB congeners some of the analytical results are lower than the limits of quantification. To include those potential small amounts, for these values 50% of the value of the quantification limits were used to calculate the PCDD/F and PCB concentrations and TEQ.
Due to the loss of material by the HTC process that could be seen in decreasing amounts of dry matter, the results were calculated to the corrected dry matter basis. This is necessary for a comparison of the PCDD/F and PCB amounts in the input and the treated material.

5. Conclusions

During the HTC already present PCDD/Fs undergo a de-chlorination process where on the one hand the overall concentration declines whereas on the other hand the toxicity increases due to the higher toxicity factors of lower chlorinated congeners. The results indicate that HTC will increase the toxicity of material pre-polluted with POPs. Therefore, the process conditions and especially the composition and pre-pollution with POPs should be examined before a possible use of the hydrochar. If hydrochar is used as fuel, POPs should be destroyed during the incineration process anyway. Nevertheless, further studies should focus on the variation and pre-contaminations of input materials, process conditions during HTC and the influence of reaction time to underline or disprove the findings.

Author Contributions

H.B. and J.O. conceived and designed the experiments; J.O. performed the HTC experiments; the LUFA North-West Institute for soil and environment in Hameln performed the laboratory tests; all authors analyzed the resulting data; A.L. and V.Z. contributed material and analysis tools; H.B., F.G. and V.Z. wrote the paper; F.G. and V.Z. prepared the figures and tables; A.L. ultimately revised the paper.

Funding

We are thankful for financial support by the European Regional Development Fund (ERDF) and the Lower Saxonian Ministery for Science and Culture for the project “HTC in Niedersachsen”, within this study was carried out. We are also grateful for the financial support of the Göttinger Entsorgungsbetriebe (GEB) (Germany) for financing the laboratory test at the LUFA North-West.

Acknowledgments

We thank Helmut Appuhn from LUFA North-West Institute for soil and environment for conduction of the PCDD/F and PCB analyses. For covering the costs of publishing open access, we would like to thank Wolfgang Viöl, Head of the Research and Transfer Office of the HAWK-University of Applied Sciences and Arts in Hildesheim/Holzminden/Göttingen (Germany).

Conflicts of Interest

The authors declare no conflict of interest. The founding sponsors had no role in the design of the study; in the collection, analyses, or interpretation of data; in the writing of the manuscript, and in the decision to publish the results.

Appendix A

Table A1. Toxicity-Factors for PCDD characterized after WHO-TEF [30] and I-TEF [31].
CongenersWHO-TEF [-]I-TEF [-] CongenersWHO-TEF [-]I-TEF [-]
OCDD0.00030.001 2,3,3′,4,4′,5,5′-HpCB (189) 0.00003-
1,2,3,4,6,7,8-HpCDD0.010.01 3,3′,4,4′,5,5′-HxCB (169) 0.03-
1,2,3,7,8,9-HxCDD0.10.1 2,3′,4,4′,5,5′-HxCB (167) 0.00003-
1,2,3,6,7,8-HxCDD0.10.1 2,3,3′,4,4′,5′-HxCB (157) 0.00003-
1,2,3,4,7,8-HxCDD0.10.1 2,3,3′,4,4′,5-HxCB (156) 0.00003-
1,2,3,7,8-PeCDD10.5 3,3′,4,4′,5-PeCB (126) 0.1-
2,3,7,8-TCDD11 2′,3,4,4′,5-PeCB (123) 0.00003-
OCDF0.00030.001 2,3′,4,4′,5-PeCB (118) 0.00003-
1,2,3,4,7,8,9-HpCDF0.010.01 2,3,4,4′,5-PeCB (114) 0.00003-
1,2,3,4,6,7,8-HpCDF0.010.01 2,3,3′,4,4′-PeCB (105) 0.00003-
2,3,4,6,7,8-HxCDF0.10.1 3,4,4′,5-TCB (81) 0.00003-
1,2,3,7,8,9-HxCDF0.10.1 3,3′,4,4′-TCB (77) 0.00001-
1,2,3,6,7,8-HxCDF0.10.1
1,2,3,4,7,8-HxCDF0.10.1
2,3,4,7,8-PeCDF0.050.05
1,2,3,7,8-PeCDF0.50.5
2,3,7,8-TCDF0.10.1

References

  1. Kelessidis, A.; Stasinakis, A.S. Comparative study of the methods used for treatment and final disposal of sewage sludge in European countries. Waste Manag. 2012, 32, 1186–1195. [Google Scholar] [CrossRef] [PubMed]
  2. Verordnung über das Inverkehrbringen von Düngemitteln, Bodenhilfsstoffen, Kultursubstraten und Pflanzenhilfsmitteln. (Düngemittelverordnung—DüMV); Bundesministerium der Justiz und für Verbraucherschutz: Berlin, Germany, 2017.
  3. Gemeinschaftsveröffentlichung der DWA (Deutsche Vereinigung für Wasserwirtschaft; Abwasser und Abfall e. V. und des Statistischen Bundesamtes). Abwasser und Klärschlamm in Deutschland-Statistische Betrachtungen: Teil 2: Klärschlamm, Klärgas, Rechen-und Sandfanggut; The Federal Statistical Office: Wiesbaden, Germany, 2015.
  4. Wiechmann, B.; Dienemann, C.; Kabbe, C.; Brandt, S.; Vogel, I.; Roskosch, A. Sewage Sludge Management in Germany; German Environmental Agency: Dessau-Roßlau, Germany, 2015.
  5. Titirici, M.-M.; Thomas, A.; Antonietti, M. Back in the black: Hydrothermal carbonization of plant material as an efficient chemical process to treat the CO2 problem? New J. Chem. 2007, 31, 787–789. [Google Scholar] [CrossRef]
  6. Funke, A.; Ziegler, F. Hydrothermal carbonization of biomass: A summary and discussion of chemical mechanisms for process engineering. Biofuels Bioprod. Bioref. 2010, 4, 160–177. [Google Scholar] [CrossRef]
  7. Kruse, A.; Funke, A.; Titirici, M.-M. Hydrothermal conversion of biomass to fuels and energetic materials. Curr. Opin. Chem. Biol. 2013, 17, 515–521. [Google Scholar] [CrossRef] [PubMed]
  8. Kruse, A.; Dahmen, N. Hydrothermal biomass conversion: Quo vadis? J. Supercrit. Fluids 2017. [Google Scholar] [CrossRef]
  9. Libra, J.A.; Ro, K.S.; Kammann, C.; Funke, A.; Berge, N.D.; Neubauer, Y.; Titirici, M.-M.; Fühner, C.; Bens, O.; Kern, J.; et al. Hydrothermal carbonization of biomass residuals: A comparative review of the chemistry, processes and applications of wet and dry pyrolysis. Biofuels 2011, 2, 71–106. [Google Scholar] [CrossRef]
  10. Basso, D.; Patuzzi, F.; Castello, D.; Baratieri, M.; Rada, E.C.; Weiss-Hortala, E.; Fiori, L. Agro-industrial waste to solid biofuel through hydrothermal carbonization. Waste Manag. 2016, 47, 114–121. [Google Scholar] [CrossRef] [PubMed] [Green Version]
  11. Lucian, M.; Fiori, L. Hydrothermal Carbonization of Waste Biomass: Process Design, Modeling, Energy Efficiency and Cost Analysis. Energies 2017, 10, 211. [Google Scholar] [CrossRef]
  12. Fiori, L.; Basso, A.; Castelloa, D.; Baratierib, M. Hydrothermal Carbonization of Biomass: Design of a Batch Reactor and Preliminary Experimental Results. Chem. Eng. Trans. 2014, 37. [Google Scholar] [CrossRef]
  13. Kruse, A.; Zevaco, T. Properties of Hydrochar as Function of Feedstock, Reaction Conditions and Post-Treatment. Energies 2018, 11, 674. [Google Scholar] [CrossRef]
  14. Weiner, B.; Baskyr, I.; Poerschmann, J.; Kopinke, F.-D. Potential of the hydrothermal carbonization process for the degradation of organic pollutants. Chemosphere 2013, 92, 674–680. [Google Scholar] [CrossRef] [PubMed]
  15. Tirler, W.; Basso, A. Resembling a “natural formation pattern” of chlorinated dibenzo-p-dioxins by varying the experimental conditions of hydrothermal carbonization. Chemosphere 2013, 93, 1464–1470. [Google Scholar] [CrossRef] [PubMed]
  16. Conte, P.; Hanke, U.M.; Marsala, V.; Cimo, G.; Alonzo, G.; Glaser, B. Mechanisms of water interaction with pore systems of hydrochar and pyrochar from poplar forestry waste. J. Agric. Food Chem. 2014, 62, 4917–4923. [Google Scholar] [CrossRef] [PubMed] [Green Version]
  17. Rex, D.; Schimmelpfennig, S.; Jansen-Willems, A.; Moser, G.; Kammann, C.; Müller, C. Microbial community shifts 2.6 years after top dressing of Miscanthus biochar, hydrochar and feedstock on a temperate grassland site. Plant Soil 2015, 397, 261–271. [Google Scholar] [CrossRef]
  18. Egle, L.; Rechberger, H.; Krampe, J.; Zessner, M. Phosphorus recovery from municipal wastewater: An integrated comparative technological, environmental and economic assessment of P recovery technologies. Sci. Total Environ. 2016, 571, 522–542. [Google Scholar] [CrossRef] [PubMed]
  19. Cordell, D.; Drangert, J.-O.; White, S. The story of phosphorus: Global food security and food for thought. Glob. Environ. Chang. 2009, 19, 292–305. [Google Scholar] [CrossRef]
  20. Cordell, D.; White, S. Peak Phosphorus: Clarifying the Key Issues of a Vigorous Debate about Long-Term Phosphorus Security. Sustainability 2011, 3, 2027–2049. [Google Scholar] [CrossRef] [Green Version]
  21. Schoumans, O.F.; Bouraoui, F.; Kabbe, C.; Oenema, O.; van Dijk, K.C. Phosphorus management in Europe in a changing world. Ambio 2015, 44 (Suppl. 2), 92. [Google Scholar] [CrossRef] [PubMed]
  22. Federal Law Gazette I Sewage Sludge Ordinance (Verordnung über Die Verwertung von Klärschlamm, Klärschlammgemisch und Klärschlammkompost. (Klärschlammverordnung—AbfKlärV)); Federal Law Gazette I: Berlin, Germany, 2017.
  23. Wiedner, K.; Naisse, C.; Rumpel, C.; Pozzi, A.; Wieczorek, P.; Glaser, B. Chemical modification of biomass residues during hydrothermal carbonization—What makes the difference, temperature or feedstock? Org. Geochem. 2013, 54, 91–100. [Google Scholar] [CrossRef]
  24. Poerschmann, J.; Weiner, B.; Woszidlo, S.; Koehler, R.; Kopinke, F.-D. Hydrothermal carbonization of poly(vinyl chloride). Chemosphere 2015, 119, 682–689. [Google Scholar] [CrossRef] [PubMed]
  25. Fiedler, H. Existierende dioxininventare weltweit und neue methodik zur erstellung von vergleichbaren und vollständigen emissionsinventaren. UWSF Z Umweltchem Ökotox 2001, 13, 88–94. [Google Scholar] [CrossRef]
  26. Behnke, A.; Böhnhardt, A.; Bernd, M.; Bussian, K.B.; Dauert, U.; Fettig, I.; Gärtner, P.; Giese, E.; Juhrich, K.; Konietzka, R.; et al. Dioxine und Dioxinähnliche PCB in Umwelt und Nahrungsketten; Umweltbundesamt: Dessau, Germany, 2017. [Google Scholar]
  27. Rogers, H.R. Sources, behaviour and fate of organic contaminants during sewage treatment and in sewage sludges. Sci. Total Environ. 1996, 185, 3–26. [Google Scholar] [CrossRef]
  28. USEPA. Statistical Support Document for the Development of Round 2 Biosolids Use or Disposal Regulations; USEPA: Washington, DC, USA, 2002.
  29. Dai, J.; Xu, M.; Chen, J.; Yang, X.; Ke, Z. PCDD/F, PAH and heavy metals in the sewage sludge from six wastewater treatment plants in Beijing, China. Chemosphere 2007, 66, 353–361. [Google Scholar] [CrossRef] [PubMed]
  30. Van den Berg, M.; Birnbaum, L.S.; Denison, M.; de Vito, M.; Farland, W.; Feeley, M.; Fiedler, H.; Hakansson, H.; Hanberg, A.; Haws, L.; et al. The 2005 World Health Organization reevaluation of human and Mammalian toxic equivalency factors for dioxins and dioxin-like compounds. Toxicol. Sci. 2006, 93, 223–241. [Google Scholar] [CrossRef] [PubMed]
  31. Kutz, F.W.; Barnes, D.G.; Bottimore, D.P.; Greim, H.; Bretthauer, E.W. The international toxicity equivalency factor (I-TEF) method of risk assessment for complex mixtures of dioxins and related compounds. Chemosphere 1990, 20, 751–757. [Google Scholar] [CrossRef]
  32. Basso, D.; Ragazzi, M.; Rada, E.C.; Fiori, L. Release of PCDD/Fs during a hydrothermal carbonization process of organic waste residues. UPB Sci. Bull. Ser. D Mech. Eng. 2014, 76, 199–212. [Google Scholar]
  33. Janßen, E. Umweltanalytik; VDLUFA-Verl.: Darmstadt, Germany, 2011. [Google Scholar]
Figure 1. Concentrations of the PCDDs in the investigated sewage sludge (Input) and hydrochars produced at different temperatures (HTC200–HTC240).
Energies 11 01582 g001
Figure 2. PCDD-concentrations (sum of seven analyzed congeners) compared to the resulting toxicity, calculated as WHO-TEQ and the NATO-I-TEQ.
Energies 11 01582 g002
Figure 3. PCDF-concentrations (sum of ten analyzed PCDF congeners) compared to the resulting toxicity, calculated as WHO-TEQ and the NATO-I-TEQ.
Energies 11 01582 g003
Figure 4. Concentration of the twelve analyzed PCB congeners compared to their toxicity, calculated as WHO-TEQ.
Energies 11 01582 g004
Figure 5. Total TEQ in the input and the hydrochars samples after carbonization, calculated by the summation of the WHO-TEQ of PCBs, PCDFs and PCDDs.
Energies 11 01582 g005
Figure 6. Structure of Polychlorinated dibenzo-p-dionins (a) and dibenzofurans (b) and the formation of 2,3,7,8-Tetrachlorodibenzo-p-dioxin (c) and 2,3,7,8-Tetraclorodibenzofuran (d) by dechlorination as a possible pathway of increasing toxicity.
Energies 11 01582 g006
Table 1. Concentrations of polychlorinated dibenzo-dioxins (PCDDs), polychlorinated dibenzo-furans (PCDFs), and polychlorinated biphenyls (PCBs) in the sewage sludge (input) and in the hydrochar after carbonization and liquid-solid separation of the sewage sludge based on dry matter.
Persistent Organic Pollutants Input Hydrochar 200 °C,5 h Hydrochar 220 °C,5 h Hydrochar 240 °C,5 h
ContentWHO-TEQ 2 Content 1Δ InputWHO-TEQ 2 Content 1Δ InputWHO-TEQ 2 Content 1Δ InputWHO-TEQ 2
Congeners [ng/kg][ng/kg] [ng/kg][%][ng/kg] [ng/kg][%][ng/kg] [ng/kg][%][ng/kg]
PCDDs2,3,7,8-TCDD <0.50.25 0.51040.52 0.369740.37 4.028044.02
1,2,3,7,8-PeCDD <0.50.25 2.14232.12 6.9213836.92 34.3686134.3
1,2,3,4,7,8-HxCDD <10.05 8.58540.85 13.813851.38 2.22200.22
1,2,3,6,7,8-HxCDD 3.80.38 13.13461.31 24.86522.48 195011.90
1,2,3,7,8,9-HxCDD 1.90.19 115761.1 46.624514.66 39.420733.94
1,2,3,4,6,7,8-HpCDD 1271.27 3262563.26 2171712.17 5.9550.059
OCDD 11040.331 1067970.32 131120.039 13.310.004
Σ PCDDs 12382.72 1428 9.47 440 18 118 44.5
PCDFs2 ,3,7,8-TCDF 1.70.17 2.181280.218 2.281340.228 2.031190.203
1,2,3,7,8-PeCDF 1.10.033 1.161060.035 0.575520.017 <0.79720.012
2,3,4,7,8-PeCDF 1.90.57 2.071090.622 0.909480.273 0.436230.131
1,2,3,4,7,8-HxCDF 2.50.25 1.83730.183 <1.1440.055 <0.5200.025
1,2,3,6,7,8-HxCDF 2.10.21 1.69800.169 <0.5240.025 <0.5240.025
1,2,3,7,8,9-HxCDF 2.30.23 <0.68300.034 <0.5220.025 <1.26550.063
2,3,4,6,7,8-HxCDF <10.05 2.722720.272 1.021020.102 <1.021020.051
1,2,3,4,6,7,8-HpCDF 30.40.304 6.17200.062 <270.01 <270.01
1,2,3,4,7,8,9-HpCDF 20.02 21000.01 <21000.01 <21000.01
OCDF 65.60.02 10150.0015 <10150.0015 <10150.0015
Σ PCDFs 1101.86 24.2 1.61 12.8 0.75 11.5 0.53
PCBsPCB 77 1540.015 2261460.023 3352180.034 8615590.086
PCB 81 <200.003 <201000.003 <201000.003 <201000.003
PCB 105 6890.021 609880.018 7311060.022 679990.020
PCB 114 53.80.002 56.71050.002 49.3920.001 20.3380.001
PCB 118 25530.077 1909750.057 2281890.068 2168850.065
PCB 123 49.10.001 19.5400.001 60.61230.002 1262570.004
PCB 126 5.810.581 77.413327.74 51.18805.11 <3520.15
PCB 156 7490.022 8421120.025 350470.011 18.830.001
PCB 157 88.80.003 1181320.004 1351520.004 1231390.004
PCB 167 3100.009 3311070.01 3691190.011 3111000.009
PCB 169 <30.045 5.751920.172 <31000.045 23.97950.716
PCB 189 1440.004 131910.004 58.1400.002 <30210.000
Σ PCBs 48080.78 4334 8.06 4431 5.31 4357 1.06
1 content is corrected to dry matter of input due to the losses through HTC; 2 values below the quantification limit were calculated with half the numerical value of the quantification limit.

