Permanent Magnet Synchronous Motor with Different Rotor Structures for Traction Motor in High Speed Trains

1
Department of Electrical Engineering (DEE), Universitat Politècnica de Catalunya UPC BARCELONATECH, EPSEVG, Víctor Balaguer 1, 08800 Vilanova i la Geltrú, Barcelona, Spain
2
Faculty of Civil Engineering, Universitat Politècnica de Catalunya UPC EPSEVG, Víctor Balaguer 1, 08800 Vilanova i la Geltrú, Barcelona, Spain
*
Author to whom correspondence should be addressed.
Energies 2018, 11(6), 1549; https://doi.org/10.3390/en11061549
Submission received: 15 May 2018
/
Revised: 11 June 2018
/
Accepted: 11 June 2018
/
Published: 13 June 2018
(This article belongs to the Section F: Electrical Engineering)
Abstract
:In this work we proposed to study the use of permanent magnet synchronous motors (PMSM) for railway traction in the high-speed trains (HST) of Renfe Operadora (the Spanish national railway operator). Currently, induction motors (IM) are used in AVE classes 102–112 trains, so, the IM used as a traction motor in these trains has been studied and characterized by comparing the results with data provided by Renfe. A PMSM of equivalent power to the IM has been dimensioned, and different electromagnetic structures of the PMSM rotor have been evaluated. The simulation by the finite element method and analysis of the equivalent electrical circuit used in all the motors have been studied to evaluate the performance of the motors in this application. Efficiency is calculated at different operating points due to its impact on the energy consumption of railway traction. The implementation of the PMSM evaluated is recommended, mainly due to the improvements achieved in efficiency as compared with the IM currently used.
1. Introduction
The use of electrical drives in electric traction for high-speed trains has evolved from DC drives to AC drives [1,2]. One of the main reasons AC drives are used is due to the evolution of power electronics applied to these drives, for example, the functional improvement of inverters and the use of vector control techniques. In addition, it is worth highlighting the lower maintenance requirements and greater reliability, as well as the high efficiency and power density offered by AC drives [3]. Among AC drives, IM was mainly used initially, but the trend in recent years has been to use PMSM, initially with excitation using coils and later with excitation using permanent magnets [4]. Examples of this evolution are the TGV trains in France, where DC drives have been used in the TGV Paris–South East (year 1981, with motors of 535 kW and power density 2.9 kg/kW), AC drives with synchronous motor of rotor wound in the TGV Atlantique (year 1989, with motors of 1130 kW and power density 1.35 kg/kW), AC drives with asynchronous motor in the Eurostar (year 1994, with motors of 1020 kW and power density 1.23 kg/kW), and AC drives with permanent magnet synchronous motor in the AGV (year 2004, with motors of 760 kW and power density 1 kg/kW).
The current trend seems to indicate that in the coming years drives with PMSM will be used in the HST preferentially [5,6]. A new trend, still in the experimental phase, points to the possibility of using linear synchronous motors with permanent magnets, also incorporating superconducting materials [7].
In the beginning of the Spanish High Speed, Renfe used salient pole synchronous motors. However, the trains are currently being fitted with induction traction motors. Recently, HST have been fitted with permanent magnet synchronous motors, just like French and Italian AGV trains.
The PMSMs give high efficiency and a better power/weight ratio (power density) with higher manufacturing and materials cost. Permanent magnet synchronous motors [8,9] appear as an interesting alternative for several reasons, such as: the elimination of rotor copper losses, increased efficiency, higher power density, lower rotor momentum of inertia and the possibility of using regenerative brakes even at low speeds. On the other hand, PMSMs have several disadvantages, such as the constant flux provided by the magnets and high costs due to the increased price of rare-earth magnets. PMSMs can be classified according to magnet arrangements, i.e., surface magnets, and interior magnets with radial or tangential magnetization. Surface-mounted permanent magnet motors behave like synchronous motors with a cylindrical rotor, where the torque is solely obtained by the interaction between the rotor flux and stator current. Similar to salient pole synchronous motors, the reluctance torque must be considered in interior permanent magnet motors.
This work studies the alternative use of a PMSM in place of the IM used in AVE trains of classes 102–112. Initially, the behavior of the IM currently used was analyzed [10]. Parametric estimations of similar traction motors were conducted when there was a lack of necessary technical data. The electromagnetic structure of the IM was simulated by the finite element method, the operation was analyzed from its equivalent circuit, and finally, the results from the calculations of model were compared with actual test bench measurements of the motor. Additionally, iron and mechanical losses were also analyzed and compared with actual measurements, and hence, the procedure of calculations used in the IM was verified in order to apply it to the PMSM.
Instead of IM, the alternative use of a PMSM was proposed. Three different magnet arrangements were considered for the PMSM: surface magnets, and interior magnets with radial or tangential magnetization. The analysis of these structures involved the simulation of their electromagnetic structures and application of methods to quantify motor losses. A power balance was also used to calculate the efficiency and power density.
Finally, the functional performance of the proposed PMSM and the IM were compared and the cost of manufacturing materials was evaluated.
2. AVE Trains Classes 102-112
3. Induction Motor Used in AVE Trains
The nominal data of IM implemented in the above trains are given in Table 2. More information about this motor can be found in the Appendix A.
The IM has been simulated by the finite element method. The losses and efficiency have been evaluated through a complete equivalent circuit. The results obtained in this analysis have been compared with the data provided by the manufacturer which confirm the validity of the proposed method. In addition, the method used for the calculation of mechanical and iron losses can be applied subsequently to the proposed PMSM analysis.
3.1. Finite Element Simulation
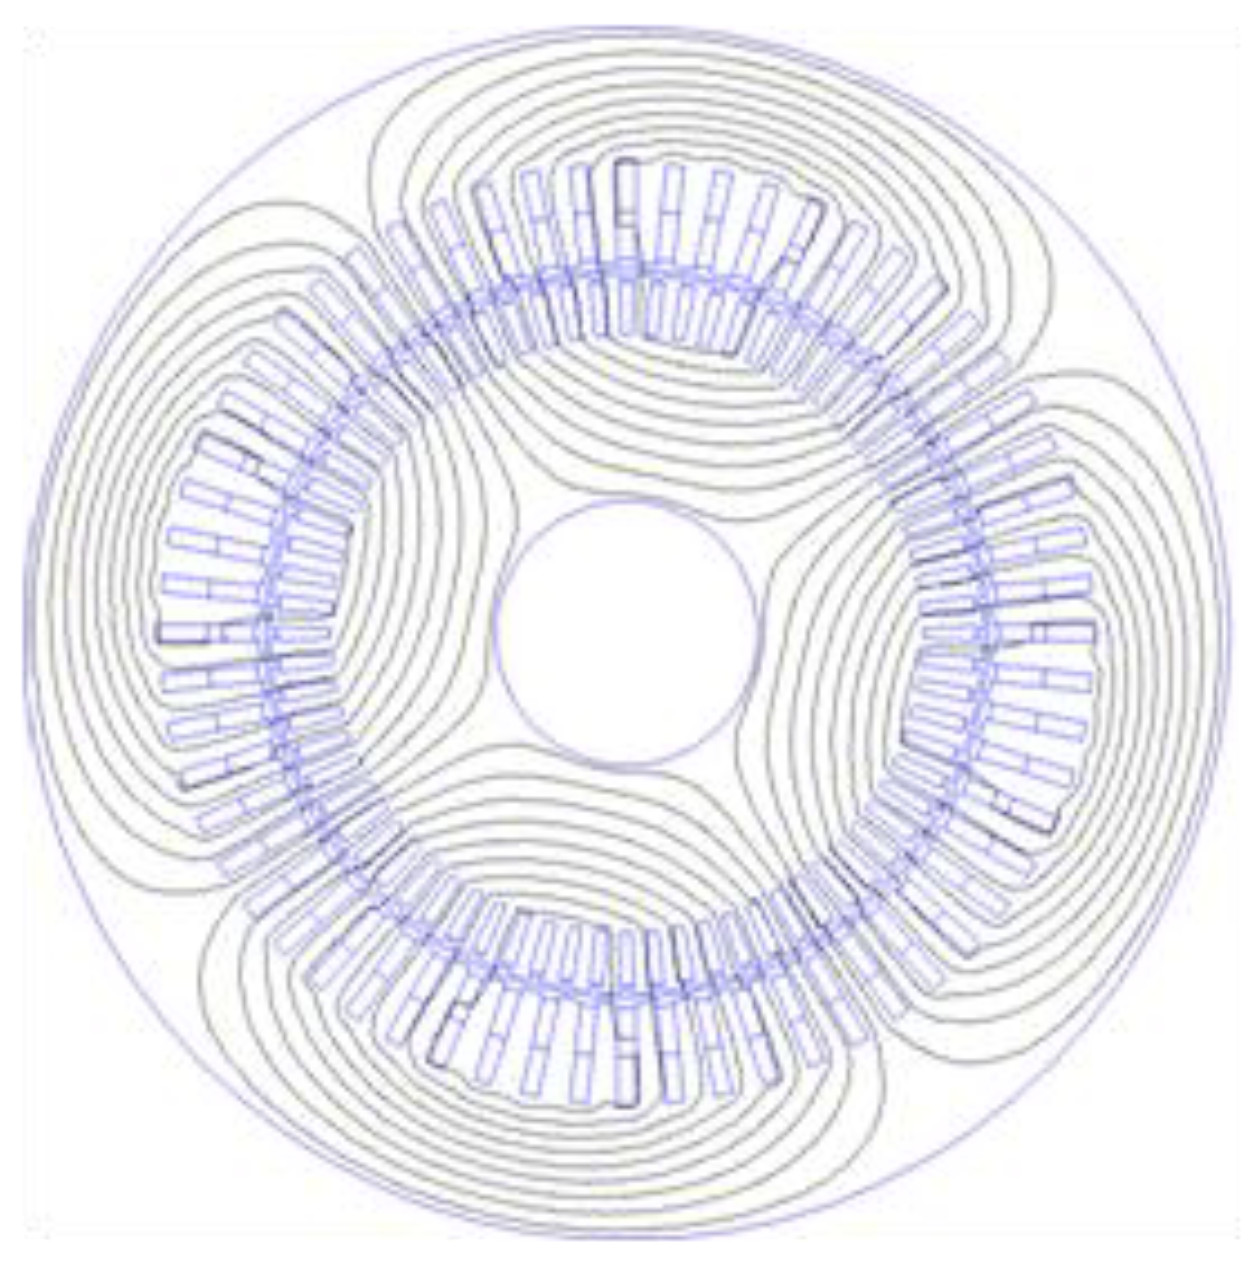
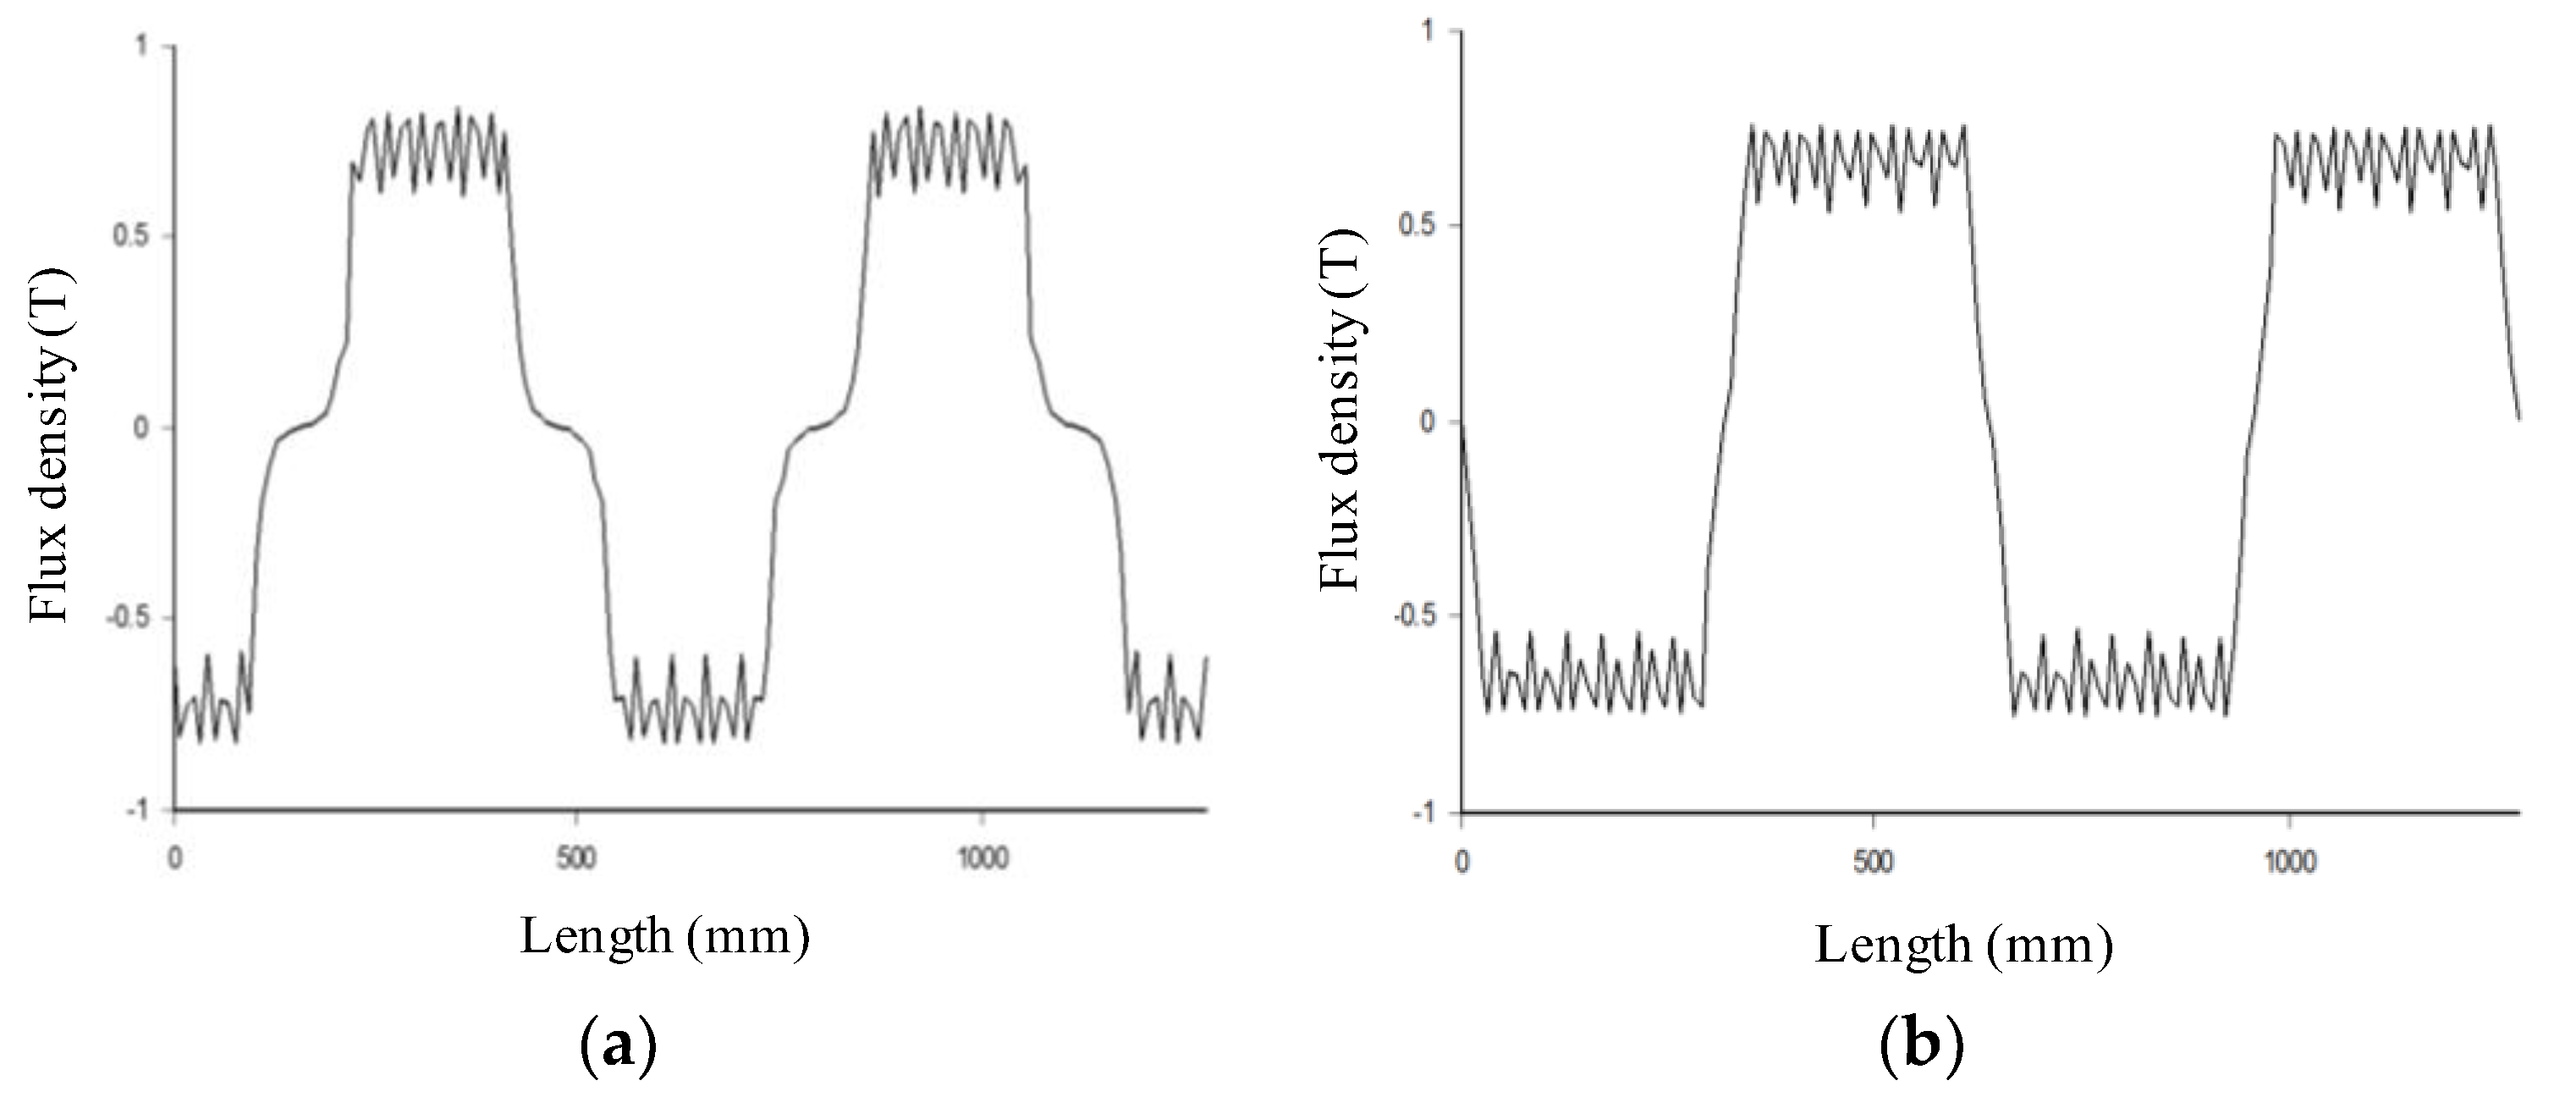
Load and no-load operations of the motor was simulated. Figure 2 shows the results of no-load flux line distribution and Figure 3 illustrates air gap induction. Static torque was obtained from the load simulations at a rated current in the stator and in the rotor for different rotor positions as shown in Figure 4.
The results shown in these simulations have been compared with those provided by the motor manufacturer which confirms the good behavior of the simulation model. The values of the air gap flux and the flux density are suitable for the type of magnetic sheet used. The values of the static torque meet the requirements of torque necessary for the train’s traction curve.
3.2. Calculation of Mechanical and Iron Losses
Mechanical losses can be divided into bearing and ventilation losses, which are directly proportional to the speed of the machine. Accurate determination of such losses is a complex task, but certain empirical expressions can provide satisfactory approximations. These expressions include coefficients that vary with machine type, size, ventilation system, etc.
Based on the expressions in [11], the bearing losses (Pc) can be calculated from:
where N is the speed (rpm), dc is the axis diameter (cm), nc is the number of bearings, and kc is the coefficient depending on motor type (between 0.02 and 0.2).
Ventilation losses (Pvent) are calculated by the following expression:
with:
where pair is the dissipation loss (W), vx is the fan tangential speed (m/s), Dv is the fan outer diameter (m), kvent is the coefficient depending on motor type and ventilation system (between 15,000 and 150,000), and exp is the coefficient depending on motor type and ventilation system (between 2 and 3).
Due to the computational complexity, dissipation losses can be calculated from the output power and estimated efficiency of the motor during operation.
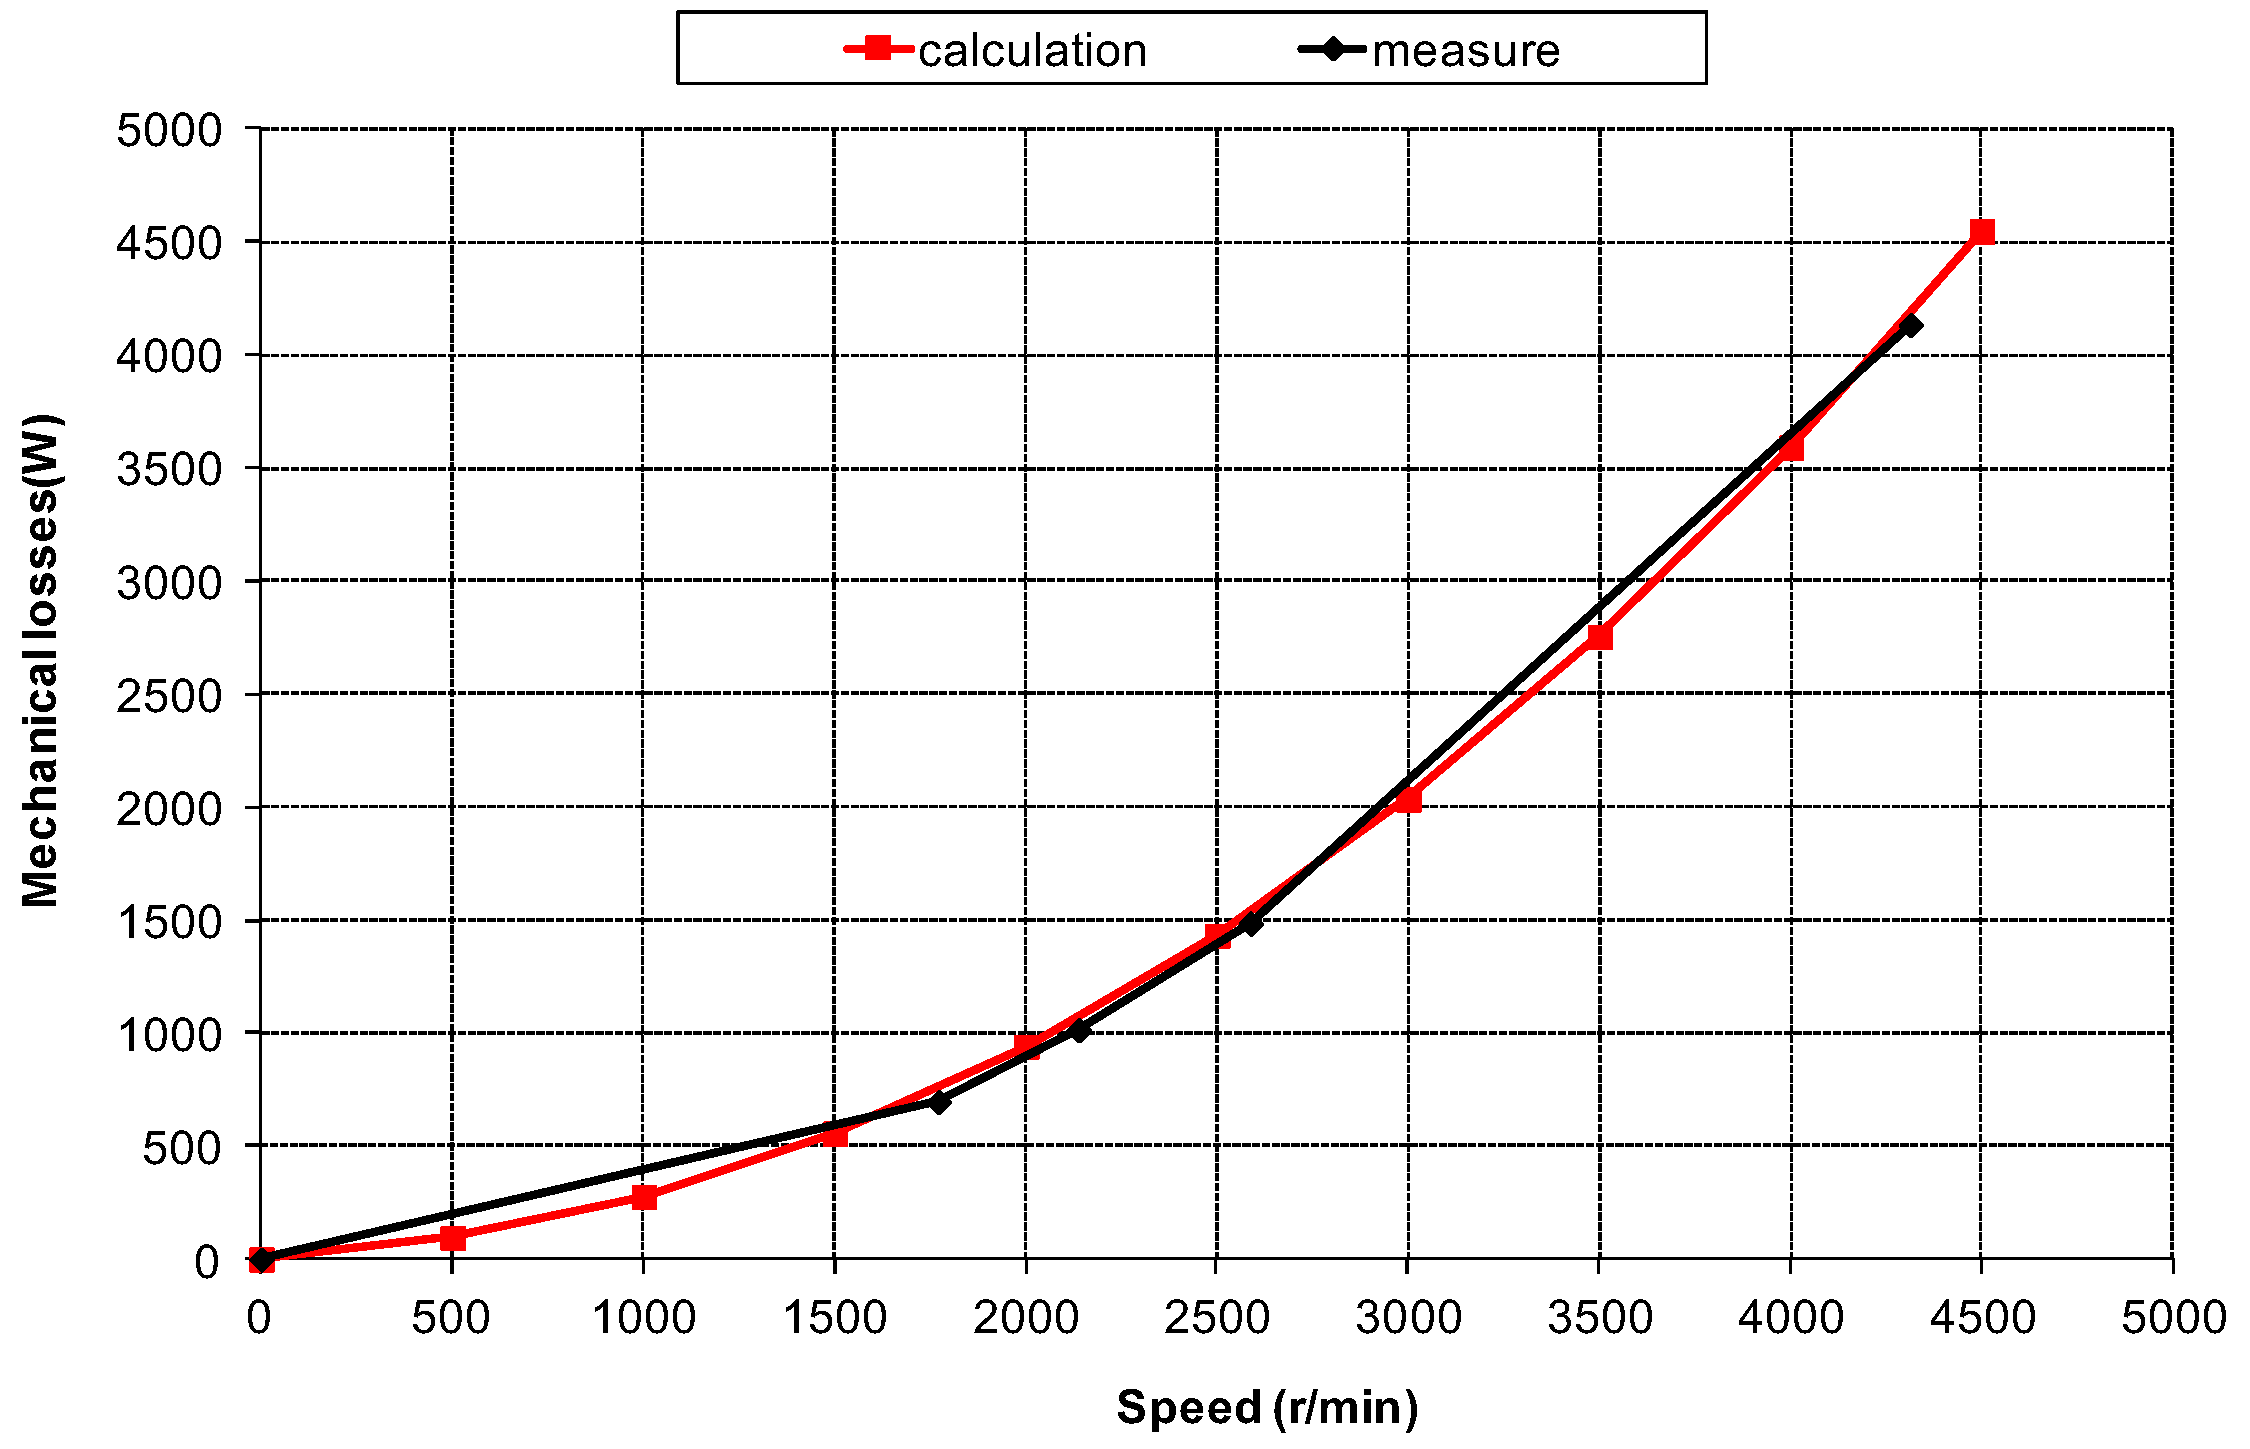
Mechanical losses obtained from manufacturer tests were compared with the results of Equations (1)–(3) as shown in Figure 5, where an excellent fit was verified between the analytical results and the experimental tests by manufacturer.
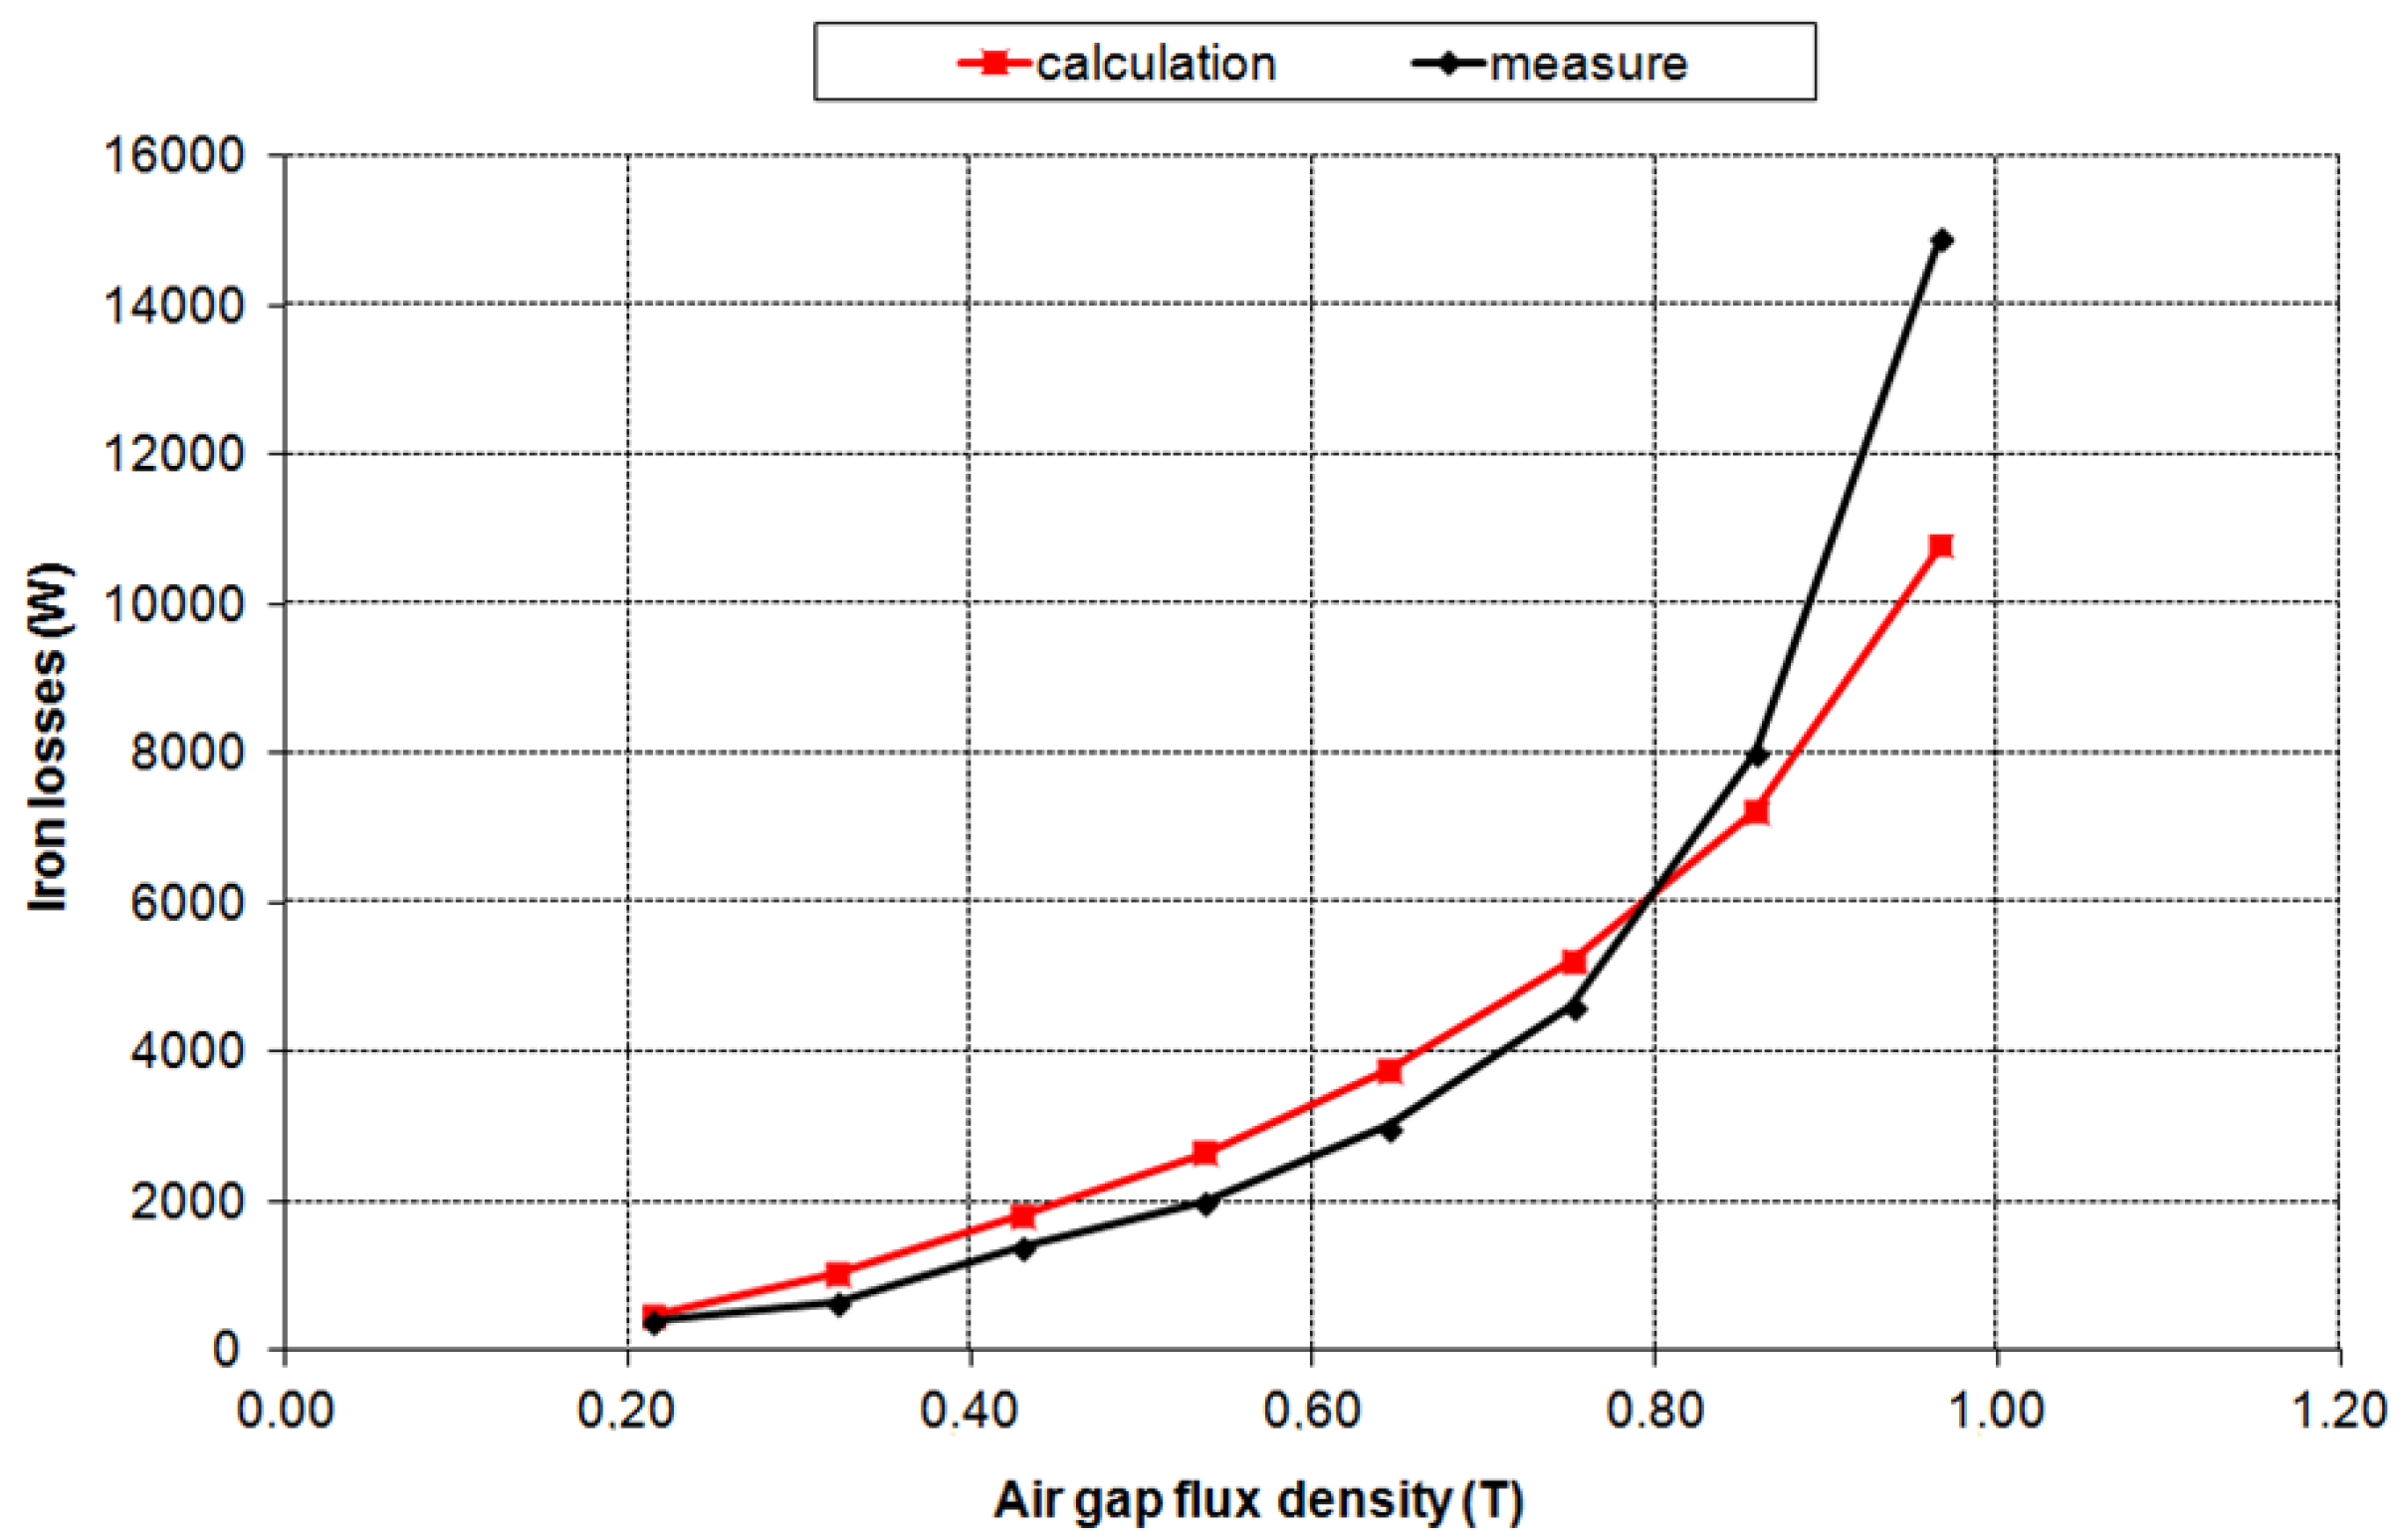
Iron losses can be approximately calculated by Steinmetz equations [12]. These equations can be used in the presence of sinusoidal or low harmonic waveforms. Since the measurements of the manufacturer laboratory tests were made under sinusoidal excitation, Steinmetz equations’ parameters were fitted to obtain the analytical results of losses, which were then compared with experimental measurements.
Hysteresis losses (Phis) were calculated by Steinmetz equation:
where kh is the loss constant of the material (between 2 and 5), a is the frequency exponent (between 1 and 1.2), and n is the induction exponent (between 1.8 and 2).
Equation (4) was separately applied to different regions of the motor, i.e., stator yoke, rotor yoke, stator teeth and rotor teeth. In these regions the induction was estimated by finite element simulation. Total losses were obtained by multiplying the specific losses (W/kg) by the weight of iron in each region.
Eddy current losses (Pfou) were calculated by the following Steinmetz equation:
where kf is the loss constant of the material (between 10 and 100), e is the sheet thickness (m), and x, y, z are the exponents eddy current losses (between 2 and 2.2).
The material of the electrical steel used in manufacturing of the induction motor is the M-19 (nomenclature standard AISI), which corresponds to M290-50A (nomenclature EN10106). This material has also been selected in the finite element simulations carried out. The manufacturer of the electrical steel has given us the specific losses in W/kg [13] for different flux densities (from 0.1 T to 1.5 T) and for different frequencies (from 50 Hz to 1000 Hz). The adjustment of the different coefficients corresponding to the Steinmetz equations was made by comparing the results of the established model with the specific losses data of the electrical steel provided by the manufacturer. The different coefficients selected from this adjustment and applied in Equations (4) and (5) are: kh = 4.8, a = 1.2, n = 2 for hysteresis losses in Equation (4), and kf = 60, e = 0.0005 m, x = 2.05, y = 2, z = 2.05 for eddy current losses in Equation (5).
The procedure for calculation of hysteresis losses in the four tested regions was also followed to quantify the total iron losses as the sum of hysteresis losses and eddy current losses. Figure 6 compares the results of the manufacturer tests with the results obtained from applying analytical methods using the Equations (4) and (5), for a 50 Hz frequency as a function of the estimated air gap flux density. There were differences between the analytical calculations and the experimental measurements, especially with high flux density values. However, they were not significant, so we could consider the analytical procedure satisfactory.
All experimental measure tests carried out by the motor manufacturer and by the motor user have been made in accordance with international standards IEC 60034-2-1 [14] and IEC 60349-2 [15], so that losses are separated as per the standards’ indications into copper losses, iron losses, mechanical losses and stray load losses.
To obtain the mechanical losses and the iron losses, shown in Figure 5 and Figure 6 respectively, the sinusoidal voltage and no-load operation have been applied. The measuring equipment used consists of a 3-phase electronic wattmeter (which allows the measurement of voltage, current, power and power factor), an analogical torque-meter on the axis, and a digital transducer for measuring speed. The motor was in service for 30 min before taking the measurements, to achieve the proper behavior of the bearings to correctly determine the mechanical losses.
To obtain the output power and performance, two identical motors have been mechanically coupled (back-to-back method). The same measuring equipment indicated above were used. The measurement of the torque and the speed, together with the measurements of the electronic wattmeter, allowed the determination of the output power and the efficiency of the motor. A temperature of 150 °C was considered as the reference temperature to calculate the stator copper losses.
3.3. Analysis of the Equivalent Circuit
Since losses have a strong influence on motor efficiency, the circuit in [16] was considered as the equivalent circuit shown in Figure 7. The considered equivalent circuit parameters are: R1, stator resistance; R’2, rotor resistance referred to the stator; Xd1, leakage reactance of the stator; X’d2, rotor leakage reactance referred to the stator; Xμ, magnetizing reactance; RFe , iron loss resistance; s, slip; Rfreg, mechanical loss resistance; Rad, stray load loss resistance; Rload, load resistance.
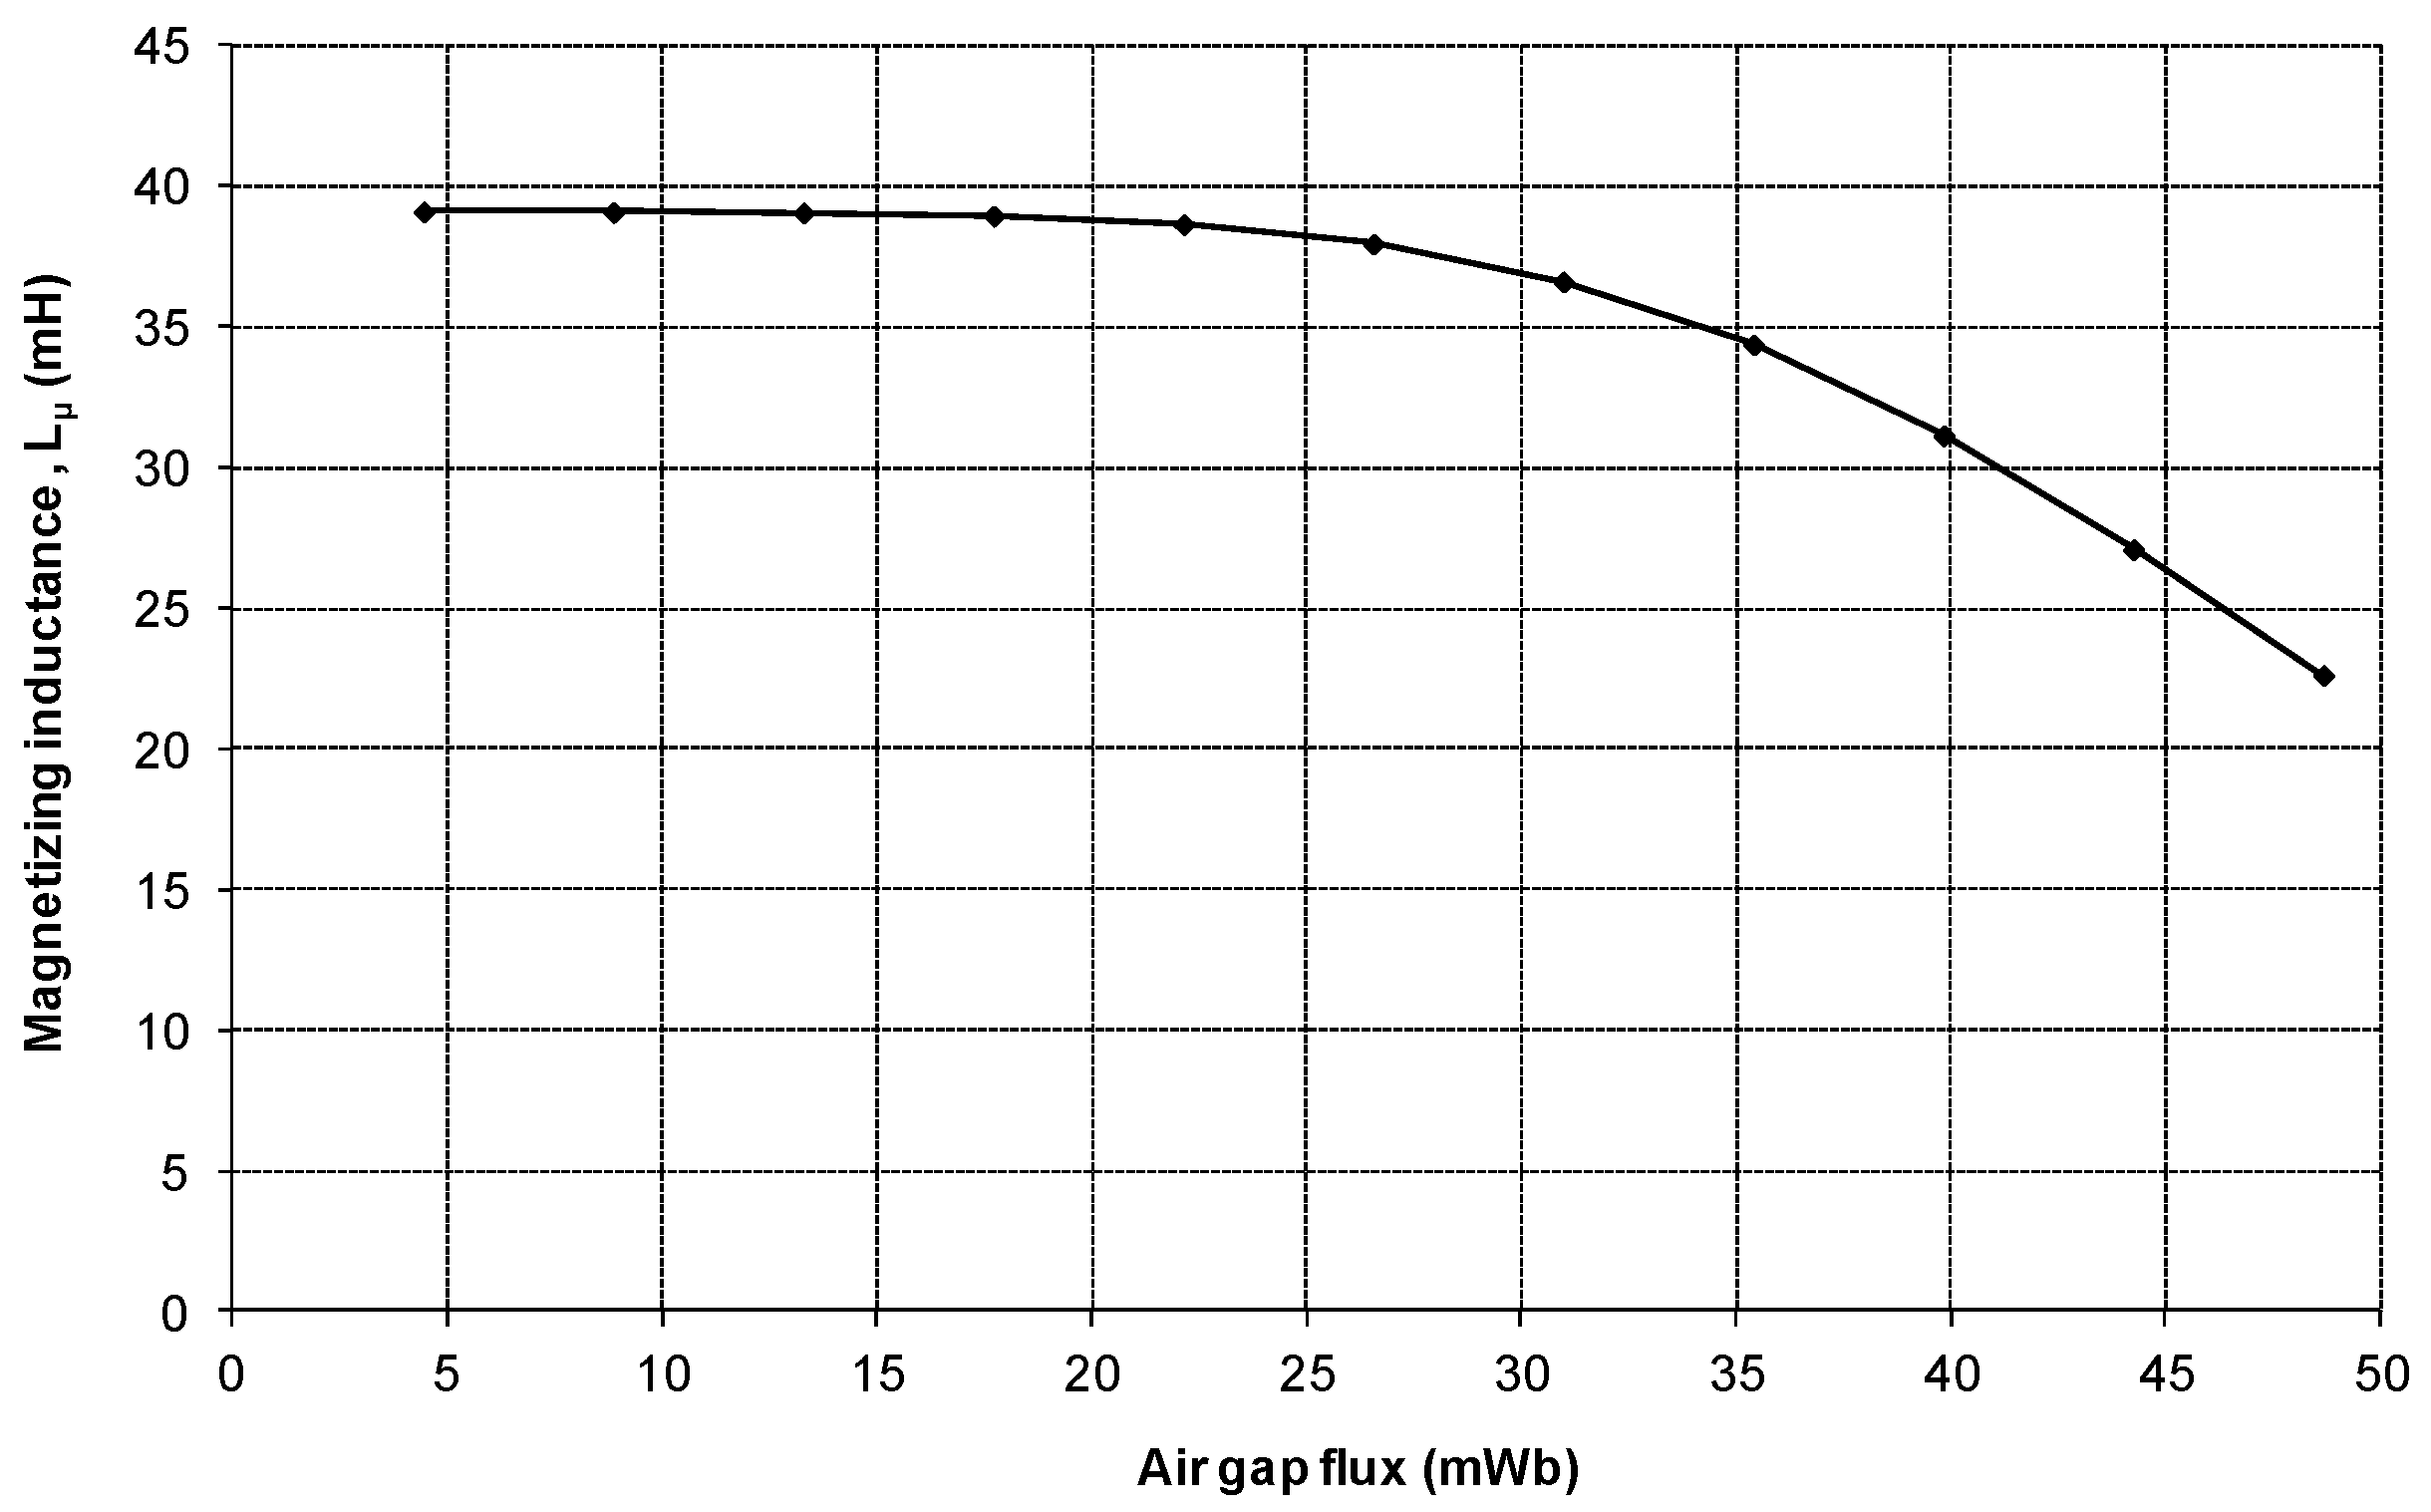
The main parameters of the equivalent circuit are included in Table 3. Mechanical loss resistance (Rfreg), iron loss resistance (RFe), stray load loss resistance (Rad) and load resistance (Rload) were calculated as specified in [17], where this equivalent circuit was satisfactorily used in a railway traction motor. The evolution of mechanical losses in Figure 5 and iron losses in Figure 6 was used to fit resistances Rfreg and RFe, respectively. Additionally, the saturation effect was considered on the magnetizing inductance value (Figure 8) and the variation of rotor parameters with slip (s), as proposed in [18].
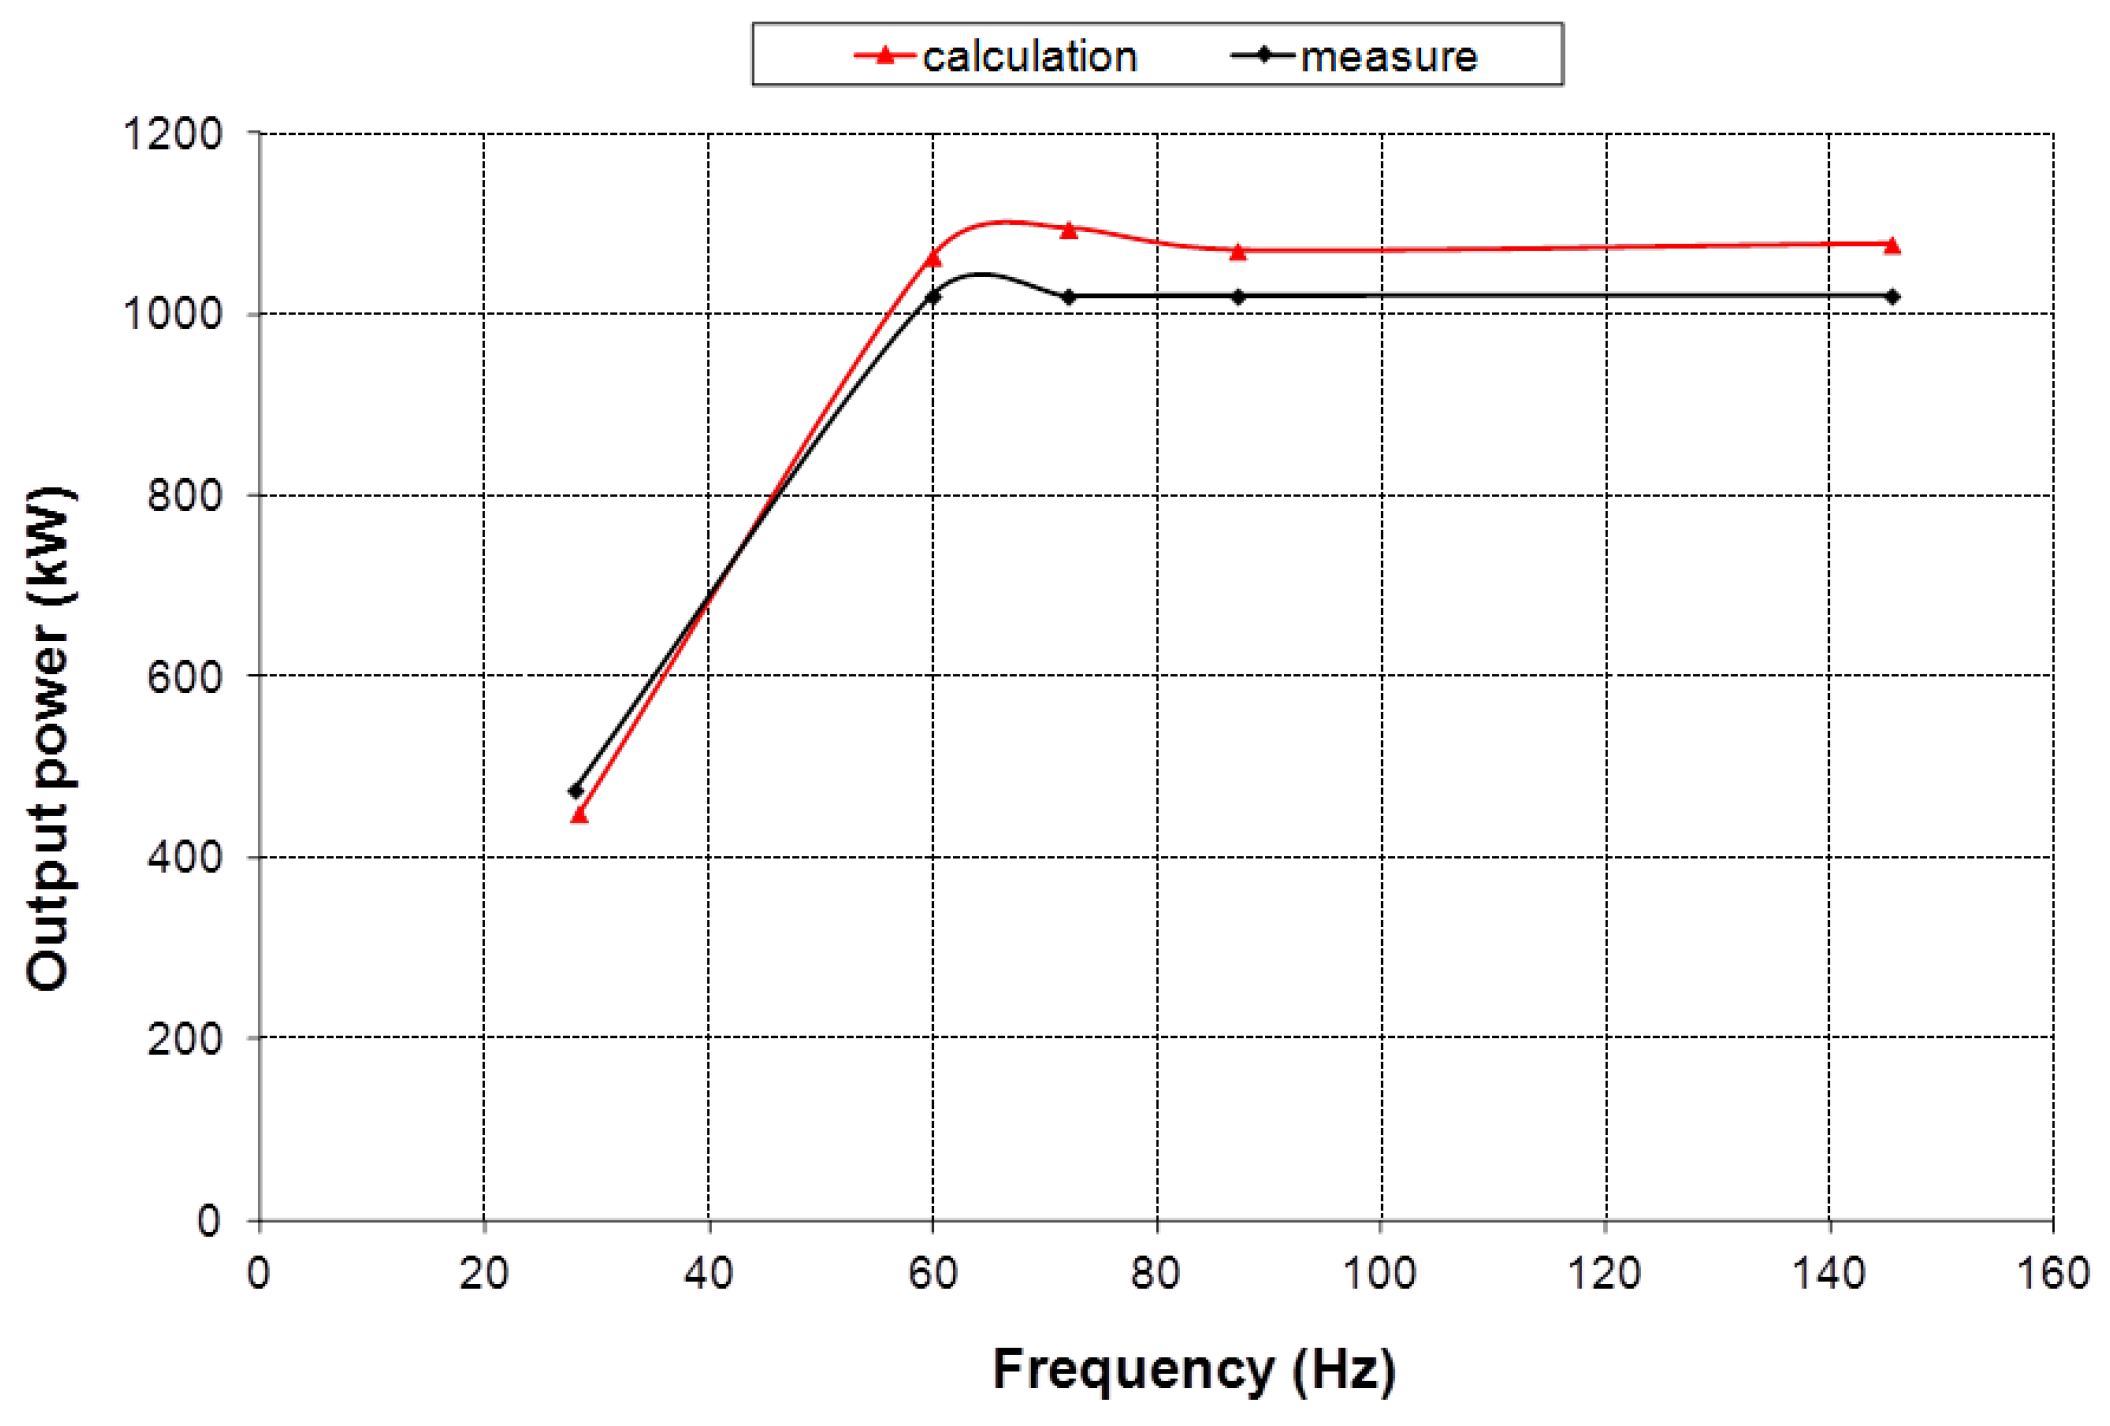
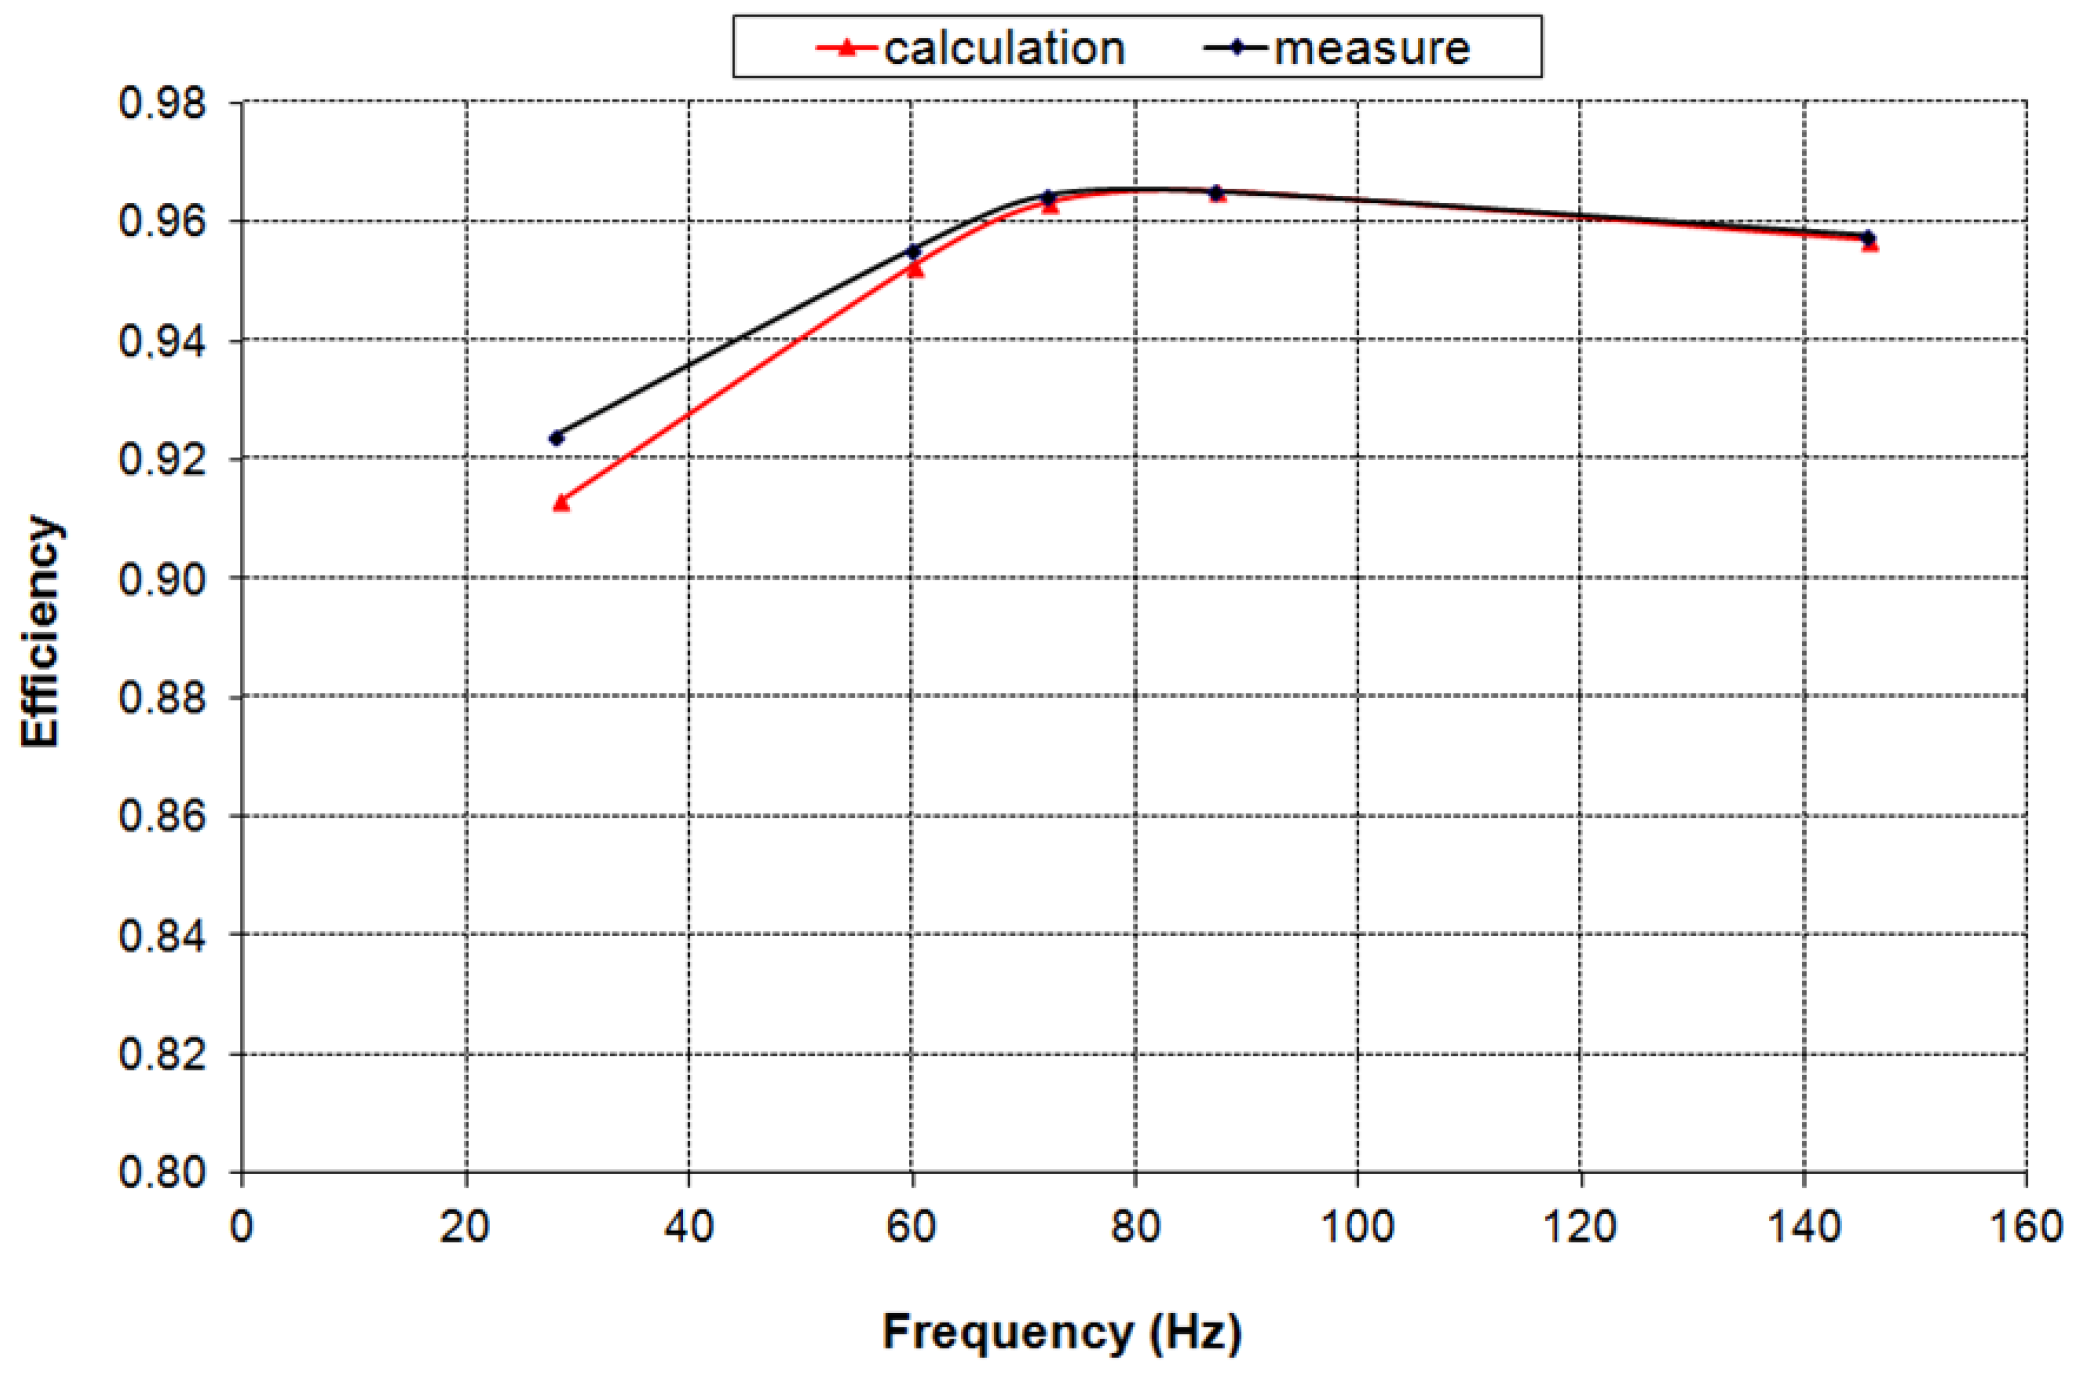
The analytical results of output power and efficiency of the equivalent circuit at different frequencies and those obtained in the tests were compared in Figure 9 and Figure 10, respectively. Good results can be observed in the calculation of the efficiency, with only small differences in the operation at low frequencies are appreciated.
4. Structures of Permanent Magnet Synchronous Motors (PMSM) Proposed
To evaluate the possibility of replacing the IM by a PMSM, three magnet structures of the rotor were proposed for the PMSMs [19,20], as shown in Figure 11:
- -
- surface magnets (SPM)
- -
- interior magnets with radial magnetization (RM-IPM)
- -
- interior magnets with tangential magnetization (TM-IPM)
The same stator used in the IM was selected for the above rotor structures to compare them with the current IM, especially in terms of electromagnetic performance and efficiency. The use of the same stator initially resulted in fewer changes in the manufacturing process of the new motor and in the power electronics required for motor control. It is important to note that modifying the winding by increasing the number of poles, using a concentrated winding with a fractional number of slots per pole and phase [21] could improve PMSM performance.
The selection of the same stator in the proposed designs of the PMSM that in the IM currently used is due to the assumption of non-aggressive modification of the manufacturing process and the power electronics installed, conditions prefixed by the manufacturer and the current customer of the motors. Therefore, the use of the same stator has been prioritized in the design over an optimized motor design, which could improve some aspects of operation if an optimization algorithm has been applied [22,23,24].
The selected magnet was a rare-earth magnet, NdFeB (ND-35UH type), with the following main characteristics at 26 °C:
- -
- Remanent induction = 1.2 T
- -
- Coercitive field = −905 kA/m
- -
- Relative permeability = 1.055
The magnets were approximately dimensioned in width to roughly cover the pole arc of the machine and in length (Lm) from Equation (6) [19]:
where Bg is the air gap induction, lg is the air gap length, and Hm is the magnet’s magnetic field at the operating point.
In order to avoid demagnetization problems of magnet, Hm was given a value corresponding to a 0.6 Br according to the magnet characteristic, where Br is the remanent induction.
4.1. Finite Element Simulation
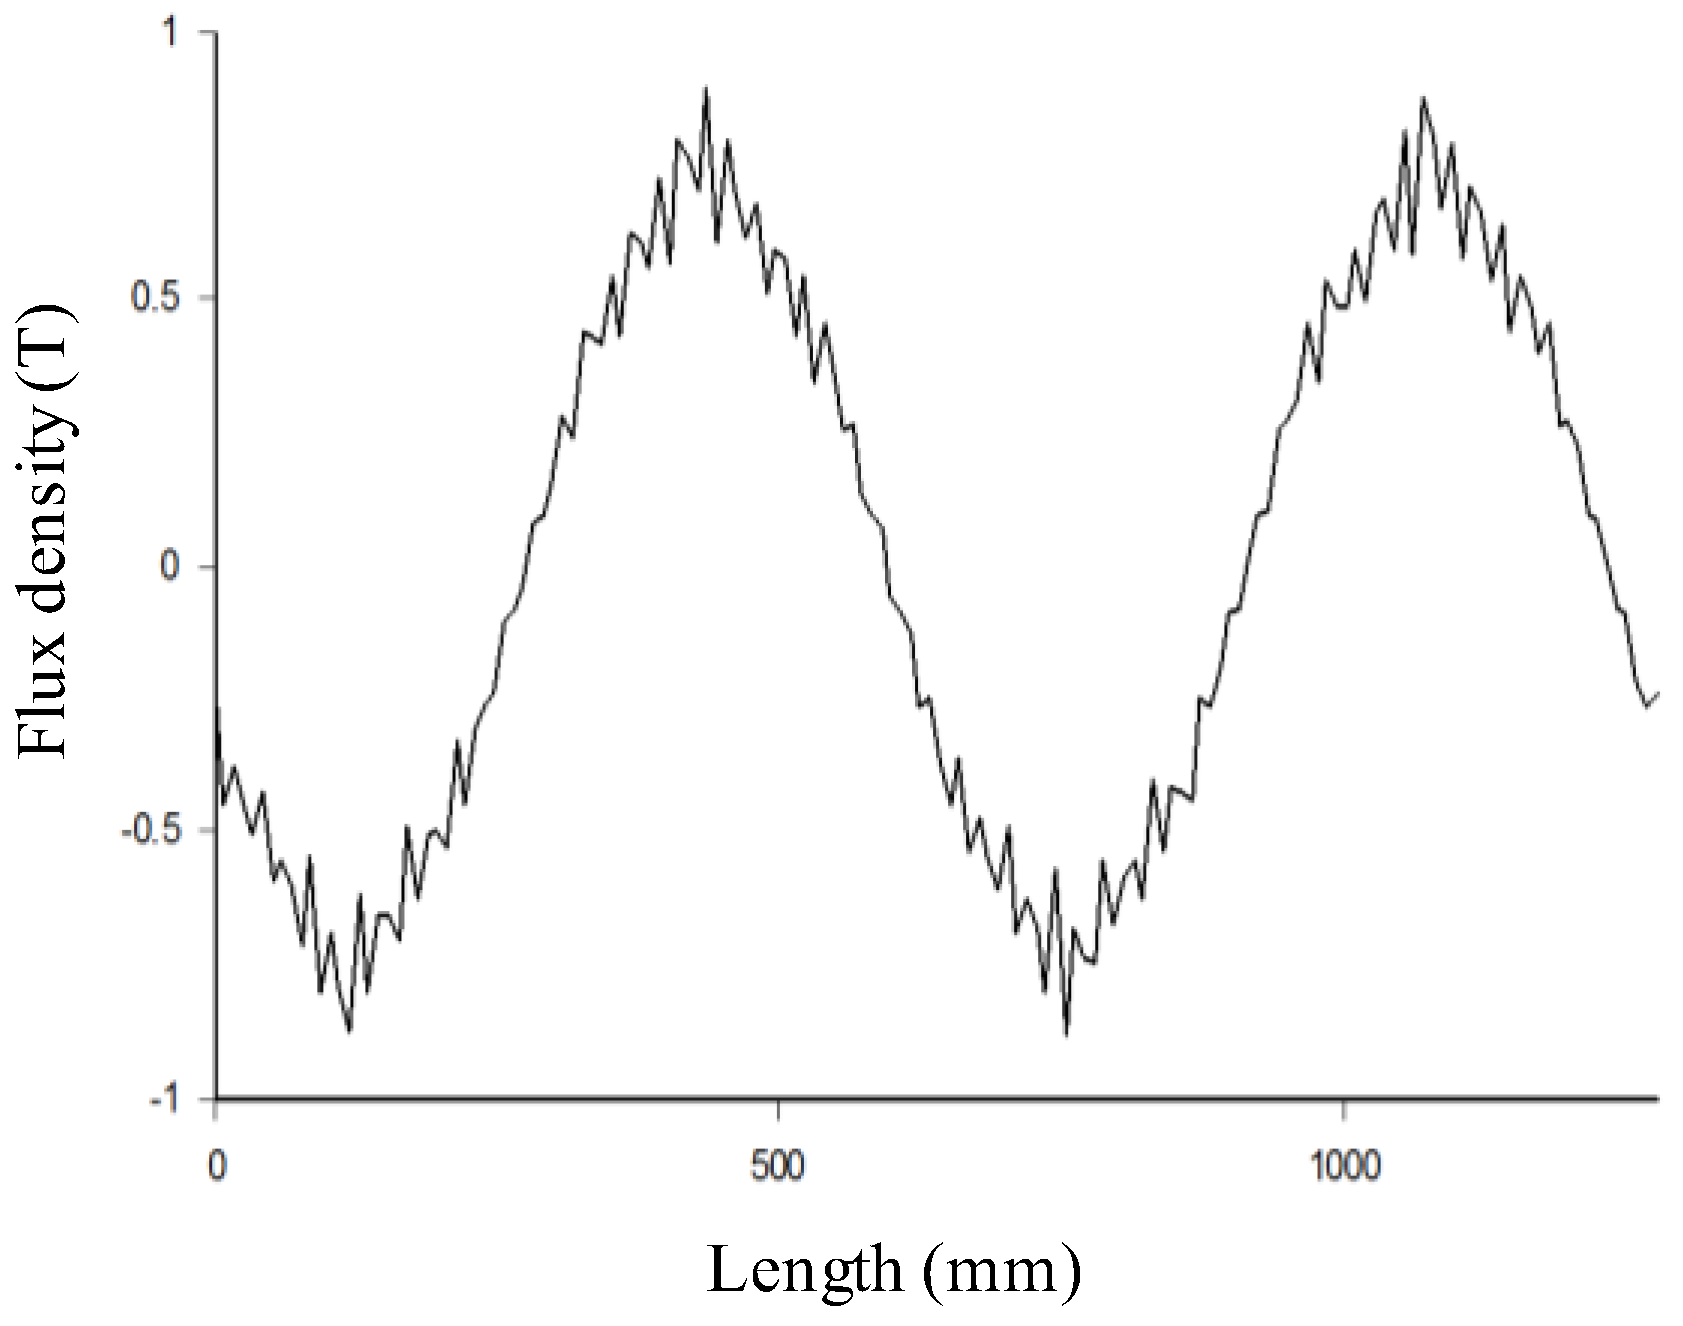
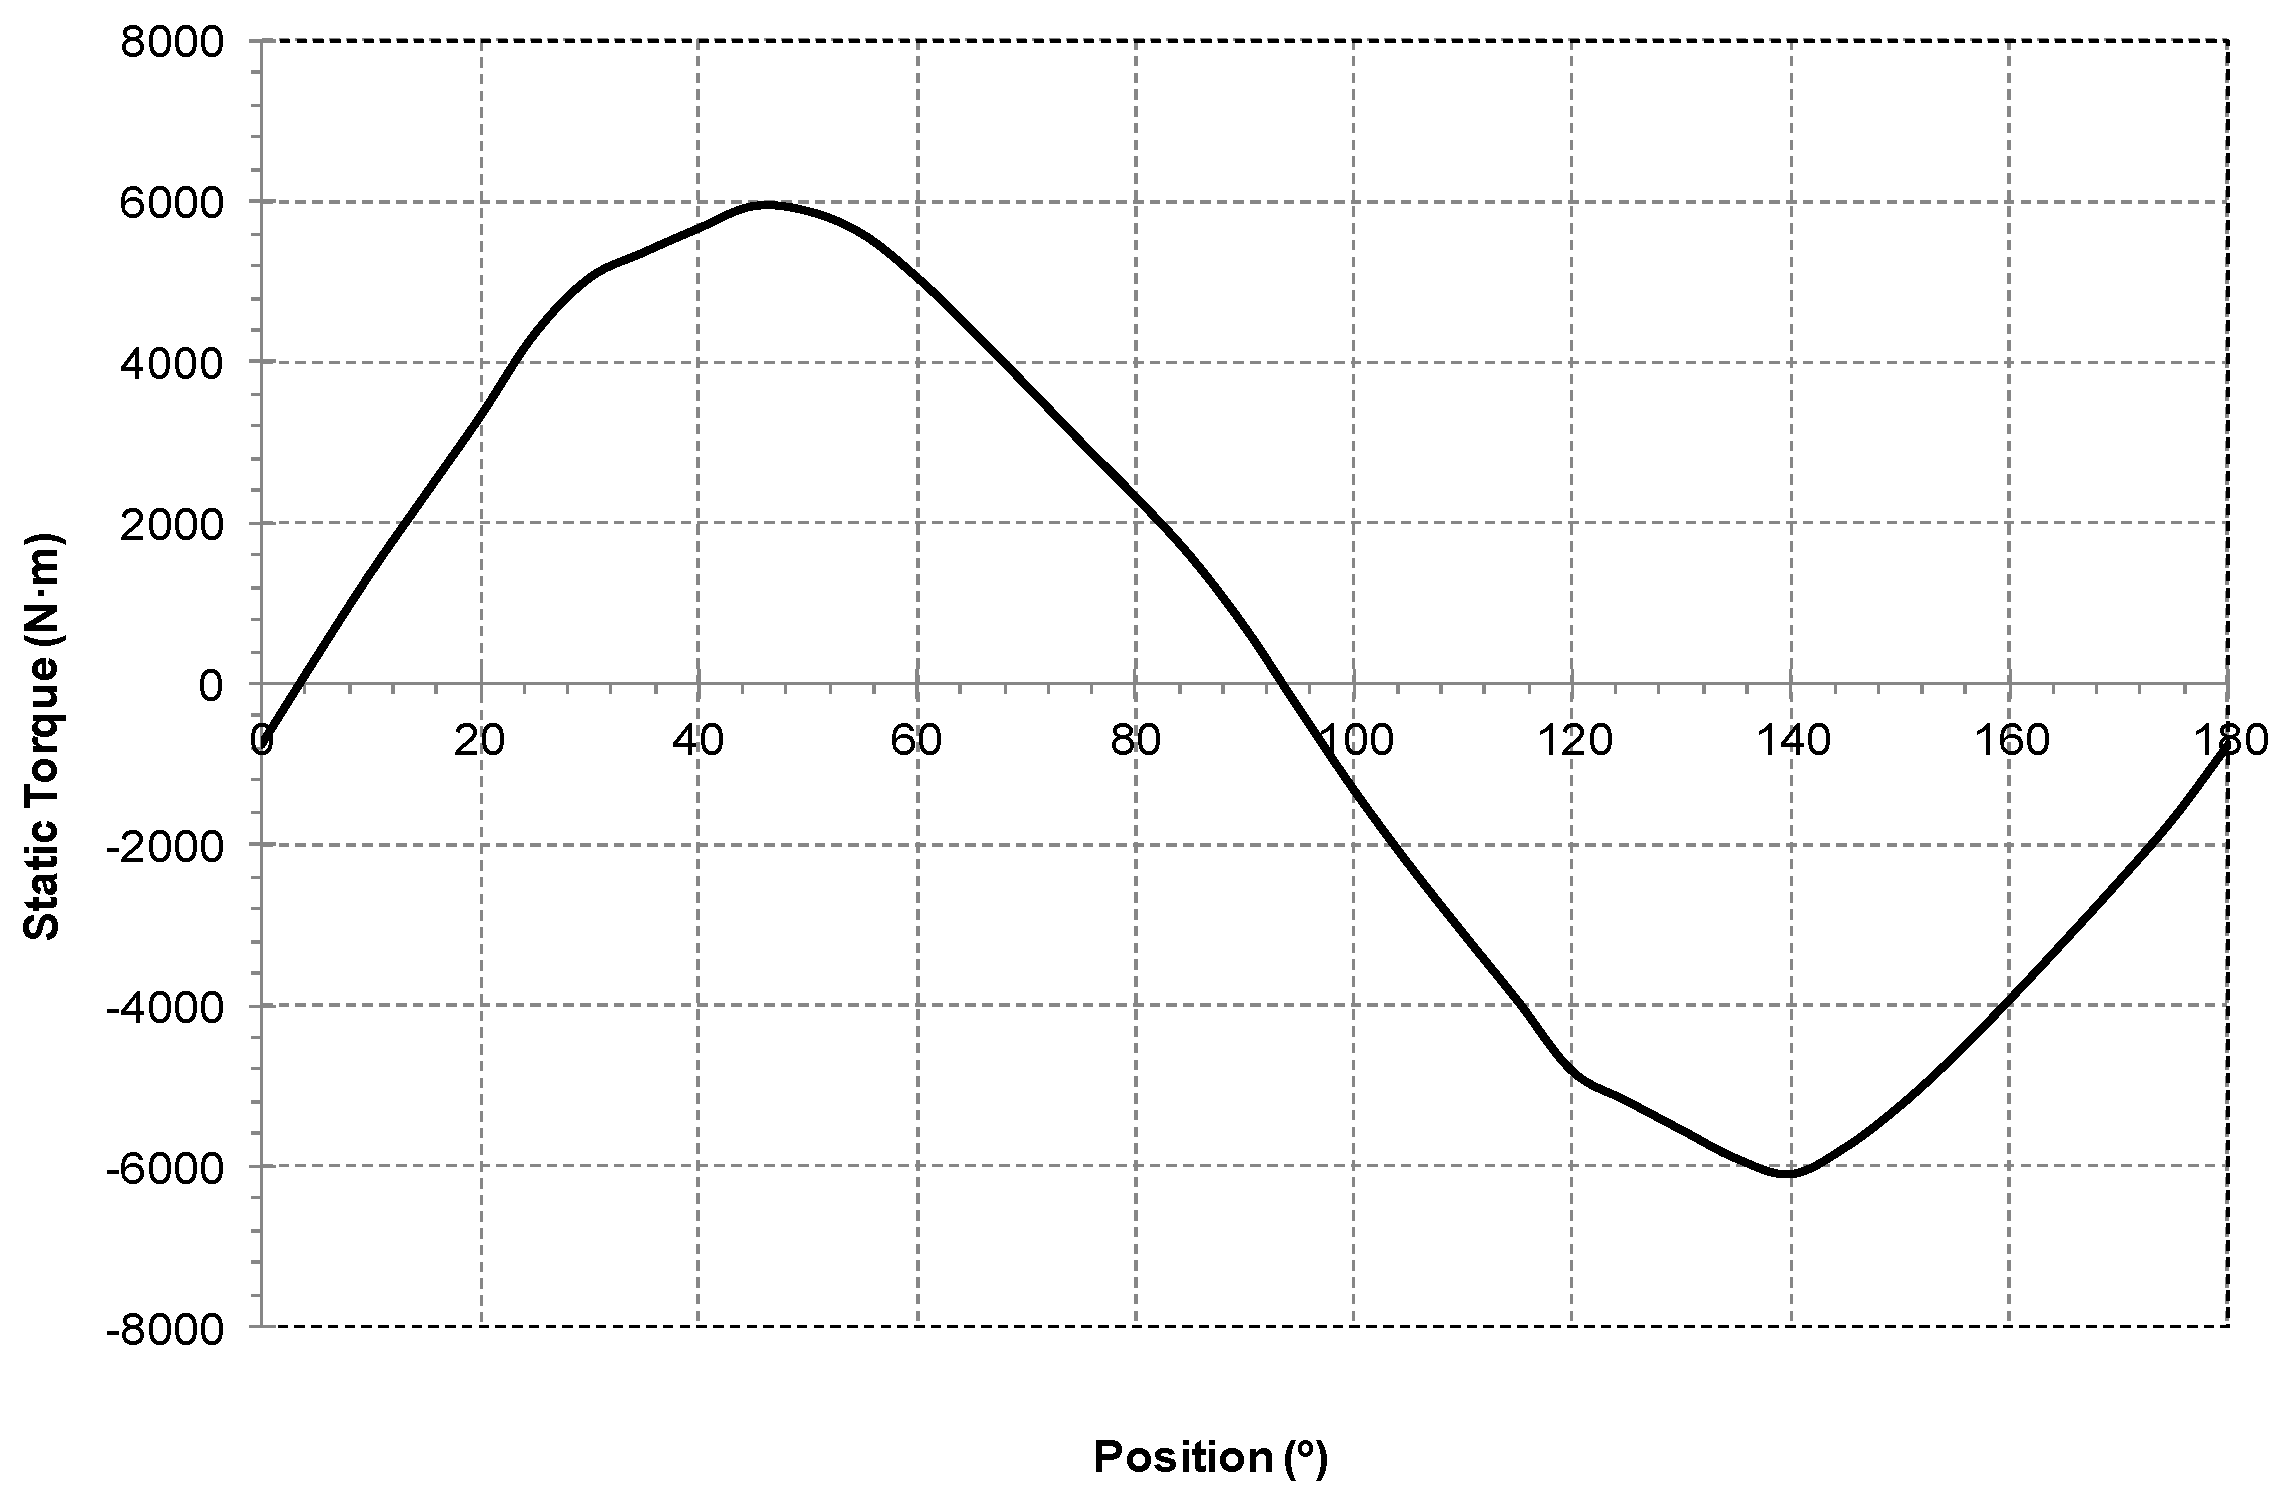
Load and no-load simulations of the PMSM rotor structures were conducted. Figure 12 and Figure 13 summarize the results of the no-load flux line distribution, whereas Figure 14 and Figure 15 illustrate the air gap induction waveforms. The back electromotive force (EMF) obtained in the three structures was 6.89 Vs/rad in the SPM, 5.32 Vs/rad in the RM-IPM and 5.31 Vs/rad in the TM-IPM, respectively. Static torque was obtained from load simulations at rated current and for different rotor positions, as shown in Figure 16 [25].
It was remarkable that an air gap flux per pole obtained in surface magnets structure was higher than the interior magnets structures. Also, in the three cases of PMSM, the air gap flux density was higher than that obtained in the IM (Figure 2).
From the simulations shown in Figure 14 and Figure 15, the SPM rotor structure provided an evolution of air gap flux density which was more sinusoidal than with the structures of interior magnets. Consequently, the harmonic content of this waveform would be lower in the SPM.
It was also observed in Figure 16 that the static torque values obtained from SPM rotor structure were higher, so this structure would be better adapted to study the needs of the railway application.
4.2. Inductances and Losses
In order to calculate the efficiency of the three PMSM rotor structures, a full power balance was performed by considering the same stator as that used for the IM in Section 3, so the stator resistances had the same value. The inductances were obtained by finite element simulation by exciting a stator phase and replacing the rotor magnets with air (since the simulation was conducted using demagnetized magnets, their permeability value is very close to air). Two simulations had to be carried out to determine the direct and quadrature axis inductances with respect to the excited stator phase. The end coil inductances (Lcb) were determined by analytical calculation using the following equation [26]:
where Nf is the number of turns per phase, p is the number of pole pairs, npf is the number of slots per pole and per phase, Ap is the pole width, Ars is the stator slot width and kcb is the dimensionless overhang factor (between 0.5 and 1).
The final inductance values are given in Table 4. The effect of magnetic saturation was negligible at different stator currents due to the effect of low relative permeability of the magnets, which was considered in the magnetic equivalent circuit analysis. It can be seen that the direct and quadrature axis inductances in the SPM structure were same, whereas they were not same in the IPM structures, as in the case of salient pole machines.
All losses were determined as follows:
- -
- Stator Joule losses: with the same resistance value as in the IM.
- -
- Mechanical losses: using Equations (1)–(3) in Section 3.2.
- -
- Iron losses [27]: using Equations (4) and (5) and the calculation process in Section 3.2.
- -
For the motor with SPM rotor structure, a steady state analysis was carried out by only considering the synchronous inductance similar to cylindrical rotor synchronous machines. On the other hand, for the motors with IPM rotor structures, longitudinal and transversal inductances were considered similar to salient pole synchronous machines.
5. Performance of PMSM Compared with Respect to the IM Used
Initially, in Section 3, the performance of the IM currently used in high speed railway traction was studied. Electromagnetic and functional performances, especially efficiency, were quantified. Comparison of the analytical results with motor specifications underpin the calculation process, particularly in the estimation of motor losses.
PMSMs have been postulated as an alternative to traction IMs, especially due to their expected higher efficiency and power density. Three PMSM rotor structures, one with surface magnets and two with interior magnets, were evaluated in Section 4. Initially, only slightly aggressive replacement was considered, keeping the same stator structure (dimensions, windings…) to evaluate the potential improvements provided by the tested PMSM rotor structures [24].
Figure 17 plots the efficiency for three PMSM rotor structures with the same frequencies and output power previously analyzed in the IM. Operating conditions are summarized in Appendix A, Figure A2. The efficiency obtained with the PMSM structures is slightly higher with respect to the IM for all the operating frequencies of the application, highlighting greater differences for the operation at low frequencies.
The most characteristic values in Table 5 were compared by using the above analytical procedures [28,29].
Air gap flux was higher in all PMSM rotor structures than the IM, especially in the SPM. In contrast, static torque in all PMSM rotor structures was lower than the IM, especially in the IPM. Nominal efficiency of all PMSM rotor structures was higher than the IM, although this improvement is not very important because motor power and application type had a strong impact on energy consumption. Power density was only slightly higher in all PMSM rotor structures than in the IM, so, it was preferred to compare efficiency for the same output power at selected operating points analyzed for different frequencies. As discussed earlier, redesigning the specific stator for the PMSM rotor structures by using a larger number of poles would result in increased power density.
Finally, a comparative study of manufacturing materials costs was conducted for the four motors in collaboration with some specialist companies located in Catalonia. The weight of the motor parts was calculated and the following approximate prices were used:
- -
- Magnetic sheet: 0.98 €/kg
- -
- Copper: 7.57 €/kg
- -
- Neodymium magnet: 133.62 €/kg
- -
- Steel for the axis: 2.32 €/kg
- -
- Aluminum for the frame: 1.49 €/kg
The following costs were obtained from the weights and unit price of materials:
- -
- Induction motor: 2953 €
- -
- Permanent magnet synchronous motor, SPM rotor structure: 6472 €
- -
- Permanent magnet synchronous motor, RM-IPM rotor structure: 6089 €
- -
- Permanent magnet synchronous motor, TM-IPM rotor structure: 4820 €
Similarly, the energy consumption for a 6000 h/year operation at several operating points (according Figure 1 and Figure A2) was estimated for the PMSM rotor structures. Annual energy and financial savings were associated with energy savings (for an estimated cost of 0.07 €/kWh) over the IM. Also, the materials cost increased for an expected amortization period and environmental impact of energy savings were calculated exclusively in terms of reduction of equivalent CO2 emission (for a 0.6 kg CO2/kWh ratio) [30,31]. These results are summarized in Table 6.
To achieve good motor reliability, an important feature for railway applications, the following maintenance operations are carried out on the currently used IM: tightness test, cooling air control, checking of the motor cables, checking of the sensors, maintenance and lubrication of the bearings, revision and cleaning of the bearings, external and internal cleaning of the motor, and control and measurement of the insulation (in service and after cleaning and drying). The total revision of the previous aspects is carried out in cycles of 5 years, and lubrication of the bearings must be done every 350,000 km. From the above, it is observed that the most demanding parts of the motor in terms of maintenance and reliability are bearings and stator windings. With the premise that maintaining the same stator in the proposed PMSM than in the IM currently used, we can say that there will be no appreciable changes in terms of maintenance needs and motor reliability. An aspect that would increase the fault tolerance of motors in traction applications refers to the increase in the number of stator phases, a design aspect that would equally affect the IM and the PMSM motors [32].
6. Conclusions
The results obtained in the study showed that the PMSM rotor structures offer higher efficiency than the IM. Despite not being significant, this increase has an interesting influence on the annual energy consumption of railway traction. The improvement in power density was small because the same stator structure was kept, a hypothesis of this study. Greater improvements could be achieved by redesigning the stator and increasing the number of poles.
The increase in the cost of the materials and the manufacturing process represented that the use of the PMSM as compared to the IM can be amortized in a relatively short time due to the reduction in electrical energy consumption.
The good behavior of the analytical calculations used in the IM and compared with test measurements confirms the validity of the proposed method to calculate motor losses and efficiency.
Author Contributions
M.T. and J.I.P. proposed the methodology and the calculation procedure; J.A.J. provided the experimental data.
Funding
This research received no external funding.
Conflicts of Interest
The authors declare no conflicts of interest.
Appendix A
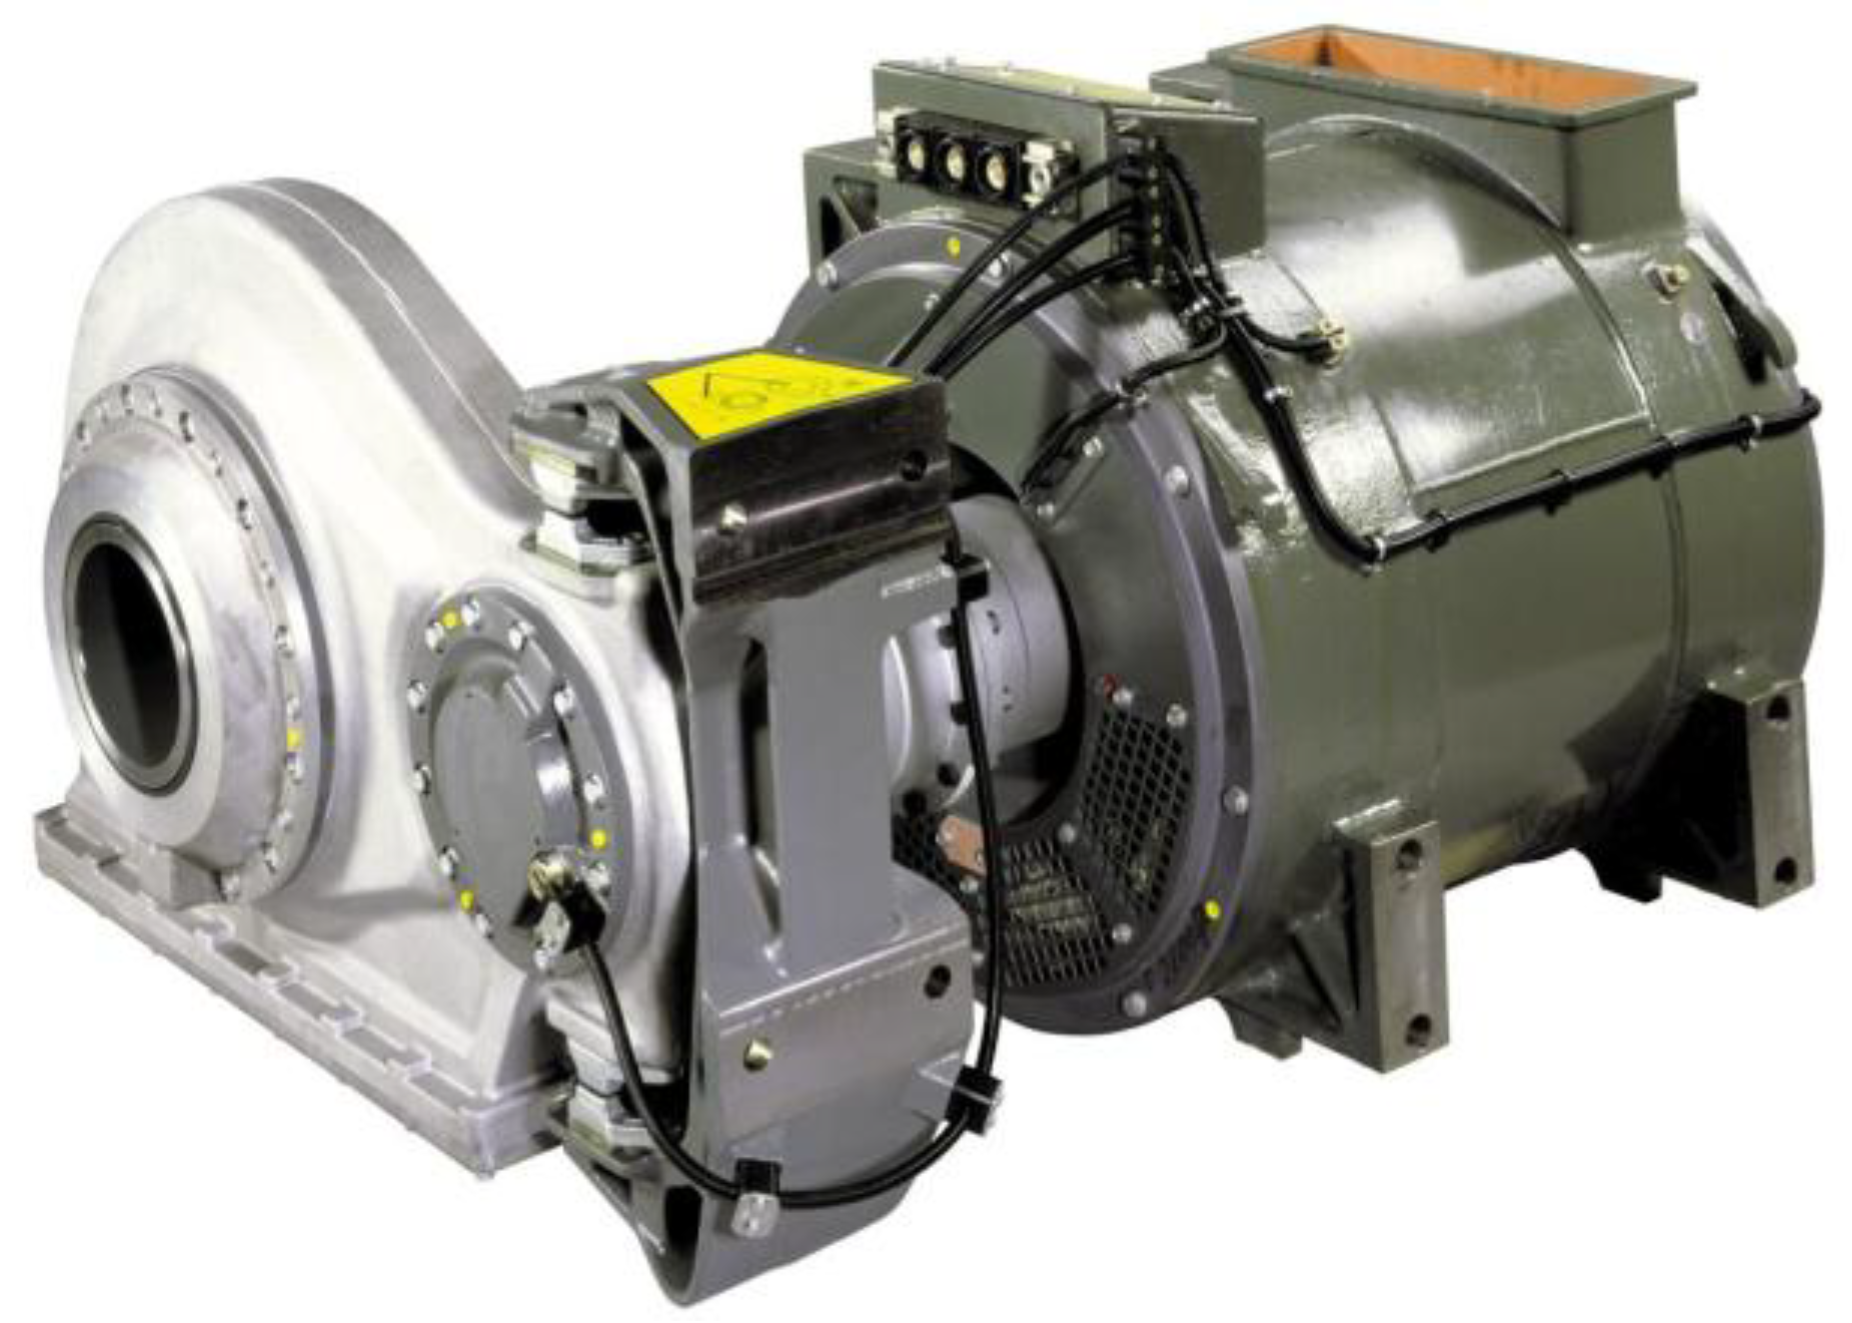
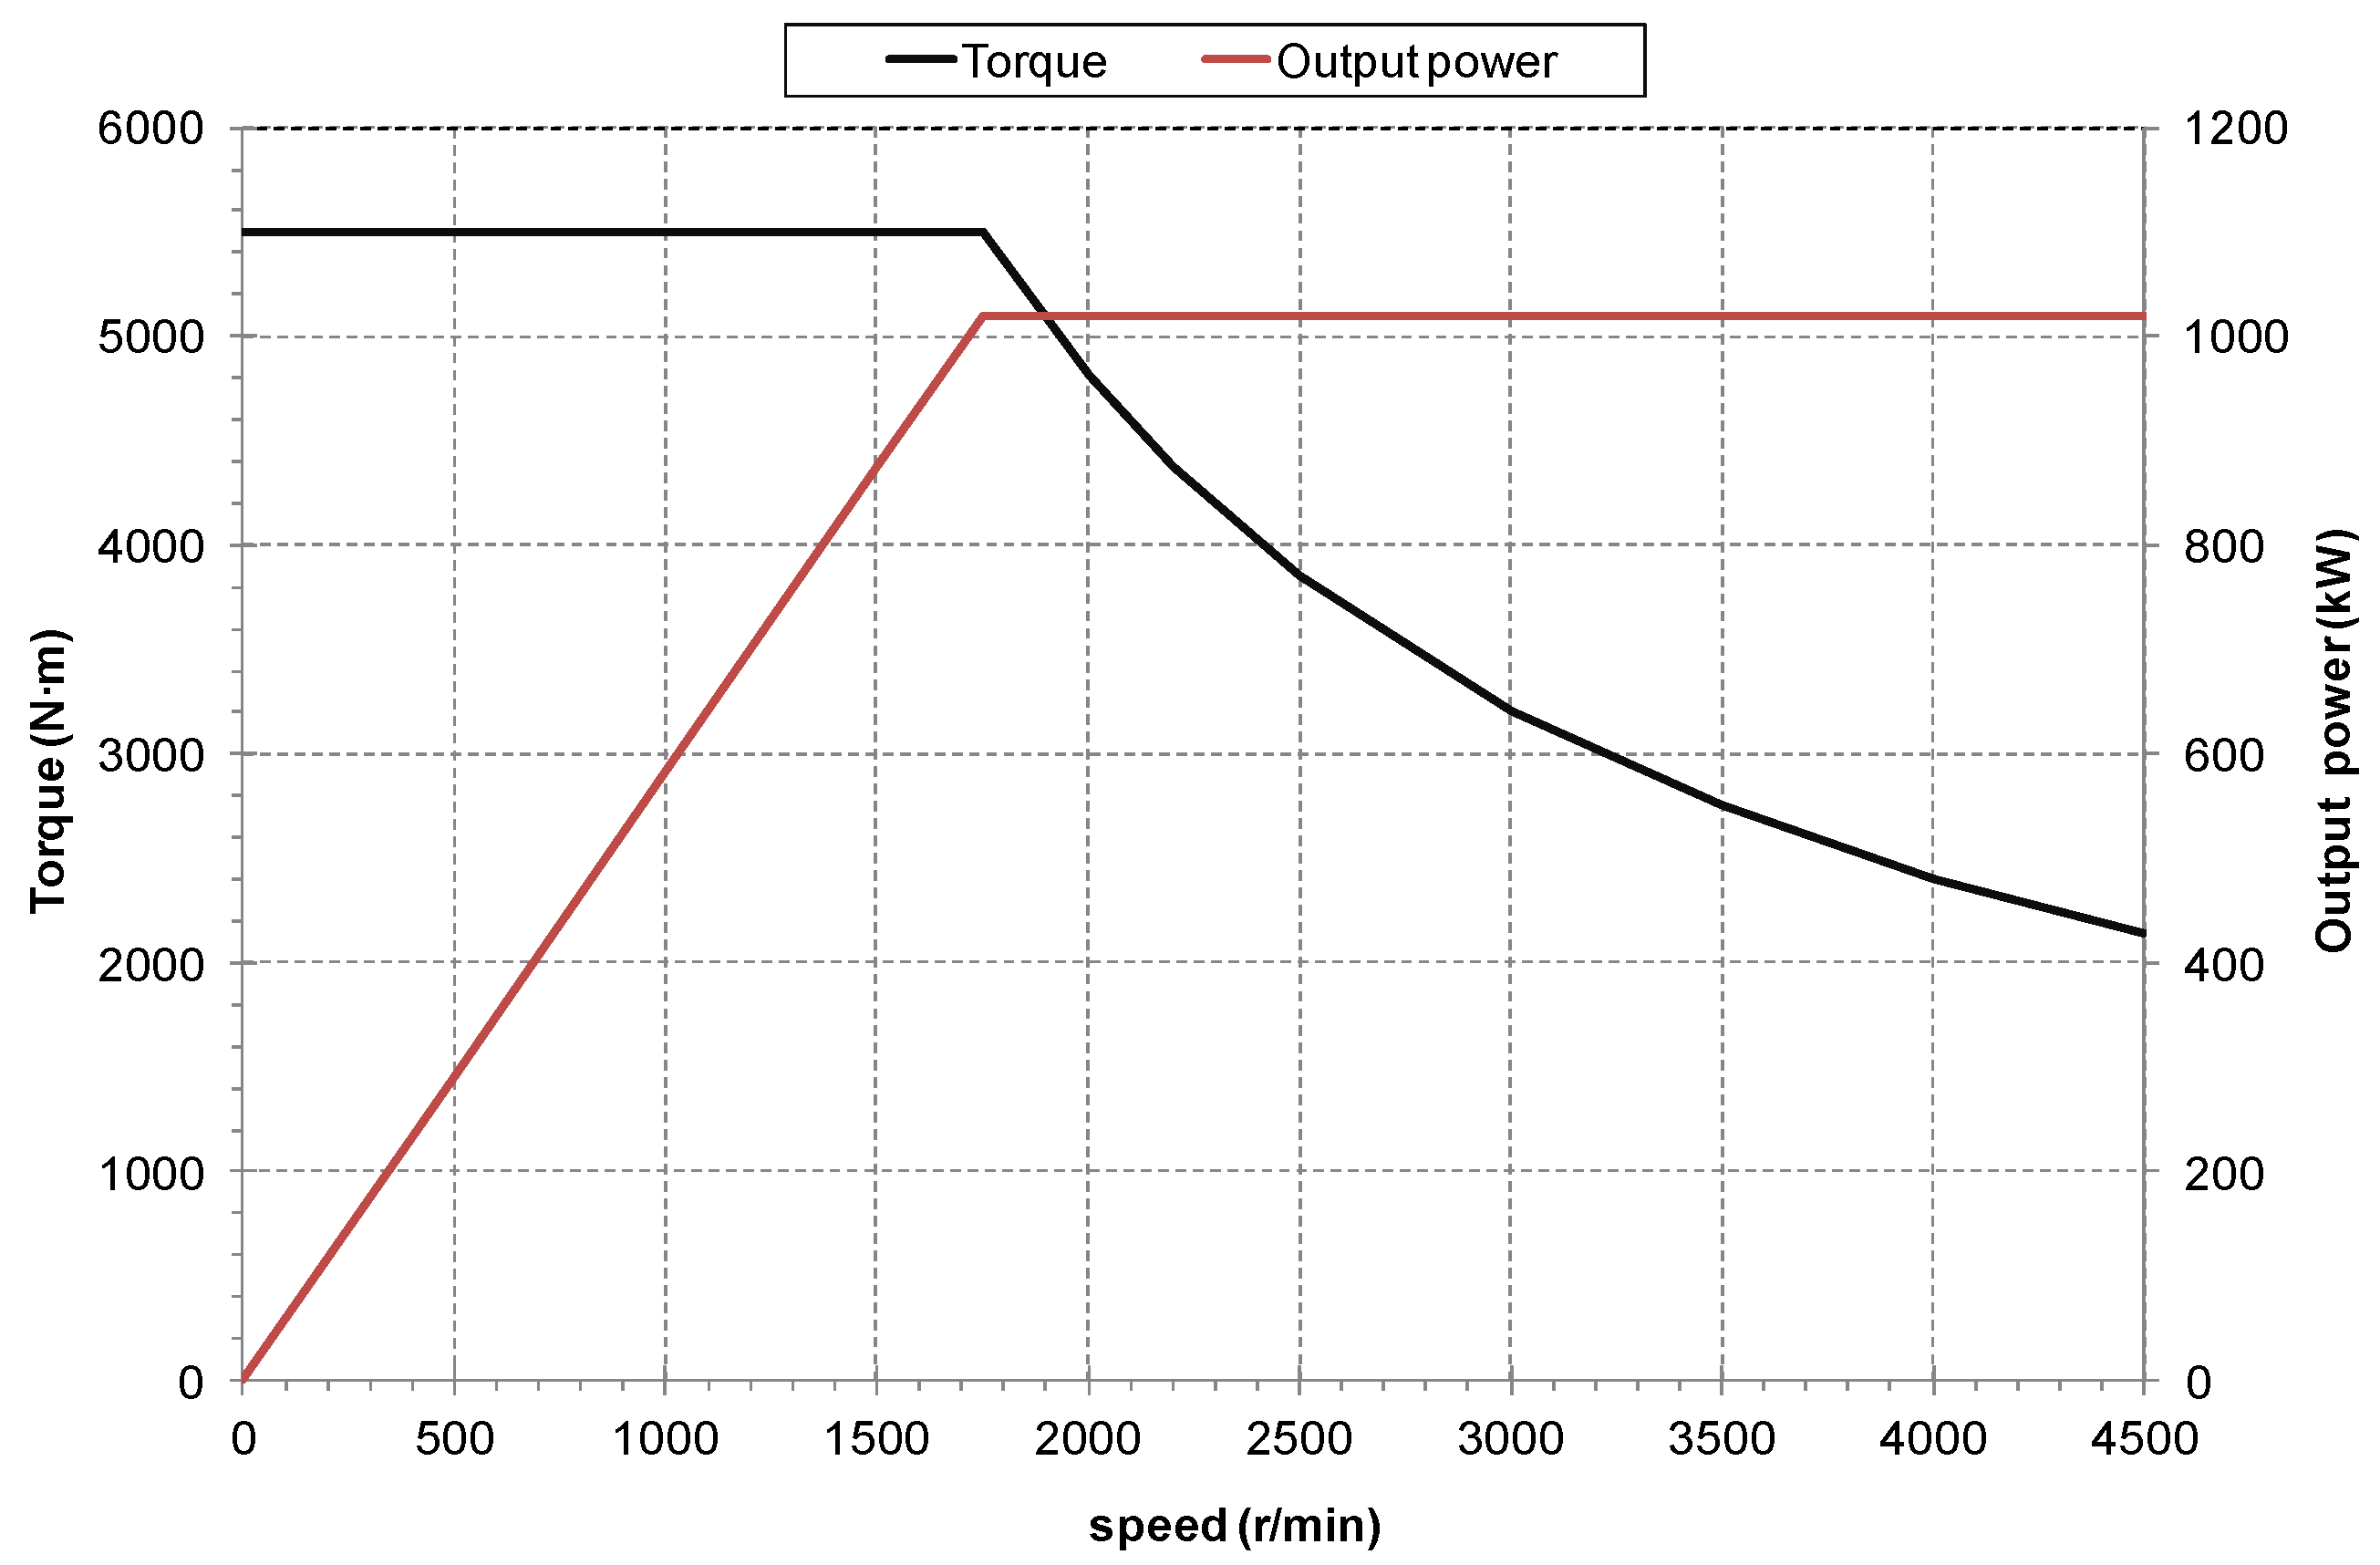
Construction data of the induction motor implemented in the AVE trains are given in Table A1. Figure A1 shows a picture of the motor and its gearbox. The torque-speed and output power-speed characteristics for each motor are summarized in Figure A2.
Figure A1.
Motor with gearbox.

Figure A2.
Torque-speed and output power-speed characteristics to inverter induction motor drive.


Table A1.
Main construction data of the induction motor.
| Weight | 1400 kg |
| Stator outer diameter | 676 mm |
| Stator inner diameter | 400 mm |
| Rotor inner diameter | 388 mm |
| Armature length | 300 mm |
| Stator slot section | 563 mm2 |
| Rotor slot section | 168 mm2 |
| Number of stator slots | 60 |
| Number of rotor slots | 72 |
| Airflow forced air-cooling | 1 m3/s |
References
- Steimel, A. Electric Traction-Motive Power and Energy Supply; Oldenbourg Industrieverlag GmbH: Munich, Germany, 2008. [Google Scholar]
- Koseki, T. Technical Trends of Railway Traction in the World. In Proceedings of the Power Electronics Conference (IPEC 2010), Sapporo, Japan, 21–24 June 2010; pp. 2836–2841. [Google Scholar]
- Bolvashenkov, I.; Kammermann, J.; Herzog, H. Methodology for Selecting Electric Traction Motors and its Application to Vehicle Propulsion Systems. In Proceedings of the International Symposium on Power Electronics, Electrical Drives, Automation and Motion (SPEEDAM 2016), Anacapri, Italy, 22–24 June 2016; pp. 1214–1219. [Google Scholar]
- Le Moal, E.; Chamaret, A.; Mannevy, P.; Bouger, O. The Permanent Magnet Synchronous Motor from a Customer Point of View: REGIO 2N vs. REGIOLIS. In Proceedings of the International Conference on Electrical Systems for Aircraft, Railway, Ship Propulsion and Road Vehicles & International Transportation Electrification Conference (ESARS-ITEC 2016), Railway, Toulouse, France, 2–4 November 2016; pp. 1–4. [Google Scholar]
- Ronanki, D.; Singh, S.A.; Williamson, S.S. Comprehensive Topological Overview of Rolling Stock Architectures and Recent Trends in Electric Railway Traction Systems. IEEE Trans. Transp. Electr. 2017, 3, 724–738. [Google Scholar] [CrossRef]
- Rind, S.J.; Ren, Y.; Hu, Y.; Wang, J.; Jiang, L. Configurations and Control of traction Motors for Electric Vehicles: A Review. Chin. J. Electr. Eng. 2017, 3, 1–17. [Google Scholar]
- Gong, T.; Ma, G.; Qian, H.; Liu, K.; Liu, K.; Wang, C.; Zhao, Z.; Zhang, W. Electromagnetic Investigation of a High-Temperature Superconducting Linear Synchronous Motor for High-Speed Railway. IEEE Trans. Appl. Superconduct. 2018, 28. [Google Scholar] [CrossRef]
- El-Refaie, A.M. Motors/Generators for Traction/Propulsion Applications. IEEE Veh. Technol. Mag. 2013, 8, 90–99. [Google Scholar] [CrossRef]
- Estima, J.O.; Marques, A.J. Efficiency Analysis of Drive Train Topologies Applied to Electric/Hybrid Vehicles. IEEE Trans. Veh. Technol. 2012, 61, 1021–1031. [Google Scholar] [CrossRef]
- Boldea, I.; Nasar, S. The Induction Machine Handbook; CRC Press LLC: New York, NY, USA, 2002. [Google Scholar]
- Corrales, J. Cálculo Industrial de Máquinas Eléctricas; Marcombo, S.A., Ed.; Barcelona, Spain, 1982. [Google Scholar]
- Reinert, J.; Brockmeyer, A.; De Doncker, R.W.A.A. Calculation of Losses in Ferro- and Ferromagnetic Materials Based on the Modified Steinmetz Equation. IEEE Trans. Ind. Appl. 2001, 37, 1055–1061. [Google Scholar] [CrossRef]
- Cogent Electrical Steel. Available online: https://www.cogent-power.com (accessed on 7 June 2018).
- Rotating Electrical Machines. Part 2-1: Standard Methods for Determining Losses and Efficiency from Tests; International Standard IEC 60034-2-1; IEC: Geneva, Switzerland, 2007. [Google Scholar]
- IEC. Electric Traction—Rotating Electrical Machines for Rail and Road Vehicles—Part 2: Electronic Converter-Fed Alternating Current Motors; International Standard IEC 60349-2; IEC: Geneva, Switzerland, 2011. [Google Scholar]
- Torrent, M. Estimation of equivalent circuits for induction motors in steady state including mechanical and stray load losses. Eur. Trans. Electr. Power 2012, 22, 989–1015. [Google Scholar] [CrossRef]
- Torrent, M.; Perat, J.I.; Blanqué, B.; Soriano, S. Characterization of induction motors for railway traction from the equivalent circuit, including all motor losses. Dyna Ingeniería y Tecnologías Eléctricas 2015, 90, 87–95. [Google Scholar] [CrossRef] [Green Version]
- Cathey, J.J. Electric Machines: Analysis and Design Applying Matlab; Mc Graw-Hill: New York, NY, USA, 2001. [Google Scholar]
- Pyrhonen, J.; Jokinen, T.; Hrabovcova, V. Design of Rotating Electrical Machines; Wiley: Hoboken, NY, USA, 2013. [Google Scholar]
- Honda, Y.; Nakamura, T.; Higaki, T.; Takeda, Y. Motor Design Considerations and Test Results of an Interior Permanent Magnet Synchronous Motor for Electric Vehicles. In Proceedings of the Industry Applications Conference (IAS ‘97), New Orleans, LA, USA, 1–3 September 2017; pp. 75–82. [Google Scholar]
- El-Refaie, A.M. Fractional-Slot Concentrated-Windings Synchronous Permanent Magnet Machines: Opportunities and Challenges. IEEE Trans. Ind. Electr. 2010, 57, 107–121. [Google Scholar] [CrossRef]
- El-Refaie, A.M.; Alexander, J.P.; Galioto, S.; Reddy, P.B.; Huh, K.; De Bock, P.; Shen, X. Advanced High-Power-Density Interior Permanent magnet Motor for Traction Applications. IEEE Trans. Ind. Appl. 2014, 50, 3235–3248. [Google Scholar] [CrossRef]
- Yu, D.; Huang, X.Y.; Fang, Y.T.; Zhang, J. Design and Comparison of Interior Permanent Magnet Synchronous Traction Motors for High Speed Railway Applications. In Proceedings of the IEEE Workshop on Electrical Machines Design, Control and Diagnosis (WEMDCD 2017), Nottingham, UK, 20–21 April 2017; pp. 58–62. [Google Scholar]
- Liu, X.; Lin, Q.; Fu, W. Optimal Design of Permanent Magnet Arrangement in Synchronous Motors. Energies 2017, 10, 1700. [Google Scholar] [CrossRef]
- Ruuskanen, V.; Nerg, J.; Pyrhönen, J.; Ruotsalainen, S.; Kennel, R. Drive Cycle Analysis of a Permanent-Magnet Traction Motor Based on Magnetostatic Finite-Element Analysis. IEEE Trans. Veh. Technol. 2015, 64, 1249–1254. [Google Scholar] [CrossRef]
- Hamdi, E.S. Design of Small Electrical Machines; John Wiley & Sons Ltd.: New York, NY, USA, 1994. [Google Scholar]
- Yan, Y.; Zhu, J.; Guo, Y. A Permanent Magnet Synchronous Motor Model with Core Loss. J. Jpn. Soc. Appl. Electromagn. Mech. 2007, 15, 147–150. [Google Scholar]
- Puranen, J. Induction Motor versus Permanent Magnet Synchronous Motor in Motion Control Applications: A Comparative Study. Ph.D. Thesis, Lappeenranta University of Technology, Lappeenranta, Finland, 2006. [Google Scholar]
- Cavagnino, M.; Lazzari, F.; Profumo, A.; Tenconi, A. A Comparison between the Axial Flux and the Radial Flux Structures for PM Synchronous Motors. IEEE Trans. Ind. Appl. 2002, 38, 1517–1524. [Google Scholar] [CrossRef]
- Matsuoka, K.; Kondo, M. Energy Saving Technologies for Railway Traction Motors. IEEJ Trans. Electr. Electr. Eng. 2010, 5, 278–284. [Google Scholar] [CrossRef] [Green Version]
- Hernández, M.; Messagie, M.; Hegazy, O.; Marengo, L.; Winter, O.; Van Mierlo, J. Environmental impact of traction electric motors for electric vehicles applications. Int. J. Life Cycle Assess. 2015. [Google Scholar] [CrossRef]
- Bolvashenkov, I.; Herzog, H. Degree of Fault Tolerance of the Multi-phase Traction Electric Motors: Methodology and Application. In Proceedings of the International Conference on Environmental and Electrical Engineering (EEEIC 2016), Florence, Italy, 7–10 June 2016; pp. 1–6. [Google Scholar]
Figure 1.
Traction performance curve of AVE trains classes 102–112.
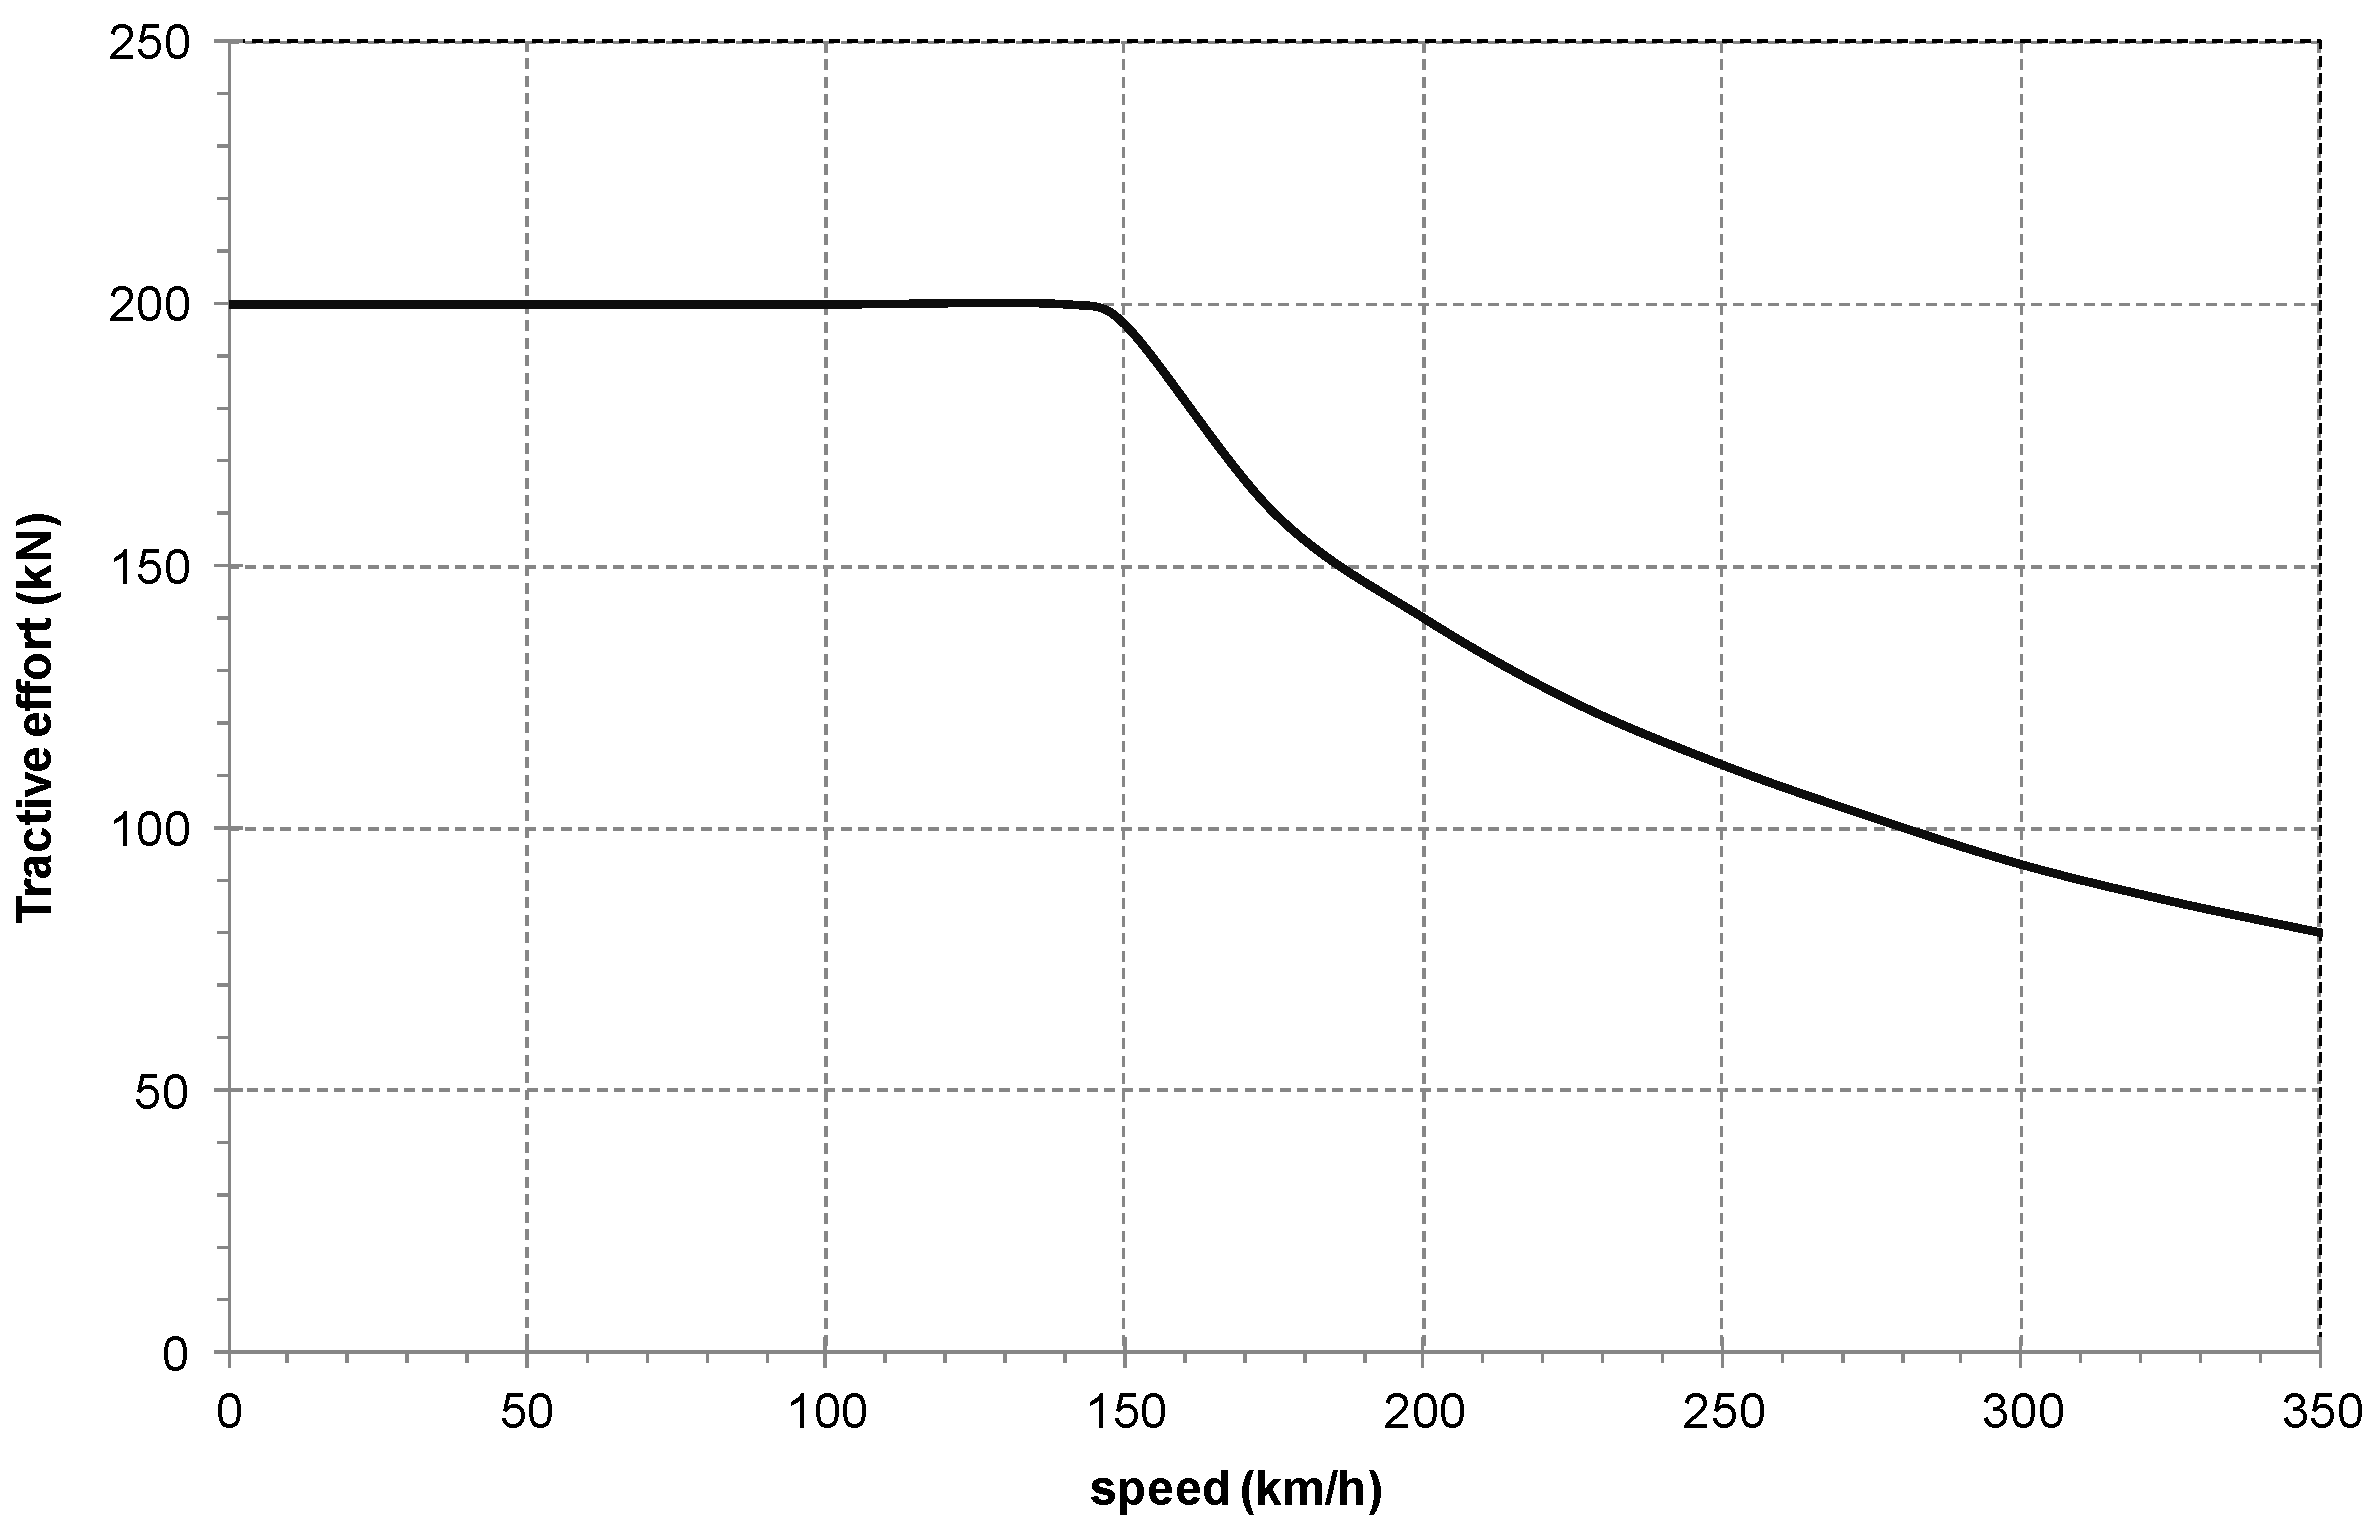
Figure 2.
Finite element simulation: IM results (Air gap flux per pole = 0.04305 Wb).

Figure 3.
Finite element simulation: IM results (Air gap flux density, max. value ≈ 0.8 T).

Figure 4.
Finite element simulation: IM results (Static torque, rms value = 4155 N∙m).

Figure 5.
Mechanical losses obtained by manufacturer tests and analytical calculation.

Figure 6.
Iron losses obtained by manufacturer tests and analytical calculation (f = 50 Hz).

Figure 7.
Induction motor equivalent circuit including all losses.
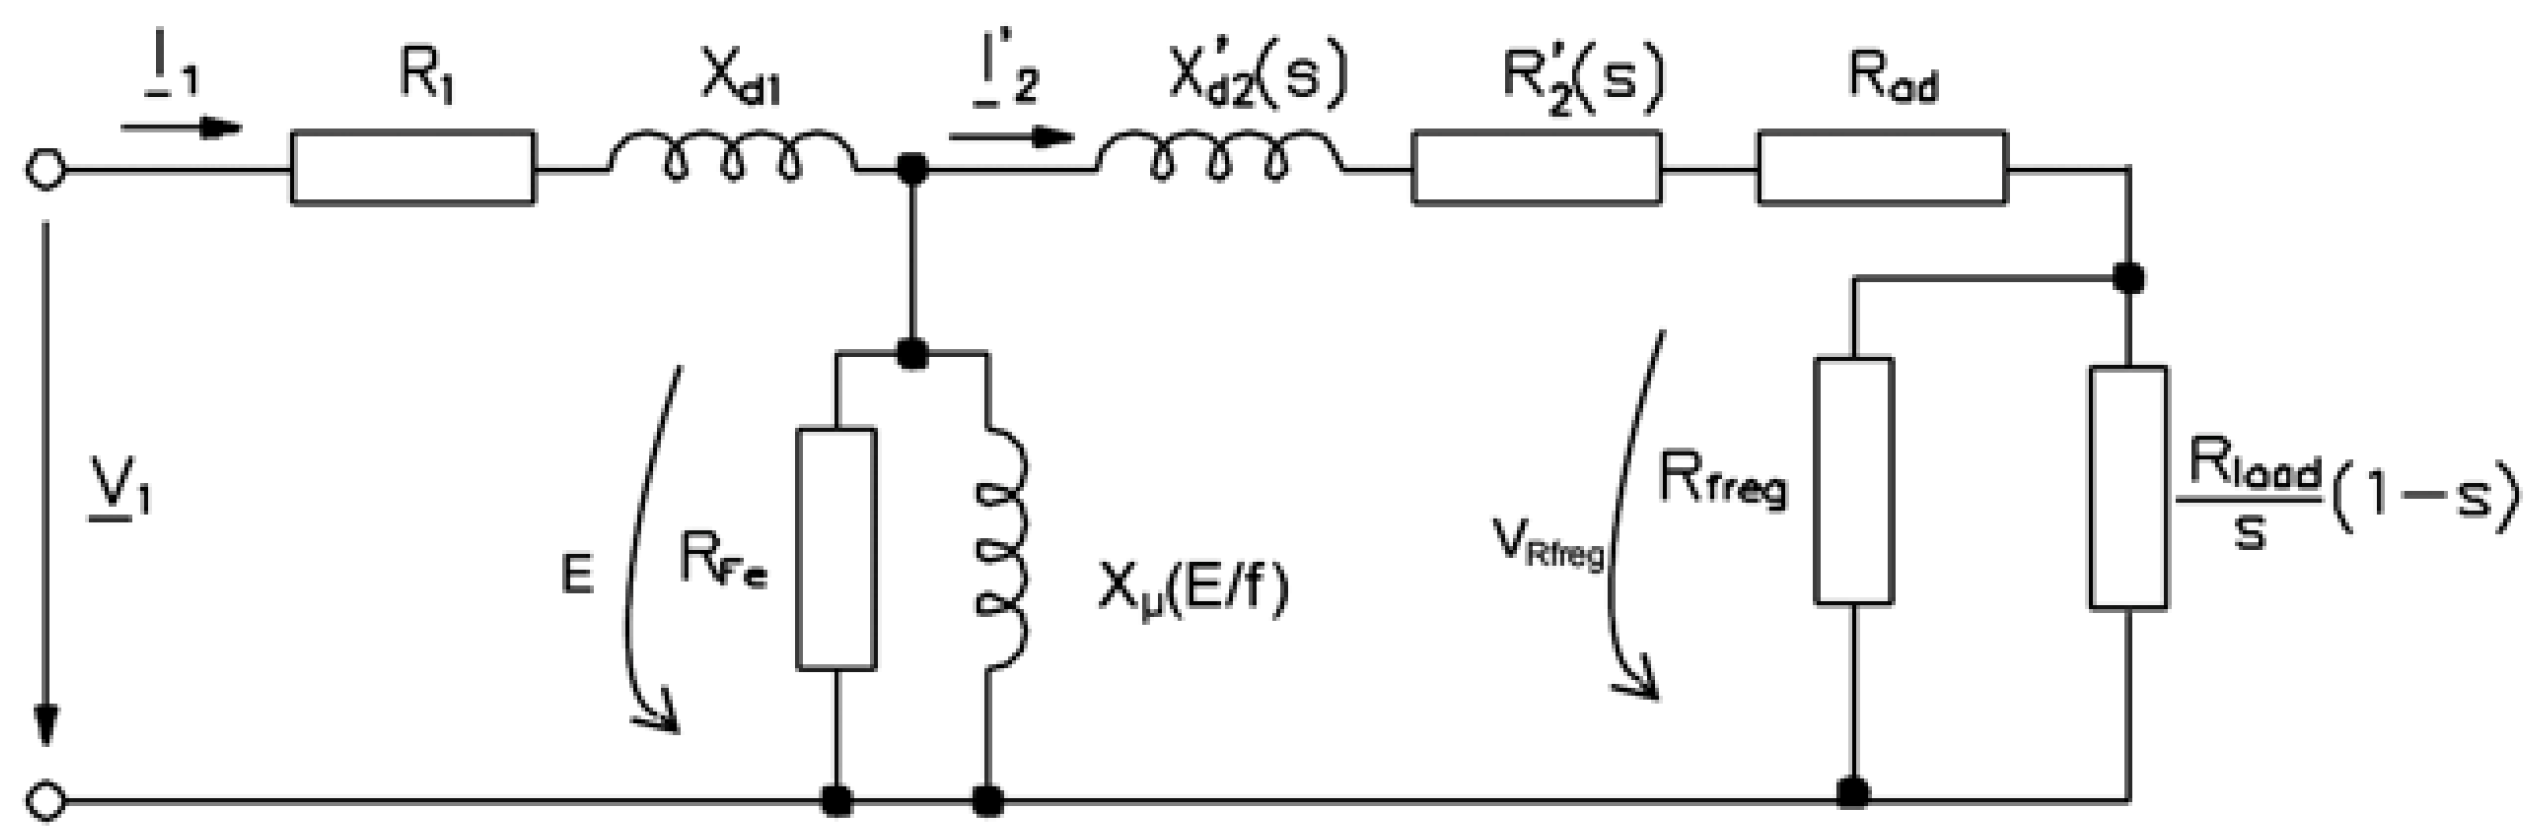
Figure 8.
Magnetizing inductance evolution with air gap flux.

Figure 9.
Output power at different operation frequencies.

Figure 10.
Efficiency at different operation frequencies.

Figure 11.
PMSM rotor structures: (a) Surface magnets (SPM); (b) Interior magnets with radial magnetization (RM-IPM); (c) Interior magnets with tangential magnetization (TM-IPM).
Figure 11.
PMSM rotor structures: (a) Surface magnets (SPM); (b) Interior magnets with radial magnetization (RM-IPM); (c) Interior magnets with tangential magnetization (TM-IPM).
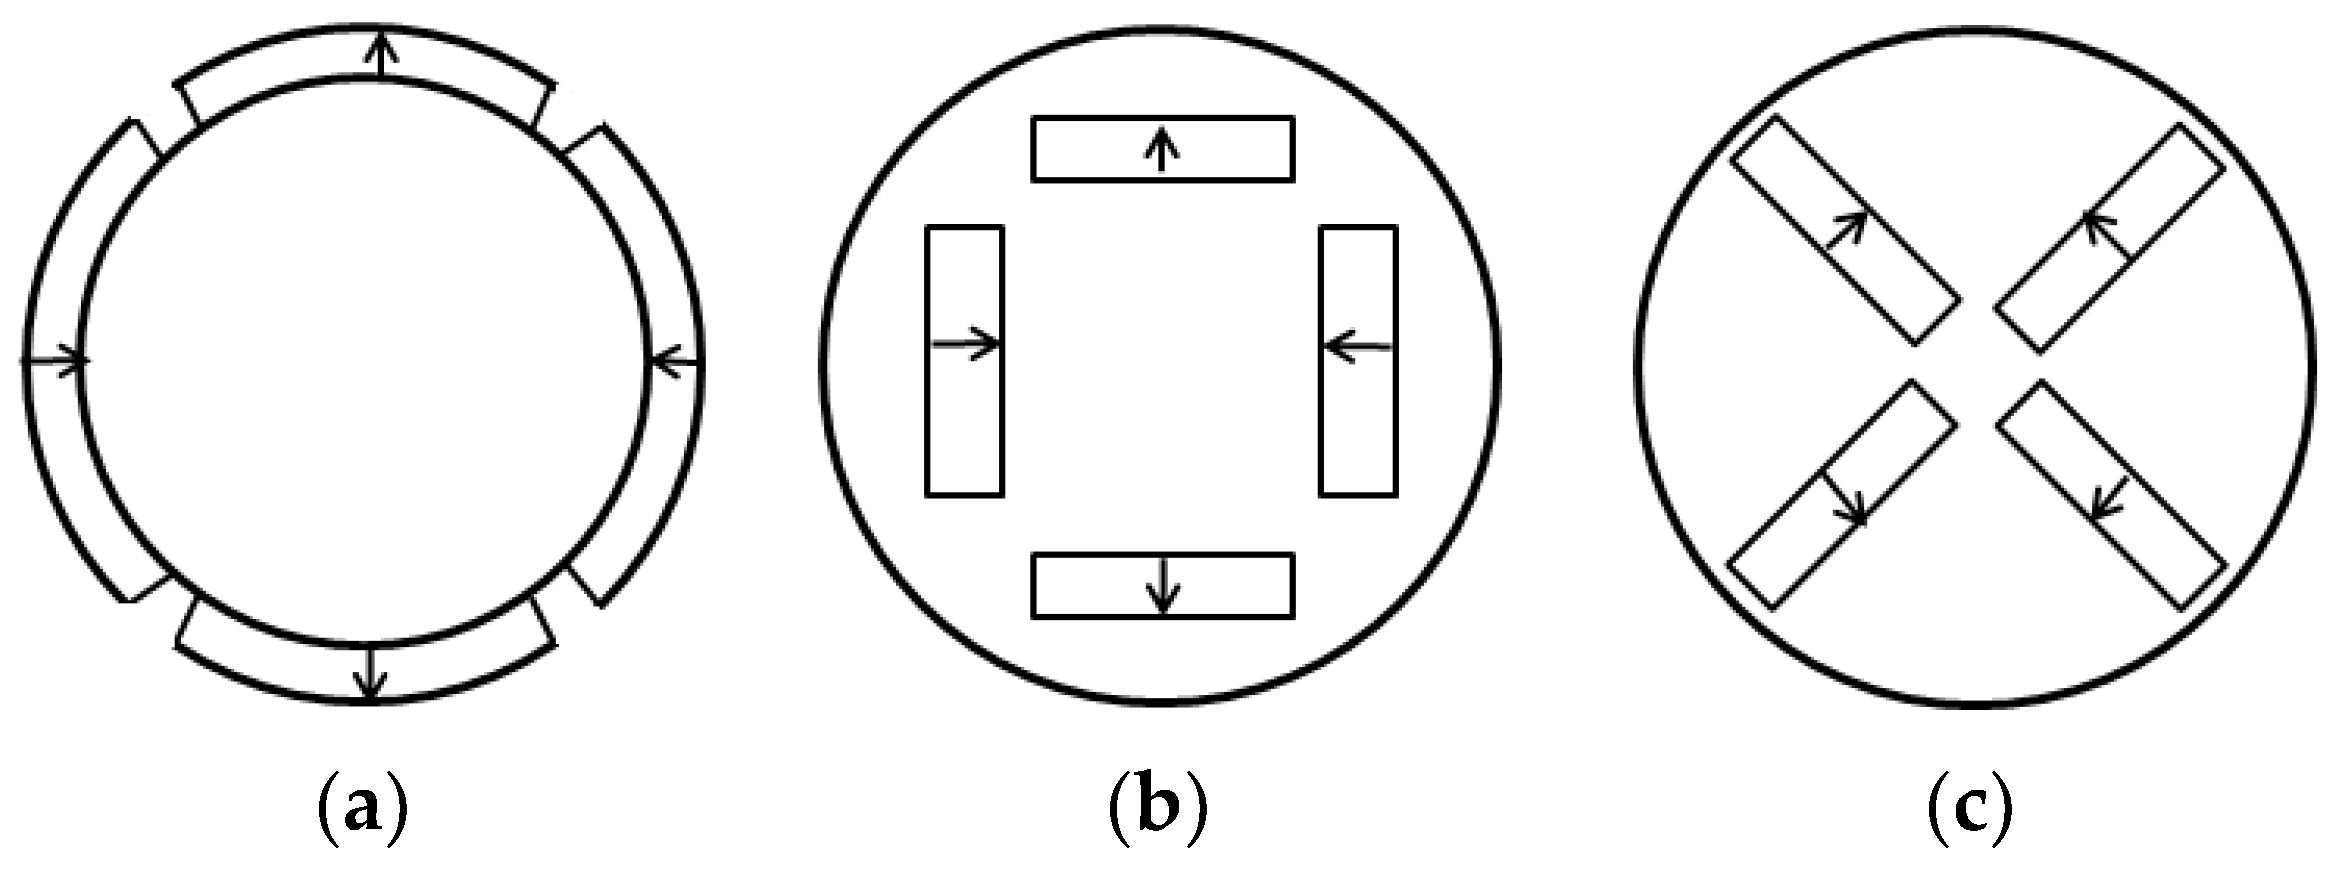
Figure 12.
Finite element simulation: SPM results (Air gap flux per pole = 0.06371 Wb).
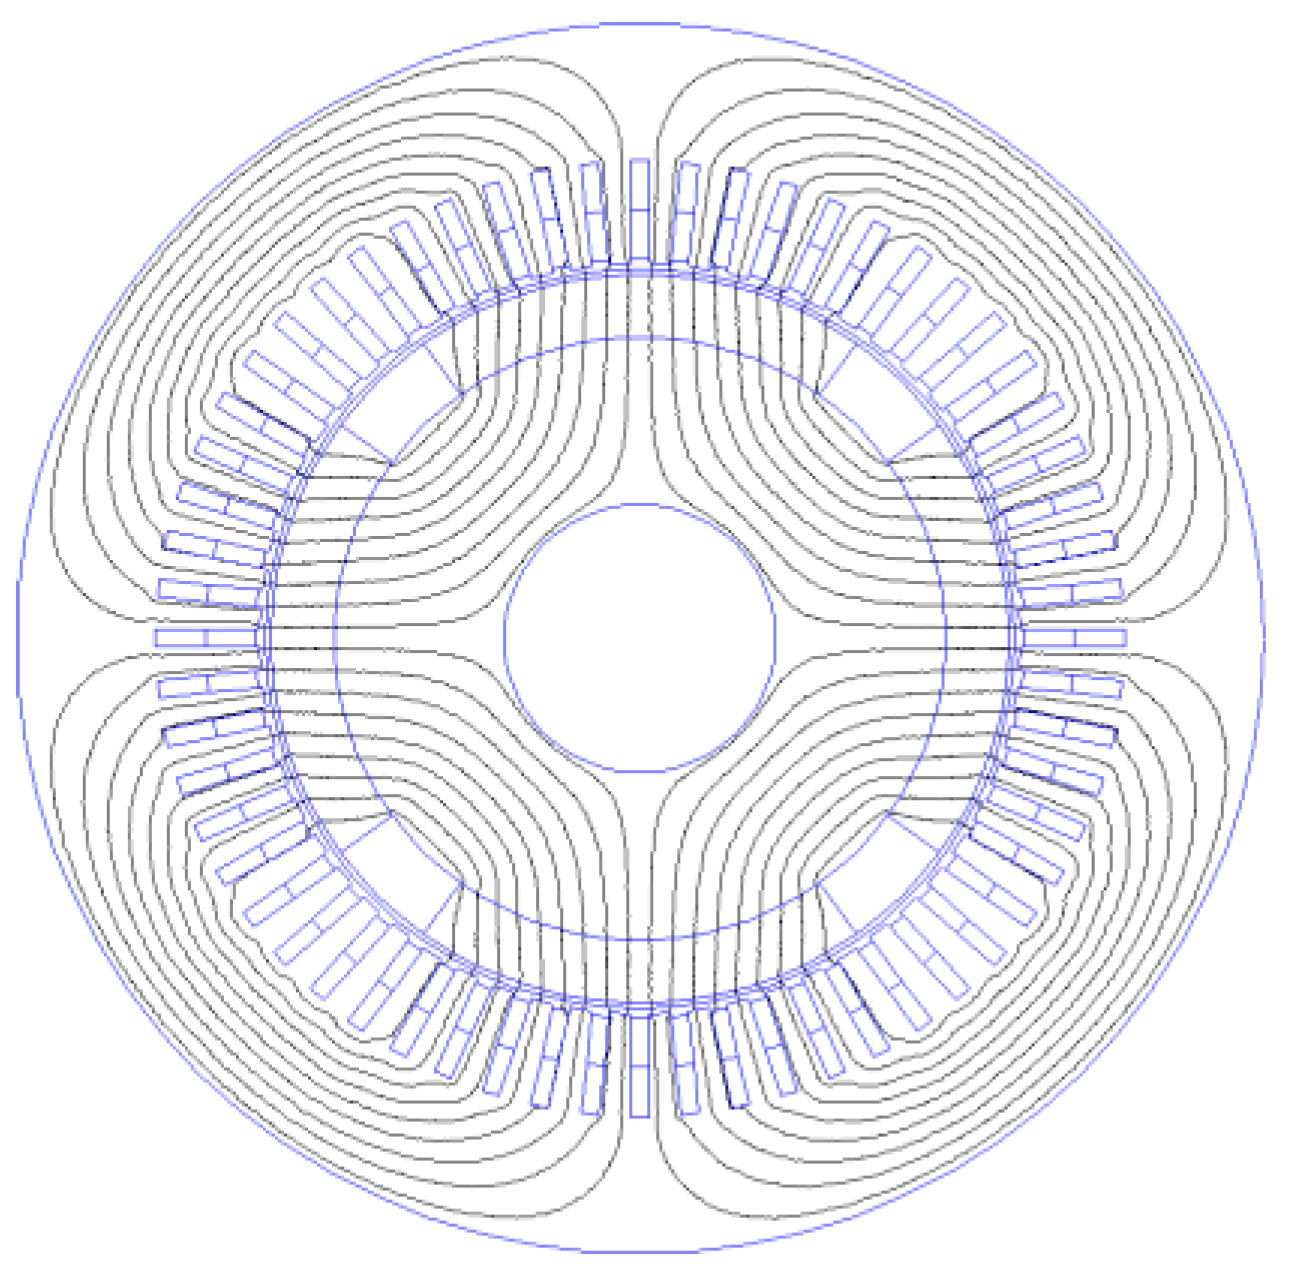
Figure 13.
Finite element simulation: IPM results: (a) RM-IPM (Air gap flux per pole = 0.04905 Wb); (b) TM-IPM (Air gap flux per pole = 0.05946 Wb).
Figure 13.
Finite element simulation: IPM results: (a) RM-IPM (Air gap flux per pole = 0.04905 Wb); (b) TM-IPM (Air gap flux per pole = 0.05946 Wb).
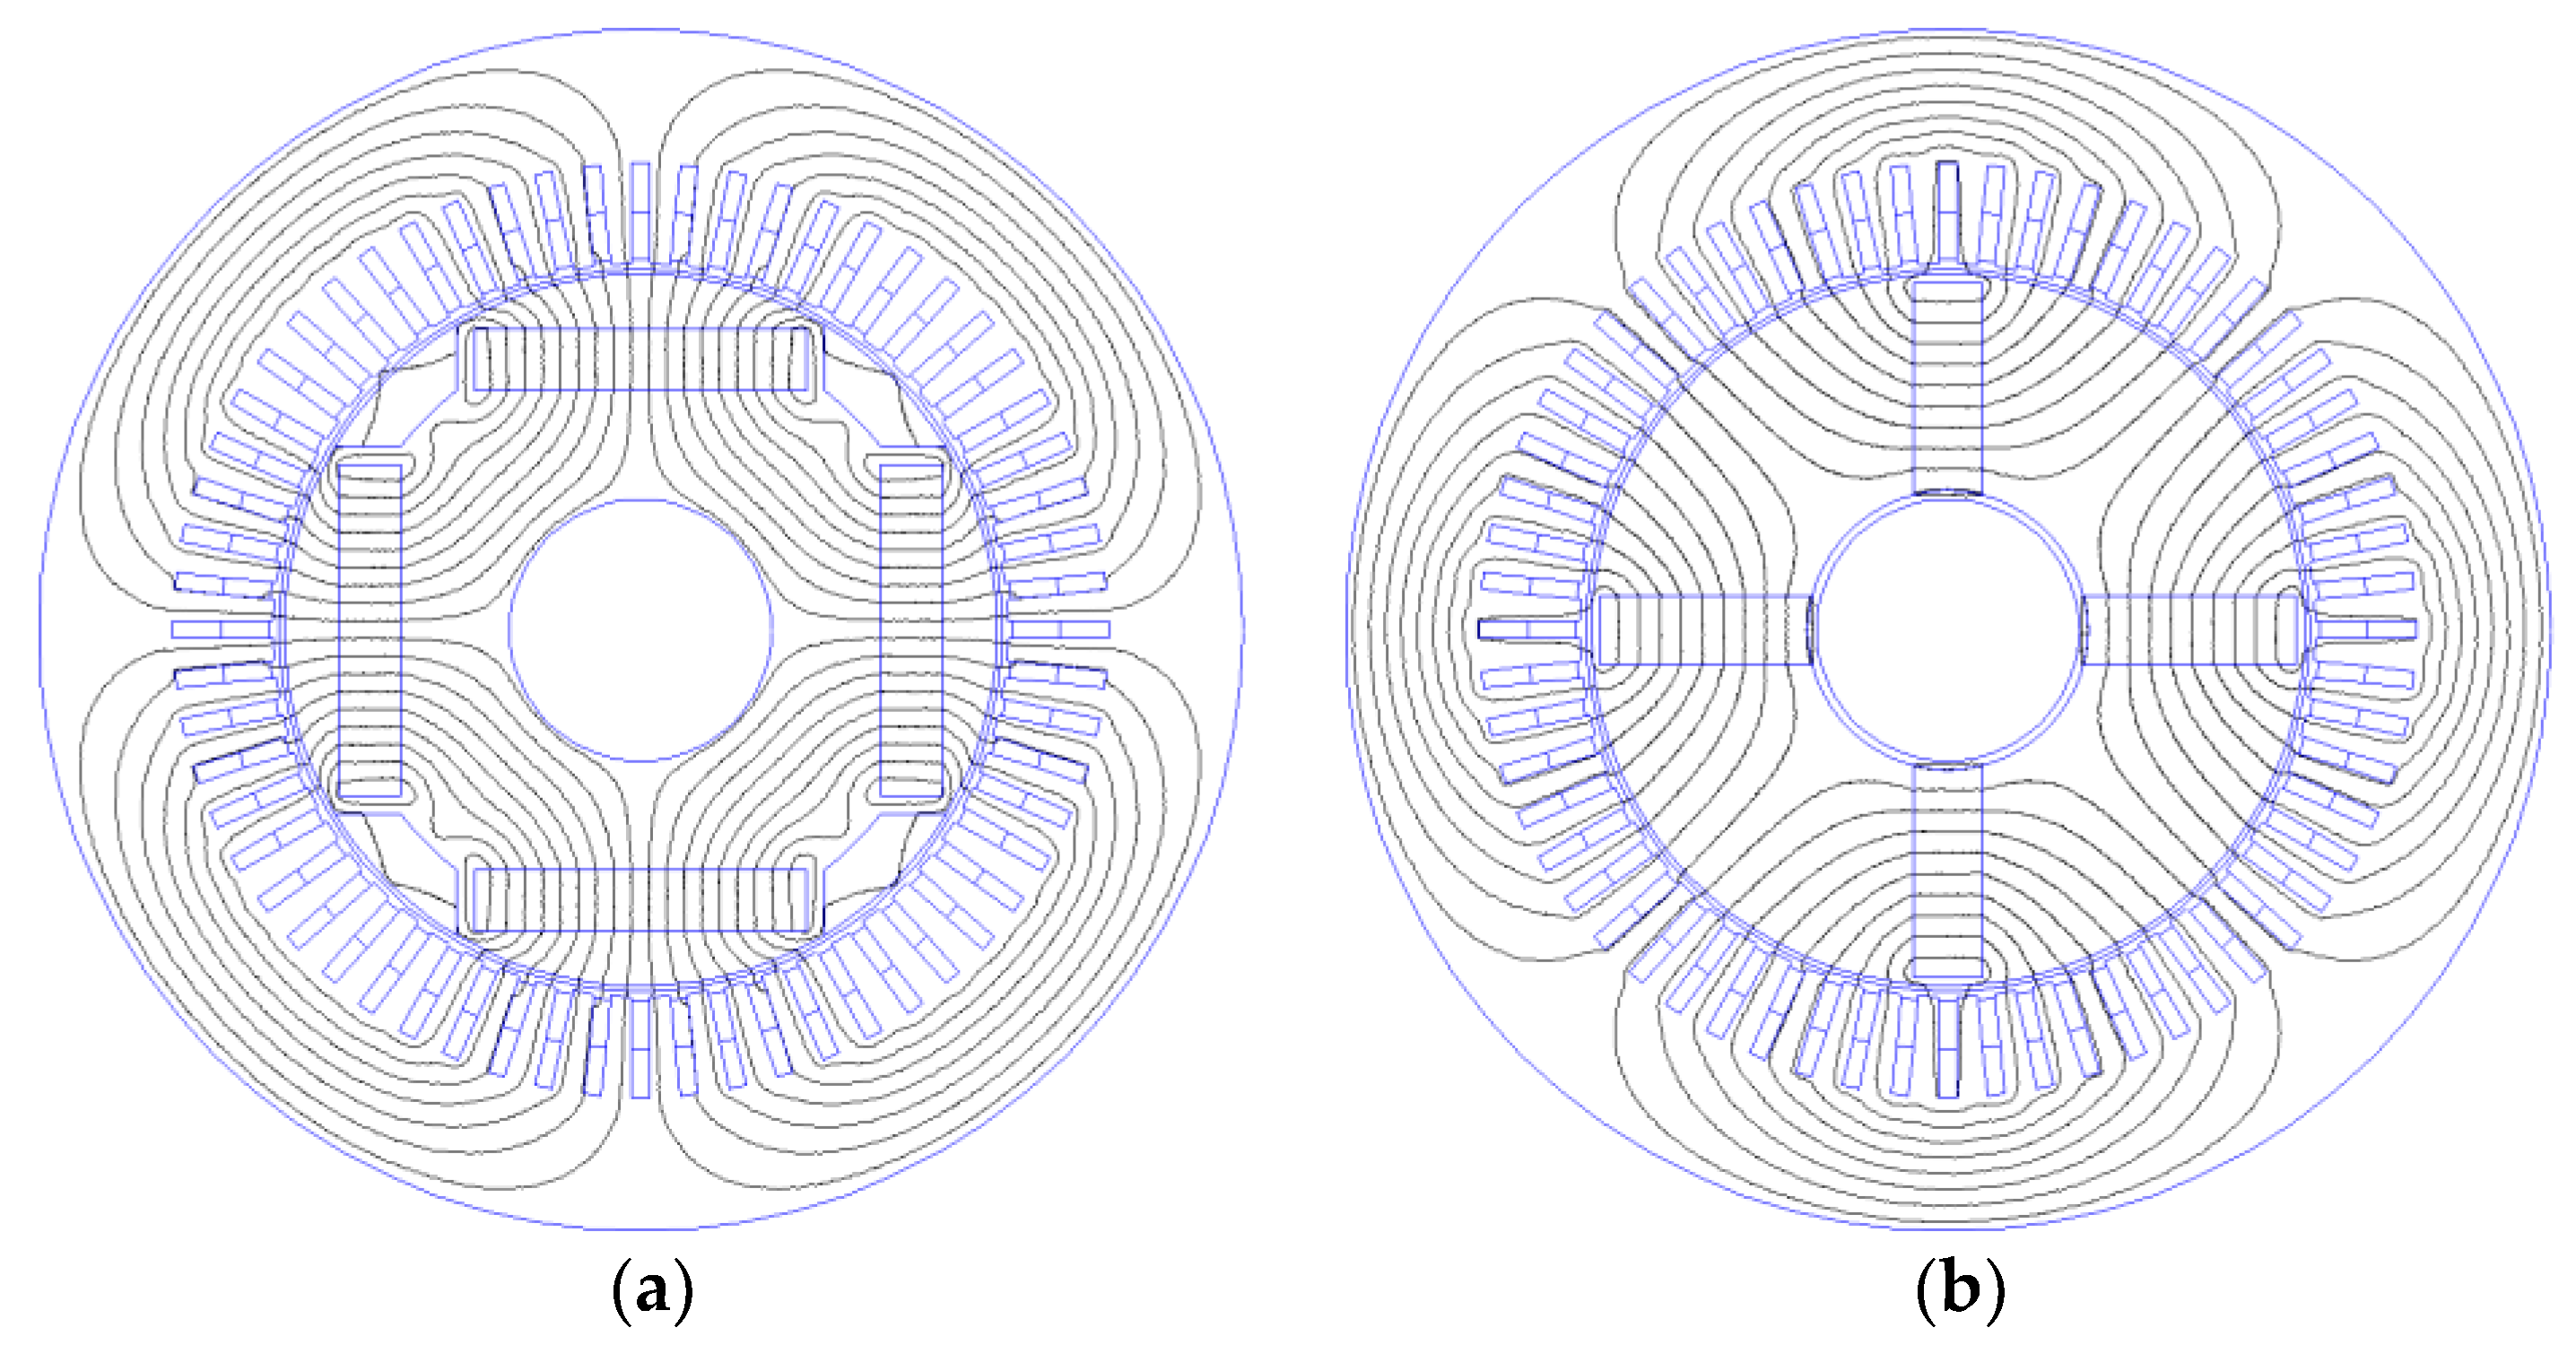
Figure 14.
Finite element simulation: SPM results (Air gap flux density; max. value ≈ 1 T).
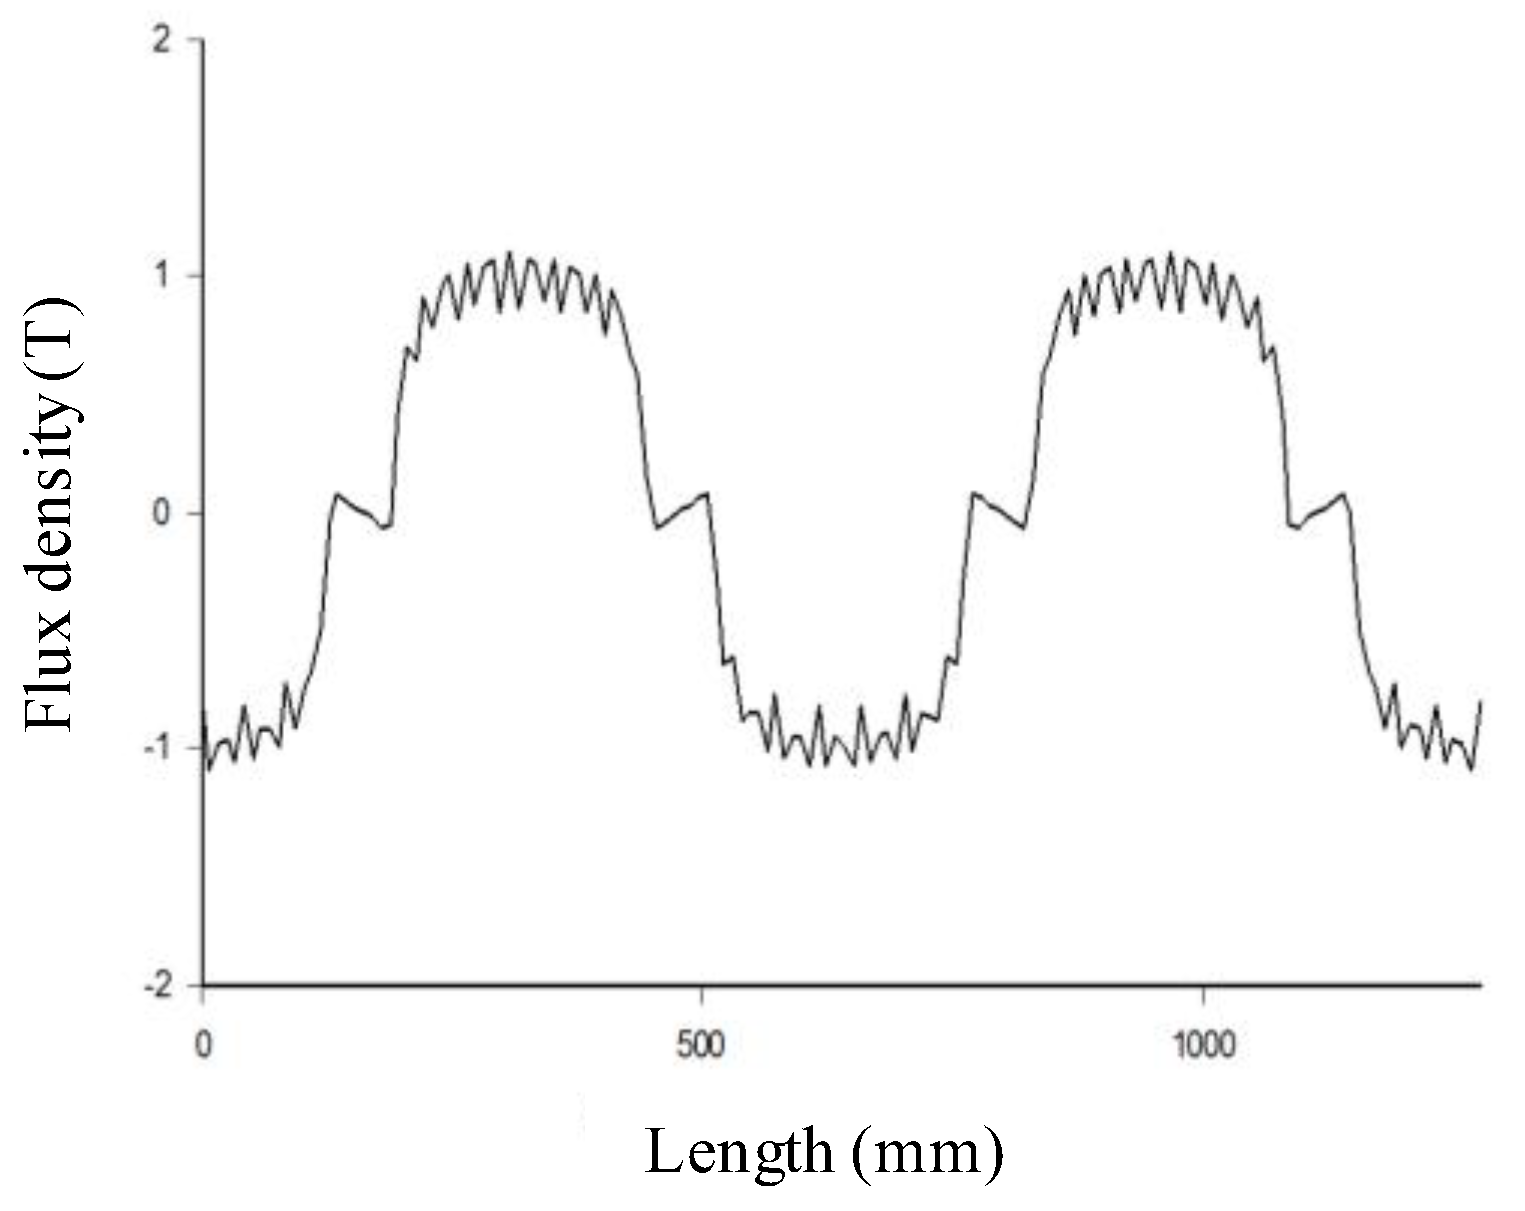
Figure 15.
Finite element simulation: IPM results: (a) RM-IPM (Air gap flux density; max. value ≈ 0.8T); (b) TM-IPM (Air gap flux density; max. value ≈ 0.7 T).
Figure 15.
Finite element simulation: IPM results: (a) RM-IPM (Air gap flux density; max. value ≈ 0.8T); (b) TM-IPM (Air gap flux density; max. value ≈ 0.7 T).

Figure 16.
Finite element simulation: static torque results (rms values: SPM = 4109 N∙m; RM-IPM = 3320 N∙m; TM-IPM = 3159 N∙m).
Figure 16.
Finite element simulation: static torque results (rms values: SPM = 4109 N∙m; RM-IPM = 3320 N∙m; TM-IPM = 3159 N∙m).
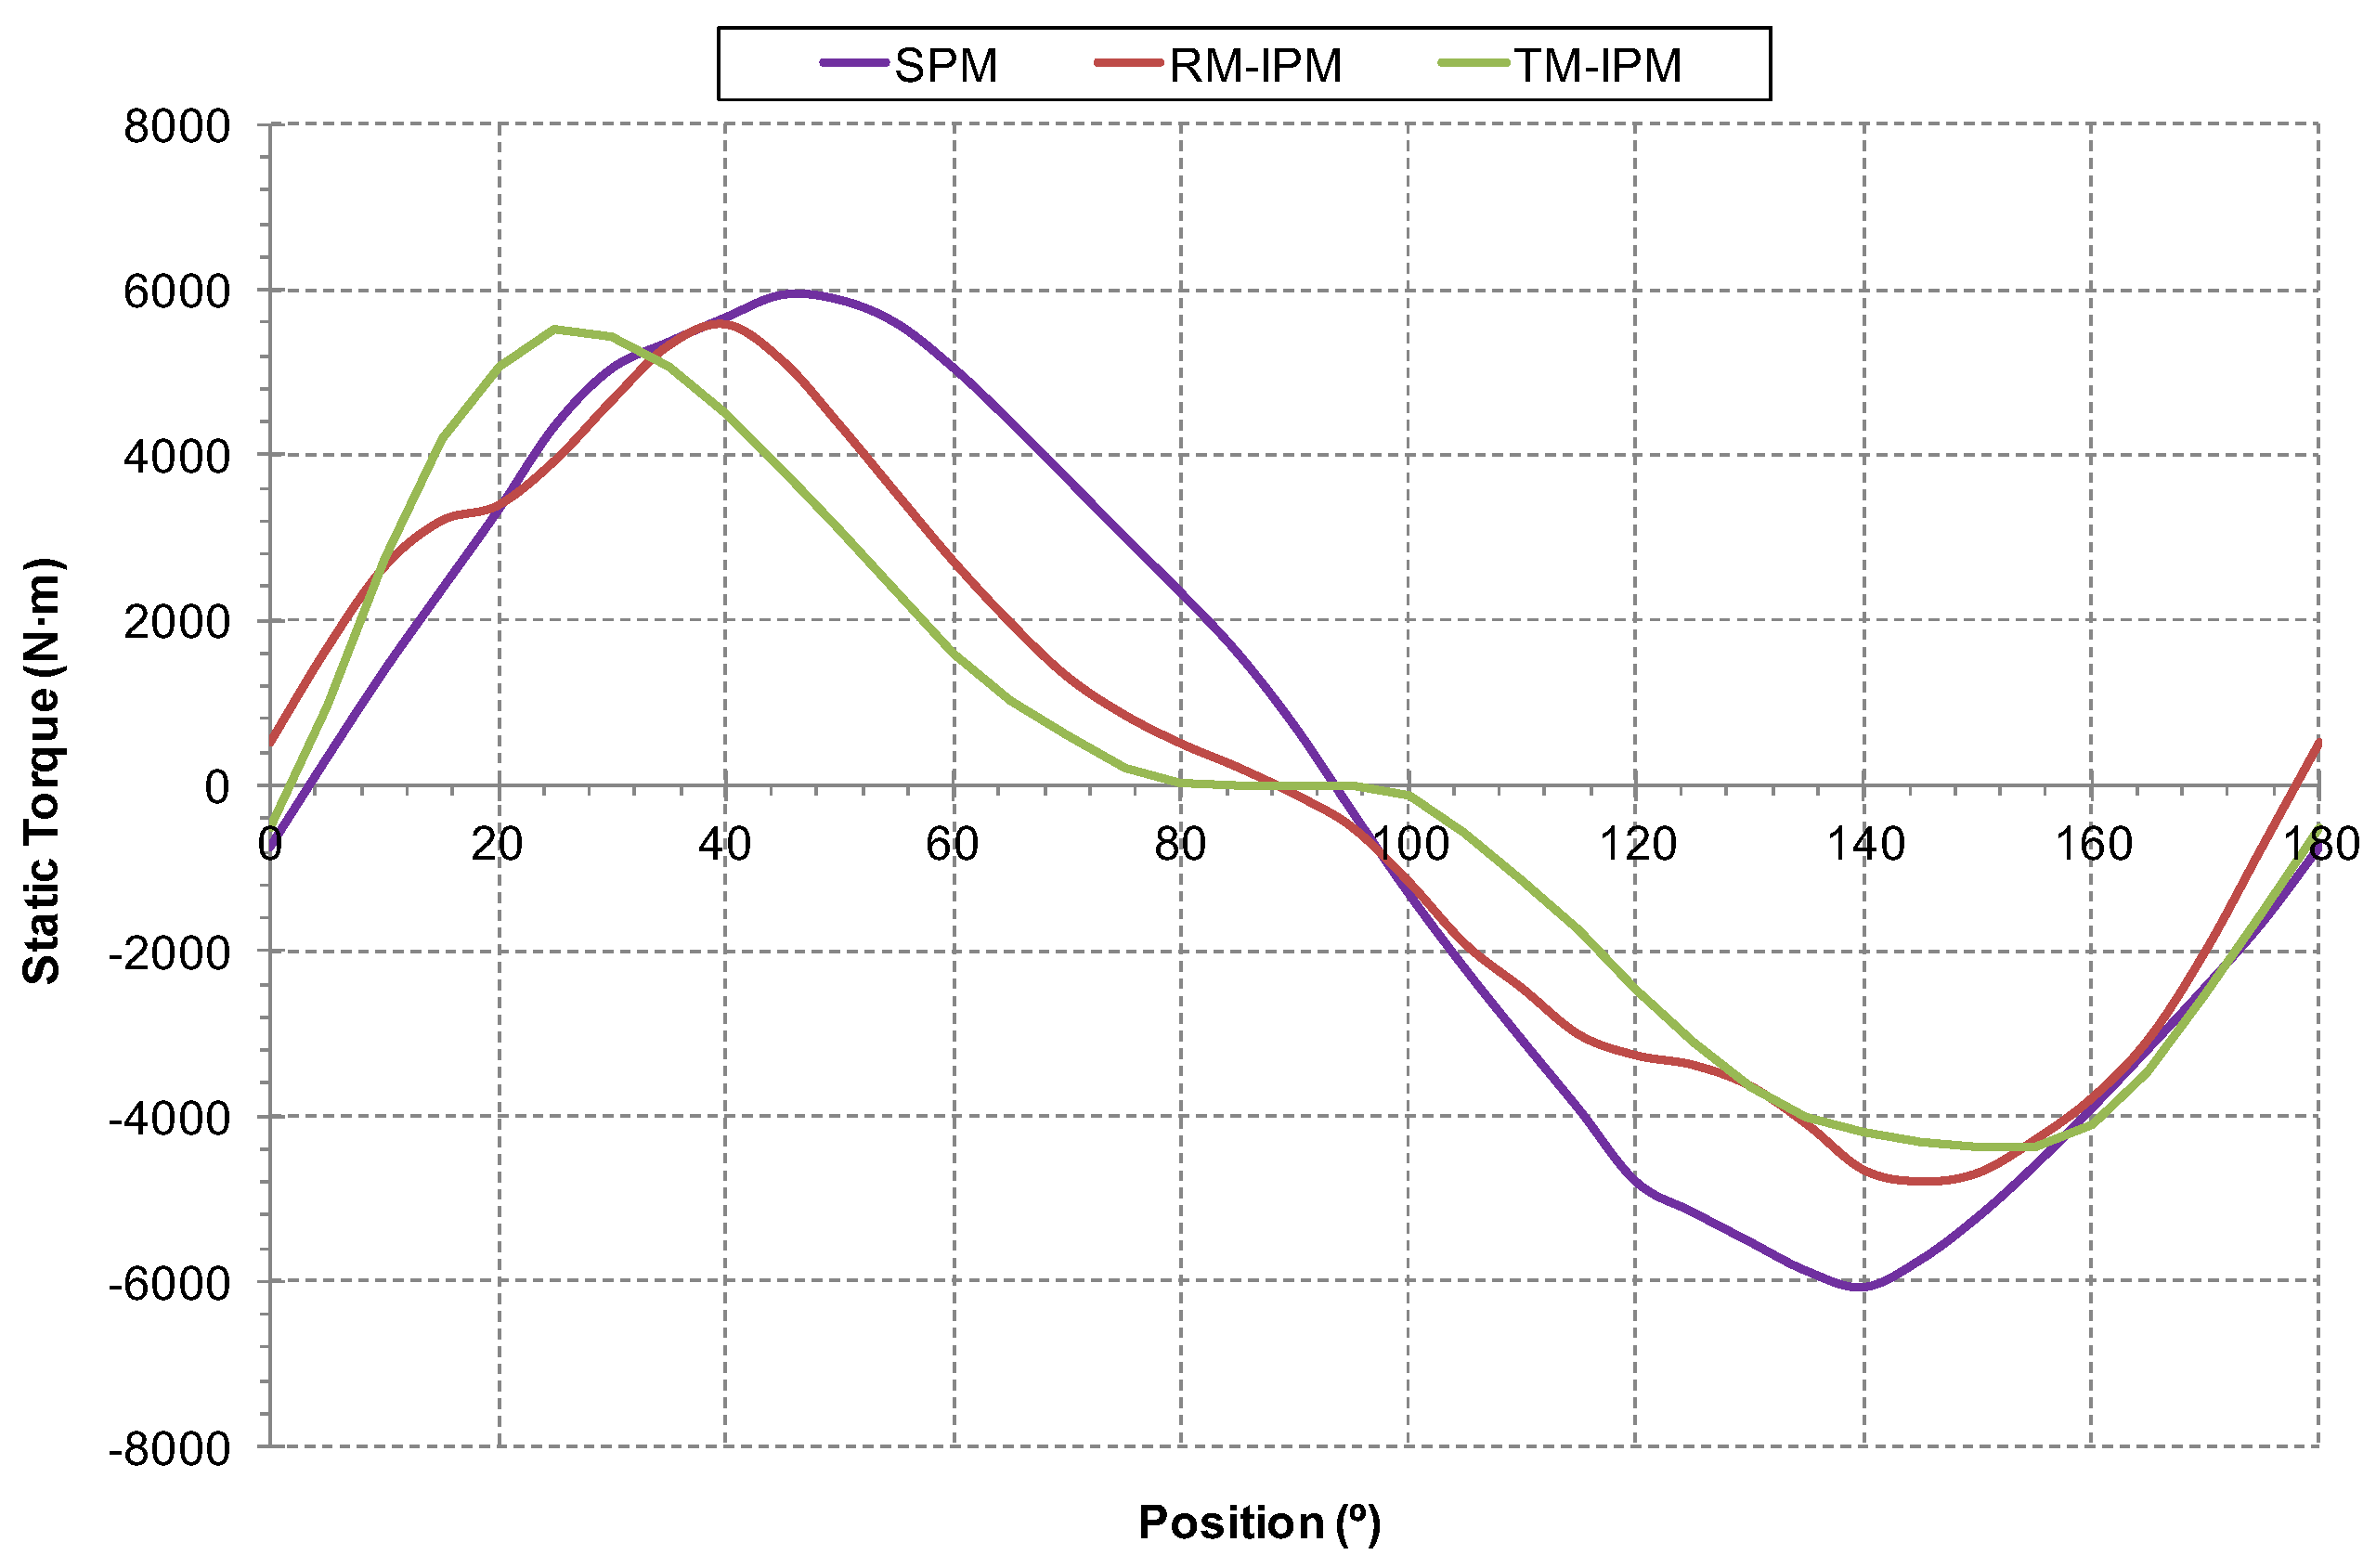
Figure 17.
Efficiency at different operation frequencies: comparative between the three PMSM rotor structures with respect to the IM.
Figure 17.
Efficiency at different operation frequencies: comparative between the three PMSM rotor structures with respect to the IM.
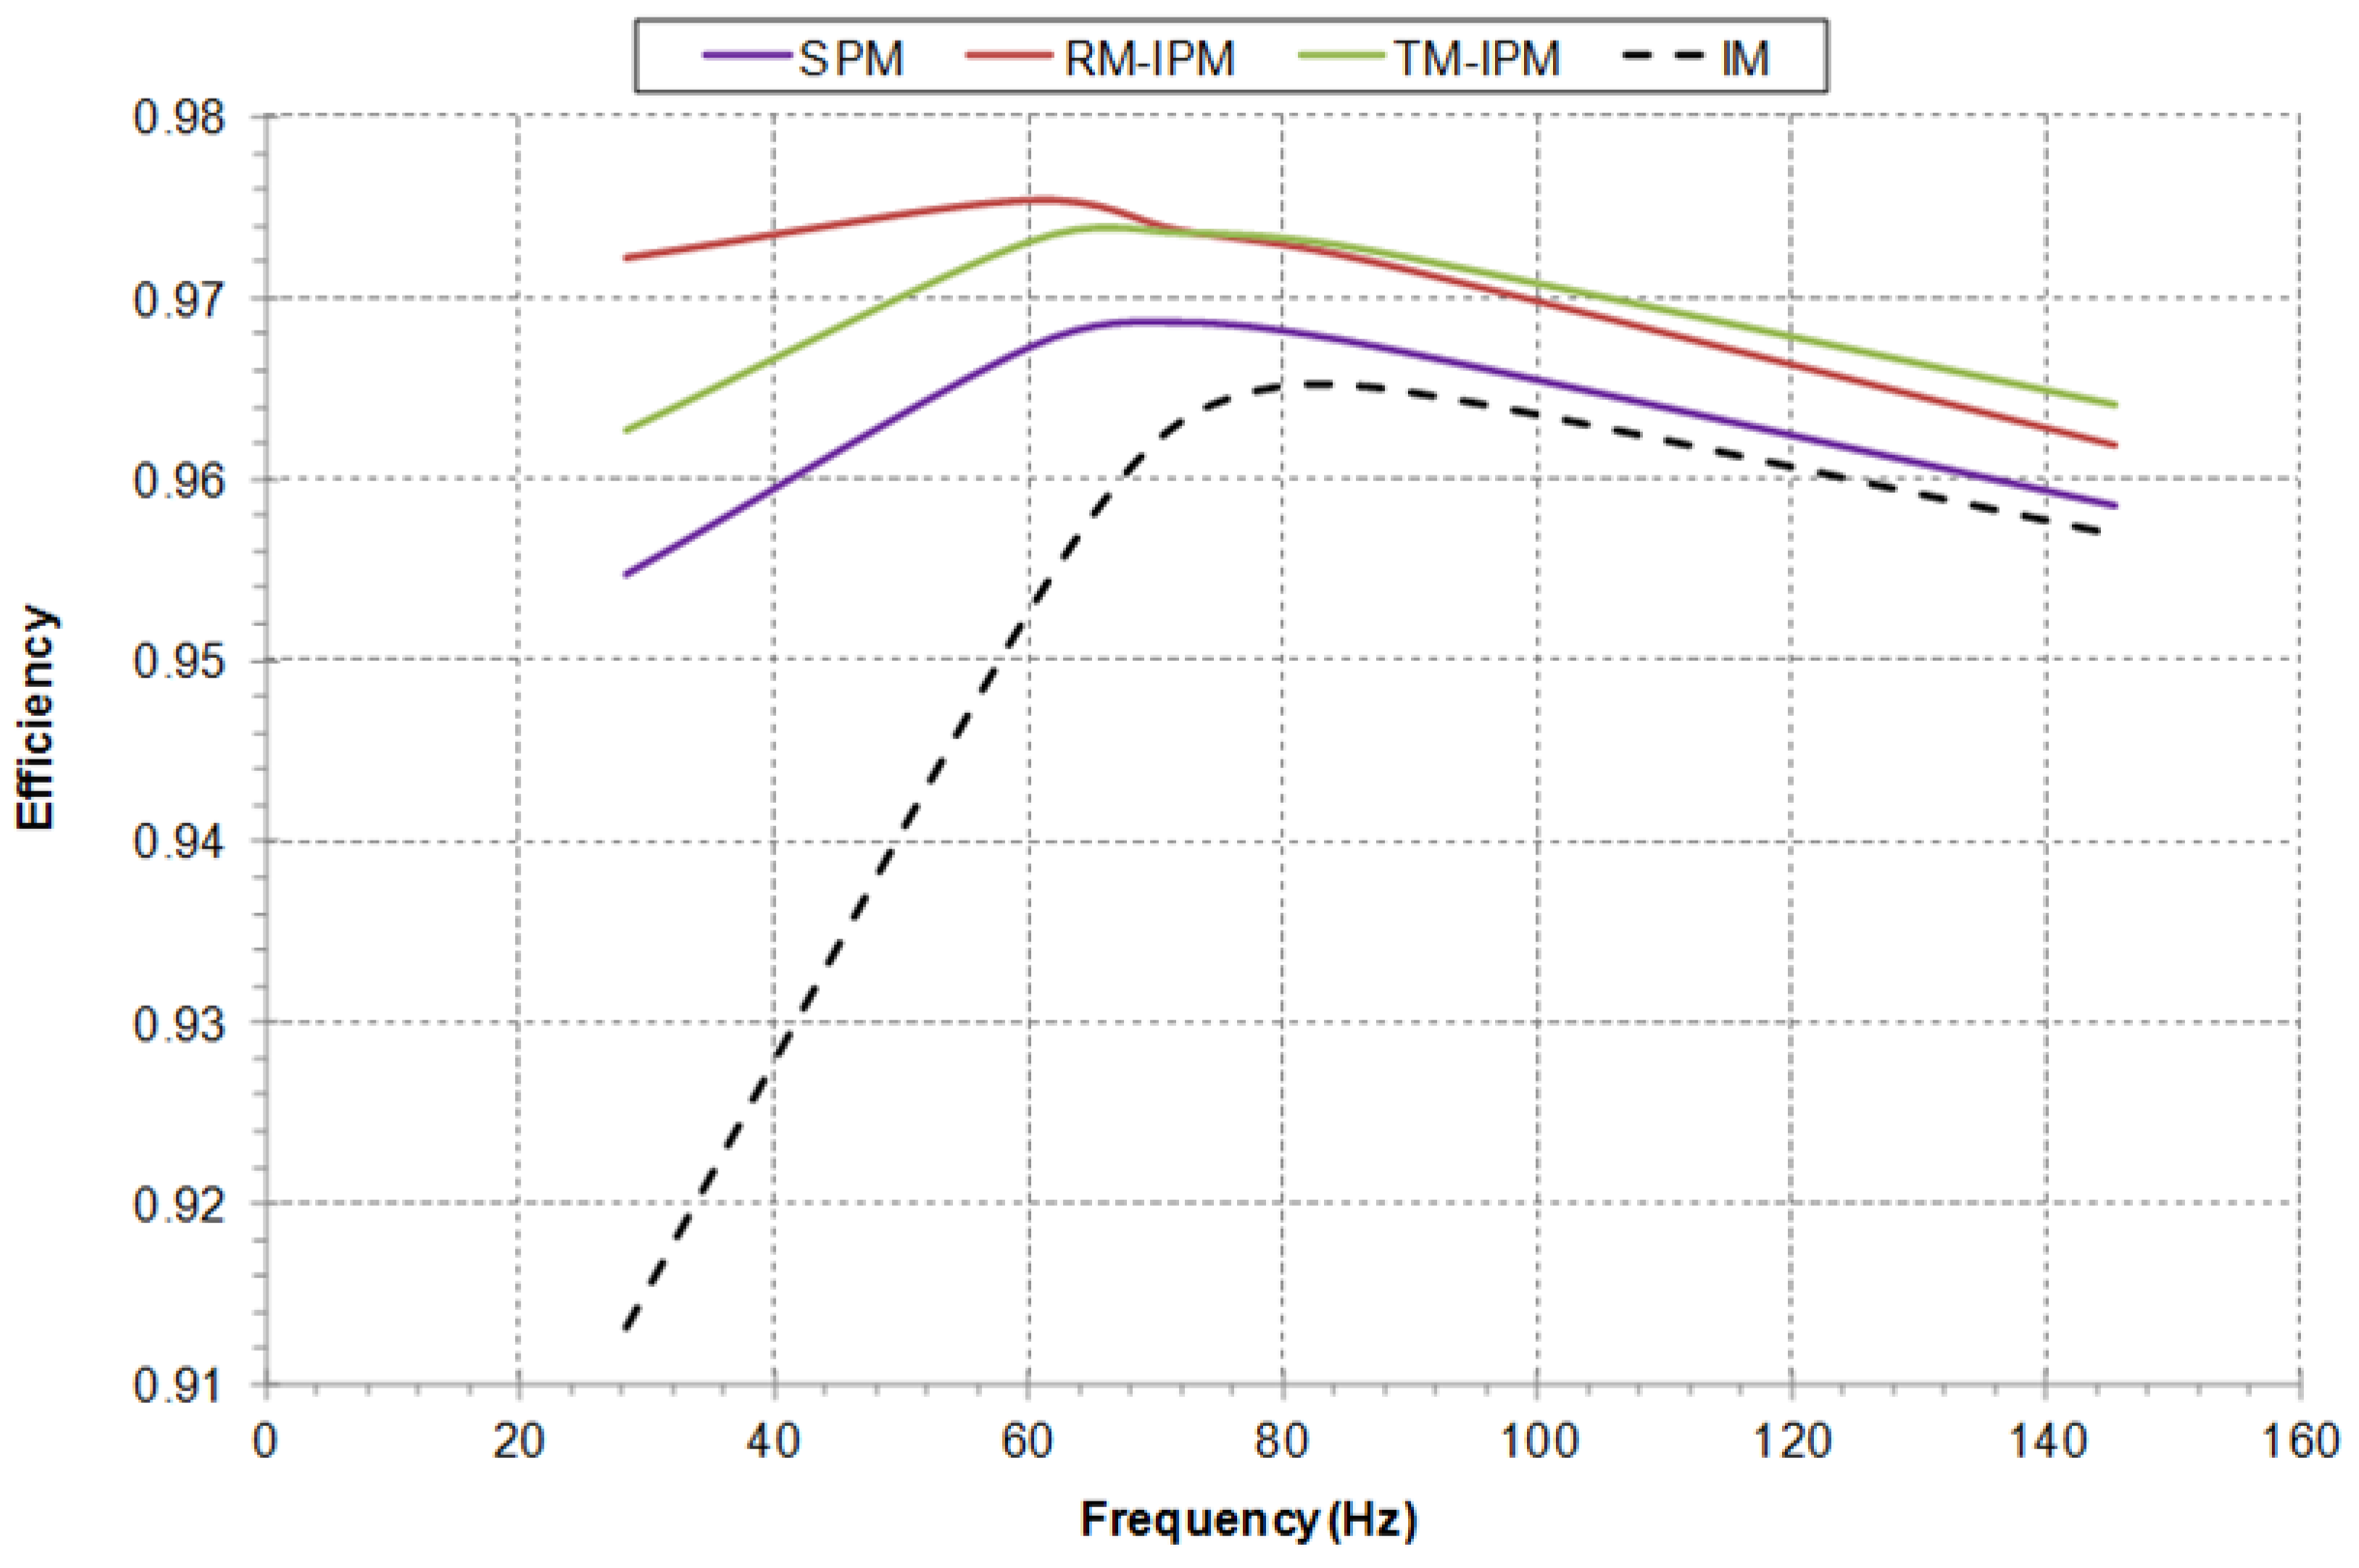
Table 1.
Characteristics of AVE trains classes 102–112.
| Power | 8000 kW |
| Voltage–frequency | 25 kV–50 Hz |
| Number of motors | 8 |
| No load mass | 322 t |
| Length | 200 m |
| Maximum speed | 330 km/h |
| Number of seats | 353 |
| Number of axes | 21 |
Table 2.
Nominal data of the induction motor.
| Power | 1020 kW |
| Voltage | 2183 V |
| Current | 312 A |
| Torque | 3765 N∙m |
| Number of poles | 4 |
| Speed | 2590 r/min |
| Frequency | 87 Hz |
Table 3.
Equivalent circuit parameters under rated conditions.
| R1 | 0.0445 Ω |
| R’2 | 0.0406 Ω |
| Ld1 | 0.00102 H |
| L’d2 | 0.00082 H |
| Lμ | 0.03013 H |
Table 4.
Inductances.
| Single | Direct Axis | Quadrature Axis | |
|---|---|---|---|
| L (mH) | Ld (mH) | Lq (mH) | |
| SPM | 4.72 | ||
| RM-IPM | 9.12 | 6.38 | |
| TM-IPM | 8.87 | 15.85 |
Table 5.
Comparison of motor performance parameters between IM and PMSM rotor structures.
| Air Gap Flux | Max. Air Gap | Static | Nominal | Power | |
|---|---|---|---|---|---|
| per Pole | Flux Density | Torque | Efficiency | Density | |
| (Wb) | (T) | (N∙m) | (pu) | (kW/kg) | |
| IM | 0.04305 | 0.8 | 4155 | 0.9651 | 0.7379 |
| SPM | 0.06371 | 1 | 4109 | 0.9674 | 0.8155 |
| RM-IPM | 0.04905 | 0.8 | 3320 | 0.9721 | 0.7837 |
| TM-IPM | 0.05946 | 0.7 | 3159 | 0.9725 | 0.7868 |
Table 6.
Savings, amortization of materials and CO2 emission reduction of PMSM structures compared to IM.
Table 6.
Savings, amortization of materials and CO2 emission reduction of PMSM structures compared to IM.
| Annual Energy Savings | Annual Financial Savings | Amortization of Materials | Annual CO2 Emission Reduction | |
|---|---|---|---|---|
| (kWh) | (€) | (days) | (kg) | |
| SPM | 18,628 | 1304 | 986 | 11,177 |
| RM-IPM | 47,250 | 3307 | 347 | 28,350 |
| TM-IPM | 52,634 | 3684 | 187 | 31,580 |
© 2018 by the authors. Licensee MDPI, Basel, Switzerland. This article is an open access article distributed under the terms and conditions of the Creative Commons Attribution (CC BY) license (http://creativecommons.org/licenses/by/4.0/).
Share and Cite
MDPI and ACS Style
Torrent, M.; Perat, J.I.; Jiménez, J.A. Permanent Magnet Synchronous Motor with Different Rotor Structures for Traction Motor in High Speed Trains. Energies 2018, 11, 1549. https://doi.org/10.3390/en11061549
AMA Style
Torrent M, Perat JI, Jiménez JA. Permanent Magnet Synchronous Motor with Different Rotor Structures for Traction Motor in High Speed Trains. Energies. 2018; 11(6):1549. https://doi.org/10.3390/en11061549
Chicago/Turabian StyleTorrent, Marcel, José Ignacio Perat, and José Antonio Jiménez. 2018. "Permanent Magnet Synchronous Motor with Different Rotor Structures for Traction Motor in High Speed Trains" Energies 11, no. 6: 1549. https://doi.org/10.3390/en11061549
Note that from the first issue of 2016, this journal uses article numbers instead of page numbers. See further details here.