Article

Performance and Emission Analysis of Rubber Seed, Palm, and Their Combined Blend in a Multi-Cylinder Diesel Engine

by
Ibrahim Khalil Adam
1,2,
Abdul Rashid Abdul Aziz
1,
Morgan R. Heikal
1,3,
Suzana Yusup
4,
Firmansyah
1,*,
Ahmad Shahrul Ahmad
1 and
Ezrann Zharif Zainal Abidin
1
1
Centre for Automotive Research and Electric Mobility, Universiti Teknologi PETRONAS, 32610 Seri Iskandar, Perak Darul Ridzuan, Malaysia
2
Mechanical Engineering Department, Blue Nile University, 143 Er Roseires, Ad Damazin, Sudan
3
Advance Engineering Centre, University of Brighton; Brighton BN2 4GJ, UK
4
Center of Biofuel and Biochemical Research, Biomass Processing Laboratory; Universiti Teknologi PETRONAS, 32610 Seri Iskandar, Perak Darul Ridzuan, Malaysia
*
Author to whom correspondence should be addressed.
Energies 2018, 11(6), 1522; https://doi.org/10.3390/en11061522
Submission received: 12 February 2018 / Revised: 18 March 2018 / Accepted: 21 March 2018 / Published: 12 June 2018
(This article belongs to the Section A: Sustainable Energy)

Abstract

:
In consideration of its vast resources in Malaysia, the potential use of a nonedible biodiesel source from rubber seed oil (RSO) is explored. However, a mixture with a high saturation content feedstock is required to increase its oxidation stability, which is caused by its 78.93% unsaturation content. Two blends of 20% and 50% v/v rubber seed biodiesel (RB) or palm biodiesel (PB) and varying percentage mixtures of these two feedstock oils biodiesel (RPB) were evaluated on combustion performance in a 55 kW multi-cylinder diesel engine at full load conditions. The results showed that feedstock blending offered benefits in terms of fuel properties enhancement, improved engine performance, and reduced emissions. In comparison to RB, RPB showed higher brake power (BP) of 1.18–2.97% and lower brake specific fuel consumption (BSFC) of 0.85–3.69%, smoke opacity (11.89–14.19%), carbon monoxide (CO) of 2.48–6.93%, hydrocarbon (HC) of 2.36–9.34%, and Nitrogen oxide (NO) emissions of 2.34–5.93%. The cylinder pressures and heat release rates (HRR) of RPB blends were 8.47–11.43% and 36.02–46.61% higher than diesel, respectively. The start of combustion angles (SOC) of RB and RPB blends were from −13 to −15 °C and from −13.2 to −15.6 crank angle degree (°CA) before top dead center (BTDC), but the combustion delays were 6–8 °C and 5.4–7.8 °C shorter when compared to diesel fuel which were −10 °C BTDC and 11 °C, respectively. It can be concluded that RPB blends showed better performance and emissions over the individual rubber seed and palm biodiesel blends and can replace diesel fuel in unmodified engines.

1. Introduction

Industrialization, motorization, and population growth has significantly increased fossil fuel consumption. This phenomenon has resulted in adverse effects on human health and the environment [1]. The environmental effects include changes in rainfall patterns, air quality deterioration, photochemical smog, and global warming [2]. Energy needs and environmental concerns are important factors which drive the search for renewable, clean, and sustainable fuel sources [3]. Biodiesel is one solution to partially replace diesel fuel and reduce carbon emissions. In Malaysia, palm oil is the main biodiesel source and is extensively cultivated. Palm oil biodiesel has higher saturation components and therefore a high cetane number and oxidation stability. In 2007, the Malaysian government launched the B5 blend; however, the government postponed the plan to 2010 because of increases in palm oil prices resulting from extensive use for both food and fuel [4]. B5 (5% biodiesel + 95% diesel) and B7 (7% biodiesel + 93% diesel) were implemented in 2014 and 2015, during which time biodiesel production increased from 451 to 550 million liters [5]. The industrial expansion of palm oil has been limited because of the food versus fuel debate, deforestation, land limitation, energy policy [6] as well as palm oil’s low fluidity at low temperatures (poor cold flow properties) resulting from the low iodine value and high content of palmitic acid [7]. For this reason, Malaysia is diversifying its biodiesel production towards non-edible sources, such as Pongamia pinnata (Karanja), Havea brasiliensis (Rubber seed), and Ceiba pentandra (Kapok) [8,9,10] to reduce the usage of palm oil in the biodiesel industry. Rubber trees belong to the South American Euphorbiaceae family. It grows in tropical or subtropical climates with a minimum rainfall of 1200 mm/year and average temperatures of 28 °C. Malaysia has over 1.2 million hectares of rubber plantations and annual production is estimated to be 1.2 million metric ton per year [11,12], as stated by the association of Natural Rubber Producing Countries (NRPC). The abundance of rubber seeds can be utilized for biodiesel production and may provide solutions for the fuel versus food issues in biodiesel application. One rubber tree annually produces 2.6 kg of rubber seeds which can produce 40–60 wt. % biodiesel [13]. Rubber seed biodiesel has a lower oxidation stability and emits more NOx compared to diesel fuel. According to Knothe et al. [14,15], one approach to overcome these problems is to modify its fatty acid composition through a blend of edible and non-edible oils. Many researchers [16,17,18,19] have studied binary mixtures such as Jatropha-palm oil, mahua-simarouba, and Jatropha-soapnut oil blends and have concluded that they are good potential sources for biodiesel production and improved engine performance and emissions. Sanjid et al. [20] reported on palm-jatropha and their combined blend biodiesel. The tested fuels were PB10, JB10, PBJB5, PB20, JB20, and PBJB10 using a single cylinder diesel engine. The combined blends of PBJB5 showed 9.53% lower CO, 3.69% lower HC, 7.55% higher BSFC, and 1.07% lower BP. However, for PBJB10, these values were 20.49%, 7.81%, 19.82%, and 1.12% respectively. In comparison to palm biodiesel blends, PBJB5 and PBJB10 showed 2.44–6.54% higher BSFC, 1.18–3.21% higher CO, and 1–1.8% lower NO; however, in comparison to jatropha biodiesel blends, combined blends showed 4.24–4.295% lower BSFC, 2.66–3.84% lower CO, 1.53–1.725% lower HC, and similar NO emissions. Habibullah et al. [21] studied the effect of PB30, CB30, and PB15CB15 and reported lower BP, BTE, CO, and HC of 3.92–4.71%, 3.84–5.03%, 13.75–17.97%, and 18.26–31.21% respectively, whereas BSFC and NOx emissions increased by 8.55–9.03% and 3.13–5.6% respectively for the blends in comparison to diesel fuel. PB15CB15 achieved better performance than CB30, the lowest BSFC over PB30 and CB30 individually; 1.12% higher BTE than PB30; 1.22% higher and 1.20% lower NO emission compared to PB30 and CB30, respectively. In a separate study, the same researchers [22] investigated the effect of 20% v/v blend of palm and coconut biodiesel and their combined blend of PB15CB5, PB10CB10, and PB5CB15 with the same operating condition. A lower BP of 1.72%, higher BSFC of 4.07%, and higher NOx emission of 4.49% were observed with the CB20 blend, but the PB20 blend showed a similar BP and a higher BSFC and NOx (3.24% and 1.79%, respectively) than diesel fuel. The combined blends reduced the NOx and HC emissions by 0.54–1.85% and 4.18–6.27% respectively, but the BSFC increased by 3.37–3.83% compared to diesel. Arbab et al. [23] optimized the blend of palm-coconut (PC) and PC20 and compared this to PB20. They reported a higher BP of 0.3–2% at non-turbocharged condition; however, at turbocharged condition, PC20 and PB20 showed 1% higher and 0.6% lower BP respectively than diesel fuel. The BSFC of PB20 was lower compared to PC20 at non-turbocharged condition but it was 1.8–2% higher at turbocharged condition. CO, HC, and smoke opacity were reduced by 10–60%, 20–80%, and 5.6–10.9% but NO was increased by 3.4–4.8% in comparison to diesel fuel. Combustion pressures were 69.5 and 70.24 bar for the non-turbocharged case, but for turbocharged conditions, the pressure values were 96.4 and 101.78 bar respectively for PB20 and PC20 in comparison to diesel fuel (69.80 bar). Initial higher heat release rates at the pre-mixed zone and an earlier start of combustion (SOC) for the blends were noticed when compared to diesel fuel. Iqbal et al. [24] optimized the blend of palm, coconut, and jatropha biodiesel using a MATLAB program. The optimum blend of palm-coconut (PC) was 87.6:12.4, whereas jatropha-palm-coconut (JPC) was 23:55.9:21.1. Blends of 20% (20% biodiesel with 80% diesel) of palm, jatropha, coconut, PC, and JPC were tested in a four-cylinder diesel engine at full load conditions. The blends showed 2% higher BSFC and 7–10% lower CO2, but the BP was either similar or higher than diesel fuel. The HC emissions were higher in the case of palm, jatropha, coconut, and PC but at JPC blend, the HC emission was closer to diesel fuel. NO emissions were higher in almost all of the biodiesel samples except for the palm and JPC blends which showed similar or lower NOx emission than diesel fuel. Based on their density, viscosity, and cetane number, the feasibility of light biodiesel fuels has stimulated us to find a new alternative fuel for diesel engines.
Only four studies [18,19,23,25] have analyzed the performance, emissions, and combustion characteristics of diesel engines fuelled with biodiesel derived from feedstocks oil blend. Oil or biodiesel blends have different saturation and unsaturation levels which lead to a synergistic combination with improved oxidation stability, low temperature property, engine performance, and reduced emission. In this regard, a new biodiesel fuel produced from a combined rubber seed-palm oil blend is used as an alternative to diesel fuel. A hydrodynamic cavitation reactor using a two-step acid esterification followed by transesterification processes was used for biodiesel production. The various physical and chemical properties of the produced biodiesels have been examined and the chemical composition of their molecular structure has been studied. The objective of this study is to evaluate the diesel engine combustion performance by various blends of rubber seed oil, palm oil, and combined rubber-palm oil blend biodiesels. Rubber seed, palm oil, and rubber-palm biodiesels were blended with diesel fuel for various concentrations of 10%, 20%, 25%, and 50% by volume. Engine performance, emissions, cylinder pressure, and heat release rate of a multi-cylinder diesel engine were experimentally investigated and compared to those of diesel fuel.

2. Materials and Methods

2.1. Materials

Crude rubber seed oil (RSO), crude palm oil (CPO), and neat diesel fuel were used in this study. The equipment used and the property analysis of RSO and CPO are presented in Table 1 and Table 2.

2.2. Biodiesel Production

A hydrodynamic cavitation reactor with 50 L capacity was used to produce both rubber seed and palm oil biodiesel. It is consisted of diaphragm pump, double jacked glass and air compressor to operate the double diaphragm pump which acted as a device to dissipate the energy in the hydrodynamic cavitation reactor. A 30 kg of RSO or CPO with sulphuric acid catalyst of 8 wt. % and methanol to oil ratio of 6:1 was processed in a hydrodynamic cavitation reactor at temperature of 55 °C using circulating liquid glycerin for 30 min [30]. The plate used have diameter of 1 mm, holes number of 21, total hole perimeter of 65.98 mm and total flow area of 16.5 mm2 [31]. Orifice inlet flow rate and inlet pressure of 2 bar were regulated using bypass line valve and main line valve. The reactant was gravitationally settled for 4 h while the catalyst discharged. The product was transferred to the transesterification process after it undergoes esterification process. The optimized condition for transesterification process is 1 wt. % catalyst concentration, 6:1 alcohol to oil ratio, 55 °C reaction temperature and 30 min processing time [32,33]. The reaction was stopped after the specified time and the mixture was allowed to separate under gravity for 4 h. Two layers; glycerol and methyl ester were formed. The catalyst and by product were discharged. The separated methyl ester was washed with deionized water at 40 °C to remove impurities in the product. To remove the remaining water and methanol the biodiesel was subjected to under vacuum condition using a rotary evaporator. A 10 g of anhydrous sodium sulphate was added to the product to absorb the moisture and then the final biodiesel was collected after filtration (541 Whatman).

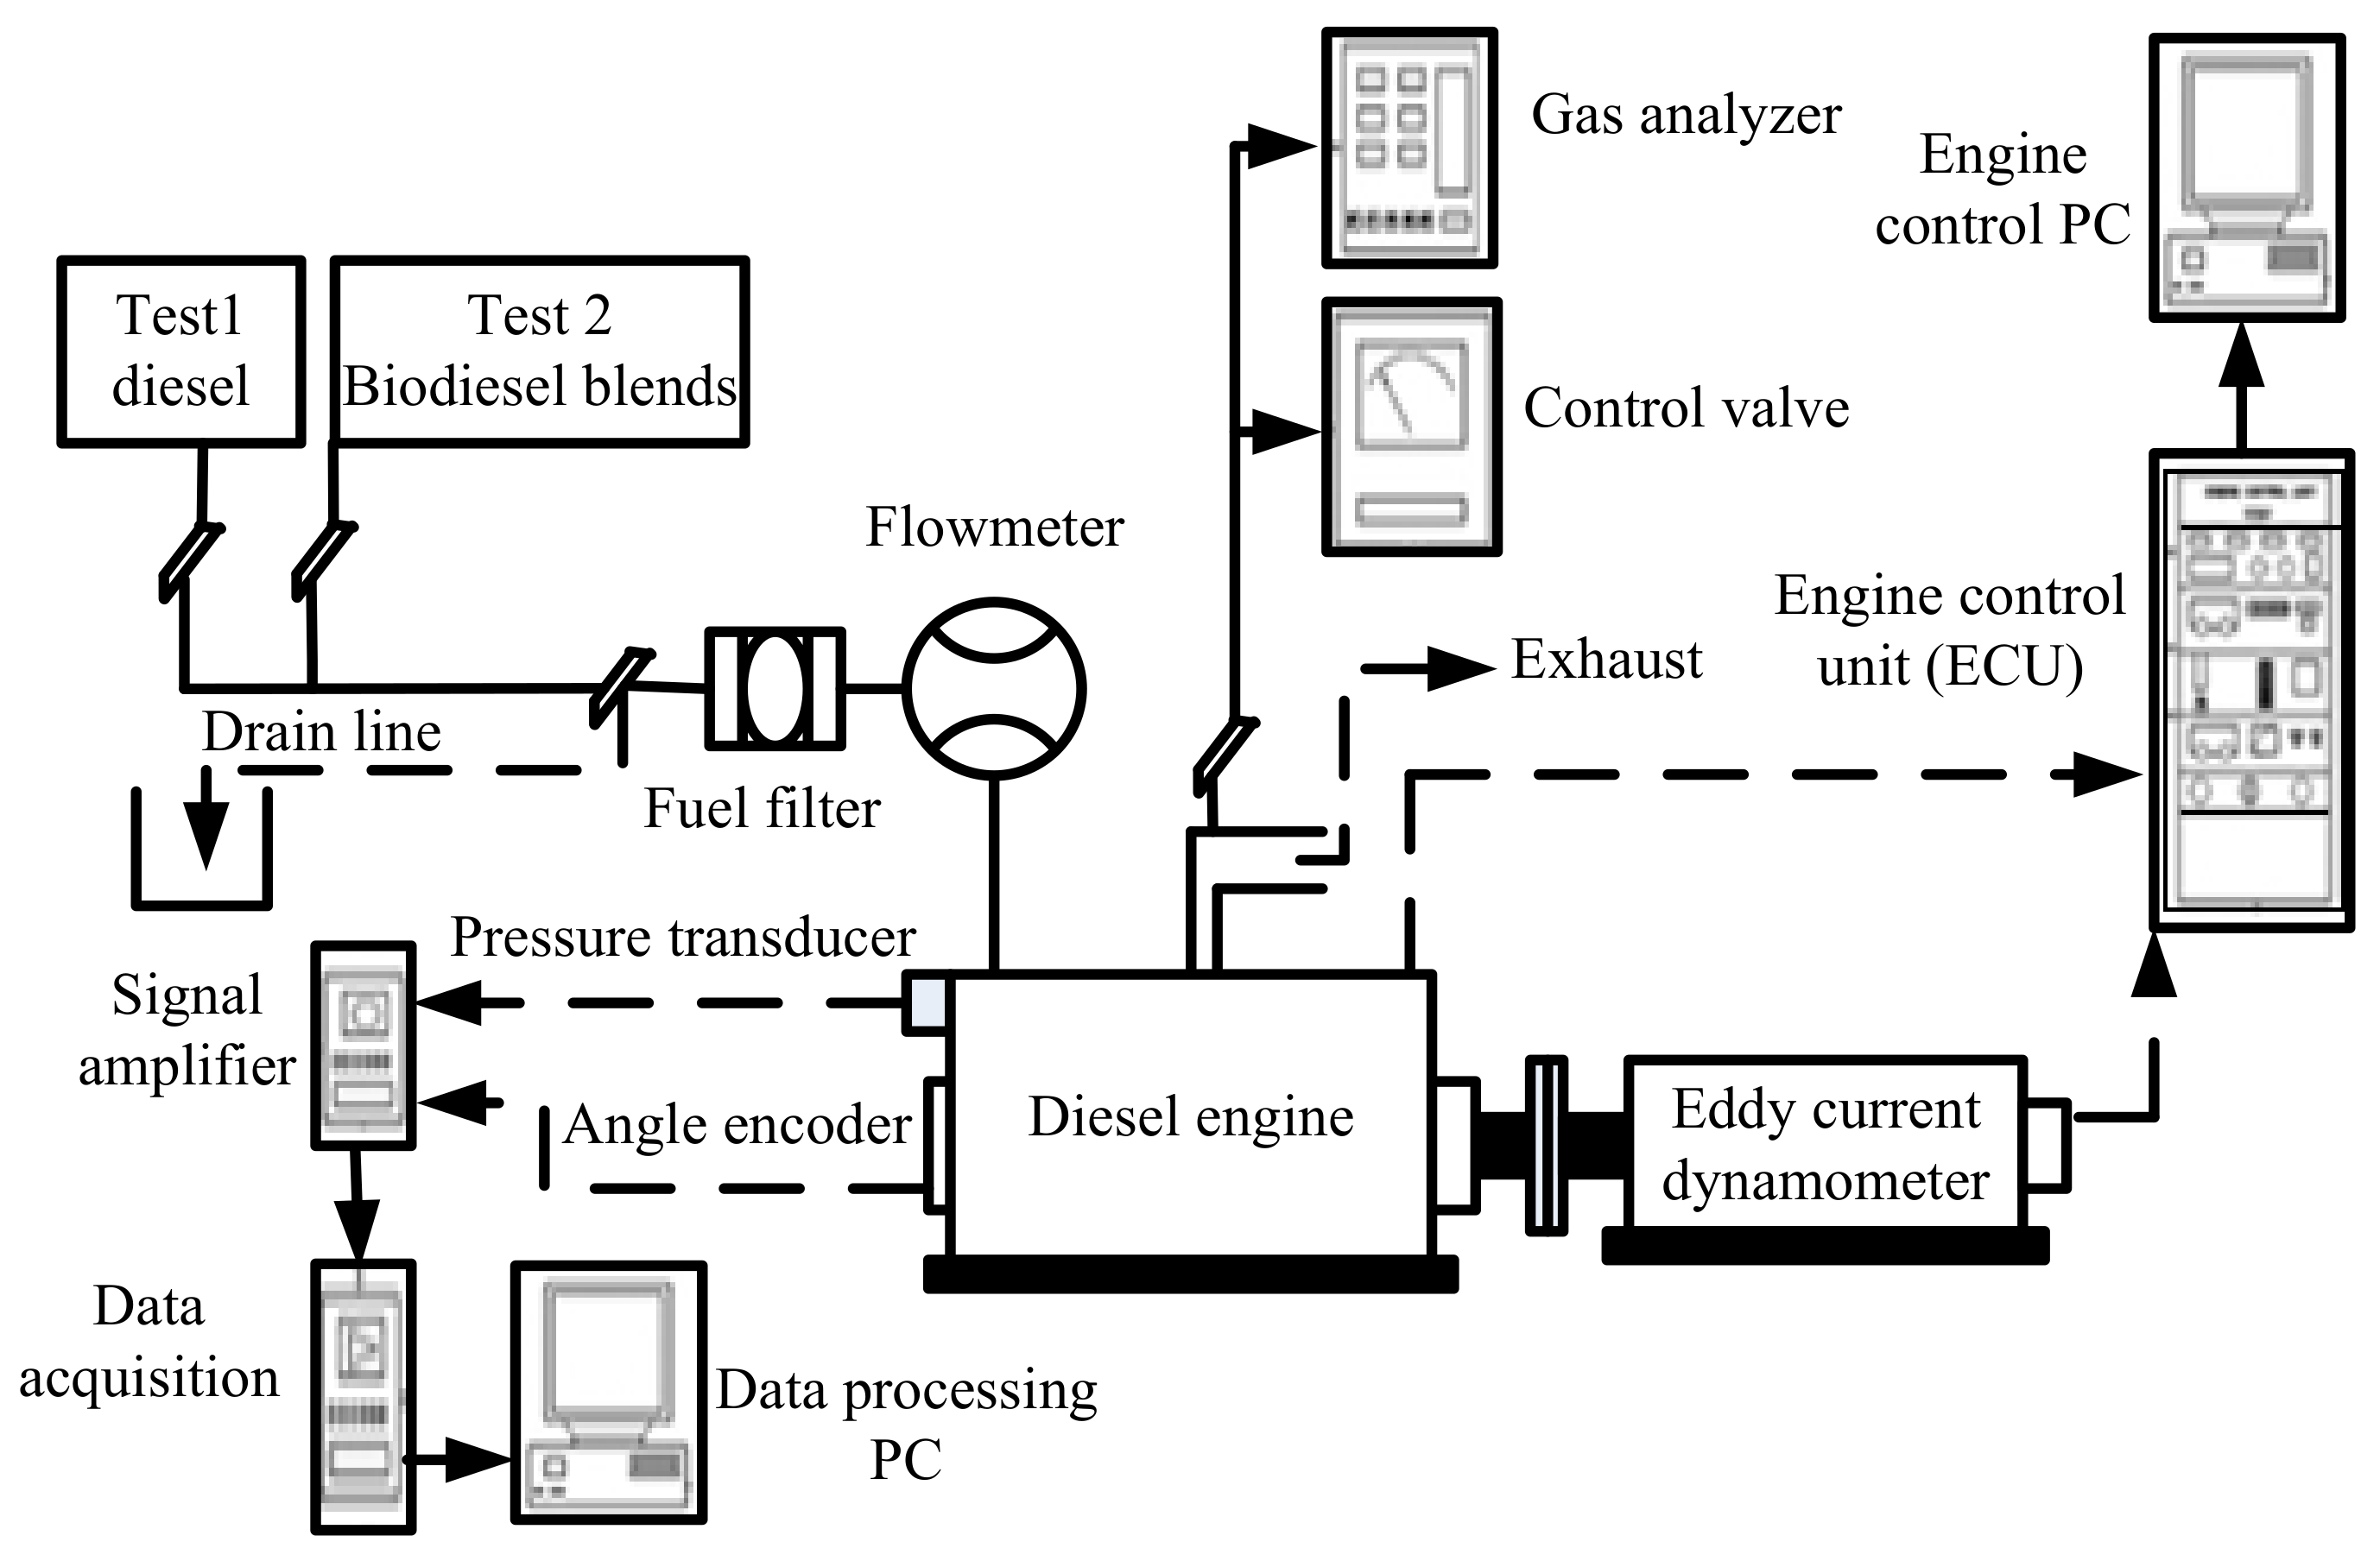
2.3. Experimental Set-Up

The experiments were carried out on a 2 L naturally aspirated multi-cylinder diesel engine (model 4D68). Figure 1 shows the schematic diagram of the test rig. Table 3 shows the specification of the engine dyno that was used in the experiment. The engine was directly coupled with SAJ SE-150 eddy current dynamometer. Engine control unit (ECU) consisted of data acquisition device, logging and sensors was used to control the engine and the dynamometer. The experiments started with the engine warm up using diesel fuel for about 30 min before the biodiesel fuels were tested. Likewise, the engine was again flushed with diesel fuel for 45 min to ensure full exhaustion of blend in the fuel line. To carry out the performance and emission testing, the engine was operated between 1500–3500 rpm with 500 interval at full load condition (100% load). The data collections were done three times to insure the data repeatability and consistency of torque, cooling water temperature, engine oil and fuel mass flow measurement. A Bosch (BEA460, Robert Bosch Gmbh, Stuttgart, Germany) (detail specification listed in Table 4) was used to measure the exhaust gas emissions from the engine. The test fuels were diesel, RB20 (20% rubber seed biodiesel + 80% diesel fuel), PB20 (20% palm oil biodiesel + 80% diesel fuel), RB50 (50% rubber seed biodiesel + 50% diesel fuel), PB50 (50% palm oil biodiesel + 50% diesel fuel), RPB10 (10% rubber seed biodiesel + 10% palm oil biodiesel + 80% diesel) and RPB25 (25% rubber seed biodiesel + 25% palm oil biodiesel + 50% diesel fuel). The fuels were mechanically stirred for 30 min at 2500 rpm before being used in the engine to insure the fuel homogeneity. Dewetron combustion analyser (Dewe-800, Dewetron Gmbh, Grambach, Austria) was used in combination with Kistler pressure transducer type 6061B and crank angle encoder type 2613B (Kistler Instrument Ltd., Winterthur, Switzerland) where the pressure transducer is installed at the first cylinder.

2.4. Uncertainty Analysis

The error analysis in the experiments was needed to know the repeatability and reproductively of the results. The experiment was repeated three times and the variations of performance, combustion characteristics, and exhaust emissions were used to calculate the uncertainty using percent relative standard error (RSE), as in Equation (1) [33].
RSE   ( % ) = ( S Error X ¯ ) × 100
where S Error is the standard error, X ¯ is the mean of the collected data. The standard error is calculated using Equation (2).
S Error = σ n
where σ is the standard deviation and n is the repeatable readings of performance, combustion characteristics, and emissions parameters. Overall experimental uncertainty, σ k was calculated using Equation (3).
σ k = ( σ q 1 ) 2 + ( σ q 2 ) 2 + + ( σ q n ) 2
where σ k is the total uncertainty and σ q 1 , σ q 2 and σ q n are uncertainty of individual parameters. Accuracies and uncertainties of the measured parameters are given in Table 5.

3. Results and Discussion

3.1. Analysis of Biodiesel Fuel Properties

Biodiesel fuel quality depends on feedstock, chemical composition, production process, and storage conditions. Biodiesel quality is assessed through the measurement of physicochemical properties to confirm the international standard of ASTM D6751 [34] and EN 14214 [35]. The physico-chemical properties of biodiesels obtained from rubber seed (RB), palm (PB), rubber-palm oil blend (RPB), and their different blending ratios with diesel, i.e., RB20, PB20, RB50, PB50, RPB10, and RPB25, are shown in Table 6. The acid value reflects the age and the quality of the produced biodiesel. It occurs naturally due to saturated or unsaturated elements or from the remaining acid used in the biodiesel production. The measured acid value of RB and PB were 0.36 and 0.30 mg KOH/g oil, respectively. The densities for RB and PB were found to be 0.878 and 0.862 g/m3 at 20 °C, whereas the viscosities were 4.2 and 3.8 mm2/s at 40 °C, respectively. The acid value, density, and viscosity of PB and RB complied with both standard of EN 14214 and ASTM D6751. The measured cetane number and the oxidation stability (OS) of PB were 57.5 and 25.3 h; however, for RB these values were 51.9 and 8.2 h respectively and were within the limits of both standards. The low flow properties of cloud point (CP), pour point (PP), and cold filter plugging point (CFPP) of PB were measured and found to be 11.25, 10.2, and 10.5 °C in contrast to RB for which these values were 3.4, −2 and 0 °C, respectively. A comparison RB and PB showed a large deviation of oxidation stability (67.58%) and cold flow properties (69.78–112.74%), which was a result of the differences in molecular structure and chemical composition. The carbon to hydrogen ratio (C/H) of RB and PB were found to be 6.399 and 6.29 compared to that of diesel, which is 6.557. The RPB synthesized from edible palm oil and non-edible rubber seed oil remarkably improved the OS by 11.46–54.07%, PP by 27.45–109.80%, CP by 17.96–58.93%, and CFPP by 17.05–90.48% respectively compared to individual RB and PB. Therefore, a blend of the two oils is an effective method to improve the oxidation stability and low temperature properties and to minimize the use of edible oils in biodiesel production.

3.2. Performance Analysis

Engine brake power (BP), BSFC, NO, HC, CO, CO2, and combustion characteristics were evaluated at full load conditions. The following section describes the results and the discussion of theses parameters.

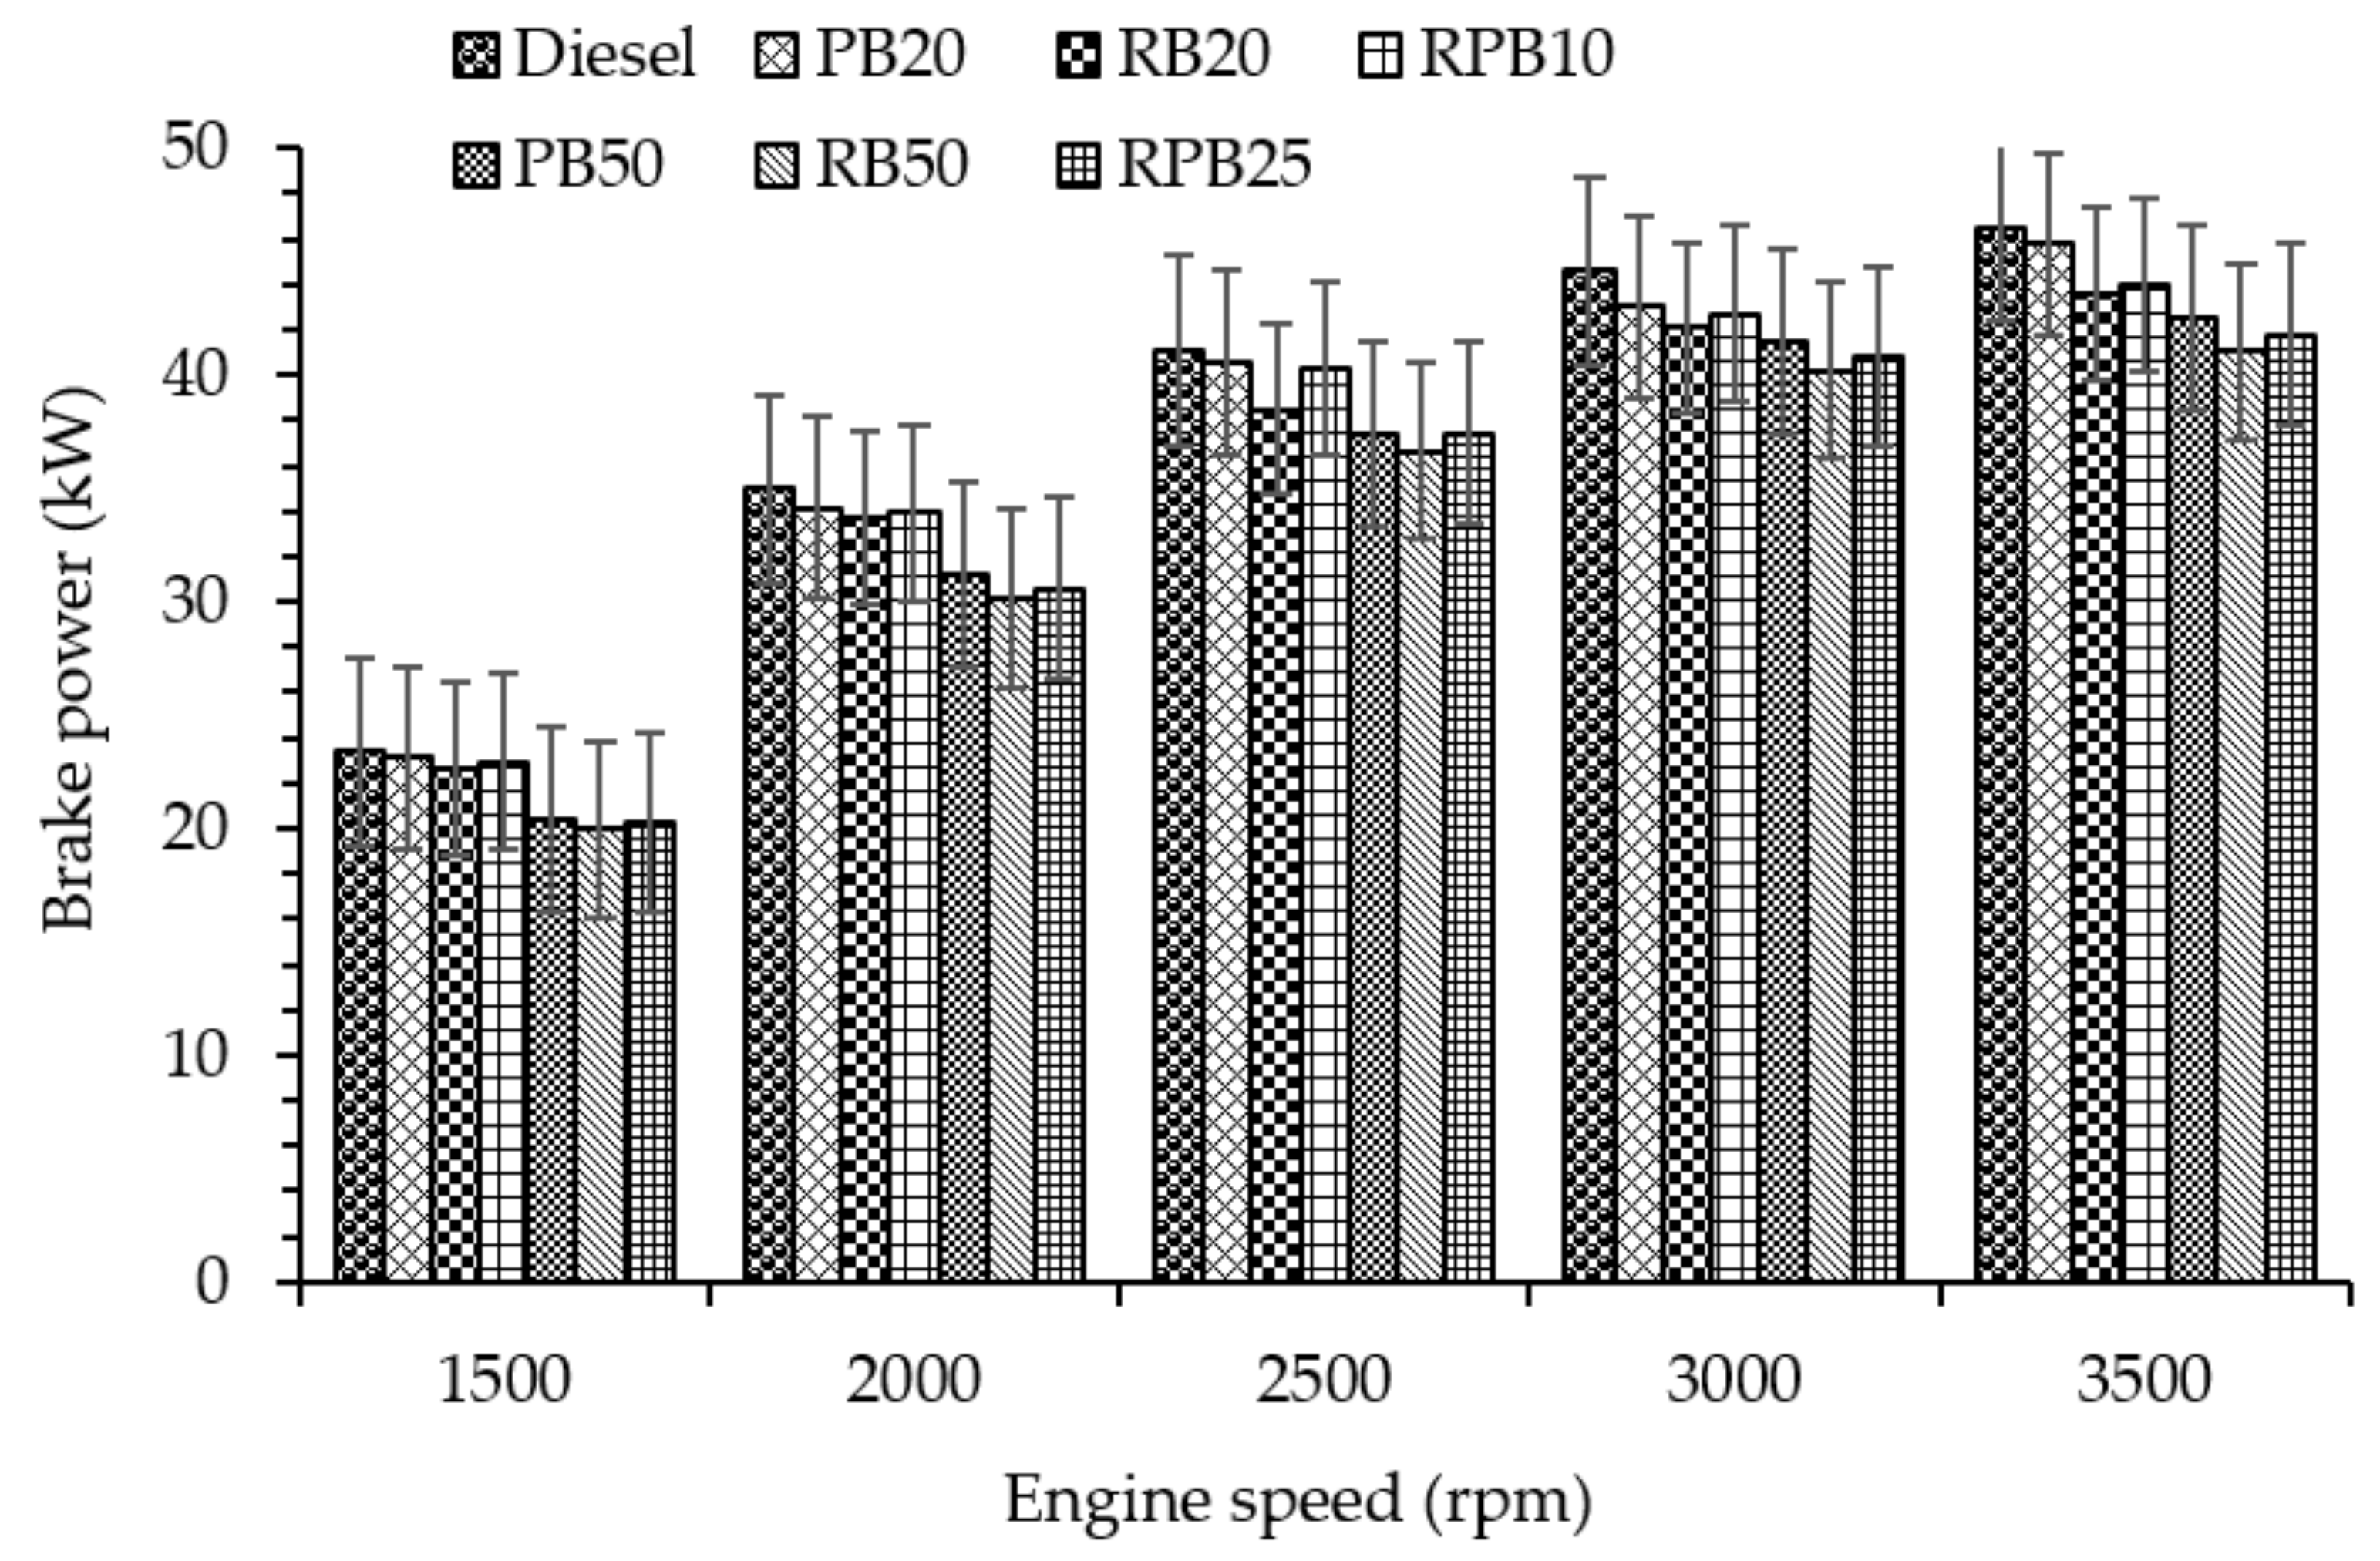
3.2.1. Brake Power (BP)

The variation of BP for the tested biodiesel fuels against engine speeds is shown in Figure 2. On average, over the speed range, the BP for diesel, PB20, RB20, RPB10, PB50, RB50, and RPB25 were 37.70, 37.01, 36.54, 36.97, 35.27, 33.59 and 34.69 kW, respectively. Compared to diesel fuel, PB20, RB20, RPB10, PB50, RB50, and RPB25 produced less brake powers (about 1.83%, 3.07%, 1.94%, 6.45%, 10.90%, and 7.51%) because the increase of biodiesel ratio reduced the volumetric heating value of the blend resulting in a decrease of brake power [36]. In addition, the higher density and viscosity, which resulted in an uneven combustion, also reduced the brake power [37]. In comparison to PB fuels, RB and RPB blends yielded lower brake power of 1.26–3.72% and 0.11–1.2%, respectively. The higher BP with palm biodiesel fuels was attributed to their higher calorific value and lower viscosity (see Table 6) [18,38]. In comparison to RB blends, RPB samples produced higher brake power of 1.18–2.97%. The lower BP of RB fuels was attributed to an inferior mix, defined by a higher density, viscosity and lower volatility. This resulted in a lower flash point and lower calorific value of 11.47%, 3.92%, and 1.75% in comparison to diesel, PB and RPB fuels, respectively [39]. In the RPB blends, the calorific values, density and viscosity improved and resulted in increased brake power than that of RB fuels [22].

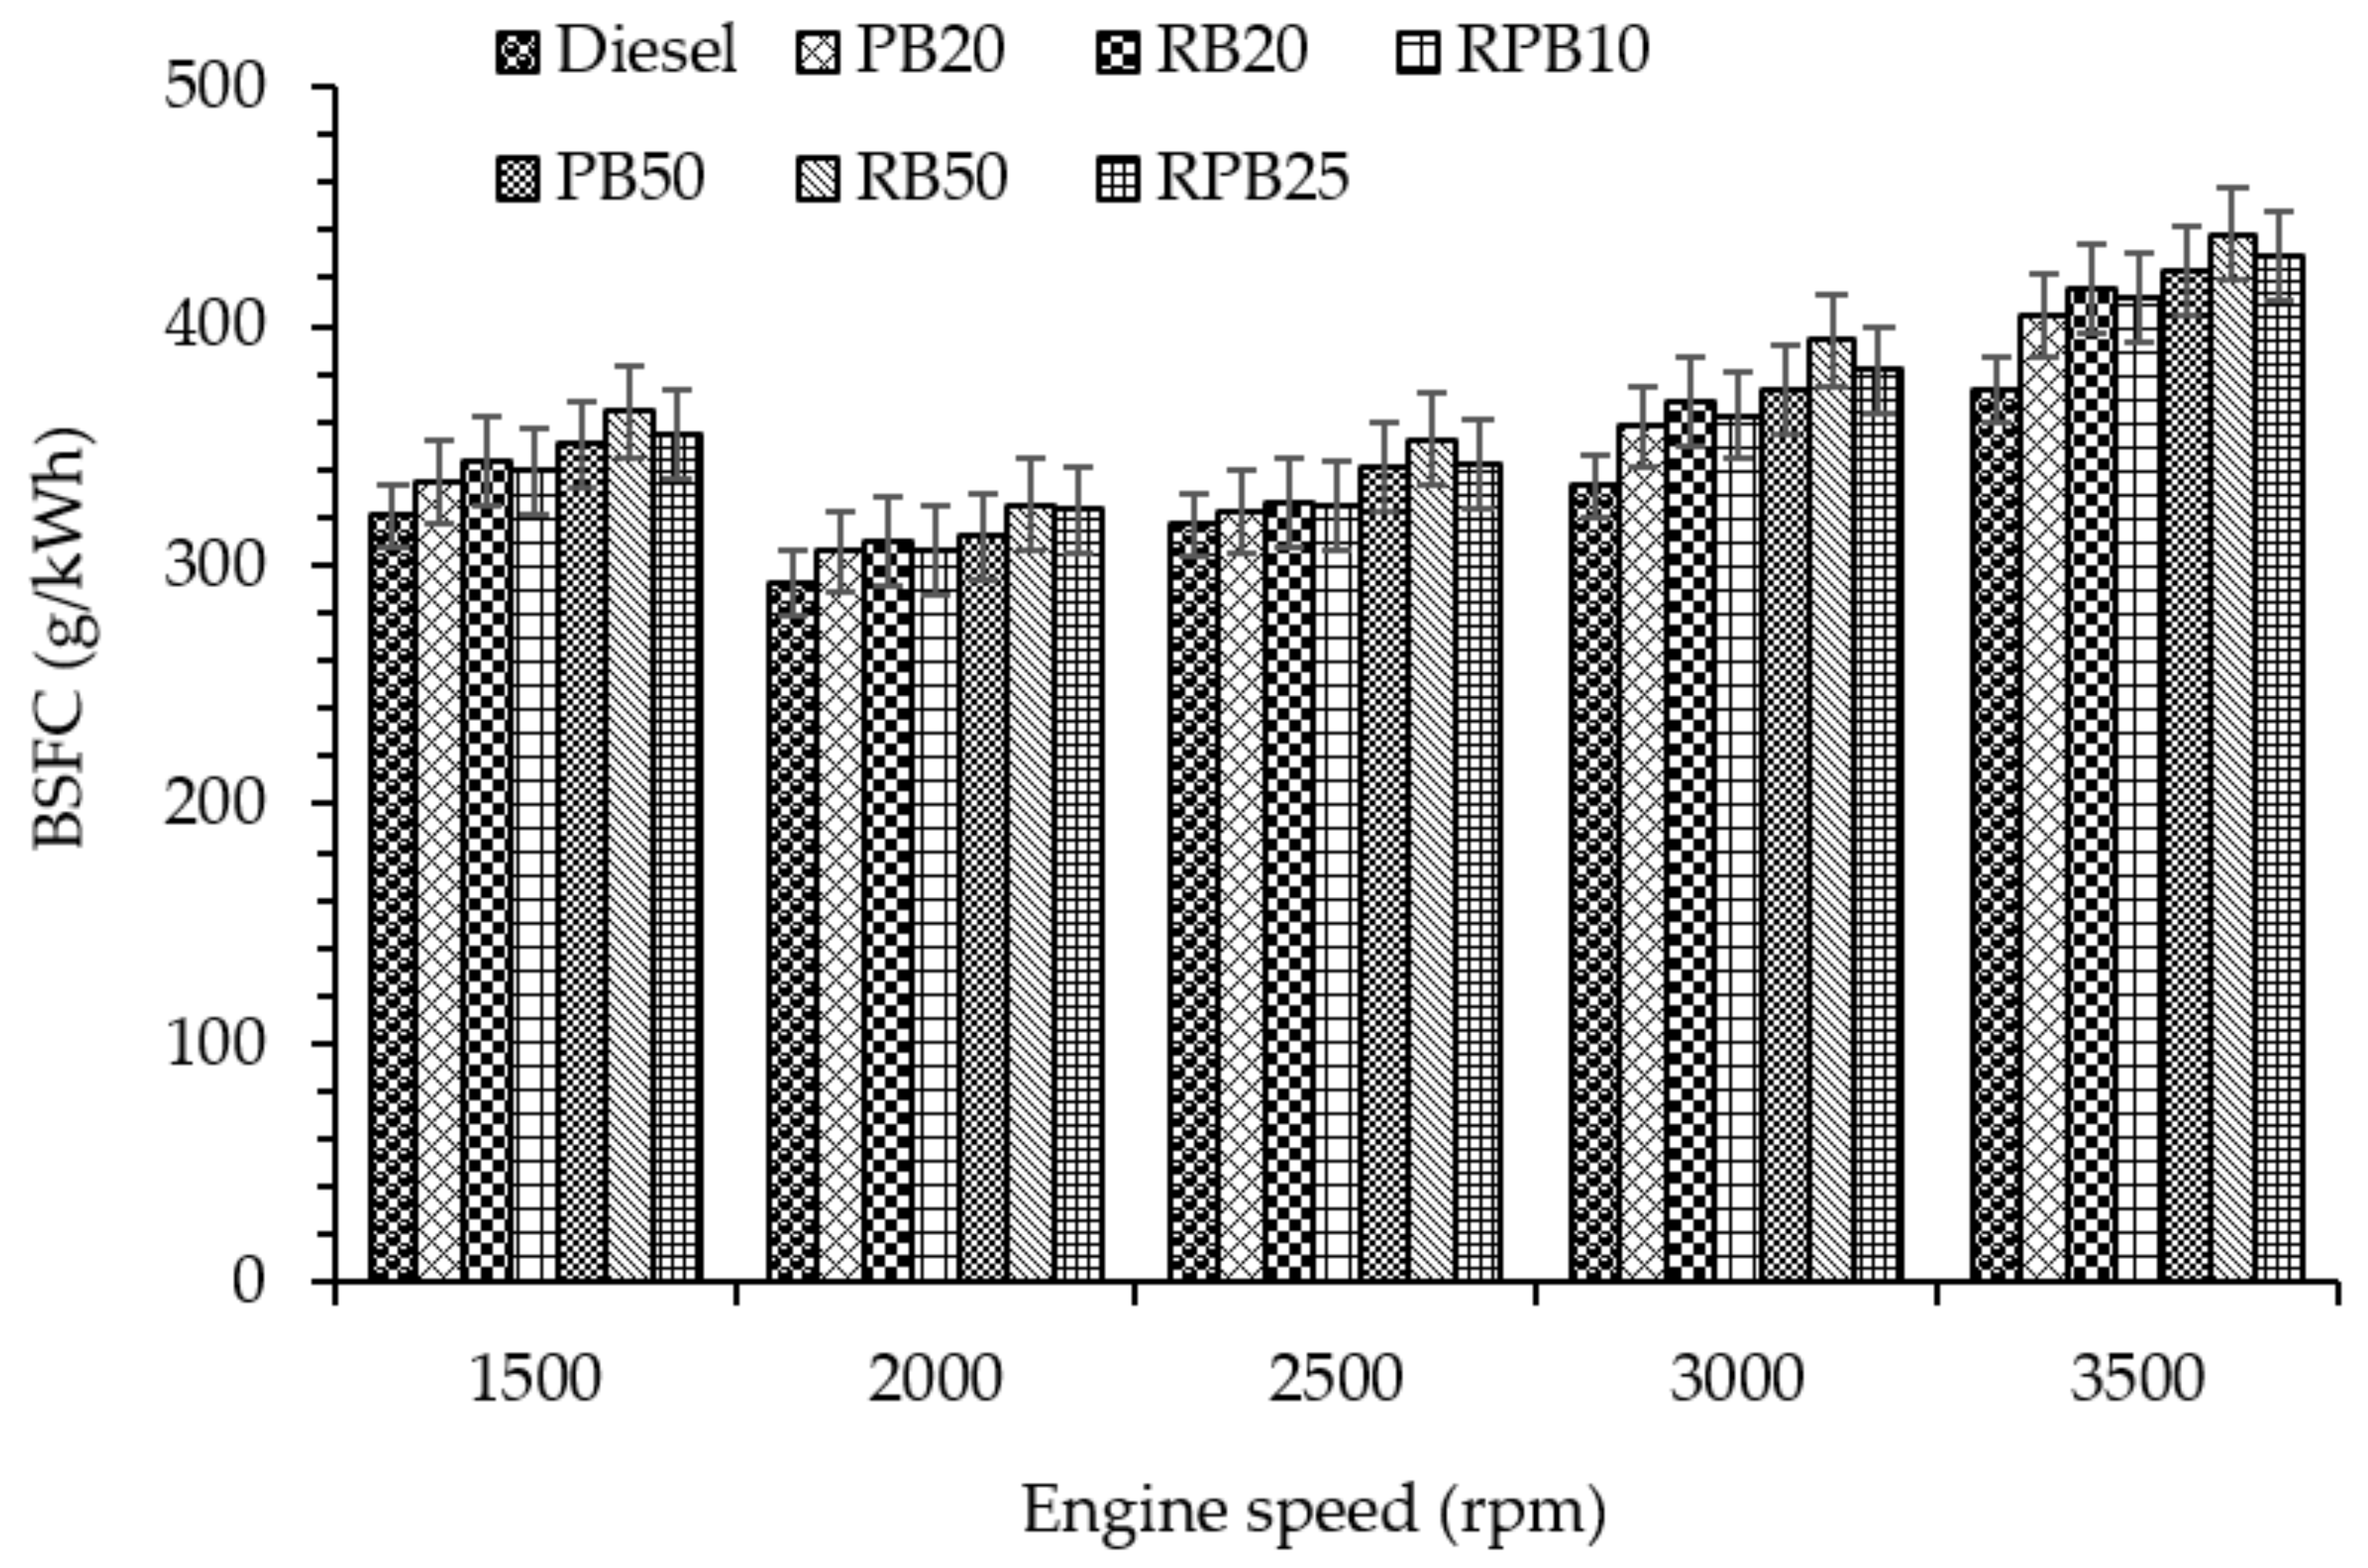
3.2.2. Brake Specific Fuel Consumption (BSFC)

BSFC variation in the tested fuels as a function of engine speed at full load conditions is depicted in Figure 3. This variable depends on the relationship among the density, viscosity, calorific value, and volumetric fuel injection system [40]. From the figures, it is clear that the BSFC trends tended to increase at low speed (1500 rpm), decrease at medium speed (2000–2500 rpm), and to increase again at higher speed (3500 rpm). At medium speeds, the decrease of BSFC was due to the increase in atomization ratio because of better physical and chemical conditions of the combustion [41]. However, the friction losses increased at higher speeds resulting in an increase in the BSFC [42,43]. The increase in the BSFC was also a result of the lower heating value as well as the higher viscosity and density, causing more fuel to be injected into the combustion chamber than neat diesel fuel [44]. The lowest BSFC of all tested fuels occurred at 2000 rpm (maximum brake torque) and it increased by 4.45–6.28% for PB, 5.62–10.16% for RB, and 4.68–7.24% for RPB respectively in comparison to diesel fuel. On average, the BSFCs were 327.35, 335.14, 339.86, 336.96, 355.8, 374.78, and 360.94 g/kWh respectively for diesel, PB20, RB20, RPB10, PB50, RB50, and RPB25 blends. This was demonstrated by an increased BSFC by 2.37%, 3.82%, 2.93%, 8.69%, 14.5%, and 10.26% for PB20, RB20, RPB10, PB50, RB50, and RPB25 respectively in comparison to diesel fuel. From the figure, RB and RPB samples show higher BSFC of 1.41–5.34% and 0.54–1.59% respectively in comparison to PB fuels. This was due to a combination of factors including a lower calorific value and oxygen element as well as poor mixture formation caused by higher density, resulting in higher BSFC. These results are in agreement with Habibullah et al. [21,22]. With RPB blends, the BSFC was 0.85–3.69% lower than that of RB blends because the combination (RPB) improved the calorific value, viscosity, and density [20].

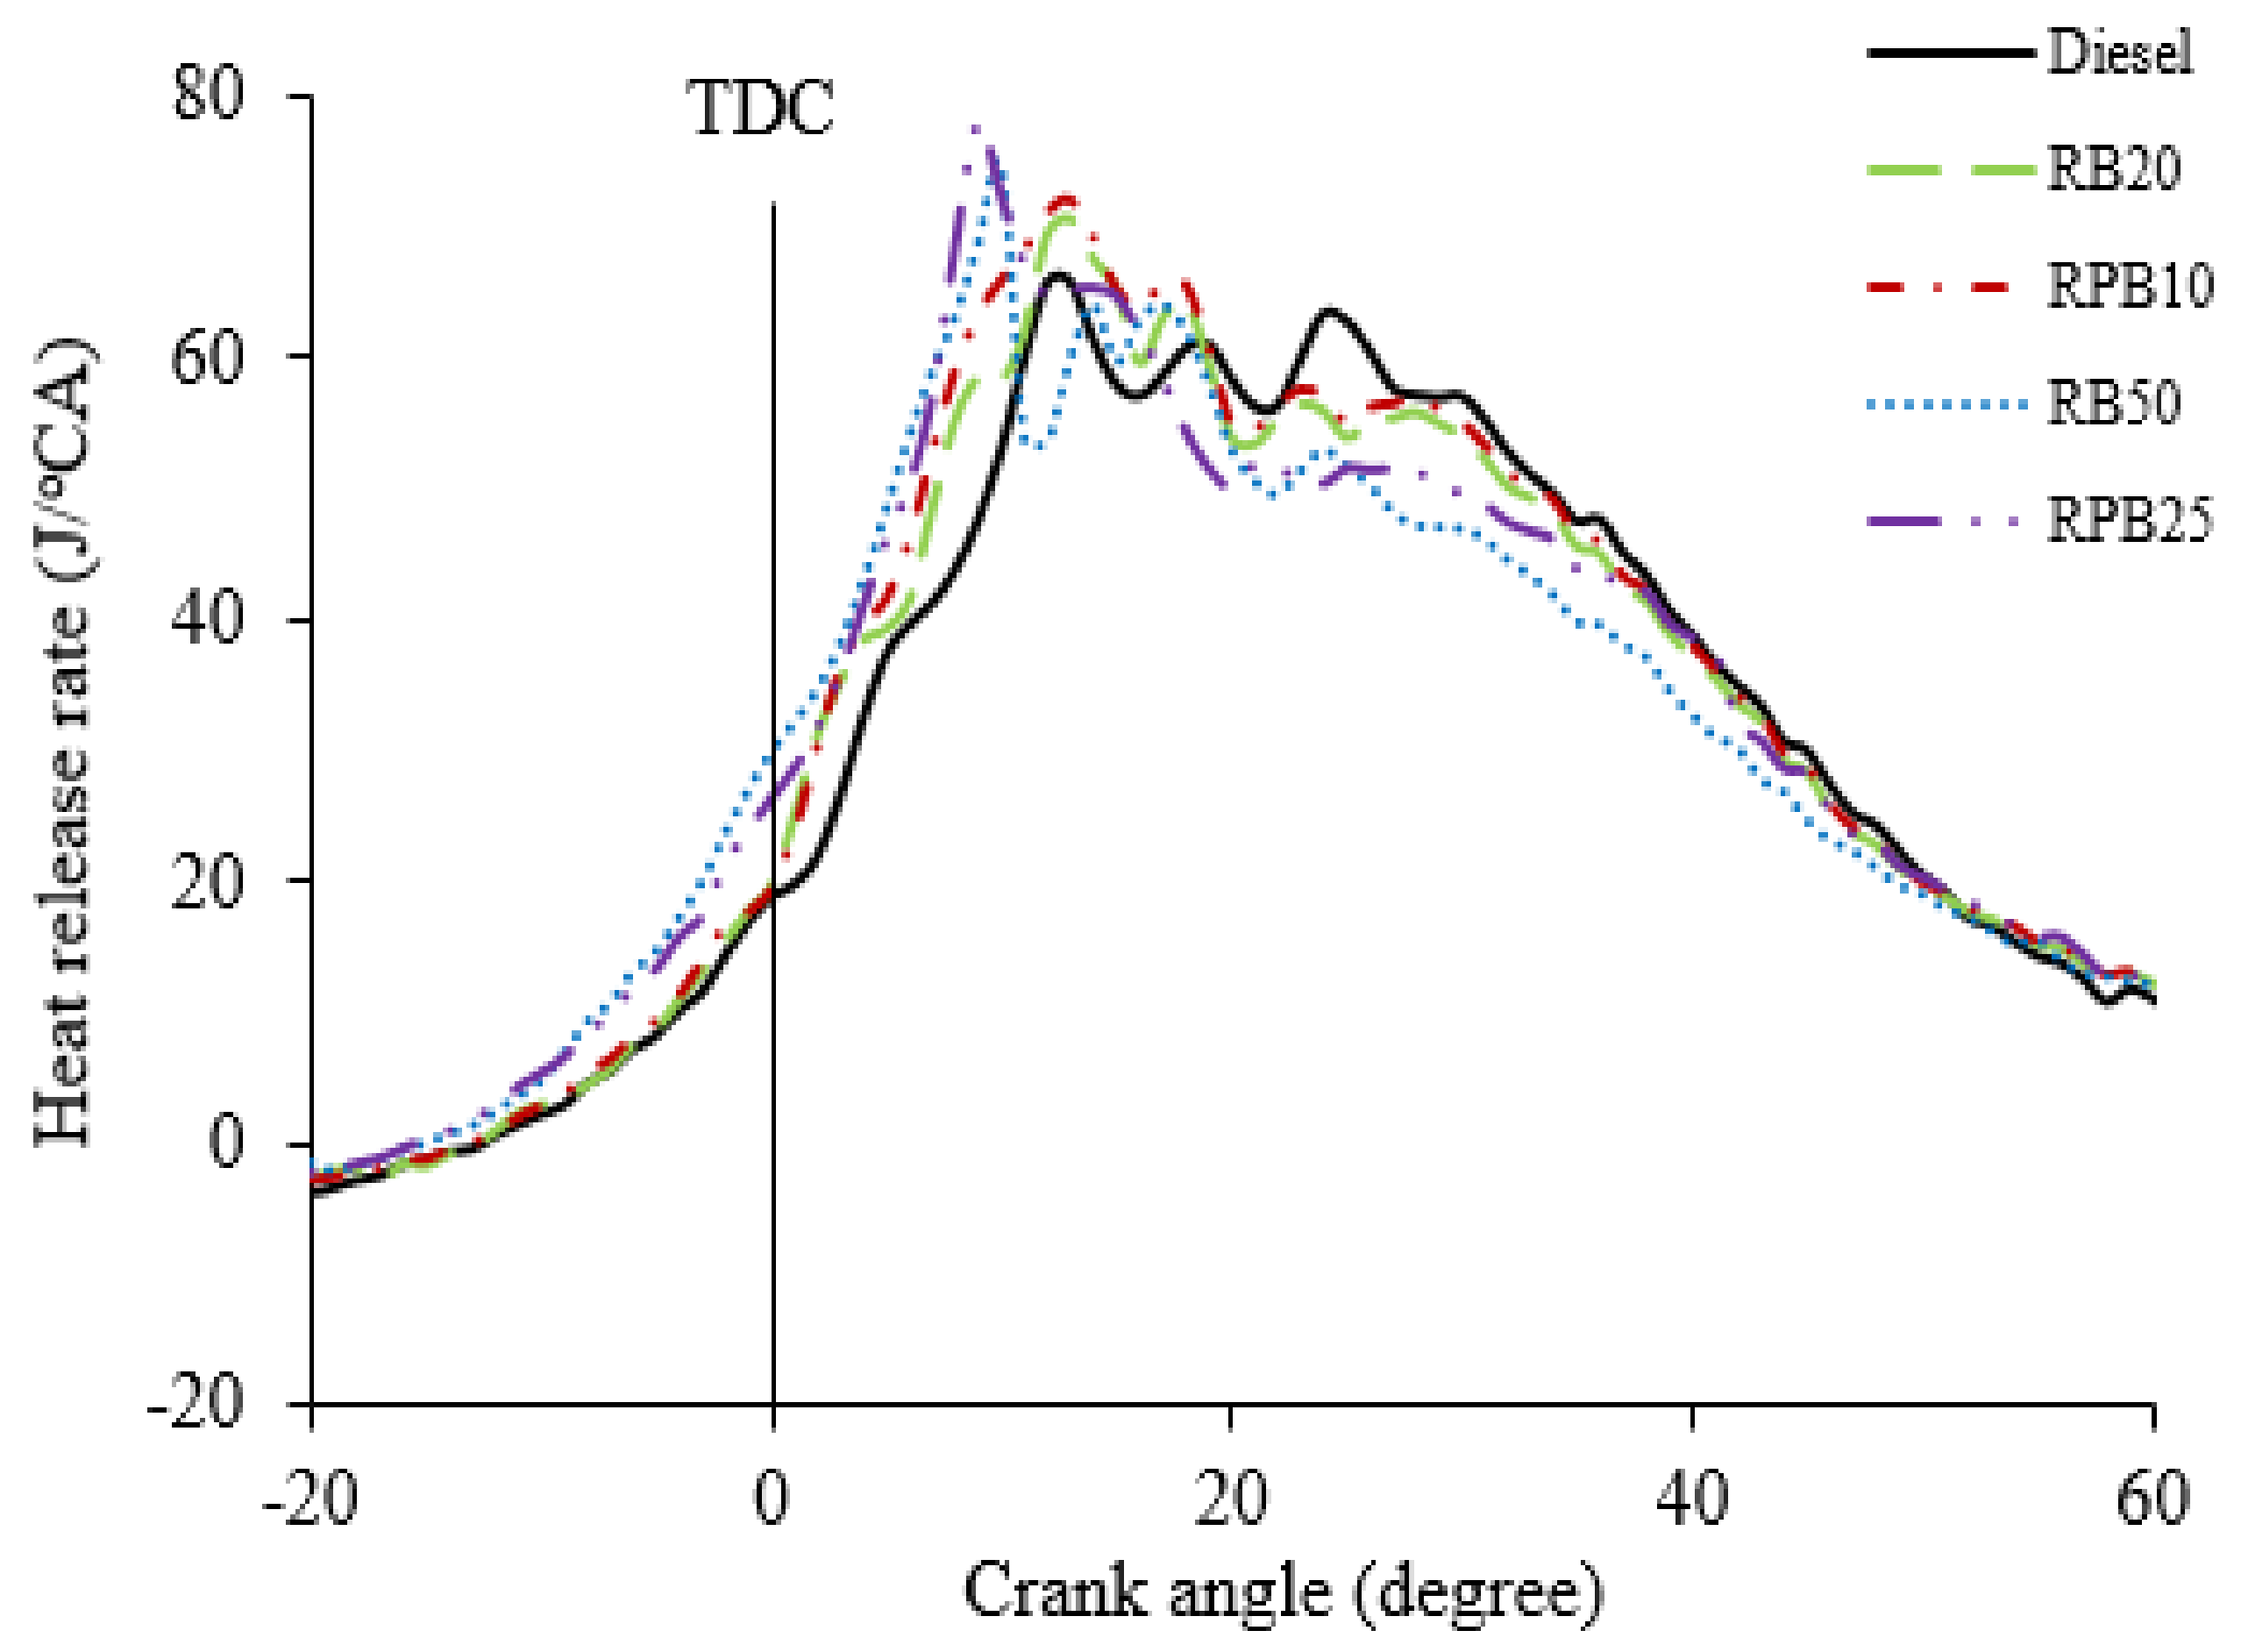
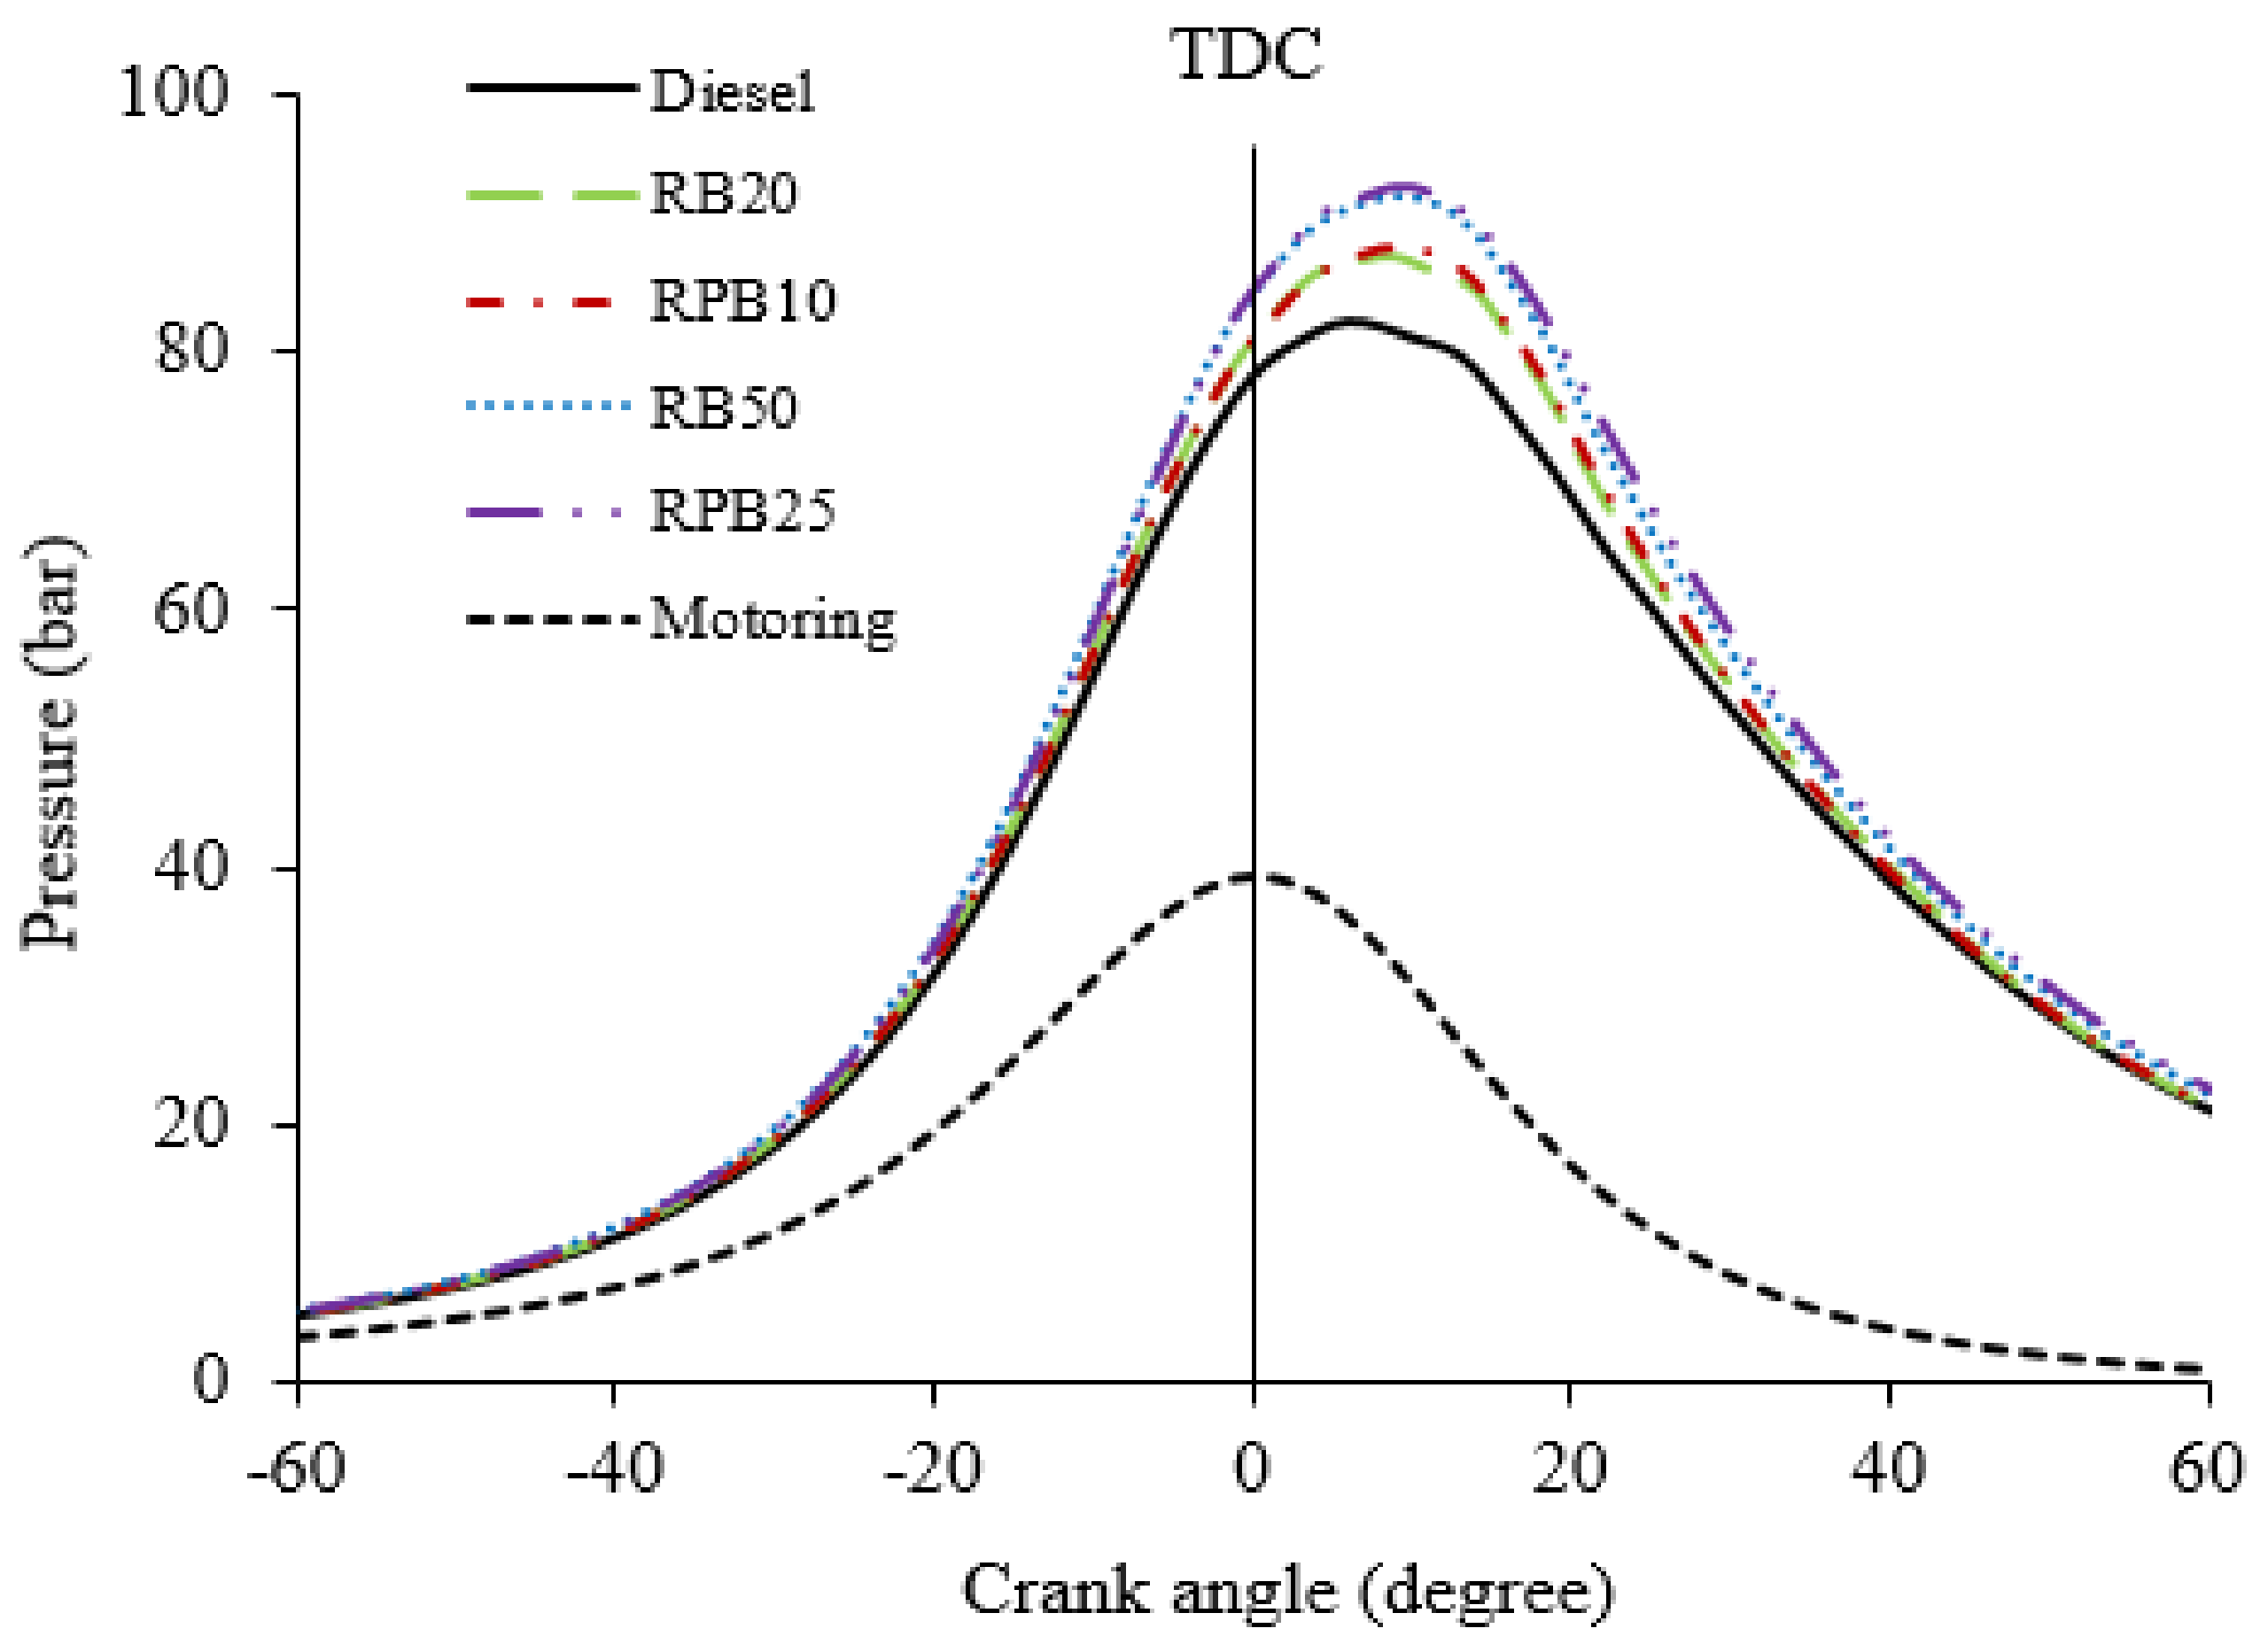
3.3. Combustion Analysis

The in-cylinder pressure is an important parameter for combustion analysis. It depends on both the ignition delay period and fuel spray behavior [45]. The combustion studies of fuel samples were investigated by means of cylinder pressure and peak values achieved as well as the heat release rate. Figure 4 shows the cylinder pressure against the crank angle for different test fuels at 2000 rpm. The in-cylinder pressure data of 400 consecutive cycles with a resolution of 0.1 °CA were averaged and used to study the combustion characteristics. Results showed the maximum cylinder pressure occurred at crank angle range of 3–13 °C after top dead center (ATDC) for all tested fuels with no significant trace of knock observed. The maximum cylinder pressure depends on engine type, fuel properties, air–fuel ratio, and the burned fuel fraction during the premixed combustion phase [45,46]. Additionally, an increase in biodiesel percentage increased the cylinder pressure for the specified samples. This was due to the addition of biodiesel which increased the cetane number, density, bulk modulus, oxygen element, and combustion maximum temperature; consequently; the combustion pressure increased. The maximum cylinder pressure of diesel, RB20, RPB10, RB50, and RPB25 were 82.38, 88.29, 89.37, 90.23 and 91.80 bar, respectively. In comparison to diesel fuel, the blends of RB20, RPB10, RB50, and RPB25 increased the maximum cylinder pressure by 7.18%, 8.47%, 9.53%, and 11.43%, respectively. A slightly higher peak pressure with RPB blends is attributed to palm biodiesel which has a higher cetane number than RB blends [47]. The heat release rate (HRR) shown in Figure 5 characterized the start of combustion (SOC) and ignition delay (ID). SOC was defined as the start of the heat release, whereas the ID was defined as time interval between start of injection and SOC release (Muralidharan et al., 2011). The SOC of diesel, RB20, RPB10, RB50, and RPB25 were 10, 13, 13.2, 15, and 15.6 °CA BTDC, but the peak HRR were 53.16 at 13 °C, 70.76 at 13 °C, 72.31 at 13 °C, 75.43 J/°C at 10 °C and 77.94 J/°C at 9 °C, respectively. In comparison to diesel fuel, the earlier SOC of 3–5 °C for RB and 3.2–5.6 °C for RPB blends were observed. The delays were observed to be short for RB and RPB blends, varying between 6–8 °C and 5.4–7.8 °C, respectively. When comparing HRR of RB to those of the RPB blend, the premixed combustion phase was observed to be less intense; at the same time, the controlled combustion phase was at a lower rate as shown by the lower heat release rate, see Figure 5. This was a result of a large amount of fuel having been injected into the cylinder because of its lower calorific value (Table 6). The higher NO emissions of 215.38 and 240.94 ppm for RB20 and RB50 in comparison to 213.91 and 231.75 ppm for RPB10 and RPB25.

3.4. Emissions Analysis

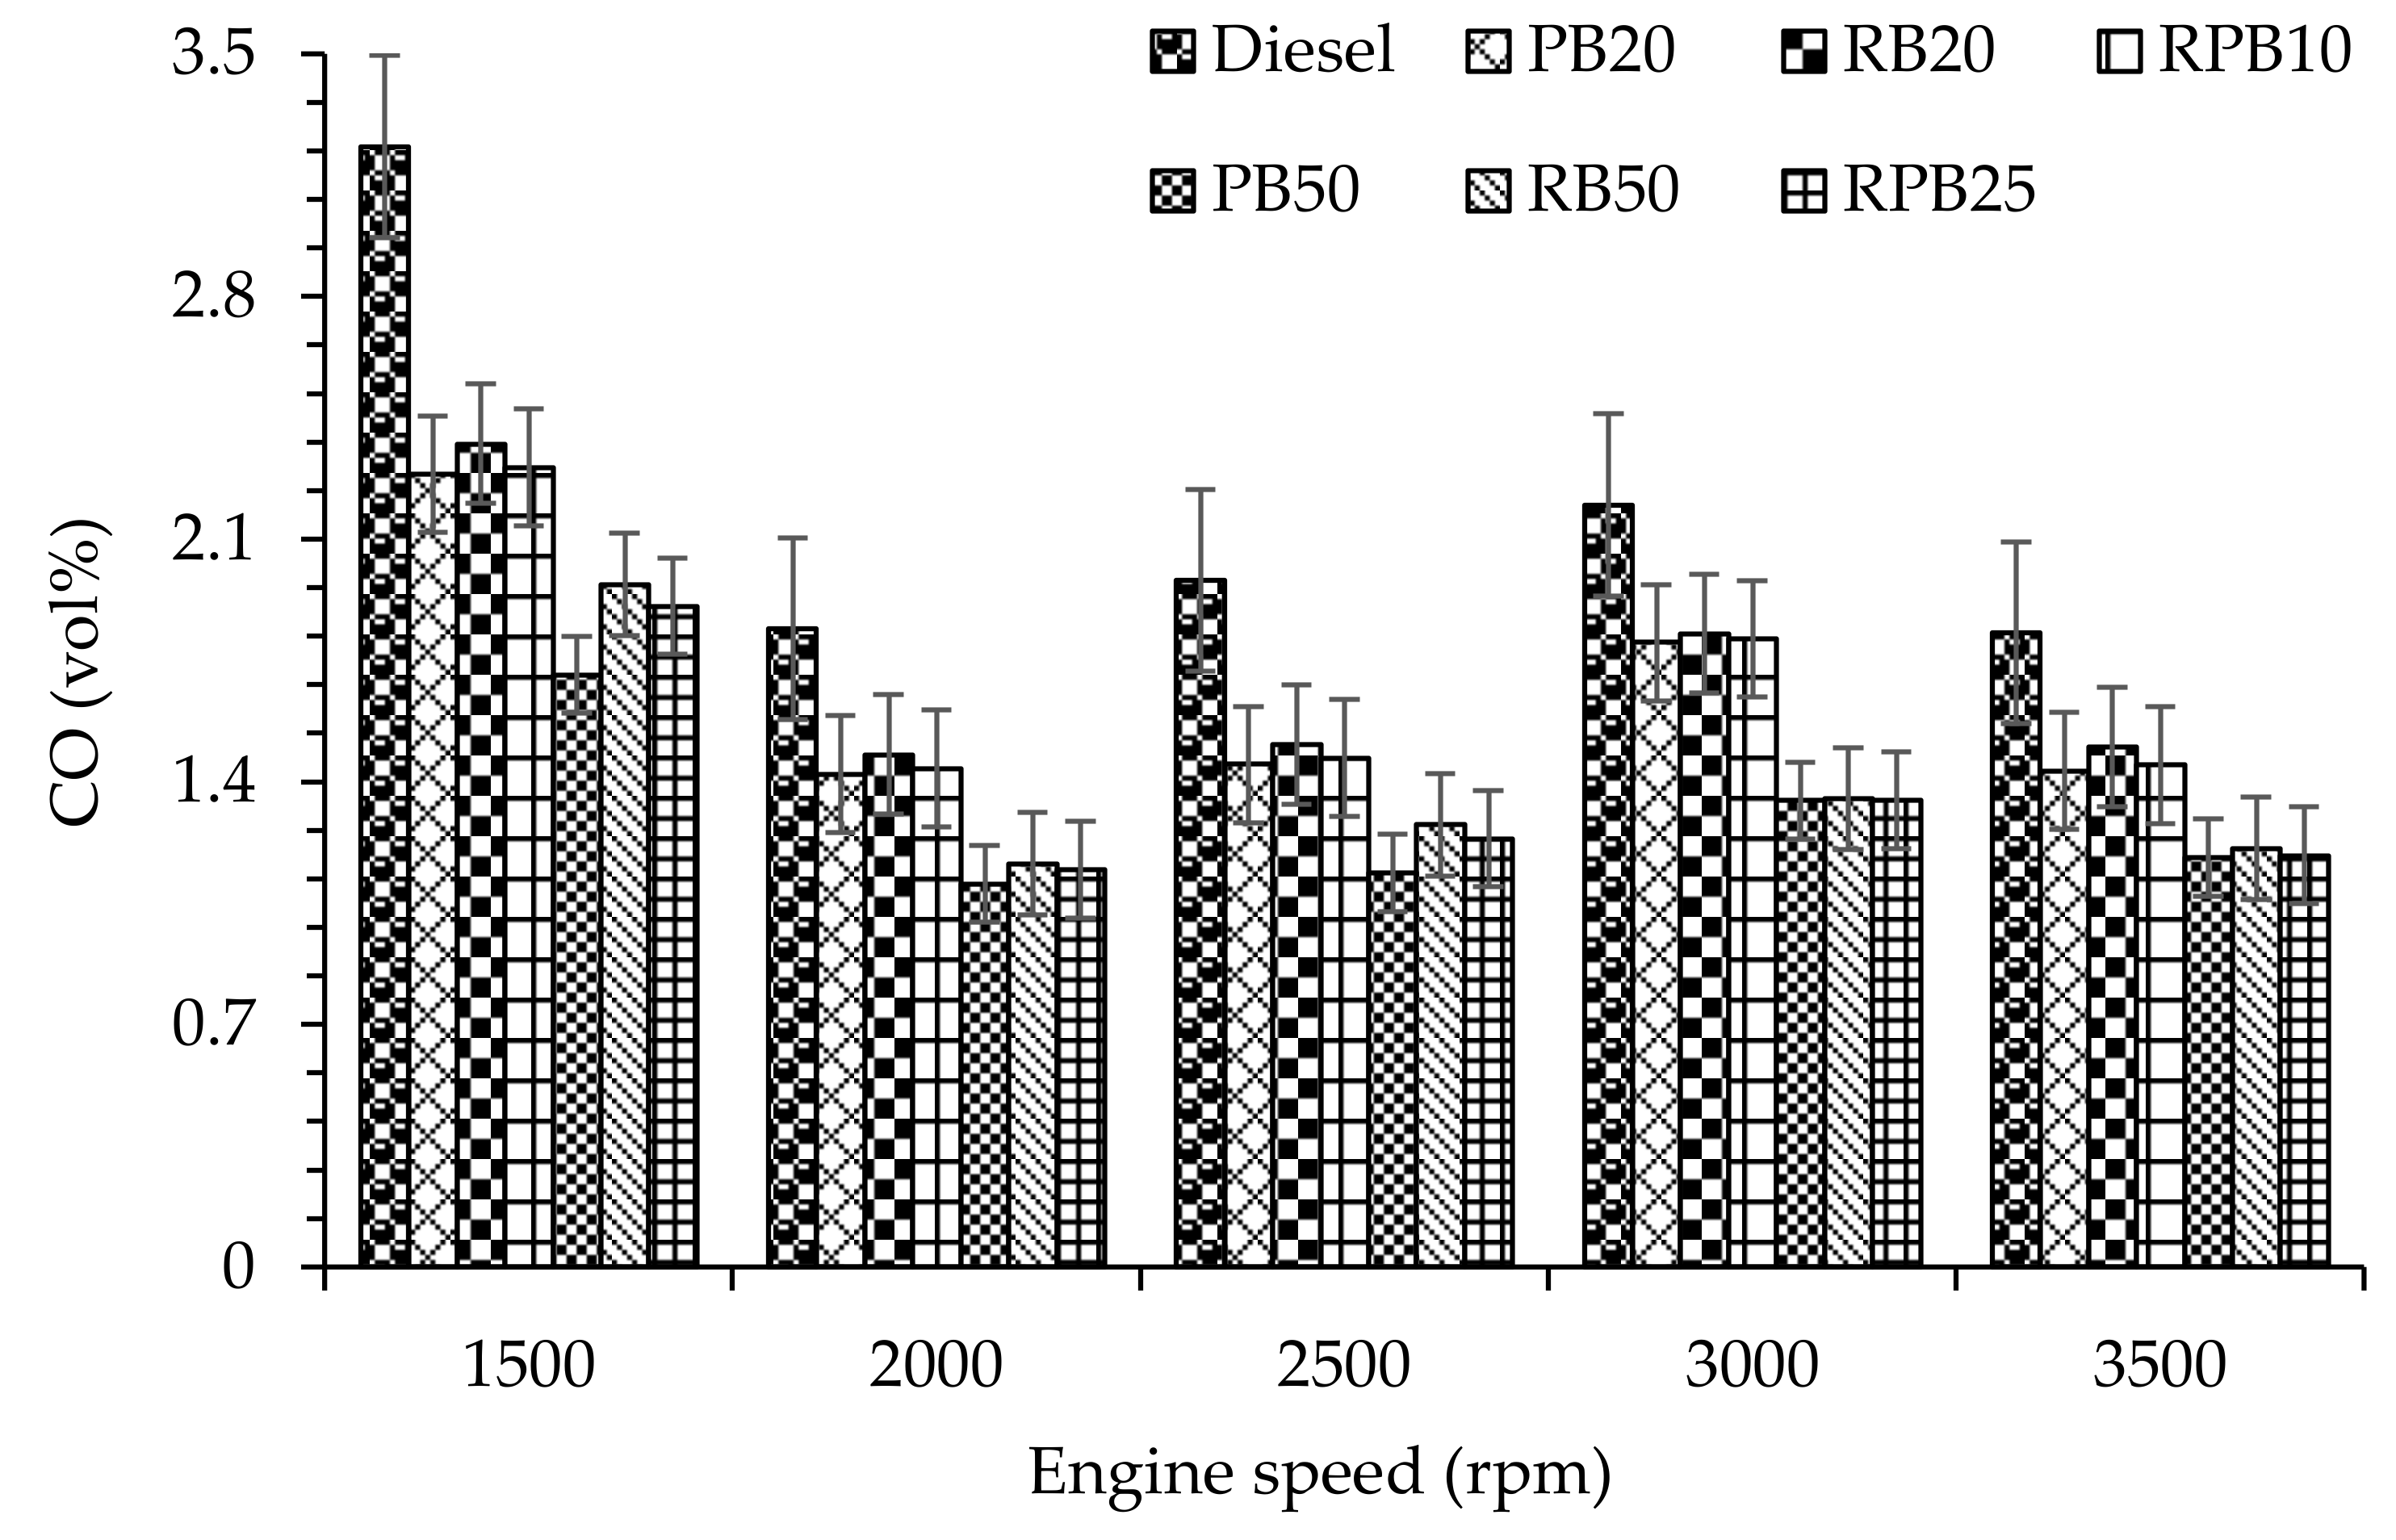
3.4.1. Carbon Monoxide (CO) Emission

CO is formed as a result of inadequate burning due to low flame temperature, rich fuel air ratio, and insufficient air supply [20] which hinders the conversion of CO to CO2 [48,49]. Additionally, the injection timing, combustion chamber design, atomization rate, engine speed and load, fuel type, and injection pressure influence CO formation [50]. With respect to the CO emissions shown in Figure 6, biodiesel blends produced lower CO emissions compared to neat diesel. This was a result of a higher oxygen element and higher cetane number in the biodiesel fuels which enhanced the combustion process [45,51]. Higher oxygen content ensured complete combustion by allowing more carbon to burn [52], whereas the higher cetane number ensured higher flame speed and post flame oxidation, prolonging the combustion duration and reducing the possible formation of a rich fuel zone. At 2000 rpm, the blends of PB20, RB20, RPB10, PB50, RB50, and RPB25 produced 9.38%, 2.63%, 7.62%, 13.58%, 10.79%, and 12.25% lower CO emission than diesel fuel, respectively. The average CO emissions of PB20, RB20, RPB10, PB50, RB50, and RPB25 were 30.54%, 27.36%, 29.59%, 43.56%, 35.74%, and 40.39% lower respectively than that of diesel fuel. Compared to PB blends, RB and RPB fuel samples showed 5.23–13.6% and 2.61–8% higher CO emissions, respectively. This was a result of their higher density and viscosity which caused poor fuel atomization and spray formation resulting in incomplete combustion and, accordingly, higher CO emission [43]. However, RPB blends produced lower CO emissions by 2.48–6.93% than RB blends. Thus, the addition of PB in RB clearly resulted in a significant reduction in CO emission.

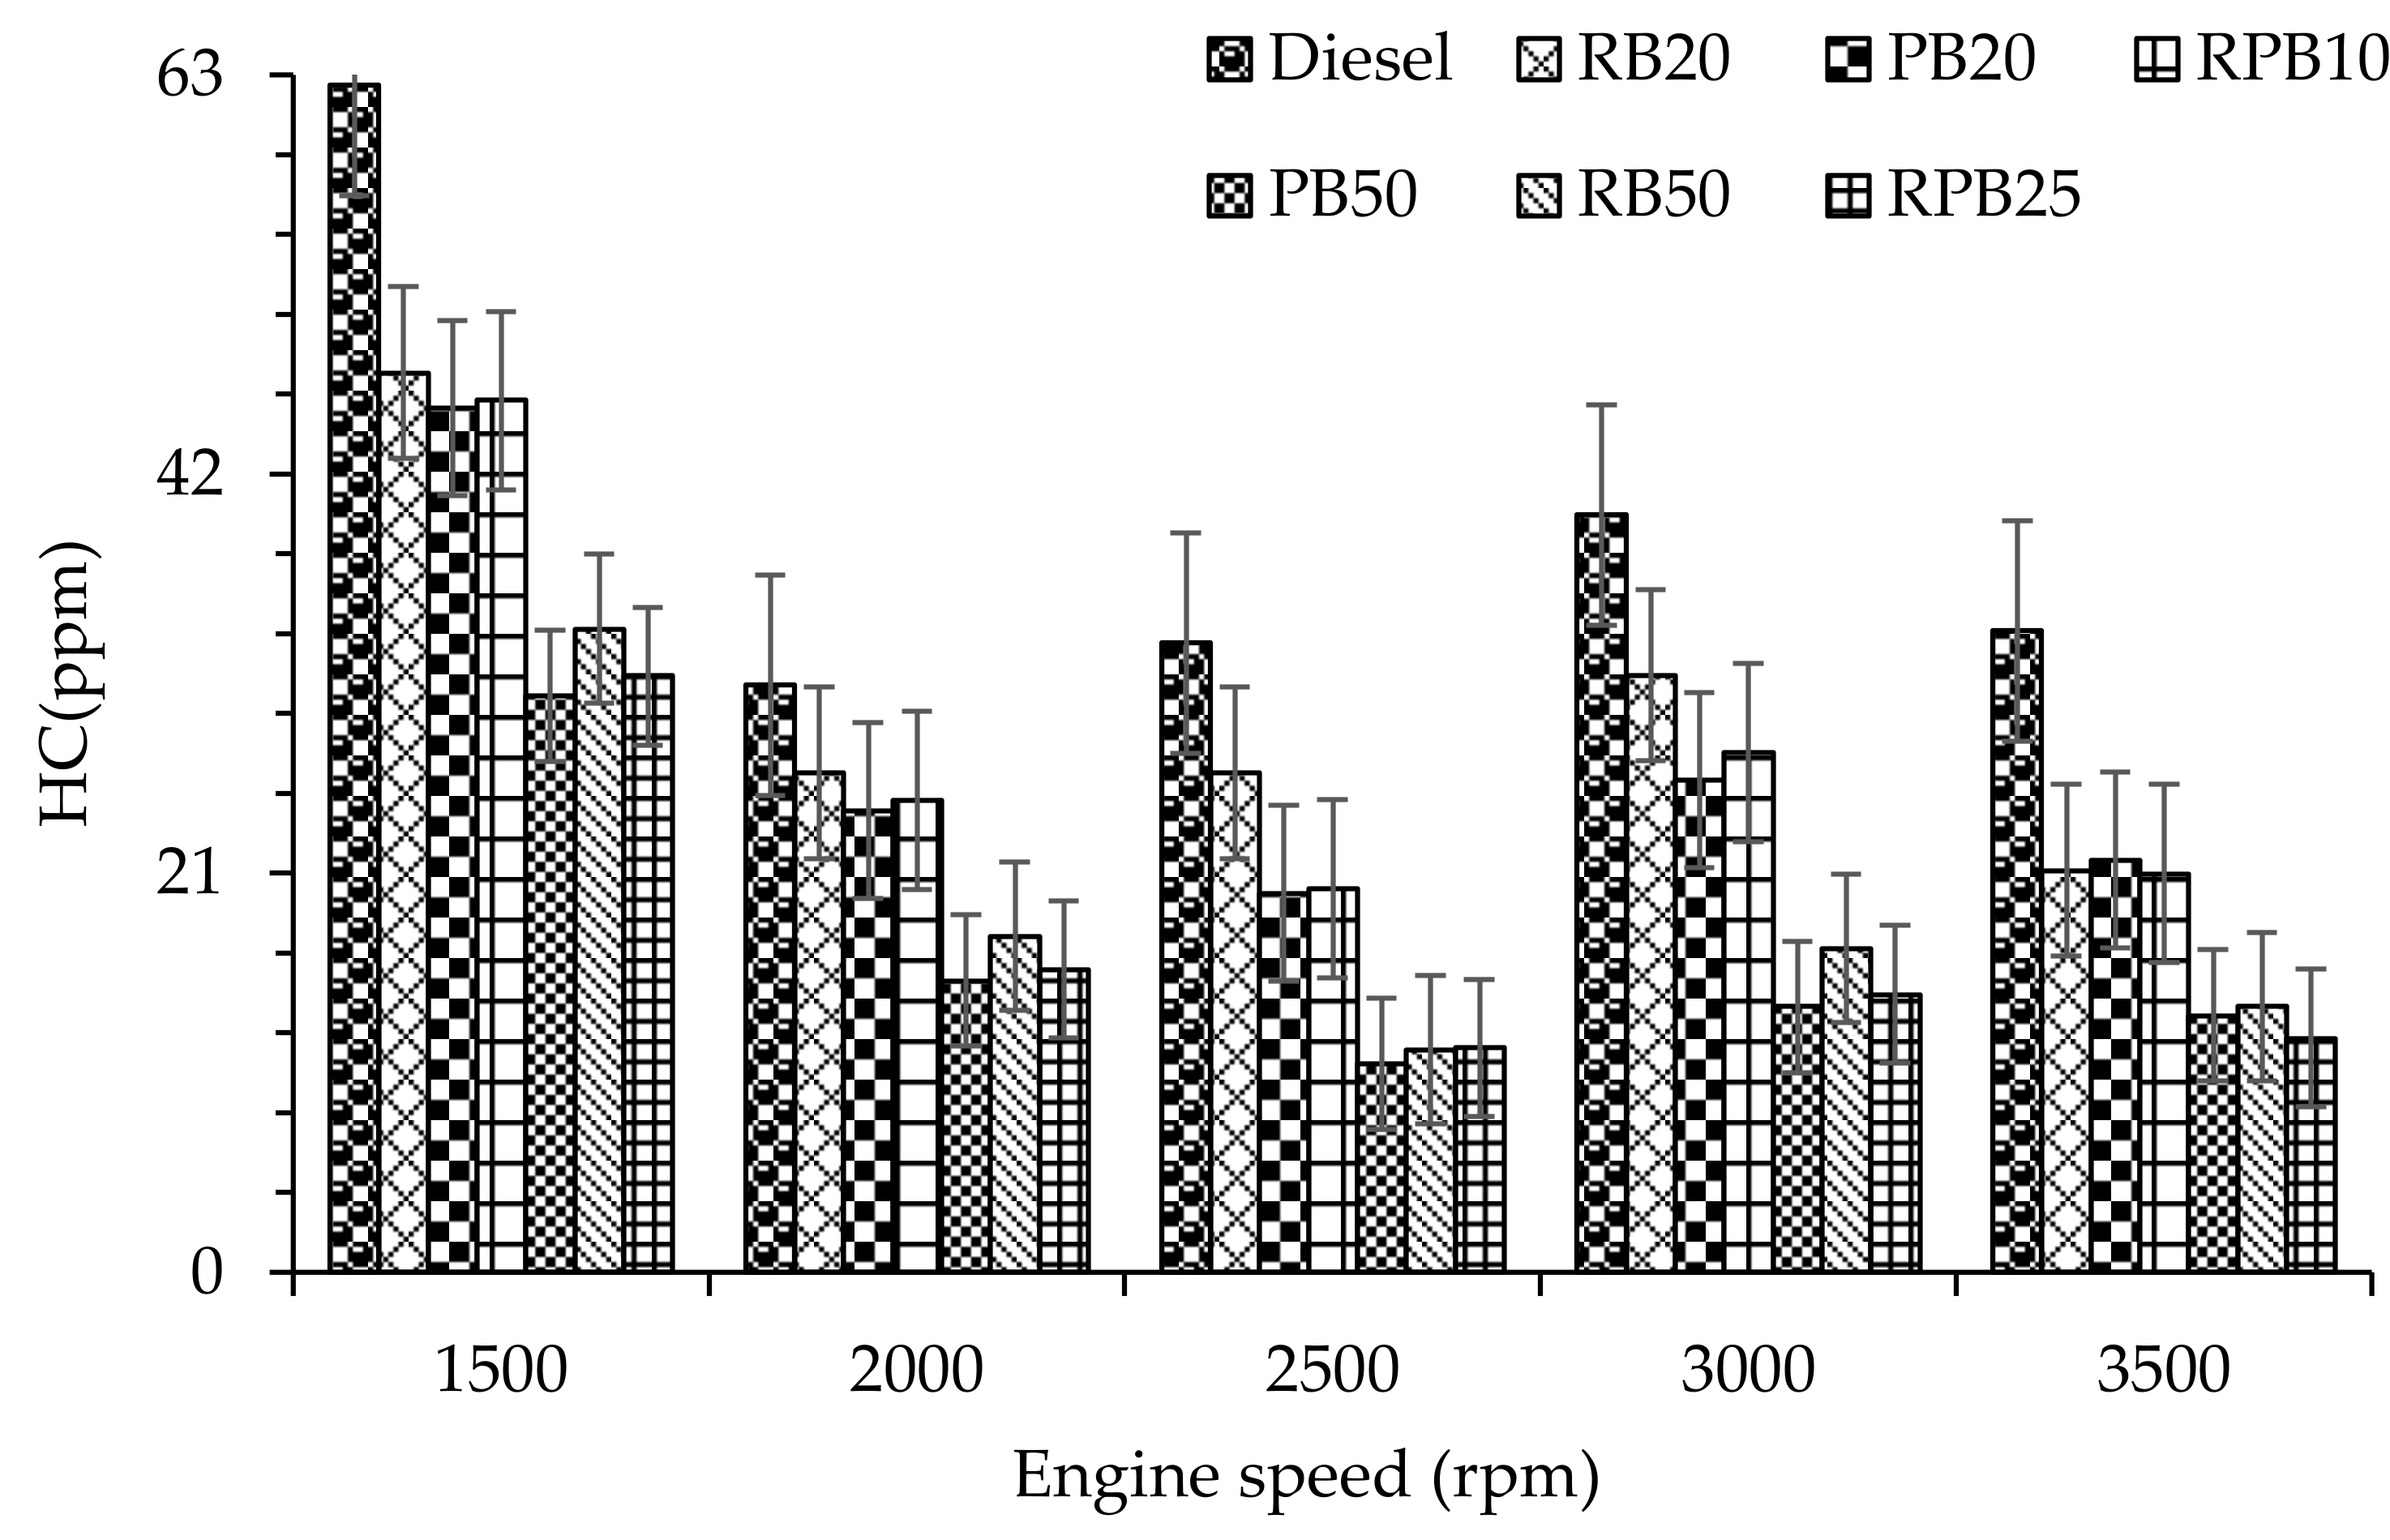
3.4.2. Hydrocarbon Emission (HC)

Incomplete combustion of fuel leads to hydrocarbon emissions resulting from a leaner mixing of the fuel than the lean combustion limit as well as an under-mixing of fuel which leaves the fuel injector nozzle late in the combustion at low velocity [45,53]. Additionally, parameters such as fuel properties, operating conditions, and spray characteristics all affect the HC emission formation [54]. The variation of HC emissions for the tested fuels at different engine speeds is illustrated in Figure 7. The HC emissions of all tested fuels were reduced significantly in comparison to diesel fuel. This was a result of the higher flame speed and post flame oxidation owing to the high cetane number in the biodiesel blends which insured a more complete combustion [55]. The average HC emissions for diesel, PB20, RB20, RPB10, PB50, RB50, and RPB25 were 40.37, 24.46, 25.49, 24.89, 16.82, 20.86 and 18.91 ppm, respectively. This was about 39.42%, 36.85%, 38.34%, 58.21%, 48.34%, and 53.16% reduction in HC emission compared to diesel. Thus, a higher biodiesel blending ratio contributed to lower HC emissions. A similar result was reported by Habibullah et al. [22] who observed HC emission reduction of 8.70–16.52% for palm-coconut binary biodiesel blends than diesel fuel. Sanjid et al. [45] also reported 23–42% lower HC with kapok-moringa biodiesel fuels compared to diesel fuel. Furthermore, RB and RPB blends increased the HC emissions by 4.21–24.02% and 1.76–12.43% compared to PB blends, respectively. This is because of the high oxygen content and high cetane number of PB blends (see Table 6). In comparison to RB, RPB blends showed lower HC emission of 2.36–9.34%. The higher degree of unsaturation components in RB blends were less likely to completely vaporize and burn, hence an increase in HC emission. The lower carbon to hydrogen ratio and oxygen element in biodiesel fuels may have triggered improved combustion, which in turn reduced the HC emissions [56].

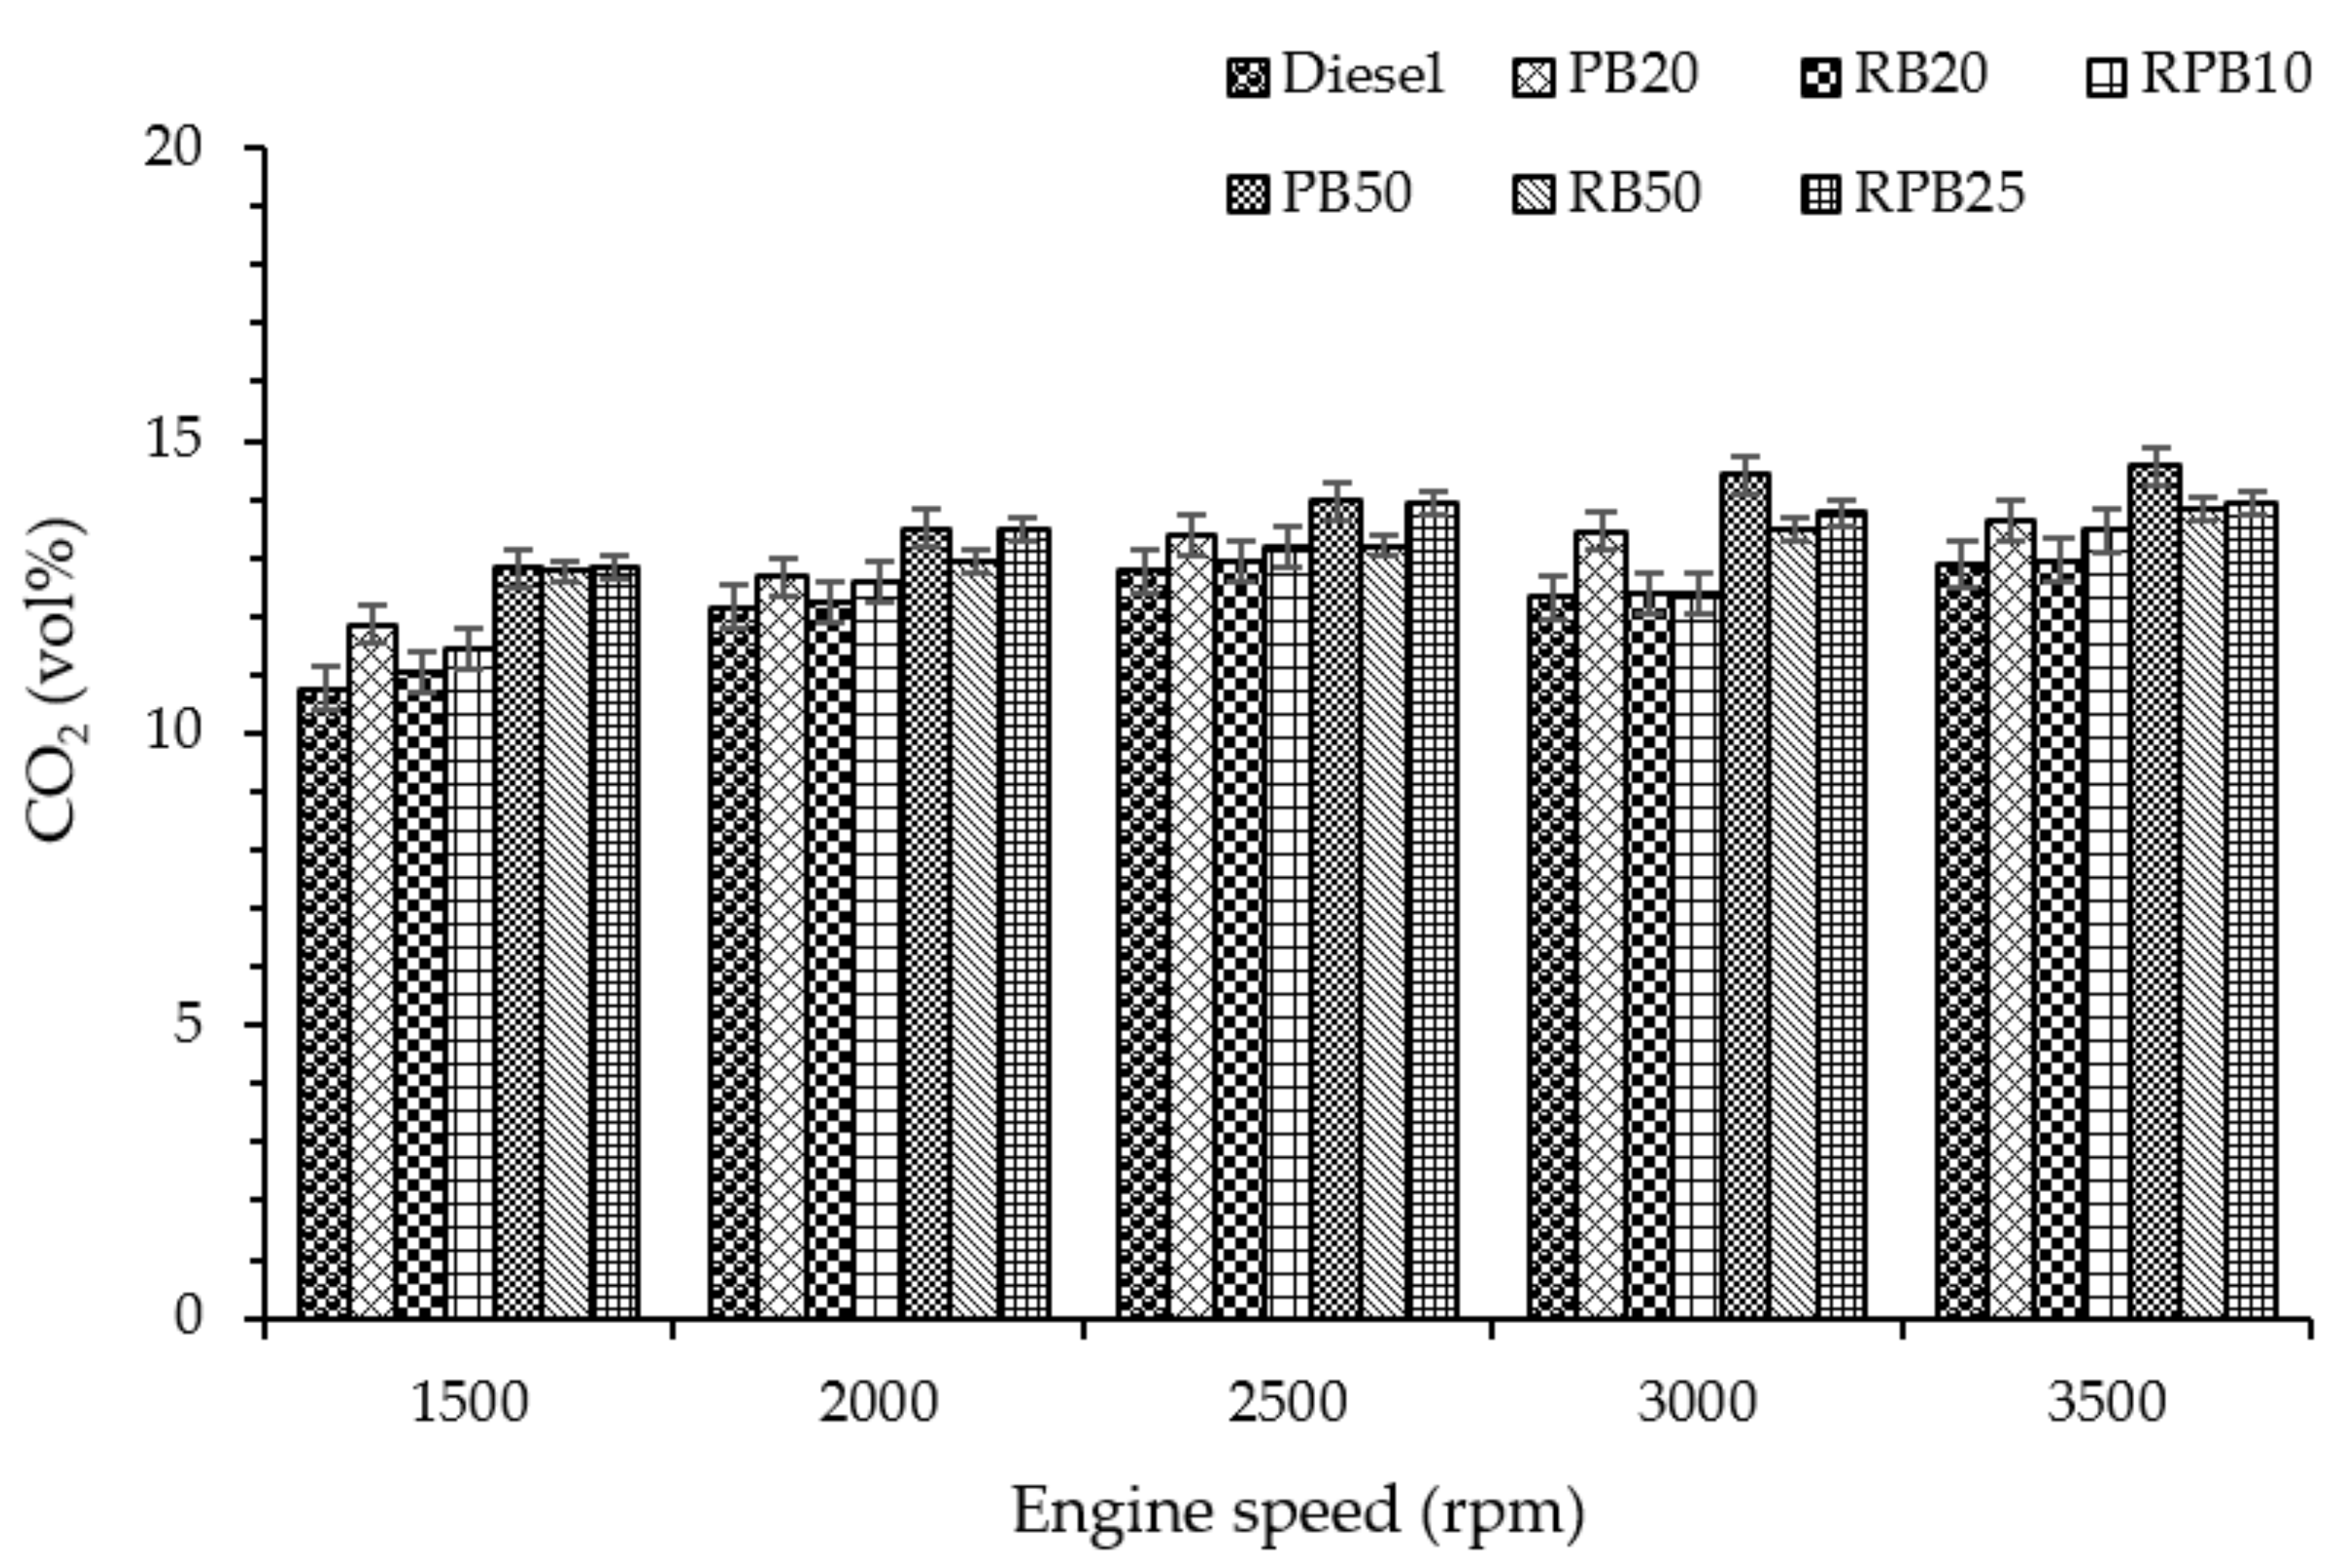
3.4.3. Carbon Dioxide (CO2) Emission

The CO2 emission of a diesel engine is an indicator of complete combustion [57]. It is significant because it contributes to ozone depletion, global warming, as well as public health issues [58]. Figure 8 shows the variation of CO2 emissions against engine speed at full load conditions. The figure shows that, as engine speed increased, CO2 emissions also increased, resulting from an increase in overall fuel mass consumption at higher loads, forming a richer air–fuel mixture. Thus, CO2 emission increased [50]. Results also indicate that CO2 emission increased as biodiesel ratios in the blend increased. This was a result of the biodiesel blends’ oxygen contents which improved combustion [59]. The average CO2 emission for diesel, PB20, RB20, RPB10, PB50, RB50, and RPB25 were 11.18, 12.99, 12.32, 12.82, 14.26, 13.54, and 13.65 vol %, which represent about a 16.28%, 10.2%, 14.72%, 27.56%, 21.17%, and 22.18% increase respectively in comparison to diesel fuel. These results were in agreement with Sanjid et al. [45]. Sanjid et al. [45] also found 2–6% higher CO2 emission on average using kapok-moringa mixed biodiesel blends. Moreover, the highest CO2 emission was observed when the engine was fueled with PB blends, followed by RPB and RB blended fuels. This was a result of the high degree of saturated fatty acids composition of palm oil biodiesel which resulted in complete combustion in comparison to other biodiesels.

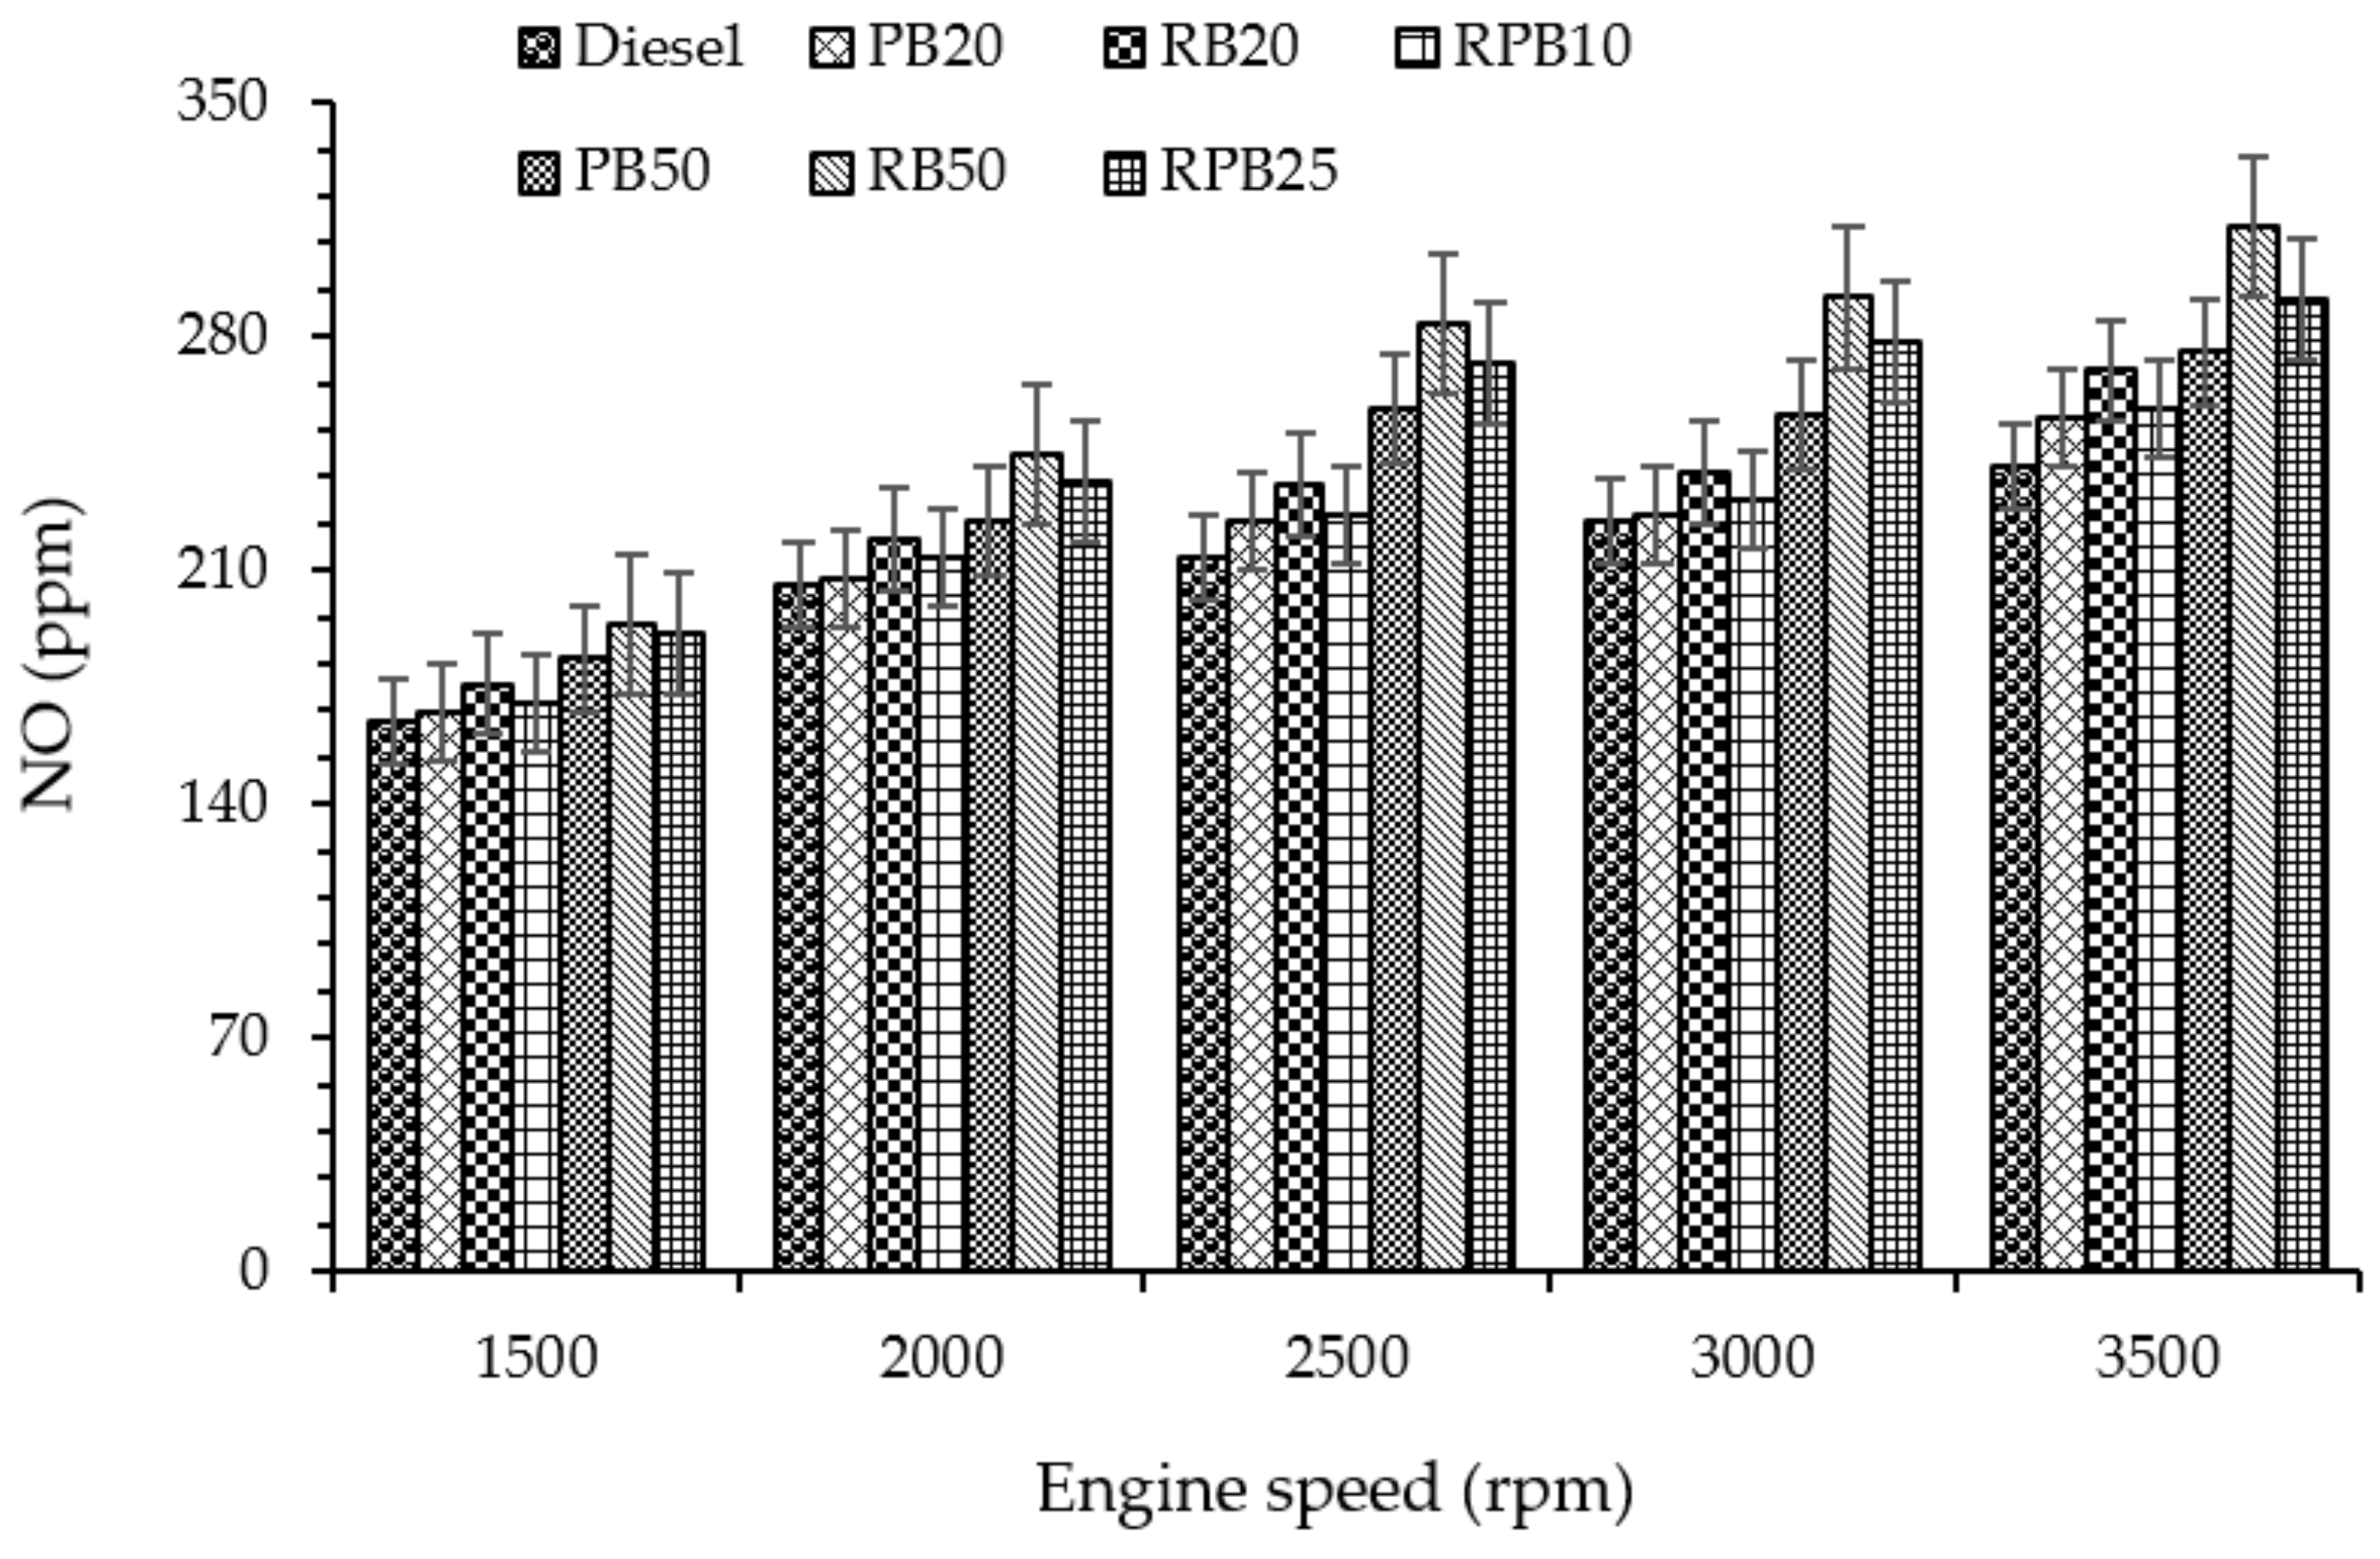
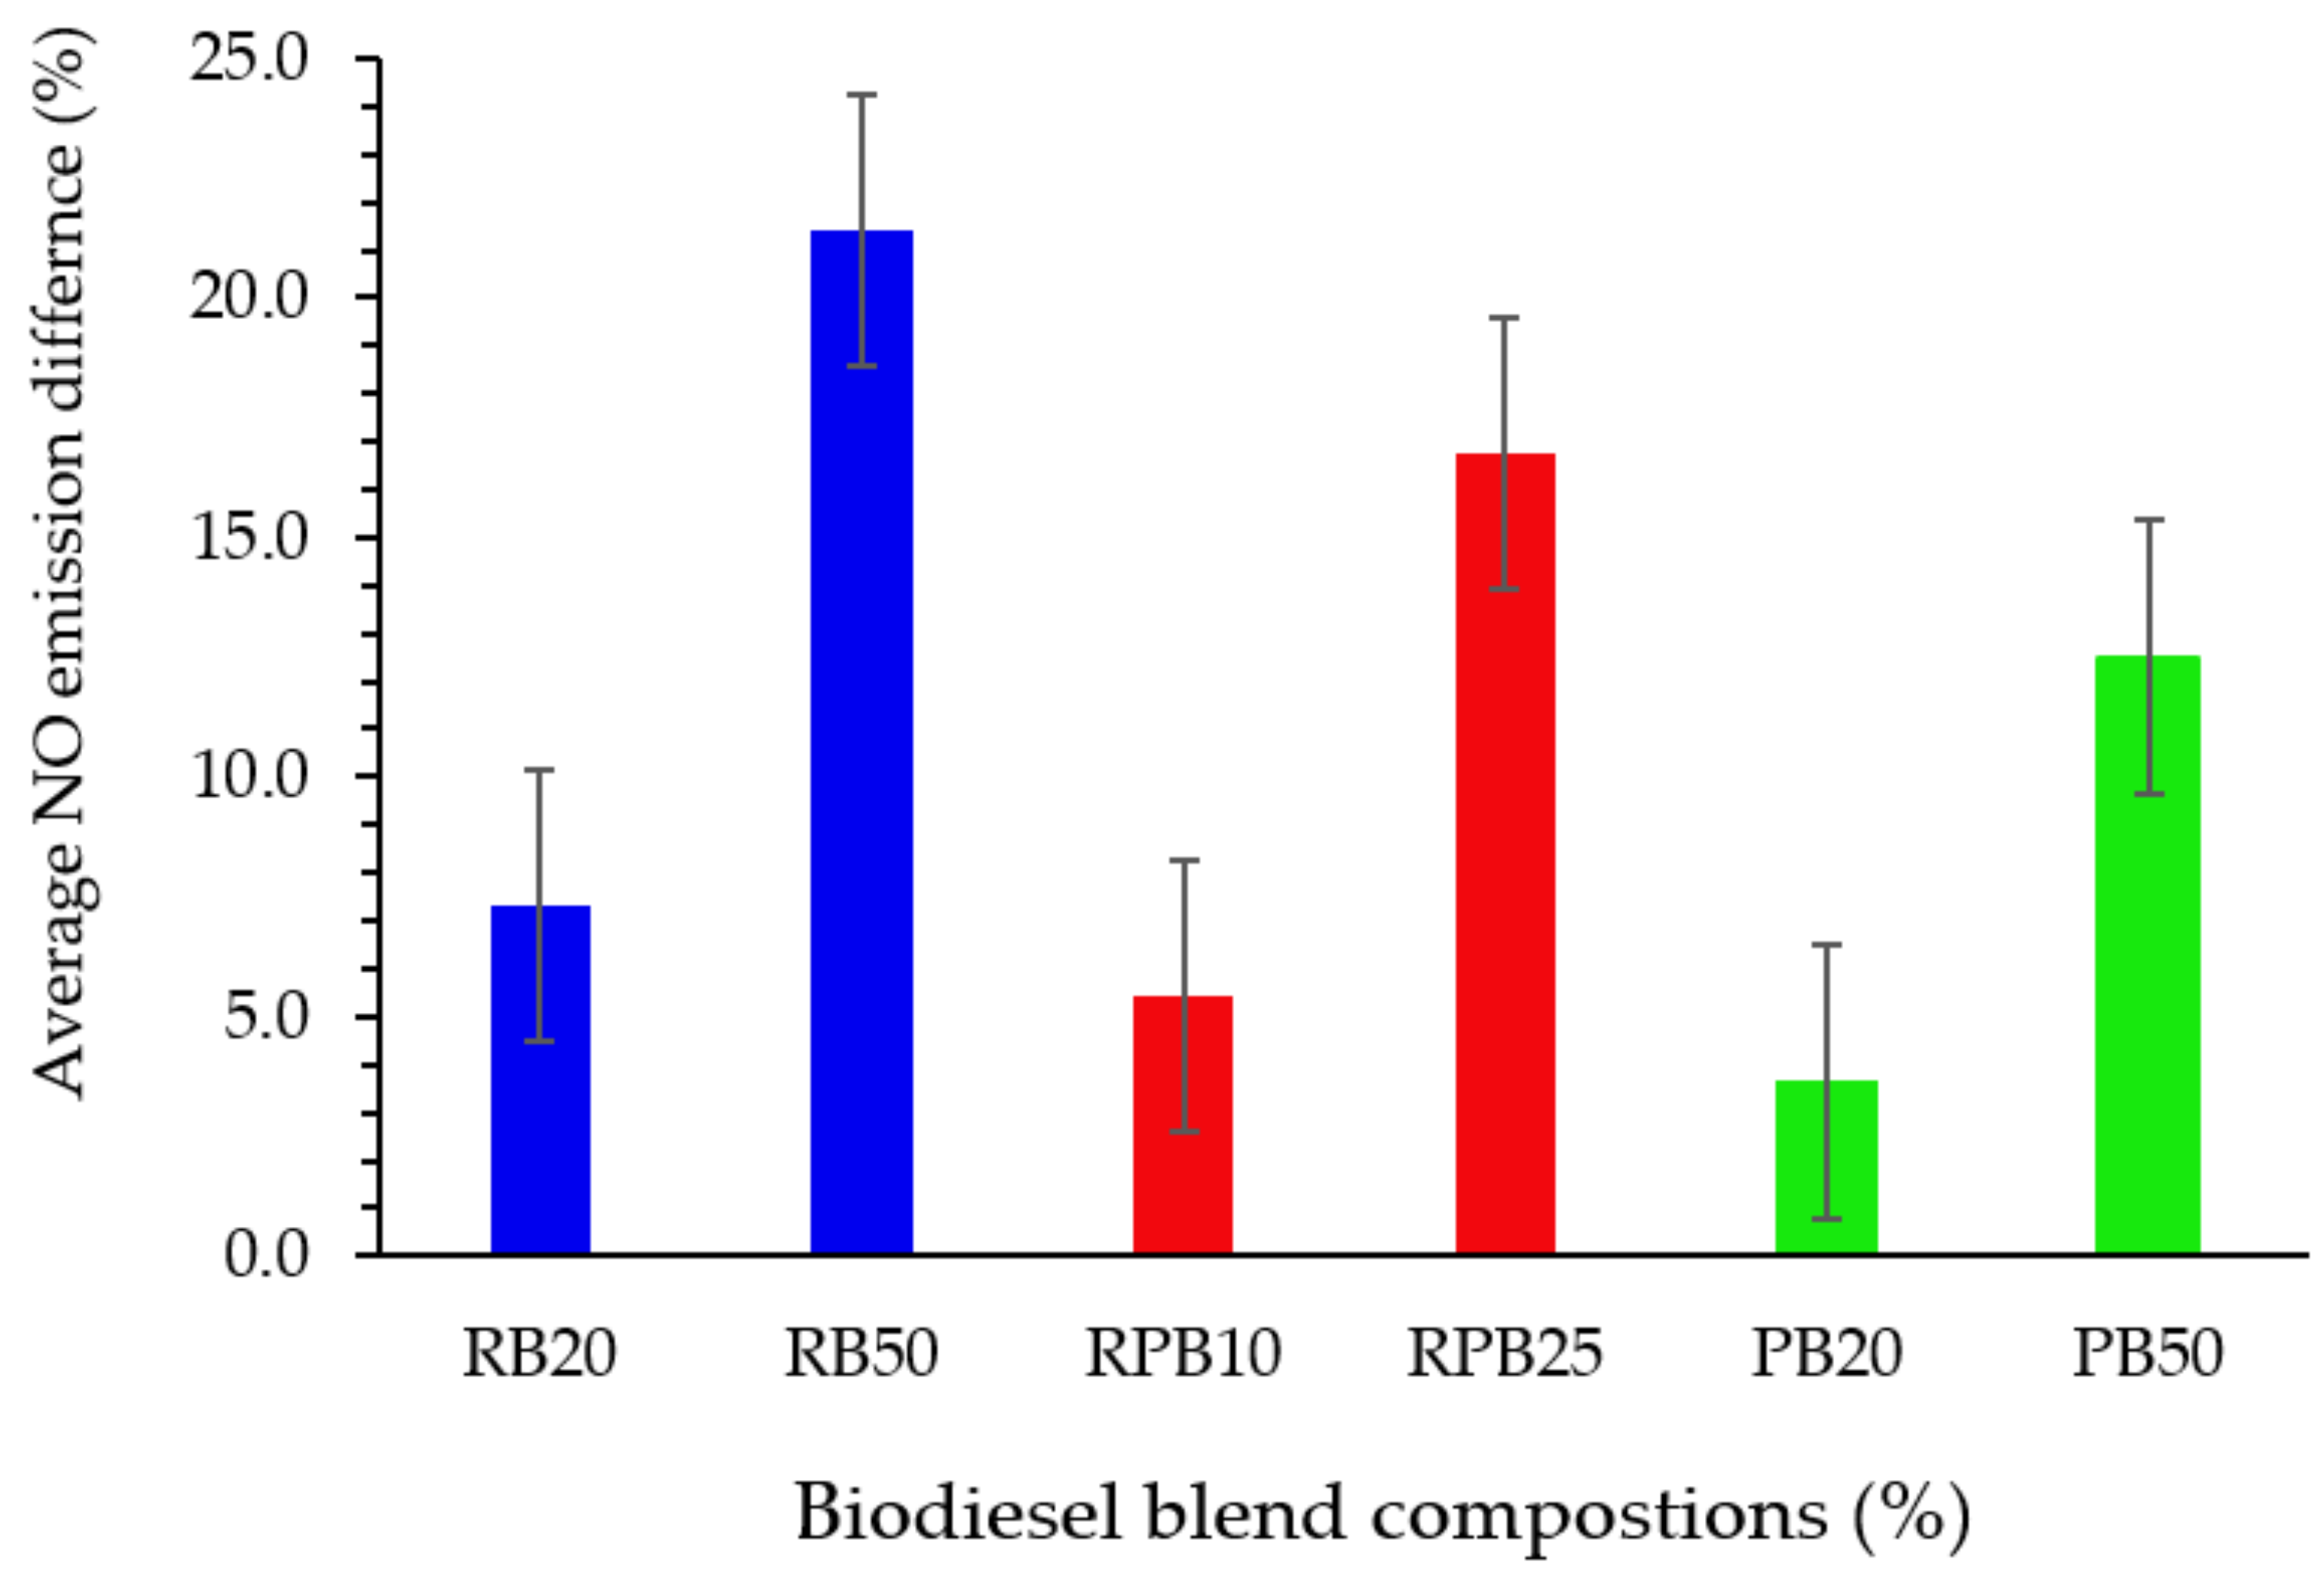
3.4.4. Nitric Oxide (NO) Emission

NO emission is considered one of the significant contributors to environmental issues such as acid rain and photochemical smog. It is the most deleterious pollutant, dependent on combustion behavior, fuel characteristics, operating conditions, ignition delay, residence time of the high burning gas temperature, oxygen and nitrogen content in the reaction mixture, and flame temperature [60,61]. Figure 9 illustrates the relationship of NO emissions with engine speed for different blends at full load conditions. Biodiesel fuels showed significantly higher NO emissions in comparison to diesel fuel. This was a result of a shorter ignition delay period, large spray droplet size, high adiabatic flame temperature, and reduced radiation from soot particles. Additionally, factors such as a higher carbon double bond increase the free radicals hydrocarbon formation and increases NO emission formation [62]. On average, the diesel, PB20, RB20, RPB10, PB50, RB50, and RPB25 produced NO emissions of 211.37, 219.35, 228.76, 223.52, 241.62, 268.96, and 253.89 ppm; equivalent to 3.64%, 7.32%, 5.43%, 12.51%, 21.42%, and 16.75% higher NO emissions respectively in comparison to diesel fuel. These results are in agreement with the results reported by Sanjid et al. [40] and Kinoshita et al. [63] who reported 17% and 8% higher NO emission respectively using binary biodiesel blends in comparison to diesel fuel. It was observed that RB blends produced 4.11–10.17% higher NO emissions than those of palm biodiesel fuels (see Figure 10, attributable to higher adiabatic flame temperature and higher unsaturated fatty acids content which reacted with N2 and caused higher NO emissions [1]. The RPB blends showed 1.87–4.83% higher NO emissions than PB samples and 2.34–5.93% lower NO emissions than the RB blends.

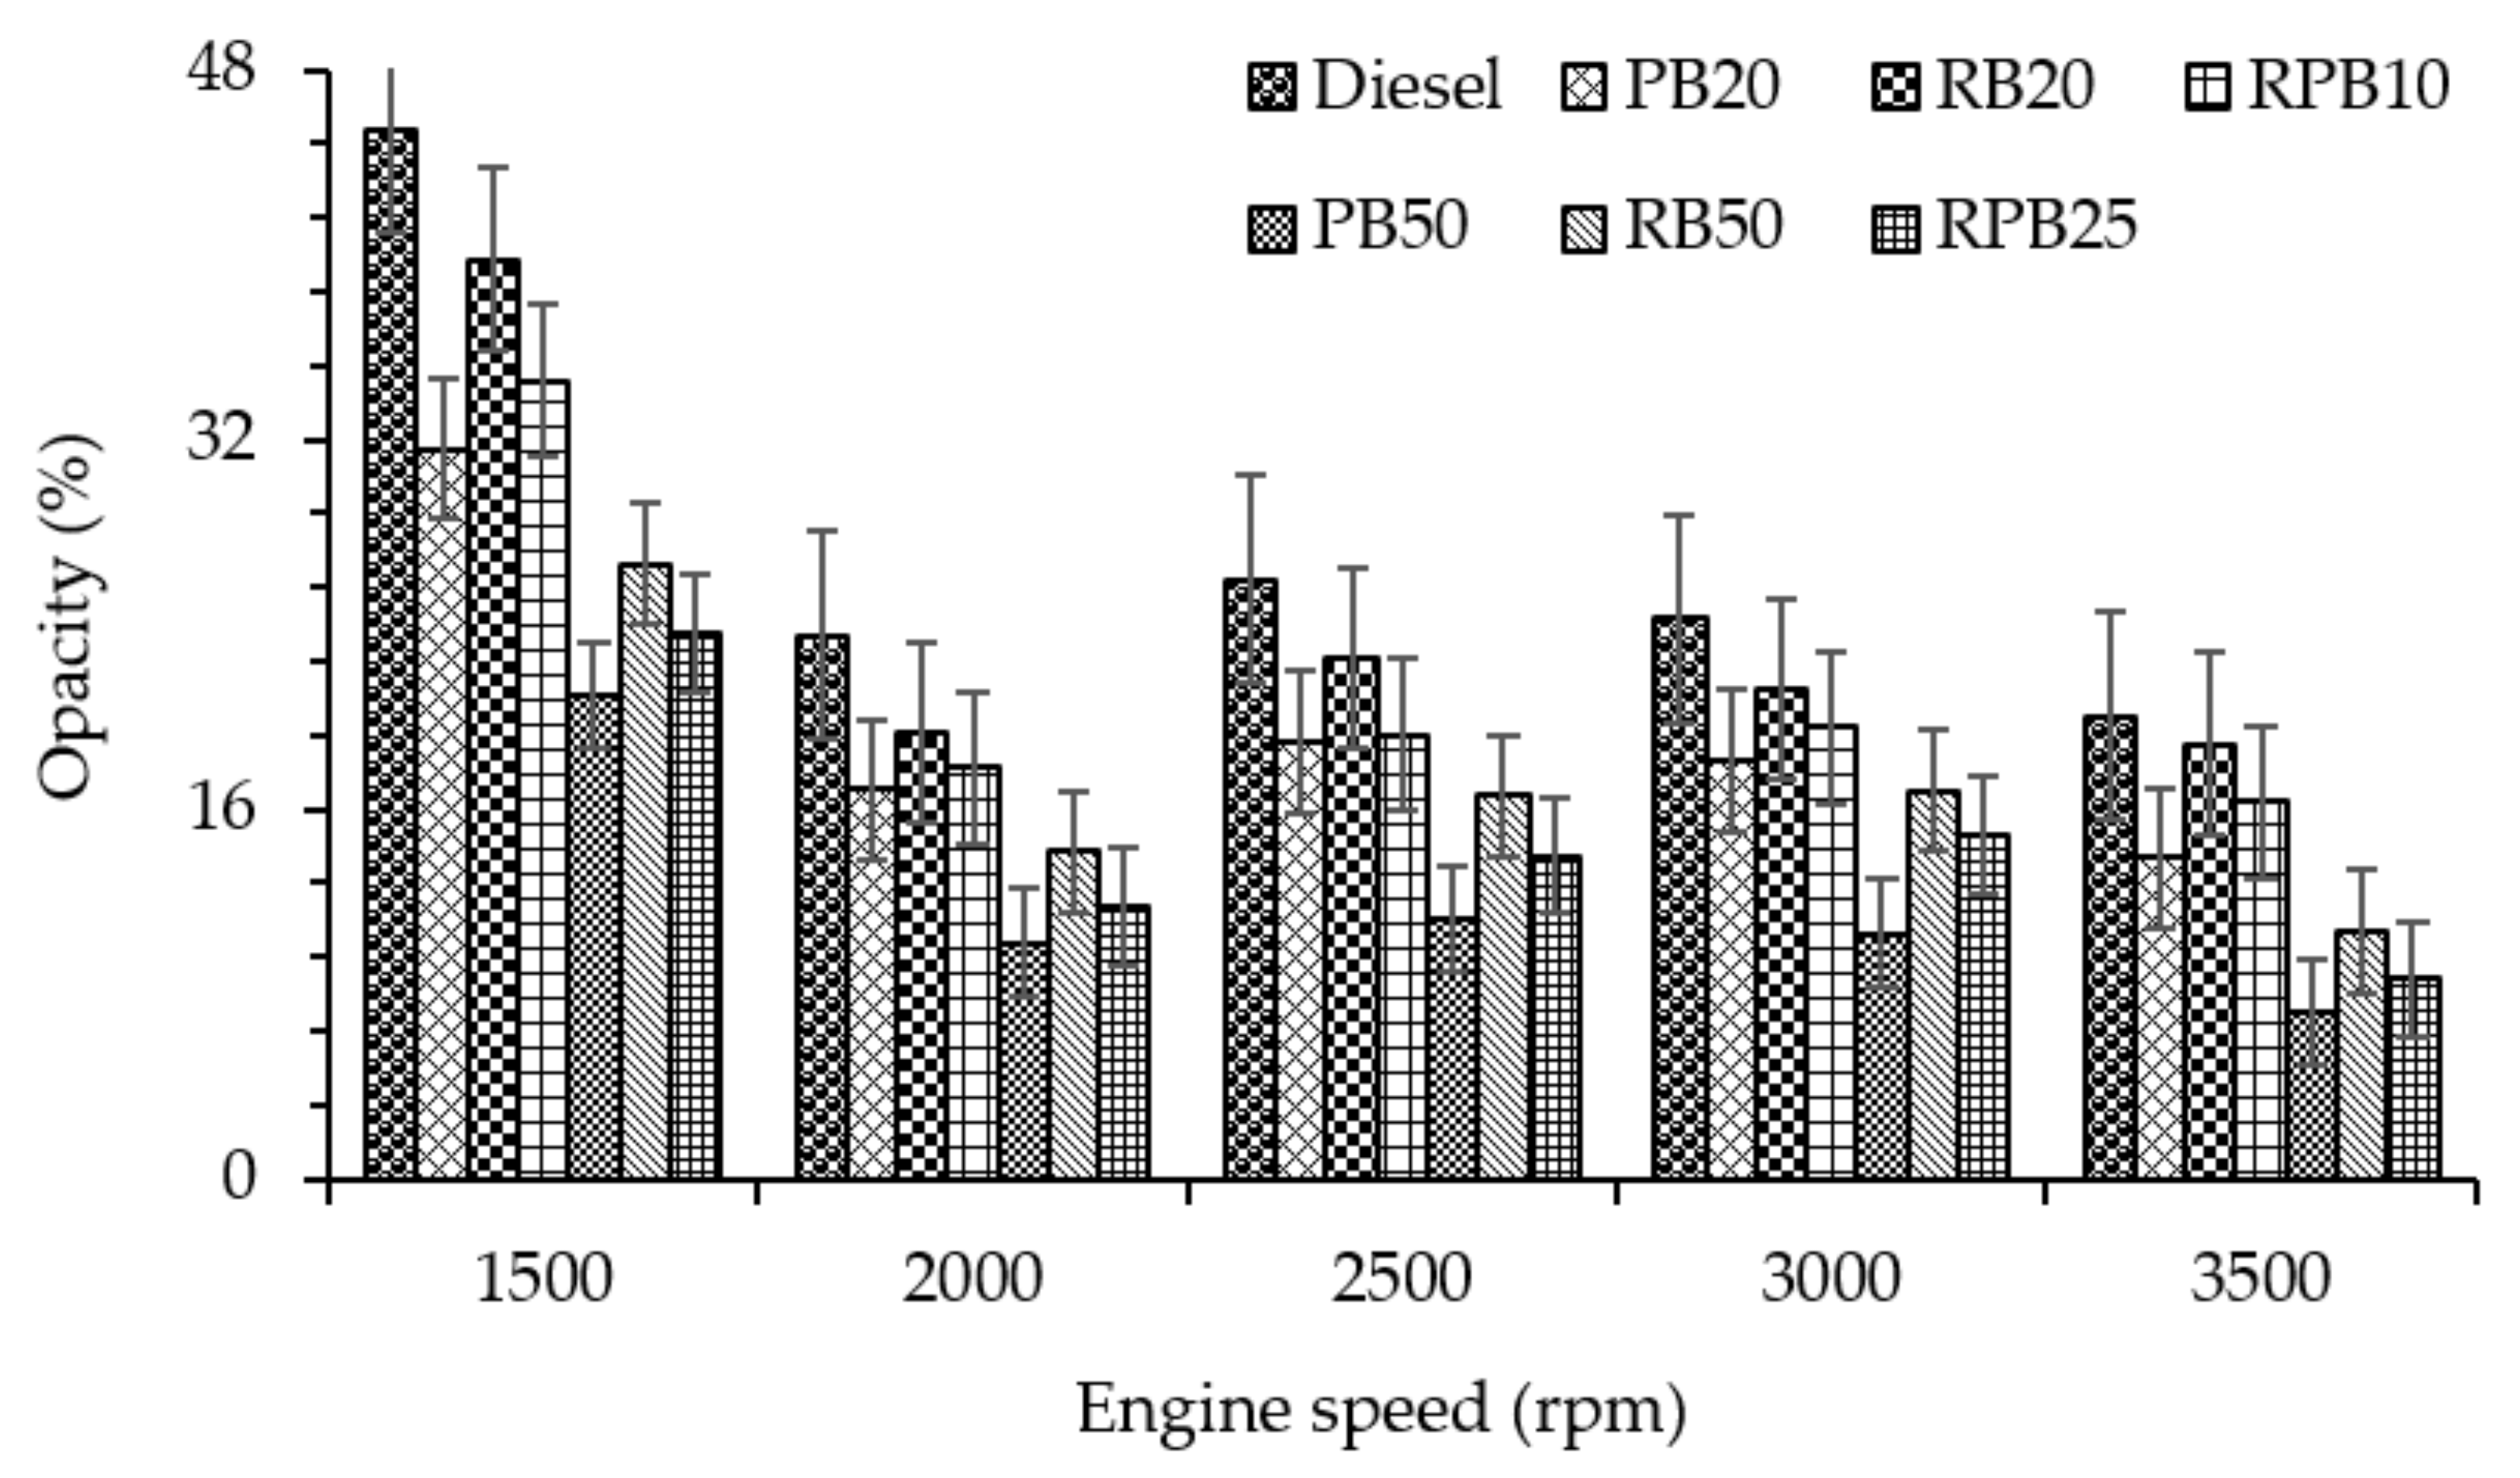
3.4.5. Smoke Opacity

Smoke emission is a major problem in diesel engines, formed by the incomplete burning of hydrocarbon fuels which have partially reacted to the carbon content in liquid fuel [64]. Figure 11 shows the smoke opacity of biodiesel samples as functions of engine speed and at full load conditions. The smoke opacity decreased with the increase in biodiesel ratio and engine speed. The reduction of the smoke opacity was because of a decrease in carbon content and an increase of oxygen element in the biodiesel blends which enhanced the complete combustion [50]. On average, the smoke opacity of diesel, PB20, RB20, RPB10, PB50, RB50, and RPB25 was 27.82%, 21.04%, 24.37%, 21.47%, 10.03%, 16.98%, and 13.57% respectively. The average smoke opacity was reduced by 24.33%, 12.36%, 22.83%, 63.94%, 38.97%, and 47.63% respectively for PB20, RB20, RPB10, PB50, RB50, and RPB25 in comparison to diesel fuel. From the figure, the low smoke opacities of 24.12–48.05%, 16.52–39.78%, and 24.33–49.87% were observed for PB, RB, and RPB blends respectively at 2000 rpm compared to diesel fuel. The smoke opacity values of RPB blends were 11.89–14.19% lower in comparison to RB blends, but were 2–31.16% higher in comparison to PB blends. Notably, as the palm oil biodiesel ratio increased in the RPB blend, smoke opacity decreased. The lower smoke opacity with palm biodiesel blends was a result of the decrease in the carbon residue, higher oxygen element, and lower aromatics contents when compared to rubber seed biodiesel (see Table 6). Additionally, the lower smoke opacity with biodiesel fuel can be explained by the reduction of fuel rich regions, a result of fuel-borne oxygen-enhanced fuel oxidation in these regions and reduced soot formation [65].

4. Conclusions

In this study, combustion performance and emissions of methyl esters produced from rubber seed, palm, and their combined blends biodiesel were investigated and compared to base line fuels. The OS of RPB synthesized from edible palm and non-edible rubber seed oil was found to be 42.94–57.52% higher than RB. Additionally, PP, CP, and CFPP were 15.28–67.48%, 10.58–94.86%, and 85.51–169.17% lower respectively when compared to PB. Results from engine testing showed that BSFC, CO, HC, and smoke opacity were reduced and brake power was increased with the established RPB as compared to RB. The reduction percentage of BSFC, CO, HC, NO, and smoke opacity were 0.85–3.69%, 2.48–6.93%, 2.36–9.34%, 2.34–5.93%, and 11.89–14.19% respectively as compared to RB blends. However, compared to PB blends, RPB showed slightly lower BP of 0.11–1.2% and higher BSFC, CO, HC, NO, and smoke opacity of 0.54–1.59%, 2.61–8%, 1.76–12.43%, 1.87–4.83%, and 2–31.16%, respectively. The higher carbon double bond in rubber seed biodiesel increased the free radicals hydrocarbon formation and resulted in 3.64–21.42% higher NO emission than diesel fuel. In comparison to PB, RPB reduced the CO2 emission by 7.64%, a promising finding for these mixed fuels. NO emissions of the tested biodiesel were 3.64–21.42% higher than diesel fuel. It can be concluded that lower unsaturation components and lower density and viscosity are the most effective properties in reducing NO emission. A slightly higher peak pressure of biodiesel fuels compared to diesel fuel was observed. This was a result of both a higher cetane number and short ignition delay, which enhanced the fuel evaporation rate and caused high combustion rates during the initial combustion phase.

Acknowledgments

The authors would like to acknowledge the Centre for Automotive Research and Electric Mobility (CAREM) Universiti Teknologi Petronas for the engine experimental facilities, technical support, and budget. We also would like to extend our gratitude to the Centre for Biofuel and Biochemical Research for their support in establishing the fuel blending method and the utilization of their blending facilities.

Author Contributions

Ibrahim Khalil Adam and Firmansyah conceived and designed the experiments; Ibrahim Khalil Adam and Ahmad Shahrul Ahmad performed the experiments; Ibrahim Khalil Adam, Firmansyah and Ezrann Zharif Zainal Abidin analyzed the data; Suzana Yusup contributed blending methods and facilities; Abdul Rashid Abdul Aziz, Suzana Yusup and Morgan R. Heikal are reviewing and correcting the paper.

Conflicts of Interest

The authors declare no conflict of interest.

Abbreviations

RSORubber seed oil
RBRubber seed biodiesel
PBPalm oil biodiesel
RPBRubber seed-palm oil biodiesel
BPBrake power
BSFCBrake specific fuel consumption
COCarbon monoxide
HCHydrocarbon
HRRHeat release rate
SOCStart of combustion
BTDCBefore top dead left
JBJatropha biodiesel
PB1010% palm oil biodiesel + 90% diesel fuel
JB1010% jatropha biodiesel + 90% diesel fuel
PBJB55% palm oil biodiesel + 5% jatropha biodiesel + 90% diesel
PB2020% palm oil biodiesel + 80% diesel fuel
JB2020% jatropha biodiesel + 80% diesel fuel
PBJB1010% palm oil biodiesel + 10% jatropha biodiesel + 80% diesel fuel
PB3030% palm oil biodiesel + 70% diesel fuel
CBCoconut biodiesel
CB3030% coconut biodiesel + 70% diesel fuel
PB15CB1515% palm oil biodiesel + 15% coconut biodiesel + 70% diesel fuel
PCPalm-coconut biodiesel
JPCJatropha-palm-coconut biodiesel
CPOCrude palm oil
RSERelative standard error

References

  1. Mofijur, H.; Masjuki, H.H.; Kalam, M.A.; Atabani, A.E.; Fattah, I.M.R.; Mobarak, H.M. Comparative evaluation of performance and emission characteristics of Moringa oleifera and Palm oil based biodiesel in a diesel engine. Ind. Crops Prod. 2014, 53, 78–84. [Google Scholar] [CrossRef]
  2. Fattah, I.R.; Masjuki, H.; Liaquat, A.; Ramli, R.; Kalam, M.; Riazuddin, V. Impact of various biodiesel fuels obtained from edible and non-edible oils on engine exhaust gas and noise emissions. Renew. Sustain. Energy Rev. 2013, 18, 552–567. [Google Scholar] [CrossRef]
  3. Piemonte, V.; di Paola, L.; Iaquaniello, G.; Prisciandaro, M. Biodiesel production from microalgae: Ionic liquid process simulation. J. Clean. Prod. 2016, 111, 62–68. [Google Scholar] [CrossRef]
  4. Malaysian Oil Palm Statistics 2007; Economics and Industry Development Division, MPOB: Selangor, Malaysia, 2008.
  5. Biofuels Annual Kuala Lumpur Malaysia. 2016. Available online: https://gain.fas.usda.gov (accessed on 29 March 2018).
  6. Wendy, N.; Qin, P.; Loong, L.H.; Yusup, S. Supply network synthesis on rubber seed oil utilisation as potential biofuel feedstock. Energy 2013, 55, 82–88. [Google Scholar]
  7. Lim, W.H.; Ooi, T.L.; Hong, H.K. Study on low temperature properties of palm oil methyl esters-petrodiesel blends. J. Oil Palm Res. 2009, 21, 683–692. [Google Scholar]
  8. Lam, M.K.; Tan, K.T.; Lee, K.T.; Mohamed, A.R. Malaysian palm oil: Surviving the food versus fuel dispute for a sustainable future. Renew. Sustain. Energy Rev. 2009, 13, 1456–1464. [Google Scholar] [CrossRef]
  9. Atabani, A.E.; Silitonga, A.S.; Ong, H.C.; Masjuki, H.H.; Badruddin, I.A.; Fayaz, H. Non-edible vegetable oils: A critical evaluation of oil extraction, fatty acid compositions, biodiesel production, characteristics, engine performance and emissions production. Renew. Sustain. Energy Rev. 2013, 18, 211–245. [Google Scholar] [CrossRef]
  10. Abdullah, A.Z.; Salamatinia, B.; Mootabadi, H.; Bhatia, S. Current status and policies on biodiesel industry in Malaysia as the world’s leading producer of palm oil. Energy Policy 2009, 37, 5440–5448. [Google Scholar] [CrossRef]
  11. Eka, H.D.; Aris, T.Y.; Nadiah, W.W. Potential use of Malaysian rubber (Hevea brasiliensis) seed as food, feed and biofue. Int. Food Res. J. 2010, 17, 527–534. [Google Scholar]
  12. Abdullah, B.M.; Salimon, J. Physicochemical characteristics of Malaysian rubber (Hevea brasiliensis) seed oil. Eur. J. Sci. Res. 2009, 31, 437–445. [Google Scholar]
  13. Ashraful, A.M.; Masjuki, H.H.; Kalam, M.A.; Fattah, I.M.R.; Imtenan, S.; Shahir, S.A.; Mobarak, H.M. Production and comparison of fuel properties, engine performance, and emission characteristics of biodiesel from various non-edible vegetable oils: A review. Energy Convers. Manag. 2014, 80, 202–228. [Google Scholar] [CrossRef]
  14. Knothe, G. Designer biodiesel: Optimizing fatty ester composition to improve fuel properties. Energy Fuels 2008, 22, 1358–1364. [Google Scholar] [CrossRef]
  15. Knothe, G. Dependence of biodiesel fuel properties on the structure of fatty acid alkyl esters. Fuel Process. Technol. 2005, 86, 1059–1070. [Google Scholar] [CrossRef]
  16. Jena, R.H.; Jadav, P.C.; Snehal, S. Performance of a diesel engine with blends of biodiesel (from a mixture of oils) and high-speed diesel. Int. J. Energy Environ. Eng. 2013, 4, 1. [Google Scholar]
  17. Haas, M.J.; Scott, K.M.; Alleman, T.L.; McCormick, R.L. Engine Performance of Biodiesel Fuel Prepared from Soybean Soapstock: A High Quality Renewable Fuel Produced from a Waste Feedstock. Energy Fuels 2001, 15, 1207–1212. [Google Scholar] [CrossRef]
  18. Can, Ö. Combustion characteristics, performance and exhaust emissions of a diesel engine fueled with a waste cooking oil biodiesel mixture. Energy Convers. Manag. 2014, 87, 676–686. [Google Scholar] [CrossRef]
  19. Öztürk, E. Performance, emissions, combustion and injection characteristics of a diesel engine fuelled with canola oil–hazelnut soapstock biodiesel mixture. Fuel Process. Technol. 2015, 129, 183–191. [Google Scholar] [CrossRef]
  20. Sanjid, A.; Hassan, M.H.; Kalam, M.A.; Rahman, A.S.M.; Abedin, M.J.; Palash, S.M. Production of palm and jatropha based biodiesel and investigation of palm-jatropha combined blend properties, performance, exhaust emission and noise in an unmodified diesel engine. J. Clean. Prod. 2014, 65, 295–303. [Google Scholar] [CrossRef]
  21. Habibullah, M.; Masjuki, H.H.; Kalam, M.A.; Fattah, I.M.R.; Ashraful, A.M.; Mobarak, H.M. Biodiesel production and performance evaluation of coconut, palm and their combined blend with diesel in a single-cylinder diesel engine. Energy Convers. Manag. 2014, 87, 250–257. [Google Scholar] [CrossRef]
  22. Habibullah, M.S.; Fattah, I.M.R.; Masjuki, H.H.; Kalam, M.A. Effects of Palm–Coconut biodiesel blends on the performance and emission of a single-cylinder diesel engine. Energy Fuels 2015, 29, 734–743. [Google Scholar] [CrossRef]
  23. Arbab, M.I.; Varman, M.; Masjuki, H.H.; Kalam, M.A.; Imtenan, S.; Sajjad, H.; Rizwanul Fattah, I.M. Evaluation of combustion, performance, and emissions of optimum palm–coconut blend in turbocharged and non-turbocharged conditions of a diesel engine. Energy Convers. Manag. 2015, 90, 111–120. [Google Scholar] [CrossRef]
  24. Iqbal, M.A.; Varman, M.; Hassan, M.H.; Kalam, M.A.; Hossain, S.; Sayeed, I. Tailoring fuel properties using jatropha, palm and coconut biodiesel to improve CI engine performance and emission characteristics. J. Clean. Prod. 2015, 101, 262–270. [Google Scholar] [CrossRef]
  25. Sahoo, P.K.; Das, L.M. Combustion analysis of Jatropha, Karanja and Polanga based biodiesel as fuel in a diesel engine. Fuel 2009, 88, 994–999. [Google Scholar] [CrossRef]
  26. Firestone, D. Official Methods and Recommended Practices of the AOCS; American Oil Chemists’ Society: Urbana, IL, USA, 2009. [Google Scholar]
  27. Anton, P. Instruction Manual: DMA 4100 M, DMA 4500 M, DMA 5000 M; Anton Paar: Graz, Austria, 2012. [Google Scholar]
  28. Chuah, L.F.; Yusup, S.; Aziz, A.R.A.; Bokhari, A.; Abdullah, M.Z. Cleaner production of methyl ester using waste cooking oil derived from palm olein using a hydrodynamic cavitation reactor. J. Clean. Prod. 2015, 112, 4505–4514. [Google Scholar] [CrossRef]
  29. Canakci, M. Combustion characteristics of a turbocharged DI compression ignition engine fueled with petroleum diesel fuels and biodiesel. Bioresour. Technol. 2007, 98, 1167–1175. [Google Scholar] [CrossRef] [PubMed]
  30. Bokhari, A.; Chuah, L.F.; Yusup, S.; Klemeš, J.J.; Kamil, R.N.M. Optimisation on pretreatment of rubber seed (Hevea brasiliensis) oil via esterification reaction in a hydrodynamic cavitation reactor. Bioresour. Technol. 2015, 199, 414–422. [Google Scholar] [CrossRef] [PubMed]
  31. Bokhari, A.; Chuah, L.F.; Yusup, S.; Klemeš, J.J.; Akbar, M.M.; Kamil, R.N.M. Cleaner production of rubber seed oil methyl ester using a hydrodynamic cavitation: Optimisation and parametric study. J. Clean. Prod. 2016, 136, 31–41. [Google Scholar] [CrossRef]
  32. Ahmad, J.; Yusup, S.; Bokhari, A.; Nik Mohammad Kamil, R. Study of fuel properties of rubber seed oil based biodiesel. Energy Convers. Manag. 2014, 78, 266–275. [Google Scholar] [CrossRef]
  33. Yusri, I.; Mamat, R.; Azmi, W.; Omar, A.; Obed, M.; Shaiful, A. Application of response surface methodology in optimization of performance and exhaust emissions of secondary butyl alcohol-gasoline blends in SI engine. Energy Convers. Manag. 2017, 133, 178–195. [Google Scholar] [CrossRef]
  34. ASTM. Standard Specification for Biodiesel Fuel Blend Stock (B100) for Middle Distillate Fuels; ASTM D6751; ATSM: West Conshohocken, PA, USA, 2015. [Google Scholar]
  35. CEN. Automotive Fuels-Fatty Acid Methyl Esters (FAME) for Diesel Engines-Requirements and Test Methods; EN 14214; European Committee for Standardization: Brussels, Belgium, 2008. [Google Scholar]
  36. Thaiyasuit, K.P.P.; Milton, B. Combustion efficiency and performance of RSO biodiesel as alternative fuel in a single cylinder CI engine. Energy Explor. Exploit. 2012, 30, 153–166. [Google Scholar] [CrossRef]
  37. Chauhan, B.S.; Kumar, N.; Cho, H.M. A study on the performance and emission of a diesel engine fueled with Jatropha biodiesel oil and its blends. Energy 2012, 37, 616–622. [Google Scholar] [CrossRef]
  38. Buyukkaya, E.; Benli, S.; Karaaslan, S.; Guru, M. Effects of trout-oil methyl ester on a diesel engine performance and emission characteristics. Energy Convers. Manag. 2013, 69, 41–48. [Google Scholar] [CrossRef]
  39. Goodrum, J. Volatility and boiling points of biodiesel from vegetable oils and tallow. Biomass Bioenergy 2002, 22, 205–211. [Google Scholar] [CrossRef]
  40. Qi, D.; Chen, H.; Geng, L.; Bian, Y.Z. Experimental studies on the combustion characteristics and performance of a direct injection engine fueled with biodiesel/diesel blends. Energy Convers. Manag. 2010, 51, 2985–2992. [Google Scholar] [CrossRef]
  41. Canakci, M.; Ozsezen, A.N.; Arcaklioglu, E.; Erdil, A. Prediction of performance and exhaust emissions of a diesel engine fueled with biodiesel produced from waste frying palm oil. Expert Syst. Appl. 2009, 36, 9268–9280. [Google Scholar] [CrossRef]
  42. Silitonga, A.S.; Masjuki, H.H.; Mahlia, T.M.I.; Ong, H.C.; Chonga, W.T. Experimental study on performance and exhaust emissions of a diesel engine fuelled with Ceiba pentandra biodiesel blends. Energy Convers. Manag. 2013, 76, 828–836. [Google Scholar] [CrossRef]
  43. Ong, H.H.M.H.C.; Mahlia, T.M.I.; Silitonga, A.S.; Chong, W.T.; Leong, K.Y. Optimization of biodiesel production and engine performance from high free fatty acid Calophyllum inophyllum oil in CI diesel engine. Energy Convers. Manag. 2014, 81, 30–40. [Google Scholar] [CrossRef]
  44. Özener, O.; Yüksek, L.; Ergenç, A.T.; Özkan, M. Effects of soybean biodiesel on a DI diesel engine performance, emission and combustion characteristics. Fuel 2014, 115, 875–883. [Google Scholar] [CrossRef]
  45. Sanjid, A.; Kalam, M.A.; Masjuki, H.H.; Varman, M.; Zulkifli Nurin Wahidah, B.M.; Abedin, M.J. Performance and emission of multi-cylinder diesel engine using biodiesel blends obtained from mixed inedible feedstocks. J. Clean. Prod. 2016, 112, 4114–4122. [Google Scholar] [CrossRef]
  46. Yasin, M.M.; Yusaf, T.; Mamat, R.; Yusop, A.F. Characterization of a diesel engine operating with a small proportion of methanol as a fuel additive in biodiesel blend. Appl. Energy 2014, 114, 865–873. [Google Scholar] [CrossRef]
  47. Teoh, Y.; Masjuki, H.; Kalam, M.; Amalina, M.; How, H. Impact of Waste Cooking Oil Biodiesel on Performance, Exhaust Emission and Combustion Characteristics in a Light-Duty Diesel Engine; SAE Technical Paper 0148-7191; SAE: Warrendale, PA, USA, 2013. [Google Scholar]
  48. Muralidharan, K.; Vasudevan, D.; Sheeba, K. Performance, emission and combustion characteristics of biodiesel fuelled variable compression ratio engine. Energy 2011, 36, 5385–5393. [Google Scholar] [CrossRef]
  49. İleri, E.; Koçar, G. Effects of antioxidant additives on engine performance and exhaust emissions of a diesel engine fueled with canola oil methyl ester–diesel blend. Energy Convers. Manag. 2013, 76, 145–154. [Google Scholar] [CrossRef]
  50. Gumus, M.; Sayin, C.; Canakci, M. The impact of fuel injection pressure on the exhaust emissions of a direct injection diesel engine fueled with biodiesel-diesel fuel blends. Fuel 2012, 95, 486–494. [Google Scholar] [CrossRef]
  51. Singh, M.; Sandhu, S.S. Performance and emission characteristics of an indirect injection (IDI) multi-cylinder compression ignition (CI) engine using diesel/Argemone maxicana biodiesel blends. RSC Adv. 2015, 5, 91069–91081. [Google Scholar] [CrossRef]
  52. Atabani, A.E.; Silitonga, A.S.; Badruddin, I.A.; Mahlia, T.; Masjuki, H.; Mekhilef, S. A comprehensive review on biodiesel as an alternative energy resource and its characteristics. Renew. Sustain. Energy Rev. 2012, 16, 2070–2093. [Google Scholar] [CrossRef]
  53. Fattah, I.R.; Masjuki, H.; Kalam, M.; Wakil, M.; Rashedul, H.; Abedin, M. Performance and emission characteristics of a CI engine fueled with Cocos nucifera and Jatropha curcas B20 blends accompanying antioxidants. Ind. Crops Prod. 2014, 57, 132–140. [Google Scholar] [CrossRef]
  54. Valente, O.S.; Pasa, V.M.D.; Belchior, C.R.P.; Sodré, J.R. Exhaust emissions from a diesel power generator fuelled by waste cooking oil biodiesel. Sci. Total Environ. 2012, 431, 57–61. [Google Scholar] [CrossRef] [PubMed]
  55. Varatharajan, K.; Cheralathan, M.; Velraj, R. Mitigation of NOx emissions from a jatropha biodiesel fuelled DI diesel engine using antioxidant additives. Fuel 2011, 90, 2721–2725. [Google Scholar] [CrossRef]
  56. Wang, W.-G.; Lyons, D.W.; Clark, N.N.; Gautam, M.; Norton, P. Emissions from nine heavy trucks fueled by diesel and biodiesel blend without engine modification. Environ. Sci. Technol. 2000, 34, 933–939. [Google Scholar] [CrossRef]
  57. Arbab, M.I.; Masjuki, H.H.; Varman, M.; Kalam, M.A.; Imtenan, S.; Sajjad, H. Fuel properties, engine performance and emission characteristic of common biodiesels as a renewable and sustainable source of fuel. Renew. Sustain. Energy Rev. 2013, 22, 133–147. [Google Scholar] [CrossRef]
  58. Ozsezen, A.N.; Canakci, M. Determination of performance and combustion characteristics of a diesel engine fueled with canola and waste palm oil methyl esters. Energy Convers. Manag. 2011, 52, 108–116. [Google Scholar] [CrossRef]
  59. Gumus, M.; Kasifoglu, S. Performance and emission evaluation of a compression ignition engine using a biodiesel (apricot seed kernel oil methyl ester) and its blends with diesel fuel. Biomass Bioenergy 2010, 34, 134–139. [Google Scholar] [CrossRef]
  60. Hoekman, S.K.; Robbins, C. Review of the effects of biodiesel on NOx emissions. Fuel Process. Technol. 2012, 96, 237–249. [Google Scholar] [CrossRef]
  61. Ashok, B.; Nanthagopal, K.; Jeevanantham, A.; Bhowmick, P.; Malhotra, D.; Agarwal, P. An assessment of Calophyllum inophyllum biodiesel fuelled diesel engine characteristics using novel antioxidant additives. Energy Convers. Manag. 2017, 148, 935–943. [Google Scholar] [CrossRef]
  62. Lapuerta, M.; Armas, O.; Rodriguez-Fernandez, J. Effect of biodiesel fuels on diesel engine emissions. Prog. Energy Combust. Sci. 2008, 34, 198–223. [Google Scholar] [CrossRef]
  63. Kinoshita, E.; Myo, T.; Hamasaki, K.; Nishi, S. Combustion Characteristics of Diesel Engine with Coconut Oil Ethyl Ester; SAE Technical Paper; SAE: Warrendale, PA, USA, 2007. [Google Scholar]
  64. Heywood, J.B. Internal Combustion Engine Fundamentals; Mcgraw-Hill: New York, NY, USA, 1988; Volume 930. [Google Scholar]
  65. Wang, L.-B.; Yu, H.-Y.; He, X.-H.; Liu, R.-Y. Influence of fatty acid composition of woody biodiesel plants on the fuel properties. J. Fuel Chem. Technol. 2012, 40, 397–404. [Google Scholar] [CrossRef]
Figure 1. Schematic diagram of engine testing.
Energies 11 01522 g001
Figure 2. Variation of the BP with respect to engine speed.
Energies 11 01522 g002
Figure 3. Variation of the BSFC with respect to engine speed.
Energies 11 01522 g003
Figure 4. Variation of cylinder pressure at 2000 rpm at full load.
Energies 11 01522 g004
Figure 5. Variation of HRR at 2000 rpm at full load.
Energies 11 01522 g005
Figure 6. Variation of CO with respect to engine speed.
Energies 11 01522 g006
Figure 7. Variation of Hydrocarbon (HC) emission with respect to engine speed.
Energies 11 01522 g007
Figure 8. Variation of carbon dioxide (CO2) emission with respect to engine speed.
Energies 11 01522 g008
Figure 9. Variation of nitrogen oxide (NO) emission with respect to engine speed.
Energies 11 01522 g009
Figure 10. Average NO emission difference in comparison to diesel fuel.
Energies 11 01522 g010
Figure 11. Variation of smoke opacity with respect to engine speed.
Energies 11 01522 g011
Table 1. List of equipment’s used and their standard methods.
ParameterStandard MethodEquipment
Acid value (mg KOH/g oil)AOCS-Cd 3d-63 [26]Titration
Iodine value (mg/I2/g oil)AOCS-Cd 1d-92 [26]Titration
Density (kg/cm3)ASTM 5002 and ASTM D4502 [27]AMA 4500M, Anton Paar
Viscosity (mm2/s)DIN53015 and DIN12058 [28]Lovis 2000M, Anton Paar
Calorific value (J/g)DIN51900 and ASTM D4868 [24]C5000 IKA Werke, Germany
Oxidation stability (h)AOCS-Cd 12b-92 and EN14112 [24] 873 Rancimat, Metrohm
Cetane numberASTM D 613 [24]Shatox Octane meter
Flash point (°C)ASTM D 93 [24]CLA 5, Petrotest
Cold filter plugging point (°C)ASTM D 6371 [24]FPP 5G’s, ISLby PAC
Cloud point and pour point (°C)ASTM D 2500 and ASTM D 97 [24]CPP 5G’s
Surface tension (Nm)Pendant drop methodrame hart model 260
CHNS analyser (wt. %)-Series II, CHNS/O 2400, Perkin Elmer
Fatty acid composition AOCS- Ce 1-62 [29]gas chromatographer
Triglycerides and glycerine, mono-,di (wt. %)ASTM D6584 [24]GC- FID, shimadzu 2010
Table 2. Crude oil properties of rubber seed (RSO) and palm (CPO).
PropertiesCPORSO
Acid value (mg KOH/g oil)15.3 ± 0.2560.58 ± 0.16
Iodine value (mg/I2/g oil)54.8 ± 1.18129.8 ± 0.82
Free fatty acid (%)5.96 ± 0.0121.63 ± 0.02
Density (kg/m3) at 20 °C909.7 ± 0.11917.8 ± 0.03
Viscosity (mm2/s) at 40 °C42.2 ± 0.2449.2 ± 0.25
Calorific value (MJ/kg)38.41 ± 0.0237.92 ± 0.01
Sulfur (wt. %)0.751 ± 0.000.266 ± 0.00
Nitrogen (wt. %)0.419 ± 0.000.358 ± 0.00
Glycerides (wt. %)Monoglycrides0.81 ± 0.006.42 ± 0.16
Diglycerides7.64 ± 0.018.8 ± 0.13
Triglycerides81.8 ± 0.1458.01 ± 0.08
Fatty acid composition (wt. %)Myristic acid (C14:0)1.13 ± 0.01Not defined
Palmitic acid (C16:0)40.75 ± 0.049.5 ± 0.02
Stearic acid (C18:0)3.31 ± 0.087.8 ± 0.40
Oleic acid (C18:1)39.5 ± 0.1225.7 ± 0.23
Linoleic acid (C18:2)9.8 ± 0.1340.6 ± 0.12
Linolenic acid (C18:3)n.d.15.01 ± 0.123
Table 3. Engine and dynamometer specifications.
Engine Type4 Cylinder in Line Diesel Engine, IDI, 4D68
Displacement Volume1998 cm3
Bore × Stroke82.7 × 93 mm
Compression ratio22.4:1
Fuel injection pressure130 bar
Combustion chamber typeSwirl chamber
Engine coolingWater cooling pressurized circulation
Dynamometer Specifications
Dynamometer typeSE 150 model
Maximum torque, power and speed500 Nm, 150 kW and 8000 rpm (standard)
Torque and speed calibration accuracy±0.25 Nm and ±1
Minimum flow and supply pressure107 L/min and 1 kg/cm3
Maximum outlet water temperature60 °C
Weigh560 kg
Maximum voltage and current250 V AC and 5 A
Pulse pick upInductive
Load cellStrain gauge-full bridge
Energising coil voltage90 V
Input resistance375 ohms
Sensitivity and excitation2.7 MV/V and 10 V DC
Overall size (length × width× height)632 × 470 × 689 mm
Table 4. Detailed specifications of the exhaust gas analyzer.
EquipmentMethodMeasurementUpper LimitAccuracy
BOSCH exhaust gas analyzer Nondispersive infraredCO10.00 vol %±0.001 vol %
Flame ionization detectorHC9999 ppm±1 ppm
Nondispersive infraredCO218.00 vol %±0.01 vol %
Electro-chemical transmitterNO5000 ppm±1 ppm
Table 5. The accuracies and uncertainties of the measured parameters.
ParametersMeasurement LimitAccuracyUncertainty
Torque500 Nm±0.25 Nm±0.86
BSFC-±3.19 g/kWh±0.97
Speed8000 rpm±1 rpm±1.40
CO10 vol %±0.001 vol %±1.38
HC9999 ppm±1 ppm±2.49
CO218 vol %±0.01 vol %±1.00
NO5000 ppm±1 ppm±1.72
Smoke100%±0.1%±2.16
Pressure250 bar±0.5 bar±0.82
Crank angle encoder20000 rpm±0.2 rpm±0.20
Overall experimental uncertainty±5.29%
Table 6. Measured fuel properties of tested biodiesels and their blends.
PropertyRBPBRB20RB50PB20PB50RPB10RPB25Diesel
Acid value (mg KOH/g oil)0.36 ± 0.210.30 ± 0.120.053 ± 0.110.12 ± 0.160.041 ± 0.010.10 ± 0.080.044 ± 0.130.10 ± 0.030.003 ± 0.01
Density (g/m3) at 20 °C0.878 ± 0.200.862 ± 0.150.849 ± 0.130.856 ± 0.110.831 ± 0.040.845 ± 0.160.834 ± 0.220.847 ± 0.060.825 ± 0.03
Viscosity (mm2/s) at 40 °C4.2 ± 0.013.8 ± 0.023.32 ± 0.013.65 ± 0.033.31 ± 0.013.42 ± 0.113.31 ± 0.013.48 ± 0.083.064 ± 0.02
Calorific value (MJ/kg)39.2 ± 0.0341.8 ± 0.0243.20 ± 0.1141.64 ± 0.0243.88 ± 0.0243.01 ± 0.1043.56 ± 0.0242.87 ± 0.0144.28 ± 0.01
Cetane number51.9 ± 0.0557.5 ± 0.0150.1 ± 0.0350.36 ± 0.4452.3 ± 0.0354.7 ± 0850.8 ± 0.0451 ± 0.0547 ± 0.02
Oxidation stability (h)8.2 ± 0.1525.3 ± 0.1053.52 ± 0.1037.56 ± 0.1285.6 ± 0.0565.98 ± 0.0576.50 ± 0.1159.16 ± 0.01103.6 ± 0.03
Flash point (°C)152 ± 0.36156 ± 0.2586.32 ± 0.25108.74 ± 0.3290.17 ± 0.07114.63 ± 0.3088.93 ± 0.23112.29 ± 0.1572.4 ± 0.11
Cloud point (°C)3.4 ± 0.0811.25 ± 0.13−11.8 ± 0.02−7.26 ± 0.06−10.2 ± 0.02−3.69 ± 0.11−11.28 ± 0.11−7.19 ± 0.01−17 ± 0.03
Pour point (°C)−2 ± 0.0210.2 ± 0.16−22.62 ± 0.22−17.74 ± 0.01−19.5 ± 0.01−9.87 ± 0.13−22.48 ± 0.04−16.53 ± 0.12−32 ± 0.05
Cold filter plugging point (°C)0 ± 0.0010.5 ± 0.12−6.93 ± 0.10−3.47 ± 0.01−3.38 ± 0.05−1.2 ± 0.30−6.27 ± 0.01−3.23 ± 0.07−8.7 ± 0.01
Perkin Elmer, CHNS, 2400Carbon (wt. %)75.38 ± 0.8477.01 ± 0.2083.36 ± 0.0578.36 ± 0.6384.25 ± 0.0380.82 ± 0.1484.15 ± 0.2680.41 ± 0.1186.62 ± 0.11
Hydrogen (wt. %)11.78 ± 0.9112.25 ± 0.2812.61 ± 0.3412.34 ± 0.7513.04 ± 0.2112.84 ± 0.3512.98 ± 0.3012.64 ± 0.3613.21 ± 0.17
Nitrogen (wt. %)0.07 ± 0.010.11 ± 0.020.018 ± 0.110.04 ± 0.010.024 ± 0.010.054 ± 0.020.02 ± 0.000.043 ± 0.010.01 ± 0.0
Sulfur (wt. %)0.00 ± 0.000.00 ± 0.000.13 ± 0.000.07 ± 0.020.12 ± 0.010.07 ± 0.010.11 ± 0.010.08 ± 0.010.16 ± 0.00
Oxygen (wt. %)12.62 ± 0.0412.75 ± 0.023.15 ± 0.016.43 ± 0.033.56 ± 0.017.24 ± 0.023.28 ± 0.046.85 ± 0.020.0 ± 0.01

