Comparative Analysis of Lithium-Ion Battery Resistance Estimation Techniques for Battery Management Systems


1
Department of Chemical Engineering, University of Waterloo, 200 University Avenue West, Waterloo, ON N2L 3G1, Canada
2
Nuvation Energy, 40 Bathurst Dr, Waterloo, ON N2V 1V6, Canada
*
Author to whom correspondence should be addressed.
Energies 2018, 11(6), 1490; https://doi.org/10.3390/en11061490
Submission received: 18 April 2018
/
Revised: 15 May 2018
/
Accepted: 1 June 2018
/
Published: 7 June 2018
Abstract
:Safe and efficient operation of a battery pack requires a battery management system (BMS) that can accurately predict the pack state-of-heath (SOH). Although there is no universal definition for battery SOH, it is often defined based on the increase in the battery’s internal resistance. Techniques such as extended Kalman filter (EKF) and recursive least squares (RLS) are two frequently used approaches for online estimation of this resistance. These two methods can, however, be computationally expensive, especially in the case of a battery pack composed of hundreds of cells. In addition, both methods require a battery model as well as chemistry specific parameters. Therefore, this paper investigates the performance of a direct resistance estimation (DRE) technique that requires minimal computational resources and can be implemented without any training data. This approach estimates the ohmic resistance only when the battery experiences sharp pulses in current. Comparison of results from the three algorithms shows that the DRE algorithm can accurately identify a degraded cell under various operating conditions while significantly reducing the required computational complexity. The findings will further advance diagnostic techniques for the identification of a weak cell in a large battery pack.
1. Introduction
The global shift away from fossil fuels and towards more renewable energy sources has resulted in a significant push in favor of vehicle electrification. Lithium-ion (Li-ion) batteries are a promising candidate for energy storage in these vehicles due to their high power and energy density and long service life. The dangerous nature of Li-ion batteries necessitates an intelligent battery management system (BMS) for safe control and operation of the battery pack. The BMS is responsible for estimating the battery’s state-of-charge (SOC), as well as monitoring the state-of-health (SOH) of the battery. Therefore, development of an efficient and accurate SOH algorithm is essential for continued integration of electrified vehicles into the automotive market.
The health of a battery changes over time due to the irreversible physical and chemical processes that occur within the cell. The process, known as battery degradation, results in a decrease in capacity and an increase in resistance. Therefore, depending on the type of application, the SOH of the battery can be defined using either of these two metrics. For example, in electric vehicles (EVs), the parameter of interest for determining SOH is capacity since it determines the range of the vehicle. In hybrid electric vehicles (HEVs) and plug-in hybrid electric vehicles (PHEVs), the battery pack’s SOH can be defined using resistance since power losses in the pack can lead to lower acceleration or high fuel consumption in the vehicle. Although capacity can be estimated using a number of different approaches [1,2,3], the central focus of this paper will be algorithms for online estimation of the battery impedance.
The internal battery resistance is not a parameter that can be measured, but rather it needs to be inferred using sensor outputs such as voltage and current. Inference of the battery impedance is complicated by measurement noise, model error and computational limitations. Although a higher degree of accuracy can be obtained using a more complex model or algorithm, it often comes at the expense of computational efficiency [4]. Therefore, implementation of a resistance algorithm requires careful consideration of the trade-off between simplicity and accuracy.
A number of approaches have been proposed in literature for estimation of the battery impedance. One commonly used technique is electrochemical impedance spectroscopy (EIS), where an AC excitation current is applied, and the corresponding AC voltage response is recorded. Rodrigues et al. [5] used AC impedance to determine battery resistance and used these estimates for calculating SOC. Momma et al. [6] examined the impedance effects at low battery temperatures using EIS. Waag et al. [7] explored the changes in battery impedance characteristics over the lifetime of the battery, where SOC, temperature, cycling history and current draws were included in the analysis. Although EIS has proved to be a promising method for understanding the battery behavior offline, application of the technique in a BMS is challenging since it requires special circuits for generating the required signals.
Online estimation techniques of battery internal resistance generally fall into two distinct groups. In the first group, the battery is modeled using an electrochemical model, where the model parameters are estimated online [8,9]. Inference of these parameters, especially the parameters associated with battery impedance can provide insights into the degradation of the battery pack. However, implementation of these complex models can be difficult in a BMS, where computational resources are limited.
The second more frequently applied group of techniques involve modeling the battery using an equivalent circuit model (ECM) and estimating the circuit parameters online. Once again, the estimates of the circuit parameters are useful in determining the battery’s SOH. Adaptive filtering methods can then be utilized to obtain optimal parameter estimates from sensor data. These methods are frequently coupled with SOC estimation, where model parameters are updated online and used in determining the internal resistance. For example, Sun et al. [10] applied an adaptive extended Kalman filter (AEKF) for estimation of battery impedance in conjunction with SOC. Chiang et al. [11] developed an algorithm based on the Lyapunov-stability criteria to estimate the internal resistance and the open-circuit voltage (OCV). Wei et al. [12] have proposed a recursive least squares (RLS) approach for estimating resistance based on an ECM. Remmlinger et al. [13] used a specific excitation signal, found during normal operation of a HEV, along with the RLS algorithm to estimate battery impedance. Finally, Dai et al. [14] proposed a parameter estimation framework composed of two modules running on different time-scales. The EKF algorithm was applied for estimating the parameters associated with slow battery dynamics, while the RLS algorithm was used for modeling the faster battery dynamics.
Although the methods mentioned above provide reliable resistance estimates, they can become computationally expensive when implemented on a large battery pack, composed of hundreds of cells. One approach to deal with this issue has been proposed by Lievre et al. [15], where the resistance is estimated from the voltage drop across the battery, caused by large current variations in the profile. However, currently, no published works have examined how resistance estimates from this approach compare to more advanced filtering approaches. In addition, the work by Lievere et al. considered both the ohmic and diffusion resistance when calculating their SOH metric. This paper will explore the effectiveness of using only the ohmic resistance in determining the SOH of the battery.
In light of these gaps in literature, this paper will make the following contributions to literature. First, it will provide a comparison between two advanced resistance estimation techniques - the EKF and RLS algorithms, with a computationally efficient approach referred to in this work as the direct resistance estimation (DRE). In addition to computational time, another advantage of the DRE algorithm is that, unlike the EKF and other adaptive filtering algorithms proposed by Plett [16,17,18,19,20], this technique does not require chemistry-specific parameters. The goal of this paper is to determine under what conditions the simple DRE algorithm is sufficient and when a more advanced, computationally expensive algorithm is required. In addition, the paper will explore whether estimating only the ohmic resistance will provide enough information for identifying a degraded cell. These findings will be beneficial for future researchers in trying to find a balance between algorithm complexity and accuracy. Similar to the algorithms developed for optimal control of EVs with relation to the grid [21,22], the proposed approach will allow for faster integration of electrified vehicles into the automotive market.
The paper is divided into five different sections. Section 2 describes the cells used in the validation tests, the design of the test bench, and the current profile. Section 3 discusses each of the three algorithms in greater detail, while the results from the validation test are shown in Section 4. Finally, conclusions and recommendations are provided in Section 5.
2. Experimental Set-up and Procedure
2.1. Cell Selection and Degradation
The algorithms under consideration are tested on a battery pack composed of four lithium iron phosphate (LFP) cells. Two relatively fresh cells are used in the pack, combined with two cells with a significant amount of degradation. The addition of the two damaged cells allows one to test the robustness of the algorithms under different aging conditions.
Battery degradation that occurs during the charging and discharging cycles is referred to as cycling aging. Battery degradation can also happen when the battery is at rest, and this type of aging is known as calendar aging. In this paper, two LFP cells are brought to different SOH values through accelerated calendar aging, where the batteries are stored for extended periods of time at elevated temperatures. The capacity and resistance of each cell in the battery pack are reported below.
Cell 2 is degraded by fully discharging the cell to 0% SOC and then storing the battery at 50 °C for 24 months. Cell 4, on the other hand, is degraded by fully charging the battery to 100% SOC and then storing the cell at 50 °C for six months. In both cases, a thermal chamber is utilized to maintain the battery at a constant temperature. The lower storage time for cell 4 resulted in a higher capacity and lower resistance when compared to cell 2. Examination of the impedance values in Table 1 shows that there is a large spread in the ohmic resistance of different cells in the pack. The goal of this paper is to test the algorithms and determine which ones can accurately detect this difference and can correctly pinpoint the problematic cells in the pack.
2.2. Cell Characterization
Although the cell parameters for a given battery model will be identified online, the open-circuit voltage (OCV) curve is obtained offline. The OCV curve for the battery is generated using the following procedure:
- The battery is charged to full at 1C using constant-current/constant-voltage (CCCV) protocol.
- The battery is discharged to empty at a rate of C/25.
- The battery is charged to full at a rate of C/25.
The OCV curve can be obtained by taking the average of the charge and discharge curves. It should be noted that the effect of aging on the OCV curve is not considered for this study.
2.3. Test Bench for Algorithm Validation
The test bench shown in Figure 1 was developed to validate the resistance estimation algorithms.
Charging and discharging of the battery pack can be carried out using the XBL-series load box from TDI Power and Lambda Zup power supply. The power supply can deliver a maximum of 40 A with a voltage limit of 20 V, whereas the loadbox has a maximum voltage and current of 50 V and 150 A, respectively. Both the power supply and load box communicate remotely using a serial interface, and the commands are executed using Python. For safety purposes, two contactors are included in the circuit, one for the charge loop and one for the discharge loop. A Nuvation Low Voltage Battery Controller™ is utilized for temperature, current, and cell voltage measurements along with cell balancing, and pack safety. The experimental data obtained from the test bench can be used for testing the different resistance estimation algorithms.
2.4. Current Profile for Algorithm Validation
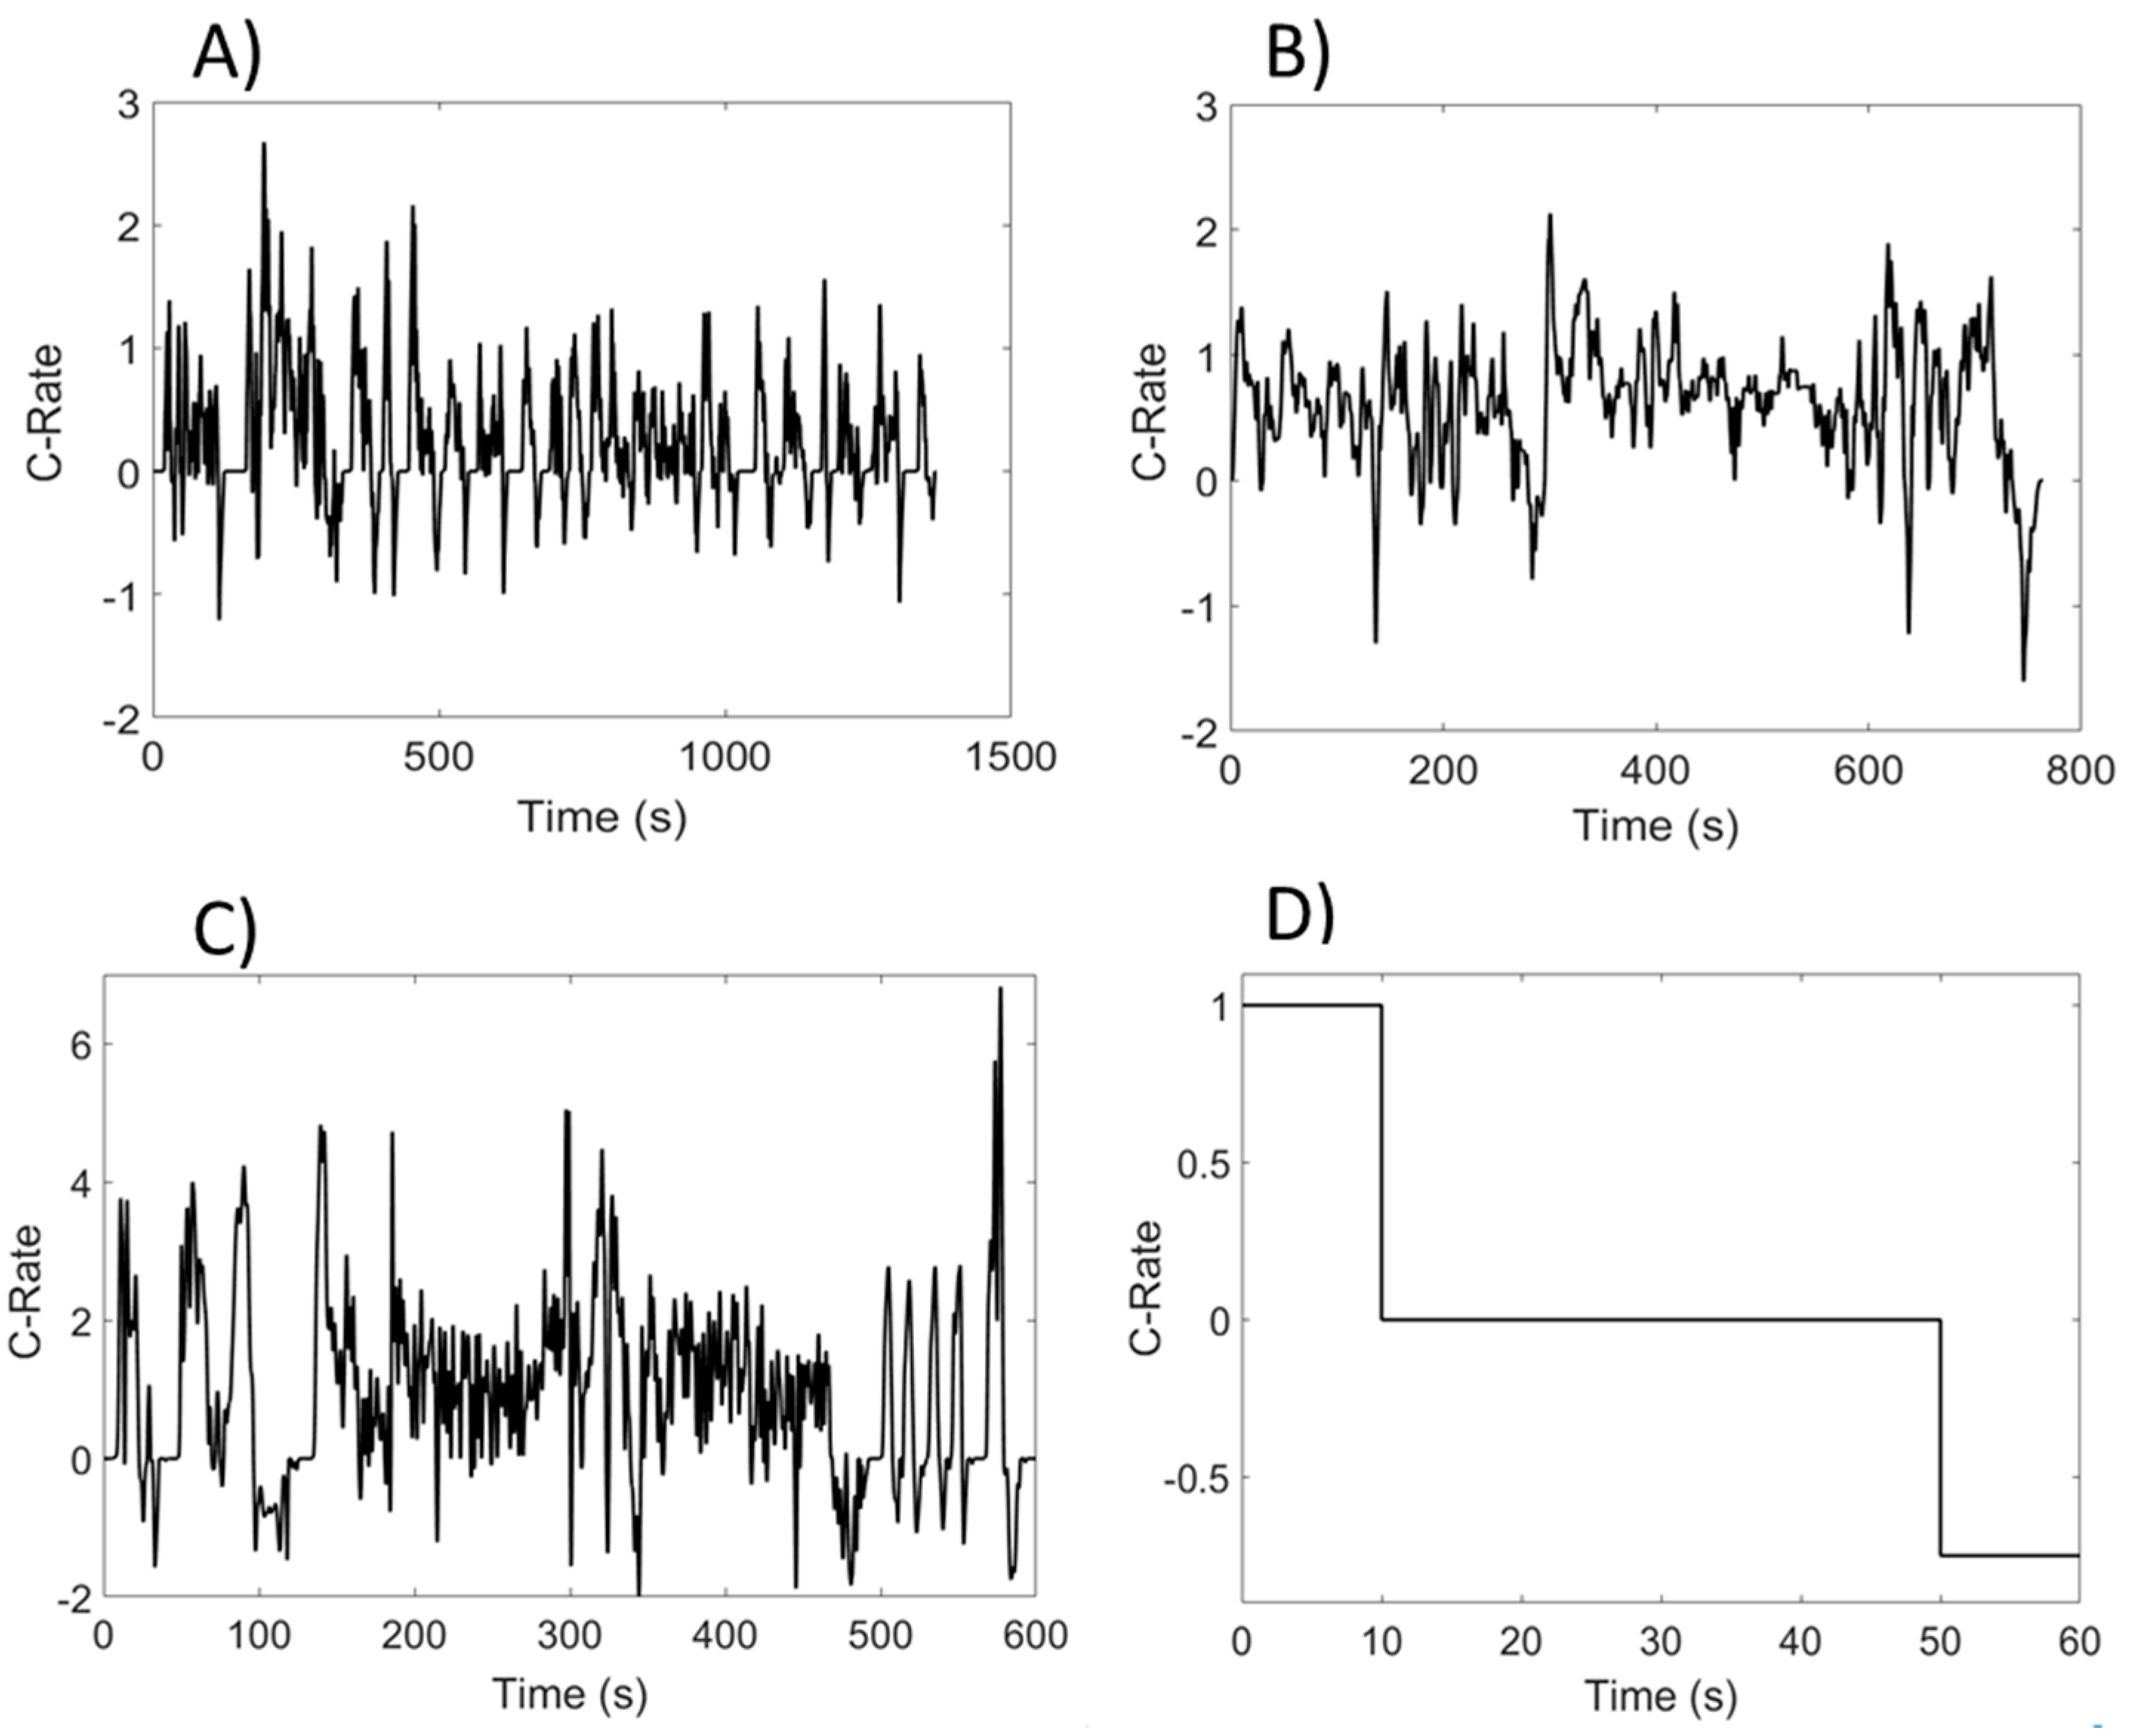
To simulate what a battery pack would experience in a PHEV or HEV application, the current profile used on the test bench was derived from three drive cycle profiles: The Urban Dynamometer Driving Schedule (UDDS), Highway Fuel Economy Test (HWFET), and US06. UDDS is a cycle that is used to represent driving in an urban environment, while HWFET represents driving conditions on the highway. US06 drive cycle, on the other hand, is used to simulate aggressive driving with extensive periods of acceleration. The combination of these three profiles will provide an accurate representation of the type of current transients a battery might experience during regular operation in a vehicle.
Drive cycles are reported as speed over time and therefore converted into a current profile using Autonomie software. Using the software, a Malibu plug-in hybrid with a 19.7 kWh battery pack consisting of seven 15s3p modules is simulated. Although the battery pack was sized for an AMP20 pouch battery, it can be scaled to any size. Figure 2A–C below shows the different drive cycles that are utilized in this paper.
In addition to the drive cycles, a hybrid pulse power characterization (HPPC) test was carried out at the beginning of each test. The hybrid pulse power characterization (HPPC) test is frequently used in identifying the resistance of the battery [23]. The test consists of a 10 s discharge at 1 C, followed by a 40 s rest period and a 10 s charge at ¾ C. The test profile is shown in Figure 2D. The ohmic resistance obtained from the HPPC test provides a baseline upon which all other online estimation algorithms can be compared.
3. Algorithm Development
Before describing the estimation algorithms, it is important to define what is meant by battery internal resistance. The battery impedance is a sum of a few different processes that occur within the battery. Figure 3 below better illustrates the different resistances that are present in a Li-ion cell.
The first resistor in the above circuit, referred to as Rohmic, represents the sum of the ionic resistance of the electrolyte as well as the electric resistance of the current collector and the electrical tabs. It models the instantaneous voltage drop that occurs as soon as a current is applied. To capture the time-dependent voltage response, n number of resistor/capacitor (RC) pairs can be added to the circuit. The RC pair with a smaller time constant is often used to represent the resistance associated with the charge-transfer reaction as well as the double layer capacitance that occurs at the surface of the electrode. The RC pair with a larger time constant represents the diffusion phenomena that occurs within the battery. Additional RC pairs are often included to increase the accuracy of the ECM.
Determination of SOH in this paper will be based on the pure ohmic resistance. Studies have shown that Rohmic is a strong indicator for the SOH of the battery [24,25,26,27]. Therefore, all three algorithms proposed in this paper will estimate the pure ohmic resistance of the battery. Comparison of the results from each technique will also provide insights into whether or not the ohmic resistance is sufficient for identifying a damaged cell at different operating conditions.
3.1. Direct Resistance Estimation Algorithm
Based on the approach used by Lievre et al. [15], DRE algorithm uses a moving time window that continuously checks for sharp pulses in current and voltage. When a significant change in both current and voltage is detected by the BMS, Ohm’s law can be used to estimate the resistance.
Current and voltage fluctuations below a minimum threshold, represented by ΔImin and ΔVmin respectively, will not be considered in determining the resistance. In addition, the length of the moving window should be kept as small as possible to estimate only the ohmic resistance. Utilization of a larger time window would produce values that contain activation and concentration polarization effects in addition to the ohmic component. The algorithm is summarized in Figure 4 below. The algorithm can be thought of as an offline resistance estimation technique that is applied online by considering the current transients inside a small moving time window.
The estimates obtained from the DRE would contain a significant amount of noise due to noise in the measurement readings. Therefore, an exponentially weighted moving average (EWMA) filter will be utilized. The filter has been shown by Lievre et al. [15] to provide substantial noise reduction while being computationally efficient. One significant advantage of using this filter is that it requires only storage of the previous mean value. A smaller memory requirement is essential for implementation in a BMS, especially when considering a large battery pack composed of hundreds of cells.
The EWMA is a moving average filter where the past values are weighted by a tunable constant λ. The constant represents the depth of memory, where using a large λ value will produce more smoothing in the output. The equation of EWMA can be written as follows:
where, represents the current filtered resistance estimate, is the previous value of the filtered resistance estimate, and is the raw ohmic resistance.
There are two significant advantages in using this method for estimating the ohmic resistance. First, the algorithm does not require an open circuit voltage curve or other chemistry-specific battery parameters. Therefore, no initial battery characterization or training data is needed before the algorithm can be used in a BMS. The second advantage of this algorithm is that unlike the EKF and RLS approaches, it does not require complex matrix calculations. The lower computational cost is a significant advantage especially when one is considering implementing the algorithm in an embedded system. No research has been done recently that discuss the accuracy of such a simple resistance estimation technique in comparison to some of the more well-established algorithms. Therefore, in light of the advantages listed above, it is valuable to analyze the relative performance of these algorithms.
3.2. Extended Kalman Filter
Kalman filters have been utilized in a number of different fields including control of complex dynamic systems, such as aircrafts, ships, satellites, and robotics [28]. As advancements continue to be made in the field of Li-ion batteries, Kalman filters are a promising algorithm that can help estimate the internal states of the battery [29]. They have also been utilized for online estimation of battery parameters such as Rohmic and R1 to provide insights into the health of the battery. Therefore, the EKF algorithm will be one of the three algorithms that will be compared in this work.
As previously mentioned, resistance is an intrinsic property of the Li-ion battery that cannot be directly measured. Therefore, the EKF algorithm is used to estimate it based on measurable outputs. Before application of the algorithm, it is important to select a model for describing the battery voltage response in discrete-time. For this paper, the ECM shown in Figure 3 will be reduced to include only the ohmic resistance and one RC pair. This model is referred to as the Thevenin model, and the components of this model are shown in red in Figure 3. The governing equations of the model as shown below.
where, Vth represents the voltage drop across the first RC pair, I is the applied current, Vocv represent the open circuit voltage and VT is the terminal voltage.
Since the goal of this paper is to provide a comparison between different parameter estimation algorithms, only a brief discussion of the EKF will be provided in this section. For a more in-depth analysis on how the filter can be implemented, please refer to the series of papers written by Plett [16,17,19]. All the equations associated with the Kalman filter implementation are summarized below.
State-Space Models for Parameter Estimation:
Definition:
Computation:
Assuming that θ represents a vector containing the true values of the battery model parameters, the goal is to adapt such that it converges to the true value. Equation (5) represents the state space model for the parameters, where the parameters are essentially constant but can change gradually over time as the battery is operated. The parameter rk represents the process noise and is assumed to follow a gaussian distribution with a mean of zero and a covariance given by Σr. The output equation, shown in Equation (6), represents the cell voltage output, which can be determined by solving the Thevenin equivalent circuit. The sensor or measurement error, ek, is modeled once again using a gaussian distribution, with zero mean and variance of Σe.
The EKF algorithm is composed of two distinct steps: the state/parameter update and the measurement update. The parameter update is based on the state-space equation, where the parameter estimates θ and the parameter error covariance matrix, Σθ, are propagated in time using Equations (8) and (9). The measurement update is then used to incorporate the additional knowledge acquired from the new measurement sample, and the parameter value is updated accordingly. The magnitude of the measurement update is based on the size of the Kalman gain, shown in Equation (10). If there is more confidence in the measurements than in the parameters, a large measurement update is carried out. Using this approach, the parameters can be continuously updated as new measurements are made available. It should be noted that initial guesses are required for both the process and measurement covariances as well as the parameter covariance. Therefore, development of an efficient filter requires tuning of these covariance matrices.
3.3. Recursive Least Squares
Online identification of the ohmic resistance can also be implemented using the RLS algorithm. The algorithm works by minimizing the difference between the estimated model voltage and the measured terminal voltage [10,30]. Due to its recursive nature, an optimal forgetting factor is required to reduce the influence of old data and update the parameters as new data is made available. To apply the proposed RLS algorithm, an autoregressive exogenous (ARX) model is required. For this paper, only the main model equations will be presented. For a more detailed analysis on the derivation of this model, please refer to He et al. [30]. The main equations for the RLS algorithm are summarized below.
Auto Regressive Exogenous (ARX) Model:
Initialization:
Computation:
Equation (13) represents the ARX model, where φk is the input vector, θk is the parameter vector, yk is the estimated system output (i.e., terminal voltage VT), ek is the process noise, and k is the sample step. The value of the constants a1, a2, a3 can be used to solve for the ECM parameters R0, R1, and C. Similar to the EKF, the new voltage measurements can be used to update the parameters, where the size of the update is dependent on the algorithm gain Lk (Equation (17)). The noise covariance of the parameters can also be propagated in time using Equation (18). The forgetting factor, λRLS, can be included when calculating the algorithm gain, and in this paper, the value of λRLS will be initially set to 0.999
4. Results and Discussion
4.1. Algorithm Validation with Differing SOH Values
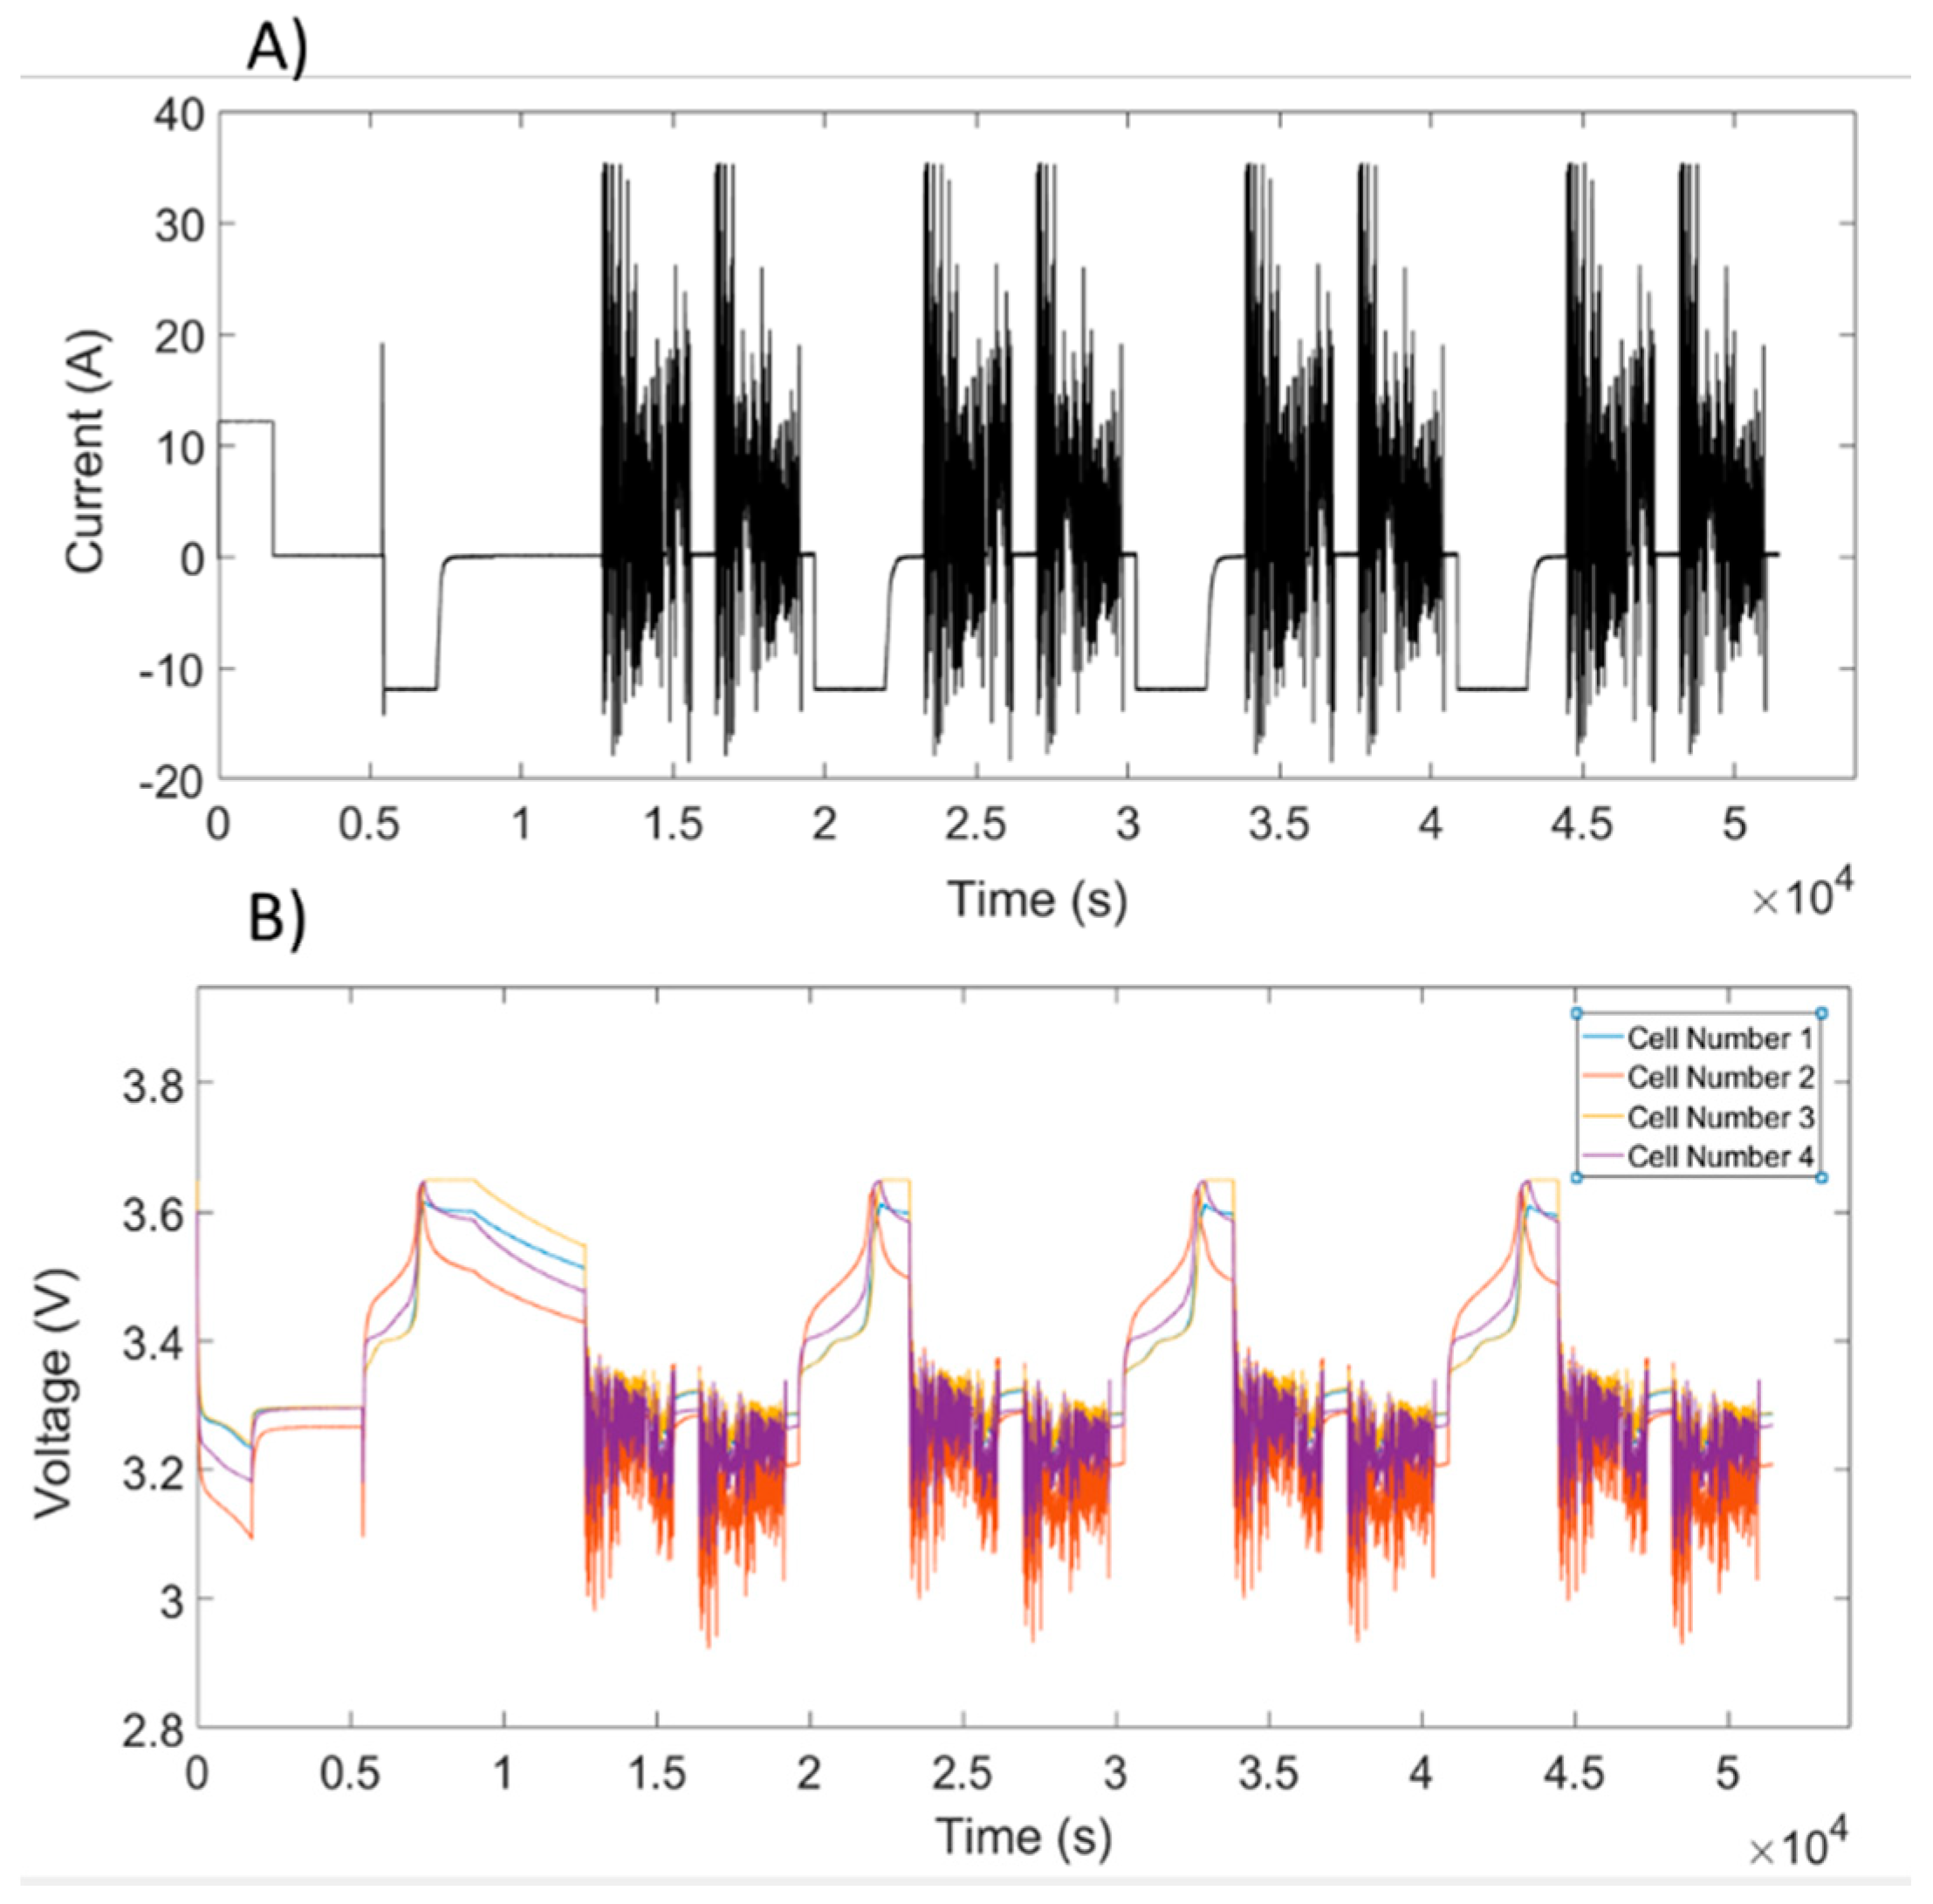
The Li-ion battery pack was subjected to a current profile that would be typically experienced by an HEV or PHEV-type application. The profile was developed by combining the UDDS/US06/HWFET drive cycles. These three drive cycles were used to simulate both highway as well as urban driving conditions. In addition, the HPPC test was conducted before the start of each cycle. The input current profile along with the corresponding voltage response for the battery pack is shown in Figure 5.
Examining Figure 5B, it is evident that the impedance of cell 2 is significantly greater than the other three cells based on the large voltage drops. Cell 4 has the second largest resistance while cells 1 and 3 have the smallest. Given the substantial difference in the voltage response among the cells, all three resistance estimation algorithms will be tested on this profile to determine whether they can accurately estimate the cell impedance.
The three algorithms, discussed in Section 3, were developed in MATLAB (R2016b, MathWorks, Natick, Massachusetts, United States) and executed using the voltage and current data obtained from the test bench. The nominal resistance of each cell was set to 2500 µOhms to determine whether the algorithm could intelligently converge to the actual resistance of the individual battery. The results are shown in the Figure 6 below.
The resistance obtained from the HPPC profile will be used as the reference when comparing the accuracy of the three resistance algorithms. Examining the results shown in Figure 6, it is evident that all three algorithms converge to the reference resistance value, given by the HPPC test. Although the initial guess for each algorithm was set to 2500 µOhms, the output estimates matched the battery’s true resistance values after the first few cycles.
It should also be noted that the DRE approach can provide the same degree of accuracy when estimating the ohmic resistance, as the more advanced algorithms. Table 2 provides a comparison of the averaged percent error of all three approaches. It was assumed that each of the three algorithms have converged after 20,000 s and the percent error is averaged from this point to the end of the test. The percent error for the DRE algorithm is in the same range as the error for RLS and EKF. These results indicate that by using a more simplified and computationally efficient approach to estimating resistance, the same degree of accuracy can be obtained.
It is also important to compare the convergence speed of the algorithm from its initial guess. The EKF can converge to the actual resistance value at a much faster rate than the other two methods. This is evident for all four cells in the battery pack. However, the disadvantage of using this approach is that it needs significant computational resources and requires careful tuning of the covariance matrices. The RLS method, on the other hand, requires less tuning but takes a longer time to converge to the correct resistance value. Finally, the DRE algorithm is not able to update the resistance during the initial part of the test, since this portion of the profile does not contain rapid changes in current. The algorithm does, however, quickly converge to the correct resistance value during the drive cycle portion of the profile. Therefore, although the DRE method is simple, computationally inexpensive, and can accurately track battery SOH, it requires sufficient excitation in the input current to provide accurate results.
4.2. Algorithm Validation at Different Temperatures
In addition to battery degradation, temperature has a significant effect on the ohmic resistance of the battery. A decrease in temperature has been shown to significantly increase the internal resistance of the battery [31]. To test the robustness of the algorithms under different operating conditions, the same profile shown in Figure 5A was carried out at three additional temperatures of 10 °C, 30 °C and 40 °C. The results are captured in Figure 7 for a fresh cell and Figure 8 for the cell with the highest amount of degradation.
Once again, there is strong agreement between the HPPC results and the output resistance estimates from all three algorithms. Given an initial guess of 2500 µOhms, all three algorithms were able to adapt to the actual battery resistance at different temperatures. This is true for both the fresh (Figure 7) and aged (Figure 8) cells. These trends are further confirmed when examining the mean percent error of the three different approaches (Table 3). The mean percent error is less than 10% at all temperatures except for 10 °C. Therefore, it can be concluded that the DRE algorithm, where only the ohmic resistance is estimated, can accurately track changes in resistance at different ambient temperatures.
It should be noted that the error at the lowest temperature of 10 °C is significantly higher than at any other temperature. Examining Figure 7A and Figure 8A, it is evident that the resistance estimates from all three algorithms are smaller than the HPPC result. To better understand this trend, it is important to examine the conditions under which the HPPC test is carried out. For this particular test, the battery is initially at rest, and the temperature of the battery is in equilibrium with the ambient temperature. The online estimation techniques, however, are estimating the internal resistance of the battery under operation. Heat generated from the applied current could result in a higher battery internal temperature and therefore, a lower resistance estimate. This effect would be more prevalent at low temperature since resistance increases exponentially as the temperature is lowered [32]. Also, not modeling the battery hysteresis in the online estimation methods could be another reason for the discrepancy observed in Table 3. The hysteresis effect has been shown to be significant in LFP batteries [33]. Therefore, future work is still required in developing a resistance estimation technique that can account for this behavior.
Another observation from Figure 7 and Figure 8 as well as Table 3 is that at low temperatures, there is a significant amount of variation in the resistance estimates. As the temperature increases, the resistance output becomes significantly smoother. One possible reason for this is that at lower temperatures, there can be differences in the battery internal resistance depending on the battery SOC. Therefore, for SOH calculations, it is advisable to estimate the battery resistance at a higher temperature, where a more stable output is observed.
Finally, it is important to compare the computational complexity of each of these three algorithms. One approach is to express the required execution time in big O notation, which provides an upper bound to the running time of the algorithm. The EKF and RLS algorithms both have matrix calculations that are dependent on the number of states or parameters that will be estimated. Suppose that N represents the number of states/parameters that are being estimated. Then, it can be shown that the EKF method has a computational complexity of O(N3) [34], whereas the RLS algorithm has a complexity of O(N2) [35]. The DRE approach, however, has a lower complexity of O(1). For state/parameter estimation in Li-ion batteries, the value of N is usually two or three. Since the DRE technique only estimates a single parameter and does not adapt the other chemistry parameters, the computational complexity will always be O(1). Therefore, the results from this study indicate that the DRE algorithm can provide accurate results with less complexity.
5. Conclusions
Three different approaches for estimating the internal resistance of the battery have been presented in this paper. The DRE approach searches the current profile for sharp pulses in the current and voltage to estimate the resistance. An exponentially weighted moving average filter is then applied to obtain a smooth resistance output. The findings from this approach are compared with the results from more advanced estimation techniques such as the EKF and RLS.
To test these three algorithms, a battery pack composed of four LFP cells connected in series were utilized. The pack was made of two new cells combined with two cells with a significant amount of degradation. The battery pack was then subjected to a carefully designed current profile.
The conclusions from this study are as follows:
- All three algorithms were able to converge from an incorrect initial guess to the actual internal battery resistance, given by the HPPC test. This is true at different temperatures and different battery SOH.
- The DRE technique can estimate the cell’s ohmic resistance with the same amount of accuracy as more advanced online estimation techniques. Therefore, utilization of this algorithm on a BMS can significantly reduce the computational cost. This can be extremely beneficial for a battery pack composed of hundreds of cells.
- The DRE technique is only able to estimate the resistance when sufficient excitation is present in the current profile. Under operating conditions where the current does not change for long periods of time (i.e., constant current regions), the EKF or RLS approach should be used.
- Comparison of the three techniques shows that the EKF has the fastest convergence to the true resistance value.
- A more stable resistance output is obtained at a higher temperature for all three algorithms. These results seem to indicate that it might be advantageous to use resistance estimates at a higher temperature when evaluating SOH.
As previously mentioned, when considering the type of SOH estimation algorithm to use, it is important to consider the trade-off between simplicity and accuracy. The findings from this study will provide valuable knowledge on which algorithm is most the appropriate for a particular application.
Author Contributions
M.M. was responsible for developing the comprehensive cell model, helping conduct thermal experiments, carrying out the simulations, preparing the results, graphs and manuscript. M.M., J.C., E.S. offered additional assistance with the experimental set-up and provided modeling advice. S.J. and M.F. provided research direction and guidance in the type of experiments to be conduct and the most appropriate model to be applied.
Funding
This research was funded by Natural Sciences and Engineering Research Council of Canada grant number [NSERC 261669-2013-RGPIN].
Acknowledgments
The authors would like to acknowledge the Natural Sciences and Research Council of Canada for the funding required to complete this project and Haocheng Zhang for his help in editing and proof-reading the document.
Conflicts of Interest
The authors declare no conflict of interest.
References
- Einhorn, M.; Conte, F.V.; Kral, C.; Member, S.; Fleig, J. A Method for Online Capacity Estimation of Lithium Ion Battery Cells Using the State of Charge and the Transferred Charge. IEEE Trans. Ind. Appl. 2012, 48, 736–741. [Google Scholar] [CrossRef]
- Farmann, A.; Waag, W.; Marongiu, A.; Sauer, D.U. Critical review of on-board capacity estimation techniques for lithium-ion batteries in electric and hybrid electric vehicles. J. Power Sources 2015, 281, 114–130. [Google Scholar] [CrossRef]
- Mathew, M.; Kong, Q.H.; McGrory, J.; Fowler, M. Simulation of lithium ion battery replacement in a battery pack for application in electric vehicles. J. Power Sources 2017, 349, 94–104. [Google Scholar] [CrossRef]
- Seaman, A.; Dao, T.-S.; McPhee, J. A survey of mathematics-based equivalent-circuit and electrochemical battery models for hybrid and electric vehicle simulation. J. Power Sources 2014, 256, 410–423. [Google Scholar] [CrossRef] [Green Version]
- Rodrigues, S.; Munichandraiah, N.; Shukla, A.K. AC impedance and state-of-charge analysis of a sealed lithium-ion rechargeable battery. J. Solid State Electrochem. 1999, 3, 397–405. [Google Scholar] [CrossRef]
- Momma, T.; Matsunaga, M.; Mukoyama, D.; Osaka, T. Ac impedance analysis of lithium ion battery under temperature control. J. Power Sources 2012, 216, 304–307. [Google Scholar] [CrossRef]
- Waag, W.; Käbitz, S.; Sauer, D.U. Experimental investigation of the lithium-ion battery impedance characteristic at various conditions and aging states and its influence on the application. Appl. Energy 2013, 102, 885–897. [Google Scholar] [CrossRef]
- Moura, S.J.; Chaturvedi, N.A.; Krstic, M. Adaptive Partial Differential Equation Observer for Battery Estimation Via an Electrochemical Model. J. Dyn. Syst. Meas. Control 2014, 136, 011015. [Google Scholar] [CrossRef]
- Zheng, L.; Zhang, L.; Zhu, J.; Wang, G.; Jiang, J. Co-estimation of state-of-charge, capacity and resistance for lithium-ion batteries based on a high-fidelity electrochemical model. Appl. Energy 2016, 180, 424–434. [Google Scholar] [CrossRef]
- Sun, F.; Xiong, R.; He, H. Estimation of state-of-charge and state-of-power capability of lithium-ion battery considering varying health conditions. J. Power Sources 2014, 259, 166–176. [Google Scholar] [CrossRef]
- Chiang, Y.-H.; Sean, W.-Y.; Ke, J.-C. Online estimation of internal resistance and open-circuit voltage of lithium-ion batteries in electric vehicles. J. Power Sources 2011, 196, 3921–3932. [Google Scholar] [CrossRef]
- Wei, X.; Zhu, B.; Xu, W. Internal Resistance Identification in Vehicle Power Lithium-Ion Battery and Application in Lifetime Evaluation. In Proceedings of the 2009 International Conference on Measuring Technology and Mechatronics Automation, Zhangjiajie, China, 11–12 April 2009; Volume 3, pp. 388–392. [Google Scholar]
- Remmlinger, J.; Buchholz, M.; Meiler, M.; Bernreuter, P.; Dietmayer, K. State-of-health monitoring of lithium-ion batteries in electric vehicles by on-board internal resistance estimation. J. Power Sources 2011, 196, 5357–5363. [Google Scholar] [CrossRef]
- Dai, H.; Xu, T.; Zhu, L.; Wei, X.; Sun, Z. Adaptive model parameter identification for large capacity Li-ion batteries on separated time scales. Appl. Energy 2016, 184, 119–131. [Google Scholar] [CrossRef]
- Lievre, A.; Sari, A.; Venet, P.; Hijazi, A.; Ouattara-Brigaudet, M.; Pelissier, S. Practical online estimation of lithium-ion battery apparent series resistance for mild hybrid vehicles. IEEE Trans. Veh. Technol. 2016, 65, 4505–4511. [Google Scholar] [CrossRef]
- Plett, G.L. Extended Kalman filtering for battery management systems of LiPB-based HEV battery packs: Part 2. Modeling and identification. J. Power Sources 2004, 134, 262–276. [Google Scholar] [CrossRef]
- Plett, G.L. Extended Kalman filtering for battery management systems of LiPB-based HEV battery packs: Part 3. State and parameter estimation. J. Power Sources 2004, 134, 277–292. [Google Scholar] [CrossRef]
- Plett, G.L. Sigma-point Kalman filtering for battery management systems of LiPB-based HEV battery packs Part 2 : Simultaneous state and parameter estimation. J. Power Sources 2006, 161, 1369–1384. [Google Scholar] [CrossRef]
- Plett, G.L. Extended Kalman filtering for battery management systems of LiPB-based HEV battery packs: Part 1. Background. J. Power Sources 2004, 134, 252–261. [Google Scholar] [CrossRef]
- Plett, G.L. Sigma-point Kalman filtering for battery management systems of LiPB-based HEV battery packs Part 1 : Introduction and state estimation. J. Power Sources 2006, 161, 1356–1368. [Google Scholar] [CrossRef]
- Alhelou, H.S.H.; Golshan, M.E.H.; Fini, M.H. Multi Agent Electric Vehicle Control Based Primary Frequency Support for Future Smart Micro-Grid. In Proceedings of the Smart Grid Conf. (SGC 2015), Tehran, Iran, 22–23 December 2015; pp. 23–24. [Google Scholar]
- Alhelou, H.H. Hierarchical Plug-in EV Control Based on Primary Frequency Response in Interconnected Smart Grid. In Proceedings of the 2016 24th Iranian Conference on Electrical Engineering (ICEE), Shiraz, Iran, 10–12 May 2016; pp. 561–566. [Google Scholar]
- Battery Test Manual for Plug-In Hybrid Electric Vehicles; INL: Idaho Falls, ID, USA, 2008.
- Dai, H.; Wei, X.; Sun, Z. A new SOH prediction concept for the power lithium-ion battery used on HEVs. In Proceedings of the 5th IEEE Vehicle Power and Propulsion Conference VPPC’09, Dearborn, MI, USA, 7–10 September 2009; pp. 1649–1653. [Google Scholar]
- Cai, Y. D-UKF Based State of Health Estimation for 18650 Type Lithium Battery. In Proceedings of the 2016 IEEE International Conference on Mechatronics and Automation (ICMA), Harbin, China, 7–10 August 2016; pp. 754–758. [Google Scholar]
- Andre, D.; Nuhic, A.; Soczka-guth, T.; Sauer, D.U. Engineering Applications of Artificial Intelligence Comparative study of a structured neural network and an extended Kalman filter for state of health determination of lithium-ion batteries in hybrid electric vehicles. Eng. Appl. Artif. Intell. 2013, 26, 951–961. [Google Scholar] [CrossRef]
- Zou, Y.; Hu, X.; Ma, H.; Li, S.E. Combined State of Charge and State of Health estimation over lithium-ion battery cell cycle lifespan for electric vehicles. J. Power Sources 2015, 273, 793–803. [Google Scholar] [CrossRef]
- Wan, E.A.; van der Menve, R.; Rd, N.W.W. The Unscented Kalman Filter for Nonlinear Estimation. In Proceedings of the Adaptive Systems for Signal Processing, Communications, and Control Symposium 2000, Lake Louise, AB, Canada, 4 October 2000; pp. 153–158. [Google Scholar]
- Waag, W.; Fleischer, C.; Sauer, D.U. Critical review of the methods for monitoring of lithium-ion batteries in electric and hybrid vehicles. J. Power Sources 2014, 258, 321–339. [Google Scholar] [CrossRef]
- He, H.; Zhang, X.; Xiong, R.; Xu, Y.; Guo, H. Online model-based estimation of state-of-charge and open-circuit voltage of lithium-ion batteries in electric vehicles. Energy 2012, 39, 310–318. [Google Scholar] [CrossRef]
- Rui, X.H.; Jin, Y.; Feng, X.Y.; Zhang, L.C.; Chen, C.H. A comparative study on the low-temperature performance of LiFePO4/C and Li3V2(PO4)3/C cathodes for lithium-ion batteries. J. Power Sources 2011, 196, 2109–2114. [Google Scholar] [CrossRef]
- Jaguemont, J.; Boulon, L.; Dube, Y. Characterization and Modeling of a Hybrid-Electric-Vehicle Lithium-Ion Battery Pack at Low Temperatures. IEEE Trans. Veh. Technol. 2016, 65, 1–14. [Google Scholar] [CrossRef]
- Dreyer, W.; Jamnik, J.; Guhlke, C.; Huth, R.; Moškon, J.; Gaberšcek, M. The thermodynamic origin of hysteresis in insertion batteries. Nat. Mater. 2010, 9, 448–453. [Google Scholar] [CrossRef] [PubMed]
- Samsuri, S.B.; Zamzuri, H.; Rahman, M.; Mazlan, S.A.; Rahman, A. Computation cost analysis of extended kalman filter in simultaneous localization & mapping (EKF-SLAM) problem for autonomous vehicle. J. Eng. Appl. Sci. 2015, 10, 7764–7768. [Google Scholar]
- Madhuri, G.; Kumar, B.V.; Raja, V.S.; Shasidhar, M. Performance Analysis of Adaptive Algorithms for Noise Cancellation. In Proceedings of the 2011 International Conference on Computational Intelligence and Communication Networks (CICN), Gwalior, India, 7–9 October 2011. [Google Scholar]
Figure 1.
Test bench used in validating the resistance estimation algorithms.

Figure 2.
(A) Urban Dynamometer Driving Schedule, (B) Highway Fuel Economy Test (C) US06 and (D) HPPC current profile used in validating the resistance estimation algorithms.
Figure 2.
(A) Urban Dynamometer Driving Schedule, (B) Highway Fuel Economy Test (C) US06 and (D) HPPC current profile used in validating the resistance estimation algorithms.

Figure 3.
Equivalent circuit model used in describing the voltage response of Li-ion batteries.

Figure 4.
Direct resistance estimation (DRE) approach for estimating ohmic resistance in the battery, where (a) is the current profile and (b) is the corresponding voltage profile.
Figure 4.
Direct resistance estimation (DRE) approach for estimating ohmic resistance in the battery, where (a) is the current profile and (b) is the corresponding voltage profile.
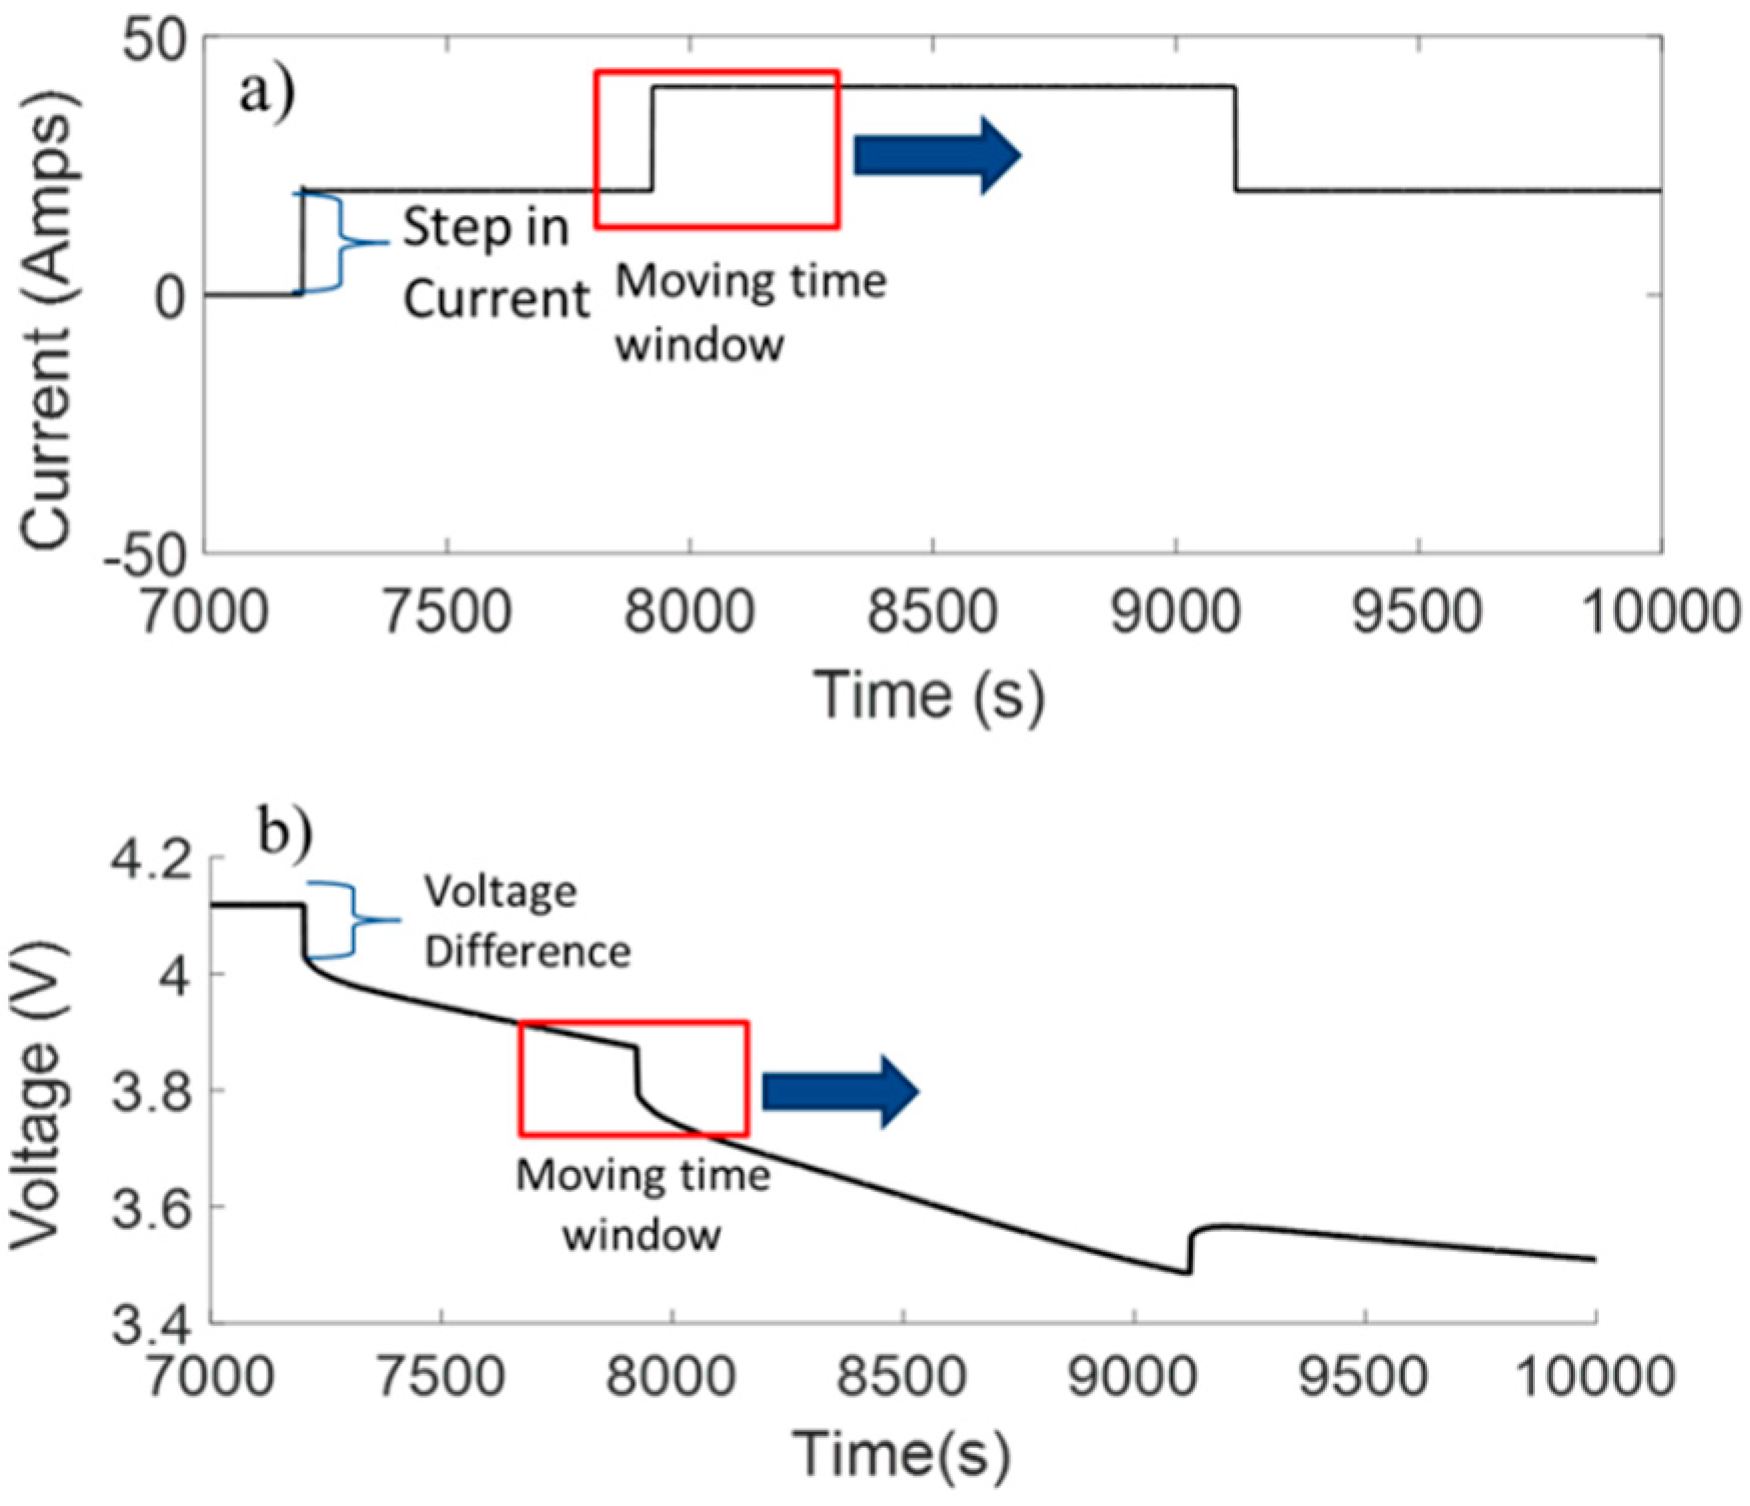
Figure 5.
The validation current profile (A) and the corresponding voltage response (B) for the LFP battery pack at a constant temperature of 20 °C.
Figure 5.
The validation current profile (A) and the corresponding voltage response (B) for the LFP battery pack at a constant temperature of 20 °C.

Figure 6.
Resistance estimations from the HPPC test, EKF algorithm, RLS algorithm and DRE algorithm for cell one (A), two (C), three (B) and four (D) at a constant temperature of 20 °C.
Figure 6.
Resistance estimations from the HPPC test, EKF algorithm, RLS algorithm and DRE algorithm for cell one (A), two (C), three (B) and four (D) at a constant temperature of 20 °C.
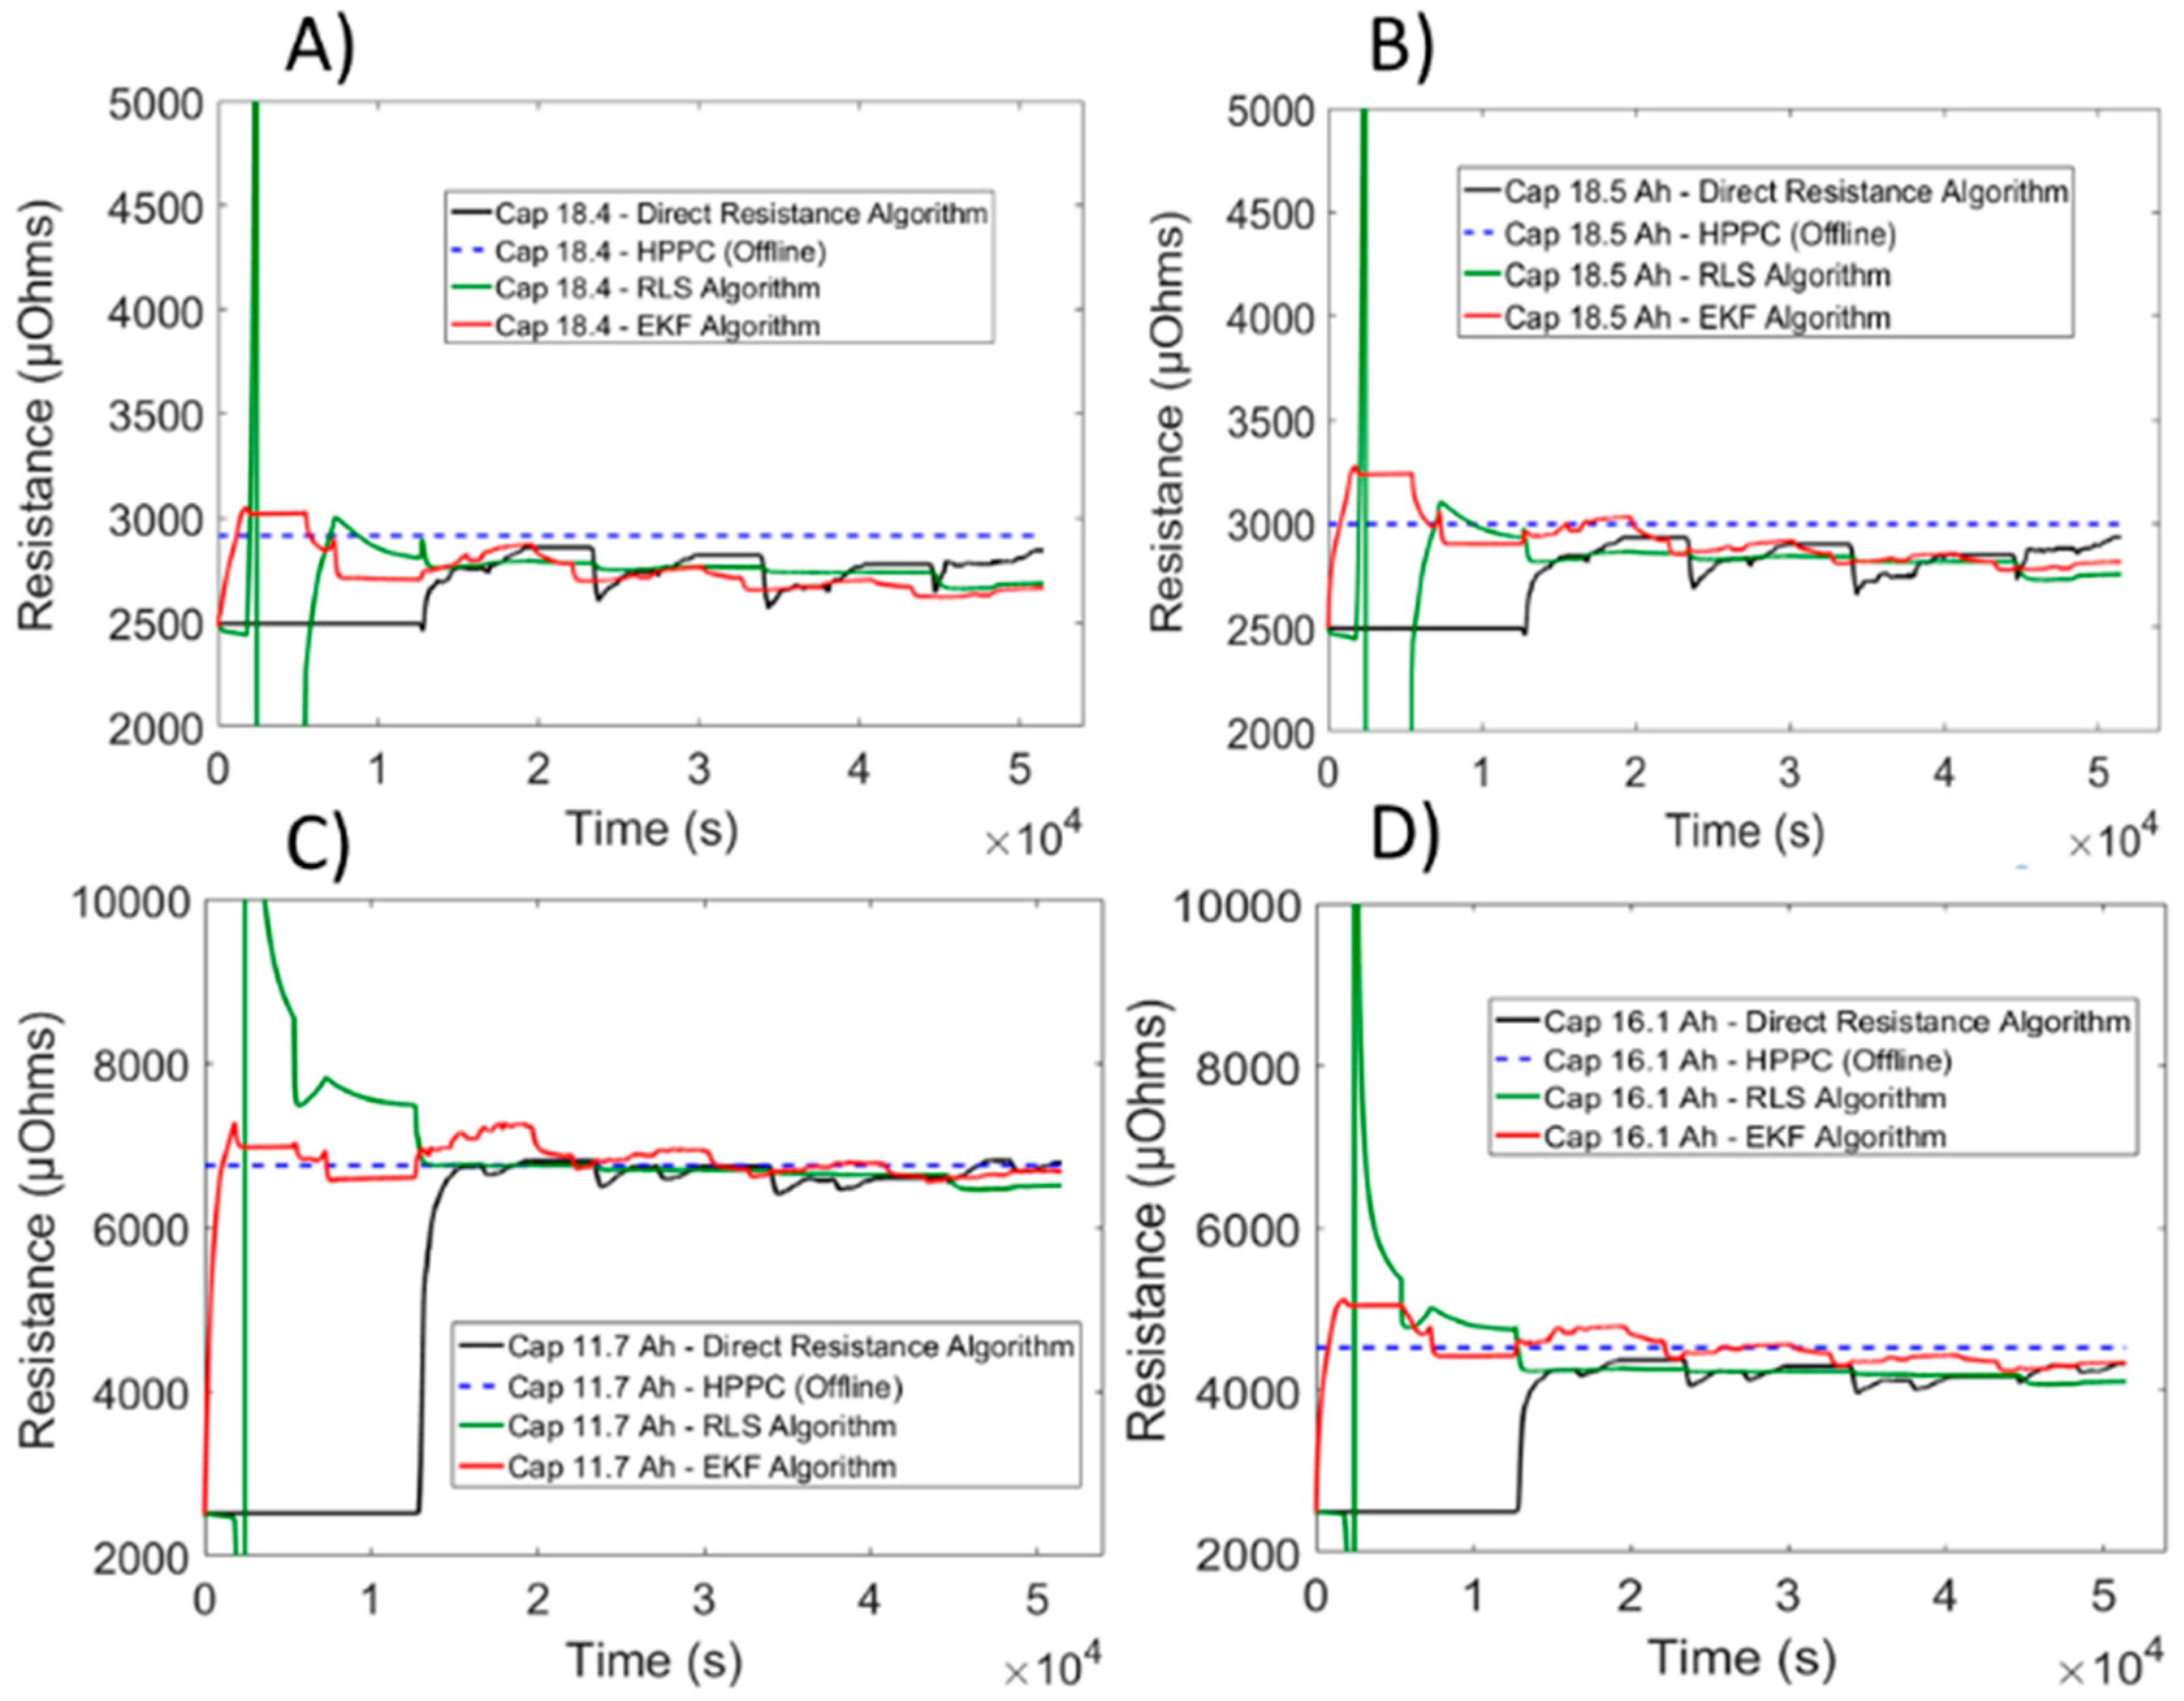
Figure 7.
Resistance estimations from HPPC test, EKF algorithm, RLS algorithm and DRE algorithm for cell #1 (fresh cell) at temperatures of 10 °C (A), 20 °C (B), 30 °C (C) and 40 °C (D).
Figure 7.
Resistance estimations from HPPC test, EKF algorithm, RLS algorithm and DRE algorithm for cell #1 (fresh cell) at temperatures of 10 °C (A), 20 °C (B), 30 °C (C) and 40 °C (D).

Figure 8.
Resistance estimations from HPPC test, EKF algorithm, RLS algorithm and DRE algorithm for cell #2 (aged cell) at temperatures of 10 °C (A), 20 °C (B), 30 °C (C) and 40 °C (D).
Figure 8.
Resistance estimations from HPPC test, EKF algorithm, RLS algorithm and DRE algorithm for cell #2 (aged cell) at temperatures of 10 °C (A), 20 °C (B), 30 °C (C) and 40 °C (D).


Table 1.
Capacity and ohmic resistance of the four lithium iron phosphate (LFP) cells used in this study.
Table 1.
Capacity and ohmic resistance of the four lithium iron phosphate (LFP) cells used in this study.
| Cell Number | Cell Capacity (Ah) | Ohmic Resistance (μOhms) at 50% SOC |
|---|---|---|
| 1 | 18.5 | 2998 |
| 2 | 11.7 | 6752 |
| 3 | 18.4 | 2916 |
| 4 | 16.1 | 4523 |
Table 2.
Comparison of the average percent error from DRE algorithm, RLS algorithm, and EKF algorithm for a battery pack maintained at 20 °C.
Table 2.
Comparison of the average percent error from DRE algorithm, RLS algorithm, and EKF algorithm for a battery pack maintained at 20 °C.
| Cell Number | RLS Error (%) | EKF Error (%) | DRE Error (%) |
|---|---|---|---|
| Cell 1 | 6.21 | 5.11 | 5.04 |
| Cell 2 | 1.66 | 1.39 | 1.58 |
| Cell 3 | 6.10 | 7.68 | 5.15 |
| Cell 4 | 7.43 | 2.91 | 6.87 |
Table 3.
Comparison of the averaged percent error from DRE algorithm, RLS algorithm, and EKF algorithm for fresh and aged cell at temperatures of 10 °C, 20 °C, 30 °C, and 40 °C.
Table 3.
Comparison of the averaged percent error from DRE algorithm, RLS algorithm, and EKF algorithm for fresh and aged cell at temperatures of 10 °C, 20 °C, 30 °C, and 40 °C.
| Cell Number | RLS Error (%) | EKF Error (%) | DRE Error (%) | |
|---|---|---|---|---|
| Fresh Cell | 10 °C | 16.95 | 11.51 | 9.06 |
| 20 °C | 6.21 | 5.11 | 5.04 | |
| 30 °C | 3.90 | 4.48 | 4.80 | |
| 40 °C | 0.73 | 1.38 | 0.87 | |
| Aged Cell | 10 °C | 12.63 | 11.89 | 6.32 |
| 20 °C | 1.66 | 1.39 | 1.58 | |
| 30 °C | 5.56 | 7.76 | 5.60 | |
| 40 °C | 6.22 | 0.81 | 7.05 |
© 2018 by the authors. Licensee MDPI, Basel, Switzerland. This article is an open access article distributed under the terms and conditions of the Creative Commons Attribution (CC BY) license (http://creativecommons.org/licenses/by/4.0/).
Share and Cite
MDPI and ACS Style
Mathew, M.; Janhunen, S.; Rashid, M.; Long, F.; Fowler, M. Comparative Analysis of Lithium-Ion Battery Resistance Estimation Techniques for Battery Management Systems. Energies 2018, 11, 1490. https://doi.org/10.3390/en11061490
AMA Style
Mathew M, Janhunen S, Rashid M, Long F, Fowler M. Comparative Analysis of Lithium-Ion Battery Resistance Estimation Techniques for Battery Management Systems. Energies. 2018; 11(6):1490. https://doi.org/10.3390/en11061490
Chicago/Turabian StyleMathew, Manoj, Stefan Janhunen, Mahir Rashid, Frank Long, and Michael Fowler. 2018. "Comparative Analysis of Lithium-Ion Battery Resistance Estimation Techniques for Battery Management Systems" Energies 11, no. 6: 1490. https://doi.org/10.3390/en11061490
Note that from the first issue of 2016, this journal uses article numbers instead of page numbers. See further details here.