Cost-Optimal Analysis for Nearly Zero Energy Buildings Design and Optimization: A Critical Review


1
Dipartimento Energia (DENERG), Politecnico di Torino, Corso Duca degli Abruzzi 24, 10129 Torino, Italy
2
FULL—Future Urban Legacy Lab., Via Agostino da Montefeltro 2, 10134 Torino, Italy
*
Author to whom correspondence should be addressed.
Energies 2018, 11(6), 1478; https://doi.org/10.3390/en11061478
Submission received: 16 April 2018
/
Revised: 2 June 2018
/
Accepted: 4 June 2018
/
Published: 6 June 2018
Abstract
:Since the introduction of the recast of the EPBD European Directive 2010/31/EU, many studies on the cost-effective feasibility of nearly zero-energy buildings (NZEBs) were carried out either by academic research bodies and by national bodies. In particular, the introduction of the cost-optimal methodology has given a strong impulse to research in this field. This paper presents a comprehensive and significant review on scientific works based on the application of cost-optimal analysis applications in Europe since the EPBD recast entered into force, pointing out the differences in the analyzed studies and comparing their outcomes before the new recast of EPBD enters into force in 2018. The analysis is conducted with special regard to the methods used for the energy performance assessment, the global cost calculation, and for the selection of the energy efficiency measures leading to design optimization. A critical discussion about the assumptions on which the studies are based and the resulting gaps between the resulting cost-optimal performance and the zero energy target is provided together with a summary of the resulting cost-optimal set of technologies to be used for cost-optimal NZEB design in different contexts. It is shown that the cost-optimal approach results as an effective method for delineating the future of NZEB design throughout Europe while emerging criticalities and open research issues are presented.
1. Introduction
Given the importance of the building sector in European final energy consumptions and CO2 emissions (buildings account for 40% of the final energy demand [1] and 36% of CO2 emissions [2]), reaching high energy performance has become a key target for the European Community within its roadmap towards a sustainable future. The adoption of cost-optimal energy efficiency measures is demanded by the EPBD recast (Energy Performance of Buildings Directive 2010/31/EU [1]) in order to meet the NZEB objective for all new buildings by 2020. Even though reaching very high energy performance in buildings has become technically feasible and many examples of successful NZEB building design are known throughout Europe, such buildings are not cost efficient yet and this constitutes the main barrier to their massive implementation. To this regard, the principle of cost-optimality has been introduced to move national minimum energy performance requirements towards the achievement of economically feasible NZEB targets.
Article 1 of the regulation accompanying EPBD [3] stipulates that the cost-optimal methodology specifies rules for comparing the achievable energy performance and the cost and savings related to different energy efficiency measures for different building typologies, therefore directly connecting energy performance requirements to financial targets. Before the EU cost-optimality approach, most of studies were primarily aimed at accomplishing energy savings targets, including economic evaluations only on a second account. In particular, some studies focused on the assessment of investment costs [4,5] or on the total net present value [6] in the building life [7] but, differently from what indicated in the EPBD Guidelines [8], the operating, replacement and disposal costs were not considered in the calculation.
Since its introduction within the EPBD recast, several applications of the defined cost-optimal analysis (COA) were carried out either by academic research bodies [9,10,11,12,13,14,15,16,17,18,19] and by EU and national bodies [20,21,22,23]. Beyond regulatory applications, the introduction of the cost-optimal approach gave rise to a growing scientific research interest in this topic. COA has been implemented as a tool for studying the energy performance of NZEBs and the impact of one or a set of building technologies on the NZEB design [24,25]. COA has been used to investigate the trade-off between the environmental and economic objectives in defining strategies and policies for the building construction field [26] and, further, COA has become a common framework for improving research on building design optimization methodologies [16,27] and investigating the mutual relationship between the involved design variables [28]. Of course, the many research studies applying COA have enlarged the set of reference buildings and energy efficiency measures that were analyzed in different climate ad market contexts throughout Europe.
Given the large diffusion throughout the European research groups and the recognized success of such approach not only in European context, the authors believe that it is important to review what has been done so far, what are the results achieved and the open issues after seven years of application of COA and before the publication of the new revised European Directive on Energy Performance of Buildings in 2018.
The research advancements provided by these studies can be compared in terms of objective of the studies, methods, and tools used, and results on multiple levels, in order to delineate common trends and related guidelines concerning NZEB design methodologies and cost-effective technologies, which will constitute the baseline for future research on the implementation of the new smart technologies that will be promoted by the second recast of EPBD.
Such a review work also aims at identifying the existing criticalities and gaps in this research field to advance in research activities towards a shared vision for bridging the gap between the zero-energy goal and its economic affordability.
2. Cost-Optimal Analysis
2.1. The Defined Multi-Step Approach
This section presents the main highlights of the methodology for COA implementation as defined by EPBD recast, which came into force in June 2010. This represents the EU normative reference with regard to the design of energy efficient buildings and their performance assessment. Specifically, the EPBD recast states that each Member State (MS) “must ensure that minimum energy performance requirements are set with a view of achieving at least cost-optimal levels” and should also provide plans to promote “the cost-effective transformation of existing buildings into NZEB”. Given that there is not a quantitative definition for NZEB, as the different MS have to define what is the performance level of a nearly zero-energy buildings, COA has been established to encourage MS to set their energy performance requirements to the resulting cost-optimal level and to implement policies that are able to move such cost-optimal level (that should lead to a “nearly” zero energy demand) towards the net zero energy performance. The European Commission has to be notified with regular reports on the results of these calculations and the related policy plans, in order to assess the national MS progress towards cost-optimal and NZEB levels achievements.
The term “cost-optimal level” points out “the energy performance level, which leads to the lowest global cost during the estimated economic lifecycle” [1]. The main steps of the COA methodology are represented in Figure 1 [8].
Reference buildings (RBs) should be representative of the national building stock [29].
EEMs should be assessed, as a single measure or as a package of measures, for the selected RBs, for single buildings as a whole and/or for building elements. The measures defined should cover building envelope design alternatives and high-efficiency alternative system solutions, also including renewable energy sources that are technically, functionally, and economically feasible and may have influence on the primary energy use of a building. The number of measures for each RB has to be equal or superior to 10 packages/variants, plus the case of the RB. The analyzed EEMs need to be compliant with the minimum performance requirements in force. Innovative solutions, based also on other MS experiences, are encouraged to enlarge the combination of measured considered within the calculations.
The energy performance assessment entails the definition of the building final energy needs for all uses, then the calculation of the energy delivered and finally the primary energy use. The EPBD only requires that calculations are performed according to national methodologies harmonized with the European Standards. The CEN technical report TR 15615 (Umbrella Document) [30] provides an ad hoc overview on the 31 CEN standards that are related to the application of the principles of EPBD. The energy needs for heating and cooling should be assessed according to standard EN ISO 13790 [31]. Moreover, the guidelines suggest performing calculations based on a dynamic method rather than a quasi-steady approach.
The economic assessment is performed based on the net present values standard approach for financial evaluation of long-term projects. EPBD recast aims at analyzing the whole lifecycle during the process of cost-optimal levels definition. The cost evaluation should include all energy-related lifecycle costs and not only the usually considered investment cost. In order to reach this goal, the global cost calculation was chosen as calculation methodology for the economic assessment of the energy renovation measures. Under the recommendations of the Umbrella Document [30], the EN 15459 [32] is specified as standard to be used for carrying out the financial calculations. It important to note that the global cost, as intended for cost-optimal calculations, takes into account only energy-related costs. Therefore, the concept of global cost as intended in the EBPD recast is not in compliance with a full life cycle assessment, where the environmental impacts are also considered.
The values of financial data that should be collected are sensible whether the calculations are performed considering the individuals (private costs) or the society.
To this regard, according to the regulation, two main perspectives should be considered during cost-optimality calculations:
- macroeconomic perspective (societal level);
- microeconomic perspective (private/end-users or financial level)
Table 1 provides a list of the main assumptions that characterize each perspective.
When calculating the global cost according to the financial perspective, all taxes (VAT), subsidies, and the interest rate (as adjusted to inflation) has to be included for considering the prices as paid by private customers and reflecting the real financial situation. In general, subsidies and incentives are usually referred to the perspective of individual building owners and private investors.
When considering the macroeconomic perspective, an environmental parameter is introduced. In fact, macroeconomic calculations exclude taxes (e.g., VAT) and subsidies and include the cost of greenhouse gas emissions (GHG), defined as “the monetary value of the related environmental damage” [8].
Further differences between the two perspectives, unlikely difficult to be assessed, can be noted in the economic calculation for each perspective: for instance, the increase of the building value, when energy renovation projects are carried out, or on the other hand the impact of energy retrofit on the work sector, with the creation of new jobs.
Finally, the procedure results in a cost-optimal graph where the building primary energy use is on the horizontal axis and the global cost is on the vertical axis, as in Figure 2.
Depending on the variety of packages considered, it is usually unlikely to form an exact curve, but rather a “cloud” of points, each corresponding to a different package of EEMs, that is a different building design alternative. The cost-optimum is the lowest point on this graph and the cost-optimal energy performance is the one corresponding to that point. MS should implement policies that are able to move that point to the left.
Figure 3 depicts, within the cost-optimal curve, the gaps, both at financial and energy level, from the cost-optimal level, the actual minimum law requirement, and the future NZEB target, respectively.
2.2. Global Cost Method
As mentioned before, calculating the global cost means defining a net present value of all costs occurring during a defined calculation period τ, considering also the residual values of components with longer lifetimes. Components with shorter lifetime are replaced during the selected calculation period.
The global cost formula can be written as
where
- CG(τ) is the global cost referred to starting year τ0;
- CI is the sum of initial investment costs;
- Ca,i(j) is the annual cost for component j at the year i;
- Rd(i) is the discount rate for year I;
- Vf,τ(j) is the final value of component j at the end of the calculation period.
The discount rate, Rd, is used to refer the annual and replacement costs and the final value to the starting year; it depends from the real interest rate.
2.3. First Experiences in COA Applications: References and Highlights
As already mentioned, since the EPBD recast came into force, various studies on the cost-optimal analysis methodology have been published, including national reports. The COA studies carried out at European level by National bodies for pushing COA application by the different stakeholders involved in the building design, construction, and management processes are hereby presented.
In particular, BPIE carried out two exemplar studies on the COA.
The first one, published following the EPBD recast in 2010, presents an exhaustive description of the methodology to provide support to the process of the COA implementation within MS and targeting at policy makers and other market actors [20]. The second study, published in 2013, aims at providing an analysis and guidance on how properly implementing COA by MS [21]. Due to this, it focuses on the calculation methodology and on the impact of financial factors at national levels, providing practical examples of the COA application. Both the macroeconomic and microeconomic perspectives are hence presented. All findings are based on three country reports (Austria, Germany, and Poland) on new residential RBs (single-family and multi-family house).
Different lessons are learnt from each COA application by the three countries involved. In general, a sensible gap was identified between each country actual requirements and the cost-optimal levels reached through the described calculations procedure. Moreover, regardless of the perspective considered (macroeconomic and private perspective) similar cost-optimal levels were observed. Looking at the results of each country, sensible differences can be noted.
With special regard to the Austrian study, the cost-optimal analysis was applied to a multi-family reference building. From the financial perspective, the gap between actual and cost-optimal energy performance ranges between 15.4% and 21.6% and can be further improved depending on different assumptions on input factors (e.g., lowering discount rate from 3% to 1%, increasing energy prices, etc.).
The cost-optimal calculation for Germany were applied on both residential building typologies. From calculations it was observed that, from a private investor perspective, the two calculated cost-optimal energy performance values are very similar (respectively 53 kWh/(m2a) for the multi-family reference building and 54 kWh/(m2a) for the single-family building). The cost of the greenhouse gas emissions has no influence due to carbon prices being too low, as assumed from the regulation [3]. From calculations, it could be observed that lower cost-optimal primary energy values could be achieved with lower discount rates and higher energy price development, thus increasing the gap with between cost-optimal and current energy performance requirements.
Concerning Poland, the cost-optimal calculations were carried out on three new reference buildings (a single-family house, a multi-family building and an office building) using dynamic simulation. A higher gap between current requirements and cost-optimal levels was recorded. Despite the highly different primary energy demand, depending on the varied climate locations, it seems like the location has no significant influence on cost-optimality.
Another report produced by the European Council for an Energy Efficient Economy and the Ecofys staff, provides, consistently with the first one from BPIE, additional insights and a detailed description of COA methodology [30].
3. Cost-Optimality and Research at a Glance
As already stated, the first experiences in the application of COA has stimulated the research community to perform research based on this approach, leading the COA for NZEB design to become a hot topic in scientific journals and international scientific conferences. In this study, a detailed analysis on COA studies included in scientific literature was conducted in order to review the most recent research applications of cost-optimal analysis since regulation entered into force. For the aim of this review, only the cost-optimal analysis by the book—namely those applications in compliance with the EBPD directive—were selected. The related search was performed by using the Scopus navigational and Google research tools. The terms “cost-optimal analysis”, “cost-optimality”, and “EPBD” were used as key words for selecting the set of papers to carry out the review. Based on the research results, 88 papers were selected as relevant for this literature review. The selected papers were analyzed based on a set of key parameters related to the methodology approach, the reference case study, the building energy performance and the economic assessment. Only English papers published into international journals or indexed international conference proceedings were included into the analysis. It is important to note that, in order to avoid twisted data and duplications, papers with similar case studies from the same authors but without significant difference in the outcomes were not considered.
All selected papers are presented in Table 2, arranged in chronological descending and authors’ alphabetic order with their proper reference. It has to be noted that several papers analyze more than one building typology for the same Country or apply the methodology to the same reference buildings in different context. This results in the 88 papers analyzing 105 case studies, of which the country of application and the building typology (given their great number, residential buildings were differentiated into the single-family and the multi-family categories, respectively RES_SF and RES_MF) is also reported.
According to the collected literature, the graphical trend analysis for the country case study is presented in Figure 5. Approximately every European country has at least one publication. Italy emerged as the most represented country, followed by Portugal, Finland, and Estonia. However, it could be possible that this significant difference in the COA publication per country may be due to the use of different publication channels and sources, such as national and non-academic journals, that were not reviewed for this study. Therefore, it is fair to consider that other MS (such as Belgium or the Netherlands), other than producing the required regulatory reports, may have chosen national channels, like more professional-oriented and commercial journals and/or national conferences, as more suitable communication carriers in order to promote COA knowledge and application at a national level. The fact that some countries that do not belong to the European Union also applied the COA to some studies, other than giving evidence of the kind of cultural affinity these countries have with EU, shows the interesting fact that the applications of COA for scientific and research purposes has crossed the boundaries of the European Union and could be applied from other countries of the world to produce advancements in research towards NZEBs.
Furthermore, it should be observed that only a small portion of the selected publications (less than 20%) included studies considering different climate conditions within the same analysis; some performed comparison between different RBs in the same country [45,54,86] and others applied the same RB to different locations/climate [35,41,49,62,109]. This trend is quite interesting as it shows that the methodology presented and shared by the regulations is not yet perceived as a methodology for comparing different outcomes from different countries, or at least from different climate locations in the same country. This trend can be related to a slow absorption of the cost-optimal approach, as a knowledge transfer issue, from Member States. In fact, looking at the publication year timeline, depicted in Figure 6, cost-optimality did not arouse great interest during the first years in force of the regulation, but has become a hot research topic starting from 2014. Approximately 80% of papers refer thus to the last four years, from 2014 up to 2017. The absorption of cost-optimal as methodology is still underway.
Most of papers were published in international journals with a great concentration of papers in the Energy and Buildings journal, which seems to be the principal academic reference for cost-optimal studies. Approximately 20% of publications were indeed published as proceedings in international conferences (CONFER, EN_PROC), as depicted in Figure 7.
With regard to the buildings typology (Figure 8), 68% of the reviewed RBs were residential buildings and 32% non-residential buildings. As depicted in Figure 8, specifically among residential buildings, multi-family buildings represented 34% of RBs and the other 34% was composed of single-family houses. Indeed, non-residential case studies were composed of office buildings (18%), retail (5%), schools (4%), and other building types (e.g., hotel, industrial buildings—the remaining 4%).
Moreover, as shown in Figure 9, most of studies concerned existing RBs which covered 60% of RBs in the analyzed studies. Existing buildings were thus preferred to new construction reference buildings, within the analyzed studies, due to the big challenge related to the existing building energy refurbishment.
Given this framework, in the context of this review, the described set of selected papers were analyzed and compared based on a set of key parameters related to the methodological approach, the financial assumptions, the resulting cost-optimal values and the emerging optimal energy efficiency measures. The results of this analysis are provided in the following sections.
4. Comparing Methods: Building Energy Performance Assessment and EEM Selection
Concerning methodological aspects, there are two of the five COA phases in which the analyzed works present differences. These are the selection of energy efficiency measures (and their combinations into packages) and the energy performance assessment of the so-created building design alternatives. The choice of the method to be used in these phases may differ in relation to the final objective of the work and to the desired accuracy of the cost-optimal calculation.
In fact, the application of the cost-optimal methodology has led to interdisciplinary research work in the fields of building science and numerical optimization science, as the search of the cost-optimal level is de facto a complex optimization problem [28,110] that may be solved with approximated or detailed optimization techniques.
The different methods that can be used for the selection of EEMs leading to the cost-optimal point can be divided into two main groups.
One is the manual approach, that means selecting a defined number of packages of EEMs and calculating and comparing the global cost values; another approach is the automated search, based on different optimization algorithms driven by computer engines, that allows exploring a greater search space and identifying the region, minimizing the global cost objective function.
Figure 10 reports the number of published papers as a function of the year of publication and of the approach that was used for selecting the EEMs or packages of EEMs to be applied to the RB. As shown, since 2010 there is an exponential increasing trend of published papers for both approaches. As shown in Figure 11, there are many tools used for the automated approach. The most used are those implementing non-derivative, population-based optimization algorithms, such as GenOpt and MATLAB® [28,33,34,108,109,110,111,112]. Also other techniques has been set up and tested by the authors of the papers, such as an automated parametric analysis [62,72] or a sequential search optimization technique [49,60], that was developed specifically for the cost-optimal calculations. The aspects to be considered when comparing the EEMs selection method are the number of evaluated EEMs packages and the related accuracy of the cost-optimal search, the computational time, and the data availability after the optimization process.
The other methodological issue is related to the energy performance assessment (Figure 12). One approach is the use of simplified methods, such as the quasi-steady state method defined by UNI EN 13790 and the various national implementations. When using the simplified approach, the authors use commercial tools that are compliant with the regulations [48] or they develop their own calculation tool for energy performance assessment [43]. The other approach is dynamic simulation that allows a more detailed and precise hourly calculations of outdoor and indoor temperatures and energy consumptions. The most used dynamic simulation tools are EnergyPlus® [17,40,76,79], IDA ICE® [10,39,63,105], and TRNSYS® [16,66,80,82].
Figure 12 reports the number of published papers as a function of the year of publication and of the used approach for the energy performance assessment of the building when different packages of EEMs are applied. As shown, dynamic simulation is getting more and more used and, starting from 2015, the number of papers where dynamic simulation is used exceeds that of papers using a simplified approach. However, the simplified approach has not been abandoned, because of its easiness of application in compliance with national regulations and the possibility of coupling with simplified optimization methods. Figure 13 reports the repartition of the papers based on the tool that is used for energy assessment.
Combining the different methods for addressing the two aforementioned phases of the COA, four main approaches for carrying out the cost-optimal analysis were identified, as shown in Table 3.
The evolution of the number of papers for each approach in function of the year of publication is reported in Figure 14. As shown, the most used approach is dynamic energy simulation with manual selection of EEMs (D-M), however the use of dynamic energy simulation with automated EEMs selection emerges as the most used in the last published studies with a strong increasing trend.
In the following subsections, the four identified approaches are presented and discussed by means of highlights from some representative papers. The papers were selected among those reporting a study on the same building typology (single-family building), in order to facilitate the comparison.
4.1. Simplified Energy Performance Assessment with Manual Selection of EEMs (S-M)
This approach typically leads to evaluating a limited number of design alternatives. In one of the exemplifying paper [48], Tronchin et al. defined six construction scenarios for the single-family house taken as reference building, beyond the existing situation. One scenario reflects the minimum law requirements, while the others consider improvements in the construction of different part of the building opaque envelope, more performing technologies for windows, the use of PV and solar thermal collectors. The definition of these scenarios requires preliminary design efforts (such as system sizing, construction layer thickness, etc.), but it ensures the easiness of the cost calculation when only a few data are available and the feasibility of the resulting cost-optimal design, because of the assured technical feasibility of all the evaluated design alternatives. The quasi-steady method ensures the calculation not to be time-consuming and the results to be understandable within the national regulatory framework for the building energy performance classification.
However, this approach may fail to consider all the existing design alternatives and therefore excluding energy efficient alternatives with lower global cost. This is why it is recommended that defined criteria are used for defining the design alternatives or in presence of additional constraints that limit the number of possible design options, such as those occurring in existing building retrofits [85].
4.2. Dynamic Energy Simulation with Manual Selection of the EEMs (D-M)
This approach typically leads to evaluate a limited number of design alternatives in a very detailed way. In the selected paper [9], Kurnitski et al. define four construction concepts for the single-family house taken as reference building. The criteria for determining the four design concepts as packages of EEMs related to many design variables (envelope construction, leakage, window type, efficiency, and size of the HVAC system) is the building envelope specific heat loss coefficient (DH), which includes transmission and infiltration losses through the building envelope and is calculated per heated net floor area. As for the previous described approach (S-M), the definition of design concepts requires a preliminary design effort but ensures the feasibility of all the evaluated design alternatives.
The energy simulation of a few construction concepts allows an accurate and validated assessment of the energy performance, leading this approach to be useful not only in the preliminary design phase, but also in the advanced design phase. When using a dynamic simulation tool with manual EEMs selection approach, the limited number of design alternatives is essential in order to ensure the cost-optimal search to be manageable and not too time-consuming.
4.3. Simplified Energy Performance Assessment with Automated Selection of the EEMs (S-A)
The papers classified in this category exploit the potential of an automated optimization technique to be able to search within a space composed of a great number of packages of EEMs. This is done by means of an optimization algorithm that drives an iterative process toward the minimization of the objective function (the global cost function).
As an example, Kapsalaki et al. [35] report a study where more than 7 million packages of EEMs are evaluated by means of a model implemented and optimized in MATLAB® (v. 7.12.0).
Because of the automatism of the EEMs selection, this approach requires to define the constraints for the optimization problem, that means defining the n building design variables to be varied (e.g., insulation thickness, glazing type, HVAC system) as EEMs and the limits of their variations (e.g., insulation thickness from 10 to 30 cm). Therefore, the automated approach for the selection of EEMs allows defining a wider n-dimensional search space with respect to the previous approaches with manual selection of EEMs, which is composed by all the points representing a combination of design variables (the so-called packages of EEMs).
To do so, it is necessary to create a system of equations for calculating the total primary energy demand and the related global cost of each package of EEM. In this S-A approach, the calculation the energy performance of each package follows the quasi-steady state method, so that the system of equations remains manageable and the computational time for energy performance assessment is reduced. However, depending on the number of design variables, their range of variation and the resulting dimension of the search space, the optimization process may take a long time before converging to a solution.
With respect to the D-M and S-M approaches, this approach allows a more accurate search of the cost-optimal point and reduces the risk of overlooking some effective solutions. However, the energy performance assessment is not detailed, and the technical feasibility of the resulted optimal solutions must be checked at the end of the optimization process, as there is less control over the selected combinations of EEMs even if constraints are set carefully.
4.4. Dynamic Energy Simulation with Automated Selection of the EEMs (D-A)
This approach is typically used when a great number of design alternatives has to be systematically evaluated, in order to provide an accurate search of the cost-optimal point with a detailed energy performance assessment. This can be done by coupling a dynamic simulation software with other tools able to run optimization algorithms and minimize the global cost objective function, leading to what is also known as simulation-based optimization method [113,114].
The definition of the search space and the potential number of evaluated design alternatives is the same of the previous approach (S-A), however the computational time may increase because of the accuracy of energy performance assessment driven by the engine of the dynamic simulation software able to solve complex systems of partial and differential equations at each calculation time step. This is why, when using this approach, it is essential to control the number of objective function evaluations before reaching the minimum point. To do so, it is possible to set up optimization algorithms that perform efficiently in this kind of optimization problems [110], or to perform the optimization with a multi-stage methodology [13]. In the last paper, Hamdy et al. found the cost-optimal level of a Finnish single-family house through a three-stage simulation-based optimization. The first part leads to the optimal combination of measures for the building envelope, the second stage combines the technical systems to the resulted optimal building design, while the last stage integrates RES-system design. This approach can explore an enormous number of possible EEMs packages (more than 3 × 10⁹) with a limited and manageable number of iterations (less than 3400).
4.5. Type and Number of Selected EEMs
The main outcome of the presented analysis on the methodological aspects is the strict relationship occurring between the used approach and the number of EEMs packages that were analyzed in the different studies. As it is clearly shown in Figure 15, it is clear that a manual approach for selecting EEMs limits the number of the analyzed design alternatives if compared to the automated approach. However, in order to be fully exploited, the automated EEMs selection is often used in combination with the dynamic energy performance assessment (D-A) in a simulation-based optimization method, leading to easily conducting the cost-optimal search throughout a design space that is composed of several thousands of alternatives.
5. Comparing Cost Calculation: Financial Assumptions
As introduced, the cost-optimal calculations are based on financial assumptions concerning inflation, interest rates and the evolution of energy and products prices. As most of the studies are carried out with a financial perspective (see Table 1), the main financial parameter is the real interest rate, which is crucial to determine the discount rate for actualizing each cost that is considered within the global cost to the year 0.
The real interest rate depends on the market interest rate R and inflation rate Ri as follows
Both R and Ri, in the reality, may vary throughout the calculation period, but they are usually fixed for the all period, leading to a unique real interest rate value to be used in a study. It is important to note that many studies refer to the real interest rate as the discount rate, leading to some confusion between the meaning of discount rate (that is the real interest rate) and the discount rate coefficient or discount factor. To provide a correct definition, based on the aforementioned guidelines and standard [32], the Rd is used to refer some costs (see Equation (1)) to the starting year 0. It is calculated as
where Rr is the real interest rate and i is the year of calculation (e.g., i = 20 for calculation of the replacement cost of a component having a lifespan of 20 years). Because the building components may have different lifespans, there may be different discount rates within the same calculation, but they are all calculated on the same Rr, which is the main financial assumption on which all the other financial parameters are based.
The real interest rate is also used to calculate the present value factor fpv, which must be used to actualize costs equally occurring for multiple years. It is expressed as follows, as a function of the number of years n
The guidelines [8] recommend to set Rr to 4% for macroeconomic calculations, but also recommend to perform a sensitivity analysis to estimate the variation of cost-optimal levels according to the considered real interest rate, given the importance of this assumption. In fact, it has to be noted that the global costs increase when discount rates decrease, given that future costs (mainly energy costs) are discounted at a lower rate. However, this means that, for lower discount rates, the cost-optimal level will move towards better energy performance levels, given the greater impact that energy savings will have on the global cost.
Figure 16 gives a picture of the range of values that have been used as real interest rate in the analyzed cost-optimal studies. As shown, the values range between 0% and 8%, where the values of 3%, 4%, and 6% have the highest occurrence within the entire set of studies (central line with proportionally sized bubbles). The country repartition for such values is also reported, showing that 3% is used by the greater variety of countries (8 of 20), followed by 4% (7 out of 20).
It is shown that such values are used by the countries that are more represented within the analyzed set of studies. The lowest part of the figure shows the range of values of real interest rate values for the four most represented countries.
In Italy, the real interest rate ranges from 0% to 6%, with prevalence of 3% and 4% up to 6% in a study on the heat pump technology [40]. Lower values of interest rate have been used in the most recent studies, considering the recent economic scenario with interest rates and inflation rates that are close to 0. A similar range of real interest rate values is for Estonia (0.5–4%) with a prevalence of 4%, while almost all studies in Finland use 3% and Portugal ranges from 3% to 8% with a prevalence of 6%. It has to be noted that Turkey is among the countries using 3% and 4% as discount rate. However, differently from other European countries, where the inflation rate is usually set below 4%, the Turkish studies are characterized by high inflation rates, to the order of 10%. The fact that such high inflation rates are coupled to high market interest rates lead to have real interest rates that are comparable with those used in other European countries.
Figure 17 helps the reader understand this concept. The frequency of occurrence of inflation rates within the set of analyzed studies (when specified) is reported in the middle of the figures. Some examples are given for some selected studies, showing that the same Rr can be reached with different inflation rates Ri.
The other important financial parameter that may be considered in the calculation, the rate of evolution of energy prices Re, is analyzed in the bottom part of Figure 17, based on the different energy vectors. As shown, the Re values varies between 1.5% and 4%, with a prevalence of 2% and 3%. It is interesting to note that it is expected that higher evolution rates are expected to occur for district heating, gas, and coal, while the rate of the electricity price is expected to be lower. It is important to remark that the rate of evolution of energy prices impacts the definition of the discount rate only if different from the inflation rate. If they are set to the same value, Re does not modify the real interest rate as defined in Equation (2). The analysis of the relationship between Ri and Re, reported in Figure 16, shows that 56% of studies set Re > Ri while 35% used the same value for the two rates, assuming that the evolution of energy prices will follow the trend of inflation rates.
As expressed in Equation (1), the aforementioned financial parameters are used to calculate the value of global cost within a defined calculation period, which can be set equal or shorter than the estimated building lifecycle. The guidelines [8] recommend that this period is set at least to the refurbishment cycle of the building, which may be different for building typologies but is almost never below 20 years. It is recognized that a period of 30 years may cover the lifecycle of most of the measures assessed and is not too long to avoid the non-reliability of interest rates and energy prices projections [20].
Figure 18 reports the frequency of use of calculation periods in the set of analyzed studies. As shown, 30 years is used in the greatest part of studies (74%), followed by 20 years (17%). In general, a longer calculation period is used for residential buildings (up to 50 years for single-family houses), in fact 94% of studies using 30 years refer to residential buildings. On the other hand, a shorter calculation period is used for other building typologies, in fact the majority of studies using 20 years refers to non-residential buildings. The few residential buildings using 20 years are all multi-family buildings.
6. Comparing Results: Cost-Optimal Levels and Optimal EEMs
6.1. Global Cost Values and Gaps
Figure 19 reports on a cost-optimal graph (specific annual primary energy on the x-axis, specific global cost on the y-axis) the cost-optimal points resulting from the analyzed studies for residential buildings. Only results related to residential buildings were reported because most of the studies related to non-residential buildings did not report the results following a standard and comparable approach. The different colors indicate different climatic zones, according to the Koppen climate classification, and the referenced paper is indicated next to the related point. As a reference, the Cfa zone (humid subtropical climate—light blue) refers to case studies located in the Northern Italy; the Cfb zone (oceanic climate—orange) is related to locations in France, Latvia, UK; the Csa zone (hot-dry summer Mediterranean climate—grey) groups the studies located in Southern Italy, Portugal, Spain, Turkey, and Greece; some locations in Portugal, Spain, and Turkey are classified under the Csb zone (cool-dry summer Mediterranean climate—yellow) and the Dfb zone (warm-summer continental climate—dark blue) refers to case studies in the Northern Europe, such as in Finland, Estonia, Ireland, and Norway.
This synthesis is reported with the purpose of facilitating the reader in analyzing the literature analysis on the topic. However, as shown, it is hard to find a common trend between the studies. From the global cost values point of view, this was expected because of the many different financial assumptions and the different set of analyzed energy efficiency measures (some studies considered only EEMs related to the envelope, others were related only to the energy systems, not all the studies considered EEMs related to renewable energy sources). However, it has to be noted that the absolute global costs value is not that important, as the main objective of the COA approach is to determine the energy performance level that is related to the lowest global cost value.
That is why, in Figure 19, the ranges of cost-optimal energy performance levels are highlighted, grouped by climatic zones and building type. Each black sign refers to a different result for a particular case-study addressed in one of the papers.
It emerges that, especially for some studies in the climate zones Cfa (Italy [12,66]) and Csa (Italy and Portugal, [26,55,74,79]), the cost-optimal energy performance level is very close to zero for both building typologies, demonstrating the possible economic feasibility of nearly zero-energy buildings. However, for other studies in the same climatic zones, the reached cost-optimal energy performance levels are much higher (up to 125 kWh/m2).
For the Cfb climatic zones, mainly due to the limited number of studies in this group, the cost-optimal energy performance range is very small, and it seems that it is easier to reach cost-optimal nearly zero-energy buildings for the single-family house than for the multi-family buildings.
The larger range and the highest values of primary energy are reached in the Dfb climate zone for single-family houses, mainly due to differences in assumptions concerning the market conditions and financial parameters [58]. However, some studies [54] have proven that it is possible to reach low cost-optimal energy performance levels also in this zone. For the multi-family building typology, the cost-optimal energy performance range is smaller both for Dfb and Csb zones.
6.2. Resulting Optimal EEMs
Beyond the difficulties in comparing cost-optimal energy performance levels and defining common trends, each of the previously reported cost-optimal points is related to a set of optimal EEMs that can be analyzed and compared. As mentioned, these EEMs are usually classified in two categories, one including ‘passive’ measures related to the building envelope and the other composed of ‘active’ measures related to the technical systems, including measures related to renewable energy production and exploitation.
The performed comprehensive analysis helps identify the technologies that most frequently results as cost-optimal in the different climatic zones for the different building typology.
6.2.1. Cost-Optimal EEMs Related to the Energy System and RES
Measures related to energy systems usually consist in the installation, or substitution, of the primary systems for the building energy uses. Terminal units (i.e., radiators, fan-coils, radiant panels, etc.) often come as a consequence of the primary system choice. In many cases the analyzed energy uses are limited to heating, cooling, and ventilation in residential buildings, while EEMs affecting the lighting energy use are included in studies regarding non-residential buildings. EEMs related to RES usually consist in the installation of solar thermal and/or PV systems.
Figure 20, Figure 21 and Figure 22 summarize the different technologies for energy systems that are used in the cost-optimal building design resulting from the analyzed set of studies. The different climate zones are on the vertical axis, while the technologies are reported on the horizontal axis. The bubble size, reported as labels on each bubble, indicates the frequency of occurrence of one technology in the resulting cost-optimal design solutions in each climate zone.
Concerning heating systems for single family houses, the reversible air heat pump results as optimal in some studies in all climate zones [12,35,43,55], while the geothermal heat pump is in most cost-optimal solutions in Dfb zone [9,34,58]. The substitution of a traditional gas boiler with a gas condensing boiler is a cost-optimal EEM only in Cfa and Cfb zones [17,46], while the biomass boiler is a cost-optimal option for some cases in Cfb, Csa, and Dfb zones [28,58,114]. Optimal EEMs for cooling system rely on the reversible air heat pump or on the electric chiller if the heating system is a gas condensing boiler [17,75,95]. Concerning ventilation in single-family houses, mechanical systems results as cost-optimal only in Dfb zone [9,73] and in one case for Csa zone [55]. PV systems are included in the optimal EEMs packages only in Cfa, Csa, and Dfb zones, while solar collectors are optimal in many studies in Cfa zones, especially if devoted to the DHW supply integrated with a gas boiler [14].
Differently from single-family houses, cost-optimal studies in multi-family residential buildings lead to select the gas condensing boiler for heating in almost all climate zones [15,42,46,57,85,89,106]. In some cases, district heating [68,69] and micro CHP [87] appears in the possible EEMs for cost-effectively heating multi-family buildings.
EEMs related to ventilation and RES follow the same trends as for single-family buildings.
The gas condensing boiler appears to be a good solution also for non-residential buildings [41,65,71]. It is interesting to note that, for non-residential building typologies, the geothermal heat pump becomes cost-effective also in some cases in Csa and Cfb zones [59,83,88]. Switching to LED lighting is a cost-optimal solution in all climate zones, together with the automated control of daylight shadings and artificial lighting.
6.2.2. EEMs Related to the Building Envelope
The EEMs related to the building envelope mostly affect the energy performance in terms of passive reduction of energy needs for heating, cooling and—especially for non-residential buildings—lighting. In most COA studies, they refer to the construction of the opaque envelope, in terms of material and thickness of each layer and/or wall packages alternatives, and to the type and dimension of window packages (glass and frame).
Figure 23, Figure 24 and Figure 25 summarize the resulting optimal envelope EEMs in terms of U-value of the different components of the opaque envelope (walls, roof, and floor) and of windows, classified according to climatic zones and building typologies. Each black marker corresponds to one optimal EEM in a particular case study.
From this representation, it is possible to determine the optimal ranges of U-values for the cost-optimal design of the building envelope. In many studies, especially those related to existing buildings, EEMs related to envelope were considered but did not appear in the resulting cost-optimal solutions, where only measures related to systems resulted as cost-effective, leaving the envelope to its initial reference building configuration. This is particularly true for non-residential buildings, where the only cost-optimal envelope EEMs are related to windows in some studies, but the greatest part of resulting optimal EEMs are related to systems and RES.
7. Beyond the Classical Cost-Optimal Analysis: Considering Uncertainty and Future Scenarios
From the described analysis, it emerges that the results are strongly influenced by the hypotheses and assumptions on which the calculations are based. In fact, the cost-optimal approach lead to rethink to the NZEB design as the solution of a complex optimization problem, as it was demonstrated that the best performance (technical, but also financial) does not result from the sum of a pre-defined set of EEMs applied to the building, but it is strictly related to the local scale, depending on the optimal interaction of the many design variables with the boundary conditions. These boundary conditions, also called environment parameters, create the scenario in which such optimization study is performed.
In case of NZEB design problems carried out within the COA framework, the environment parameters usually include the climate conditions (hourly, daily, monthly, or annual profiles of temperature, humidity, solar radiation, wind speed, etc.), the market characteristics (cost evolution of materials and technologies, energy prices, discount rates, etc.), and the available technologies in the project location. Despite such parameters potentially having a great impact on the system performance, they cannot be controlled by the system designer nor be optimized, but they have to be considered as the boundary conditions creating the scenario in which the system is optimized. Such a scenario is often fixed before looking for the optimal solutions, but it may be subject to uncertainty, especially when optimizing the system performance in the medium-long term.
Concerning climate scenarios, the objective may be to identify methods for considering the impact of global climate change on the local climate conditions, in order to understand how buildings should be designed now in order to be resilient to climate change in the future.
The same approach should be followed for financial scenarios, considering the difficulties in finding reliable medium and long-term predictions of economic trends. Also, different scenarios related to the evolution of technologies availability and costs should be studied.
In some studies, such uncertainty is taken into account through sensitivity analyses, mainly performed on financial parameters [54,107], highlighting that the variation of such parameters may lead to substantial changes in optimal levels and related technologies over time. However, given the long building lifetime and renovation cycles, it is necessary to set up methodologies that are able to go beyond simple sensitivity analysis, towards robust optimal design approaches.
In this context, some authors have started investigating the resilience of the resulting optimal solutions to the variation of the aforementioned boundary conditions [54,97,100,101,107], but a lot of further work needs to be done to cover the different European climatic and economic contexts with a sufficient number of reference case-studies. Furthermore, a standard methodological framework that is able to combine the different climate, financial, and technological scenarios should be defined for providing a common framework to assess the robustness of the resulting optimal solutions.
8. Conclusions
After seven years have passed since the introduction of the EPBD recast, the cost-optimal methodology has been the main driver to carry out important research about nearly zero-energy buildings throughout Europe. The introduction of COA has been embraced from the European scientific community not only as a legislative requirement but rather as a new and powerful tool to progress the research in building design towards the affordability of the zero energy objective. This is because, on the one hand, the COA introduced to researchers the possibility to evaluate different single energy efficiency measures (measures related to the envelope, measures related to HVAC system, measures dealing with renewable sources, etc.) and/or packages of measures within a common calculation framework, which is harmonized across all Europe. Recent publications demonstrate that this is still a hot topic, research is still in progress [115,116] and will be further encouraged by the publication of the new recast of EPBD in mid-2018.
In these terms, COA has given a strong impulse for a new generation of studies on the building energy performance, based on the trade-off between technical and economic feasibility in a life-cycle cost perspective. Because COA was introduced in a context of emerging powerful calculation tools and a regulatory framework that was able to drive this new analytical approach, the COA comparative methodology has transformed the traditional sequential parametric approach, based on the study of single variables, into an optimization approach that has to be carried out in a design space composed of a great number of design alternatives where the mutual relationship between the design variables has to be considered. This methodology for the search of the economic optimum leads to investigating and developing different methods and algorithms for building design optimization problems, and to discuss how the calculation method for the energy performance assessment can influence the selection of the optimal solutions.
Despite the many differences occurring between the analyzed studies, due to the different socio-economic contexts characterizing the European countries, COA has also given a strong impulse towards the standardization of this type of research studies on the whole-building energy performance.
In terms of methodologies and tools, a defined approach based on optimization has emerged as the evolution of the advanced simulation tools for the detailed building energy performance assessment, leading to new research on simulation-based optimization methods not only for informing the building retrofit decision process but also to drive the design of new buildings from a multiple-objective perspective.
In terms of results, despite the difficulties in comparing the studies due to the many different assumptions, there are some general considerations that can be done.
First, it was demonstrated that the zero energy objective is technically reachable through the optimal interaction of all the building design variables that can be studied in detail through advanced simulation and optimization models. However, it does not seem fully economically feasible, as many studies in different contexts highlight that there is still a consistent gap between the cost-optimal nearly zero-energy building design and the net zero energy building design.
Second, EEMs related to the building envelope do not emerge as drivers of cost-optimal building design. In fact, in all the studies where both envelope and systems EEMs were considered, the optimal envelope design results as a consequence of the resulting optimal energy systems. In many cases, only measures related to systems had to be implemented to reach the cost-optimality. The common idea “the more insulated, the better” does not result from most of these studies.
Third, the implementation of renewable energy sources in situ such as solar thermal and PV has known a fast increase in economic feasibility in the last few years. However, the current national policies for incentives and for energy selling prices are limiting the return on investment, thus limiting their massive implementation in all European contexts.
This may be the reason why gas-based technologies—such as condensing boilers or biomass boilers—can be considered among many cost-optimal solutions, thus limiting the implementation of electric heat pumps that can be easily supplied by renewable energy sources.
Another emerging aspect is that the great effort needed for comparing the different studies in this work has highlighted some criticalities in the way research in this field is carried out and presented. It was shown that the comparison between cost-optimal values is not easy, and the definition of general trends is full of uncertainty. Furthermore, financial assumptions are often unclear and not explained in detail, limiting the replicability of the studies and the correct interpretation and impact of results. The study of the uncertainty of assumptions is limited to a simplified sensitivity analysis in some cases but is not addressed at all in many studies.
Future work will be done concerning the study of the resilience of the cost-optimal design solutions to the variation of boundary conditions, such as climate and economic scenarios.
Moreover, a future study should be focused on understanding the extent to which the national regulations are being informed from such studies and are modifying their principles according to their results.
Author Contributions
V.M. carried out the first search of papers in the mentioned scientific databases and proposed a classification scheme. She also wrote the introduction to the COA in Section 2, prepared Figure 1, Figure 2 and Figure 3 and analyzed the first experiences in COA application. M.F. finalized the paper selection and performed the comparison between studies according to the different categories addressed in the paper. She prepared Figure 4, Figure 5, Figure 6, Figure 7, Figure 8, Figure 9, Figure 10, Figure 11, Figure 12, Figure 13, Figure 14, Figure 15, Figure 16, Figure 17, Figure 18, Figure 19, Figure 20, Figure 21, Figure 22 and Figure 23, wrote the greatest parts of the paper and finalized it for submission. E.F. supervised the work throughout the all process, providing ideas and criteria for performing the analysis and discussing the emerging results.
Acknowledgments
This work has been done within the Starting Grant 2016 project funded by the Compagnia di San Paolo, Turin, Italy.
Conflicts of Interest
The authors declare no conflict of interest. The founding sponsors had no role in the design of the study; in the collection, analyses, or interpretation of data; in the writing of the manuscript, or in the decision to publish the results.
References
- EPBD Recast: Directive 2010/31/EU of the European Parliament and of Council of 19 May 2010 on the energy performance of buildings (recast). Off. J. Eur. Union 2010, 153, 13–35.
- Building Performance Institute Europe (BPIE). Europe’s Buildings under the Microscope. A Country-By-Country Review of the Energy Performance of Buildings; BPIE: Brussels, Belgium, 2011. [Google Scholar]
- Commission Delegated Regulation (EU) No 244/2012 of 16 January 2012 supplementing Directive 2010/31/EU of the European Parliament and of the Council on the energy performance of buildings by establishing a comparative methodology framework for calculating cost-optimal levels of minimum energy performance requirements for buildings and building elements. Off. J. Eur. Union 2012, 136, 18–36.
- Gustavsson, L.; Joelsson, A. Life cycle primary energy analysis of residential buildings. Energy Build. 2010, 42, 210–220. [Google Scholar] [CrossRef]
- Azari, R. Integrated energy and environmental life cycle assessment of office building envelopes. Energy Build. 2014, 82, 156–162. [Google Scholar] [CrossRef]
- Verbeeck, G.; Hens, H. Life cycle inventory of buildings: A calculation method. Build. Environ. 2010, 45, 1037–1041. [Google Scholar] [CrossRef]
- Dolmens, D. A Change is going to come. A New Mandate: Nearly zero energy buildings. REHVA Eur. HVAC J. 2011, 48, 34–38. [Google Scholar]
- Guidelines accompanying Commission Delegated Regulation (EU) No 244/2012 of 16 January 2012 supplementing Directive 2010/31/EU of the European Parliament and of the Council on the energy performance of buildings by establishing a comparative methodology framework for calculating cost-optimal levels of minimum energy performance requirements for buildings and building elements. Off. J. Eur. Union 2012, 115, 2–26.
- Kurnitski, J.; Saari, A.; Kalamees, T.; Vuolle, M.; Niemelä, J.; Tark, T. Cost-optimal and nearly zero (nZEB) energy performance calculations for residential buildings with REHVA definition for nZEB national implementation. Energy Build. 2011, 43, 3279–3288. [Google Scholar] [CrossRef]
- Pikas, E.; Thalfeldt, M.; Kurnitski, J. Cost-optimal and nearly zero energy building solutions for office buildings. Energy Build. 2014, 74, 30–42. [Google Scholar] [CrossRef]
- Ganiç, N.; Yılmaz, A.Z. Adaptation of the cost-optimal level calculation method of Directive 2010/31/EU considering the influence of Turkish national factors. Appl. Energy 2014, 123, 94–107. [Google Scholar] [CrossRef]
- Barthelmes, V.M.; Becchio, C.; Bottero, M.C.; Corgnati, S.P. The Influence of Energy Targets and Economic Concerns in Design Strategies for a Residential Nearly-Zero Energy Building. Buildings 2014, 4, 937–962. [Google Scholar] [CrossRef]
- Hamdy, M.; Hasan, A.; Siren, K. A multi-stage optimization method for cost-optimal and nearly-zero-energy building solutions in line with the EPBD-recast 2010. Energy Build. 2013, 56, 189–203. [Google Scholar] [CrossRef]
- Corrado, V.; Ballarini, I.; Paduos, S. Assessment of Cost-optimal Energy Performance Requirements for the Italian Residential Building Stock. Energy Procedia 2014, 45, 443–452. [Google Scholar] [CrossRef]
- Ascione, F.; Bianco, N.; De Stasio, C.; Mauro, G.M.; Vanoli, G.P. A new methodology for cost-optimal analysis by means of the multi-objective optimization of building energy performance. Energy Build. 2015, 88, 78–90. [Google Scholar] [CrossRef]
- Ferrara, M.; Fabrizio, E.; Virgone, J.; Filippi, M. A simulation-based optimization method for cost-optimal analysis of nearly Zero Energy Buildings. Energy Build. 2014, 84, 442–457. [Google Scholar] [CrossRef]
- Becchio, C.; Dabbene, P.; Fabrizio, E.; Monetti, V.; Filippi, M. Cost-optimality assessment of a single family house: Building and technical systems solutions for the nZEB target. Energy Build. 2015, 90, 173–187. [Google Scholar] [CrossRef]
- Monetti, V. Scalable Dynamic Simulation-Based Methodology for the Energy Retrofit of Existing Buildings. Ph.D. Thesis, Politecnico di Torino, Turin, Italy, 2015. [Google Scholar]
- Becchio, C. Assessment of Energy and Cost Effectiveness in Retrofitting Existing Buildings. Ph.D. Thesis, Politecnico di Torino, Turin, Italy, 2013. [Google Scholar]
- Building Performance Institute Europe (BPIE). Cost-Optimality. Discussing Methodology and Challenges within the Recast Energy Performance of Buildings Directive; BPIE: Brussels, Belgium, 2010. [Google Scholar]
- Building Performance Institute Europe (BPIE). Implementing the Cost-Optimal Methodology in EU Countries. Lessons Learned from Three Case Studies; BPIE: Brussels, Belgium, 2013. [Google Scholar]
- Boermans, T.; Bettgenhauser, K.; Hermelink, A.; Schimschar, S. Cost-optimal Building Performance Requirements; European Council for an Energy Efficient Economy: Stockholm, Sweden, 2011. [Google Scholar]
- Corrado, V.; Ballarini, I.; Paduos, S. Sviluppo Della Metodologia Comparativa Cost-Optimal Secondo Direttiva 2010/31/UE; ENEA: Rome, Italy, 2013. [Google Scholar]
- Fokaides, P.A.; Papadopoulos, A.M. Cost-optimal insulation thickness in dry and mesothermal climates: Existing models and their improvement. Energy Build. 2014, 68, 203–212. [Google Scholar] [CrossRef]
- Teodoriu, G.; Balan, M.; Şerbănoiu, I.; Verdeş, M. Cost-optimal Analysis of Performance Relation Thermal Insulation—Hydronic Heating System Applied to Romanian Residential Buildings. Procedia Technol. 2014, 12, 583–590. [Google Scholar] [CrossRef]
- Brandão de Vasconcelos, A.; Cabaço, A.; Pinheiro, M.D.; Manso, A. The impact of building orientation and discount rates on a Portuguese reference building refurbishment decision. Energy Policy 2016, 91, 329–340. [Google Scholar] [CrossRef]
- Hamdy, M.; Nguyen, A.-T.; Hensen, J.L.M. A performance comparison of multi-objective optimization algorithms for solving nearly-zero-energy-building design problems. Energy Build. 2016, 121, 57–71. [Google Scholar] [CrossRef] [Green Version]
- Ferrara, M.; Fabrizio, E.; Virgone, J.; Filippi, M. Energy systems in cost-optimized design of nearly zero-energy buildings. Autom. Constr. 2016, 70, 109–127. [Google Scholar] [CrossRef]
- Corgnati, S.P.; Fabrizio, E.; Filippi, M.; Monetti, V. Reference buildings for cost-optimal analysis: Method of definition and application. Appl. Energy 2013, 102, 983–993. [Google Scholar] [CrossRef]
- European Committee for Standardization (CEN). European Committee for Standardization CEN/TR 15615: Explanation of the General Relationship between Various European Standards and the Energy Performance of Building Directive (EBPD); Umbrella Document; CEN: Tallinn, Estonia, 2008. [Google Scholar]
- European Committee for Standardization (CEN). ISO 13790, Energy Performance of Buildings, Calculation of Energy Use for Space Heating and Cooling; CEN: Tallinn, Estonia, 2008. [Google Scholar]
- European Committee for Standardization (CEN). EN 15459, Energy Performance of Buildings. Economic Evaluation Procedure for Energy Systems in Buildings; CEN: Tallinn, Estonia, 2007. [Google Scholar]
- Hasan, A. Selection of Optimal Combinations of Measures for Energy-Refurbishment of Buildings. REHVA Eur. HVAC J. 2010, 48–53. [Google Scholar]
- Hamdy, M.; Palonen, M.; Hasan, A. Implementation of Pareto-Archive NSGA-II Algorithms to a Nearly-Zero-Energy Building Optimisation Problem. In Proceedings of the First Building Simulation and Optimization Conference, Loughborough, UK, 10–11 September 2012. [Google Scholar]
- Kapsalaki, M.; Leal, V.; Santamouris, M. A methodology for economic efficient design of Net Zero Energy Buildings. Energy Build. 2012, 55, 765–778. [Google Scholar] [CrossRef]
- Kwiatkowski, J.; Panek, A.; Lehmden, A.; Unger, C. Consideration about the Cost-optimal Methodology to Determine Energy Performance Requirements for Buildings. In Proceedings of the Central Europe towards Sustainable Building 2013, Prague, Czech Republic, 26–28 June 2013. [Google Scholar]
- Oliveira Panão, M.J.N.; Rebelo, M.P.; Camelo, S.M.L. How low should be the energy required by a nearly Zero-Energy Building? The load/generation energy balance of Mediterranean housing. Energy Build. 2013, 61, 161–171. [Google Scholar] [CrossRef] [Green Version]
- Thalfeldt, M.; Pikas, E.; Kurnitski, J.; Voll, H. Facade design principles for nearly zero energy buildings in a cold climate. Energy Build. 2013, 67, 309–321. [Google Scholar] [CrossRef]
- Arumägi, E.; Kalamees, T. Analysis of energy economic renovation for historic wooden apartment buildings in cold climates. Appl. Energy 2014, 115, 540–548. [Google Scholar] [CrossRef]
- Aste, N.; Adhikari, R.S.; Manfren, M. Cost-optimal analysis of heat pump technology adoption in residential reference buildings. Renew. Energy 2013, 60, 615–624. [Google Scholar] [CrossRef]
- Becchio, C.; Corgnati, S.P.; Fabrizio, E.; Ganiç, N.; Monetti, V.; Zerrin Yilmaz, A. Application of the cost-optimal methodology to two European case studies: An Italian and a Turkish retrofitted existing office building. In Historical and Existing Buildings: Designing the Retrofit. An Overview from Energy Performances to Indoor Air Quality; AICARR: Milano, Italy, 2014; pp. 427–441. [Google Scholar]
- De Angelis, E.; Pansa, G.; Serra, E. Research of Economic Sustainability of Different Energy Refurbishment Strategies for an Apartment Block Building. Energy Procedia 2014, 48, 1449–1458. [Google Scholar] [CrossRef]
- Ferreira, M.; Almeida, M.; Rodrigues, A. Cost-optimality and net-zero energy in the renovation of Portuguese residential building stock—Rainha Dona Leonor neighbourhood case study. Int. J. Sustain. Build. Technol. Urban Dev. 2014, 5, 306–317. [Google Scholar] [CrossRef]
- Kamenders, A.; Vanaga, R.; Biseniece, E.; Blumberga, A. Publikācija: Cost-Optimal Energy Performance Level for Apartment Buildings in Latvia. In Proceedings of the 27th International Conference on Efficiency, Cost, Optimization, Simulation and Environmental Impact of Energy Systems (ECOS 2014), Finland, Turku, 15–19 June 2014; pp. 1921–1933. [Google Scholar]
- Kurnitski, J.; Kuusk, K.; Tark, T.; Uutar, A.; Kalamees, T.; Pikas, E. Energy and investment intensity of integrated renovation and 2030 cost-optimal savings. Energy Build. 2014, 75, 51–59. [Google Scholar] [CrossRef]
- Pountney, C.; Ross, D.; Armstrong, S. A Cost-Optimal Assessment of Buildings in Ireland Using Directive 2010/31/EU of the Energy Performance of Buildings Recast. SDAR J. Sustain. Des. Appl. Res. 2014, 2, 5. [Google Scholar]
- Tagliabue, L.C.; Maistrello, M.; Fattor, M. Technical and Cost-optimal Evaluation of Thermal Plants for Energy Retrofitting of a Residential Building. Energy Procedia 2014, 50, 597–602. [Google Scholar] [CrossRef]
- Tronchin, L.; Tommasino, M.C.; Fabbri, K. On the “cost-optimal levels” of energy performance requirements and its economic evaluation in Italy. Int. J. Sustain. Energy Plan. Manag. 2014, 3, 49–62. [Google Scholar] [CrossRef]
- Aelenei, L.; Paduos, S.; Petran, H.; Tarrés, J.; Ferreira, A.; Corrado, V.; Camelo, S.; Polychroni, E.; Sfakianaki, K.; Gonçalves, H.; et al. Implementing Cost-optimal Methodology in Existing Public Buildings. Energy Procedia 2015, 78, 2022–2027. [Google Scholar] [CrossRef]
- Almeida, M.; Bencresciuto, A.; Ferreira, M.; Rodrigues, A. Cost-effective Energy and Carbon Emission Optimization in Building Renovation—A Case-Study in a Low Income Neighbourhood. Energy Procedia 2015, 78, 2403–2408. [Google Scholar] [CrossRef] [Green Version]
- Ascione, F.; Cheche, N.; Masi, R.F.D.; Minichiello, F.; Vanoli, G.P. Design the refurbishment of historic buildings with the cost-optimal methodology: The case study of a XV century Italian building. Energy Build. 2015, 99, 162–176. [Google Scholar] [CrossRef]
- Ascione, F.; Böttcher, O.; Kaltenbrunner, R.; Vanoli, G.P. Summer Overheating in a New Multi-storey Building in Berlin: Numerical Study for Improving the Indoor Microclimate. Energy Procedia 2015, 75, 1305–1314. [Google Scholar] [CrossRef]
- Basinska, M.; Koczyk, H.; Kosmowski, A. Assessment of Thermo Modernization Using the Global Cost Method. Energy Procedia 2015, 78, 2040–2045. [Google Scholar] [CrossRef]
- Basinska, M.; Koczyk, H.; Szczechowiak, E. Sensitivity analysis in determining the optimum energy for residential buildings in Polish conditions. Energy Build. 2015, 107, 307–318. [Google Scholar] [CrossRef]
- Baglivo, C.; Congedo, P.M.; D’Agostino, D.; Zacà, I. Cost-optimal analysis and technical comparison between standard and high efficient mono-residential buildings in a warm climate. Energy 2015, 83, 560–575. [Google Scholar] [CrossRef]
- Becchio, C.; Bottero, M.C.; Corgnati, S.P.; Ghiglione, C. nZEB Design: Challenging between Energy and Economic Targets. Energy Procedia 2015, 78, 2070–2075. [Google Scholar] [CrossRef]
- Becchio, C.; Ferrando, D.G.; Fregonara, E.; Milani, N.; Quercia, C.; Serra, V. The Cost-optimal Methodology for Evaluating the Energy Retrofit of an ex-industrial Building in Turin. Energy Procedia 2015, 78, 1039–1044. [Google Scholar] [CrossRef]
- Bolliger, R.; Ott, W.; von Grünigen, S. Finding the Balance between Energy Efficiency Measures and Renewable Energy Measures in Building Renovation: An Assessment Based on Generic Calculations in 8 European Countries. Energy Procedia 2015, 78, 2372–2377. [Google Scholar] [CrossRef]
- Congedo, P.M.; Baglivo, C.; D’Agostino, D.; Zacà, I. Cost-optimal design for nearly zero energy office buildings located in warm climates. Energy 2015, 91, 967–982. [Google Scholar] [CrossRef]
- Corrado, V.; Paduos, S. Application of the Comparative Methodology for the Definition of Individual Building Elements Energy Requirements in Italy. Energy Procedia 2015, 78, 3025–3030. [Google Scholar] [CrossRef]
- Ferrari, S.; Zagarella, F. Costs Assessment for Building Renovation Cost-optimal Analysis. Energy Procedia 2015, 78, 2378–2384. [Google Scholar] [CrossRef]
- Haase, M.; Lolli, N.; Skeie, K.S.; Noris, F. Cost-optimal Retrofitting of Shopping Malls in Europe. Energy Procedia 2015, 78, 2058–2063. [Google Scholar] [CrossRef] [Green Version]
- Mohamed, A.; Hamdy, M.; Hasan, A.; Sirén, K. The performance of small scale multi-generation technologies in achieving cost-optimal and zero-energy office building solutions. Appl. Energy 2015, 152, 94–108. [Google Scholar] [CrossRef]
- Monetti, V.; Fabrizio, E.; Filippi, M. Impact of low investment strategies for space heating control: Application of thermostatic radiators valves to an old residential building. Energy Build. 2015, 95, 202–210. [Google Scholar] [CrossRef]
- Mauro, G.M.; Hamdy, M.; Vanoli, G.P.; Bianco, N.; Hensen, J.L.M. A new methodology for investigating the cost-optimality of energy retrofitting a building category. Energy Build. 2015, 107, 456–478. [Google Scholar] [CrossRef]
- Penna, P.; Prada, A.; Cappelletti, F.; Gasparella, A. Multi-objectives optimization of Energy Efficiency Measures in existing buildings. Energy Build. 2015, 95, 57–69. [Google Scholar] [CrossRef]
- Pikas, E.; Thalfeldt, M.; Kurnitski, J.; Liias, R. Extra cost analyses of two apartment buildings for achieving nearly zero and low energy buildings. Energy 2015, 84, 623–633. [Google Scholar] [CrossRef]
- Pikas, E.; Kurnitski, J.; Liias, R.; Thalfeldt, M. Quantification of economic benefits of renovation of apartment buildings as a basis for cost-optimal 2030 energy efficiency strategies. Energy Build. 2015, 86, 151–160. [Google Scholar] [CrossRef]
- Prando, D.; Prada, A.; Ochs, F.; Gasparella, A.; Baratieri, M. Analysis of the energy and economic impact of cost-optimal buildings refurbishment on district heating systems. Sci. Technol. Built Environ. 2015, 21, 876–891. [Google Scholar] [CrossRef]
- Sağlam, N.G.; Yılmaz, A.Z. Progress towards EPBD Recast Targets in Turkey: Application of Cost-optimality Calculations to a Residential Building. Energy Procedia 2015, 78, 973–978. [Google Scholar] [CrossRef]
- Stocker, E.; Tschurtschenthaler, M.; Schrott, L. Cost-optimal renovation and energy performance: Evidence from existing school buildings in the Alps. Energy Build. 2015, 100, 20–26. [Google Scholar] [CrossRef]
- Tadeu, S.; Rodrigues, C.; Tadeu, A.; Freire, F.; Simões, N. Energy retrofit of historic buildings: Environmental assessment of cost-optimal solutions. J. Build. Eng. 2015, 4, 167–176. [Google Scholar] [CrossRef]
- Wang, Q.; Holmberg, S. A methodology to assess energy-demand savings and cost effectiveness of retrofitting in existing Swedish residential buildings. Sustain. Cities Soc. 2015, 14, 254–266. [Google Scholar] [CrossRef]
- Zacà, I.; D’Agostino, D.; Congedo, P.M.; Baglivo, C. Assessment of cost-optimality and technical solutions in high performance multi-residential buildings in the Mediterranean area. Energy Build. 2015, 102, 250–265. [Google Scholar] [CrossRef]
- Araújo, C.; Almeida, M.; Bragança, L.; Barbosa, J.A. Cost-benefit analysis method for building solutions. Appl. Energy 2016, 173, 124–133. [Google Scholar] [CrossRef] [Green Version]
- Ascione, F.; Bianco, N.; De Stasio, C.; Mauro, G.M.; Vanoli, G.P. Multi-stage and multi-objective optimization for energy retrofitting a developed hospital reference building: A new approach to assess cost-optimality. Appl. Energy 2016, 174, 37–68. [Google Scholar] [CrossRef]
- Ascione, F.; Bianco, N.; De Masi, R.F.; De Stasio, C.; Mauro, G.M.; Vanoli, G.P. Multi-objective optimization of the renewable energy mix for a building. Appl. Therm. Eng. 2016, 101, 612–621. [Google Scholar] [CrossRef]
- Ashrafian, T.; Yilmaz, A.Z.; Corgnati, S.P.; Moazzen, N. Methodology to define cost-optimal level of architectural measures for energy efficient retrofits of existing detached residential buildings in Turkey. Energy Build. 2016, 120, 58–77. [Google Scholar] [CrossRef]
- De Vasconcelos, A.B.; Pinheiro, M.D.; Manso, A.; Cabaço, A. EPBD cost-optimal methodology: Application to the thermal rehabilitation of the building envelope of a Portuguese residential reference building. Energy Build. 2016, 111, 12–25. [Google Scholar] [CrossRef]
- Brinks, P.; Kornadt, O.; Oly, R. Development of concepts for cost-optimal nearly zero-energy buildings for the industrial steel building sector. Appl. Energy 2016, 173, 343–354. [Google Scholar] [CrossRef]
- Lindberg, K.B.; Fischer, D.; Doorman, G.; Korpås, M.; Sartori, I. Cost-optimal energy system design in Zero Energy Buildings with resulting grid impact: A case study of a German multi-family house. Energy Build. 2016, 127, 830–845. [Google Scholar] [CrossRef]
- Chardon, S.; Brangeon, B.; Bozonnet, E.; Inard, C. Construction cost and energy performance of single family houses: From integrated design to automated optimization. Autom. Constr. 2016, 70, 1–13. [Google Scholar] [CrossRef]
- Congedo, P.M.; D’Agostino, D.; Baglivo, C.; Tornese, G.; Zacà, I. Efficient Solutions and Cost-Optimal Analysis for Existing School Buildings. Energies 2016, 9, 851. [Google Scholar] [CrossRef]
- Corrado, V.; Ballarini, I. Refurbishment trends of the residential building stock: Analysis of a regional pilot case in Italy. Energy Build. 2016, 132, 91–106. [Google Scholar] [CrossRef]
- Ferreira, M.; Almeida, M.; Rodrigues, A.; Silva, S.M. Comparing cost-optimal and net-zero energy targets in building retrofit. Build. Res. Inf. 2016, 44, 188–201. [Google Scholar] [CrossRef]
- Ferreira, M.; Almeida, M.; Rodrigues, A. Cost-optimal energy efficiency levels are the first step in achieving cost effective renovation in residential buildings with a nearly-zero energy target. Energy Build. 2016, 133, 724–737. [Google Scholar] [CrossRef]
- Lindberg, K.B.; Doorman, G.; Fischer, D.; Korpås, M.; Ånestad, A.; Sartori, I. Methodology for optimal energy system design of Zero Energy Buildings using mixed-integer linear programming. Energy Build. 2016, 127, 194–205. [Google Scholar] [CrossRef] [Green Version]
- Niemelä, T.; Kosonen, R.; Jokisalo, J. Cost-optimal energy performance renovation measures of educational buildings in cold climate. Appl. Energy 2016, 183, 1005–1020. [Google Scholar] [CrossRef]
- Ortiz, J.; i Casas, A.F.; Salom, J.; Garrido Soriano, N.; i Casas, P.F. Cost-effective analysis for selecting energy efficiency measures for refurbishment of residential buildings in Catalonia. Energy Build. 2016, 128, 442–457. [Google Scholar] [CrossRef]
- Silva, S.M.; Mateus, R.; Marques, L.; Ramos, M.M.D.; de Almeida, M.G. Contribution of the solar systems to the nZEB and ZEB design concept in Portugal: Energy, economics and environmental life-cycle analysis. Sol. Energy Mater. Sol. Cells 2016, 156, 59–74. [Google Scholar] [CrossRef] [Green Version]
- Stevanović, S. Parametric study of a cost-optimal, energy efficient office building in Serbia. Energy 2016, 117, 492–505. [Google Scholar] [CrossRef]
- Tadeu, S.F.; Alexandre, R.F.; Tadeu, A.J.B.; Antunes, C.H.; Simões, N.A.V.; da Silva, P.P. A comparison between cost-optimality and return on investment for energy retrofit in buildings-A real options perspective. Sustain. Cities Soc. 2016, 21, 12–25. [Google Scholar] [CrossRef]
- Testi, D.; Schito, E.; Conti, P. Cost-optimal Sizing of Solar Thermal and Photovoltaic Systems for the Heating and Cooling Needs of a Nearly Zero-Energy Building: The Case Study of a Farm Hostel in Italy. Energy Procedia 2016, 91, 528–536. [Google Scholar] [CrossRef]
- Ascione, F.; Böttcher, O.; Kaltenbrunner, R.; Vanoli, G.P. Methodology of the cost-optimality for improving the indoor thermal environment during the warm season. Presentation of the method and application to a new multi-storey building in Berlin. Appl. Energy 2017, 185, 1529–1541. [Google Scholar] [CrossRef] [Green Version]
- Ascione, F.; Bianco, N.; De Stasio, C.; Mauro, G.M.; Vanoli, G.P. A new comprehensive approach for cost-optimal building design integrated with the multi-objective model predictive control of HVAC systems. Sustain. Cities Soc. 2017, 31, 136–150. [Google Scholar] [CrossRef]
- Ascione, F.; Bianco, N.; De Masi, R.F.; Perone, T.; Ruggiero, S.; Strangio, P.; Vanoli, G.P. Light and Heavy Energy Refurbishments of Mediterranean Offices. Part II: Cost-optimal Energy Renovation of an Institutional Building. Procedia Eng. 2017, 180, 1518–1530. [Google Scholar] [CrossRef]
- Ascione, F.; Bianco, N.; De Masi, R.F.; Mauro, G.M.; Vanoli, G.P. Resilience of robust cost-optimal energy retrofit of buildings to global warming: A multi-stage, multi-objective approach. Energy Build. 2017, 153, 150–167. [Google Scholar] [CrossRef]
- Ascione, F.; Bianco, N.; De Stasio, C.; Mauro, G.M.; Vanoli, G.P. CASA, cost-optimal analysis by multi-objective optimisation and artificial neural networks: A new framework for the robust assessment of cost-optimal energy retrofit, feasible for any building. Energy Build. 2017, 146, 200–219. [Google Scholar] [CrossRef]
- Ballarini, I.; Corrado, V.; Madonna, F.; Paduos, S.; Ravasio, F. Energy refurbishment of the Italian residential building stock: Energy and cost analysis through the application of the building typology. Energy Policy 2017, 105, 148–160. [Google Scholar] [CrossRef]
- Ferrara, M.; Fabrizio, E. Cost-optimal nZEBs in future climate scenarios. Energy Procedia 2017, 122, 877–882. [Google Scholar] [CrossRef]
- Hamdy, M.; Siren, K.; Attia, S. Impact of financial assumptions on the cost-optimality towards nearly zero energy buildings—A case study. Energy Build. 2017, 153, 421–438. [Google Scholar] [CrossRef]
- Pal, S.K.; Takano, A.; Alanne, K.; Palonen, M.; Siren, K. A multi-objective life cycle approach for optimal building design: A case study in Finnish context. J. Clean. Prod. 2017, 143, 1021–1035. [Google Scholar] [CrossRef]
- Loukaidou, K.; Michopoulos, A.; Zachariadis, T. Nearly-zero Energy Buildings: Cost-optimal Analysis of Building Envelope Characteristics. Procedia Environ. Sci. 2017, 38, 20–27. [Google Scholar] [CrossRef]
- Niemelä, T.; Kosonen, R.; Jokisalo, J. Cost-effectiveness of energy performance renovation measures in Finnish brick apartment buildings. Energy Build. 2017, 137, 60–75. [Google Scholar] [CrossRef]
- Niemelä, T.; Kosonen, R.; Jokisalo, J. Energy performance and environmental impact analysis of cost-optimal renovation solutions of large panel apartment buildings in Finland. Sustain. Cities Soc. 2017, 32, 9–30. [Google Scholar] [CrossRef]
- Sağlam, N.G.; Yilmaz, A.Z.; Becchio, C.; Corgnati, S.P. A comprehensive cost-optimal approach for energy retrofit of existing multi-family buildings: Application to apartment blocks in Turkey. Energy Build. 2017, 150, 224–238. [Google Scholar] [CrossRef]
- Thalfeldt, M.; Pikas, E.; Kurnitski, J.; Voll, H. Window model and 5 year price data sensitivity to cost-effective façade solutions for office buildings in Estonia. Energy 2017, 135, 685–697. [Google Scholar] [CrossRef]
- Vallée, J.-C.; Ferrara, M.; Astolfi, A.; Fabrizio, E. Trade-off between sound insulation performance and cost-optimality in a residential nZEB. Energy Procedia 2017, 140, 57–66. [Google Scholar] [CrossRef]
- Ferrara, M.; Fabrizio, E.; Virgone, J.; Filippi, M. Appraising the Effect of the Primary Systems on the Cost-optimal Design of nZEB: A Case Study in Two Different Climates. Energy Procedia 2015, 78, 2028–2033. [Google Scholar] [CrossRef]
- Ferrara, M.; Dabbene, F.; Fabrizio, E. Optimization algorithm supporting the cost-optimal analysis: The role of PSO. In Proceedings of the 15th International Conference of IBPSA—Building Simulation 2017 (BS 2017), San Francisco, CA, USA, 7–9 August 2017. [Google Scholar]
- Ferrara, M.; Sirombo, E.; Fabrizio, E. Energy-optimized vs. cost optimized design of high-performing dwellings: The case of multi-family buildings. Sci. Technol. Built Environ. 2018, 24, 513–528. [Google Scholar] [CrossRef]
- Ferrara, M.; Sirombo, E.; Fabrizio, E. Automated optimization for the integrated design process: The energy, thermal and visual comfort nexus. Energy Build. 2018, 168, 413–427. [Google Scholar] [CrossRef]
- Amaran, S.; Sahinidis, N.V.; Sharda, B.; Bury, S.J. Simulation optimization: A review of algorithms and applications. Ann. Oper. Res. 2016, 240, 351–380. [Google Scholar] [CrossRef]
- Ferrara, M.; Filippi, M.; Sirombo, E.; Cravino, V. A Simulation-Based Optimization Method for the Integrative Design of the Building Envelope. Energy Procedia 2015, 78, 2608–2613. [Google Scholar] [CrossRef]
- Zangheri, P.; Armani, R.; Pietrobon, M.; Pagliano, L. Identification of cost-optimal and NZEB refurbishment levels for representative climates and building typologies across Europe. Energy Effic. 2018, 11, 337–369. [Google Scholar] [CrossRef]
- D’Agostino, D.; Parker, D. A framework for the cost-optimal design of nearly zero energy buildings (NZEBs) in representative climates across Europe. Energy 2018, 149, 814–829. [Google Scholar] [CrossRef]
Figure 1.
The multi-step methodology for COA applications.
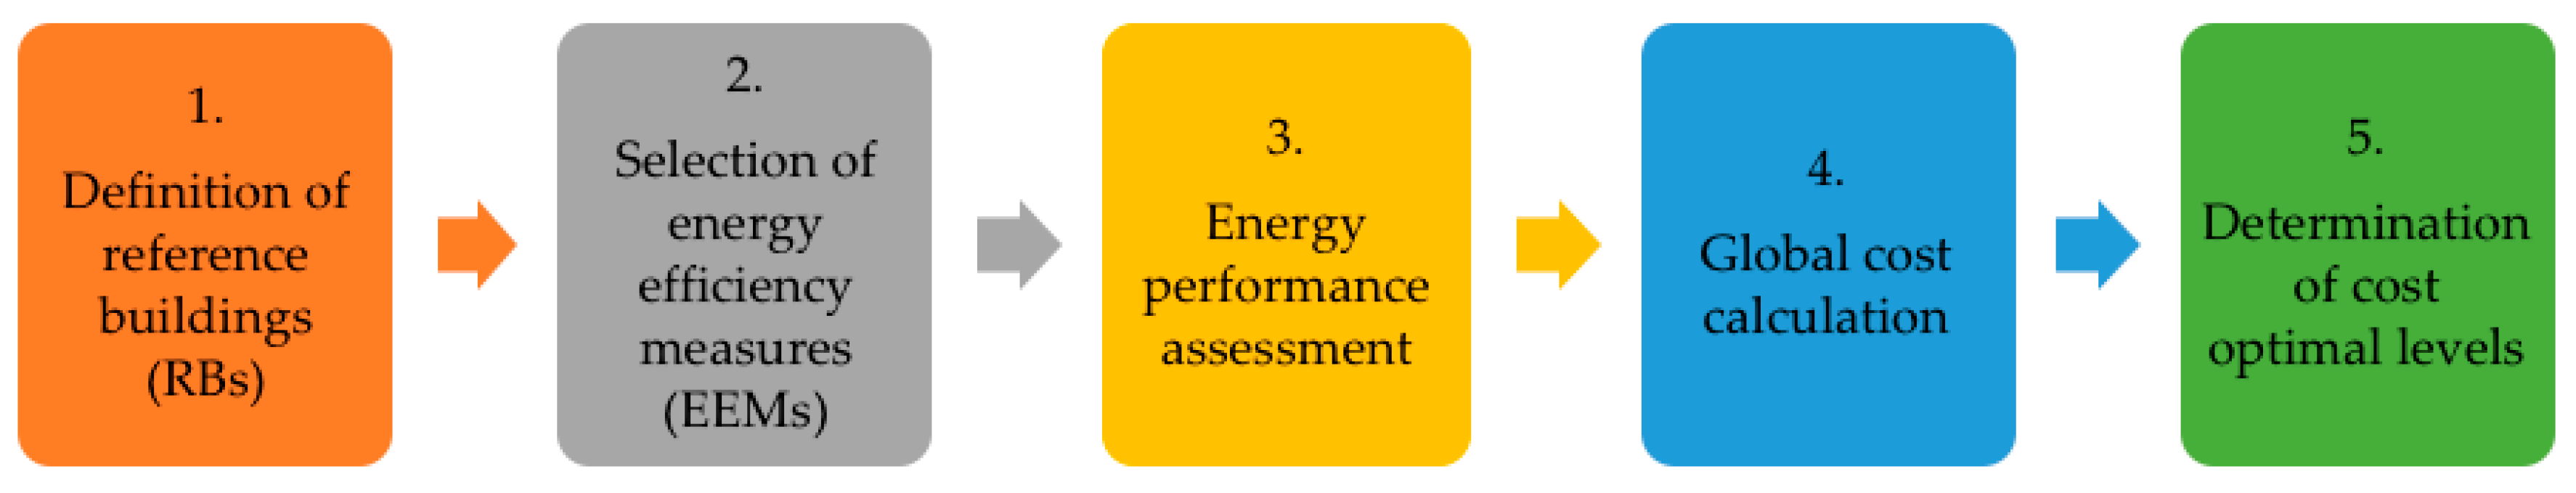
Figure 2.
Economic optimum and cost curve of different packages adapted from [22].
Figure 2.
Economic optimum and cost curve of different packages adapted from [22].
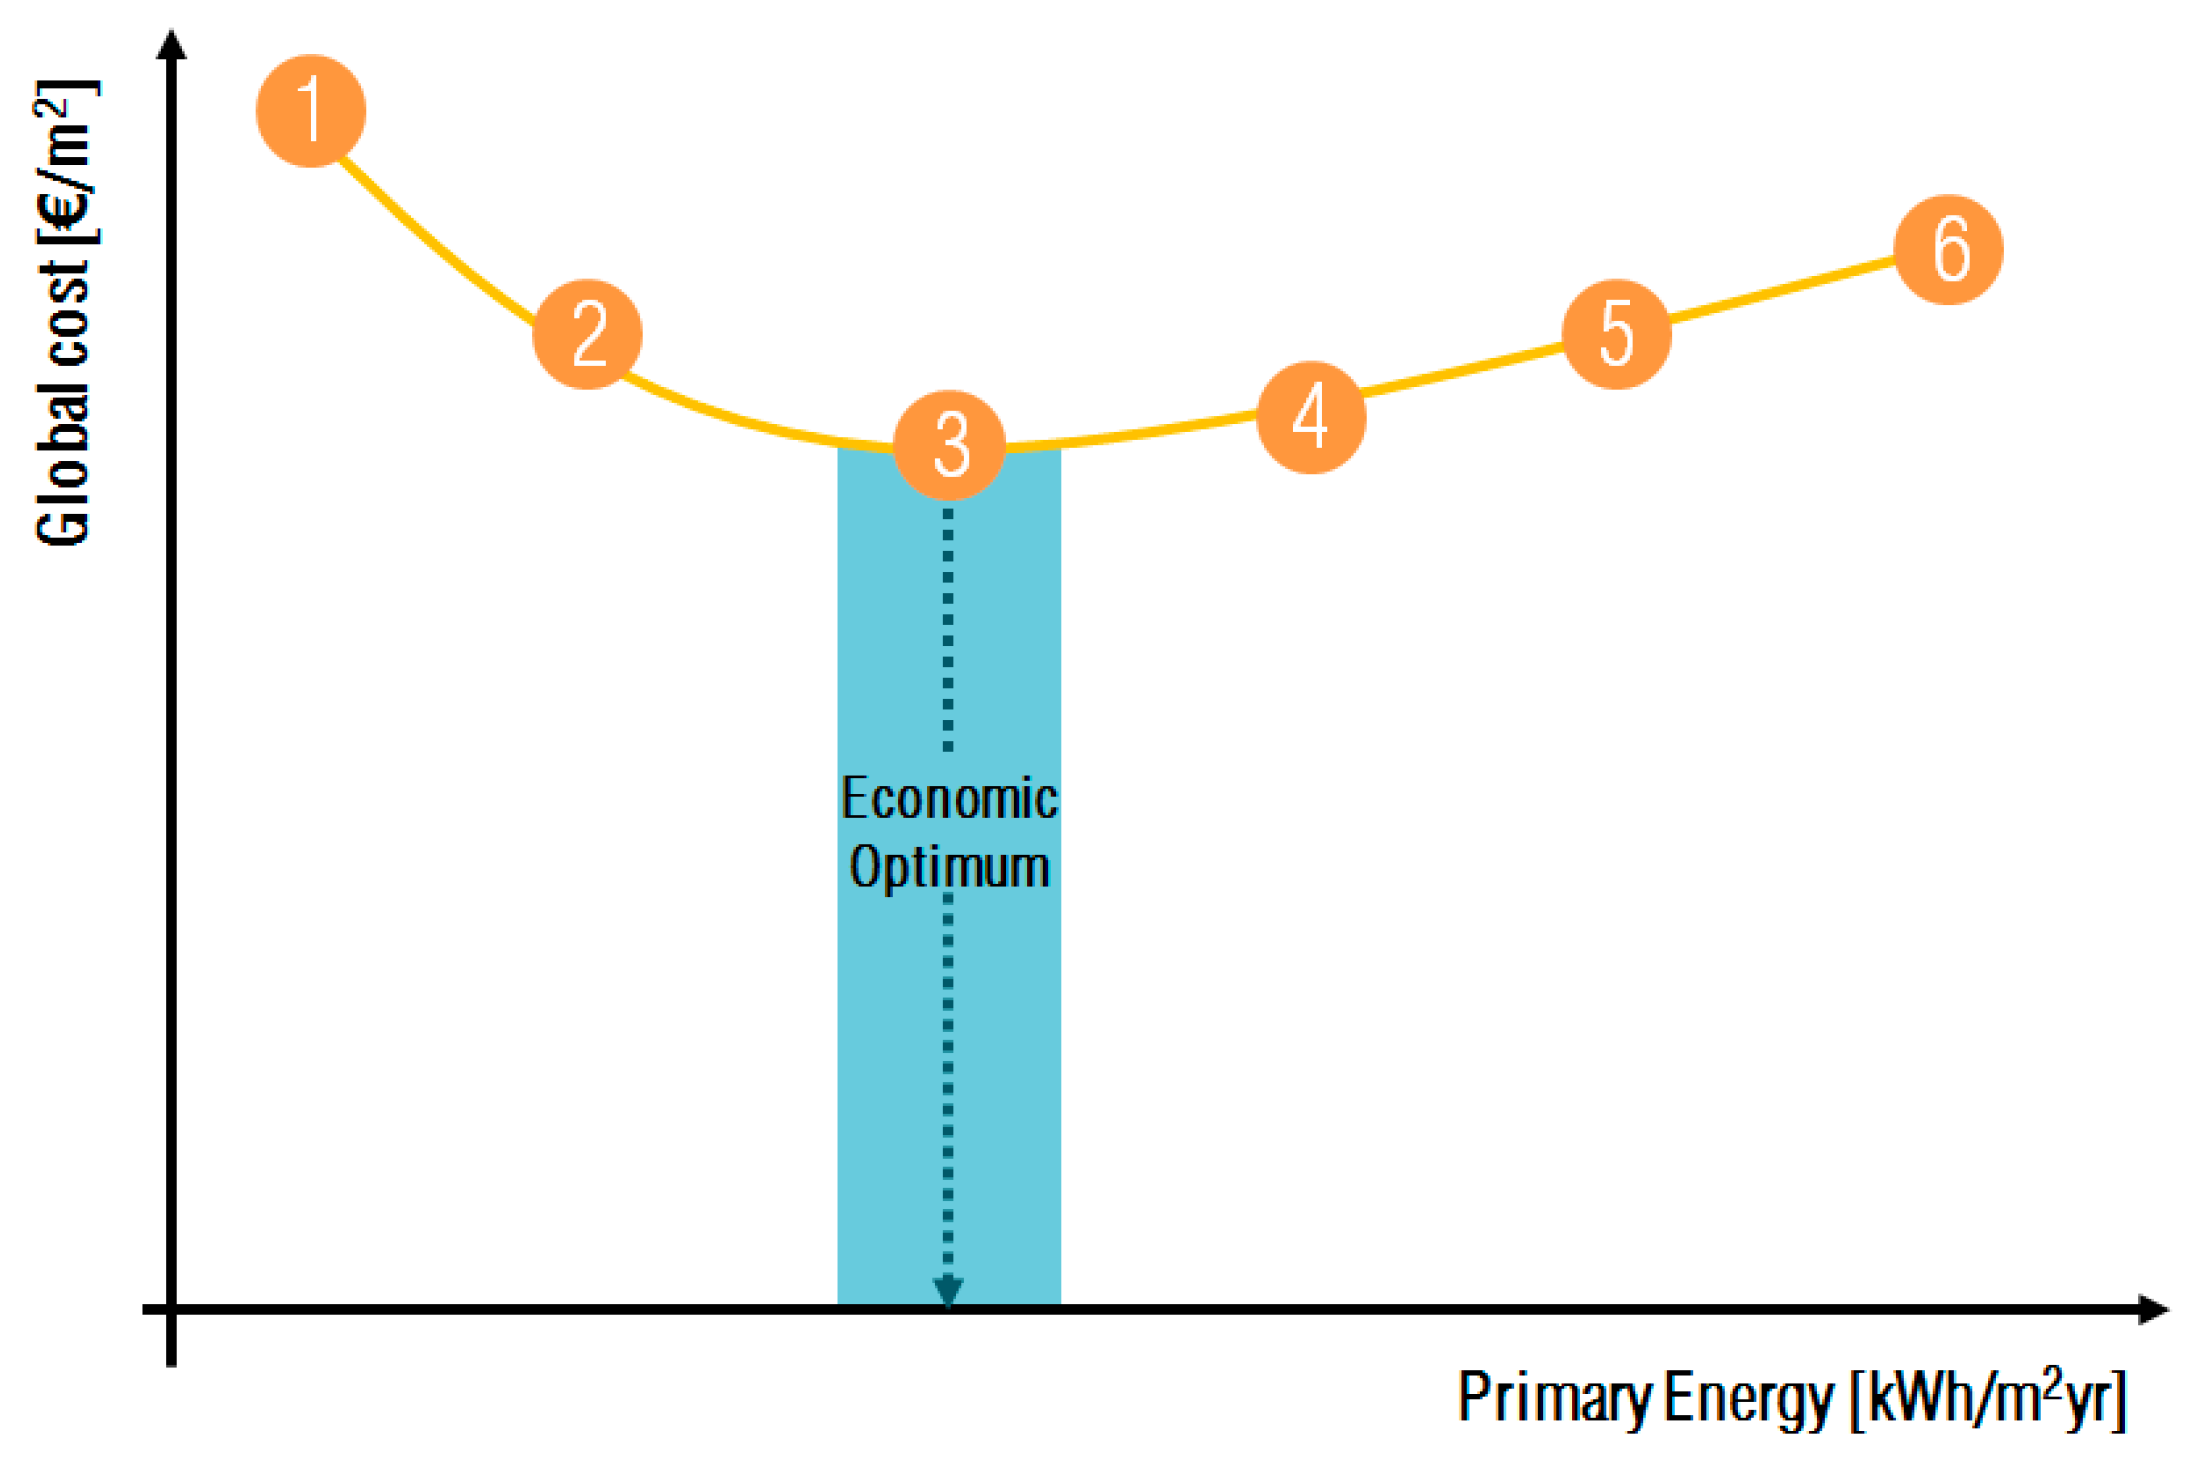
Figure 3.
Energy, environmental, and financial gaps in cost-optimal calculations.
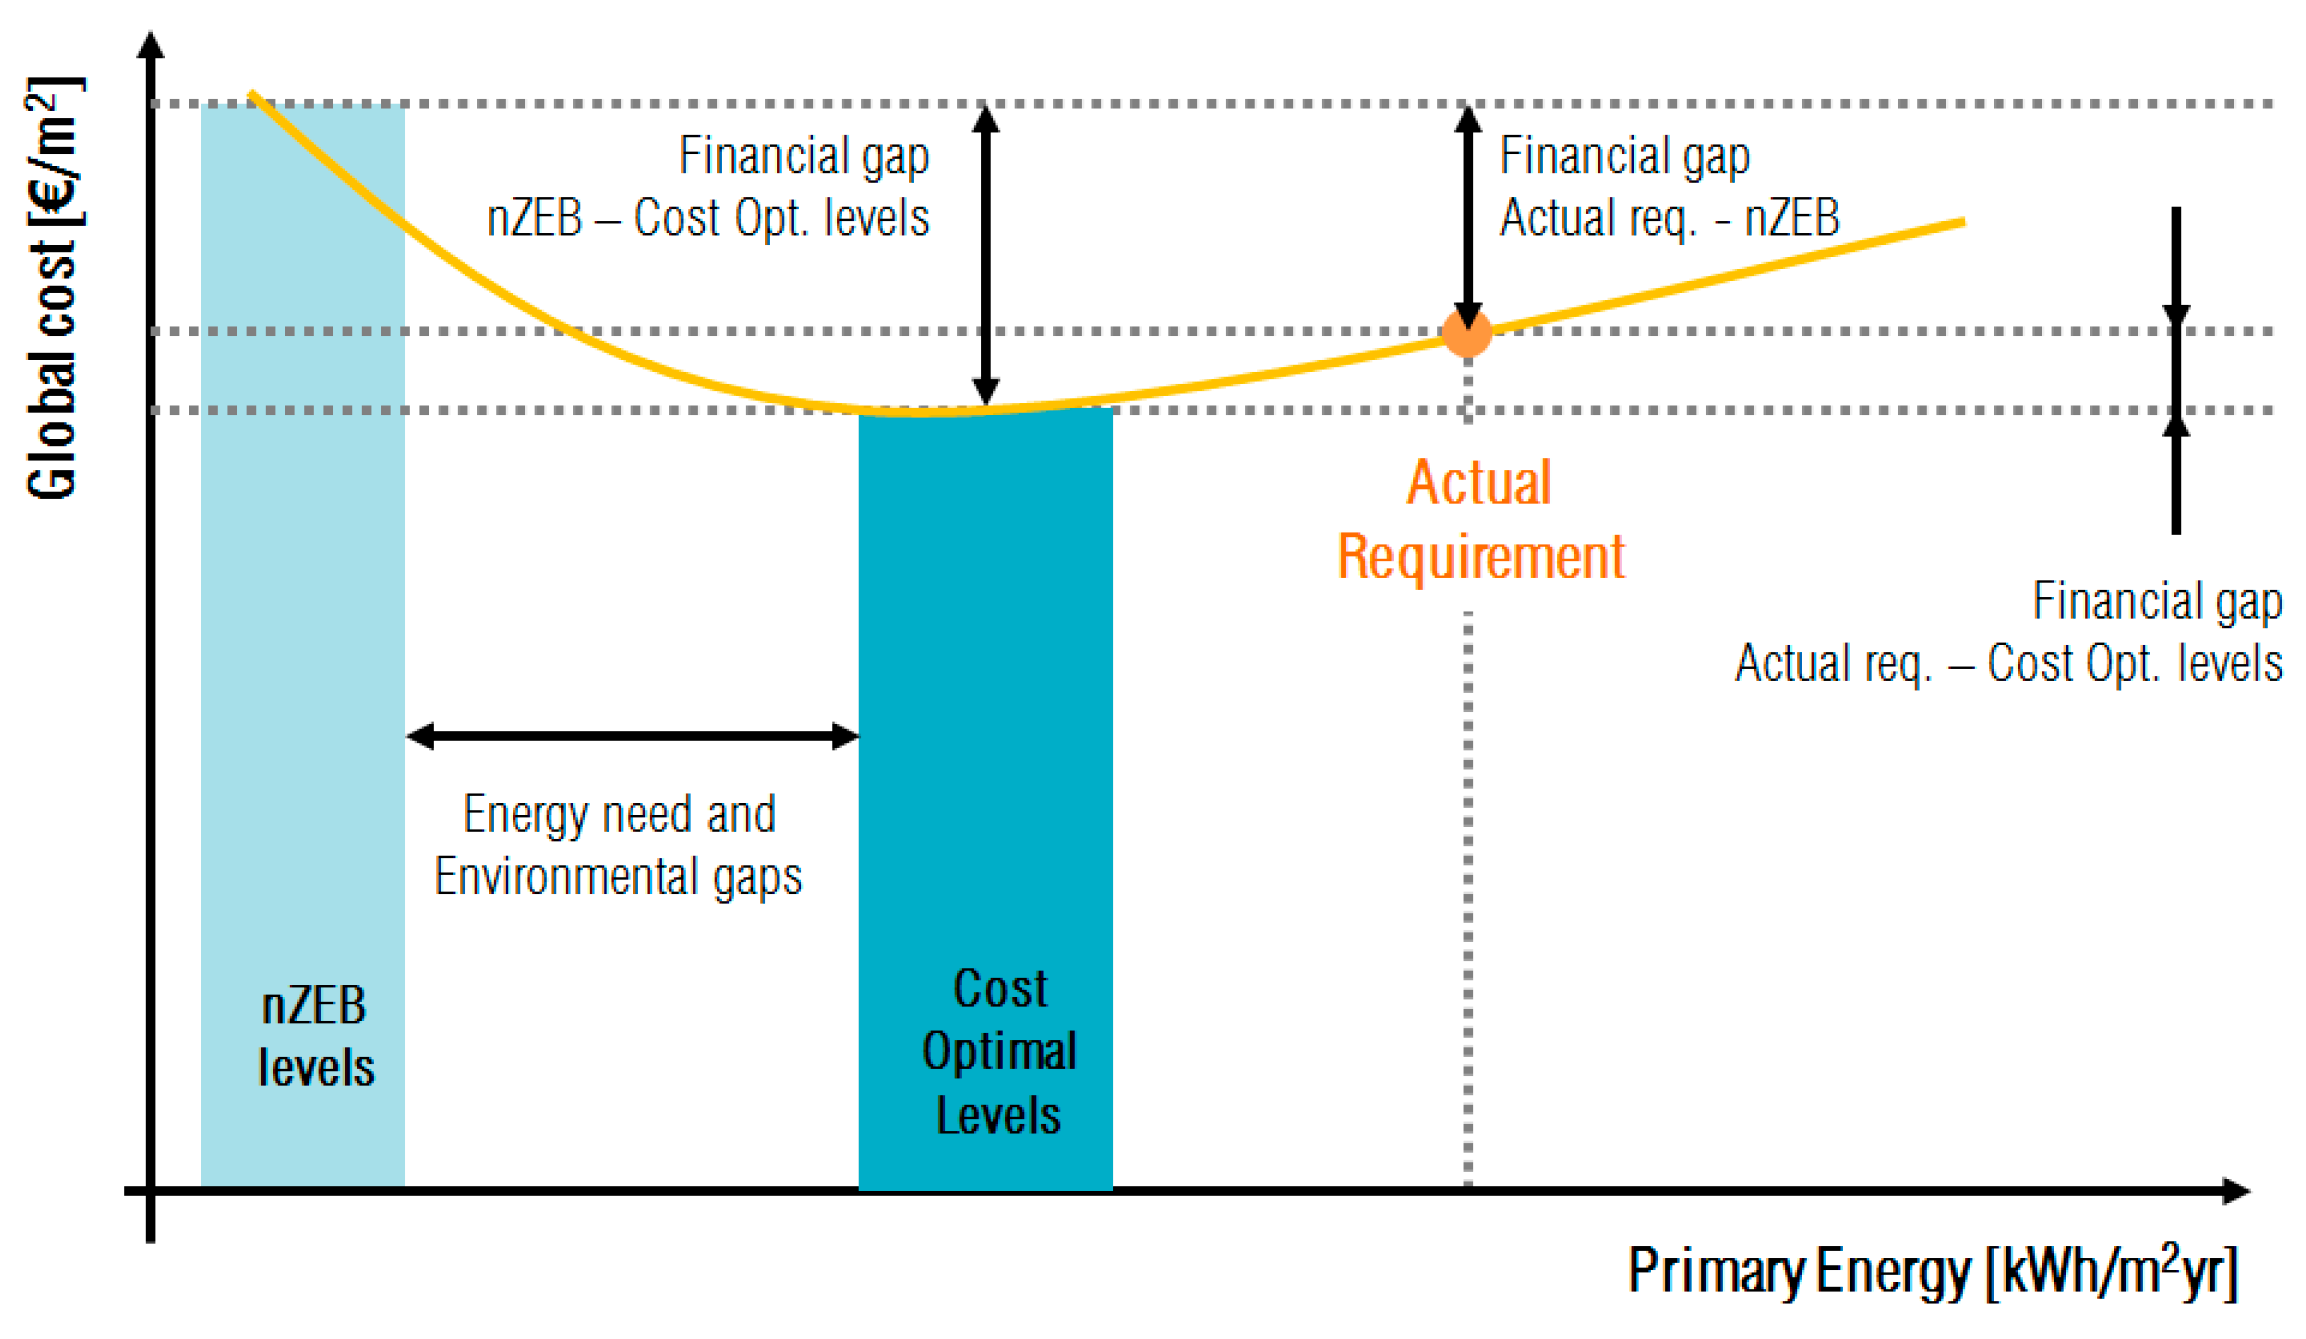
Figure 4.
Example of cost calculations of different packages [17].
Figure 4.
Example of cost calculations of different packages [17].
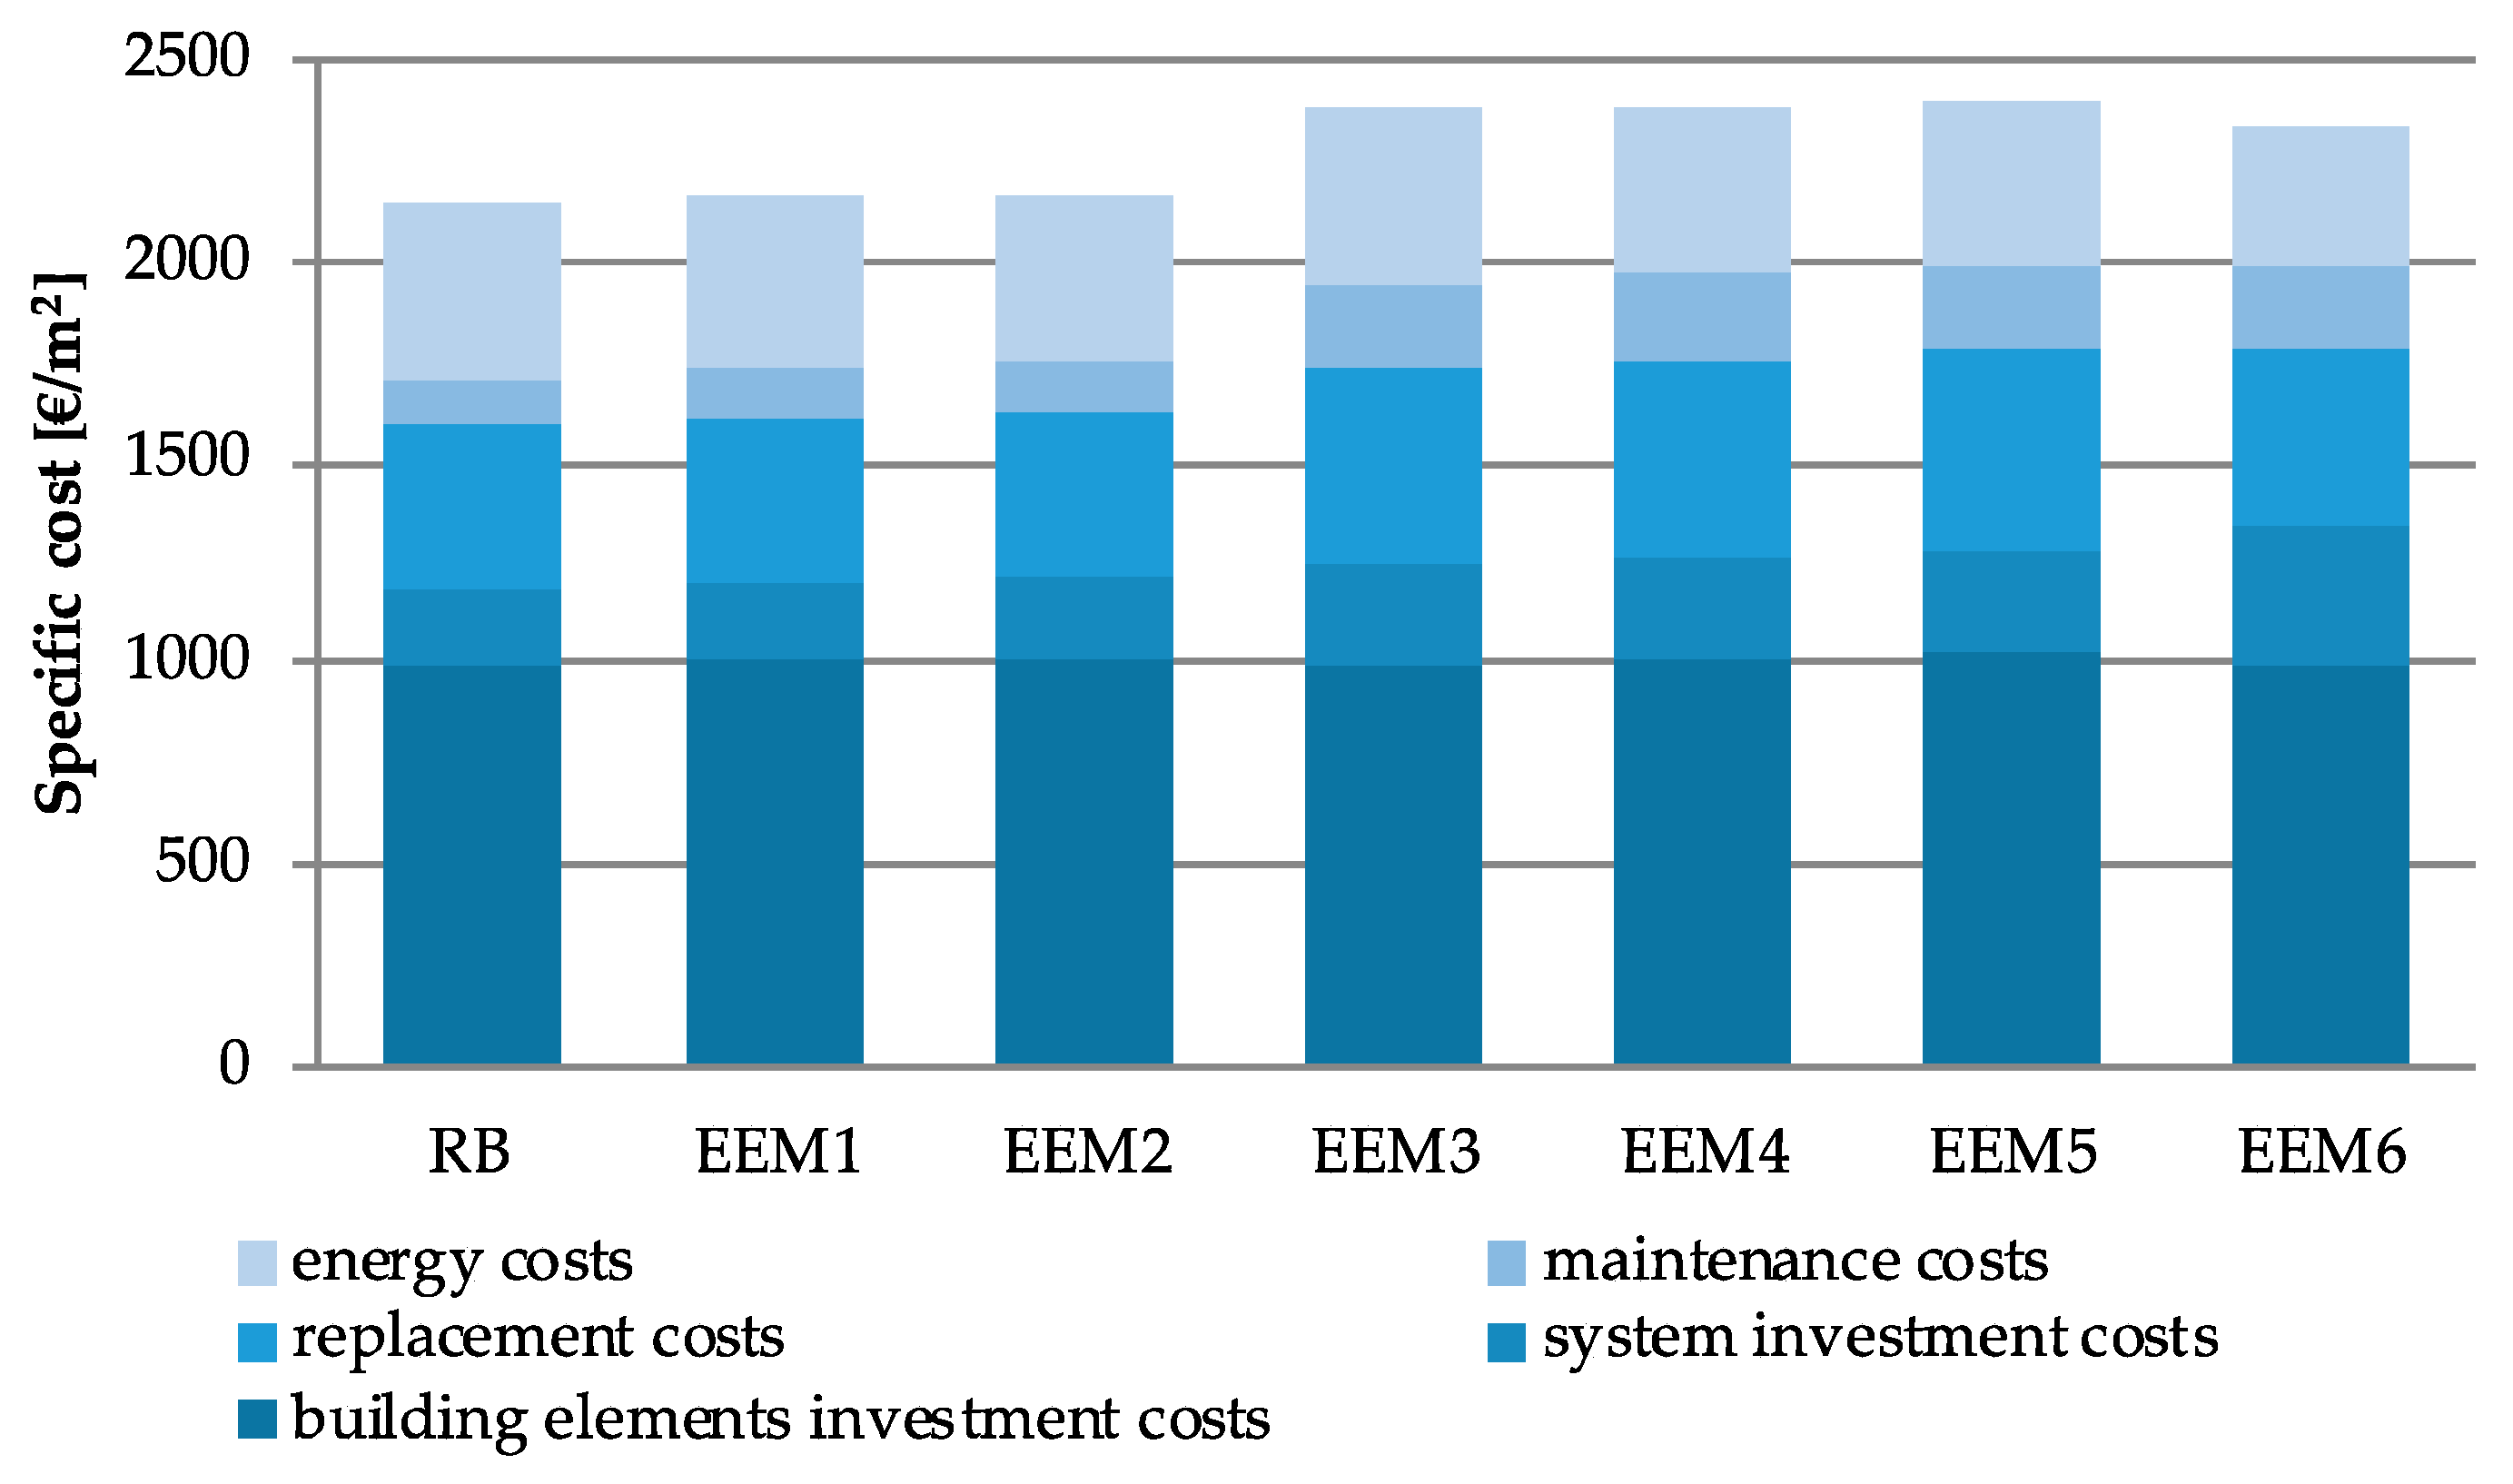
Figure 5.
Reference buildings in cost-optimal studies by countries.
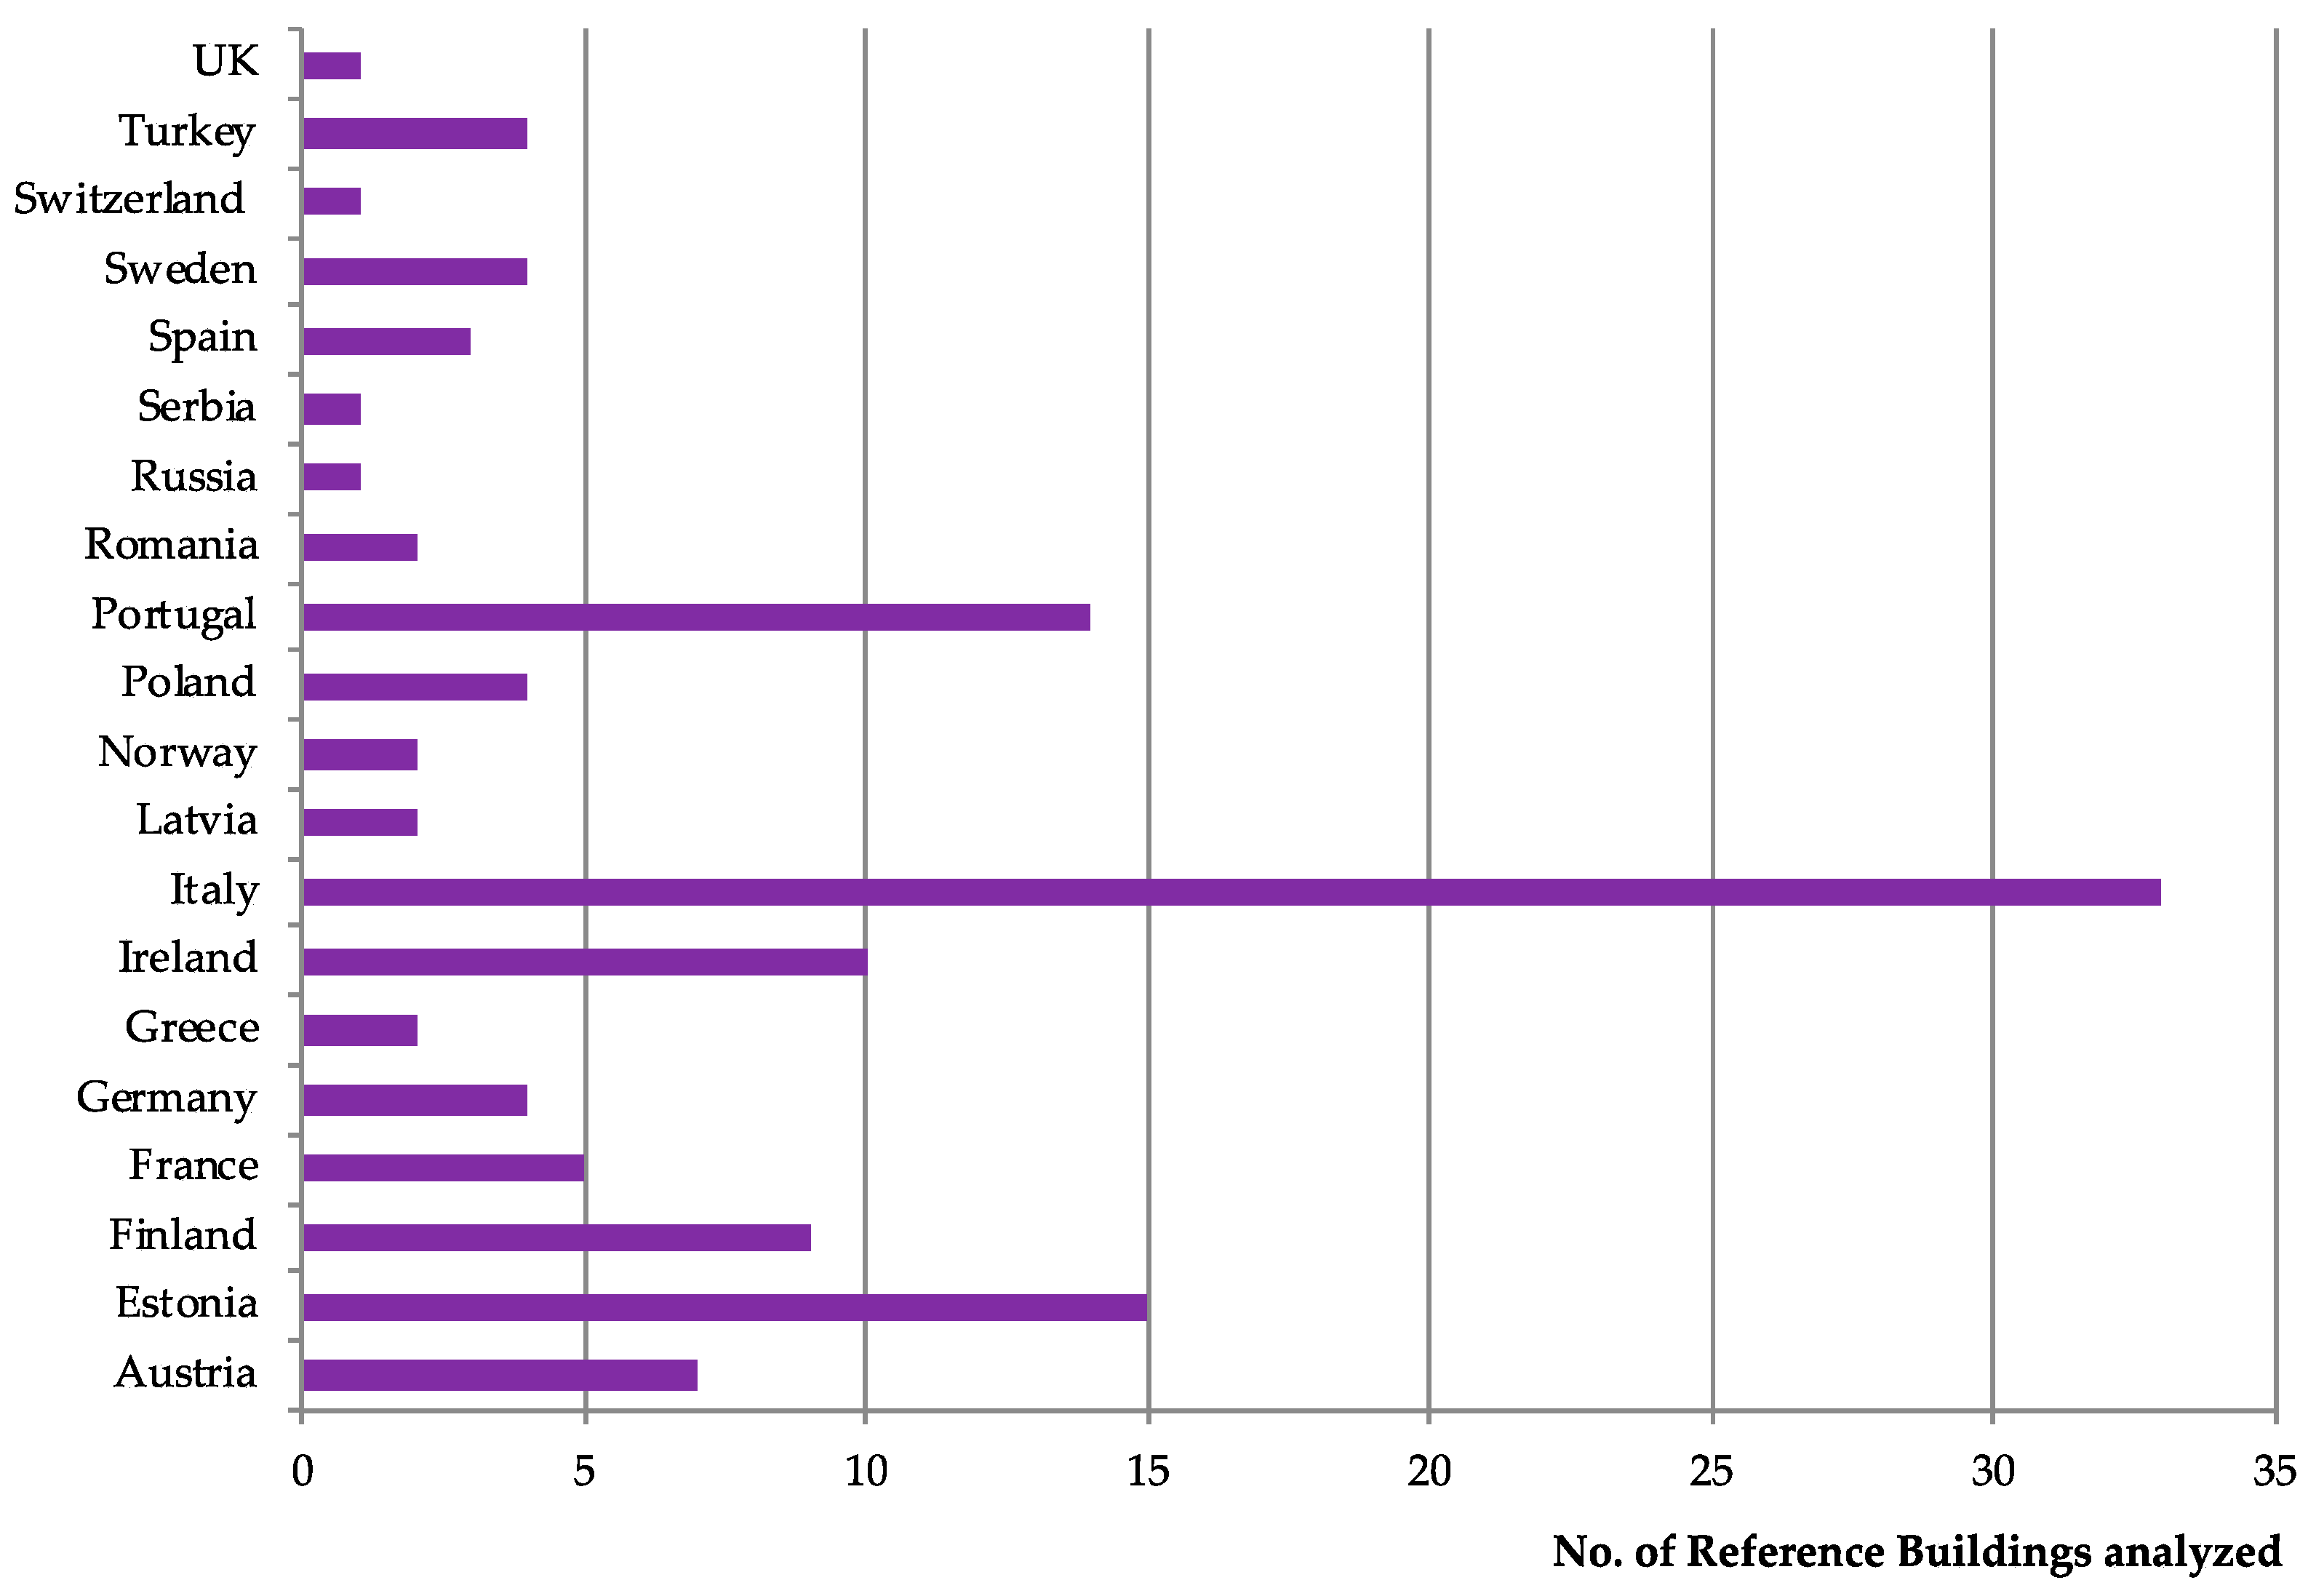
Figure 6.
Cost-optimal studies by publication year.

Figure 7.
Cost-optimal studies by publication type. (Legend: APEN = Applied Energy; ATE = Applied thermal Engineering; AUTCON = Automation in Construction; BUILD = Buildings BUILD_R&I = Building Research & Information; CONFER = International Conference Proceeding; EN_POL = Energy Policy; EN_PRO = Energy Procedia; ENB = Energy and Buildings; ENER = Energy; ENES=Energies; JBE = Journal of Building Engineering; JCP = Journal of Cleaner Production; PROC_ENG = Procedia Engineering; PROC_ENV = Proceedings Environmental Science; PROC_TECH = Procedia Technology; REN = Renewable Energy; REHVA_J = Rehva Journal; SCS = Sustainable Cities and Society; SDAR = Journal of Sustainable Design & Applied Research; SEMSC = Solar Energy Materials and Solar Cells; SEPM = International Journal of Sustainable Energy Planning and Management; STBE = Science and Technology for the Built Environment; STUD = International Journal of Sustainable Technology and Urban Development).
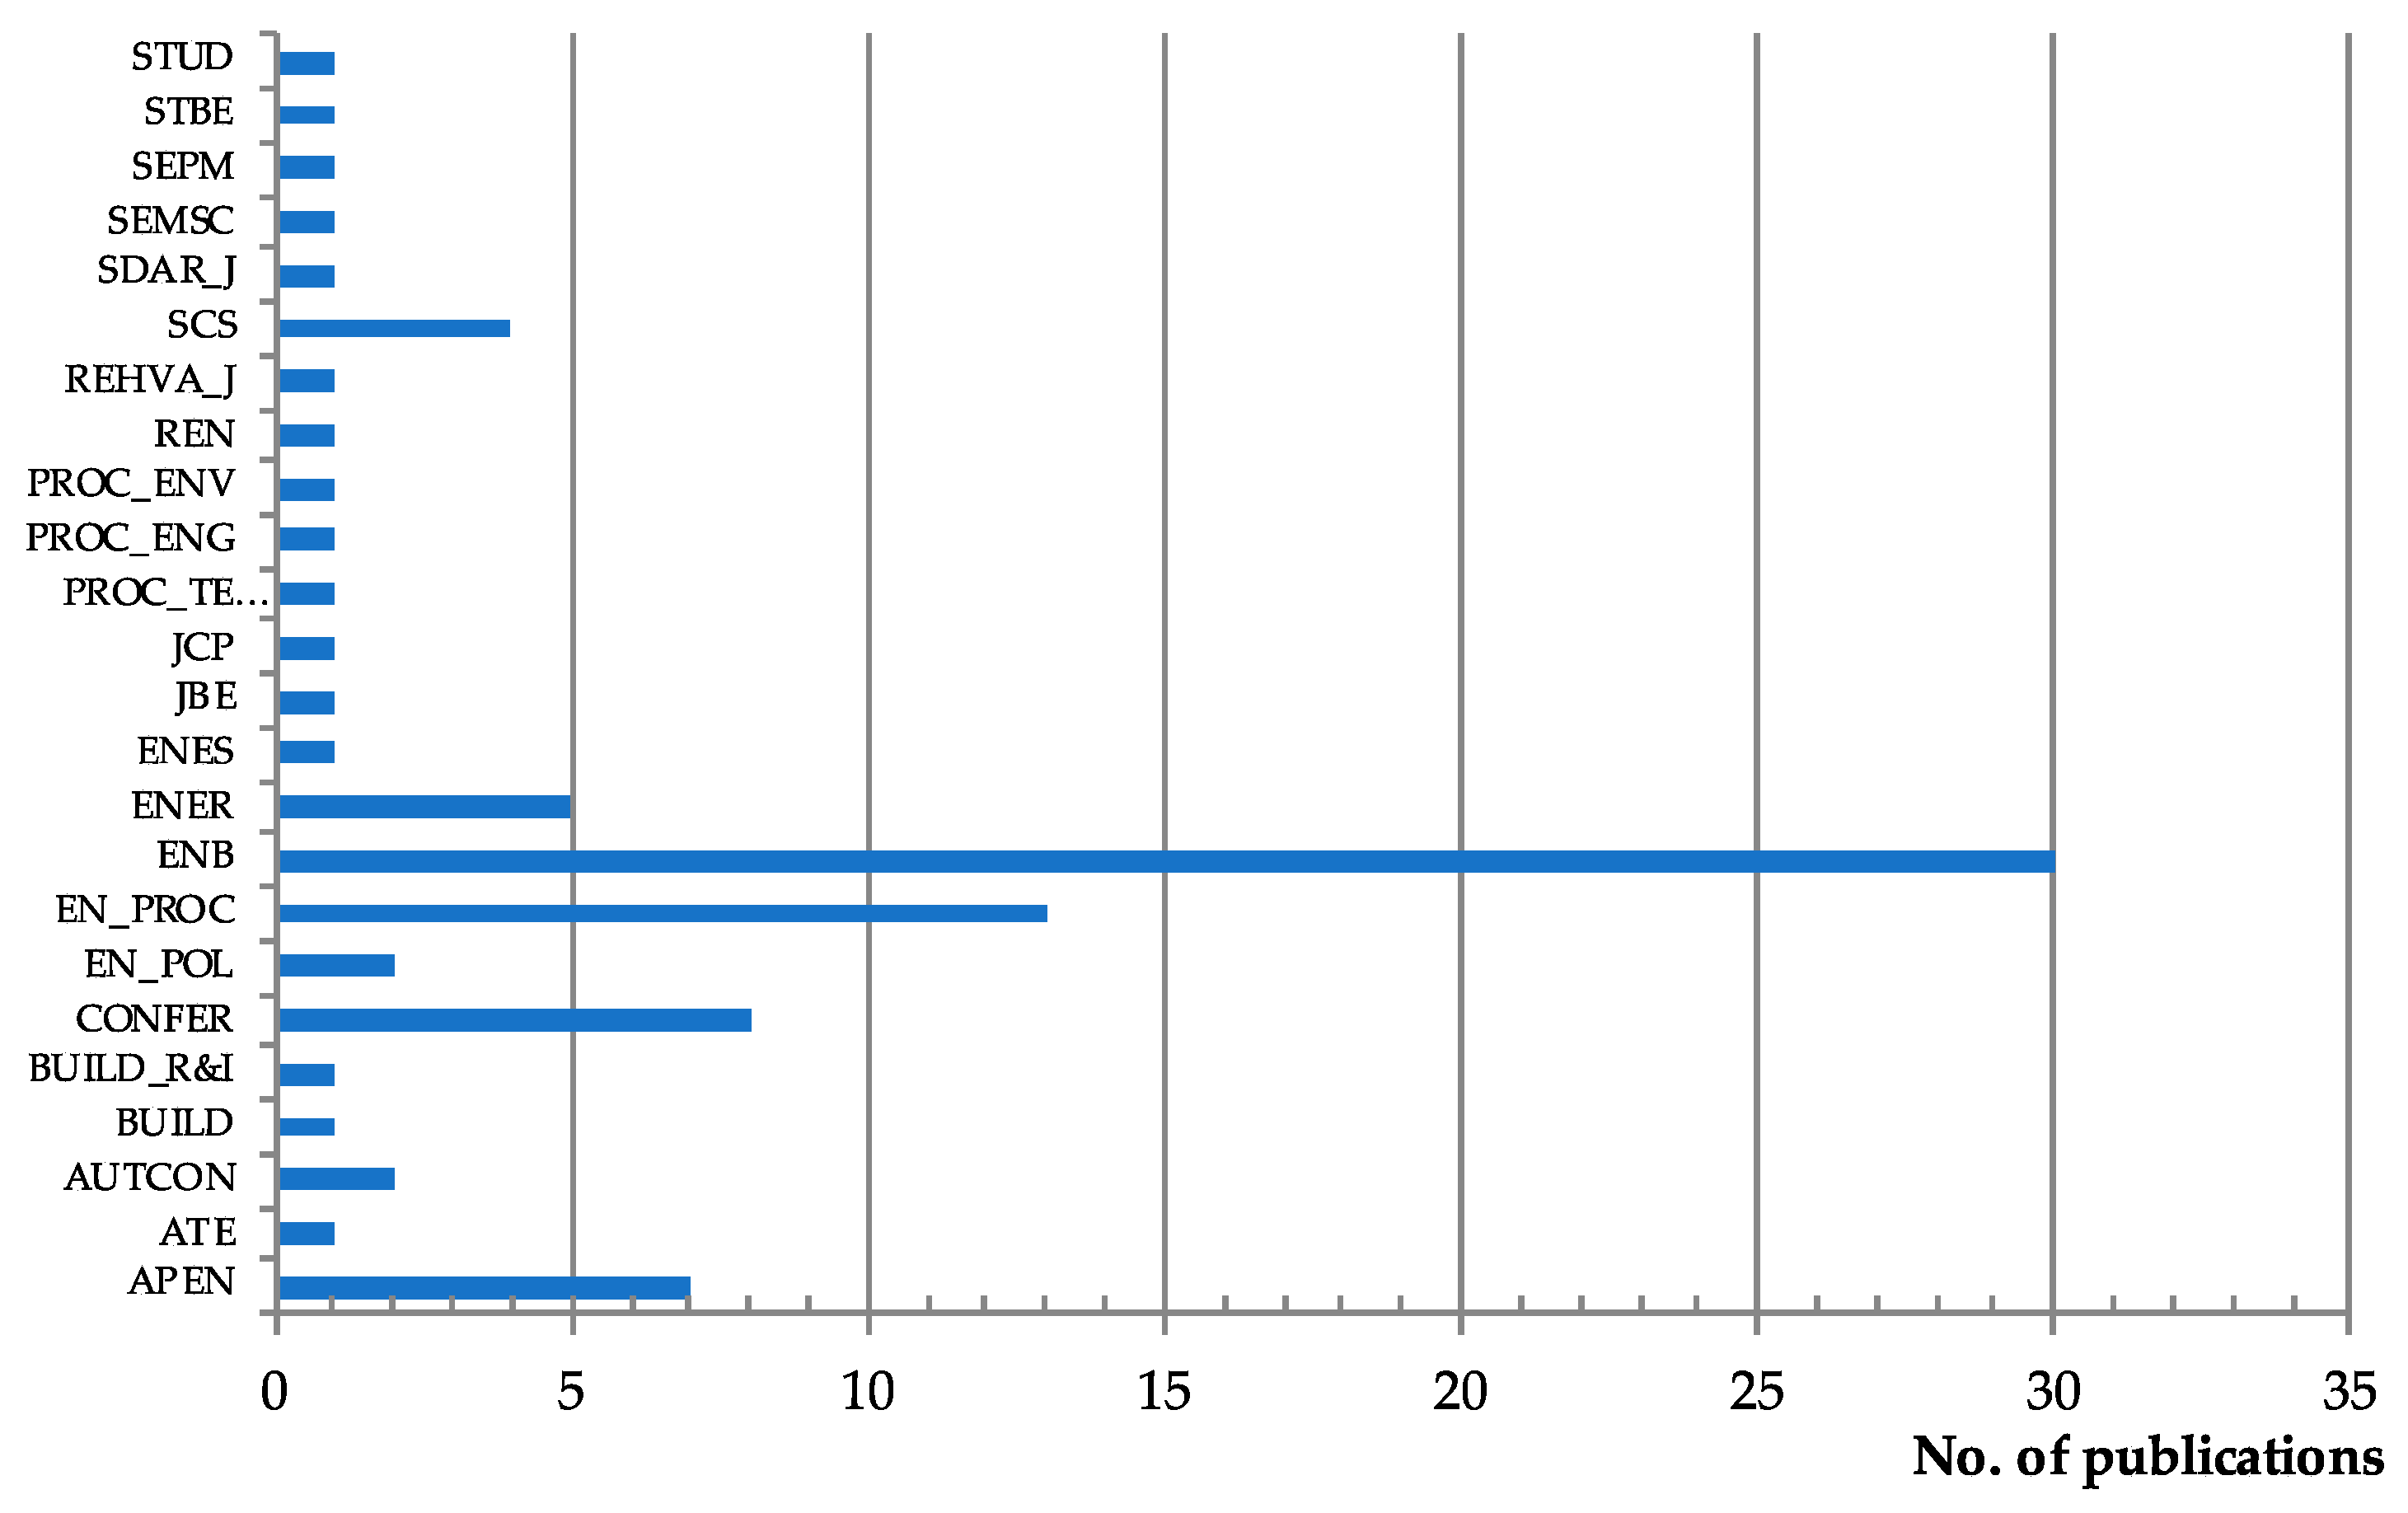
Figure 8.
Reference buildings analyzed by building typology.

Figure 9.
Reference buildings analyzed by building construction type.

Figure 10.
Methods for EEMs selection: manual (M) vs. automated (A) approach. Evolution of number of papers using the two approaches in the studied period (2010–2017).
Figure 10.
Methods for EEMs selection: manual (M) vs. automated (A) approach. Evolution of number of papers using the two approaches in the studied period (2010–2017).

Figure 11.
Methods for EEMs selection: manual (M) vs. automated (A) approach. Repartition of the analyzed papers according to the tool used.
Figure 11.
Methods for EEMs selection: manual (M) vs. automated (A) approach. Repartition of the analyzed papers according to the tool used.
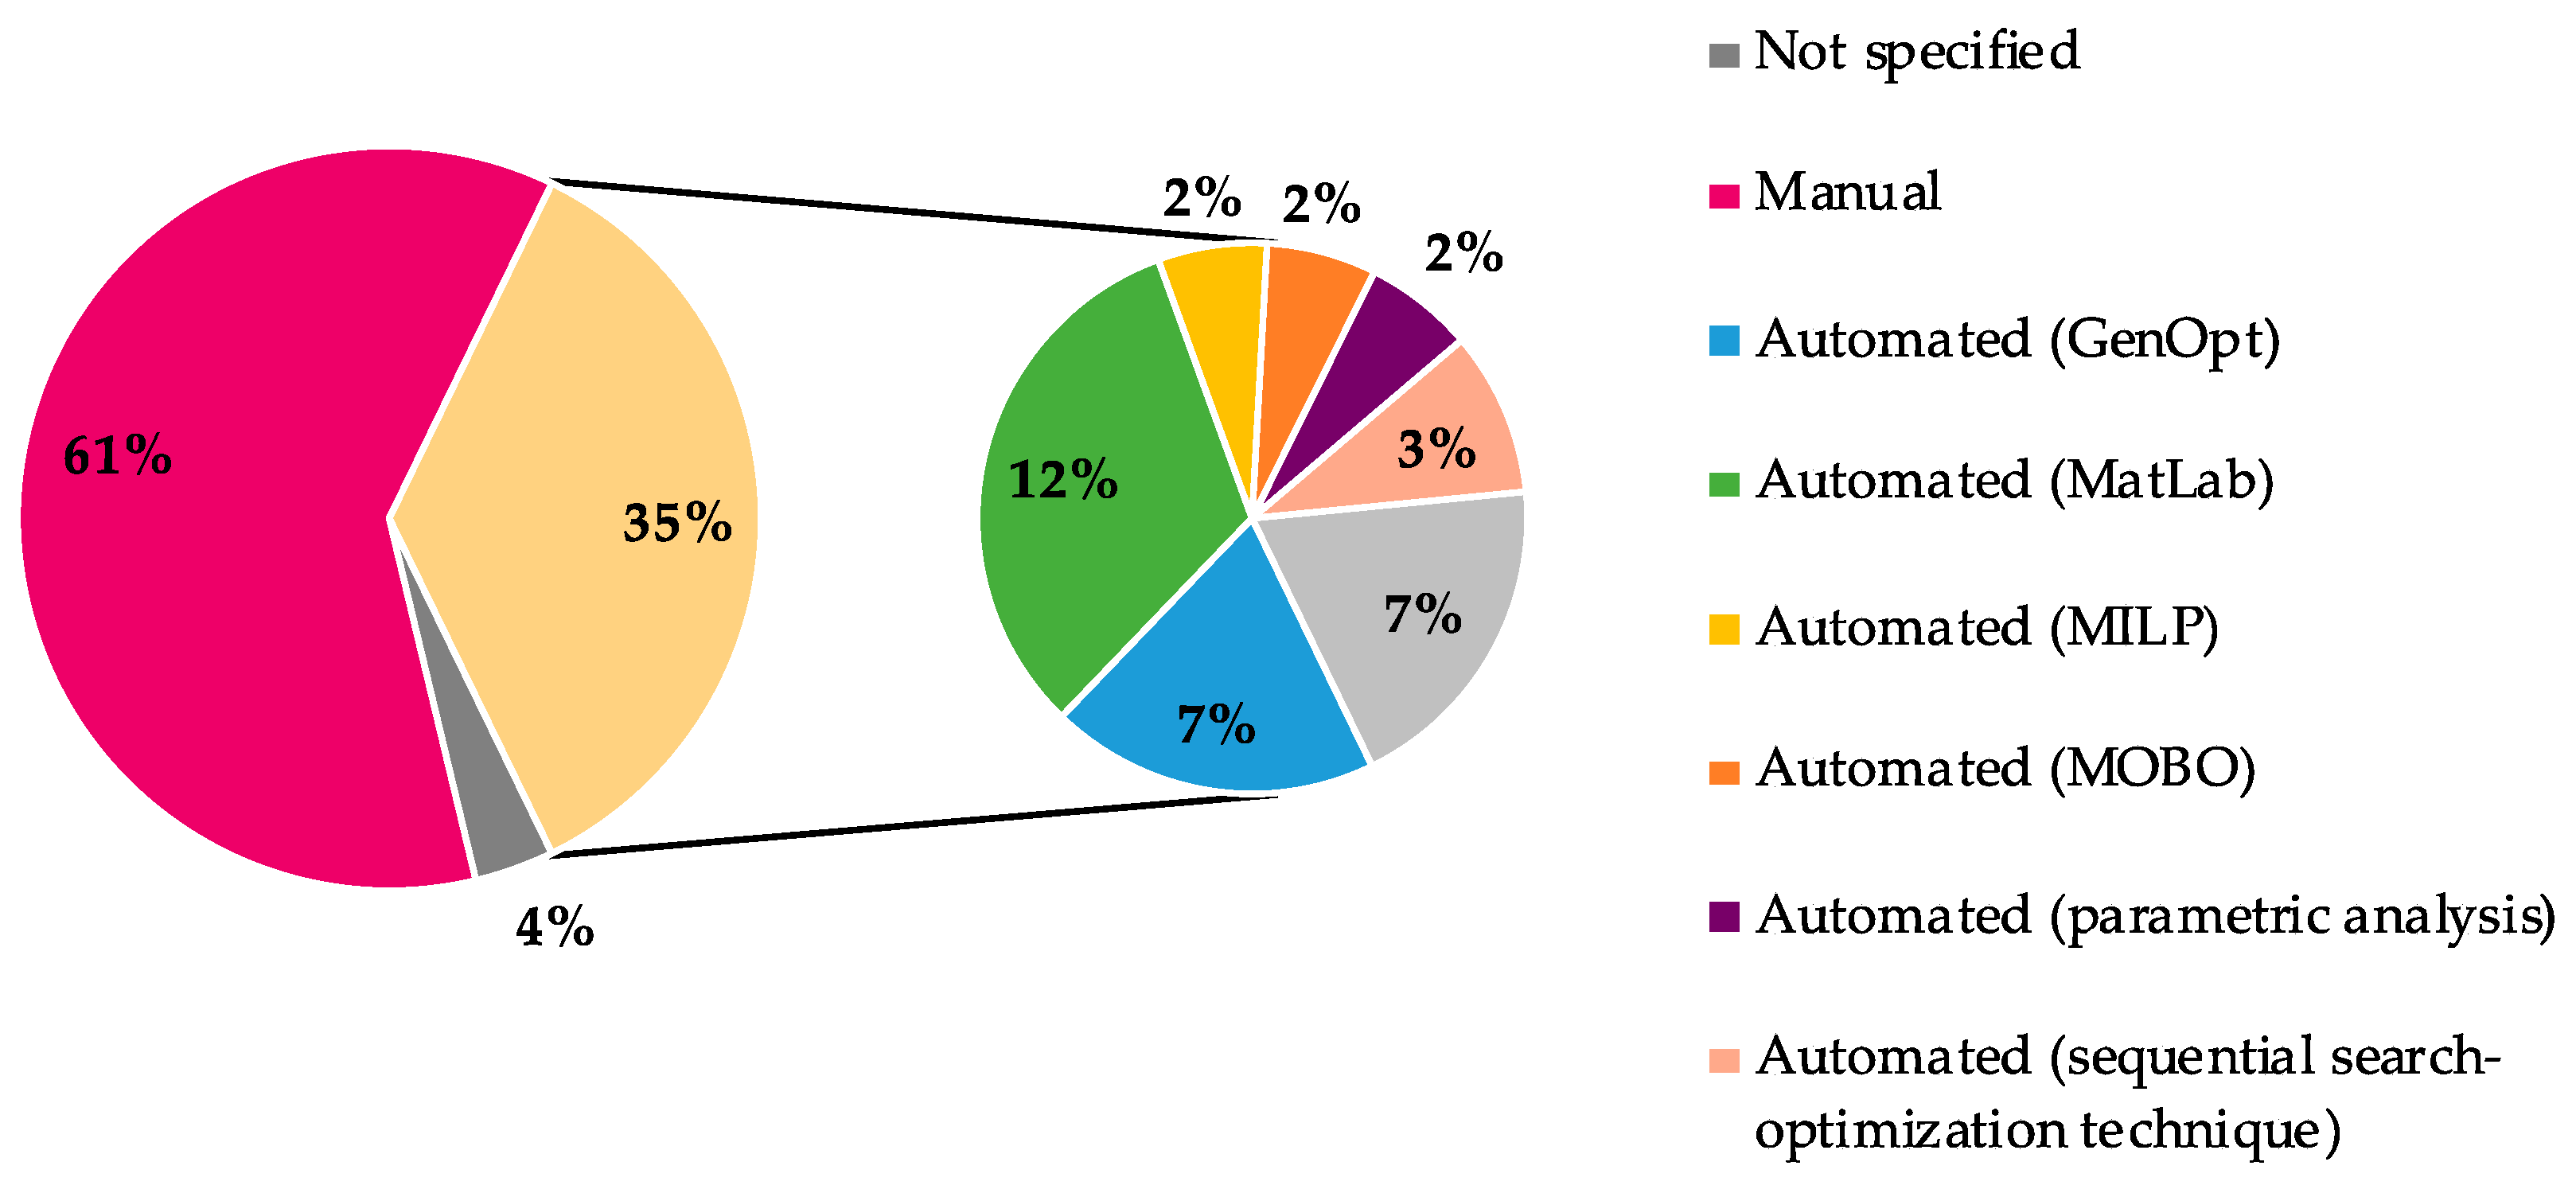
Figure 12.
Methods for energy performance calculation: simplified (S) vs. dynamic (D). Evolution of number of papers using the two approaches in the studied period (2010–2017).
Figure 12.
Methods for energy performance calculation: simplified (S) vs. dynamic (D). Evolution of number of papers using the two approaches in the studied period (2010–2017).

Figure 13.
Methods for energy performance calculation: simplified (S) vs. dynamic (D). Repartition of the analyzed papers according to the tool used.
Figure 13.
Methods for energy performance calculation: simplified (S) vs. dynamic (D). Repartition of the analyzed papers according to the tool used.
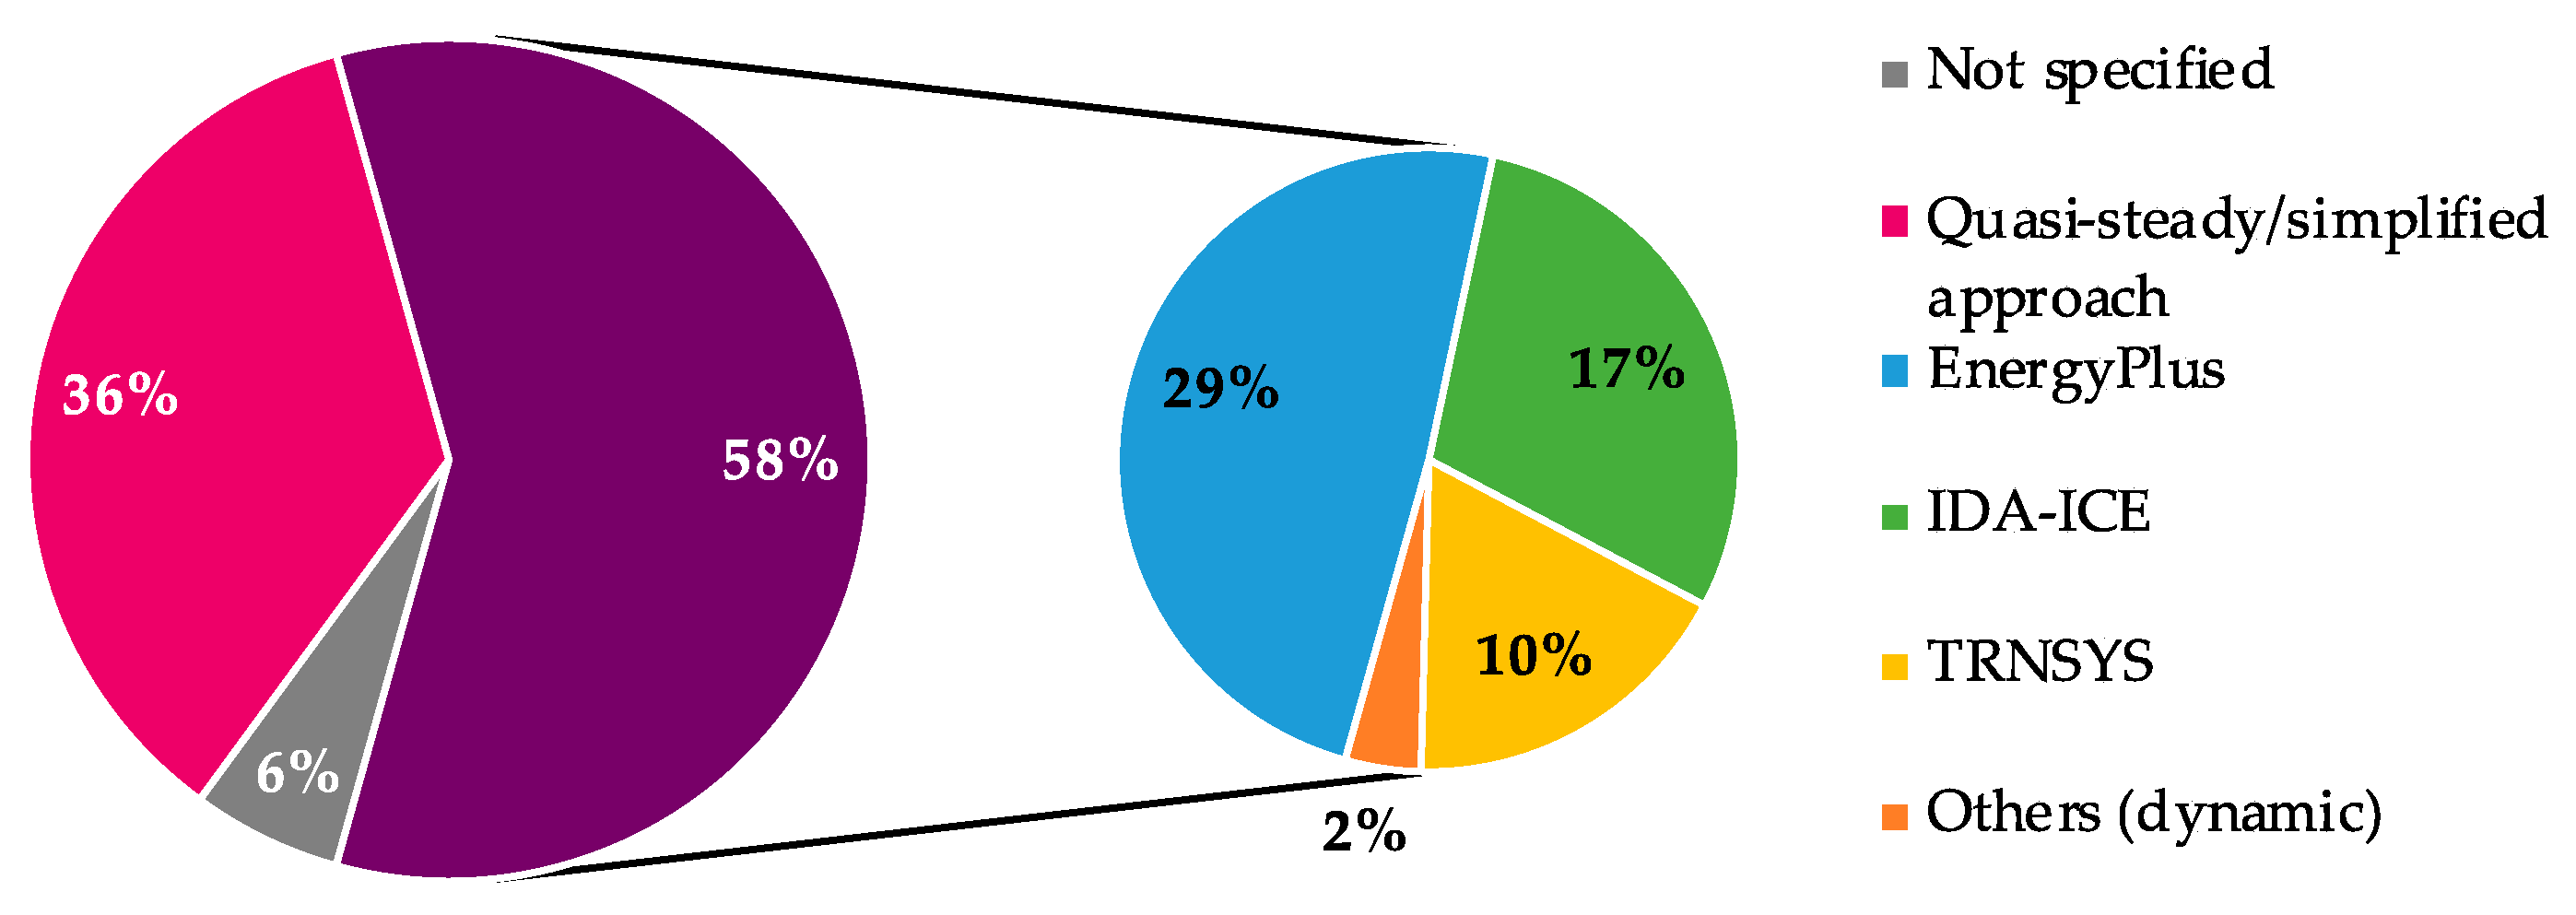
Figure 14.
Evolution of the frequency of the used approach for the analyzed cost-optimal studies: simplified EP assessment with EEMs manual selection (S-M); dynamic simulation with manual EEMs selection (D-M); simplified EP assessment with automated EEMs selection (S-A); dynamic simulation with automated EEMs selection (D-A).

Figure 15.
Approach for cost-optimal studies as a function of the number of EEMs packages.
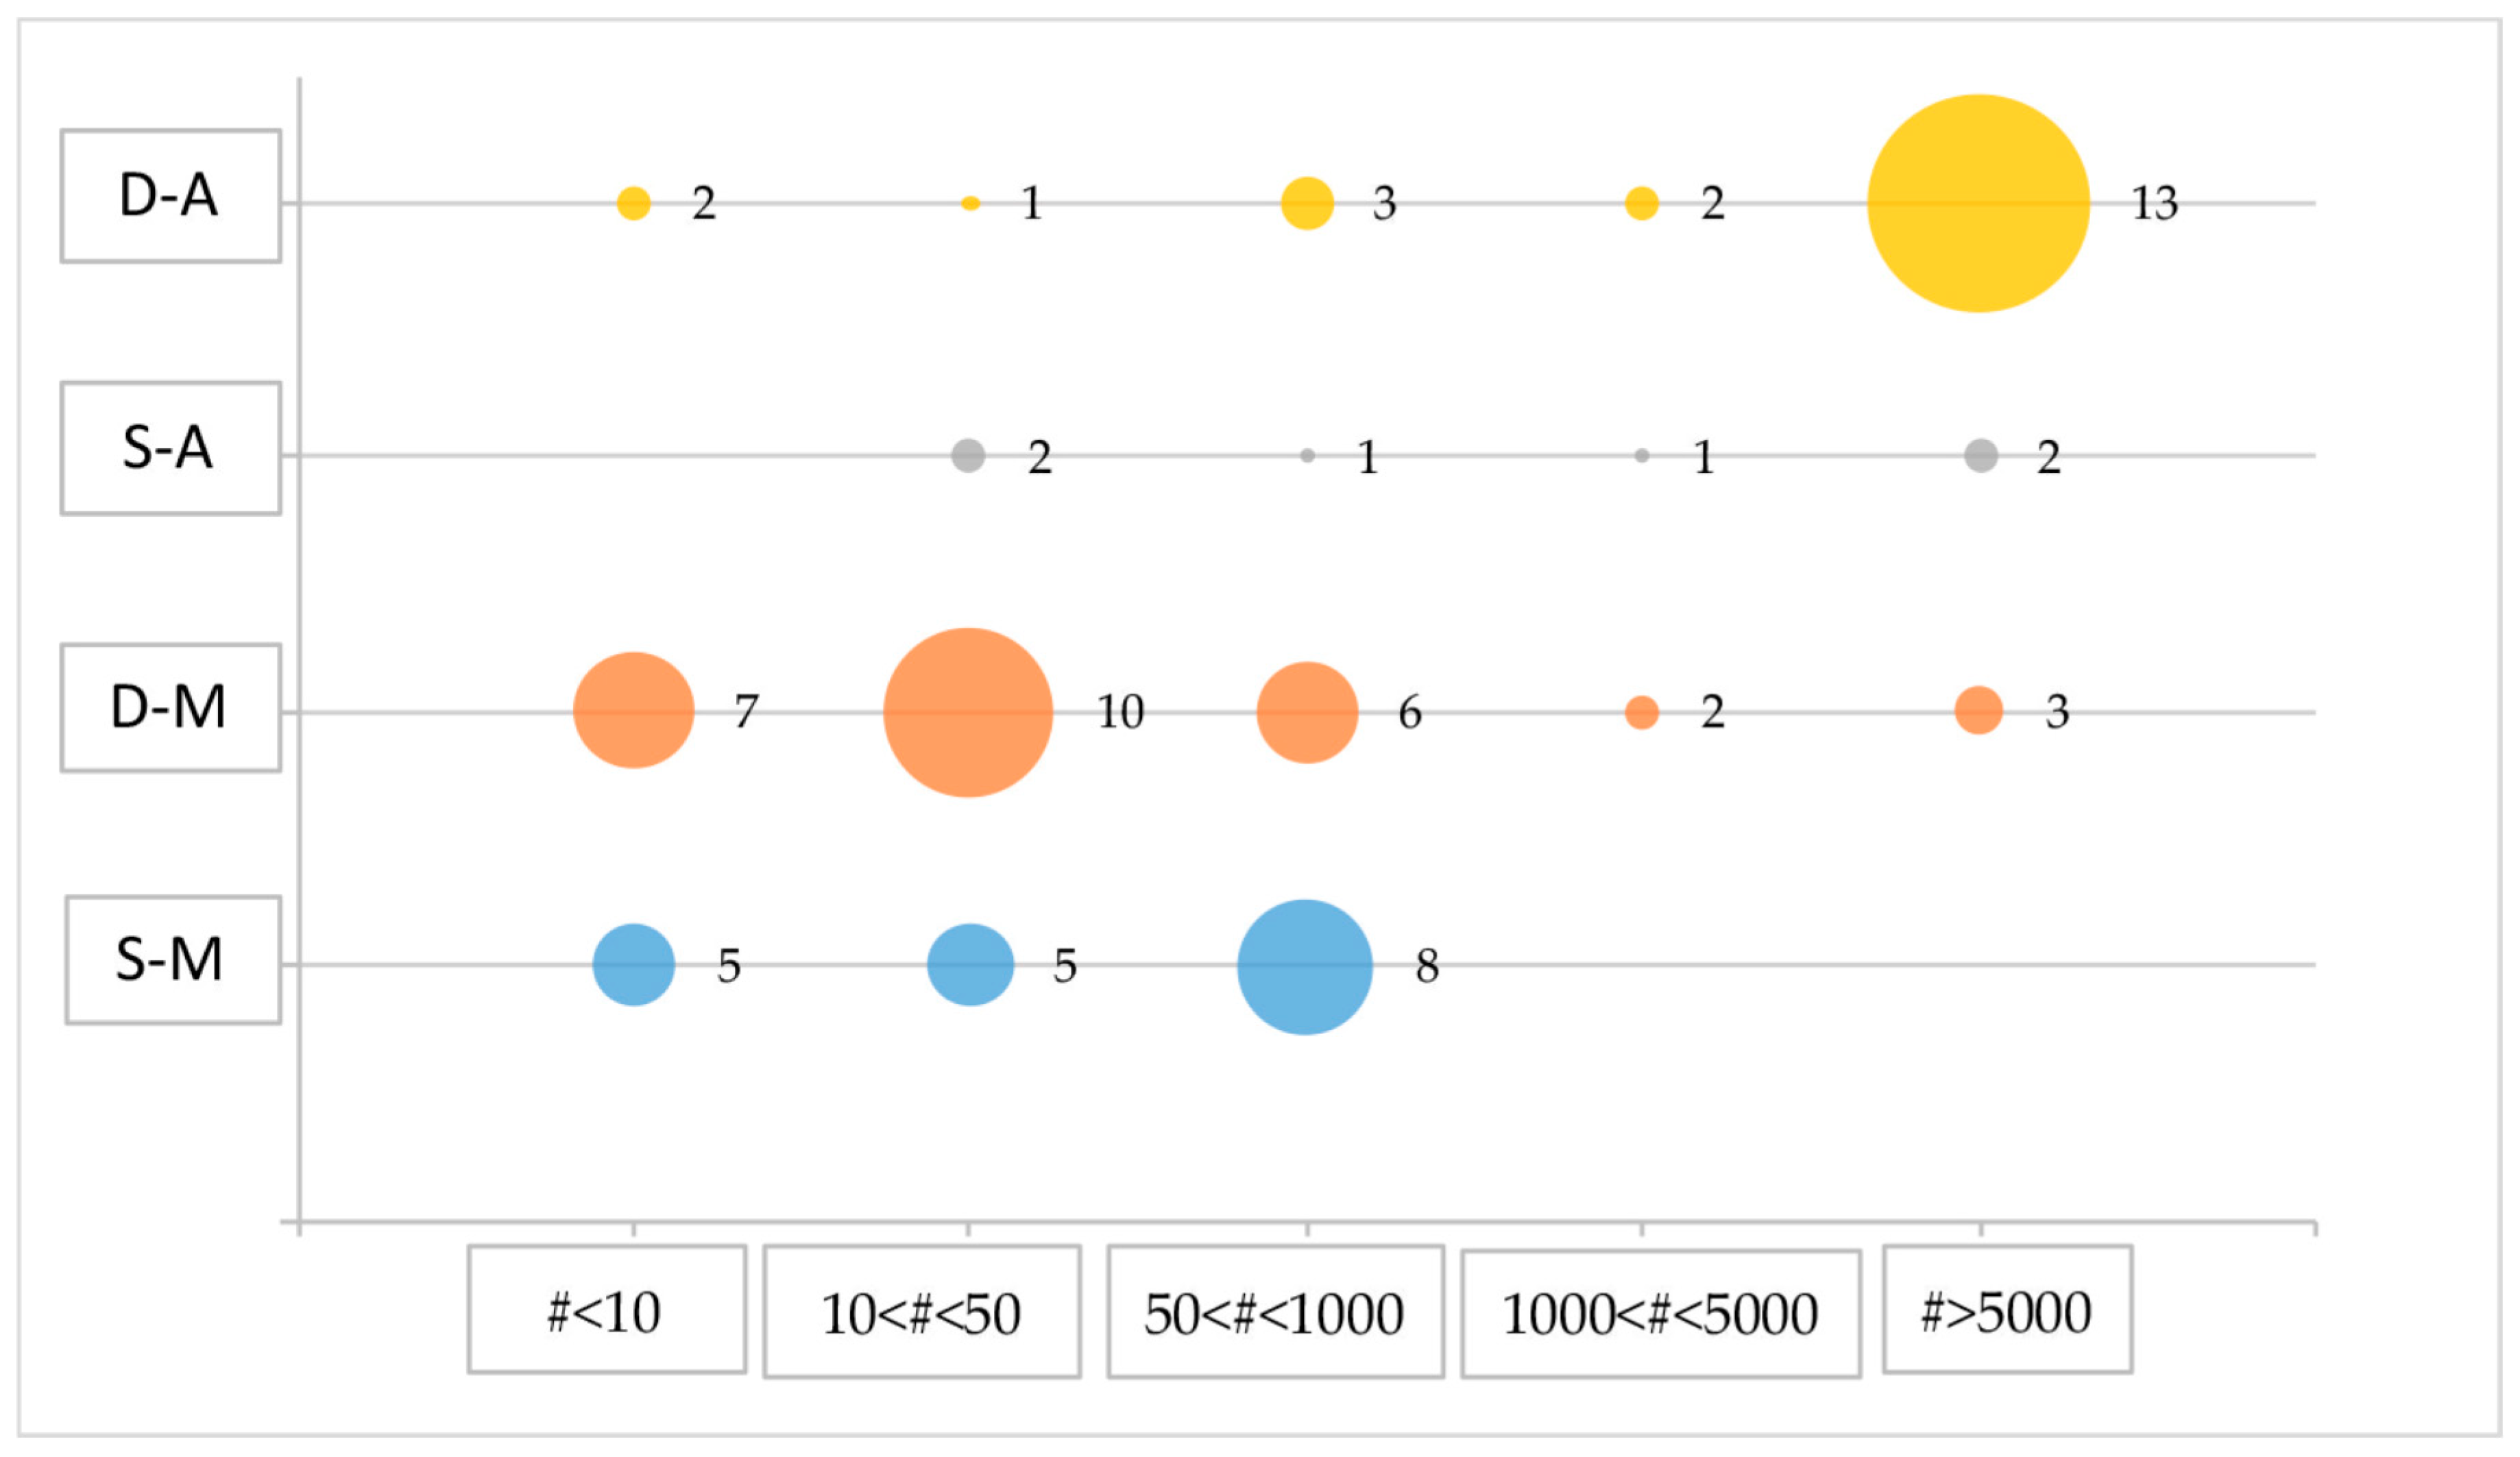
Figure 16.
Real interest rate values in the analyzed studies.

Figure 17.
Analysis of inflation rate and of rates of evolution of energy prices and their relationship.
Figure 17.
Analysis of inflation rate and of rates of evolution of energy prices and their relationship.

Figure 18.
Analysis of the calculation periods used in the analyzed set of studies.
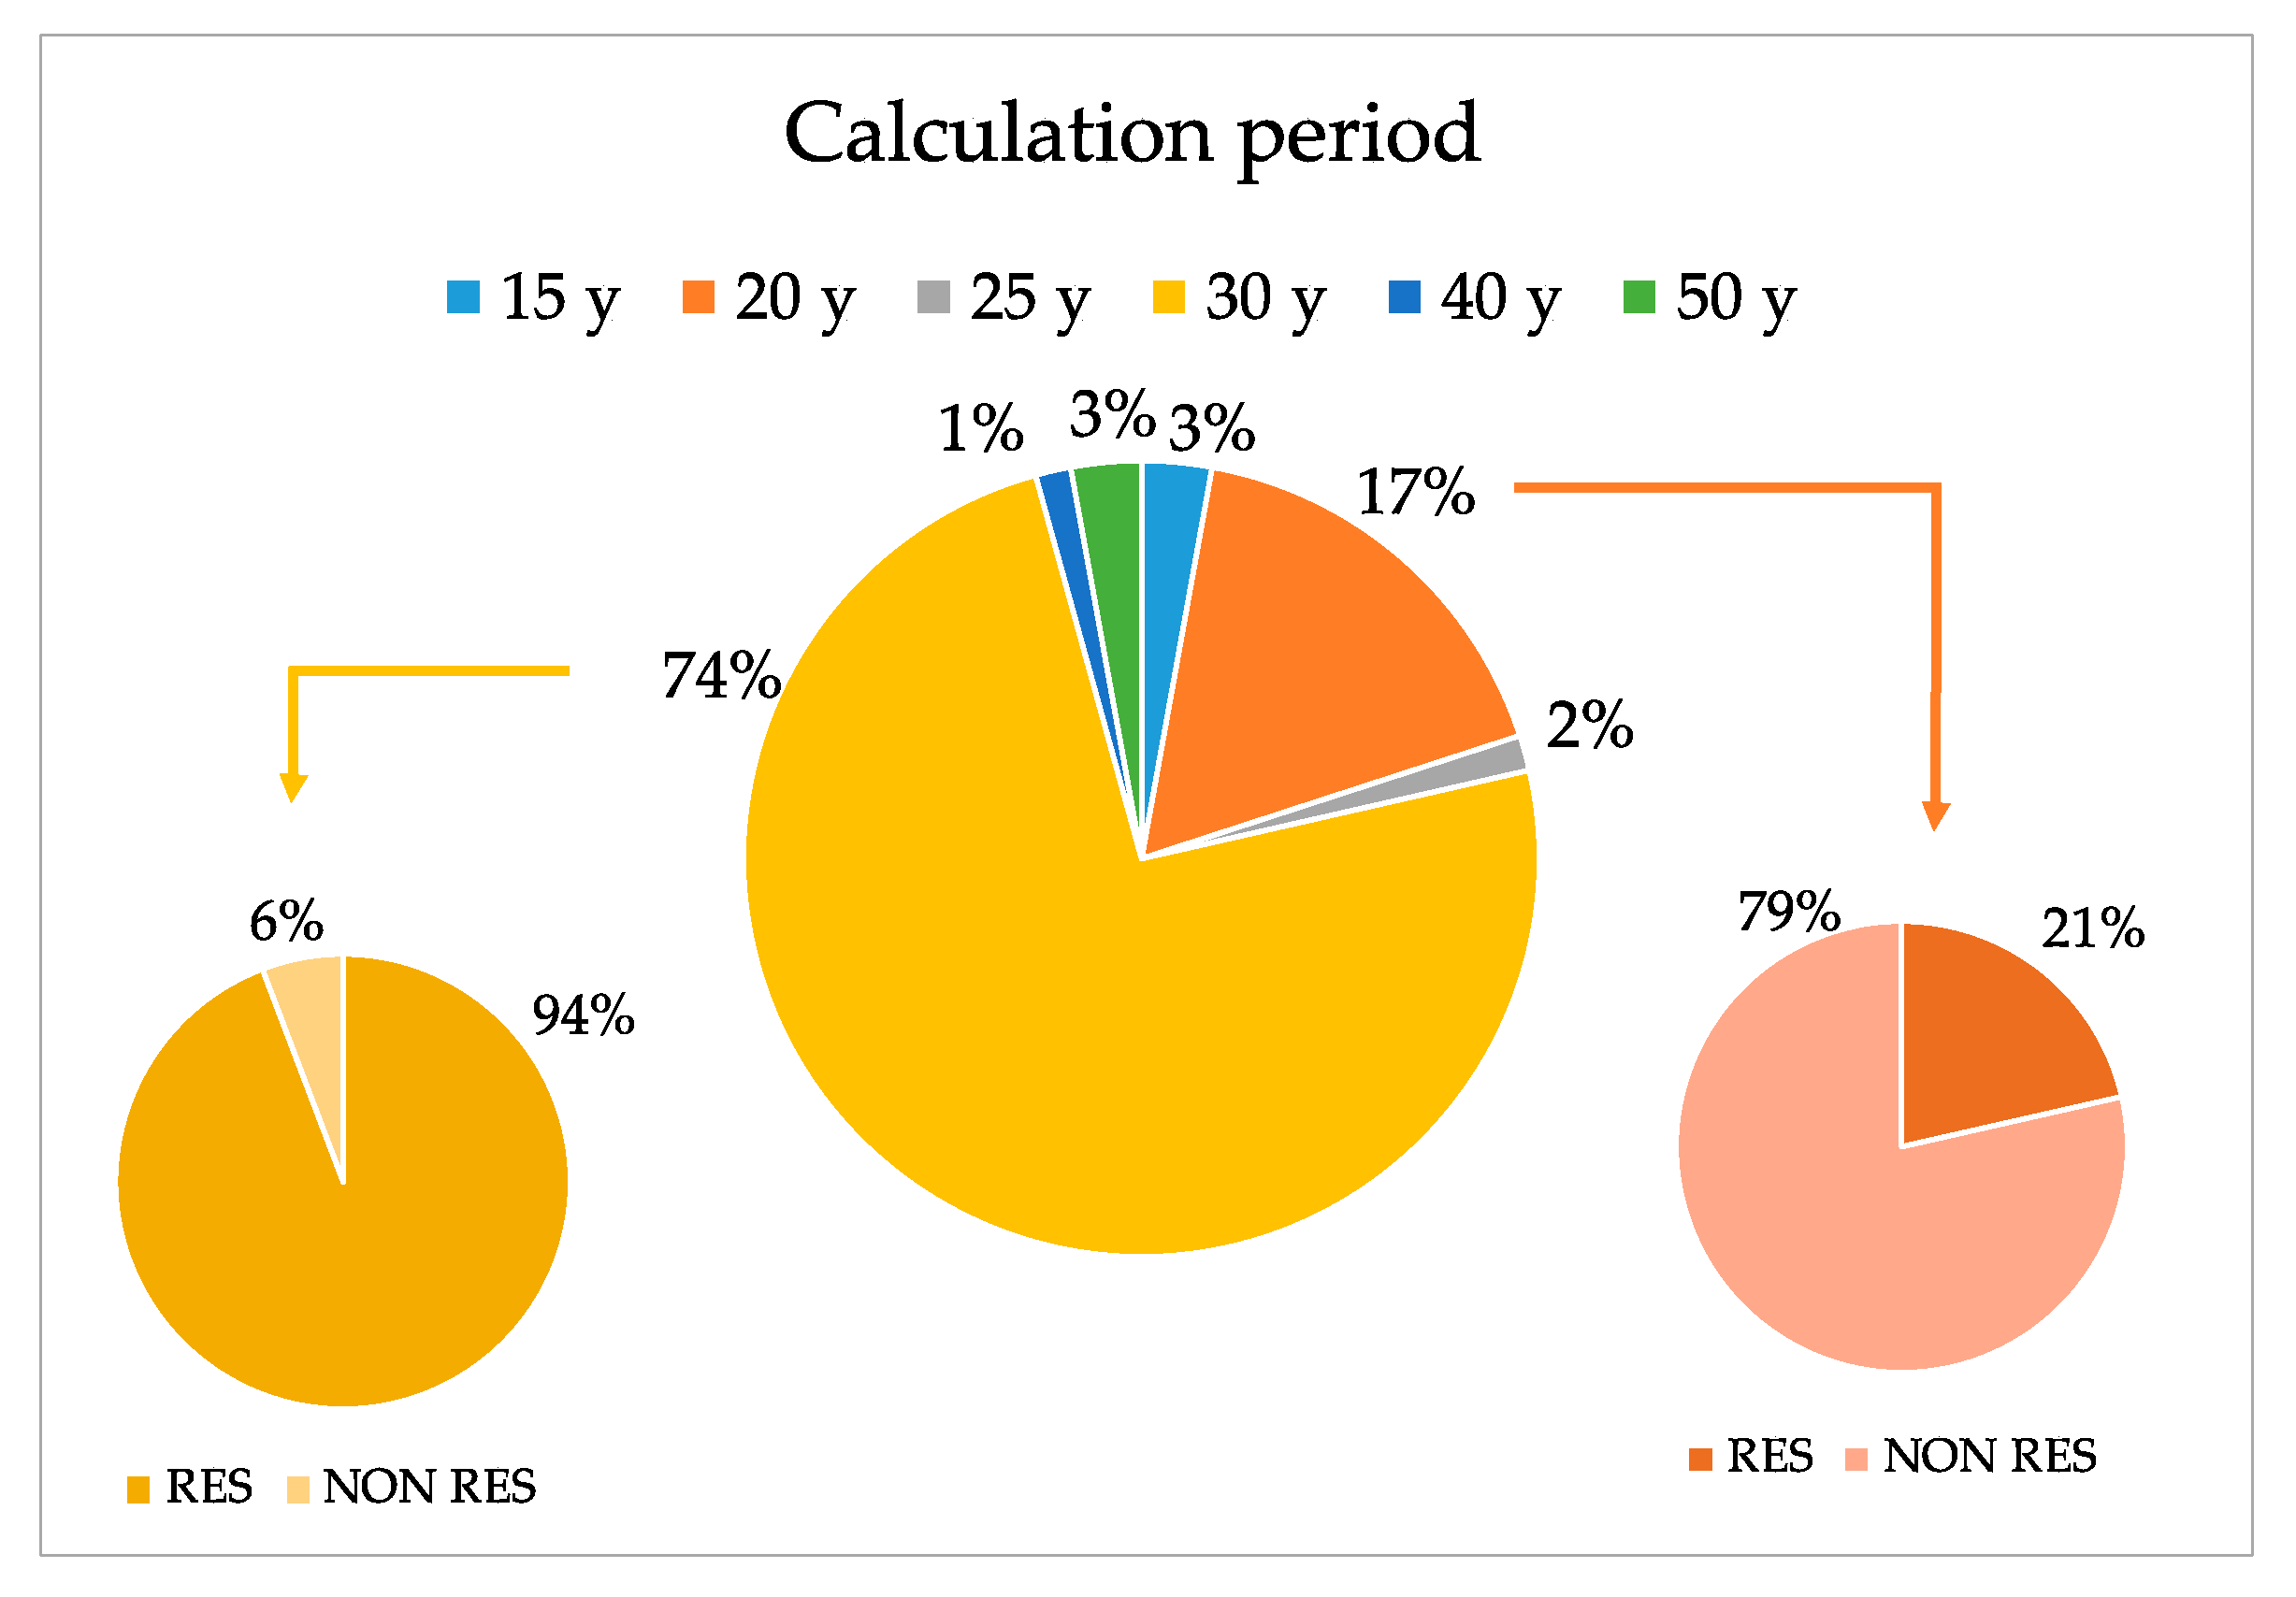
Figure 19.
Global cost values and cost-optimal energy performance levels for residential buildings.

Figure 20.
Optimal EEMs for energy systems—single-family residential buildings.

Figure 21.
Optimal EEMs for energy systems—multi-family residential buildings.
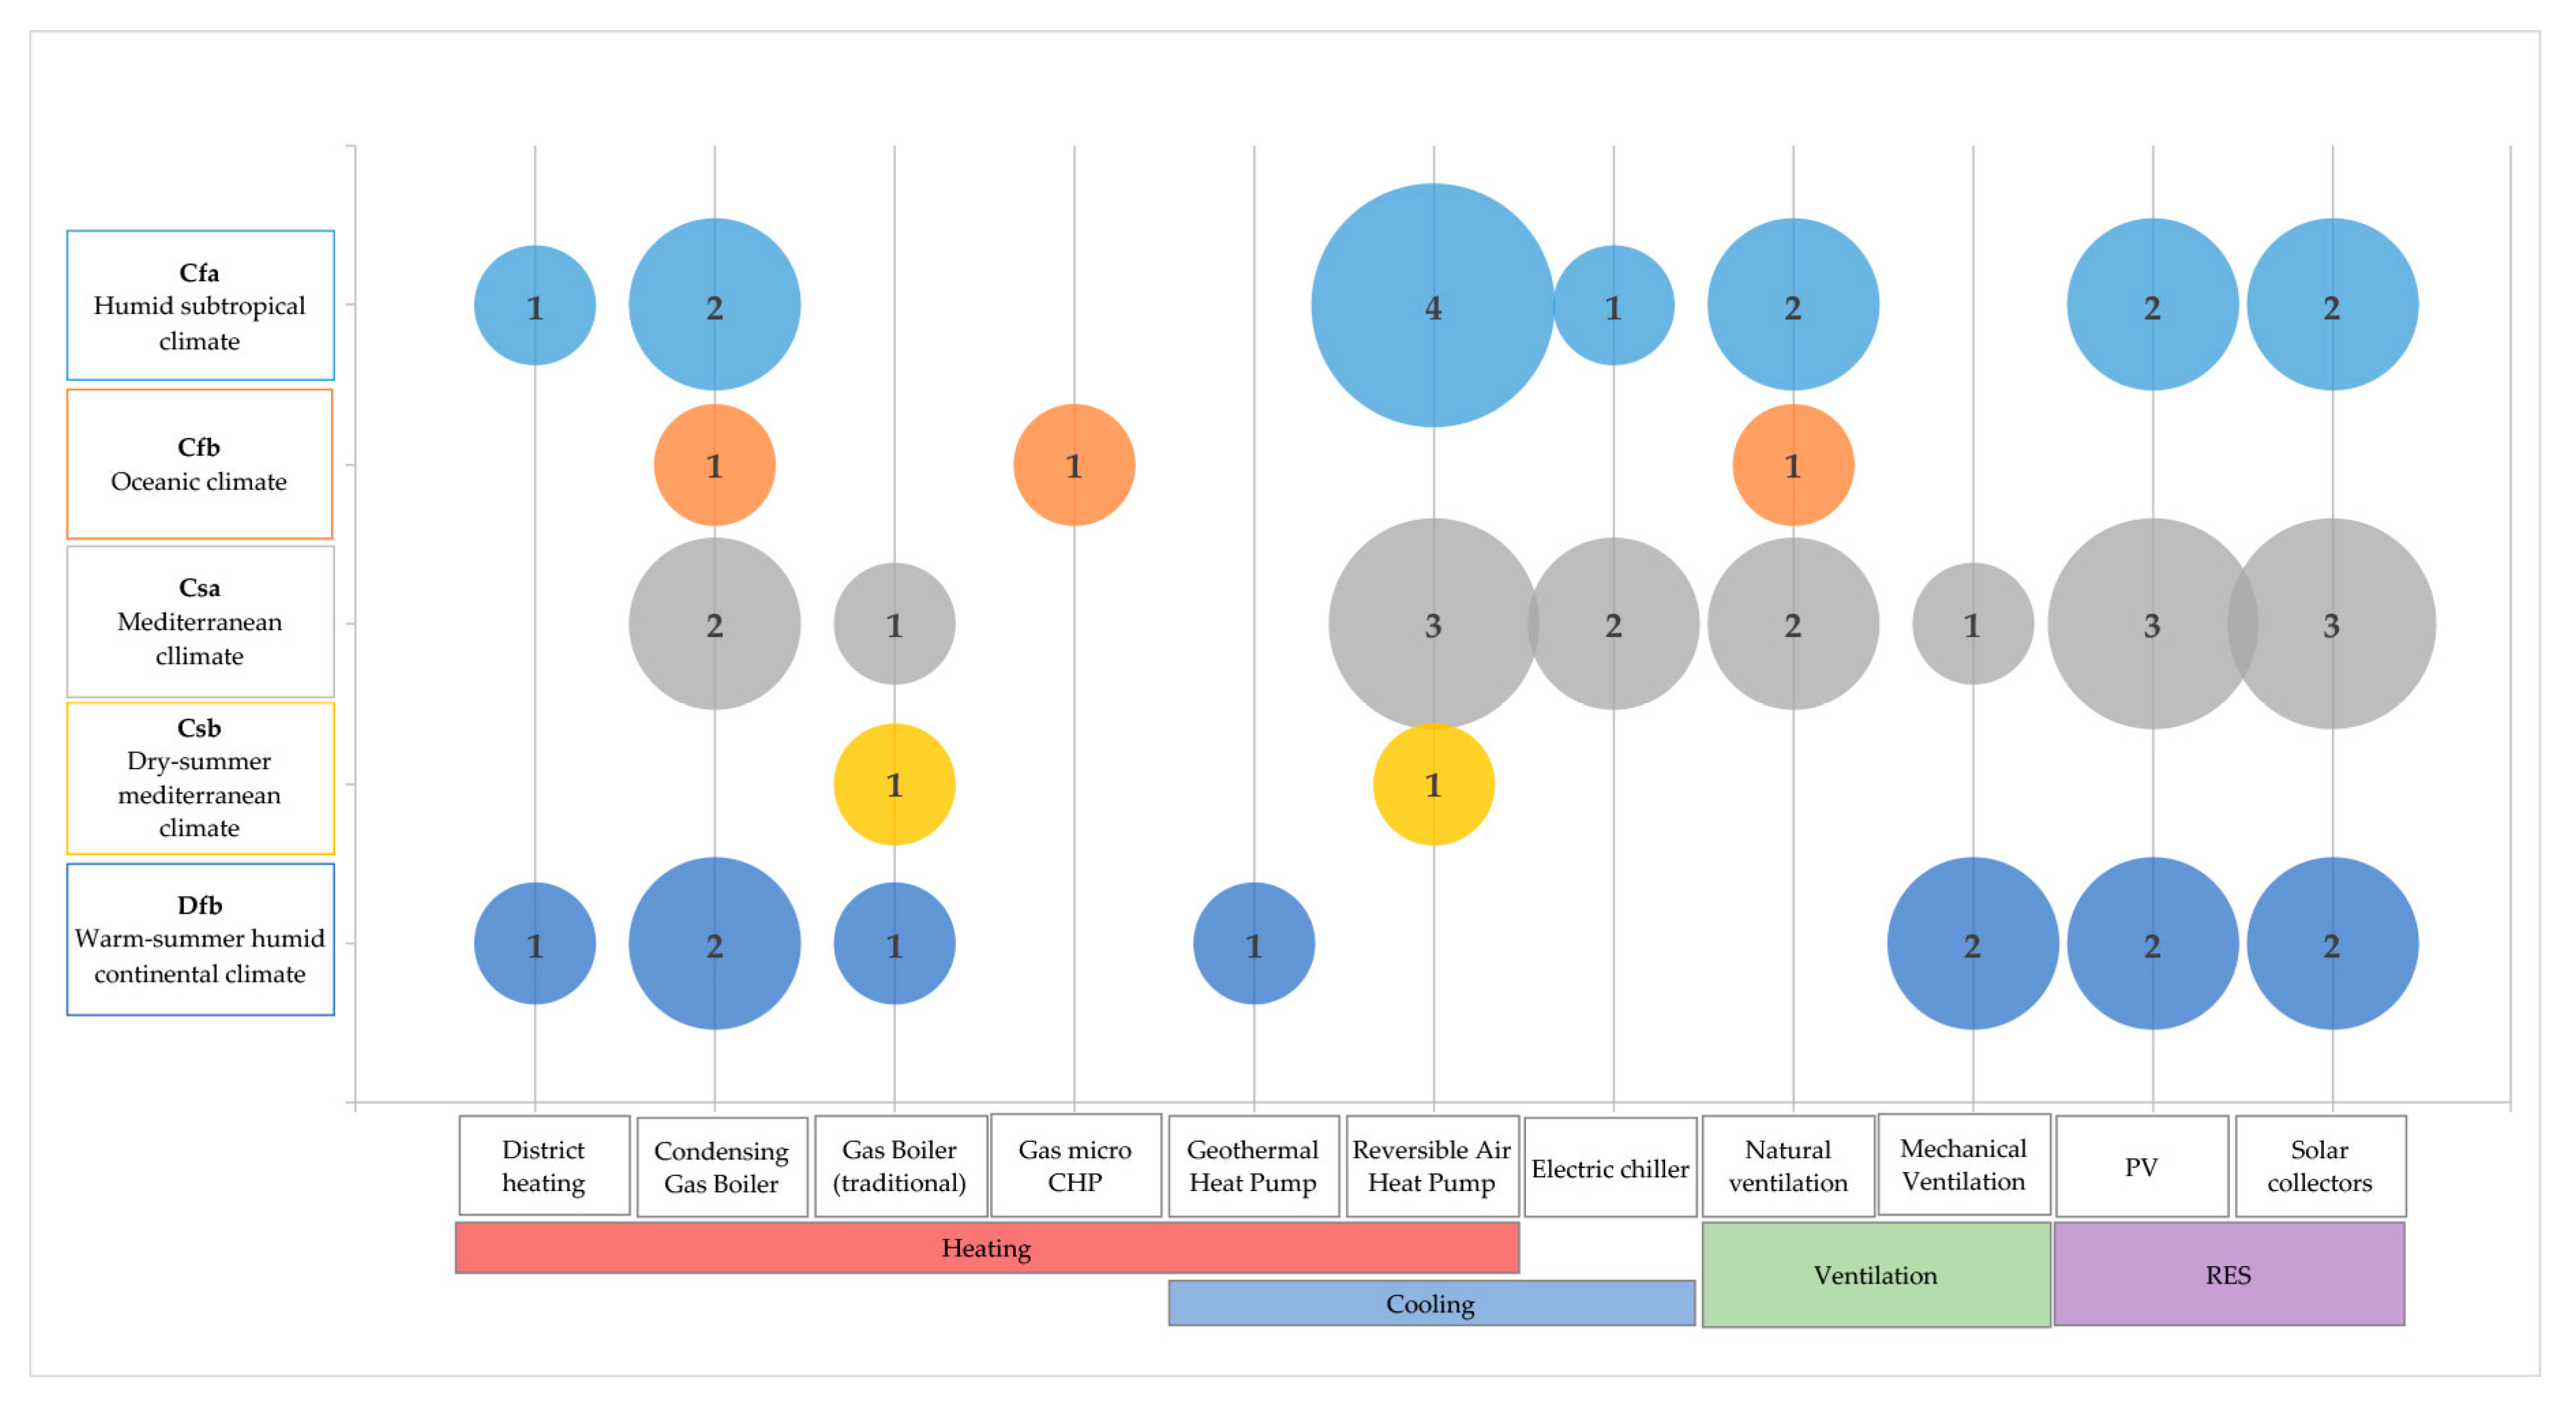
Figure 22.
Optimal EEMs for energy systems—non-residential buildings.
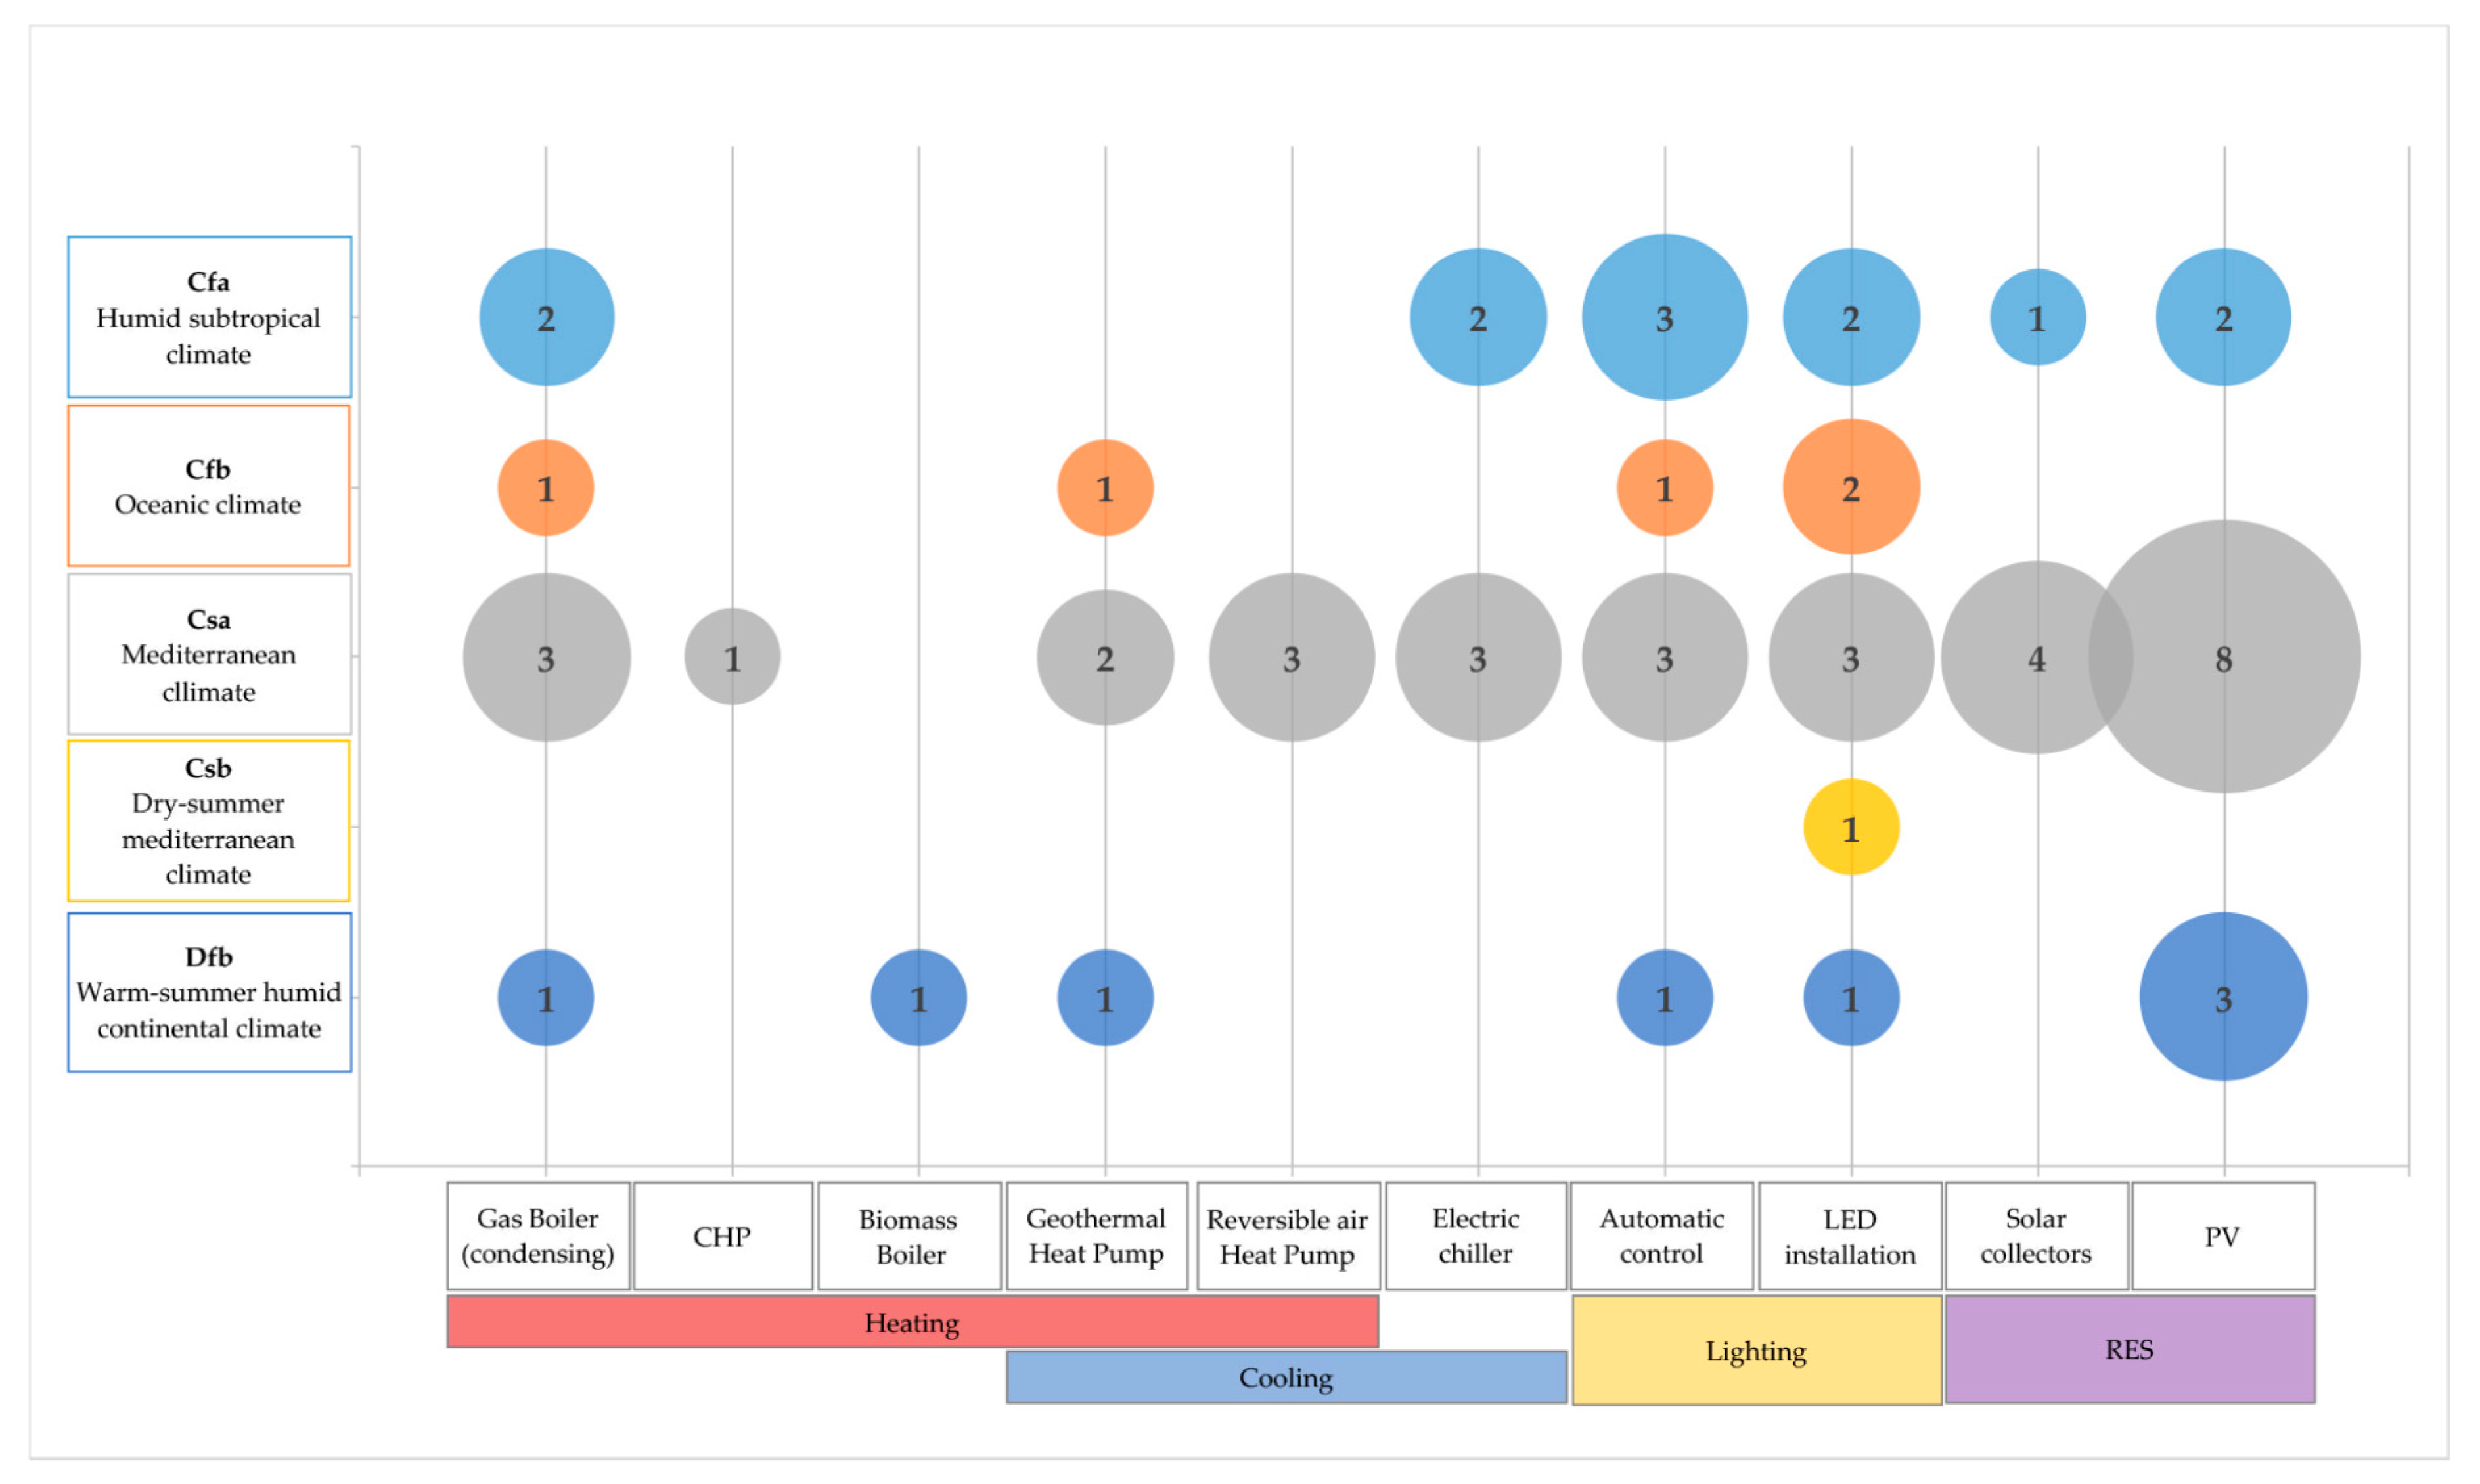
Figure 23.
Optimal EEMs for opaque envelope—single-family buildings.

Figure 24.
Optimal EEMs for opaque envelope—multi-family buildings.

Figure 25.
Optimal EEMs for windows—all building types.


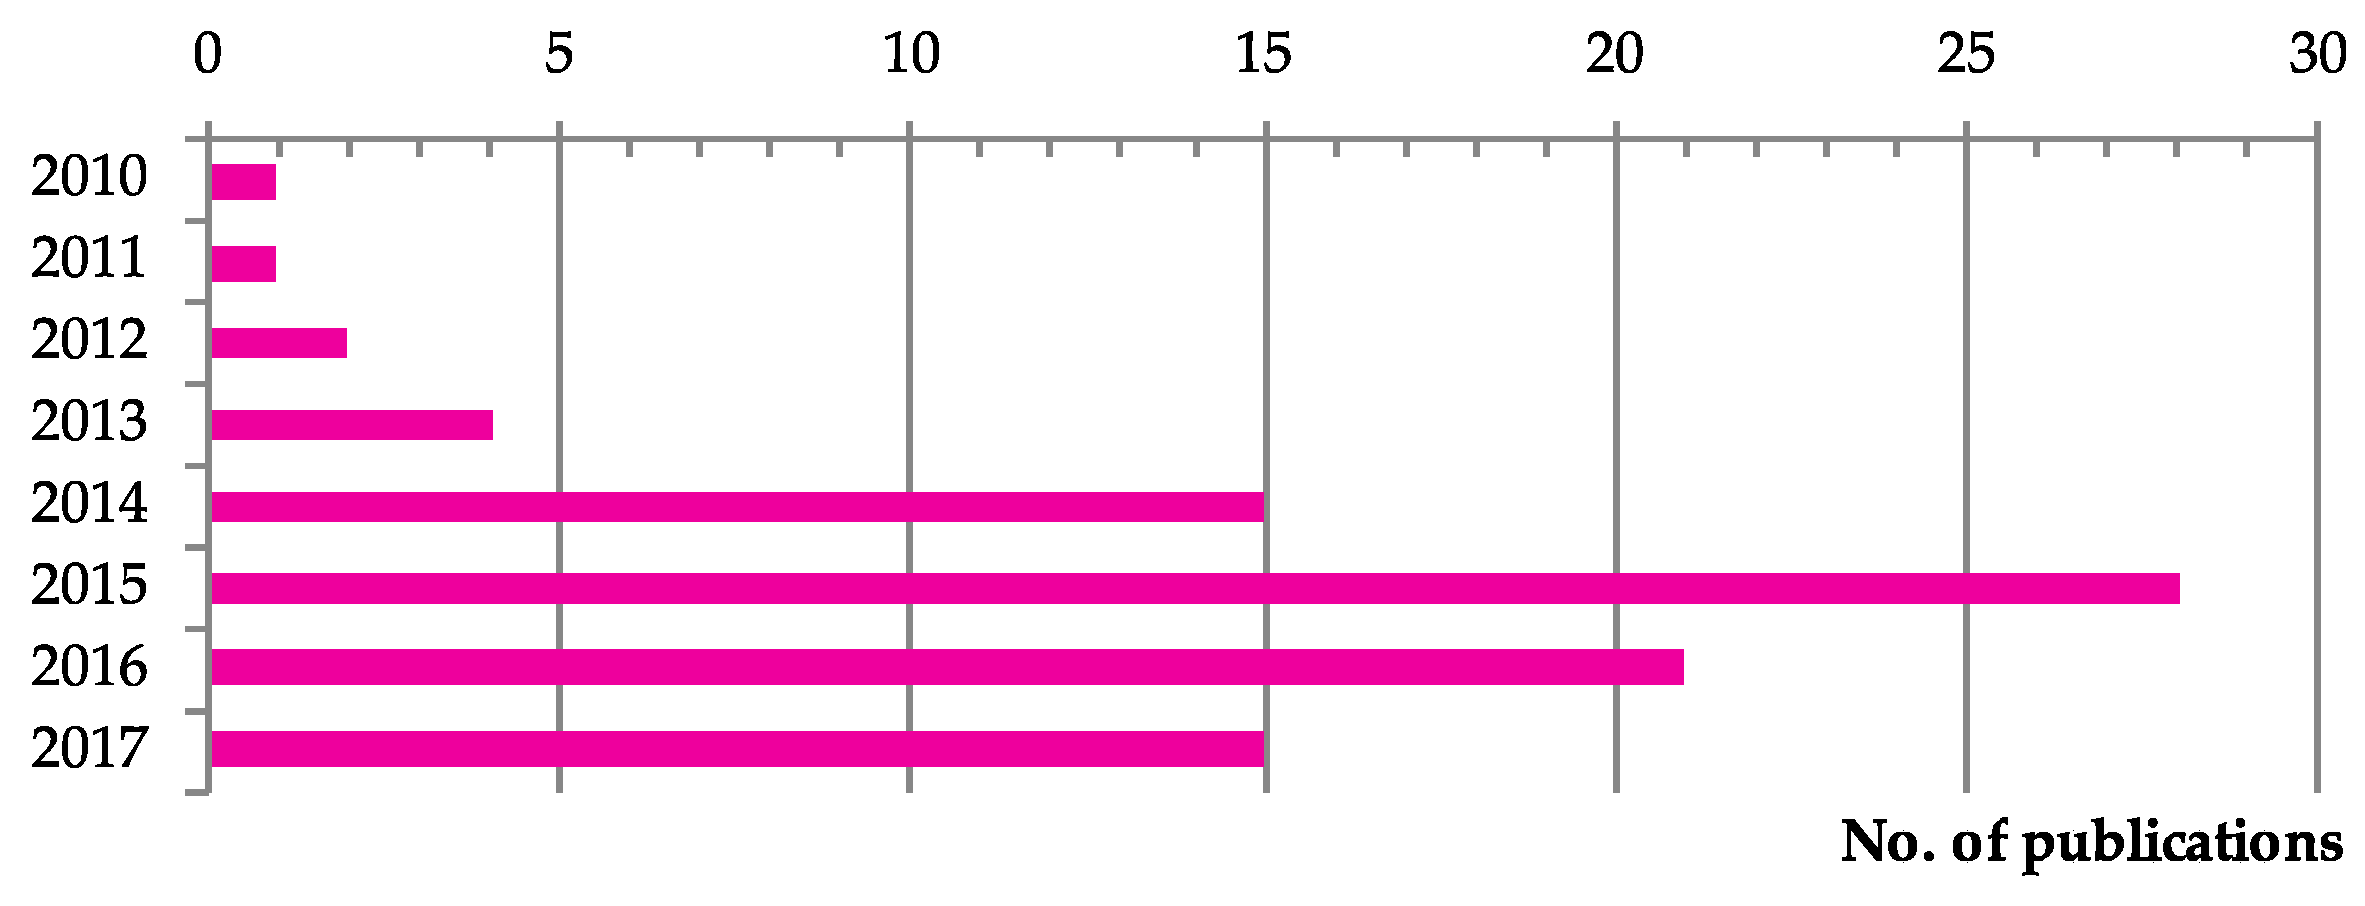
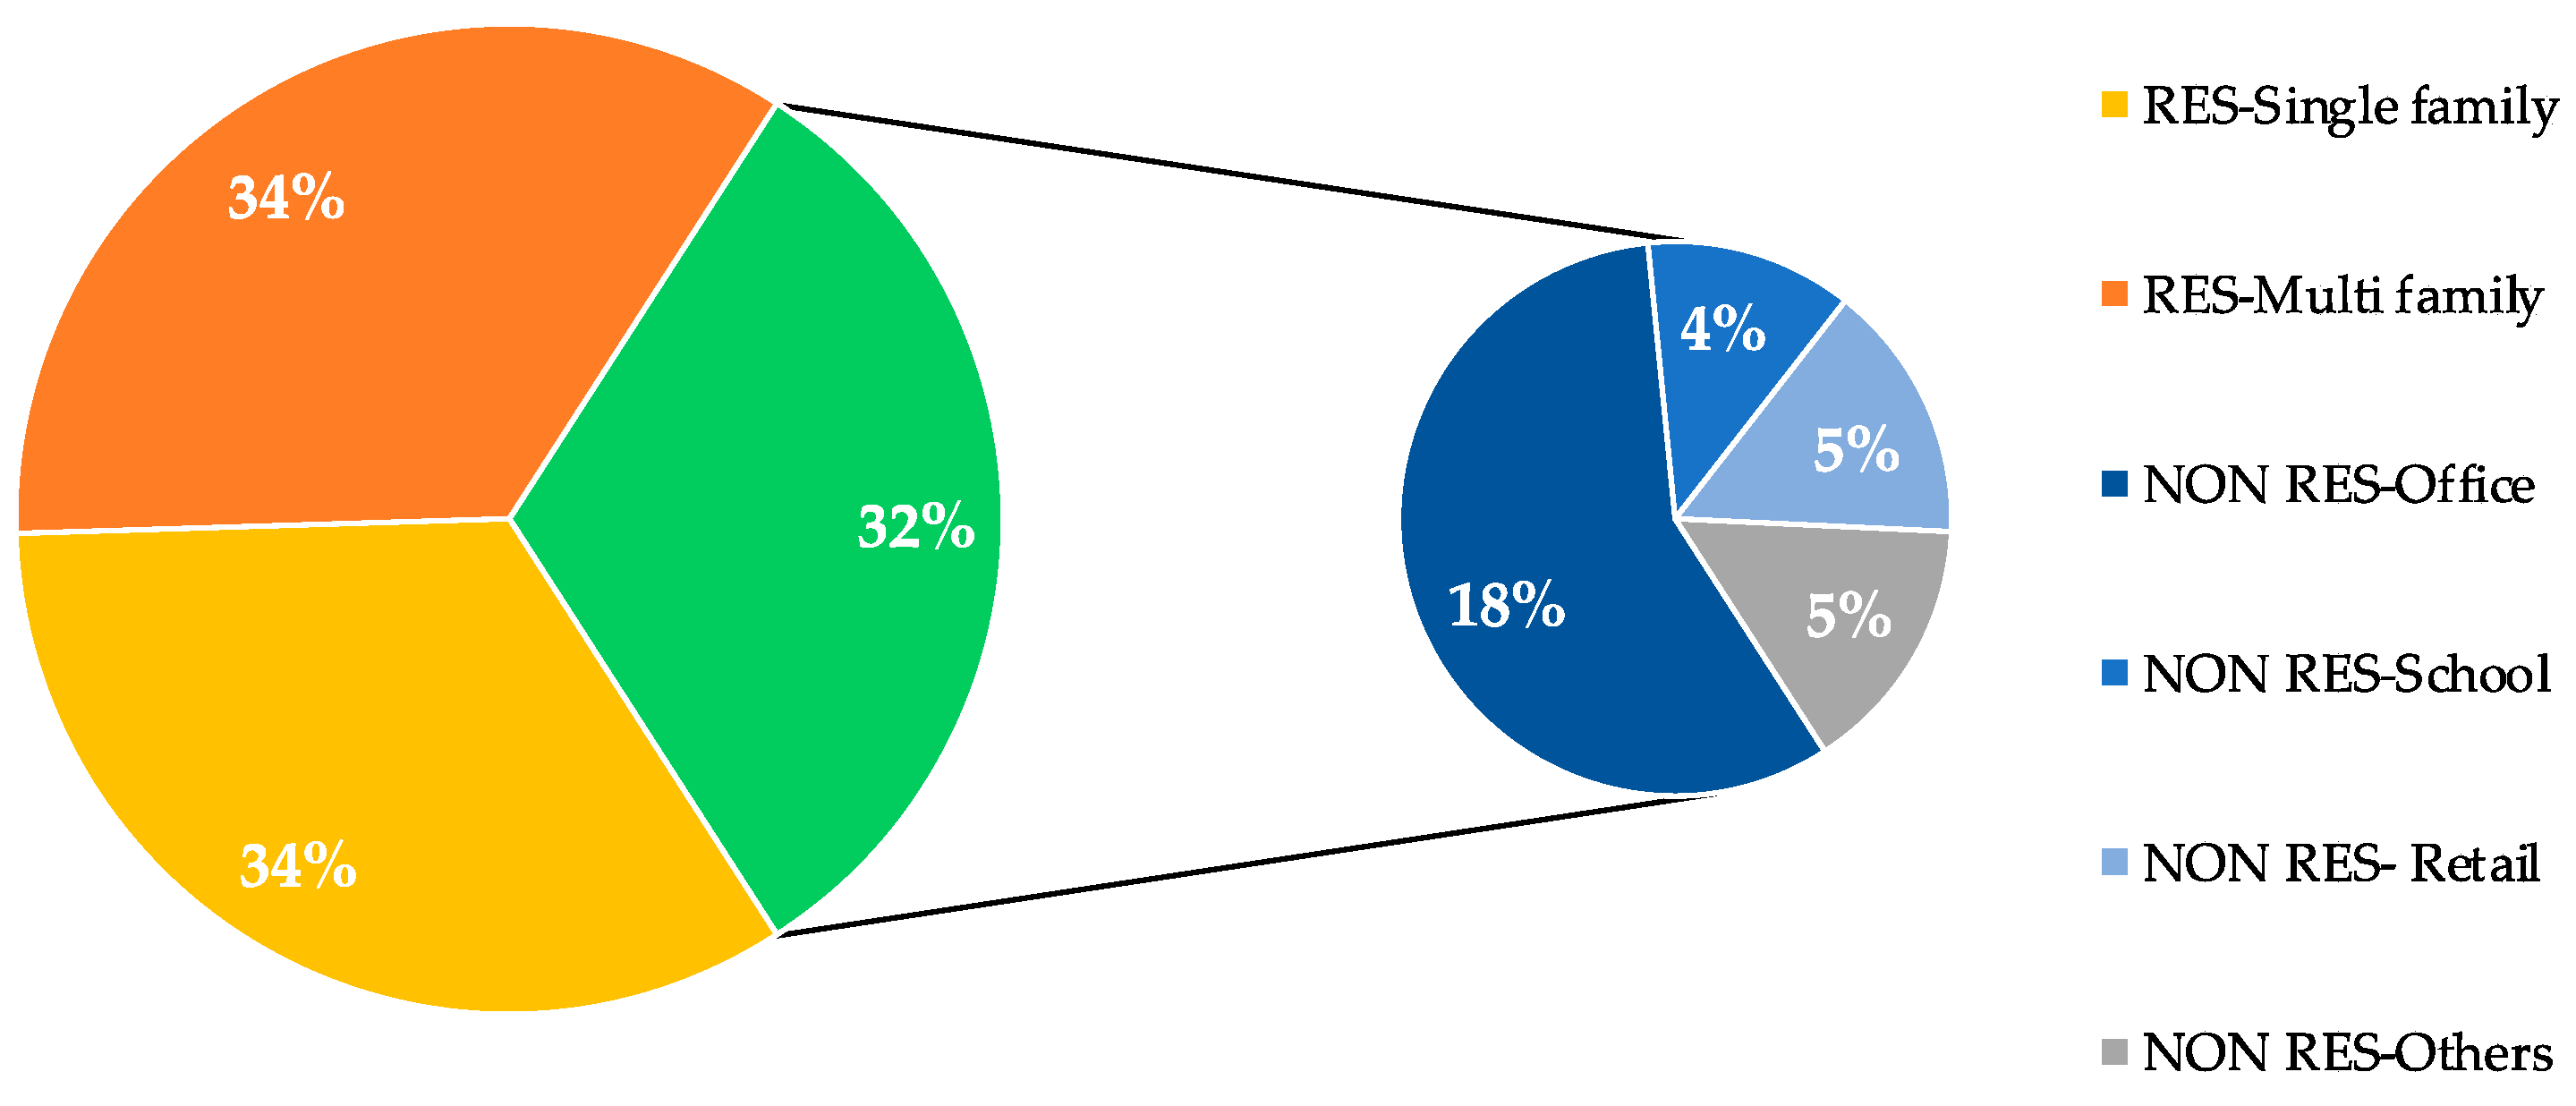
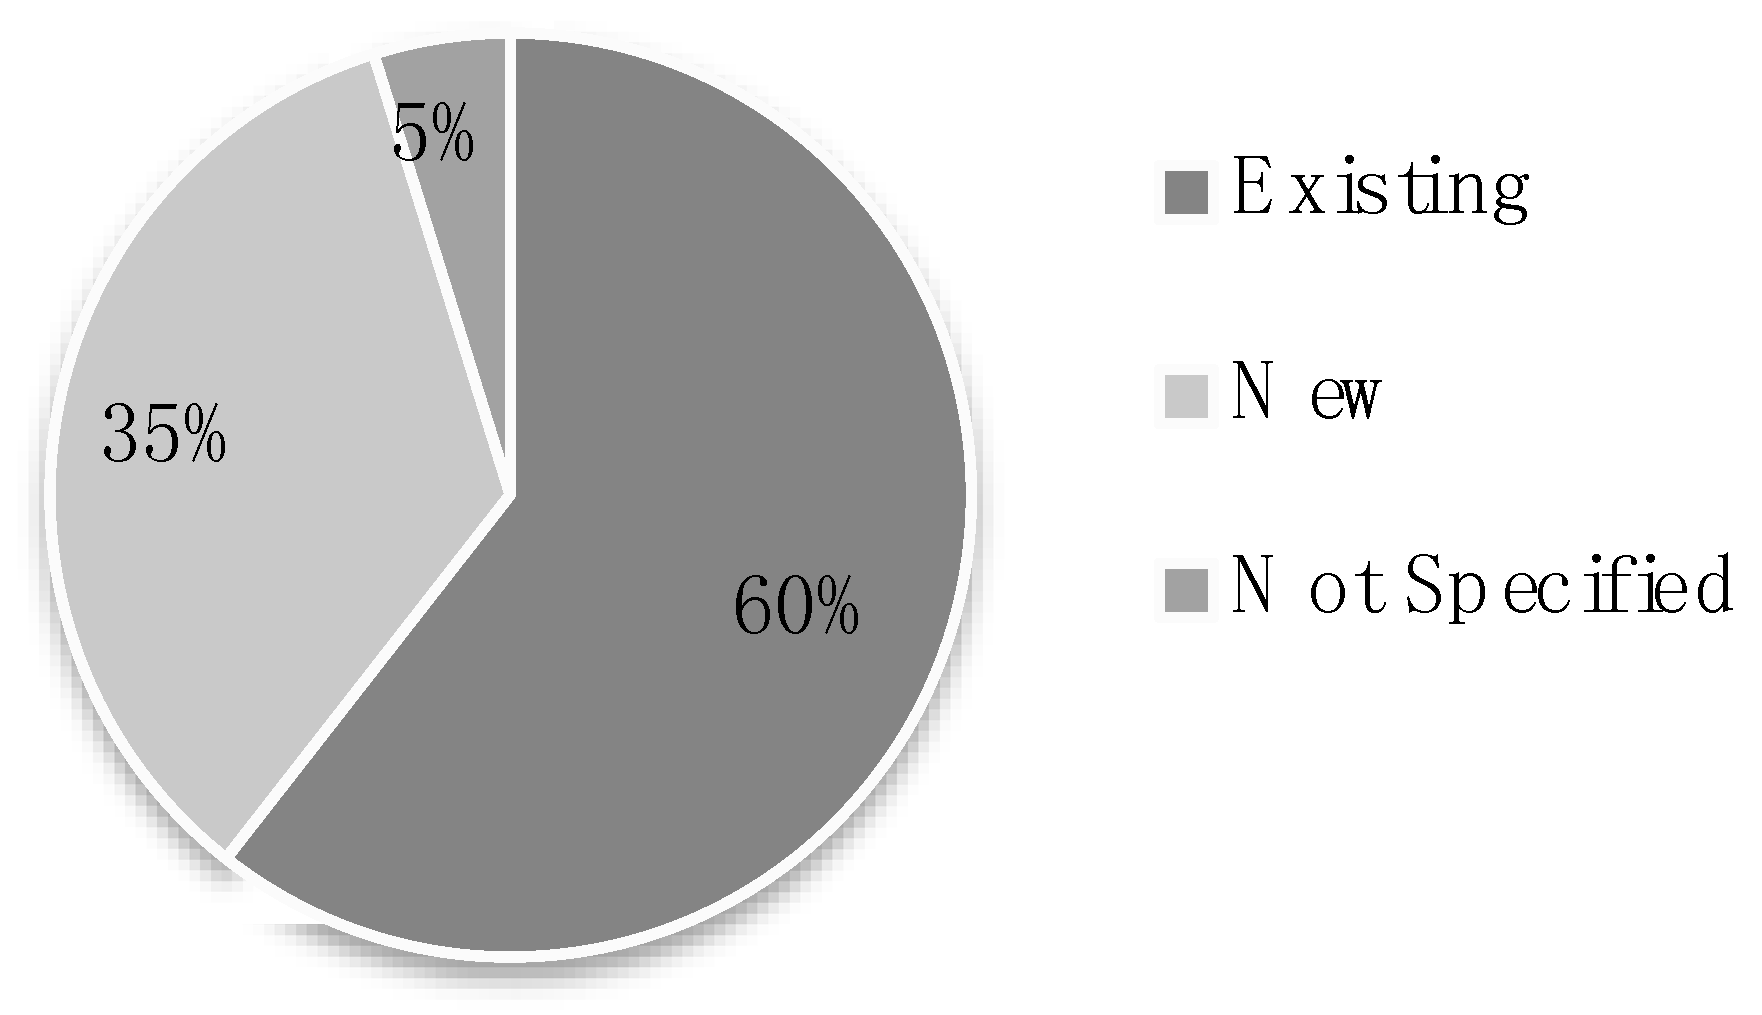
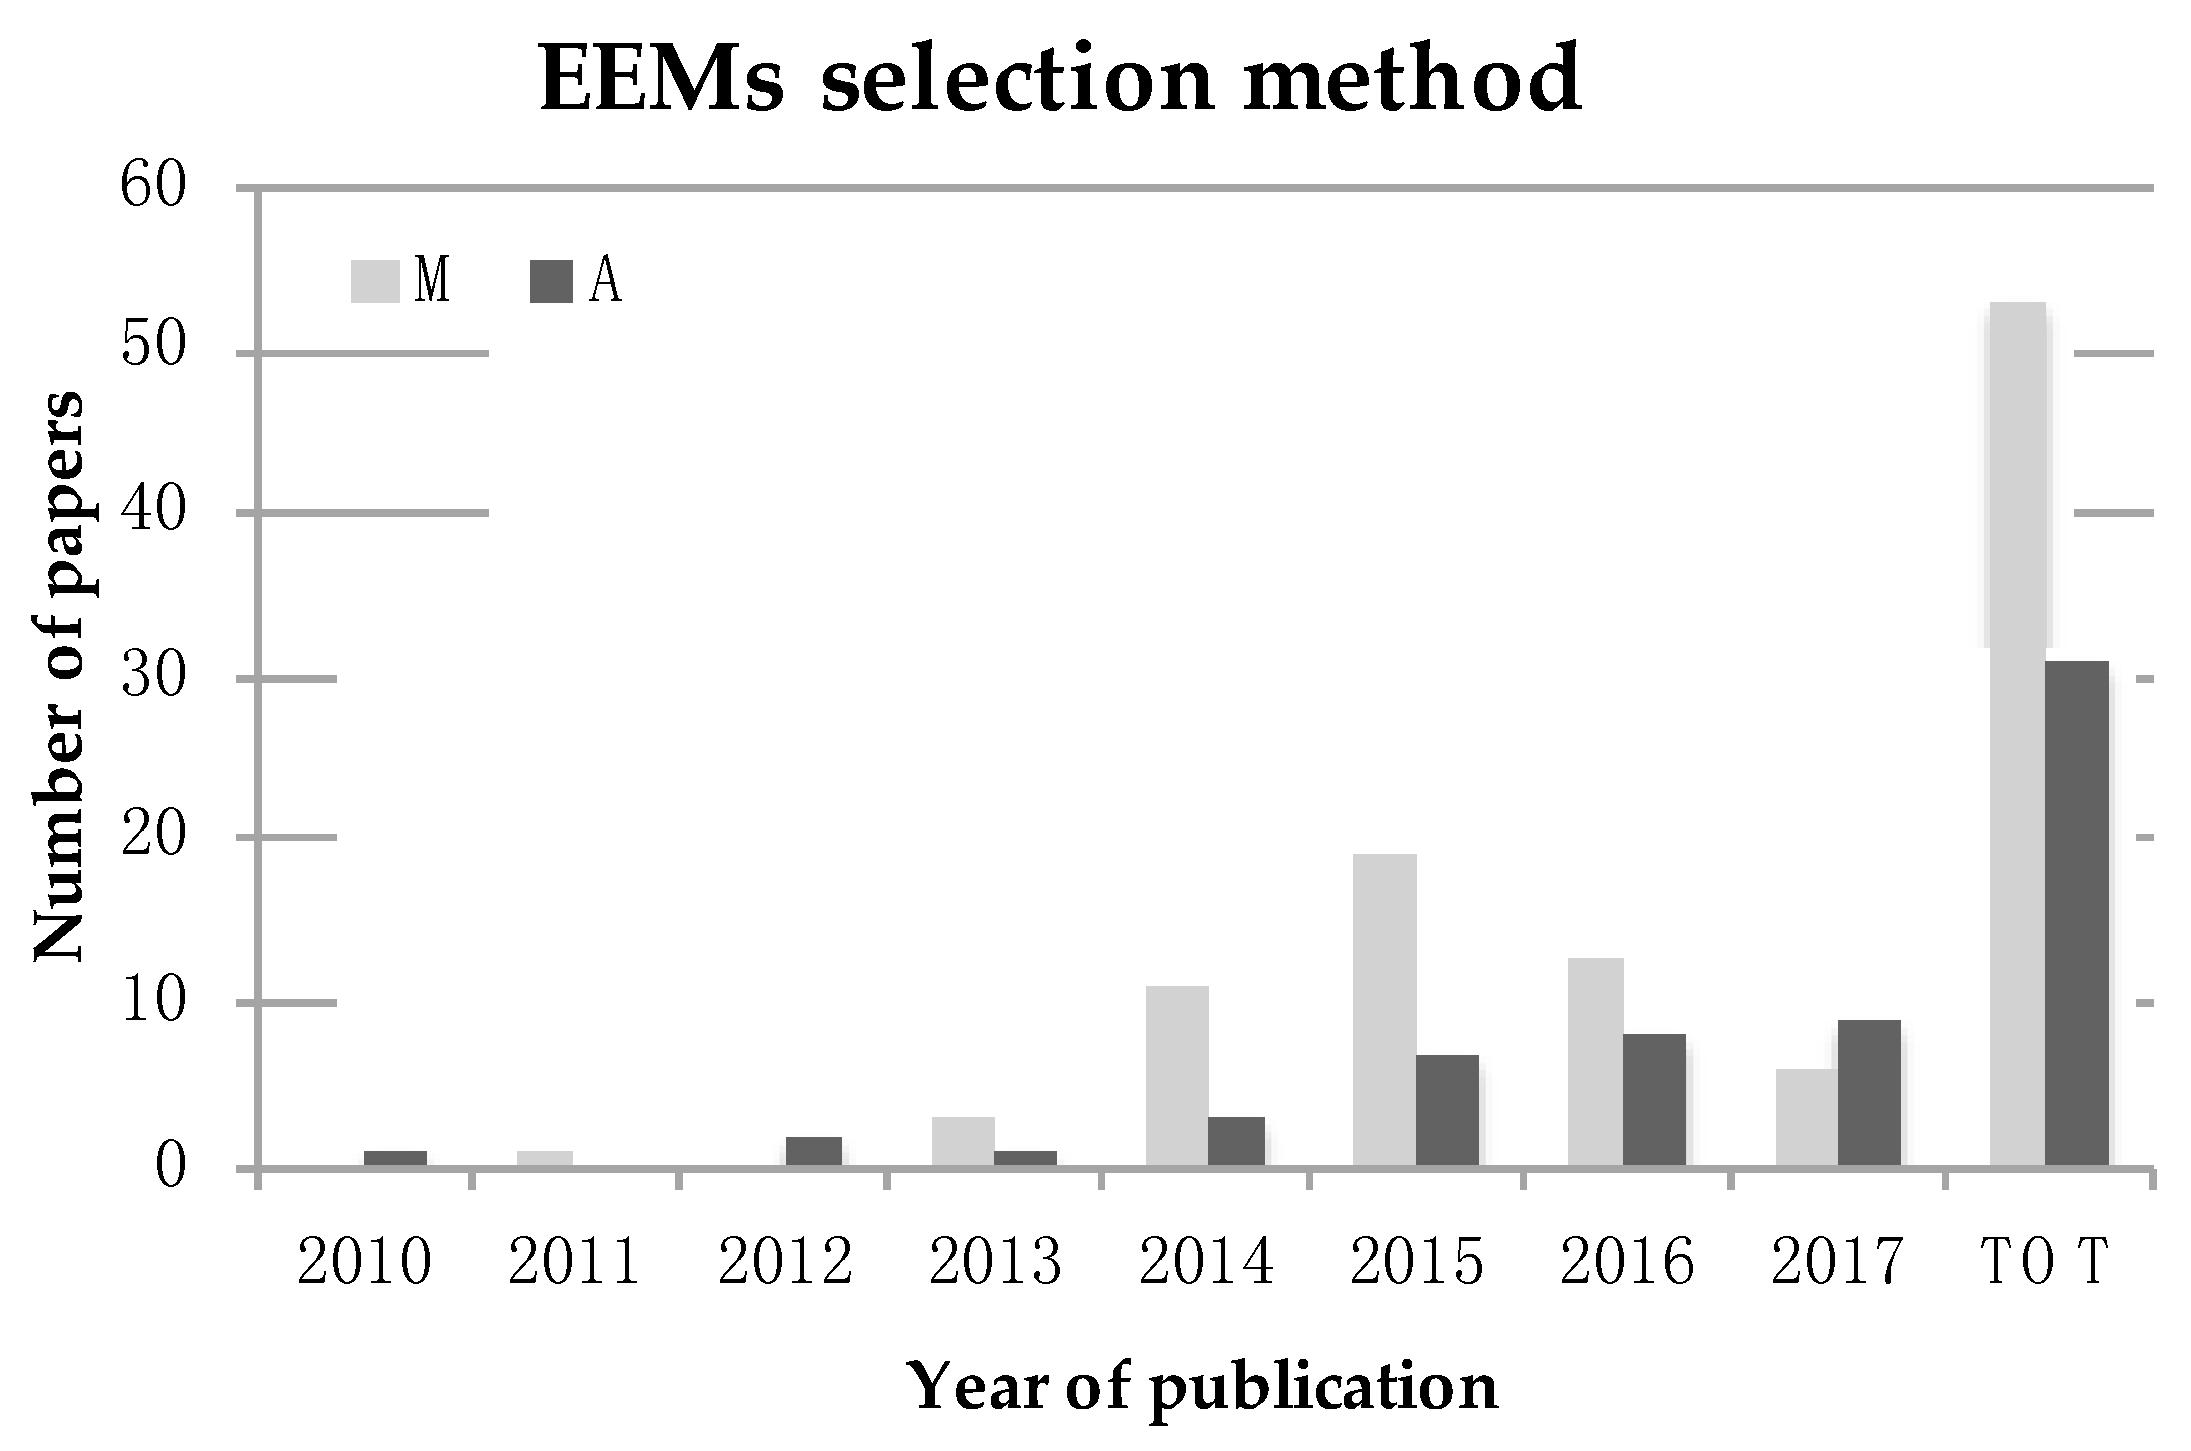
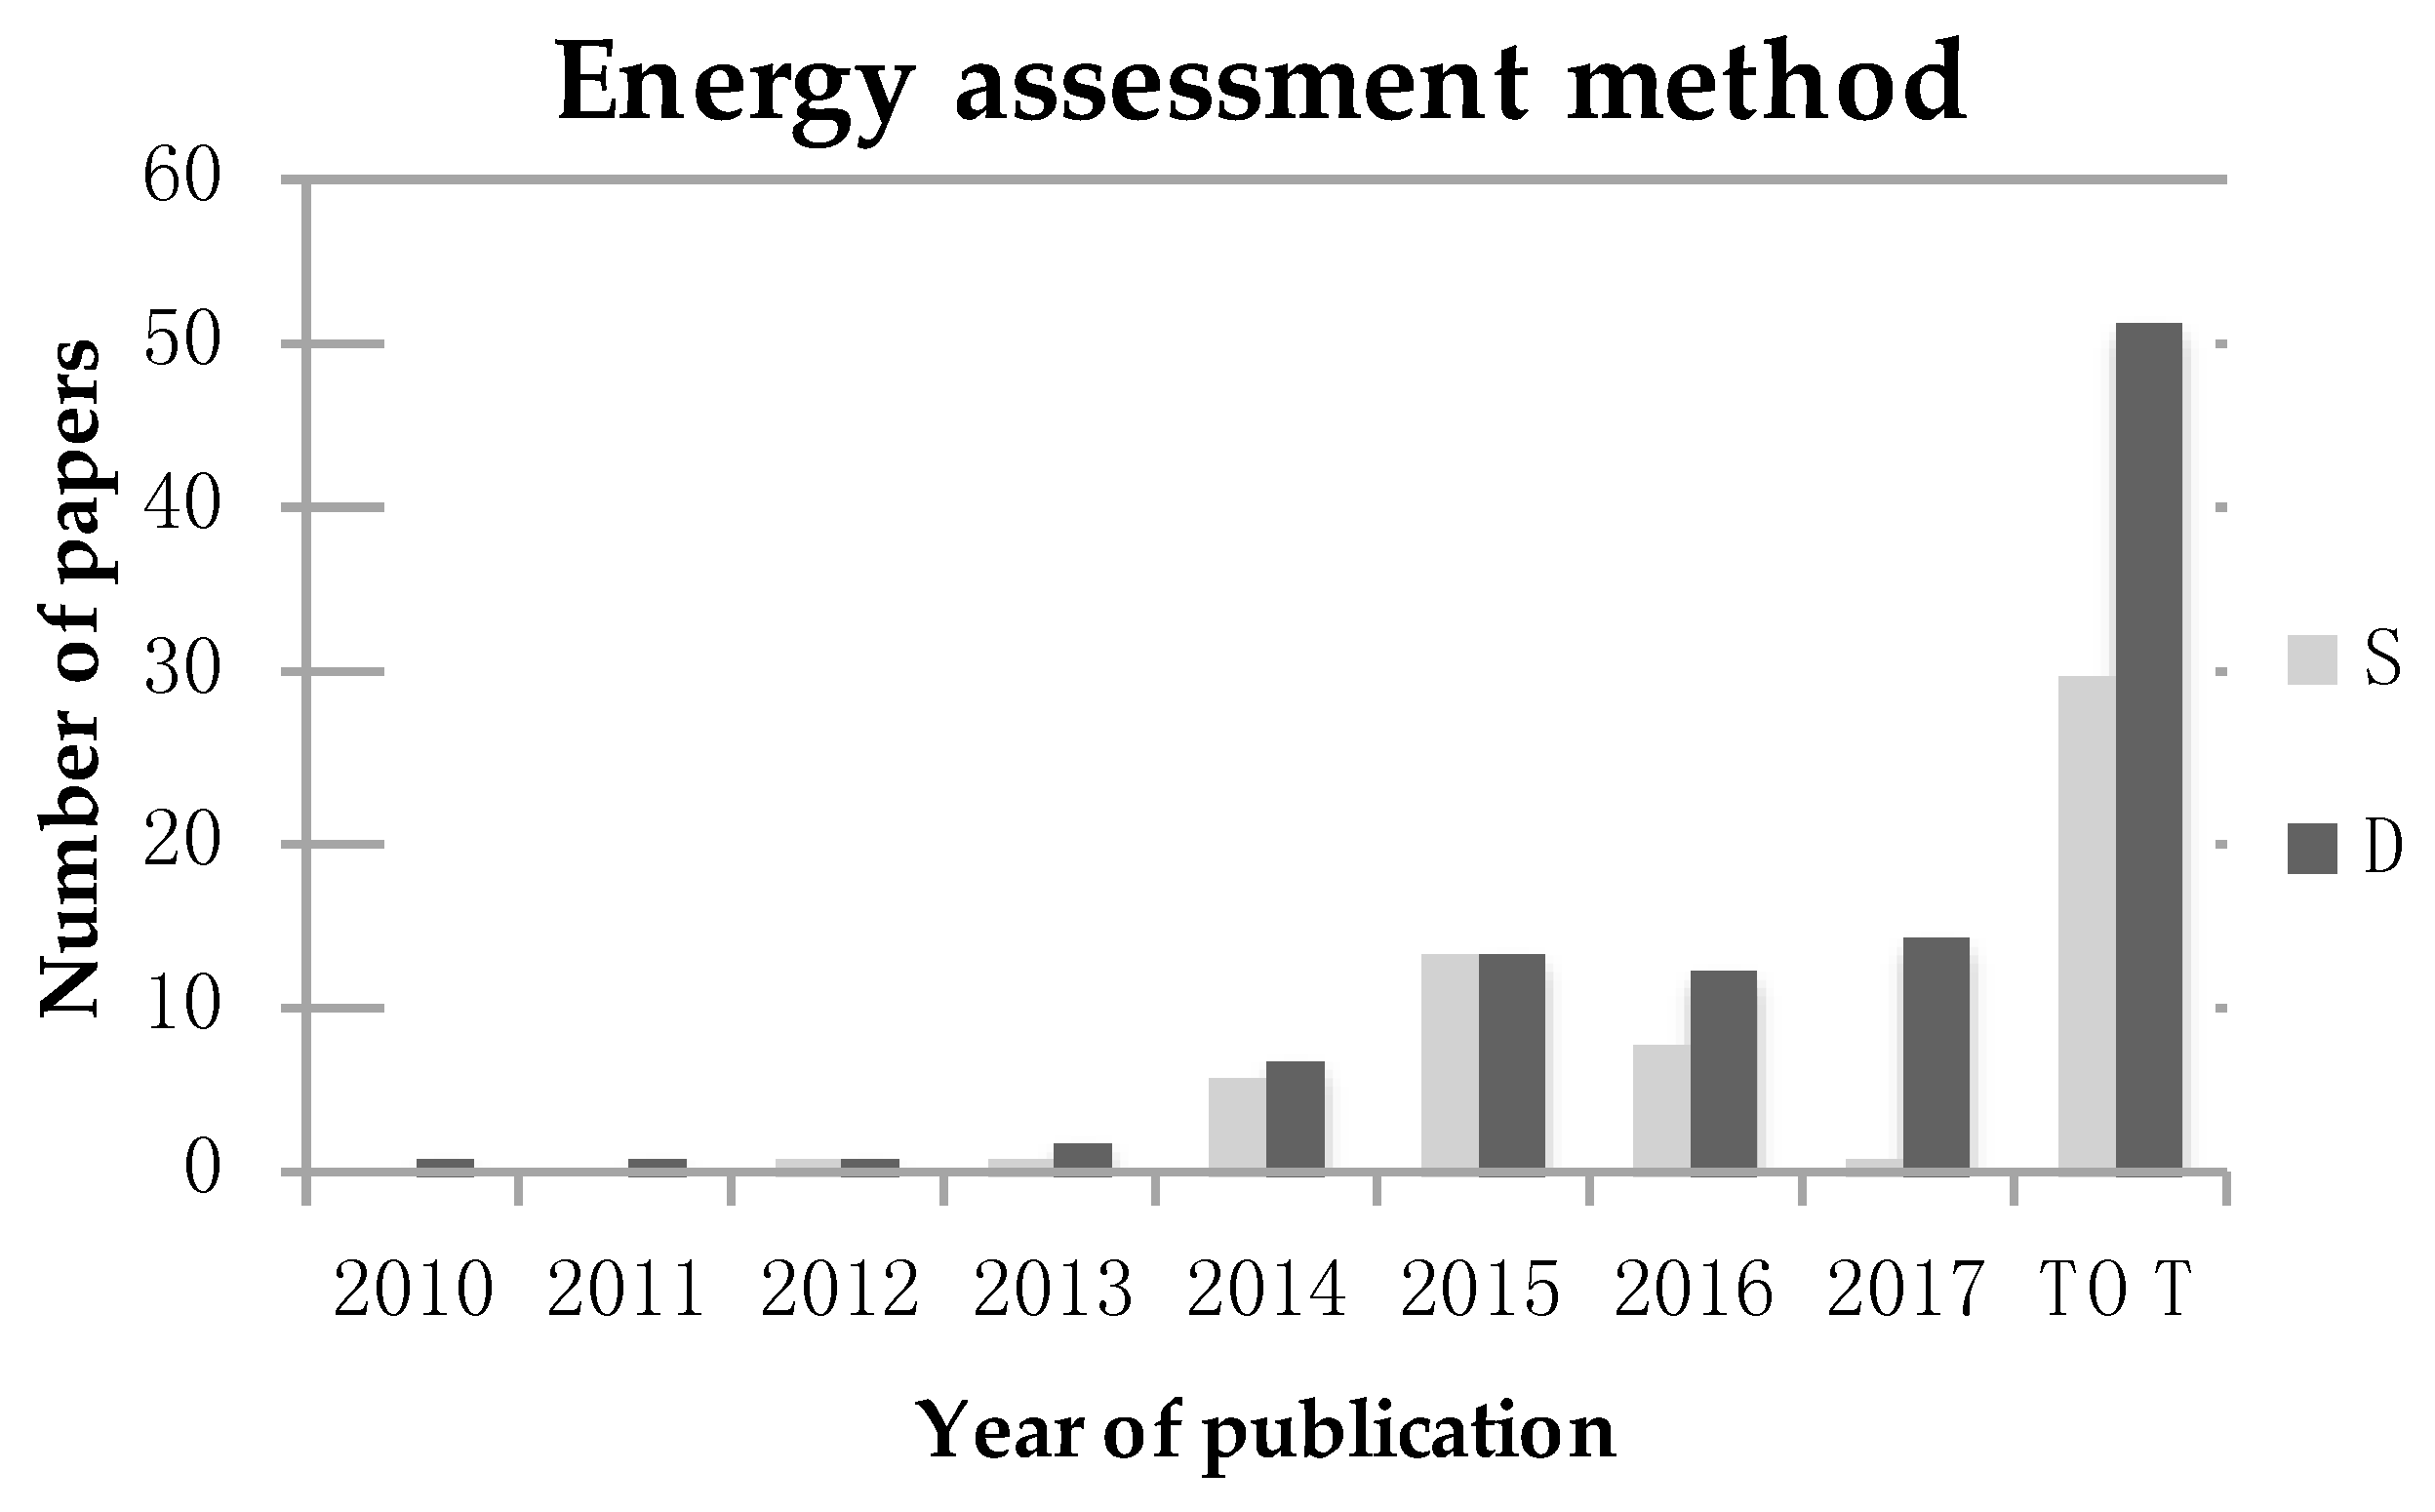
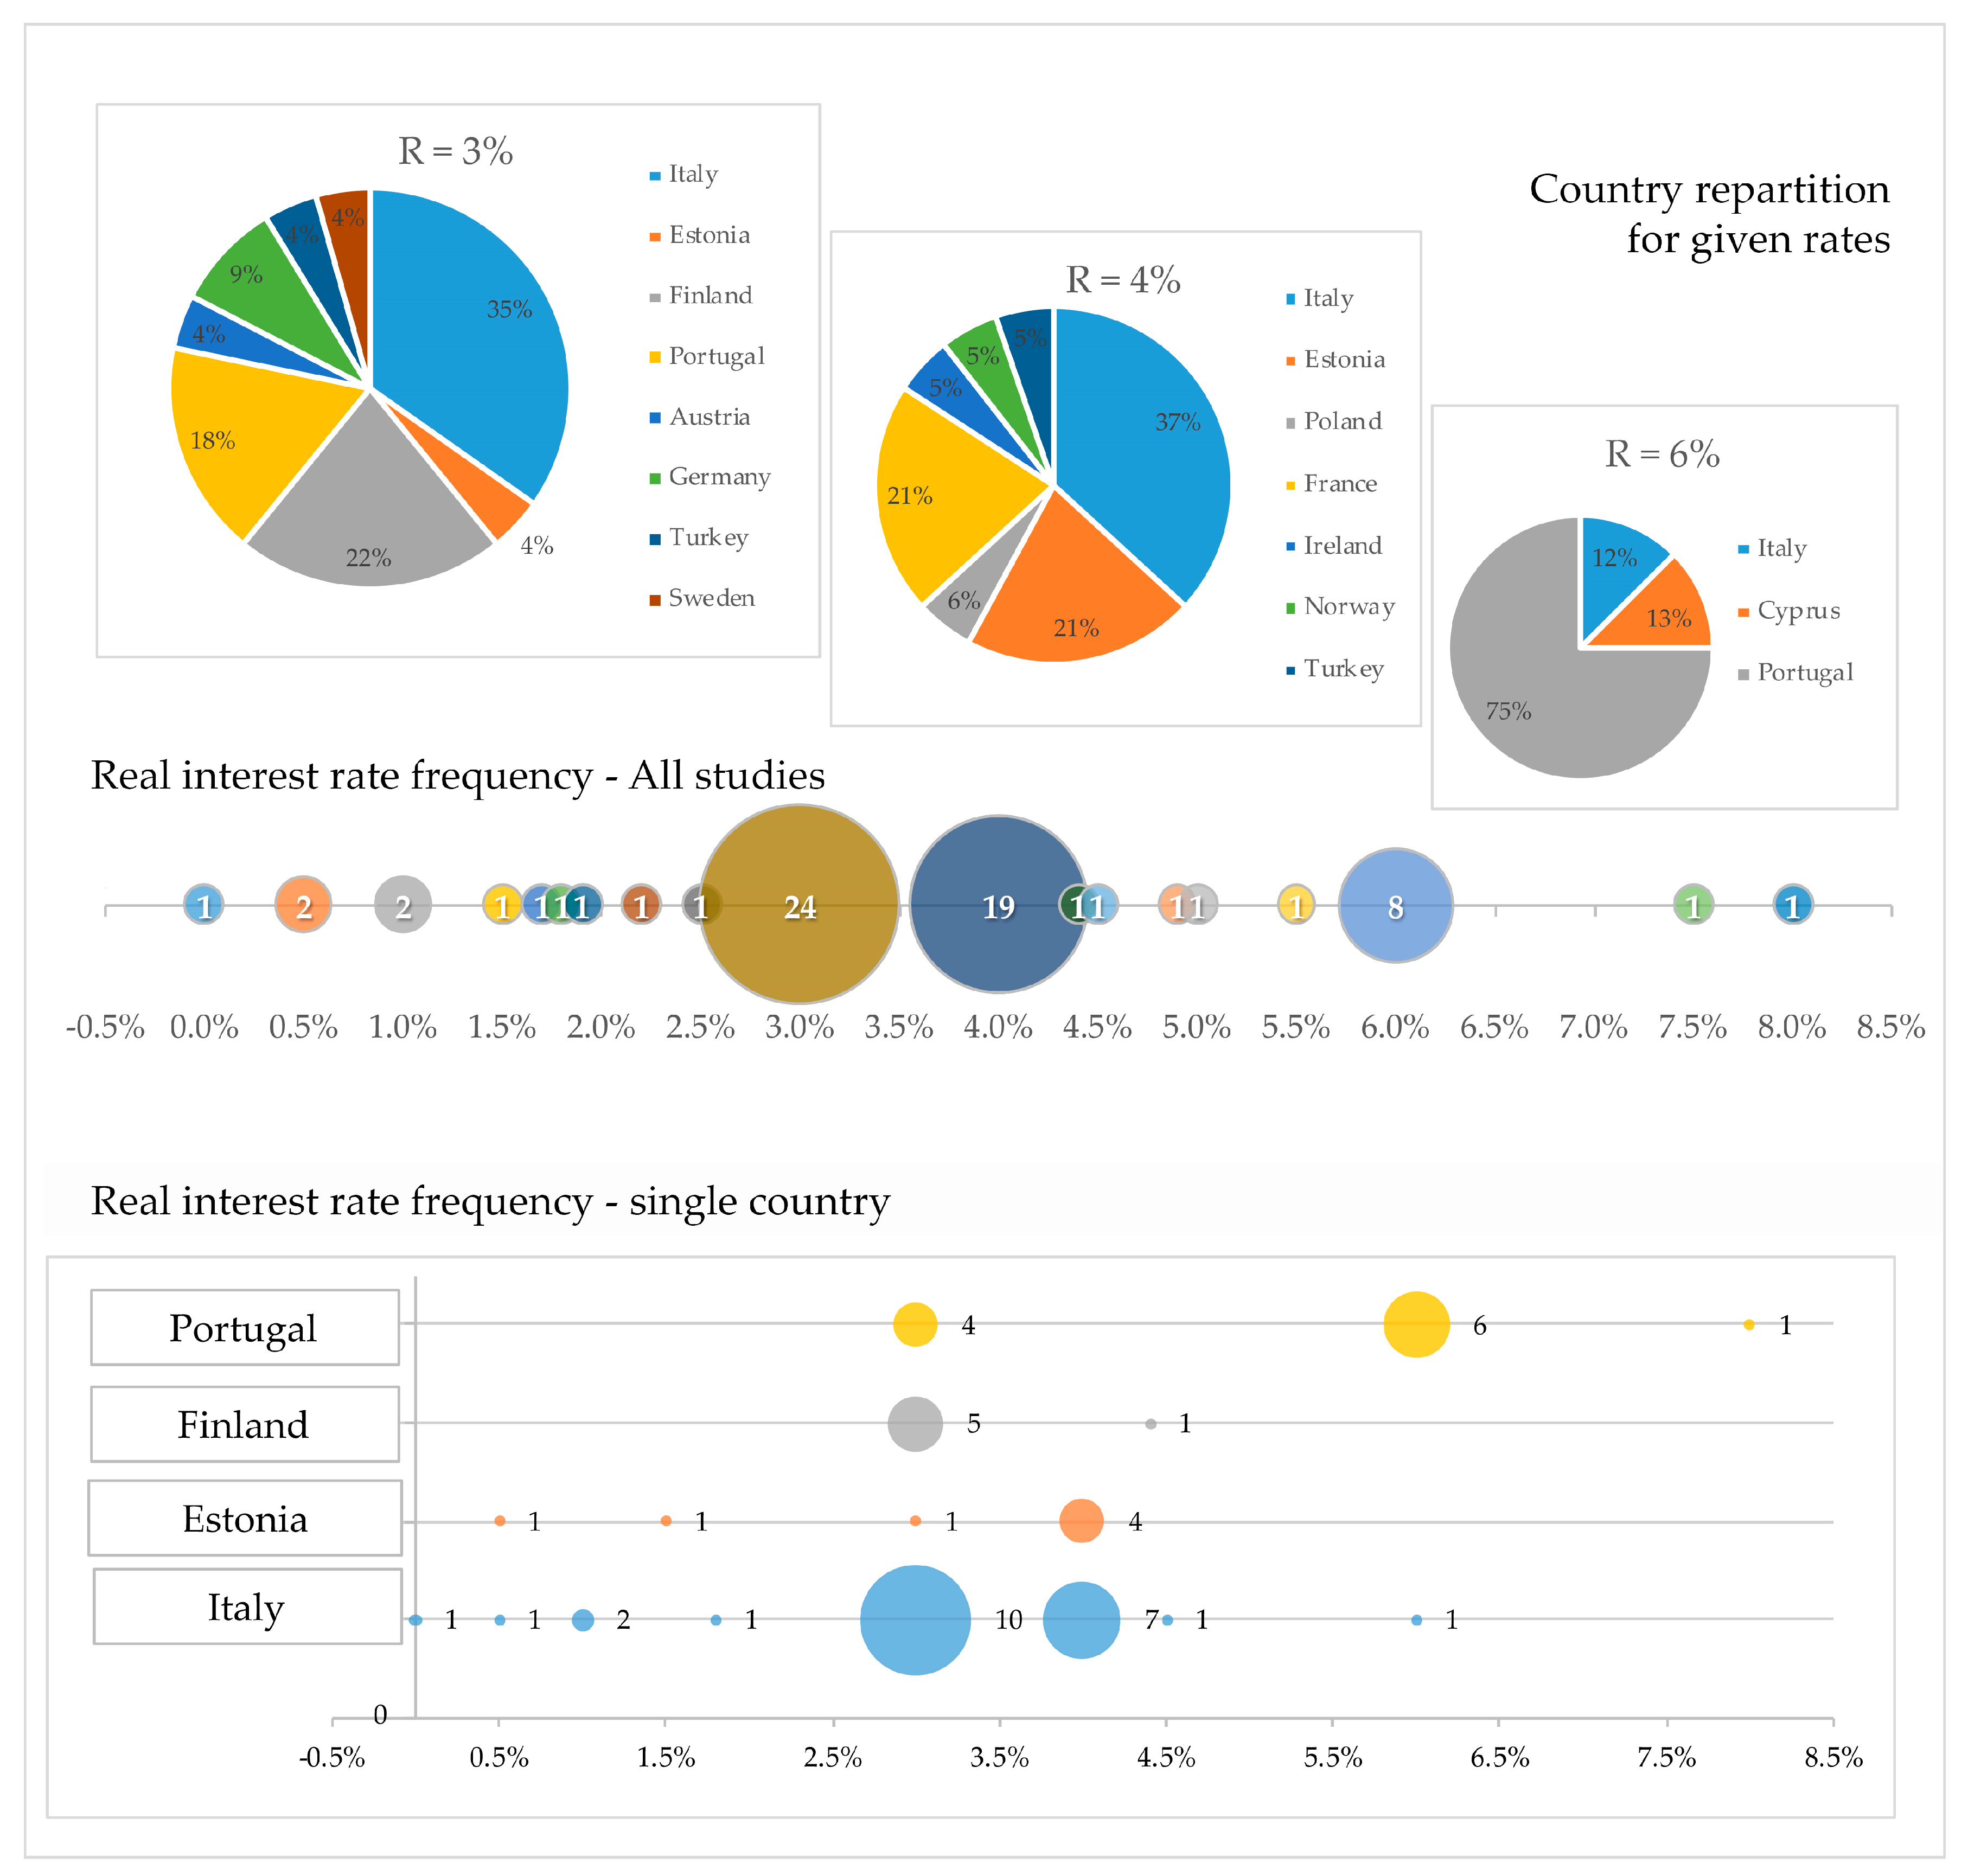
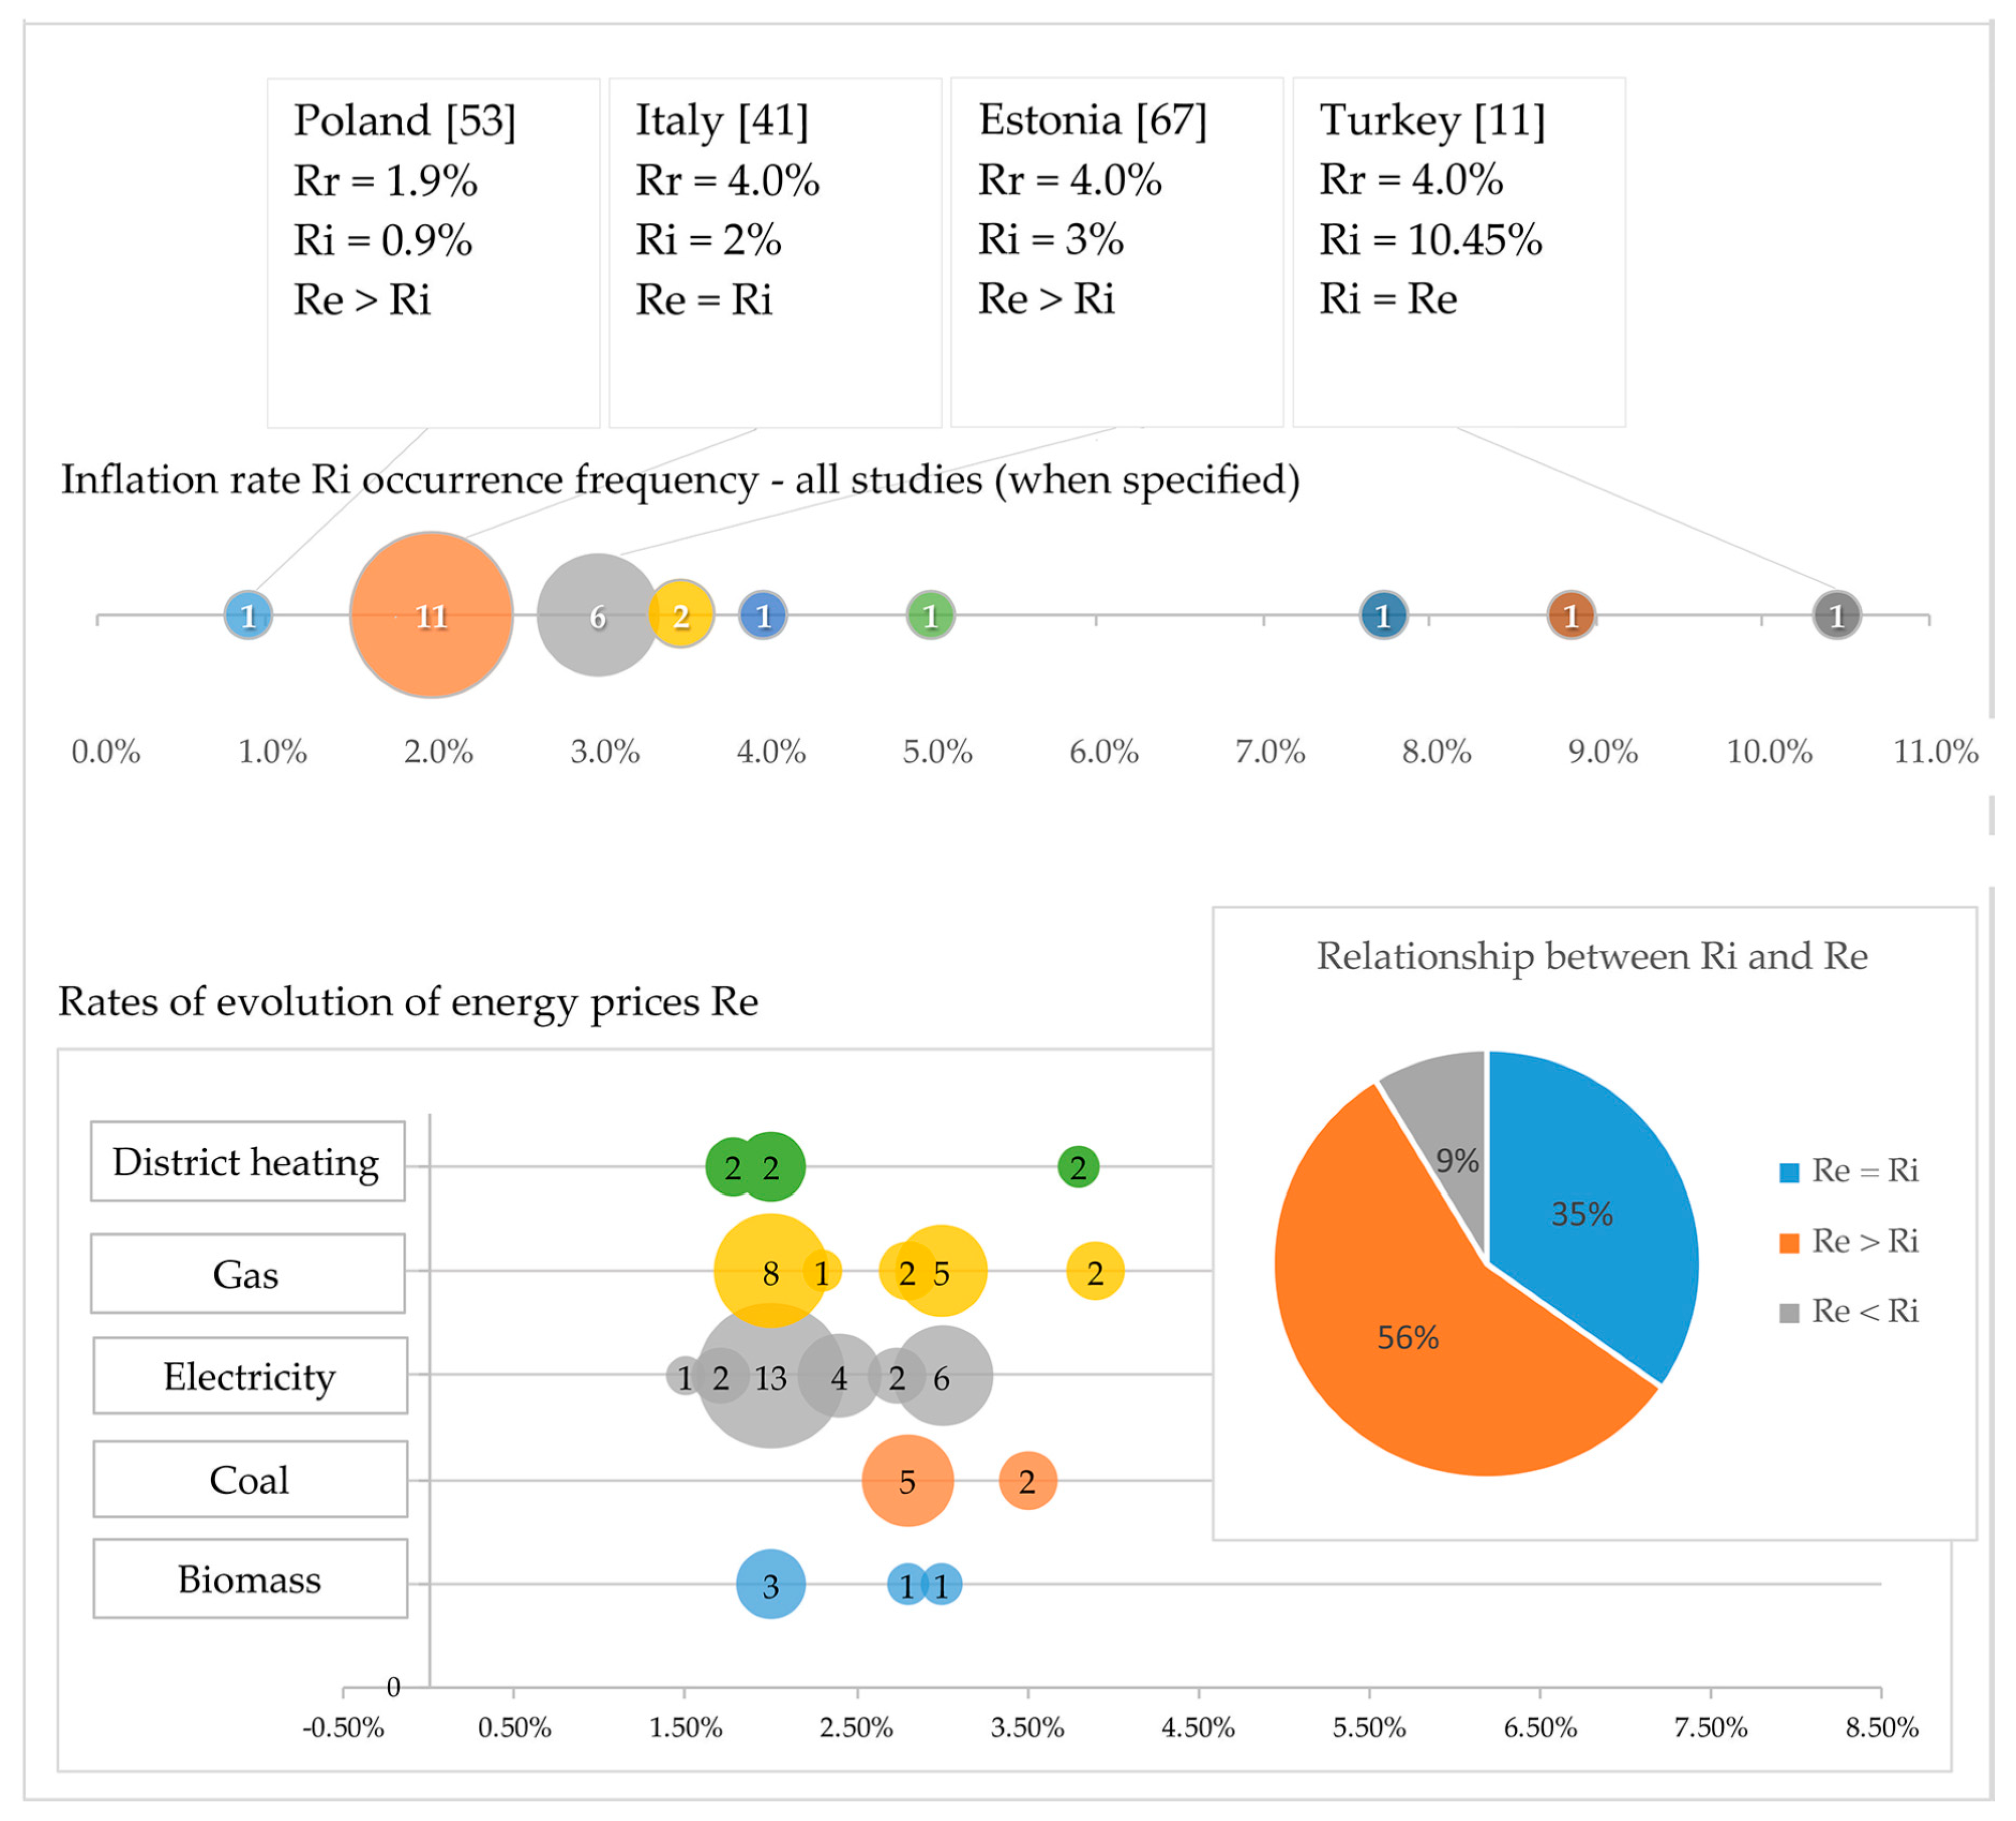
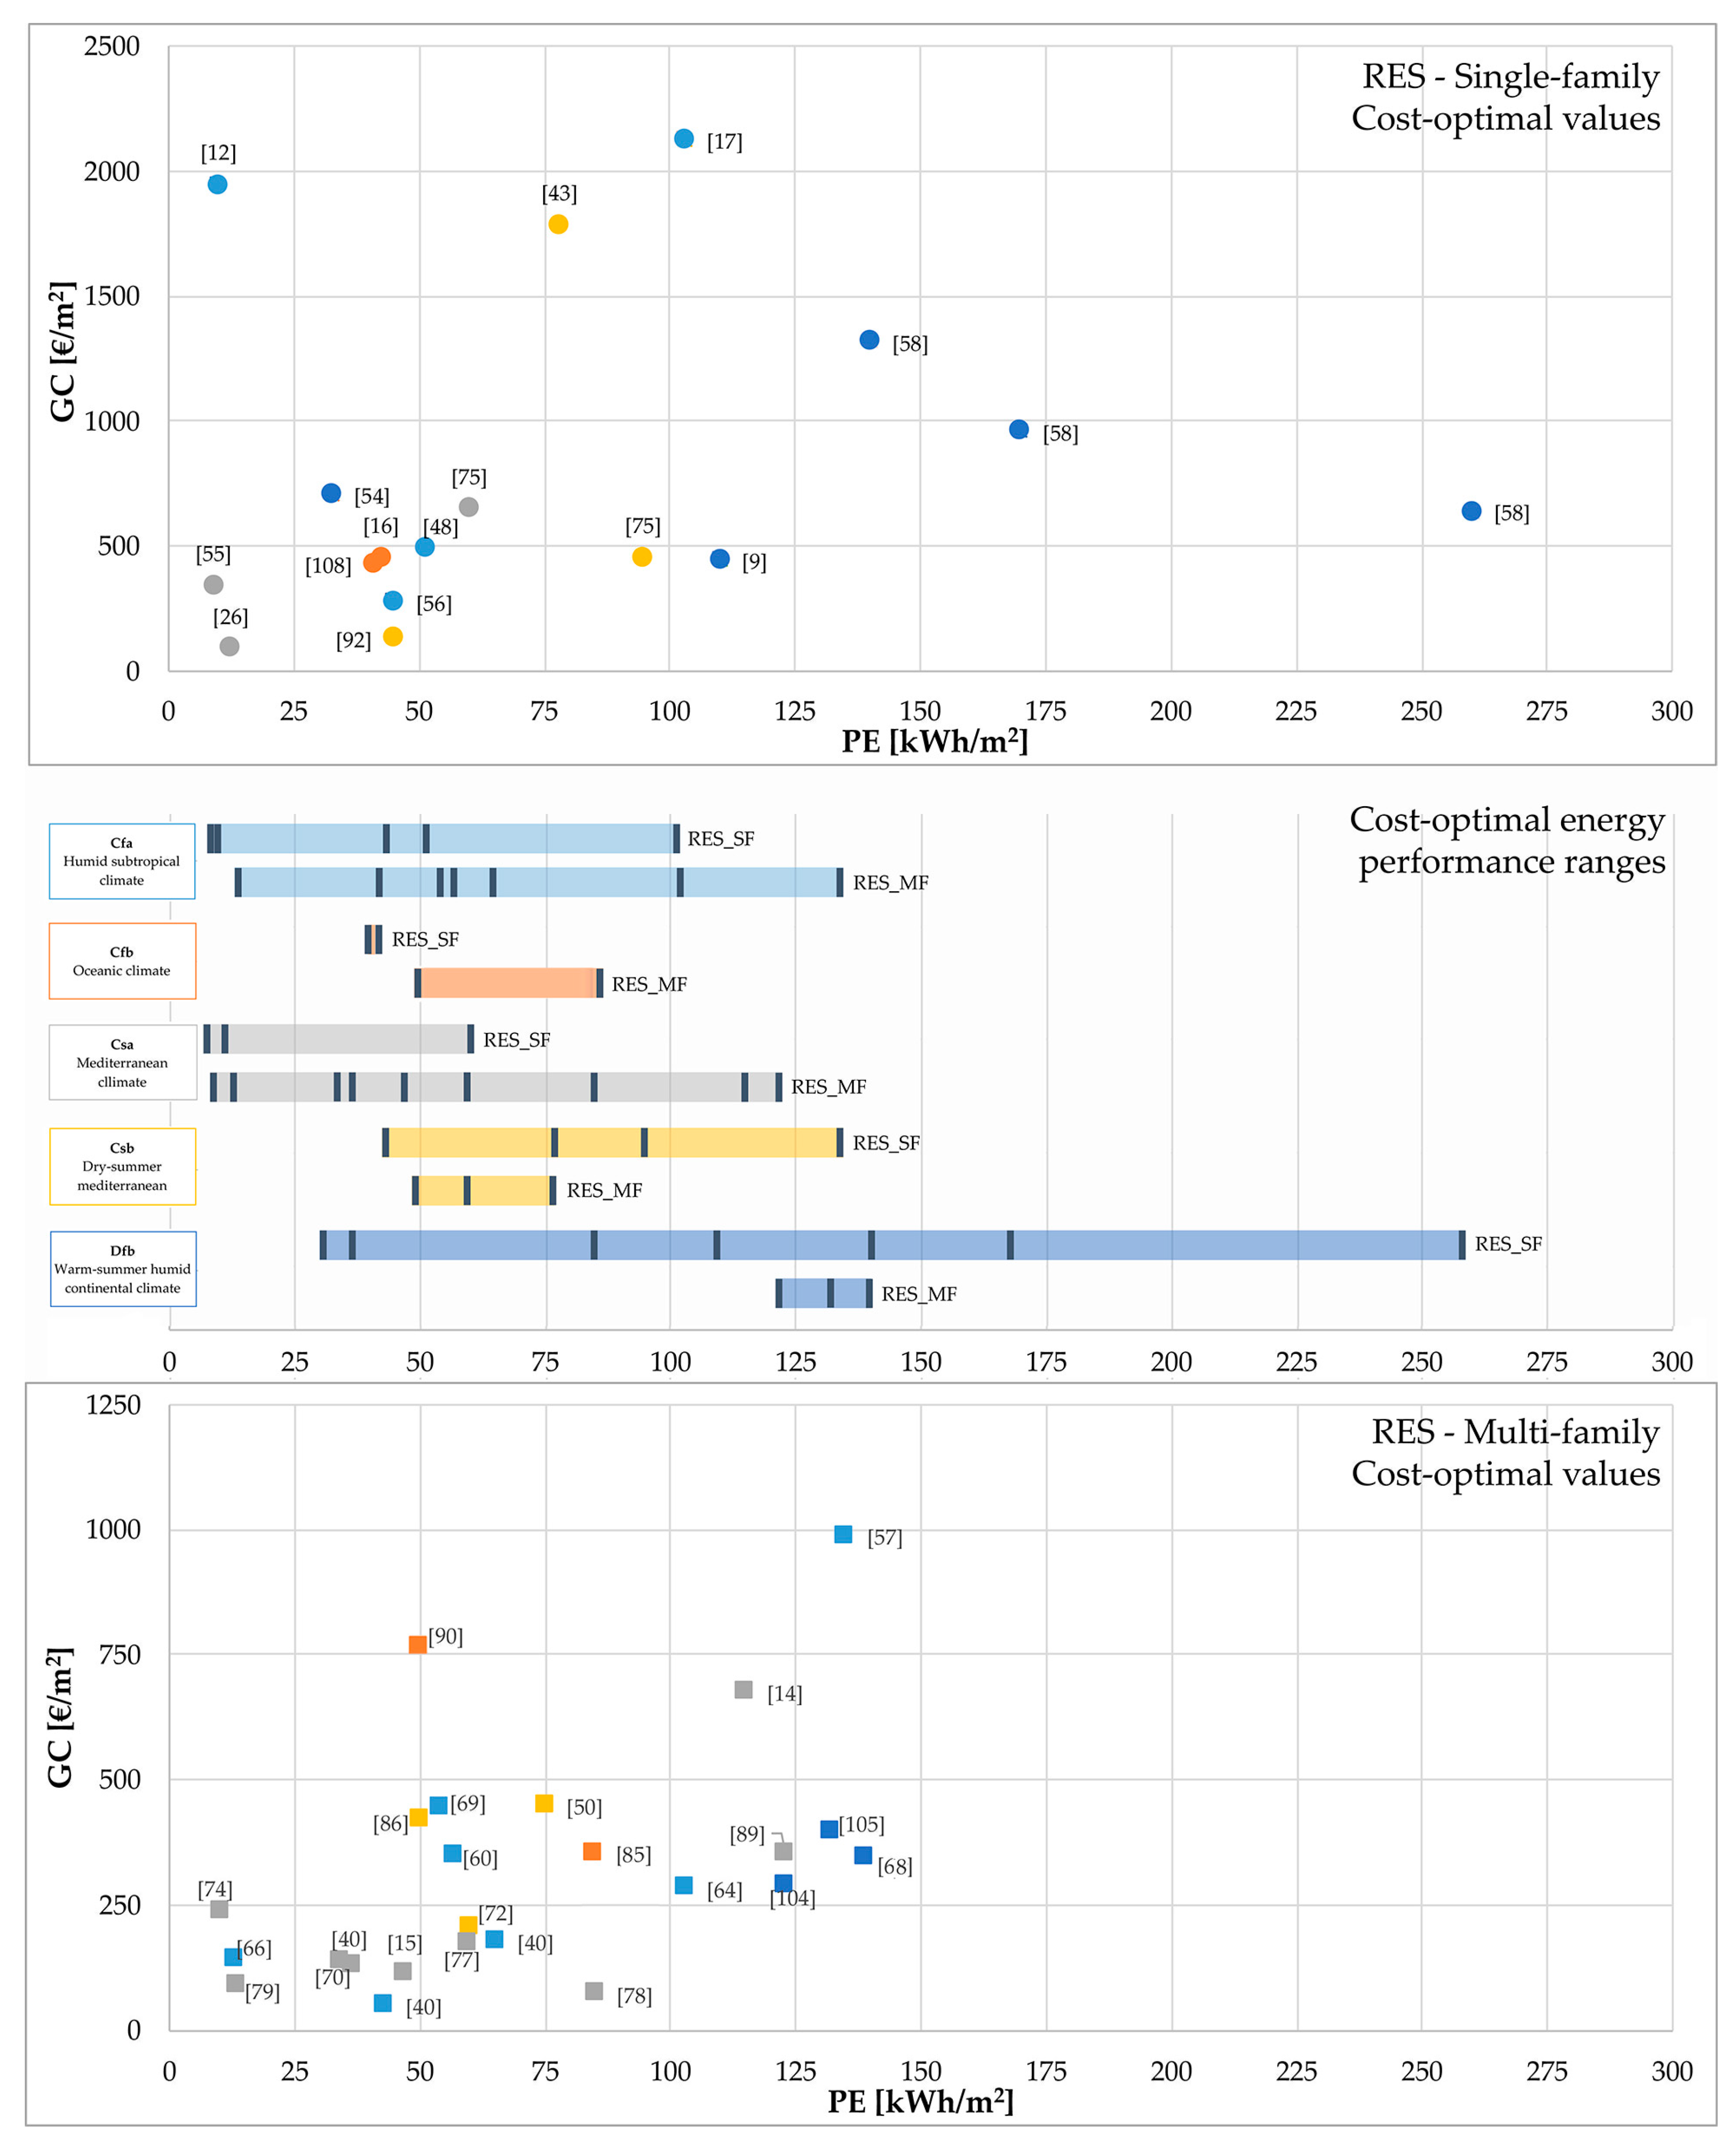
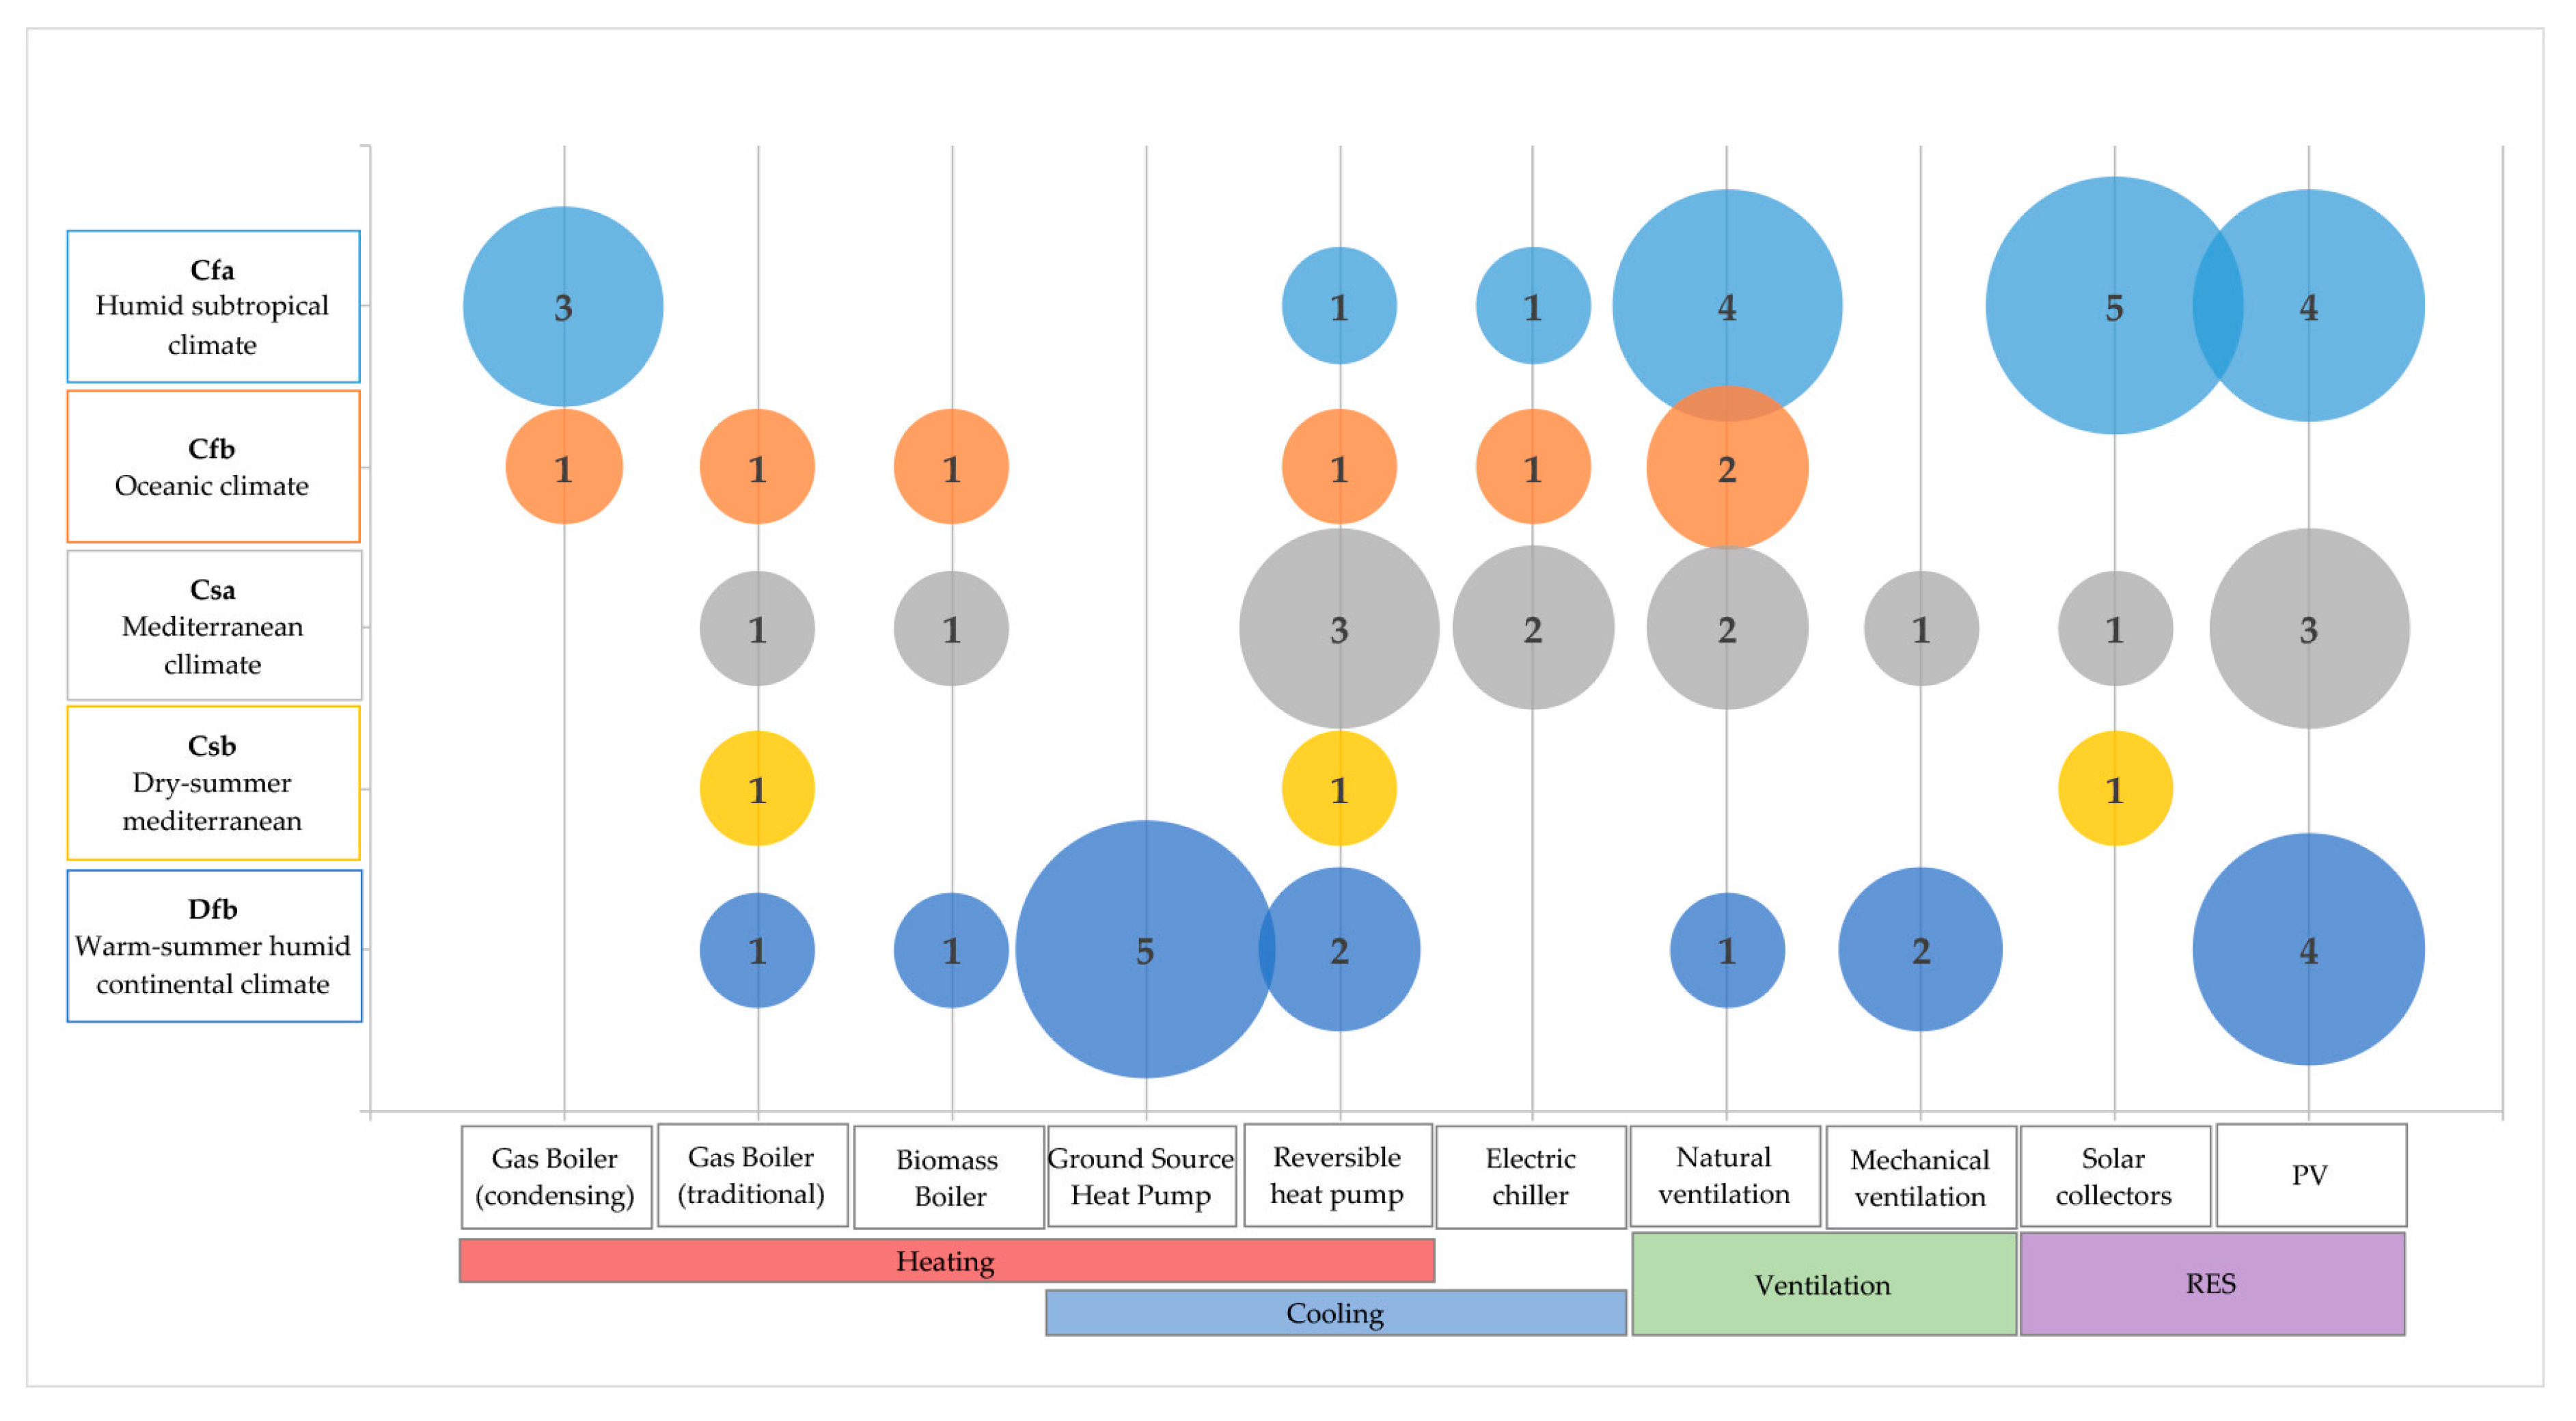
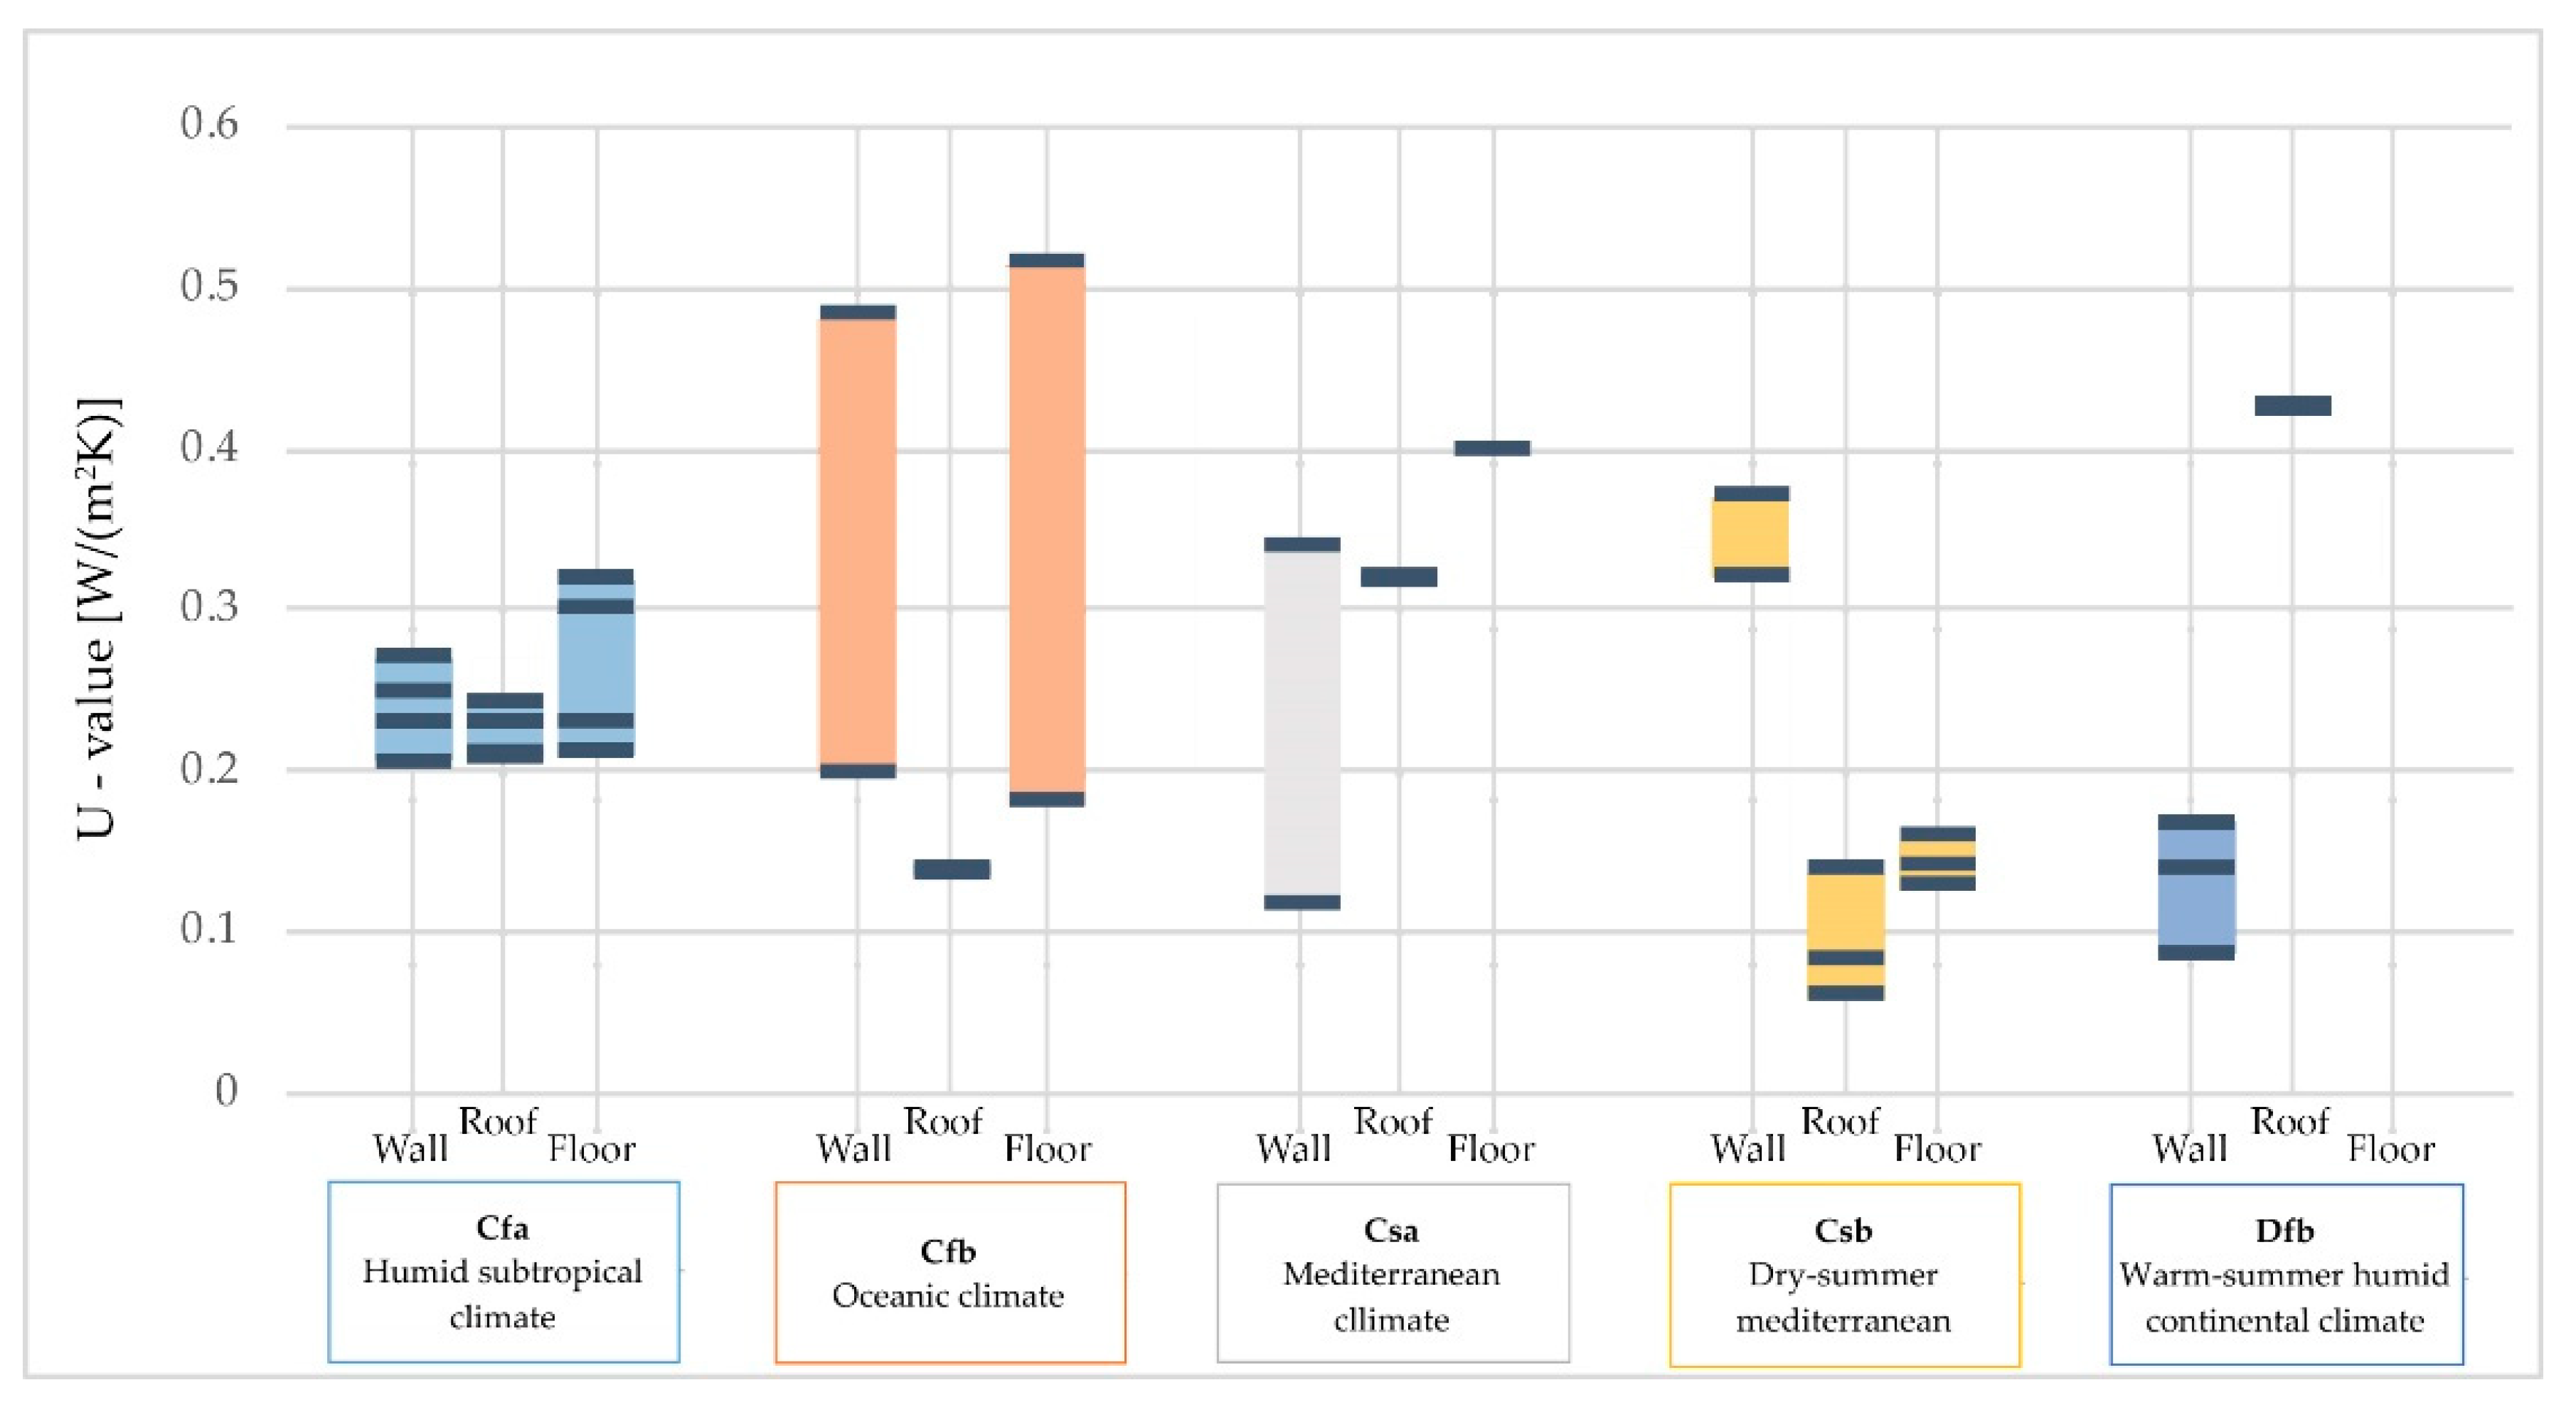
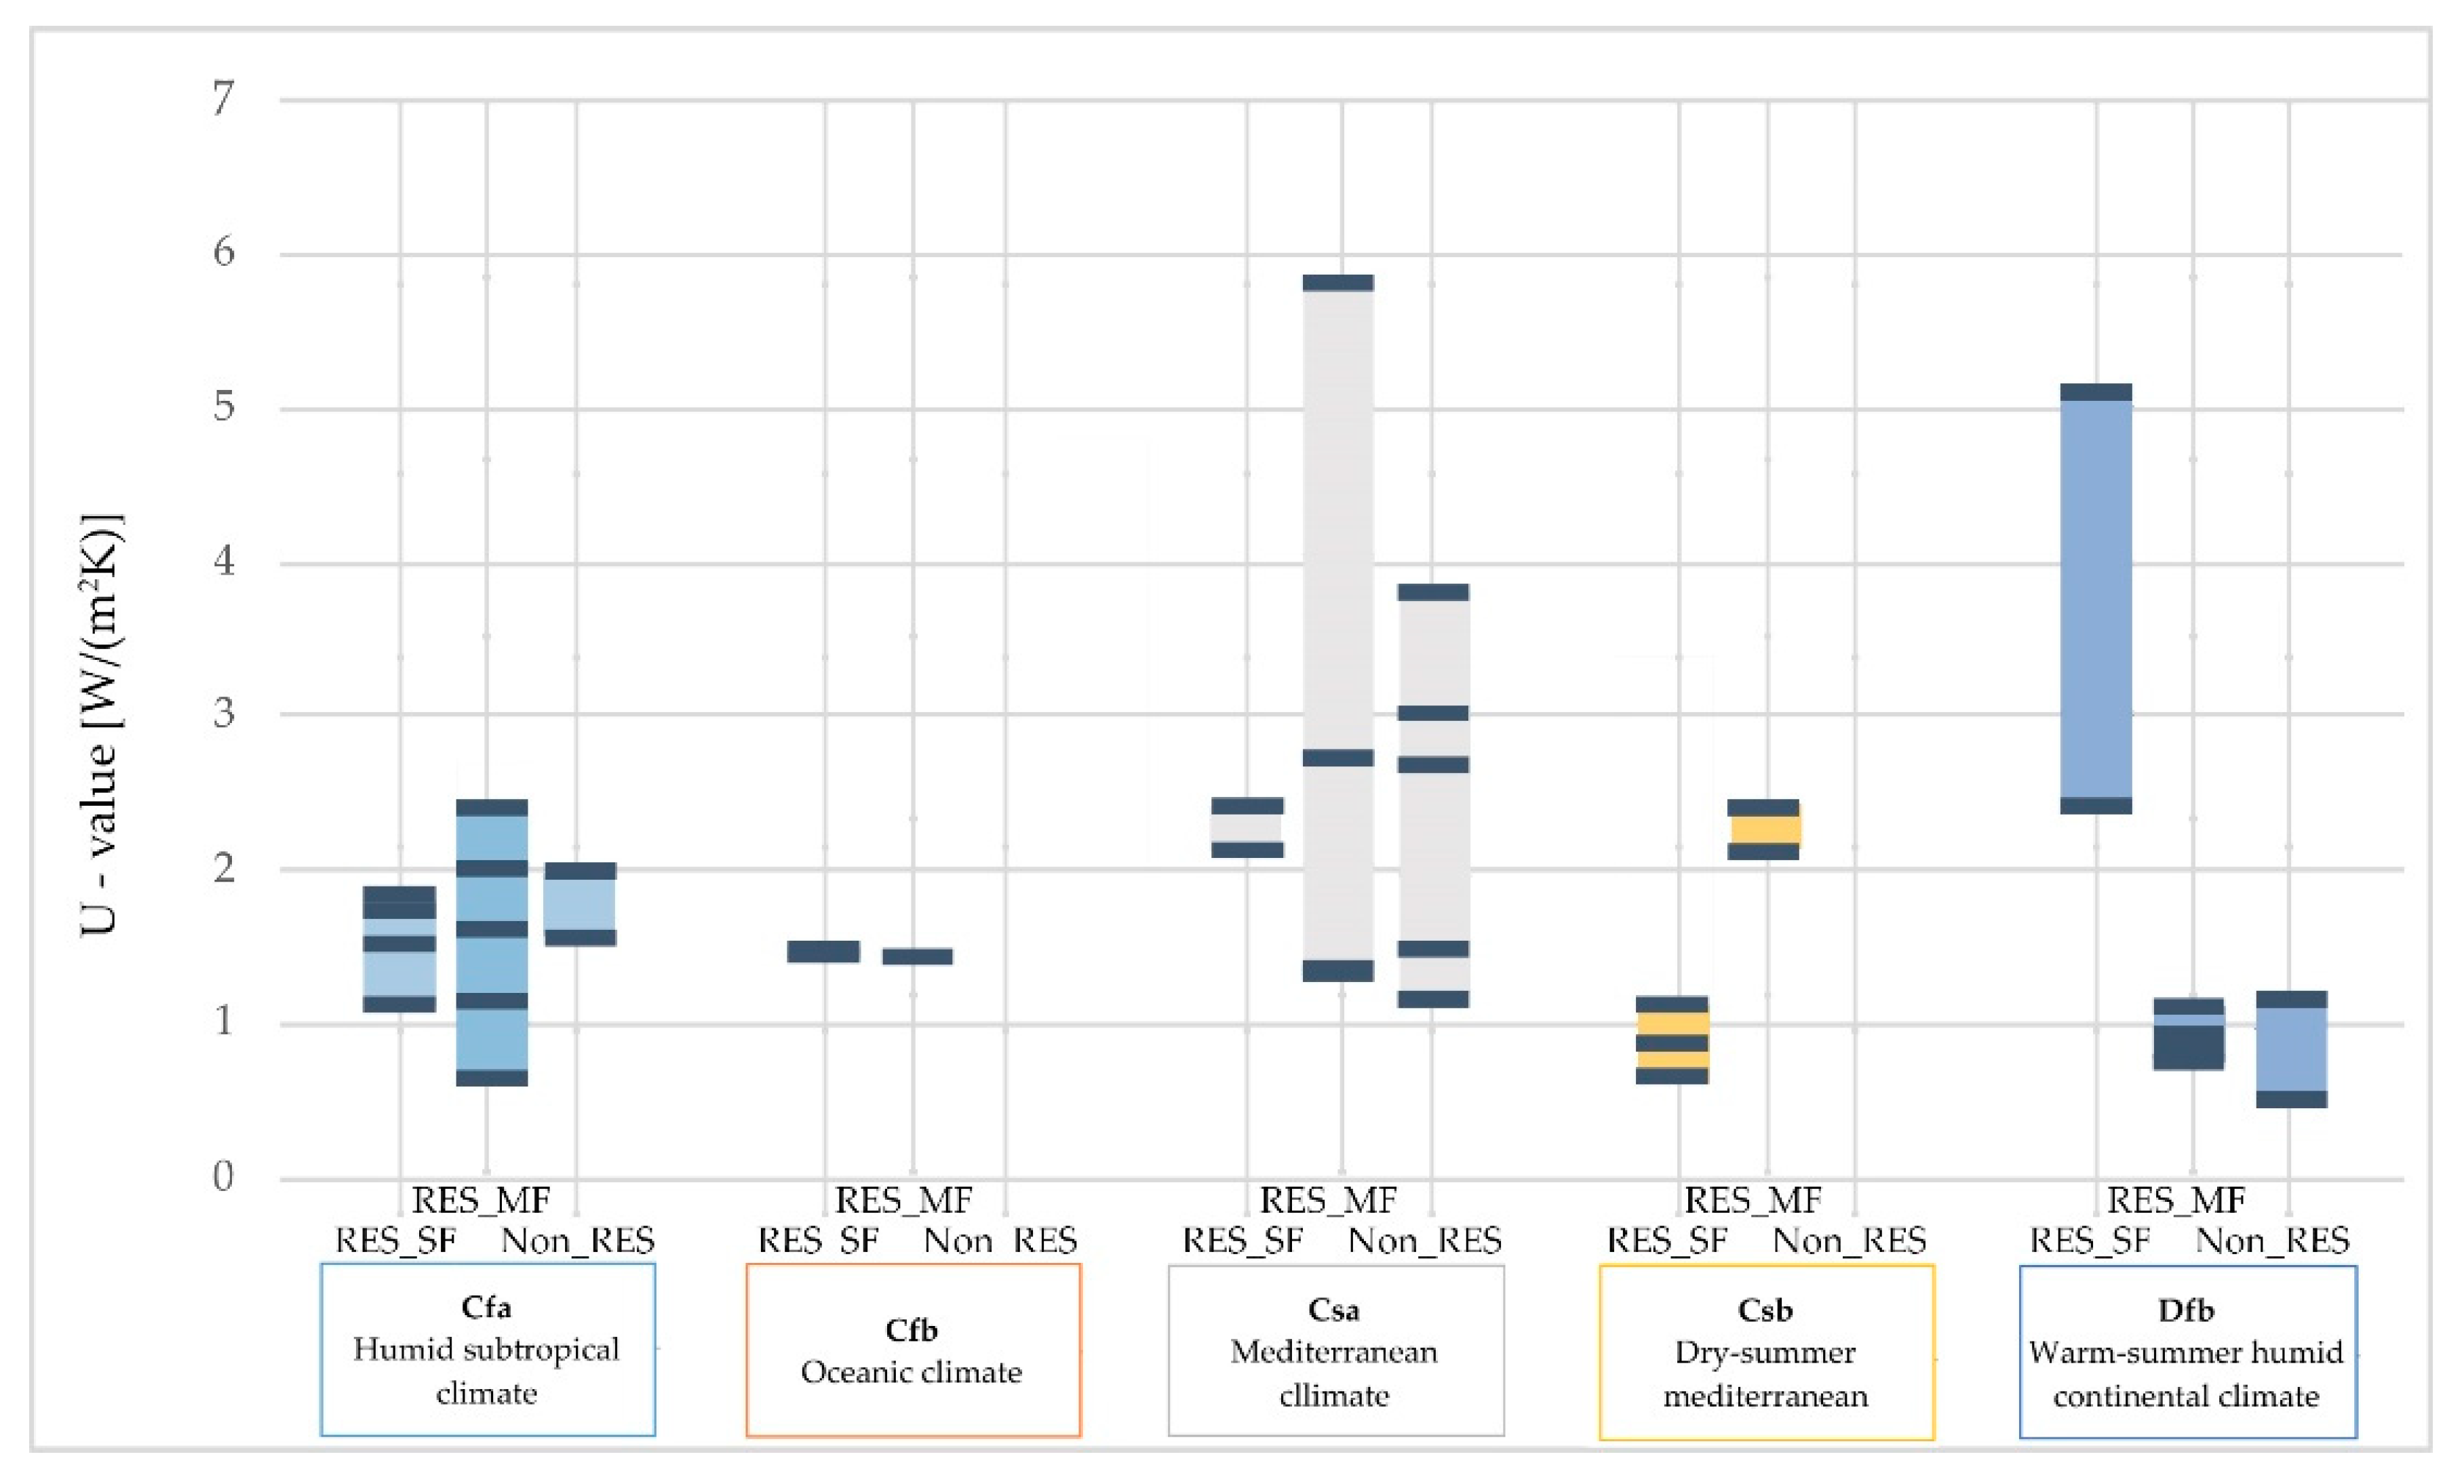
Table 1.
Assumptions for private and societal perspectives. Adapted from [22].
Table 1.
Assumptions for private and societal perspectives. Adapted from [22].
| Parameter | Financial Perspective | Macroeconomic Perspective |
|---|---|---|
| Interest rate | Real interest rate | Societal interest rate |
| Subsidies and incentives | Included | Excluded |
| Taxes | Included | Excluded |
| Cost of emissions | Excluded | Included |
Table 2.
List of papers considered in this work.
| Reference | Authors | Year | Country | Building Type |
|---|---|---|---|---|
| [33] | A.Hasan | 2010 | Finland | RES_SF |
| [9] | J. Kurnitski, et al. | 2011 | Estonia | RES_SF |
| [34] | M. Hamdy, et al. | 2012 | Finland | RES_SF |
| [35] | M. Kapsalaki | 2012 | Sweden, Portugal, Greece | RES_SF |
| [13] | M. Hamdy, et al. | 2013 | Finland | RES_SF |
| [36] | J. Kwiatkowski, et al. | 2013 | Poland | RES_MF |
| [37] | M.J.N. Oliveira Panão, et al. | 2013 | Portugal | RES_MF |
| [38] | M. Thalfeldt, et al. | 2013 | Estonia, France | Office |
| [39] | E. Arumagi, et al. | 2014 | Estonia | RES_MF |
| [40] | N. Aste, et al. | 2014 | Italy | RES_MF |
| [14] | I. Ballarini, et al. | 2014 | Italy | RES_MF |
| [12] | V.M. Barthelmes, et al. | 2014 | Italy | RES_SF |
| [41] | C. Becchio, et al. | 2014 | Italy, Turkey | Office |
| [42] | E. De Angelis, et al. | 2014 | Italy | RES_MF |
| [16] | M. Ferrara, et al. | 2014 | France | RES_SF |
| [43] | M. Ferreira, et al. | 2014 | Portugal | RES_SF |
| [11] | N. Ganic, et al. | 2014 | Turkey | Office |
| [44] | A. Kamenders, et al. | 2014 | Latvia | RES_MF |
| [45] | J. Kurnitski, et al. | 2014 | Estonia | RES_SF/MF, Office, School |
| [10] | E. Pikas, et al. | 2014 | Estonia | Office |
| [46] | C. Pountney, et al. | 2014 | Ireland | RES_SF |
| [47] | L.C. Tagliabue, et al. | 2014 | Italy | RES_MF |
| [25] | G. Teodoriu, et al. | 2014 | Romania | RES_MF |
| [48] | L. Tronchin, et al. | 2014 | Italy | RES_SF |
| [49] | L. Aelenei, et al. | 2015 | Greece, Italy, Portugal, Romania, Spain | Office |
| [50] | M. Almeida, et al. | 2015 | Portugal | RES_MF |
| [15] | F. Ascione, et al. | 2015 | Italy | RES_MF |
| [51] | F. Ascione, et al. | 2015 | Italy | Office |
| [52] | F. Ascione, et al. | 2015 | Germany | Office |
| [53] | M. Basinska, et al. | 2015 | Poland | RES_SF/MF |
| [54] | M. Basinska, et al. | 2015 | Poland | RES_MF |
| [55] | C. Baglivo, et al. | 2015 | Italy | RES_SF |
| [17] | C. Becchio, et al. | 2015 | Italy | RES_SF |
| [56] | C. Becchio, et al. | 2015 | Italy | RES_SF |
| [57] | C. Becchio, et al. | 2015 | Italy | RES_MF |
| [58] | R. Bolliger, et al. | 2015 | Sweden, Switzerland | RES_SF |
| [59] | P.M. Congedo, et al. | 2015 | Italy | Office |
| [60] | V. Corrado, et al. | 2015 | Italy | RES_MF |
| [61] | S. Ferrari, et al. | 2015 | Italy | RES_SF |
| [62] | M. Haase, et al. | 2015 | Latvia, Norway, Spain, Russia, UK | Retail |
| [63] | A. Mohamed, et al. | 2015 | Finland | Office |
| [64] | V. Monetti, et al. | 2015 | Italy | RES_MF |
| [65] | G.M. Mauro, et al. | 2015 | Italy | Office |
| [66] | P. Penna, et al. | 2015 | Italy | RES_MF |
| [67] | E. Pikas, et al. | 2015 | Estonia | RES_MF |
| [68] | E. Pikas, et al. | 2015 | Estonia | RES_MF |
| [69] | D. Prando, et al. | 2015 | Italy | RES_MF |
| [70] | N.G. Saglam, et al. | 2015 | Turkey | RES_MF |
| [71] | E. Stocker, et al. | 2015 | Austria | School |
| [72] | S. Tadeu, et al. | 2015 | Portugal | RES_MF |
| [73] | Q. Wang, et al. | 2015 | Sweden | RES_SF |
| [74] | I. Zacà, et al. | 2015 | Italy | RES_MF |
| [75] | C. Araujo, et al. | 2016 | Portugal | RES_SF |
| [76] | F. Ascione, et al. | 2016 | Italy | Others |
| [77] | F. Ascione, et al. | 2016 | Italy | RES_MF |
| [78] | T. Ashrafian, et al. | 2016 | Turkey | RES_SF |
| [26] | A. Brandao de Vasconcelosa, et al. | 2016 | Portugal | RES_SF |
| [79] | A. Brandao de Vasconcelosa, et al. | 2016 | Portugal | RES_MF |
| [80] | P. Brinks, et al. | 2016 | Germany | Others |
| [81] | K.B. Lindberg, et al. | 2016 | Germany | RES_MF |
| [82] | S. Chardon, et al. | 2016 | France | RES_SF |
| [83] | P. M. Congedo, et al. | 2016 | Italy | School |
| [84] | V. Corrado, et al. | 2016 | Italy | RES_MF |
| [32] | M. Ferrara, et al. | 2016 | France | RES_SF |
| [85] | M. Ferreira, et al. | 2016 | Portugal | RES_MF |
| [86] | M. Ferreira, et al. | 2016 | Portugal | RES_SF, MF |
| [87] | K.B. Lindberg, et al. | 2016 | Norway | School |
| [88] | T. Niemela, et al. | 2016 | Finland | School |
| [89] | J. Ortiza, et al. | 2016 | Spain | RES_MF |
| [90] | S. Silva, et al. | 2016 | Portugal | RES_MF |
| [91] | S. Stevanovic, et al. | 2016 | Serbia | Office |
| [92] | S. Tadeu, et al. | 2016 | Portugal | RES_SF |
| [93] | D. Testi, et al. | 2016 | Italy | Others |
| [94] | F. Ascione, et al. | 2017 | Germany | Office |
| [95] | F. Ascione, et al. | 2017 | Italy | RES_SF |
| [96] | F. Ascione, et al. | 2017 | Italy | Others |
| [97] | F. Ascione, et al. | 2017 | Italy | RES_MF |
| [98] | F. Ascione, et al. | 2017 | Italy | Office |
| [99] | I. Ballarini, et al. | 2017 | Italy | RES_SF |
| [100] | M. Ferrara, et al. | 2017 | France | RES_SF |
| [101] | M. Hamdy, et al. | 2017 | Finland | RES_SF |
| [102] | S. Kumar Pal, et al. | 2017 | Finland | RES_SF |
| [103] | K. Loukaidou, et al. | 2017 | Cyprus | Others |
| [104] | T. Niemela, et al. | 2017 | Finland | RES_MF |
| [105] | T. Niemela, et al. | 2017 | Finland | RES_MF |
| [106] | N.G. Saglam, et al. | 2017 | Turkey | RES_MF |
| [107] | M. Thalfeldt, et al. | 2017 | Estonia | Office |
| [108] | J.C. Vallée, et al. | 2017 | France | RES_SF |
Table 3.
Number of papers for each combination of methodological approach.
| EP Assessment | EEMs Selection | ||
|---|---|---|---|
| Manual (M) | Automated (A) | n/a | |
| Simplified method (S) | 21 | 9 | 1 |
| Dynamic calculation (D) | 29 | 22 | 0 |
| n/a | 3 | 0 | 2 |
© 2018 by the authors. Licensee MDPI, Basel, Switzerland. This article is an open access article distributed under the terms and conditions of the Creative Commons Attribution (CC BY) license (http://creativecommons.org/licenses/by/4.0/).
Share and Cite
MDPI and ACS Style
Ferrara, M.; Monetti, V.; Fabrizio, E. Cost-Optimal Analysis for Nearly Zero Energy Buildings Design and Optimization: A Critical Review. Energies 2018, 11, 1478. https://doi.org/10.3390/en11061478
AMA Style
Ferrara M, Monetti V, Fabrizio E. Cost-Optimal Analysis for Nearly Zero Energy Buildings Design and Optimization: A Critical Review. Energies. 2018; 11(6):1478. https://doi.org/10.3390/en11061478
Chicago/Turabian StyleFerrara, Maria, Valentina Monetti, and Enrico Fabrizio. 2018. "Cost-Optimal Analysis for Nearly Zero Energy Buildings Design and Optimization: A Critical Review" Energies 11, no. 6: 1478. https://doi.org/10.3390/en11061478
Note that from the first issue of 2016, this journal uses article numbers instead of page numbers. See further details here.