Loading History Effect on Creep Deformation of Rock
by
 , ,
, ,
Wendong Yang
1,* ,
,
Ranjith Pathegama Gamage
2,
Chenchen Huang
1,
Guangyu Luo
1,
Jingjing Guo
1 and
Shugang Wang
3 1
College of Pipeline and Civil Engineering, China University of Petroleum, Qingdao 266580, China
2
Deep Earth Energy Research Laboratory, Department of Civil Engineering, Monash University, 3800 Melbourne, VIC, Australia
3
Research Center of Geotechnical and Structural Engineering, Shandong University, Jinan 250061, China
*
Author to whom correspondence should be addressed.
Energies 2018, 11(6), 1462; https://doi.org/10.3390/en11061462
Submission received: 6 May 2018
/
Revised: 22 May 2018
/
Accepted: 31 May 2018
/
Published: 6 June 2018
Abstract
:The creep characteristics of rocks are very important for assessing the long-term stability of rock engineering structures. Two loading methods are commonly used in creep tests: single-step loading and multi-step loading. The multi-step loading method avoids the discrete influence of rock specimens on creep deformation and is relatively time-efficient. It has been widely accepted by researchers in the area of creep testing. However, in the process of multi-step loading, later deformation is affected by earlier loading. This is a key problem in considering the effects of loading history. Therefore, we intend to analyze the deformation laws of rock under multi-step loading and propose a method to correct the disturbance of the preceding load. Based on multi-step loading creep tests, the memory effect of creep deformation caused by loading history is discussed in this paper. A time-affected correction method for the creep strains under multi-step loading is proposed. From this correction method, the creep deformation under single-step loading can be estimated by the super-position of creeps obtained by the dissolution of a multistep creep. We compare the time-affected correction method to the coordinate translation method without considering loading history. The results show that the former results are more consistent with the experimental results. The coordinate translation method produces a large error which should be avoided.
1. Introduction
Time-dependent behavior is one of the most important properties of geomaterials, such as rock and soil. Creep is one important aspect of the time-dependent behavior of rocks, which is particularly relevant for cases where the applied load or stress is kept constant. In Figure 1, three cases are illustrated with respect to the complete stress-strain curve: creep, i.e., increasing strain when the stress is held constant; stress relaxation, i.e., decreasing stress when the strain is held constant; and a combination of both, when the rock unloads along a chosen unloading path (Aydan et al. [1]).
Creep properties of rocks occur both under natural conditions, in long-standing geological processes, and in the interaction of the rock with engineering installations, for example, when undertaking various types of excavation in rocks. For example, Figure 2 shows a significant time-dependent behavior observed in the tabular excavations of the South African gold mines.
Creep behavior is generally divided into primary, secondary (or steady-state), and tertiary (or accelerated), creep stages. Creep experiments are often used to determine the time-dependent strength and time-dependent parameters of rocks [5,6,7,8,9,10,11,12,13,14,15,16,17,18,19,20,21,22,23,24,25,26,27,28,29,30]. Creep tests have been carried out on soft rocks such as soil or sand (Perzyna [5]; Lade and Liu [6]; Zhou et al. [7]), tuff (Akai et al. [8]; Okubo et al. [9,10]), argillaceous (Fabre and Pellet [11]), and sandstone (Boukharov et al. [12]), medium-hard rocks such as marble (Liu and Shao [13]), sandstone (Baud and Meredith [14]; Heap et al. [15]; Yang and Jiang [16]), and rock salt (Chan [17]; Yang et al. [18]; Hunsche and Hampel [19]; Slizowski and Lankof [20]; Berest et al. [21]), and hard rocks such as granite (Lomnitz [22]; Lockner and Byerlee [23]; Van der Molen and Paterson [24]; Ito et al. [25]; Masuda et al. [26,27]), diabase (Yang et al. [28,29]), and basalt (Heap et al. [30]).
Due to the limitations of experimental conditions, creep tests are usually performed for hours or days, some tests are carried out for a few months, and very few experiments can be carried out for several years [31,32,33,34,35,36]. Therefore, generally speaking, the creep time of the test in a laboratory is much lower than the very long creep time of in situ rock and soil. However, it is important to estimate the long-term deformation and strength behavior of in situ rock and soil based on the relatively short time of creep testing in the laboratory. Caution should be exercised in relation to laboratory creep tests, and we need to consider all the factors in order for the results of creep tests in the laboratory obtained in a relatively short time to accurately reflect the creep properties of real rock masses (Aydan et al. [1]).
One of the most commonly used methods for rock creep experiments is single-step loading on a single specimen, and several specimens are used to complete all the loading levels. The impact of the early loading history can be avoided by using this method. However, this method requires a series of rock specimens with the same properties. It is also worth noting that it is very difficult to avoid the impact of the heterogeneity of the material on creep test results (Yu et al. [37]). Another widely used method is the multi-step loading method. This method avoids the discrete influence of rock specimens on creep deformation, but the creep deformation in the current step includes the creep deformation that occurred in the previous loading steps. Therefore, in this paper, we intend to analyze the deformation laws of rock under multi-step loading and propose a method to correct the disturbance of the preceding load.
Some previous studies have investigated creep properties utilizing single-step loading creep tests (Yang et al. [38]). For example, Liu et al. [39] conducted triaxial creep tests on some clayey rock specimens using one-step deviatoric loading with the same hydrostatic stress to avoid the influence of loading path. In order to evaluate the creep stress threshold, six samples were tested in uniaxial creep tests with constant compression stresses of 40 MPa (43% σcd), 50 MPa (53.8% σcd), 60 MPa (64.5% σcd), 70 MPa (75.3% σcd), 80 MPa (86.0% σcd) and 90 MPa (96.8% σcd), respectively, according to conventional uniaxial compression testing (Tang et al. [40]). Cao et al. [41] performed a series of uniaxial compression creep tests using increment-step loading and single-step loading to study the creep characteristics of typical soft rock in the Jinchuan No. 2 Mine in the north-west of China.
Several methods have been proposed to deal with the problem of multi-step loading creep test data (Tan et al. [42]; Xia et al. [43]; Kolařík et al. [44]). Two methods are commonly used: the coordinate translation method, and the correction method based on the Boltzmann linear super-position principle. The coordinate translation method involves moving the creep curves at each loading step to the initial loading time of the creep test. It is very easy to use the coordinate translation method, but this method ignores the impact of pre-loading on the deformation of the next step loading (Mishra et al. [45]; Wang et al. [46]; Wang et al. [47]; Wang et al. [48]; Zhang et al. [49]; Zhang et al. [50]).
The Boltzmann super-position principle (BSP) was first used for standard linear solids. The BSP applies to linear creep states such that the response of a material to a given load is independent of the responses of the material to any load already acting on the material. Therefore, each loading step makes an independent contribution to the final strain, so that the total strain is obtained by the addition of all the contributions. In other words, the BSP states that the effect of a compound cause is the sum of the effects of the individual causes (Lakes [51]; Kolařík et al. [44]).
Tan et al.’s loading method (Tan et al. [42]; Sun [52]; Li et al. [53]) is a mapping method based on the Boltzmann linear superposition principle, which is widely used in the revision of multi-step loading creep curves. The basic principle of Tan et al.’s method is that the rheological medium has a memory effect on the loading history. It is possible to estimate the creep curves of several specimens under different single-step loading by one multi-step creep test under several loading steps. This method, using specific experimental procedures and a graph method, established the creep deformation super-position law, which is effective regardless of whether the time-effect is linear or non-linear. However, this method requires: (1) ensuring that the creep curve reaches the secondary creep stage (that is, the creep rate is constant) before the next loading step; (2) the creep time of each loading step should be the same; (3) the loads of every creep step should be equal.
In summary, different creep loading methods have direct impacts on the test results. Many geotechnical materials have significant rheological and memory-effect properties, and for multi-step loading creep testing, the loading history needs to be considered in order to better understand the creep results. Due to the limitations of the test conditions, in most cases, the loading increment at each step is not equal and the loading time is not exactly the same. In this paper, we propose an estimation method to deal with the loading history effect in multi-step loading creep tests.
2. Coordinate Translation Method
For creep testing under multi-step loading, the coordinate translation method requires the following step: move the creep strain curve . of loading step i to time t = 0, which is the starting time when we applied the first load. Then is considered to be the single-step loading creep strain by the load . Figure 3 and Figure 4 show the coordinate translation method.
Figure 3 shows the loading history in a creep test. is applied on a specimen at time t = 0 and is kept constant, and . is applied on this specimen at time t = t1 and is kept constant. Then is applied on this specimen at time t = t2 and is kept constant until time t3.
Figure 4 presents the data analysis of creep deformation by the coordinate translation method. The red triangular line in Figure 4 is the multi-step loading creep curve. The orange diamond line is obtained by moving the second step of red triangular line to time t = 0, which is considered to be the creep strain under single-step load . The crossed green line is obtained by moving the third step of red triangular line to time t = 0, which is considered to be the creep strain under single-step load .
3. Data Analysis of Creep Deformation Considering Loading History
The multi-step loading method is easy to operate and is relatively time-efficient, and has been widely accepted by researchers in the area of creep testing. Tan et al. [42] proposed a method to solve creep data considering the loading history effect (Tan et al. [42]; Sun [52]). This method assumes that the creep material has a memory effect on the loading history. The creep deformation due to a loading of in a single step is assumed to be the super-position of the individual creeps obtained by multi-step loading with an increment of ∆σi. This method establishes a super-position relationship for the deformation process, but has several requirements: (1) the next load should be applied after the previous creep stage becomes the steady-state stage; (2) the time interval for every creep stage should be equal; (3) the loads of every creep step should be equal.
However, because of the limited test conditions during creep testing, loading increments are difficult to maintain equal, and it is also difficult to set the loading creep time to be exactly the same. Therefore, we have modified the above procedure as follows:
- (1)
- Ensure that creep is in the steady-state creep stage (the creep rate becomes zero or a positive constant).
- (2)
- Obtain the incremental creep deformation ∆εi under each loading increment ∆σi The loading increment ∆σi does not necessarily have to be the same for every loading stage.
- (3)
- The creep deformation under loading applied to the specimen in one step can be obtained by superimposing the incremental creep deformation in every step.
- (4)
- If the creep loading time ∆ti is not the same for every step, we extend the deformation trend by using the creep rate at the end of the shorter stage to make each creep time equal for every loading step.
The mathematical basis of the method is discussed below. Figure 5 shows the history of the creep deformation. The loading process in Figure 5 is described using the following formula.
where, the θ(t − ti) function is defined as: if t − ti ≥ 0, θ(t − ti) = 1; and if t − ti < 0, θ(t − ti) = 0; for simplicity, θ(t − ti) = θi.
Based on the Boltzmann superposition, the creep equation can be then expressed as,
where J(t − τ) is the creep compliance, K(t − τ) is the creep kernel function, which are determined by the creep properties of the material.
Substituting Equation (1) into Equation (2), we obtain
If the testing time reaches t ≥ tn, Equation (3) can be rewritten as
Equation (4) shows that under the loading function specified in Equation (1), the total deformation of the material at time t is equal to the sum of the elastic deformation of every stage plus the sum of the creep incremental deformation of every step.
If the creep times for every step are equal, then
Given that σ is denoted by , Equation (4) then can be expressed as
Equation (6) is the creep equation at time ∆t when the loading is applied only in single step.
Figure 5 shows the strain super-position process for three steps. The loading history in this creep test is shown in Figure 3. The red triangular line is the creep curve under three-step load. The green square line is the creep curve under the first step load, and we extend the first creep curve with the same strain rate to time t3, which means the first stress state continues to play a role of creep after time t1. Therefore, the new creep strain induced by is the area covered by dotted lines under the second step creep curve of the red triangular line. The blue diamond line is obtained by adding this increased extra strain by the effect of to the green square line which is produced by . The blue diamond line represents the creep strain under the single-stage load of .
Similarly, the black crossed line is obtained by super-position of strains in the three loading steps. The blue diamond line represents the creep strain under single-step loading of .
4. Creep Strain Expression Considering Time Effect for Several Creep Models
Seven rheological models are listed in Table 1, which shows the constitutive equation and creep equation; their creep properties are shown in Table 2.
Of these models, the H-K model, Burgers model and the Nishihara model are used most often. The H-K model can be used to describe stable creep for hard rock under a low load. Burgers’ model can be used to describe steady-state creep, which is an unstable creep for weak rock. The Nishihara model could be used to describe both stable and unstable creep, depending on whether the load is lower or higher than the long-term strength of the rock.
Next, we take these three creep models as examples to analyze the time effect on creep deformation under multi-step loading.
In the following derivation process, we assume that the total creep strain equals the sum of elastic strain, primary creep strain, secondary creep strain and tertiary creep strain. A diagram of the typical deformation behavior of rock under long-term constant load is presented in Figure 6. If a stress state σ is applied on the rock that is lower than the stress state defined by a short-term yield condition, then instantaneous elastic deformation εel is induced as the first response of the material on the stress change, as presented in the diagram in Figure 6. As time passes, deformations develop without any change of the established stress state, which represents a time-dependent deformation, which is creep itself.
Creep strains, when the stress state is below the yield condition (σ0 < σF, Figure 6), are characterized by the components of the primary and secondary creep. When the stress level reaches the yield stress surface (σ0 ≥ σF, Figure 6), creep strain, in addition to the primary and secondary components, gains the tertiary component, which, after a long time, leads to the failure of the material.
4.1. H-K Model
Figure 7 shows the illustration of creep strain expression considering time effect for the H-K model.
For single-step loading, if load σ1 is applied to a rock specimen at time 0, the creep strain of the H-K model can be expressed as:
For single-step loading, if the load σ2 is applied to a rock specimen at time 0, the creep strain of the H-K model can be expressed as:
For multi-step loading, if load σ1 is applied to a rock specimen at time 0, and load σ2 () is applied to a rock specimen at time t1, the creep strain of the H-K model during time t1–t2 can be expressed as:
To illustrate the time effect based on the loading history, we compared the results for creep strains for single-step loading and multi-step loading. Figure 8 shows the comparison of creep strains between single-step loading and multi-step loading for the H-K model. Table 3 lists the parameters for the H-K model.
Figure 8 shows that the stable creep strains at time 20 days are the same for single-step loading and multi-step loading for the H-K model. However, the transient creep curve under multi-step loading differs from that for single-step loading, which is affected by the time effect. The loading history of the previous loads influences creep deformation under subsequent loads.
4.2. Burgers Model
Figure 9 shows the illustration of creep strain expression considering time effect for the Burgers model.
For single-step loading, if the load σ1 is applied to a rock specimen at time 0, the creep strain of the Burgers model can be expressed as:
For single-step loading, if the load σ2 is applied to a rock specimen at time 0, the creep strain of the Burgers model can be expressed as:
For multi-step loading, if load σ1 is applied to a rock specimen at time 0, and load σ2 () is applied to a rock specimen at time t1, the creep strain of the Burgers model at time t1–t2 can be expressed as:
We also compared the creep strains between single-step loading and multi-step loading results. Figure 10 shows the comparison of creep strains for single-step loading and multi-step loading for the Burgers model. Table 4 lists the parameters for Burgers model.
The curves in Figure 10 show the comparison of creep strains between single-step loading and multi-step loading for the Burgers model. Load σ1 is applied to a rock specimen at time 0, and load σ2 () is applied to a rock specimen at time 10 days. The green crossed line is obtained by moving the second stage creep curve from 10 days to 0. The black circle line is the creep strain curve under single-step loading σ2 applied at time 0. The values of the black circle curve are lower than those of the green crossed curve, which indicates that the loading history of the previous loads influences creep deformation under subsequent loads.
4.3. Nishihara Model
The Nishihara model is a combination of five basic units (Figure 11), which can also be viewed as a series of H-K models and Bingham models. The first part of this model is an elastic element, mainly reflecting an instantaneous deformation. The second part is a visco-elastic element reflecting primary creep. The third part is a visco-plastic component reflecting unsteady creep deformation. The Nishihara model has five rheological parameters: E1, E2, η1, η2 and τs, respectively. E1 is the instantaneous elastic modulus, E2 is the visco-elastic modulus, η1, η2 are the viscosity coefficients, and τs is the long-term strength of the rock.
Figure 12 shows the illustration of creep strain expression considering time effect for the Nishihara model.
For single-step loading, if the load σ1 is applied to a rock specimen at time 0, the creep strain of the Nishihara model can be expressed as
For single-step loading, if the load σ2 is applied to a rock specimen at time 0, the creep strain of the Nishihara model can be expressed as
For multi-step loading, if load σ1 is applied to a rock specimen at time 0, and load σ2 () is applied to a rock specimen at time t1, the creep strain of the Nishihara model during time t1–t2 can be expressed as
For multi-step loading, if the load σ1 is applied to a rock specimen at time 0, load σ2 () is applied to a rock specimen at time t1, and load σ3 () is applied to a rock specimen at time t2, the creep strain of the Nishihara model during time t > t2 can be expressed as:
We also compared the creep strain results for single-step loading and multi-step loading. Figure 13 shows the comparison of creep strains between single-step loading and multi-step loading for the Nishihara model. Table 5 lists the parameters for the Nishihara model.
The red triangular line in Figure 13 is the multi-step creep strain curve for the Nishihara model. Load σ1 is applied to the rock specimen at time 0, load σ2 () is applied to a rock specimen at time 10 days, and load σ3 () is applied to a rock specimen at time 20 days. The orange diamond line is obtained by move the second step creep curve from time 10 days to time 0. The blue circle line is the creep strain curve under single-step loading σ2 applied at time 0. The green crossed line is obtained by moving the third-stage creep curve from time 20 days to time 0. The black plus line is the creep strain curve under single-step loading σ3 applied at time 0.
The values of the curve under single-step loading are lower than the values of the coordinate translation method, which also indicates that the loading history of previous loads influences creep deformation under subsequent loads.
5. Analysis of Creep Test Data
Rock samples were obtained from underground gas storage somewhere in China in planned construction. After analyzing the in situ core, multi-level creep loading experiments on anhydrite rock salt were conducted (Zhang et al. [49]). Figure 14 shows a tri-axial creep curve of anhydrite rock salt.
Multi-step tri-axial creep tests on anhydrite rock salt specimens were performed with confining pressure of 10 MPa. Axial stresses were applied in four-level loading of σ1 = 33.95 MPa, σ2 = 39.96 MPa, σ3 = 46.20 MPa, σ4 = 52.15 MPa, respectively. (For further details of the creep tests, refer to Zhang et al. [49]).
Figure 15 shows the creep strain decomposition of the specimen under multi-step loading.
Our procedure requires the following steps: (i) if the creep times of each loading stage are different, we extend the creep curves to the longest creep interval time, keeping the creep rate unchanged; (ii) the dissolution (decomposition) of the total creep strain into the strains produced by individual creeps; (iii) a point-by-point calculation of internal strains for the individual creeps, which is necessary for comparative plots and their super-position; (iv) super-position of creep curves produced by each incremental load.
Figure 16 shows estimated creep strains under single-step loading of anhydrite rock salt. The proposed super-position procedure is shown to be viable for all the types of rocks studied as well as for various loading sequences and time intervals.
The tri-axial creep curves of anhydrite rock salt under multi-step loading are shown in Figure 14. Since the creep did not reach the accelerated creep deformation stage under the experimental stress condition, only the primary and secondary creep stages are taken into consideration. At the first stress level, the curve shows gradually stabilized deformation behavior with time, and the creep rate remains steady and strain grows linearly with time after the second stress level. The Nishihara model is adopted. In conventional tri-axial creep tests σ2 = σ3, and the tri-axial creep equation of the Nishihara model can be deduced as follows in the light of Zhang et al. [49]:
where K is bulk modulus, G0 is the instantaneous shear modulus, G1 is the visco-elastic shear modulus, η1, η2 are the viscosity coefficients, and σs is long-term strength.
To validate the time-affected correction method proposed in this paper, we calibrated the creep parameters based on the experimental curves under single-step loading, and we used the same creep parameters to estimate the creep curves under multi-step loading.
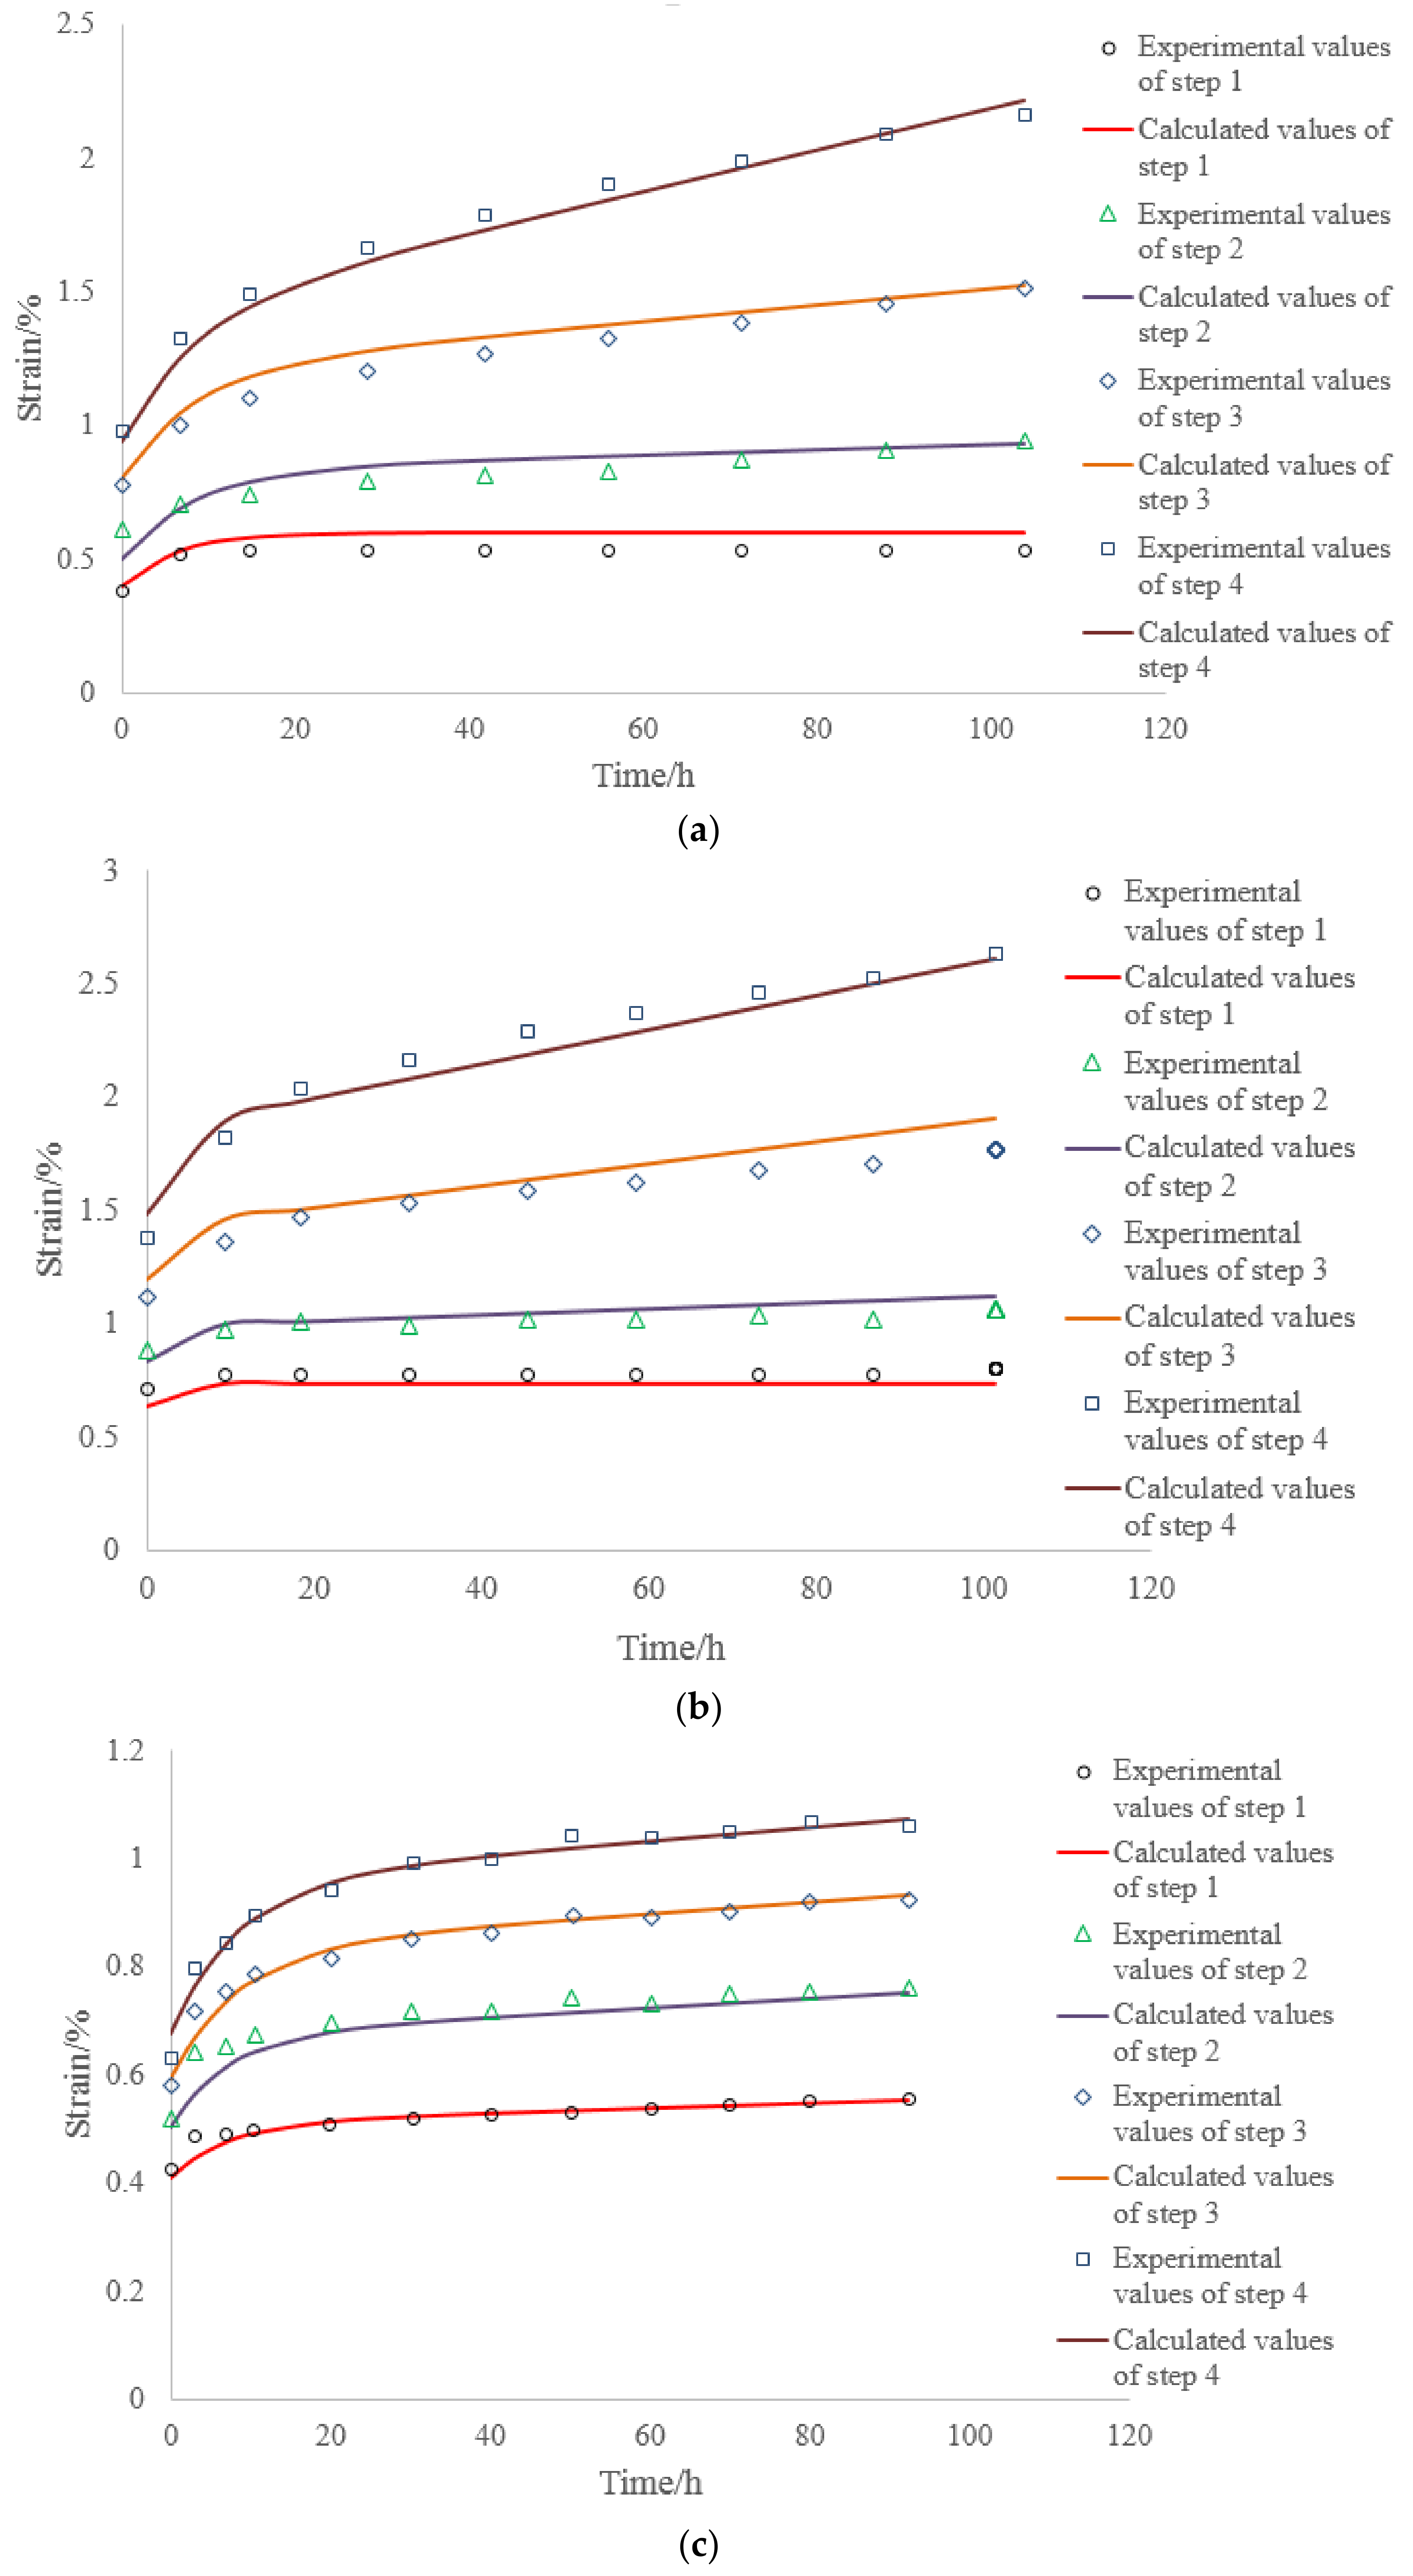
We also present another two examples to validate the time-affected correction method (Figure 17 and Figure 18, (b) Glauberite rock salt (c) Argillaceous rock salt, Zhang et al. [49]). Table 6 shows the creep parameters of rocks. Figure 17 shows a comparison of the Nishihara model and the experimental curves under single-step loading. Figure 18 shows a comparison of the Nishihara model and the experimental curves under multi-step loading. Figure 18 indicates that the calculated results presented compare favorably with the experimental results, which validates the time-affected correction procedure. Therefore, we should use time-affected correction method to analyze the creep strains of rocks under multi-level loading instead of the coordinate translation method, because the former one minimizes the error of multi-level creep strains during the data analysis processing.
6. Conclusions
Multi-step loading creep tests are usually conducted to explore the long-term properties of rock. However, the time effect of loading history is often ignored. In this paper, the memory effect of creep deformation caused by loading history is discussed. The following conclusions can be drawn from this study:
- The multi-step loading method is more efficient than single-step loading method for creep test. We could estimate the creep strain under single-step loading from the results of multi-step loading creep test unless we consider the loading history. The creep deformation under single-step loading can be estimated by the super-position of creeps obtained by the dissolution of a multi-step creep. The proposed time-affected correction method is effective for all types of rock and for various loading sequences and time intervals.
- A mathematical creep strain equation considering the loading history effect is proposed, which is the mathematical explanation of this correction method.
- By comparing the time-affected correction method with the coordinate translation method, the results showed that the former results are more consistent with the experimental results. Because the coordinate translation method ignores the influence of loading history which produces a large error.
Author Contributions
Conceptualization and Writing—Original Draft Preparation, W.Y.; Review, R.P.G.; Data Curation, C.H., G.L. and J.G.; Validation, S.W.
Acknowledgments
The authors gratefully acknowledge the financial support of the National Science Foundation of China under Grant No. 51309238. The work in this paper is also supported by the Natural Science Foundation of Shandong Province China No. ZR2018MEE050, the Fundamental Research Funds for the Central Universities No. 18CX02079A and by the Chinese government plan on the Recruitment of Global Young Talents. The authors also gratefully acknowledge the scholarship of the China Scholarship Council (CSC) No. 201706455009.
Conflicts of Interest
The authors declare no conflict of interest.
References
- Aydan, Ö.; Ito, T.; Özbay, U.; Kwasniewski, M.; Shariar, K.; Okuno, T.; Özğenoğlu, A.; Malan, D.F.; Okada, T. ISRM suggested methods for determining the creep characteristics of rock. Rock Mech. Rock Eng. 2014, 47, 275–290. [Google Scholar] [CrossRef]
- Hagros, A.; Johanson, E.; Hudson, J.A. Time Dependency in the Mechanical Properties of Crystalline Rocks: A Literature Survey; Possiva OY: Eurajoki, Finland, 2008. [Google Scholar]
- Malan, D.F. Time-dependent behaviour of deep level tabular excavations. Rock Mech. Rock Eng. 1999, 32, 123–155. [Google Scholar] [CrossRef]
- Malan, D.F. Simulating the time-dependent behavior of excavations in hard rock. Rock Mech. Rock Eng. 2002, 35, 225–254. [Google Scholar] [CrossRef]
- Perzyna, P. Fundamental problems in viscoplasticity. Adv. Appl. Mech. 1966, 9, 244–368. [Google Scholar]
- Lade, P.V.; Liu, C.T. Experimental study of drained creep behavior of sand. J. Eng. Mech. 1998, 124, 912–920. [Google Scholar] [CrossRef]
- Zhou, Q.J.; Chen, X.P. Experimental study on creep characteristics of soft soils. Chin. J. Geotech. Eng. 2006, 28, 626–630. [Google Scholar]
- Akagi, T.; Ichikawa, Y.; Kuroda, T.; Kawamoto, T. A non-linear rheological analysis of deeply located tunnels. Int. J. Num. Anal. Meth. Geomech. 1984, 8, 107–120. [Google Scholar] [CrossRef]
- Okubo, S.; Nishimatsu, Y.; Fukui, K. Complete creep curves under uniaxial compression. Int. J. Rock Mech. Min. Sci. Geomech. Abstr. 1991, 28, 77–82. [Google Scholar] [CrossRef]
- Okubo, S.; Fukui, K.; Nishimatsu, Y. Control performance of servocontrolled testing machines in compression and creep tests. Int. J. Rock Mech. Min. Sci. Geomech. Abstr. 1993, 30, 247–255. [Google Scholar] [CrossRef]
- Fabre, G.; Pellet, F. Creep and time-dependent damage in rgillaceous rocks. Int. J. Rock Mech. Min. Sci. 2006, 43, 950–960. [Google Scholar] [CrossRef]
- Boukharov, G.N.; Chandi, M.W.; Boukharov, N.G. The three processes of brittle crystalline rock creep. Int. J. Rock Mech. Min. Sci. Geomech. Abstr. 1995, 32, 325–335. [Google Scholar] [CrossRef]
- Liu, Z.B.; Shao, J.F. Strength Behavior, Creep failure and permeability change of a tight marble under triaxial compression. Rock Mech. Rock Eng. 2017, 50, 529–541. [Google Scholar] [CrossRef]
- Baud, P.; Meredith, P.G. Damage accumulation during triaxial creep of Darley Dale sandstone from pore volumometry and acoustic emission. Int. J. Rock Mech. Min. Sci. 1997, 34, 24.e1–24.e10. [Google Scholar] [CrossRef]
- Heap, M.J.; Baud, P.; Meredith, P.G.; Vinciguerra, S.; Bell, A.F.; Main, I.G. Brittle creep in basalt and its application to time-dependent volcano deformation. Earth Planet. Sci. Lett. 2011, 307, 71–82. [Google Scholar] [CrossRef]
- Yang, S.Q.; Jiang, Y. Triaxial mechanical creep behavior of sandstone. Min. Sci. Technol. 2010, 20, 339–349. [Google Scholar] [CrossRef]
- Chan, K.S. A damage mechanics treatment of creep failure in rock salt. Int. J. Damage Mech. 1997, 6, 122–152. [Google Scholar] [CrossRef]
- Yang, C.H.; Daemen, J.J.K.; Yin, J.H. Experimental investigation of creep behavior of salt rock. Int. J. Rock Mech. Min. Sci. 1999, 36, 233–242. [Google Scholar] [CrossRef]
- Hunsche, U.; Hampel, A. Rock salt—The mechanical properties of the host rock material for a radioactive waste repository. Eng. Geol. 1999, 52, 271–291. [Google Scholar] [CrossRef]
- Slizowski, J.; Lankof, L. Salt-mudstones and rock-salt suitabilities for radioactive-waste storage systems: Rheological properties. Appl. Energy 2003, 75, 137–144. [Google Scholar] [CrossRef]
- Berest, P.; Blum, P.; Charpentier, J.; Gharbi, H.; Vales, F. Very slow creep tests on rock samples. Int. J. Rock Mech. Min. Sci. 2005, 42, 569–576. [Google Scholar] [CrossRef] [Green Version]
- Lomnitz, C. Creep measurements in igneous rocks. J. Geol. 1956, 64, 473–479. [Google Scholar] [CrossRef]
- Lockner, D.A.; Byerlee, J.D. Acoustic emission and creep in rock at high confining pressure and differential stress. Bull. Seismol. Soc. Am. 1977, 67, 247–258. [Google Scholar]
- Van der Molen, I.; Paterson, M.S. Experimental deformation of partially-melted granite. Contrib. Mineral. Petrol. 1979, 70, 299–318. [Google Scholar] [CrossRef]
- Ito, H.; Sasajima, S. A ten year creep experiment on small rock specimens. Int. J. Rock Mech. Min. Sci. Geomech. Abstr. 1987, 24, 113–121. [Google Scholar] [CrossRef]
- Masuda, K.; Mizutani, H.; Yamada, I. Experimental study of strain-rate dependence and pressure dependence of failure properties of granite. J. Phys. Earth 1987, 35, 37–66. [Google Scholar] [CrossRef]
- Masuda, K.; Mizutani, H.; Yamada, I.; Imanishi, Y. Effects of water on time-dependent behavior of granite. J. Phys. Earth 1988, 36, 291–313. [Google Scholar] [CrossRef]
- Yang, W.D.; Zhang, Q.Y.; Li, S.C.; Wang, S.G. Estimation of in situ viscoelastic parameters of a weak rock layer by time-dependent plate-loading tests. Int. J. Rock Mech. Min. Sci. 2014, 66, 169–176. [Google Scholar] [CrossRef]
- Yang, W.D.; Zhang, Q.Y.; Li, S.C.; Wang, S.G. Time-dependent behavior of diabase and a nonlinear creep model. Rock Mech. Rock Eng. 2014, 47, 1211–1224. [Google Scholar] [CrossRef]
- Heap, M.J.; Baud, P.; Meredith, P.G.; Bell, A.F.; Main, I.G. Time-dependent brittle creep in Darley Dale sandstone. J. Geophys. Res. Solid Earth 2009, 114. [Google Scholar] [CrossRef] [Green Version]
- Brantut, N.; Heap, M.J.; Meredith, P.G.; Baud, P. Time-dependent cracking and brittle creep in crustal rocks: A review. J. Struct. Geol. 2013, 52, 17–43. [Google Scholar] [CrossRef]
- Brantut, N.; Baud, P.; Heap, M.J.; Meredith, P.G. Micromechanics of brittle creep in rocks. J. Geophys. Res. Solid Earth 2012, 117. [Google Scholar] [CrossRef] [Green Version]
- Atkinson, B.K.; Meredith, P.G. The theory of subcritical crack growth with applications to minerals and rocks. Fract. Mech. Rock 1987, 2, 111–166. [Google Scholar]
- Jaeger, J.C.; Cook, N.G.W. Fundamentals of Rock Mechanics; Chapman and hall Ltd. and Science Paperbacks: London, UK, 1971. [Google Scholar]
- Cristescu, N.D. Rock Rheolgy; Kluwer Academic Publishers: Dordrecht, The Netherlands, 1988. [Google Scholar]
- Cristescu, N.D.; Hunsche, U. Time Effects in Rock Mechanics; John Wiley & Sons: New York, NY, USA, 1998. [Google Scholar]
- Yu, Q.L.; Zhu, W.C.; Ranjith, P.G.; Shao, S.S. Numerical simulation and interpretation of the grain size effect on rock strength. Geomech. Geophys. Geo-Energ. Geo-Resour. 2018. [Google Scholar] [CrossRef]
- Yang, S.Q.; Xu, P.; Xu, T. Nonlinear visco-elastic and accelerating creep model for coal under conventional triaxial compression. Geomech. Geophys. Geo-Energ. Geo-Resour. 2015, 1, 109–120. [Google Scholar] [CrossRef] [Green Version]
- Liu, Z.B.; Xie, S.Y.; Shao, J.F.; Conil, N. Effects of deviatoric stress and structural anisotropy on compressive creep behavior of a clayey rock. Appl. Clay Sci. 2015, 114, 491–496. [Google Scholar] [CrossRef]
- Tang, M.M.; Wang, Z.Y. Experimental study on rheological deformation and stress properties of limestone. J. Cent. South Univ. Technol. 2008, 15 (Suppl. 1), 475–478. [Google Scholar] [CrossRef]
- Cao, P.; Wen, Y.D.; Wang, Y.X.; Yuan, H.P.; Yuan, B.X. Study on nonlinear damage creep constitutive model for high-stress soft rock. Environ. Earth Sci. 2016, 75, 900. [Google Scholar] [CrossRef]
- Tan, T.K.; Kang, W.F. Locked in stresses, creep and dilatancy of rocks, and constitutive equations. Rock Mech. 1980, 13, 5–22. [Google Scholar] [CrossRef]
- Xia, C.C.; Zhong, S.Q. Experimental data processing method in consideration of influence of loading history on rock specimen deformation. J. Cent. South. Univ. 1989, 20, 18–24. [Google Scholar]
- Kolařík, J.; Pegoretti, A. Proposal of the Boltzmann-like superposition principle for nonlinear tensile creep of thermoplastics. Polym. Test. 2008, 27, 596–606. [Google Scholar] [CrossRef]
- Mishra, B.; Verma, P. Uniaxial and triaxial single and multistage creep tests on coal-measure shale rocks. Int. J. Coal Geol. 2015, 137, 55–65. [Google Scholar] [CrossRef]
- Wang, H.L.; Xu, W.Y.; Yan, L.; Meng, Q.X.; Wang, R.B.; Zhao, H.B.; Xie, W.C. Investigation on time-dependent behaviour and long-term stability of underground water-sealed cavern. Eur. J. Environ. Civ. Eng. 2015, 19 (Suppl. 1), 119–139. [Google Scholar] [CrossRef]
- Wang, X.G.; Hu, B.; Tang, H.M.; Hu, X.L.; Wang, J.D.; Huang, L. A constitutive model of granite shear creep under moisture. J. Earth Sci. 2016, 27, 677–685. [Google Scholar] [CrossRef]
- Wang, Q.Y.; Zhu, W.C.; Xu, T.; Niu, L.L.; Wei, J. Numerical simulation of rock creep behavior with a damage-based constitutive law. Int. J. Geomech. 2017, 17, 04016044. [Google Scholar] [CrossRef]
- Zhang, H.B.; Wang, Z.Y.; Zheng, Y.L.; Duan, P.J.; Ding, S.L. Study on tri-axial creep experiment and constitutive relation of different rock salt. Saf. Sci. 2012, 50, 801–805. [Google Scholar] [CrossRef]
- Zhang, Y.; Shao, J.F.; Xu, W.Y.; Jia, Y. Time-dependent behavior of cataclastic rocks in a multi-loading triaxial creep test. Rock Mech. Rock Eng. 2016, 49, 3793–3803. [Google Scholar] [CrossRef]
- Lakes, R.S. Viscoelastic Solids; CRC Press: Boca Raton, FL, USA, 1999. [Google Scholar]
- Sun, J. Rheological Behavior of Geomaterials and Its Engineering Applications; China Architecture and Building Press: Beijing, China, 1999. [Google Scholar]
- Li, Y.S.; Xia, C.C. Time-dependent tests on intact rocks in uniaxial compression. Int. J. Rock Mech. Min. Sci. 2000, 37, 467–475. [Google Scholar] [CrossRef]
- Tomanovic, Z. Rheological model of soft rock creep based on the tests on marls. Mech. Time-Depend. Mater. 2006, 10, 135–154. [Google Scholar] [CrossRef]
Figure 1.
Possible stress-strain paths during testing for the time-dependent characteristics of rocks (from Hagros et al. [2]).
Figure 1.
Possible stress-strain paths during testing for the time-dependent characteristics of rocks (from Hagros et al. [2]).
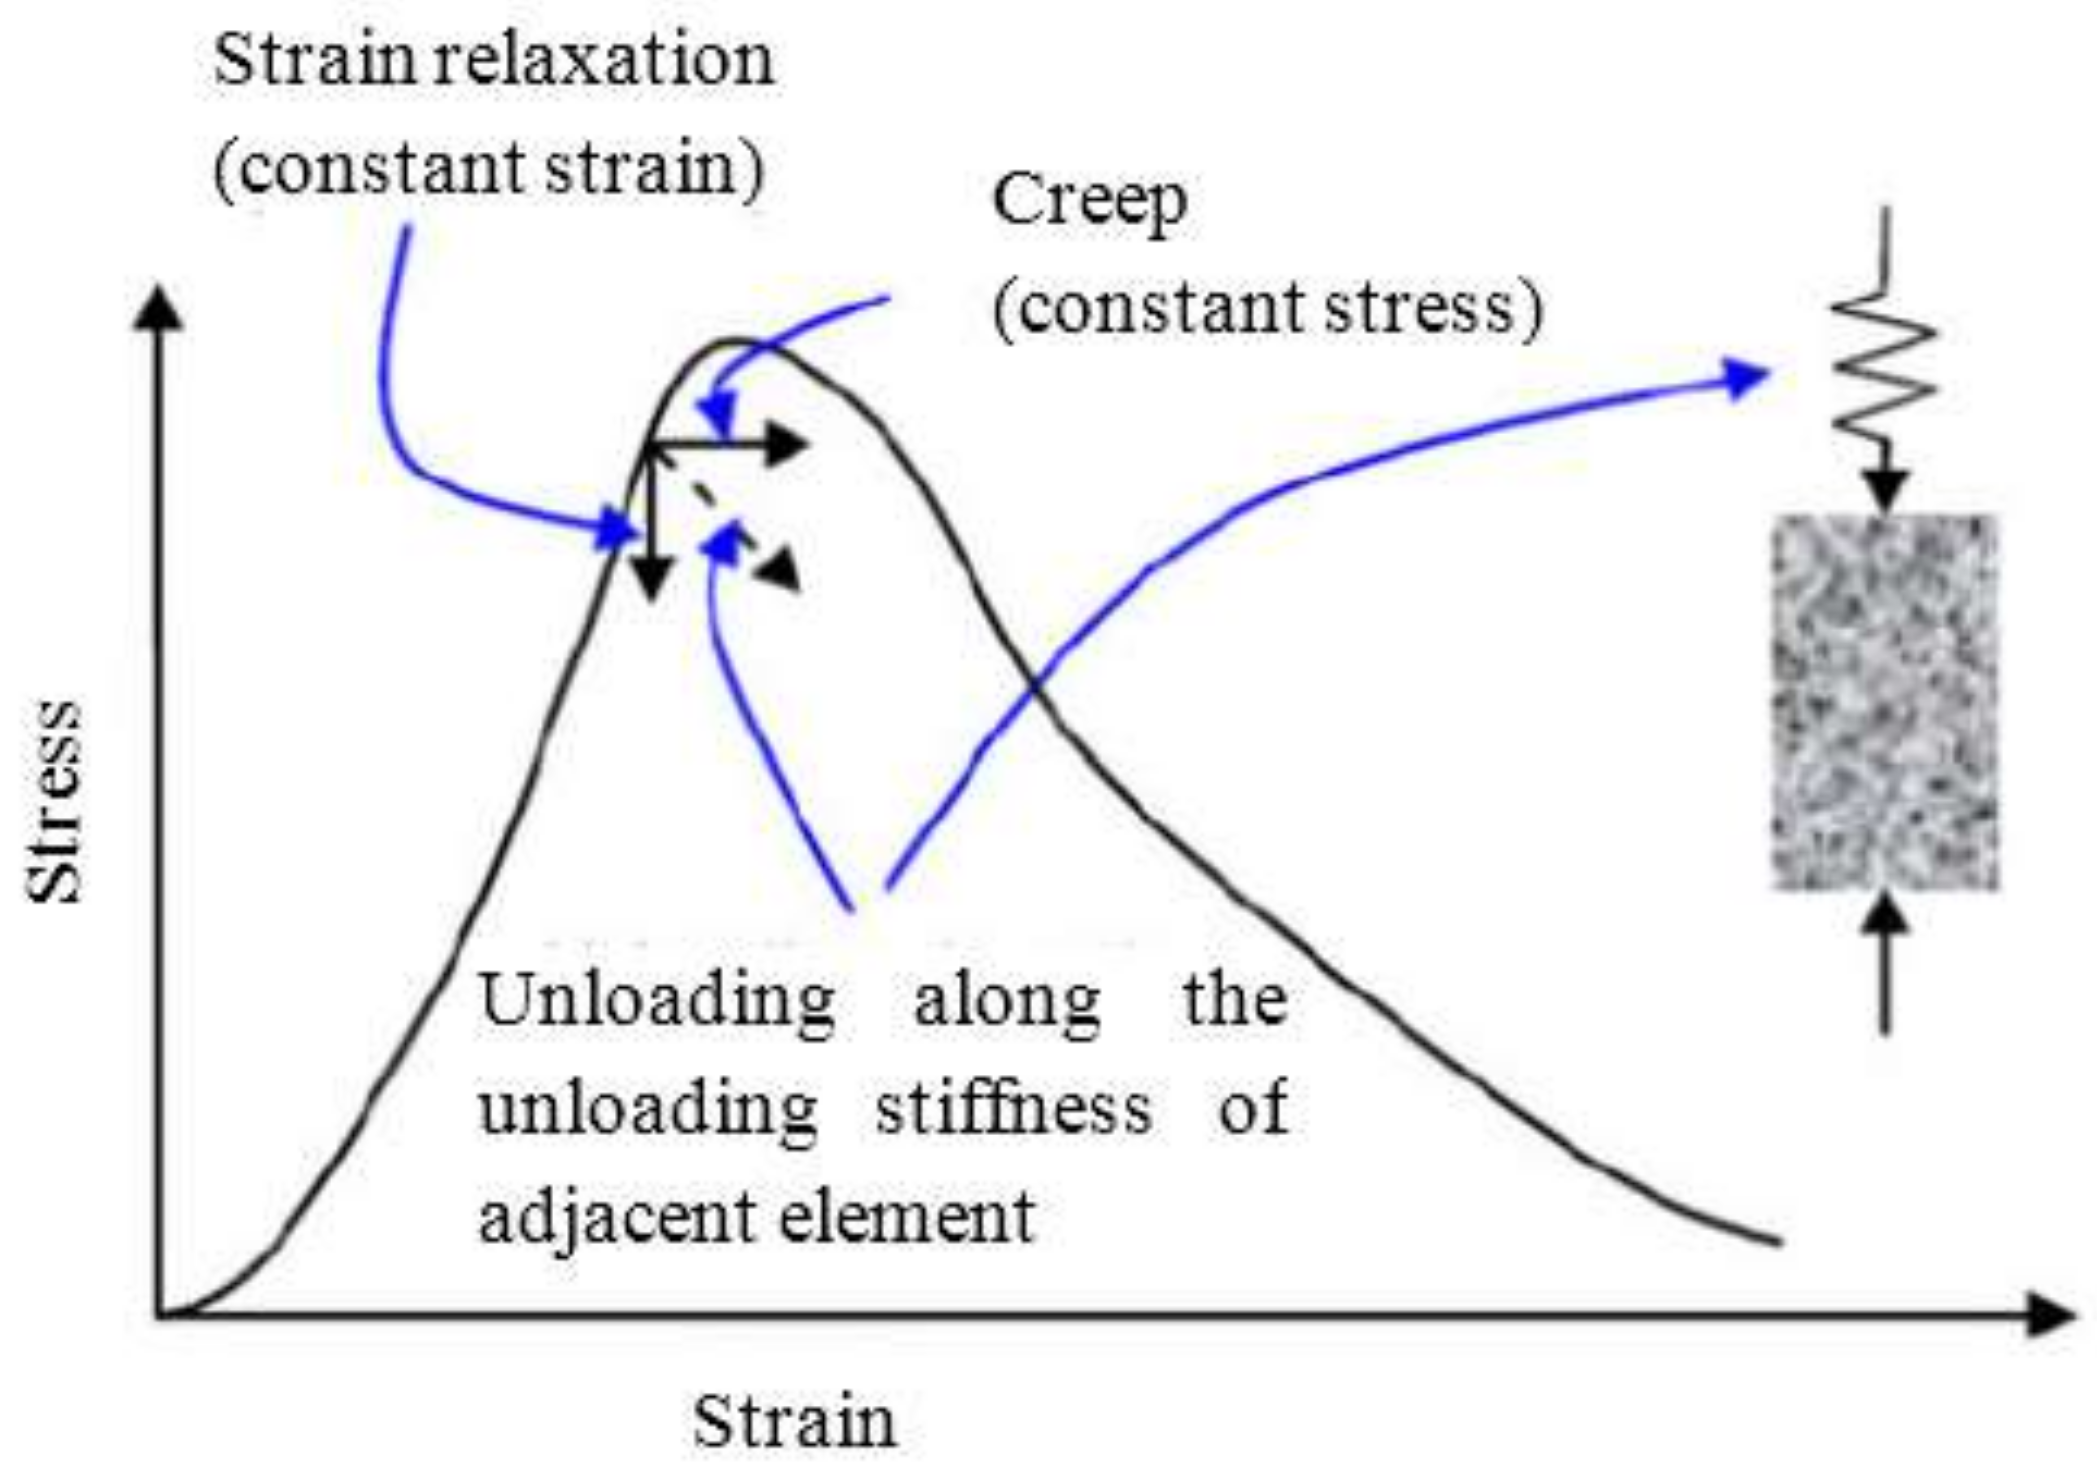
Figure 2.
Adverse haulage conditions at Hartebeestfontein Gold Mine in South Africa caused by slow time-dependent deformation processes in the rock (from Malan [3,4]).
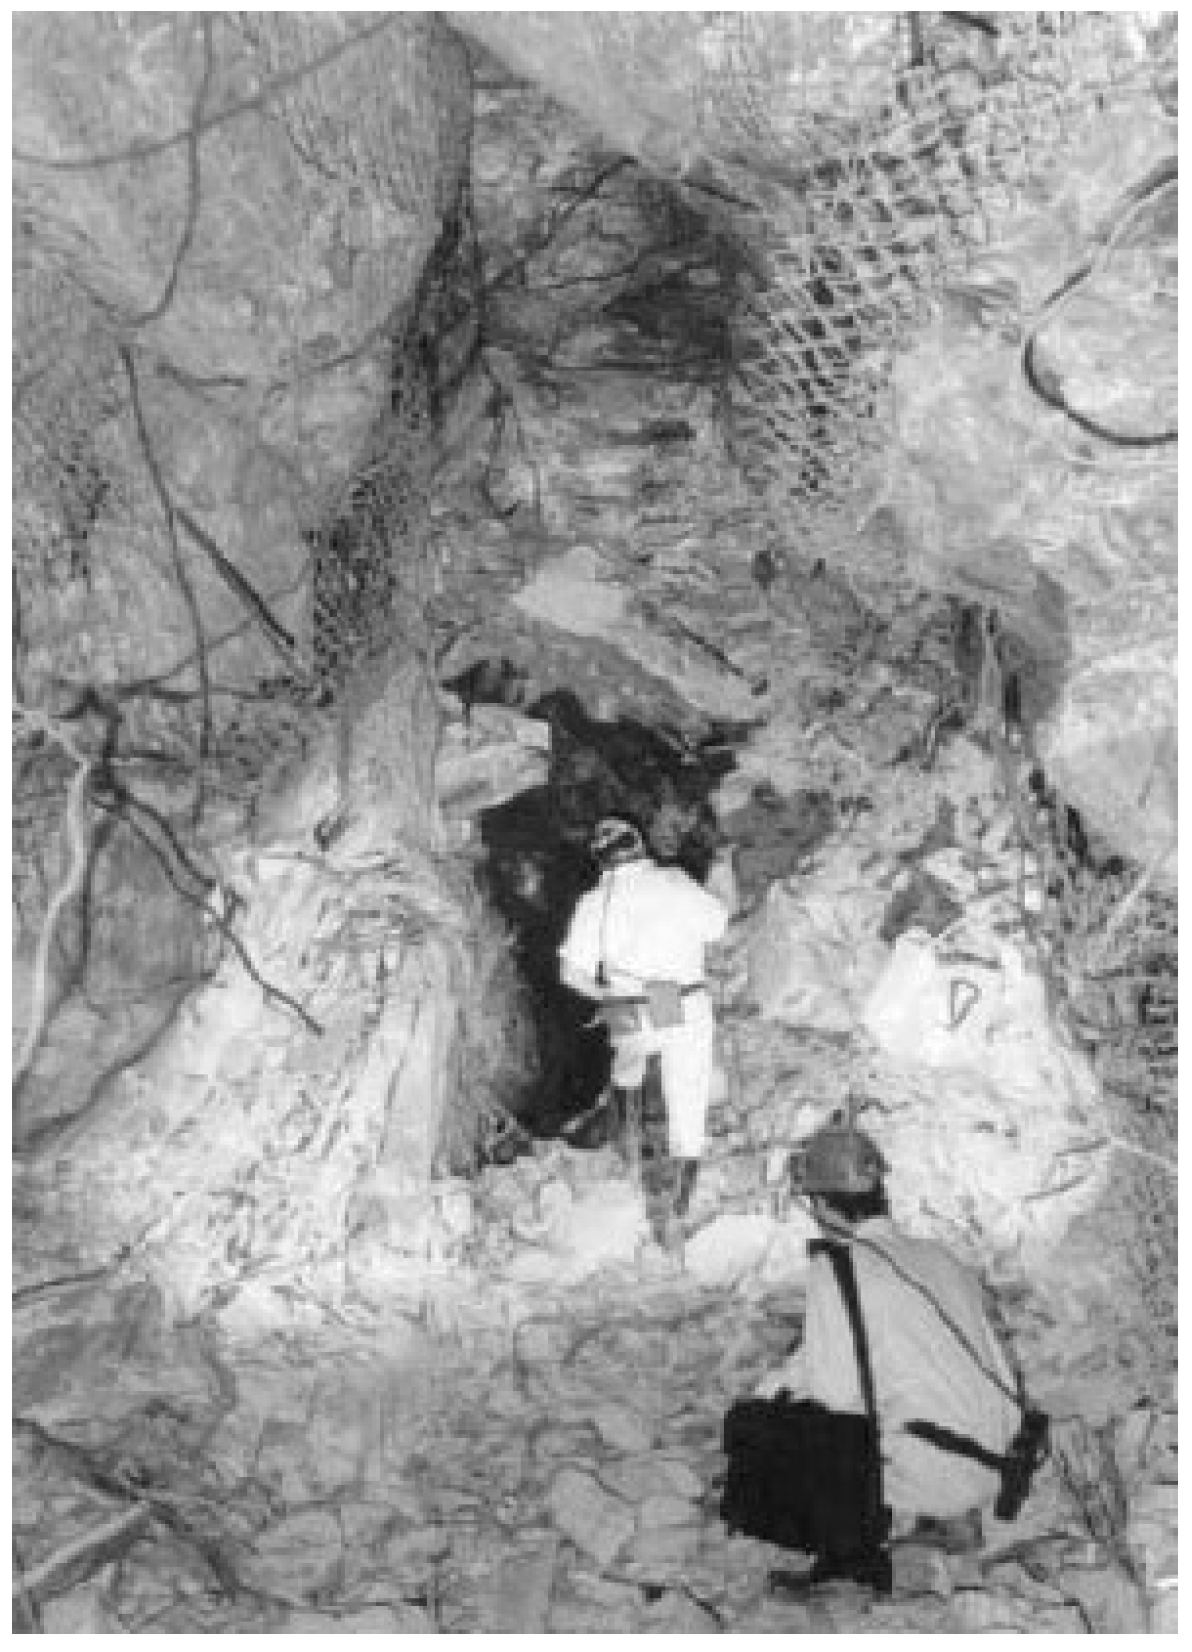
Figure 3.
Loading history in creep test.
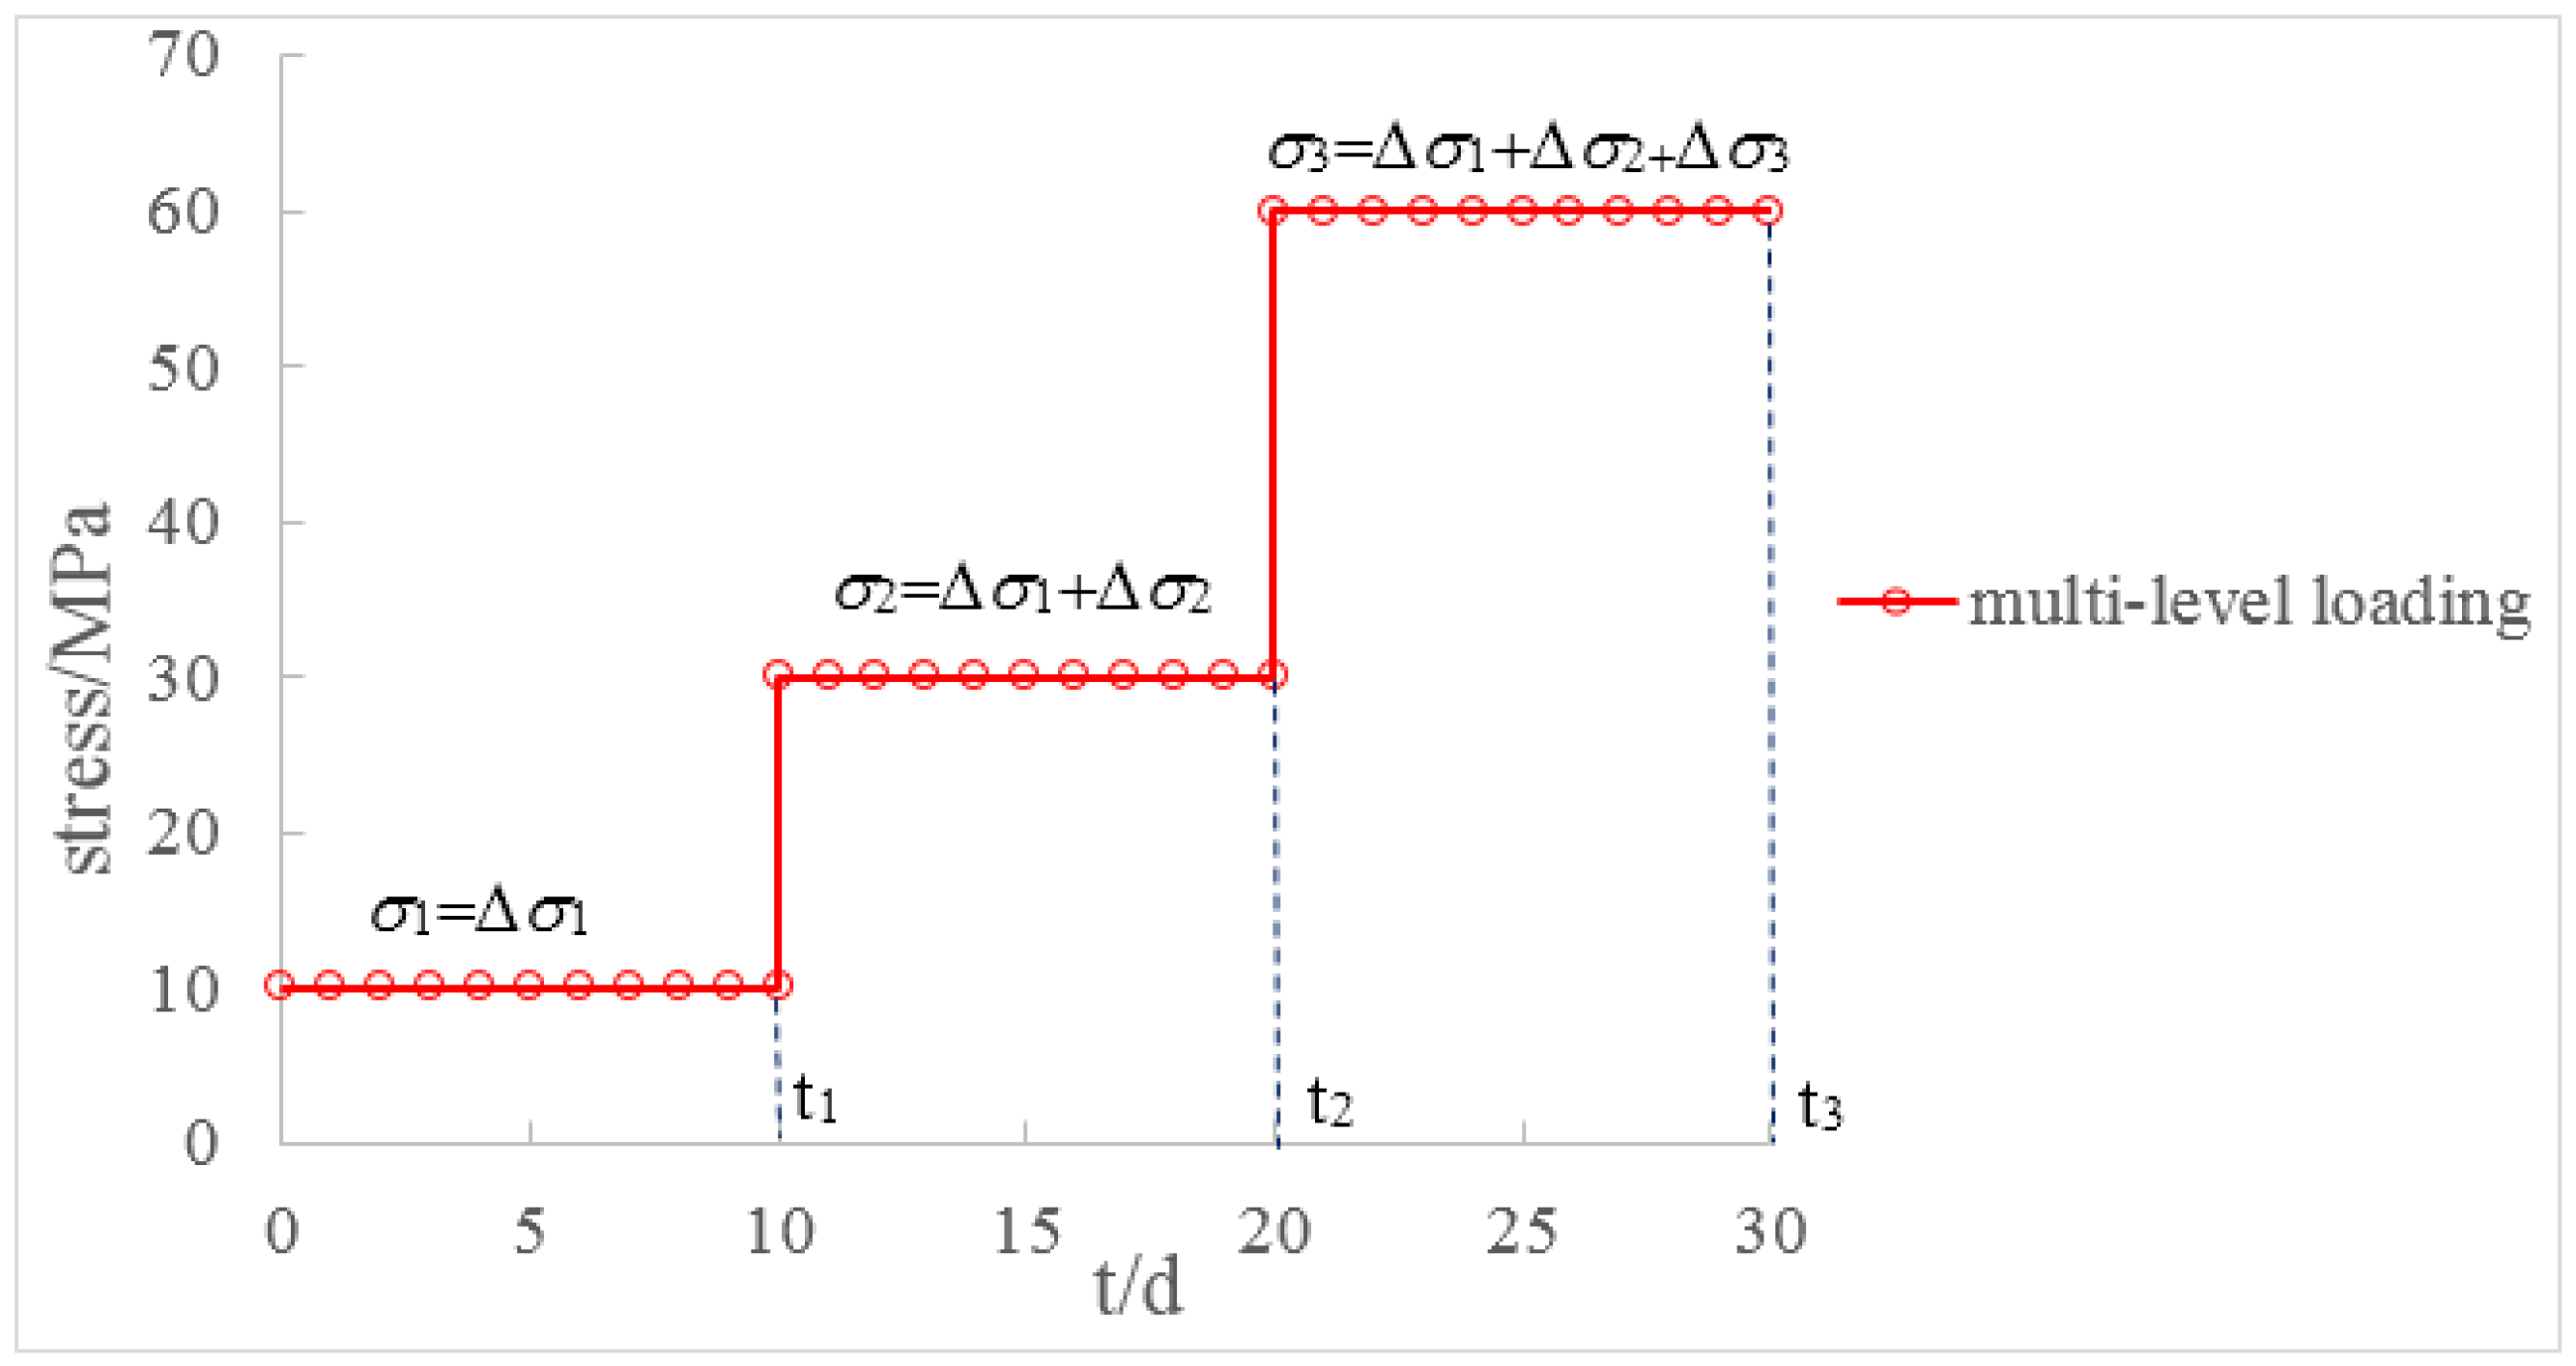
Figure 4.
Data analysis of creep deformation by coordinate translation method.
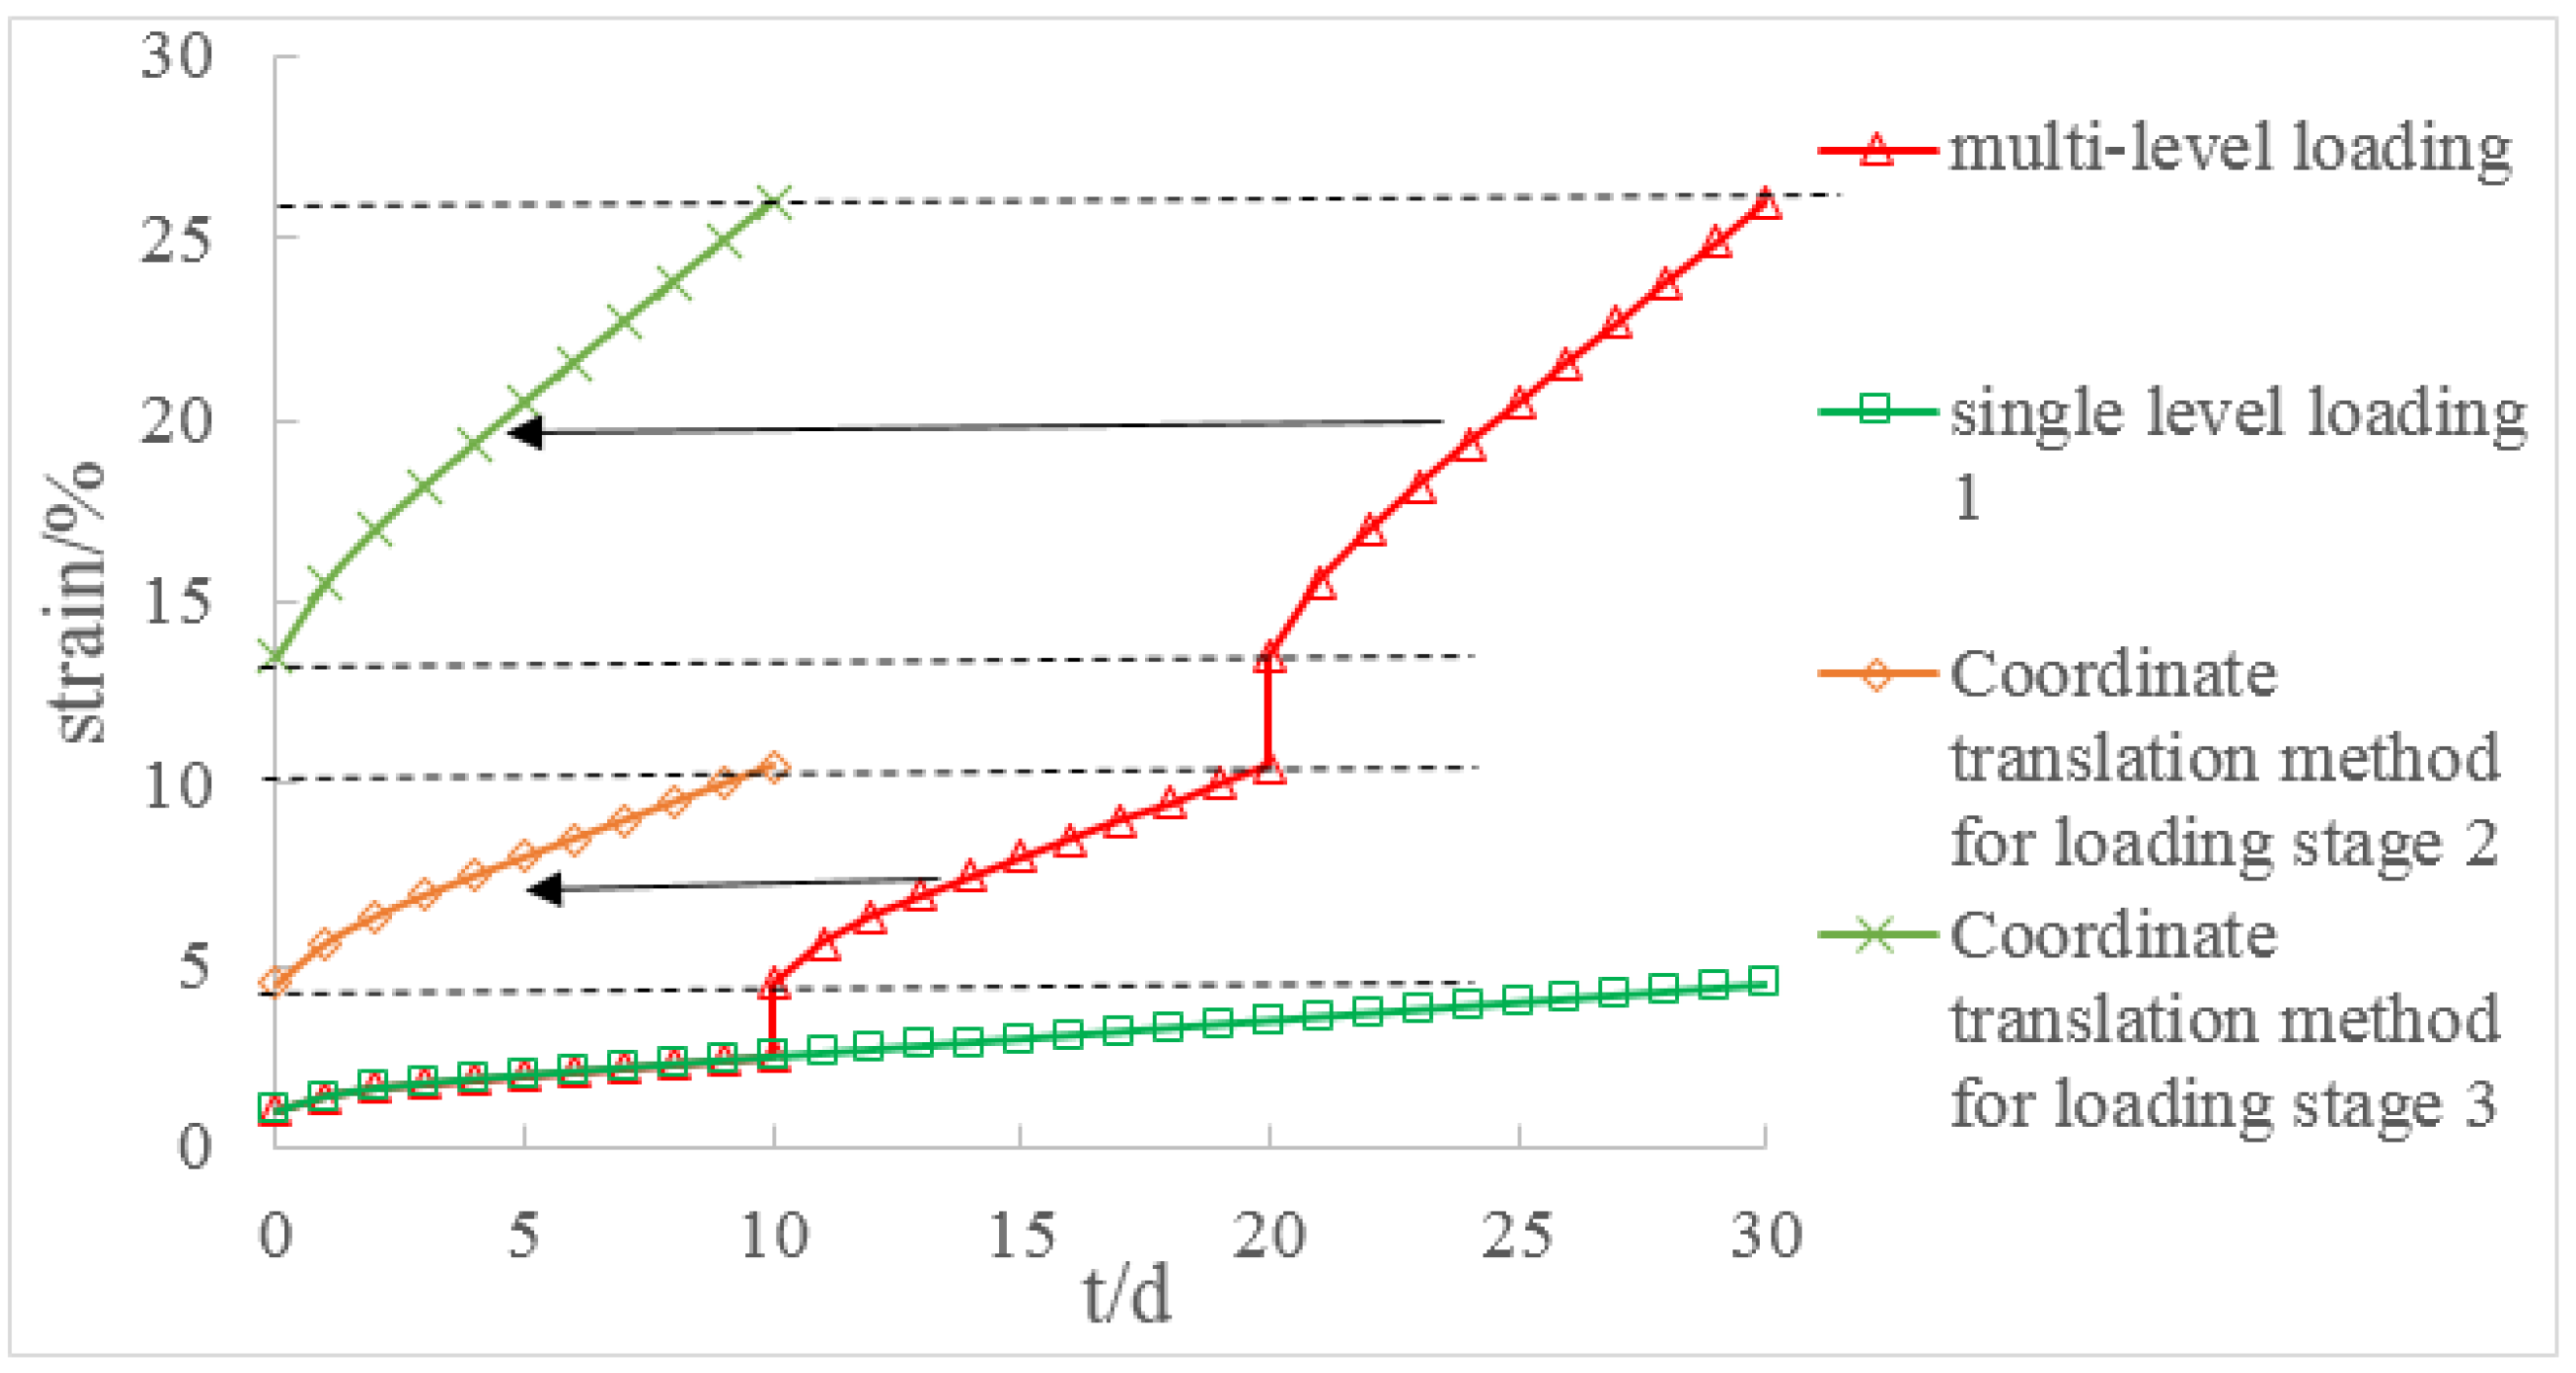
Figure 5.
Illustration of multi-step loading method. Plot shows strain super-position process for three stages.
Figure 5.
Illustration of multi-step loading method. Plot shows strain super-position process for three stages.
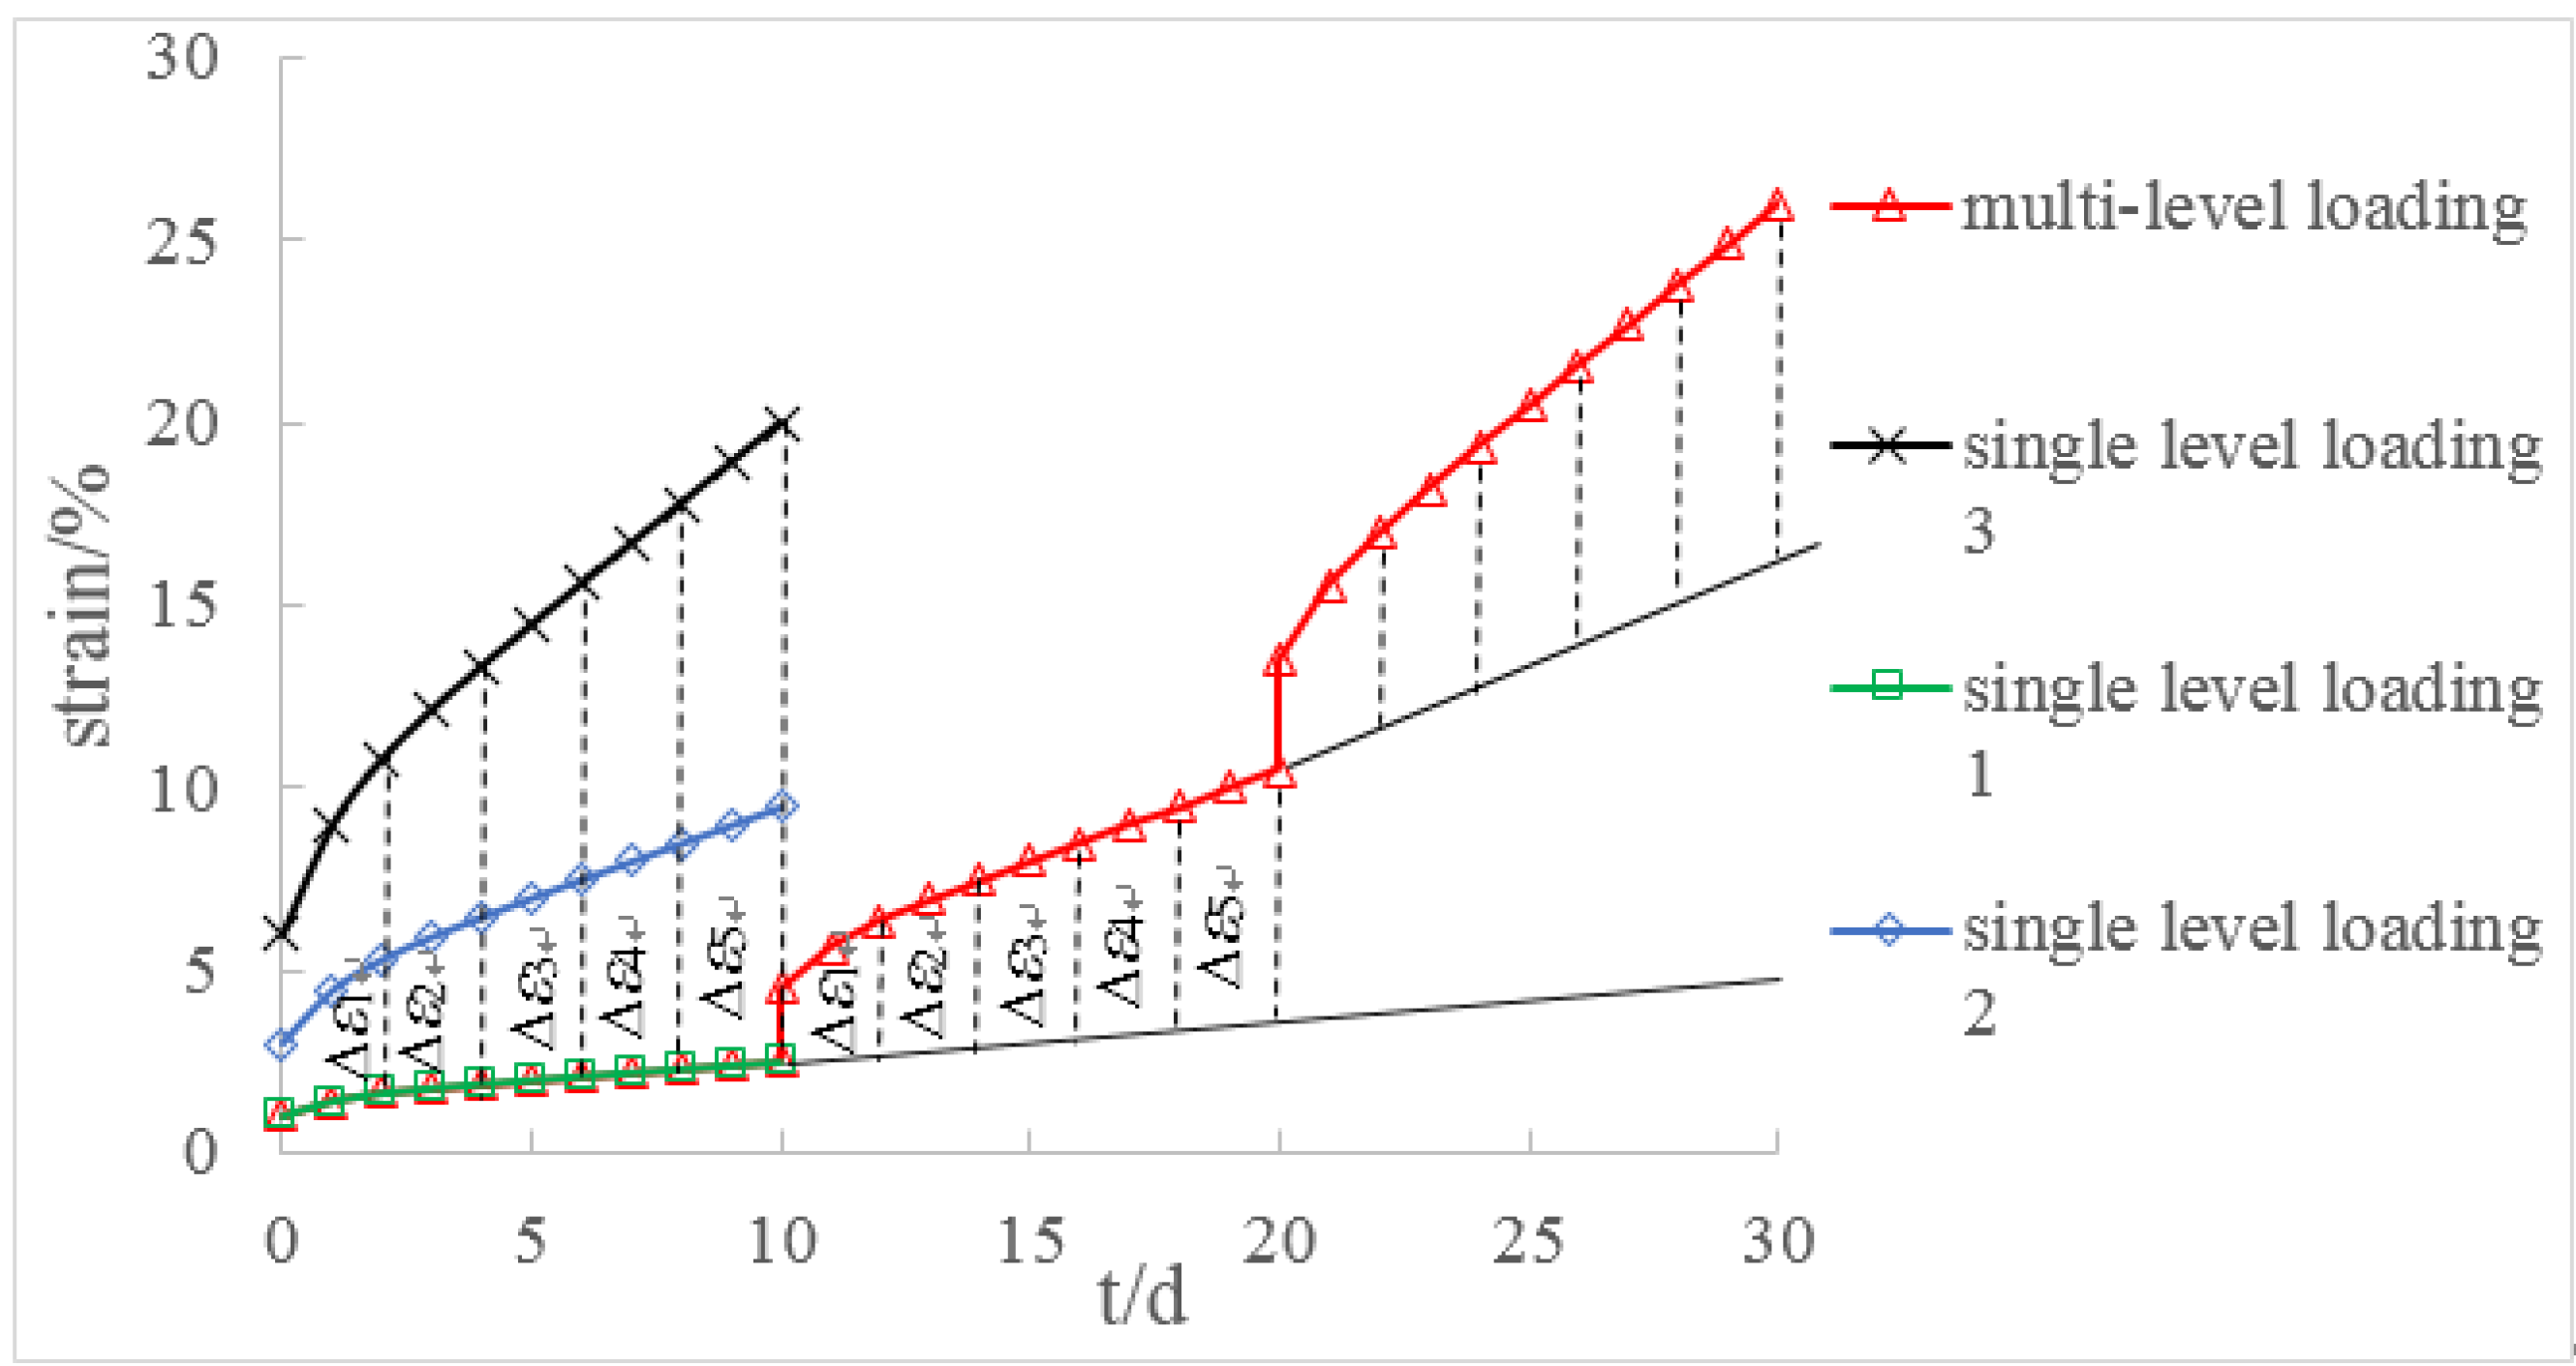
Figure 6.
Primary, secondary and tertiary creep in uniaxial test (after Tomanovic [54]).
Figure 6.
Primary, secondary and tertiary creep in uniaxial test (after Tomanovic [54]).
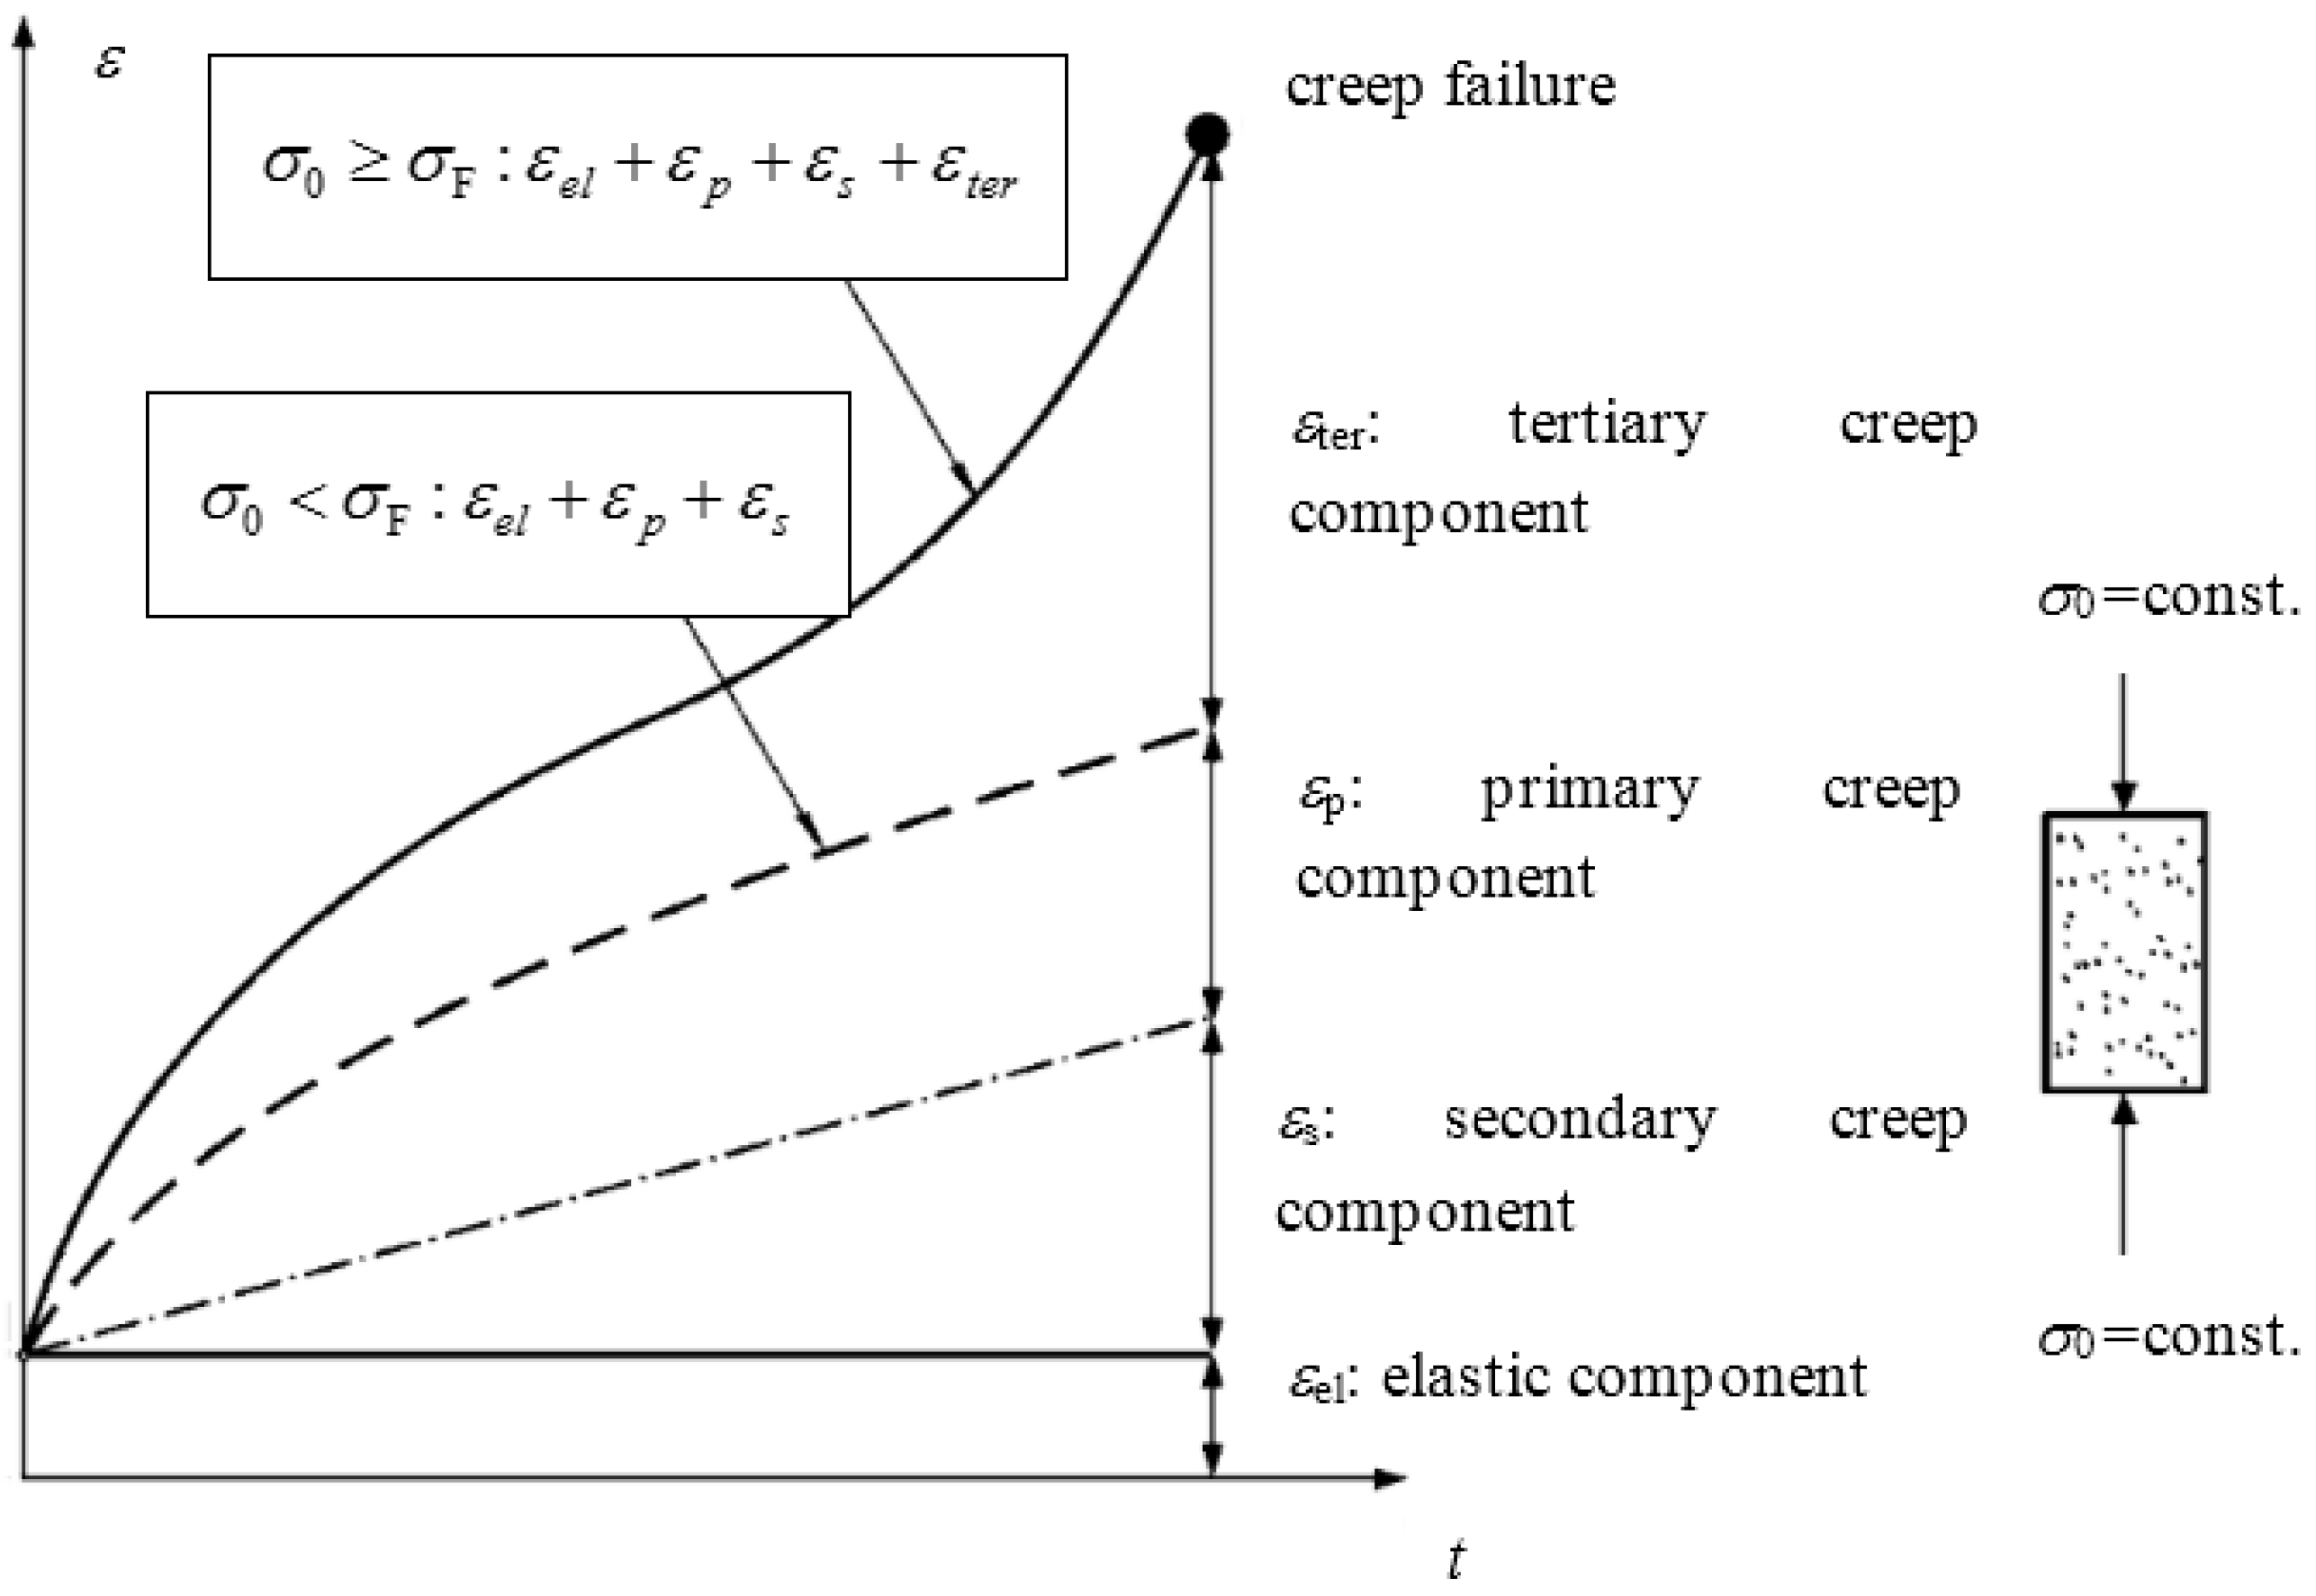
Figure 7.
Illustration of creep strain expression considering time effect for the H-K model.
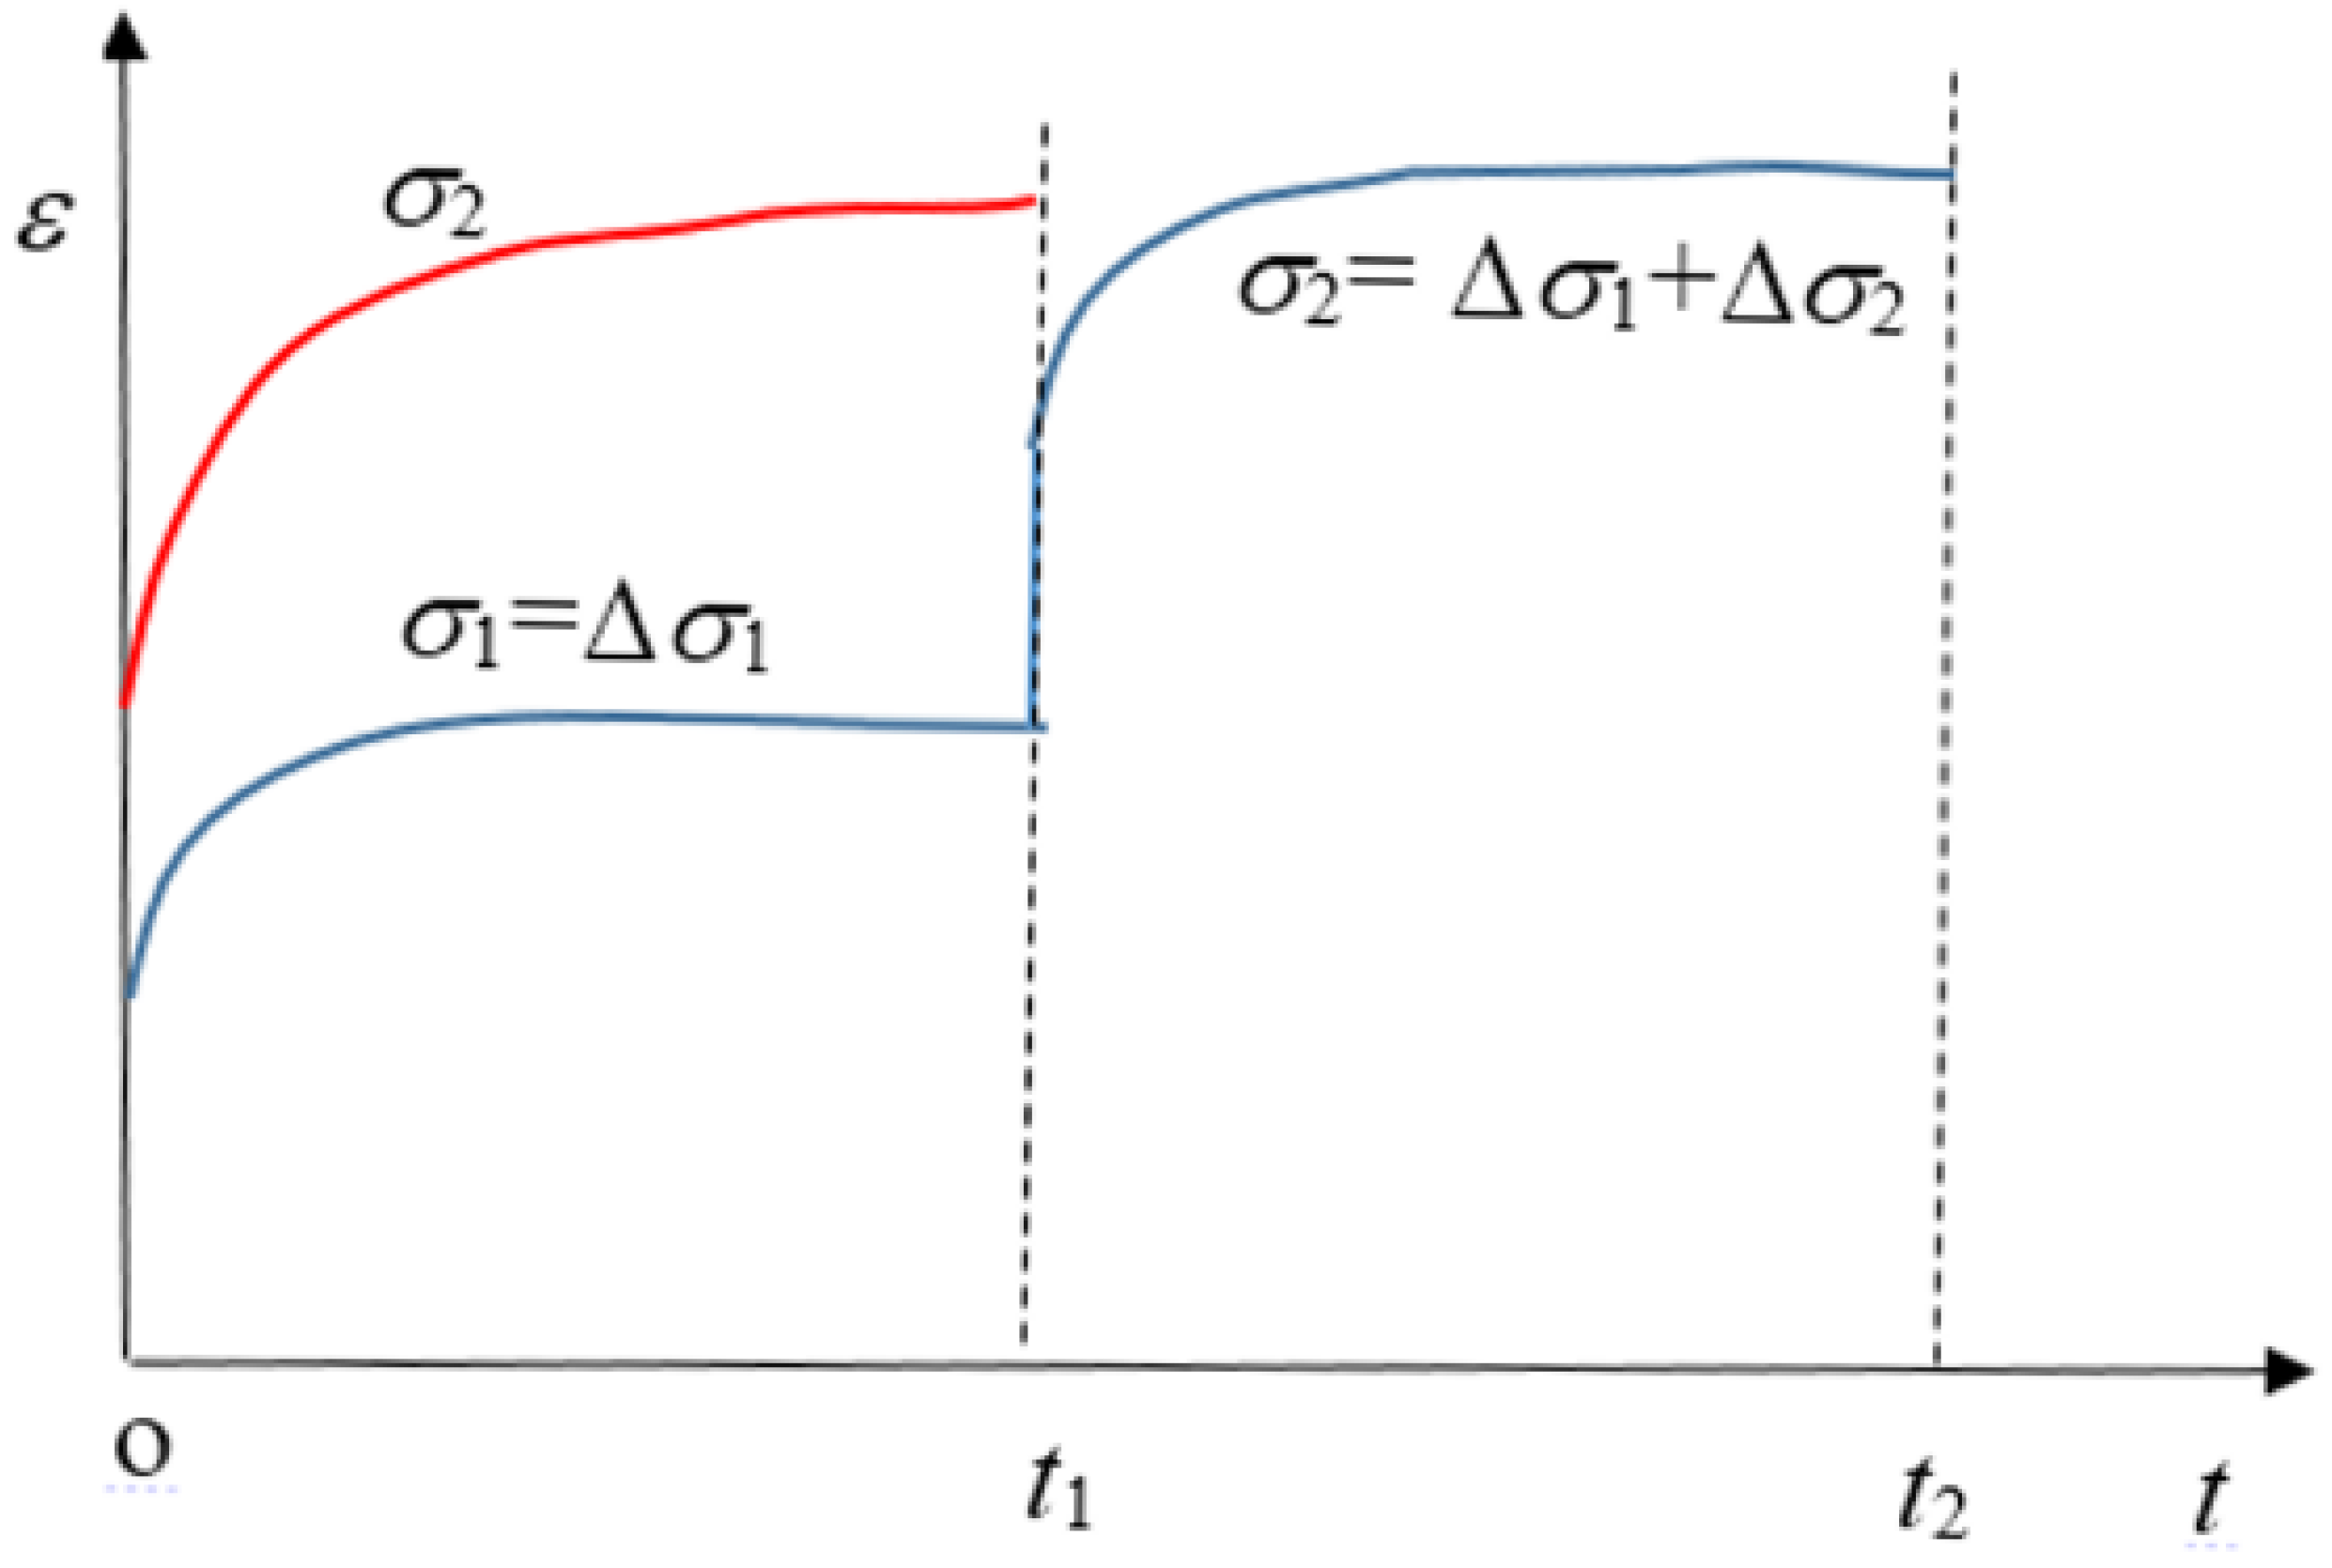
Figure 8.
Comparison of creep strains between single-step loading and multi-step loading for H-K model.
Figure 8.
Comparison of creep strains between single-step loading and multi-step loading for H-K model.
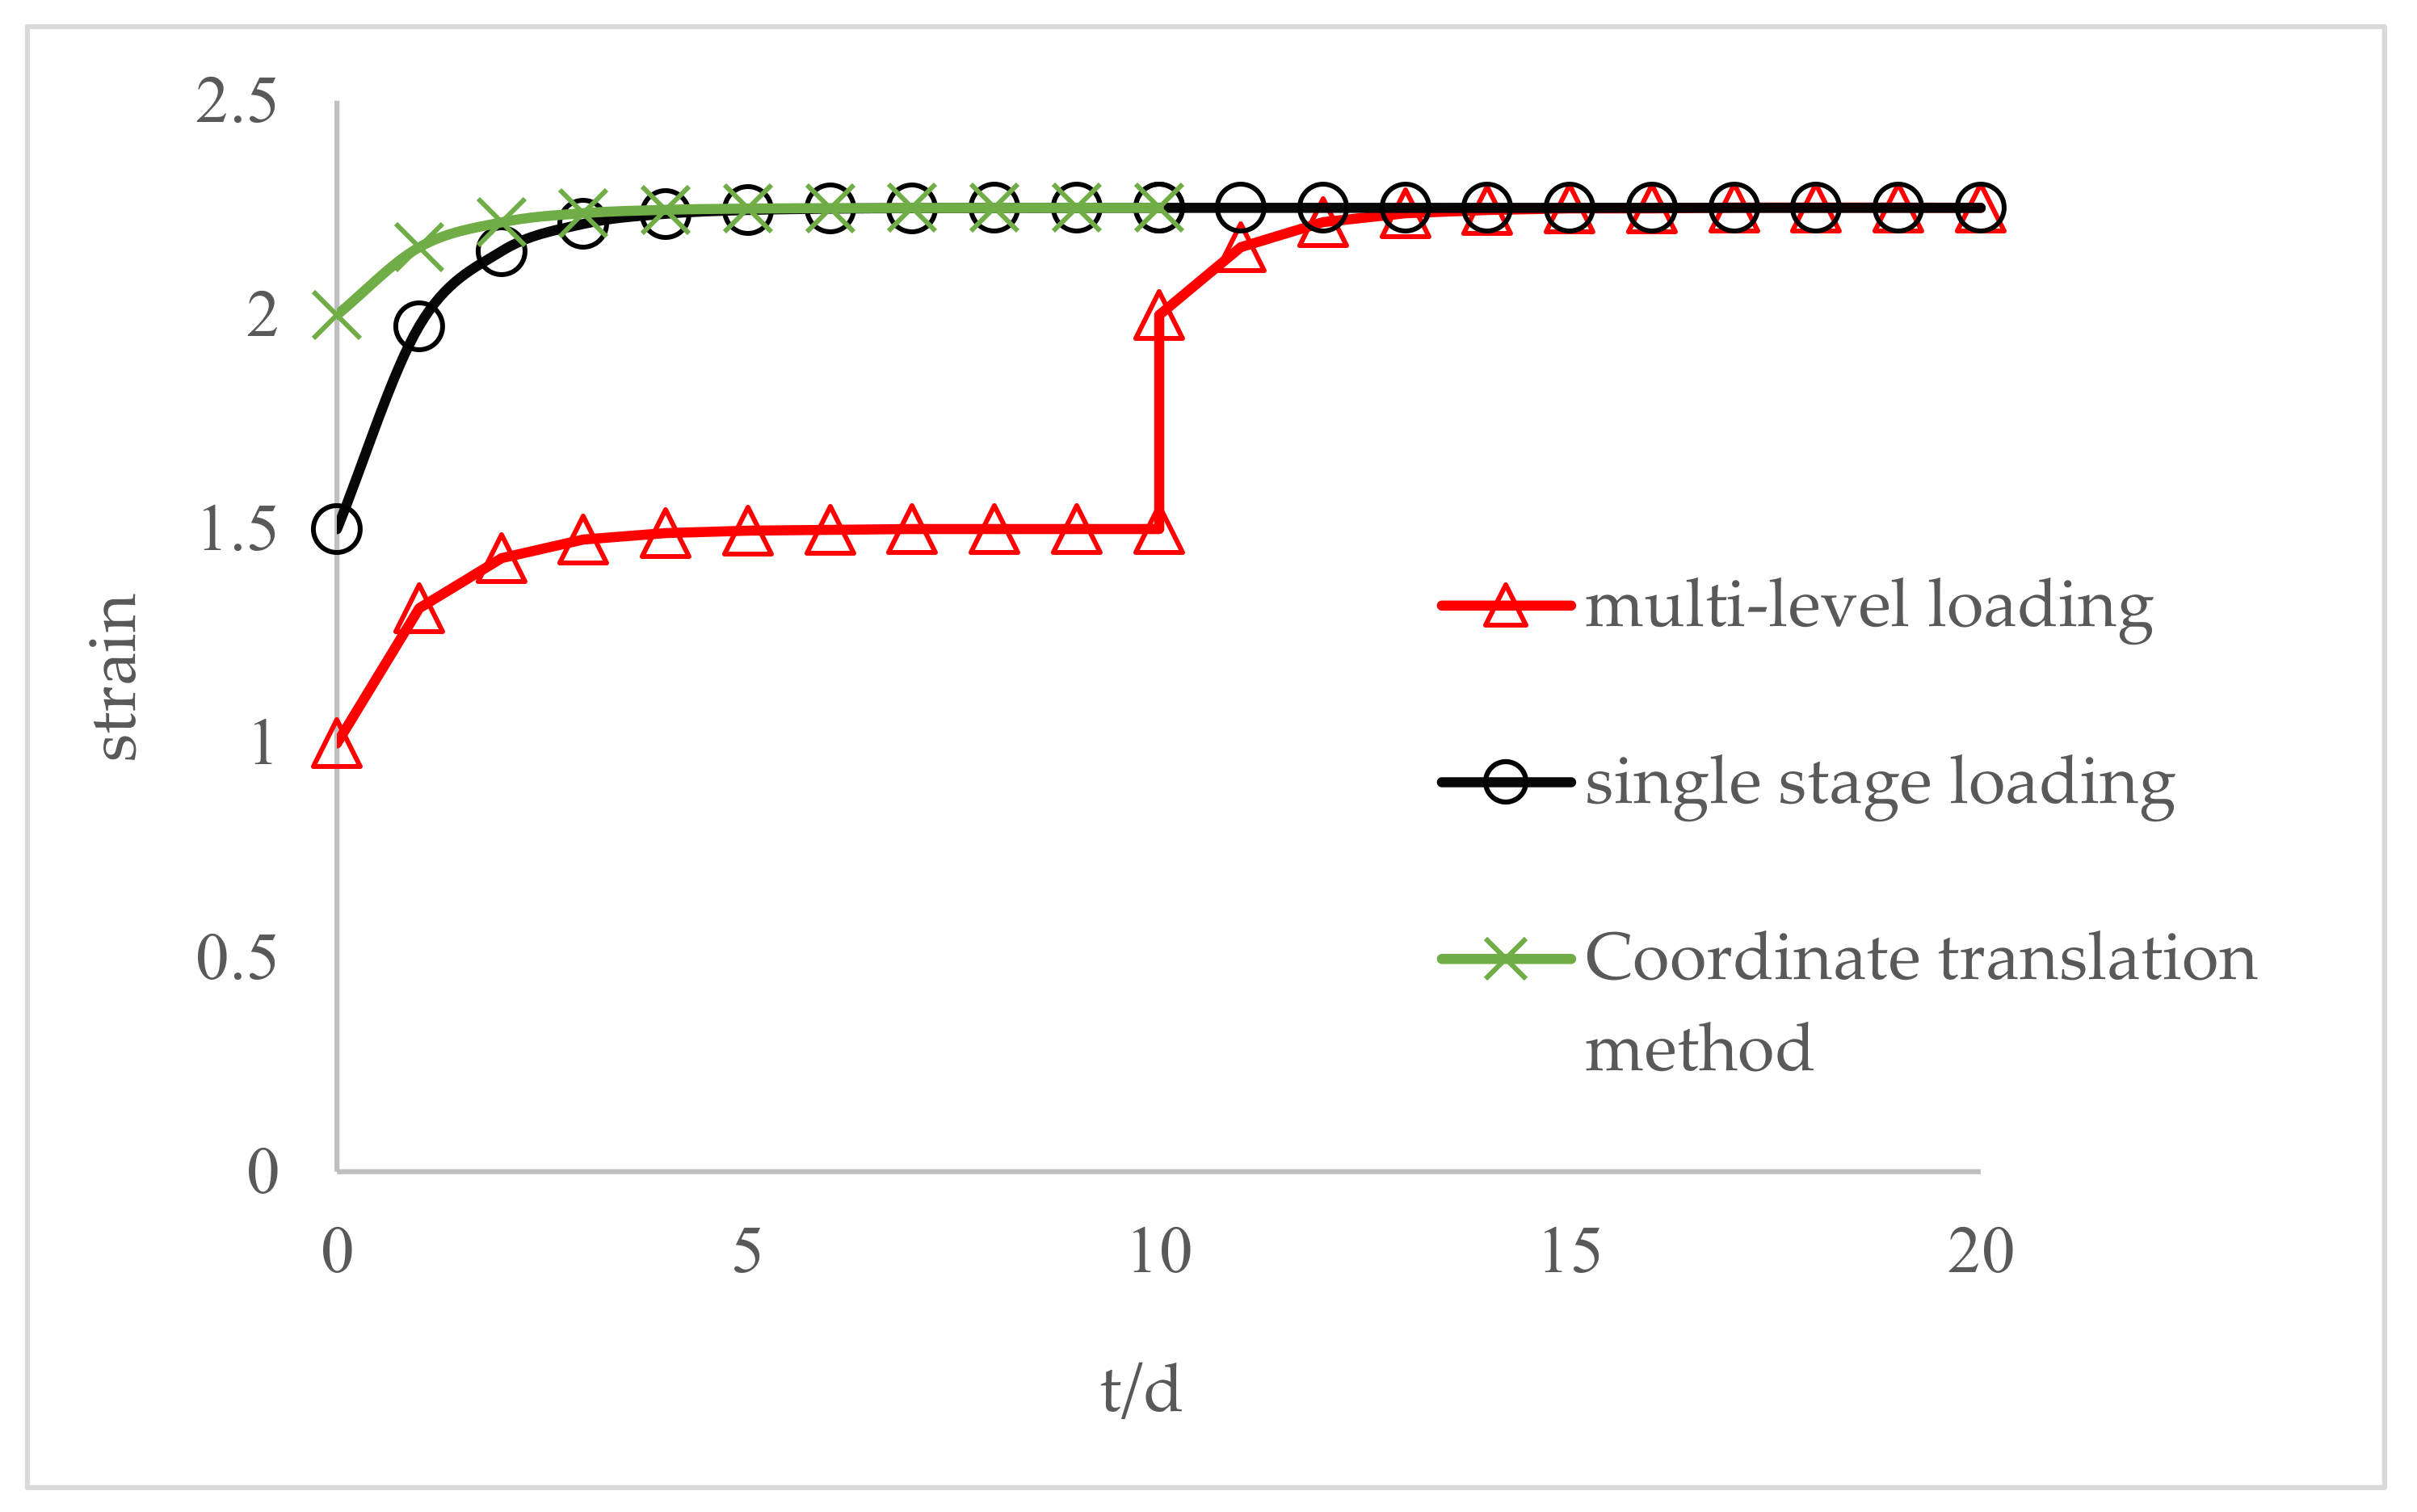
Figure 9.
Illustration of creep strain expression considering time effect for the Burgers model.
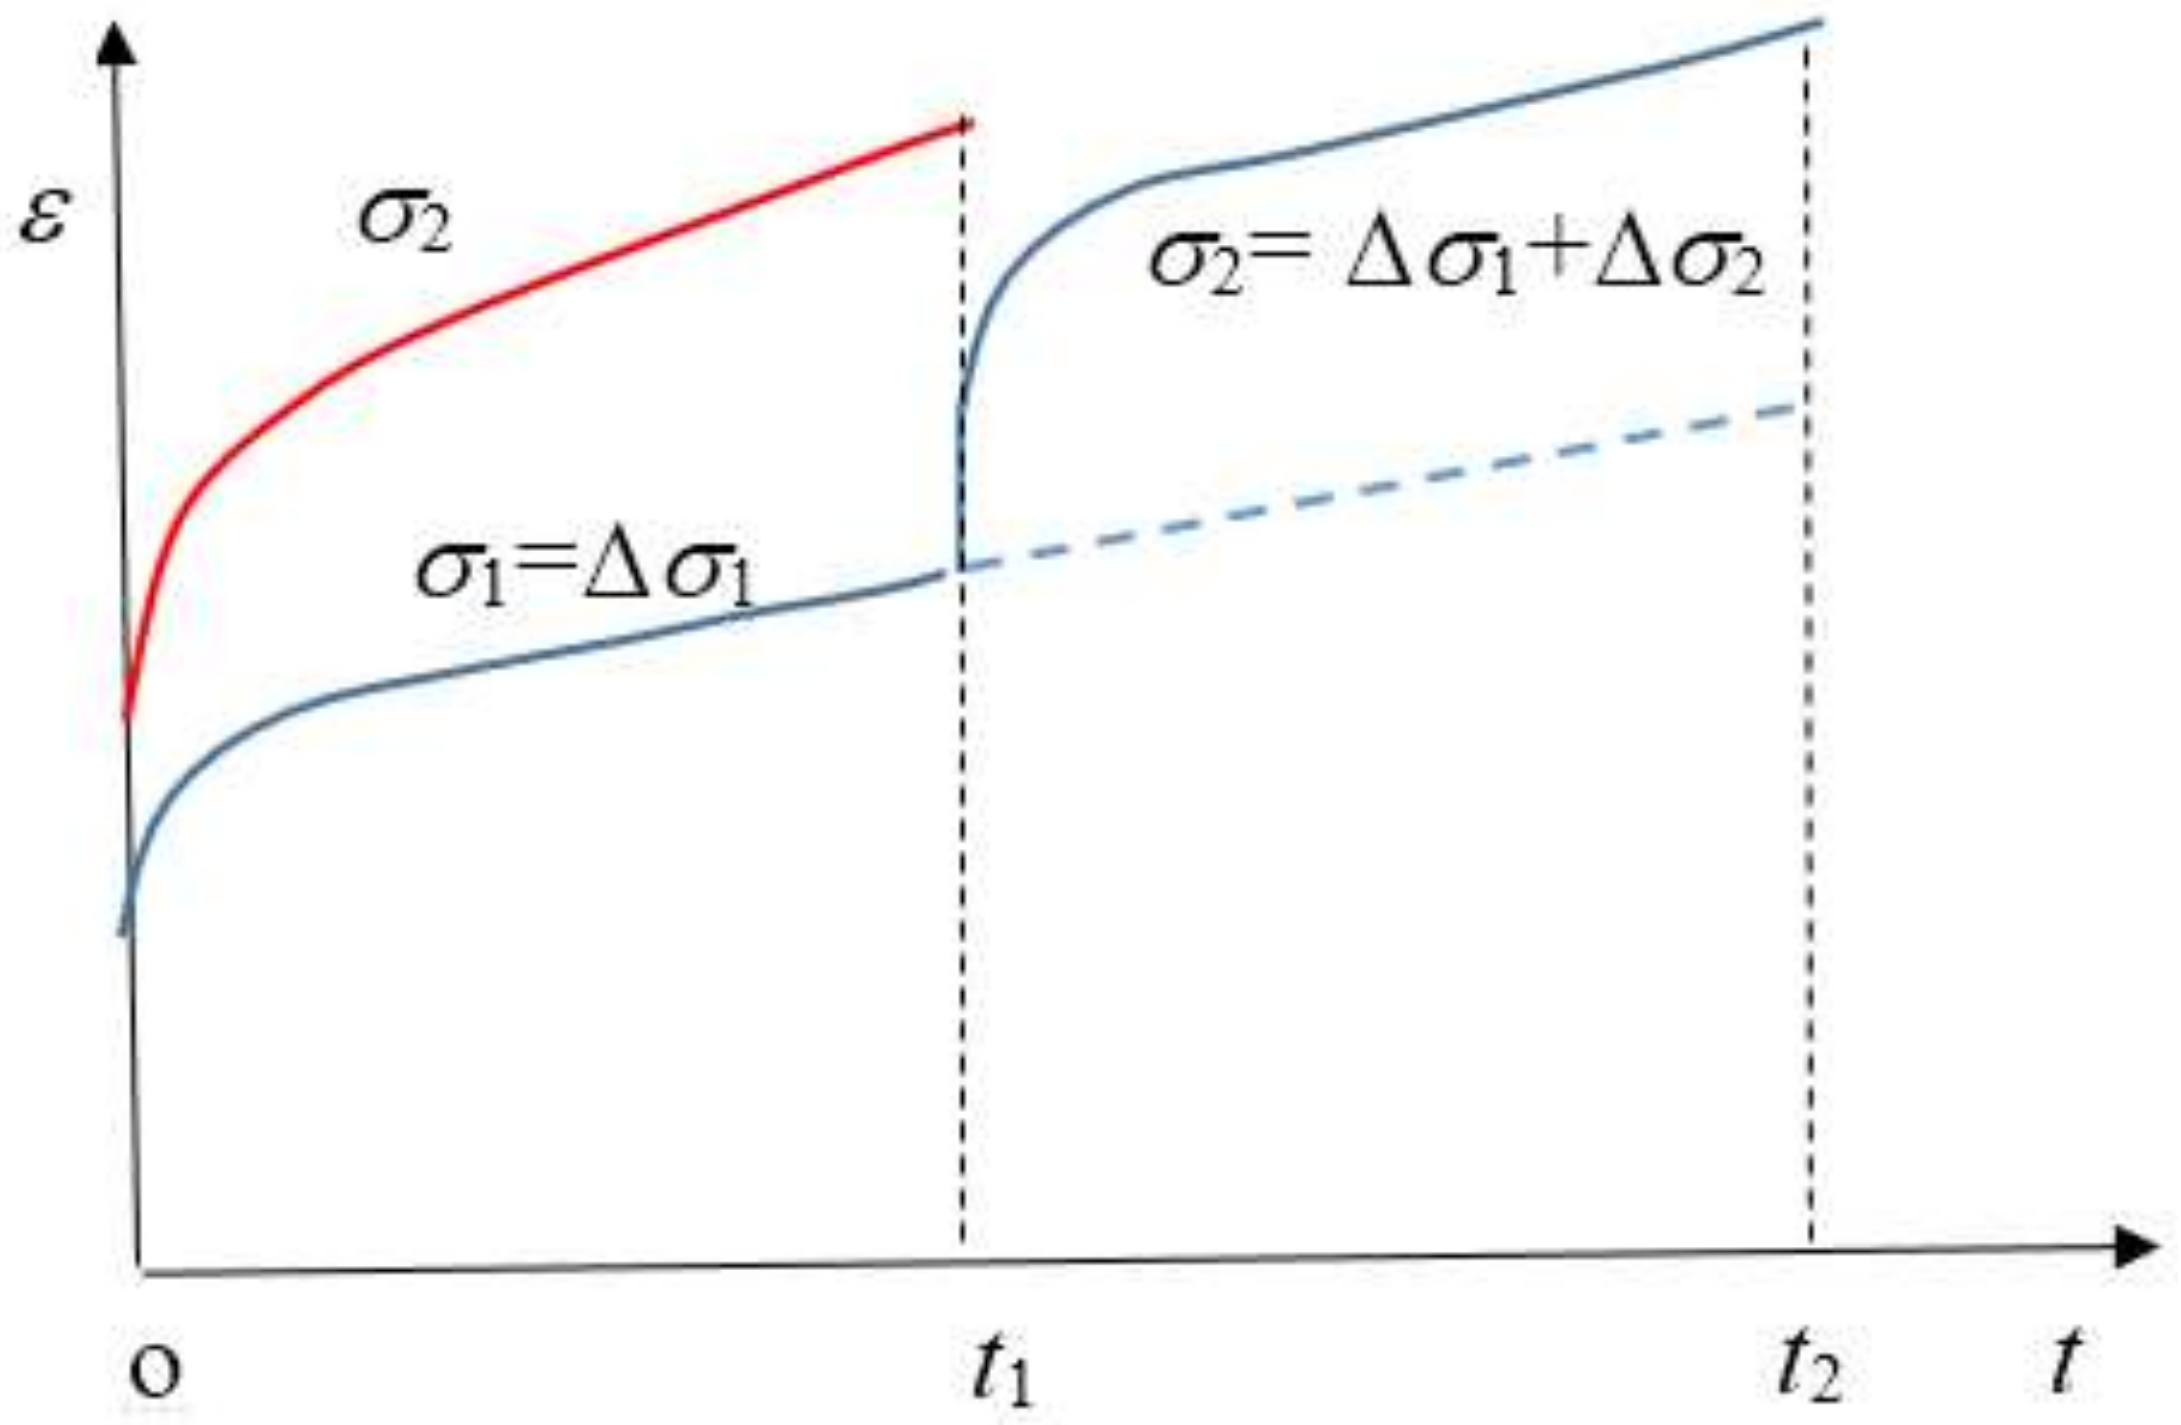
Figure 10.
Comparison of creep strains between single-step loading and multi-step loading for the Burgers model.
Figure 10.
Comparison of creep strains between single-step loading and multi-step loading for the Burgers model.
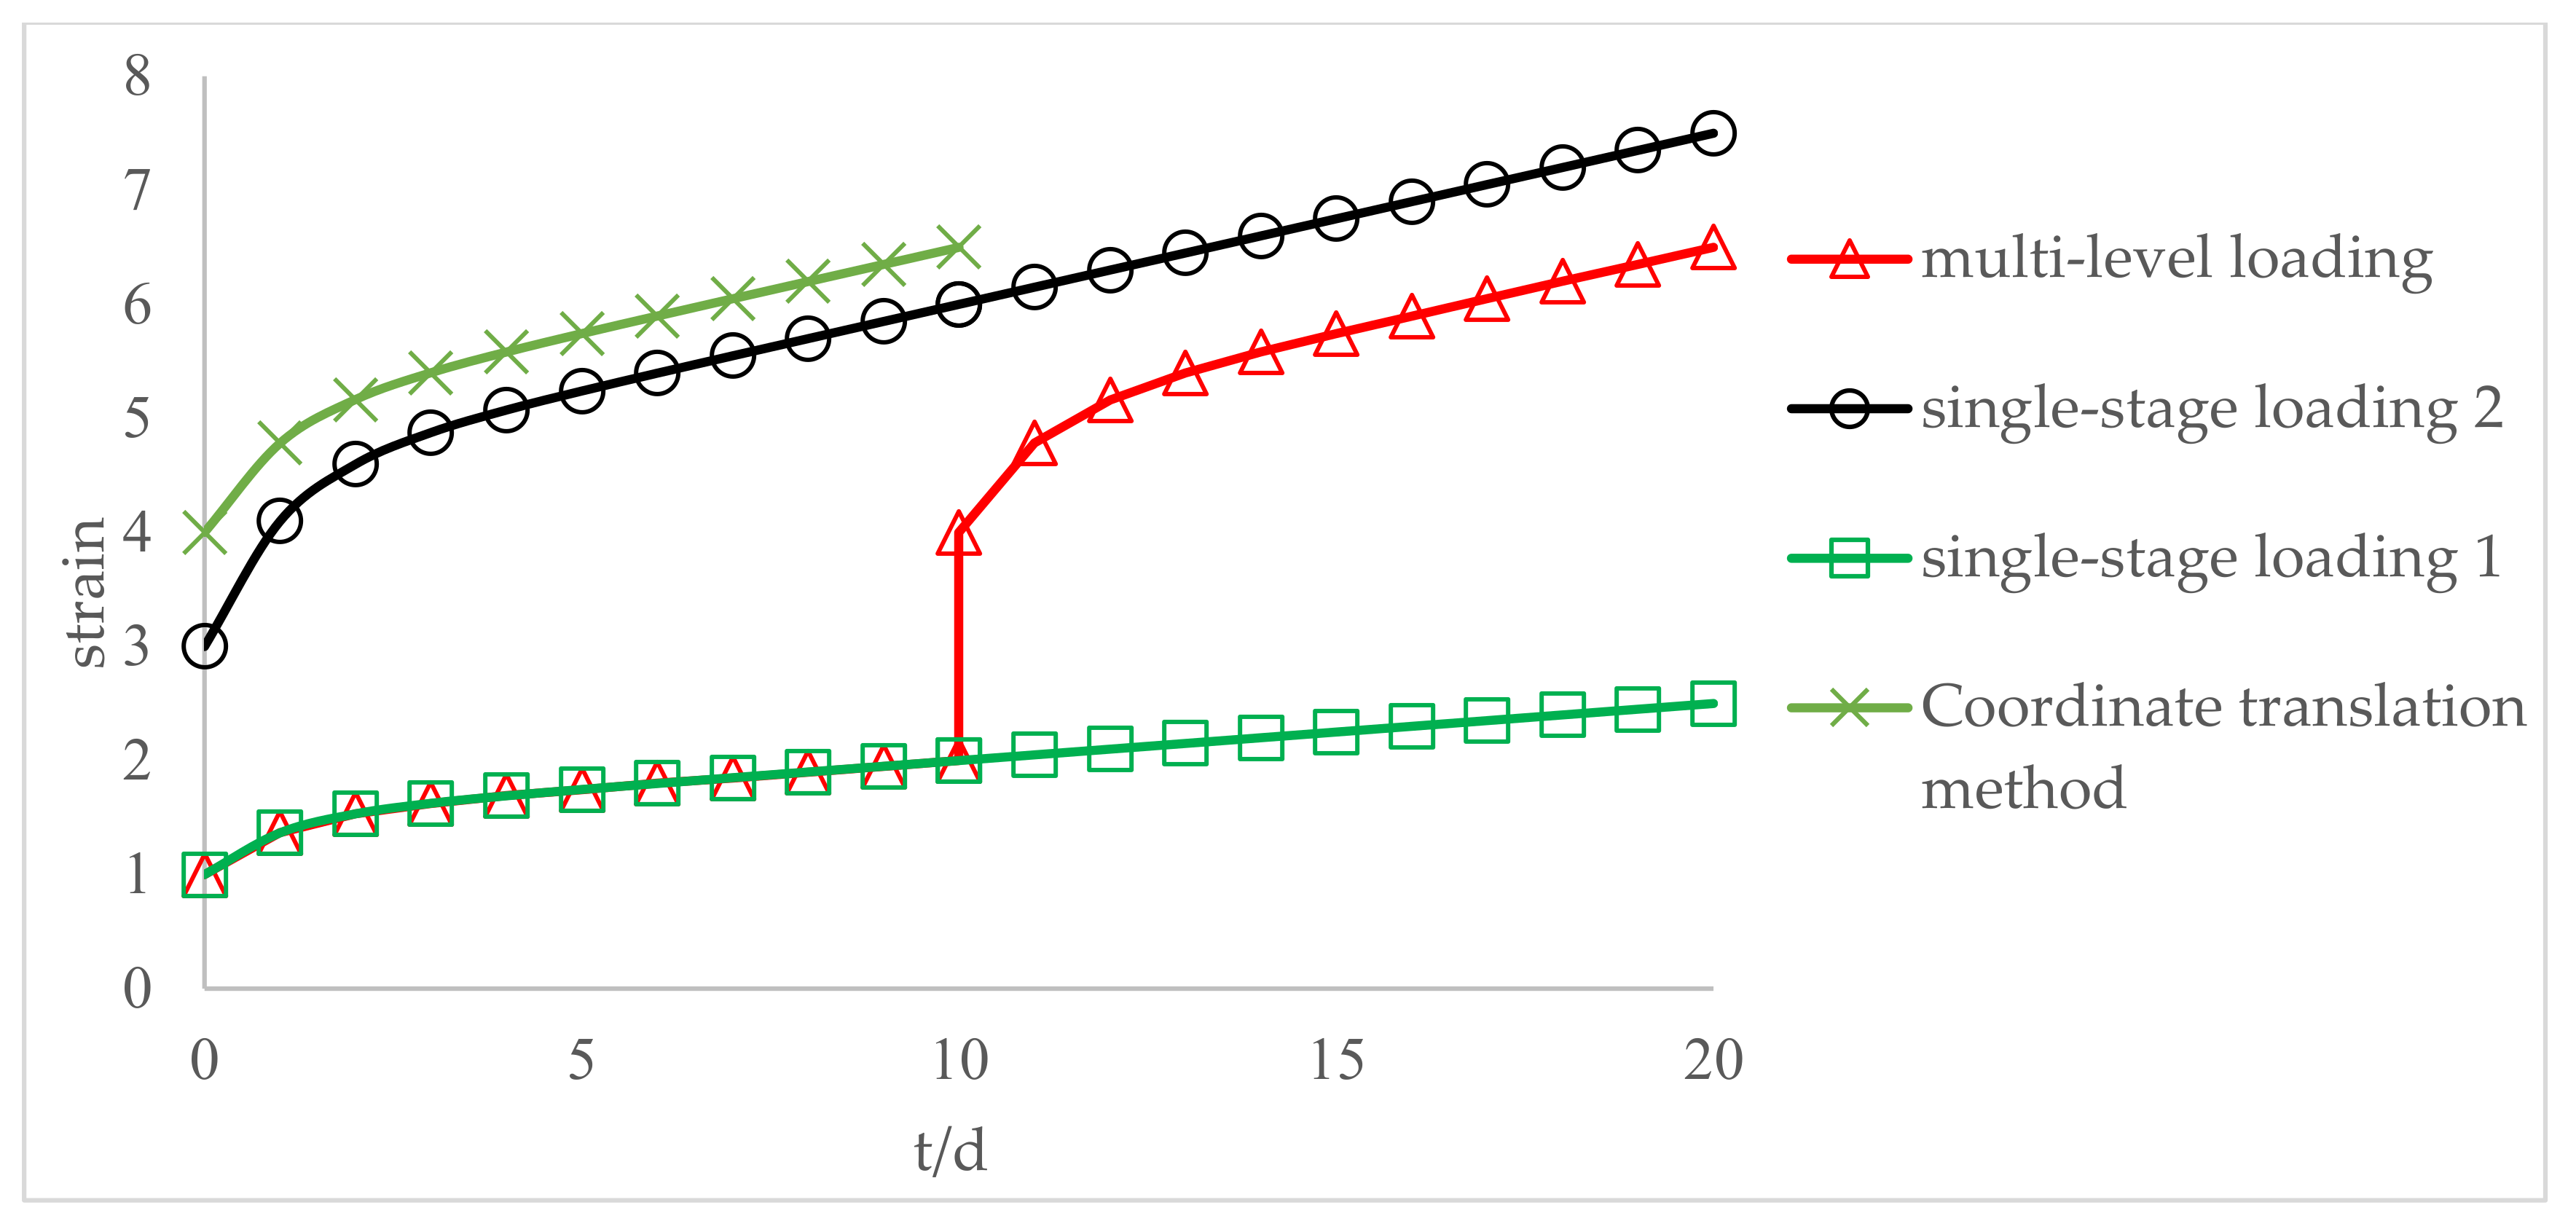
Figure 11.
Illustration of the Nishihara creep model.
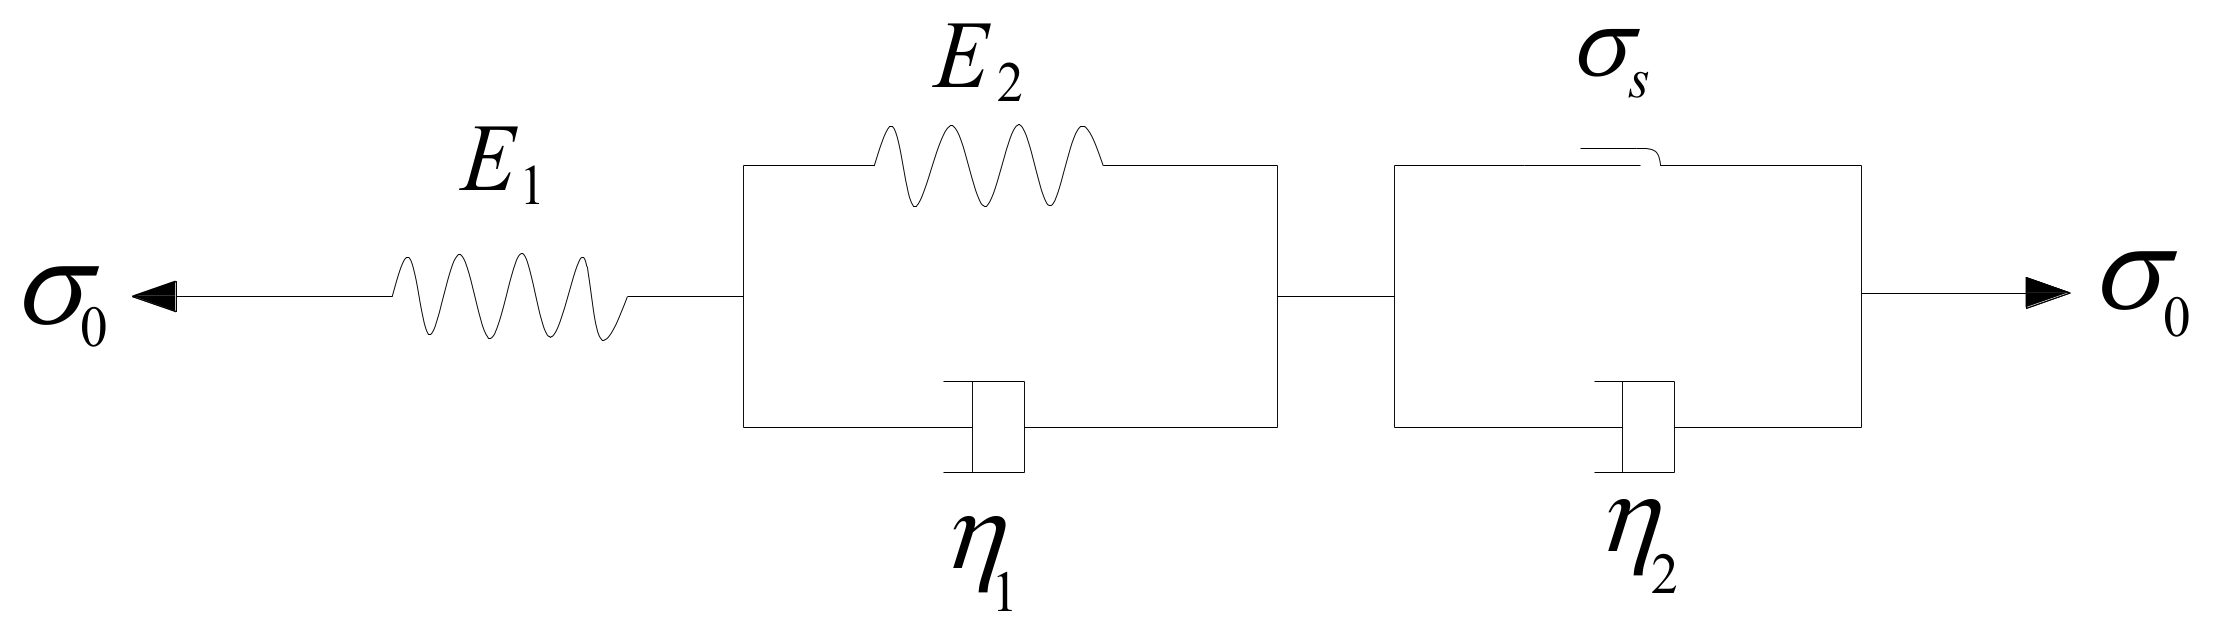
Figure 12.
Illustration of creep strain expression considering time effect for the Nishihara model.
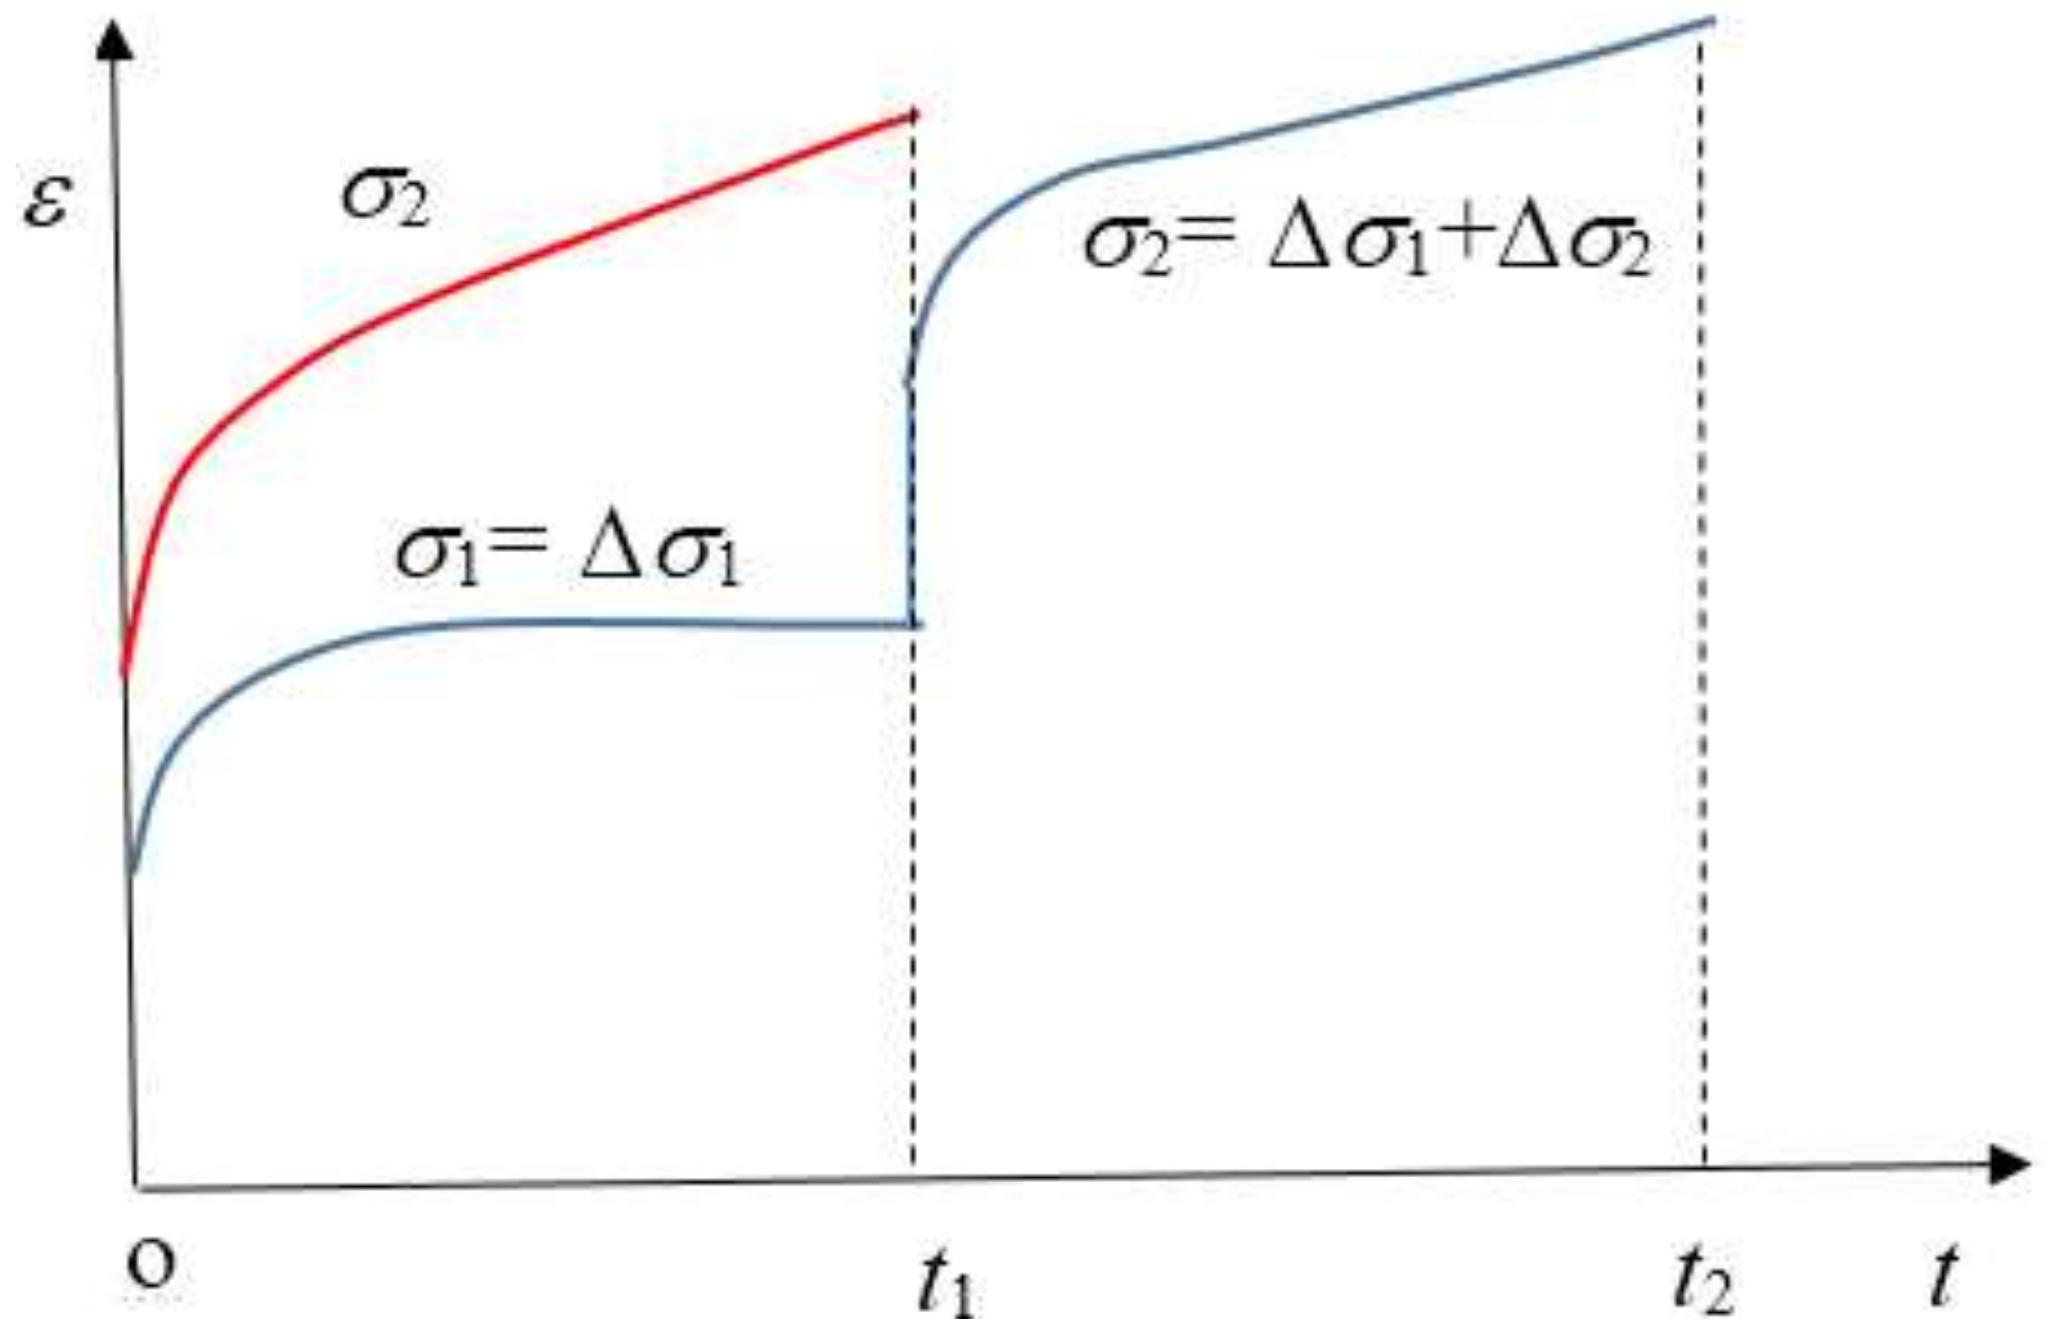
Figure 13.
Comparison of creep strains between single-step loading and multi-step loading for Nishihara model.
Figure 13.
Comparison of creep strains between single-step loading and multi-step loading for Nishihara model.
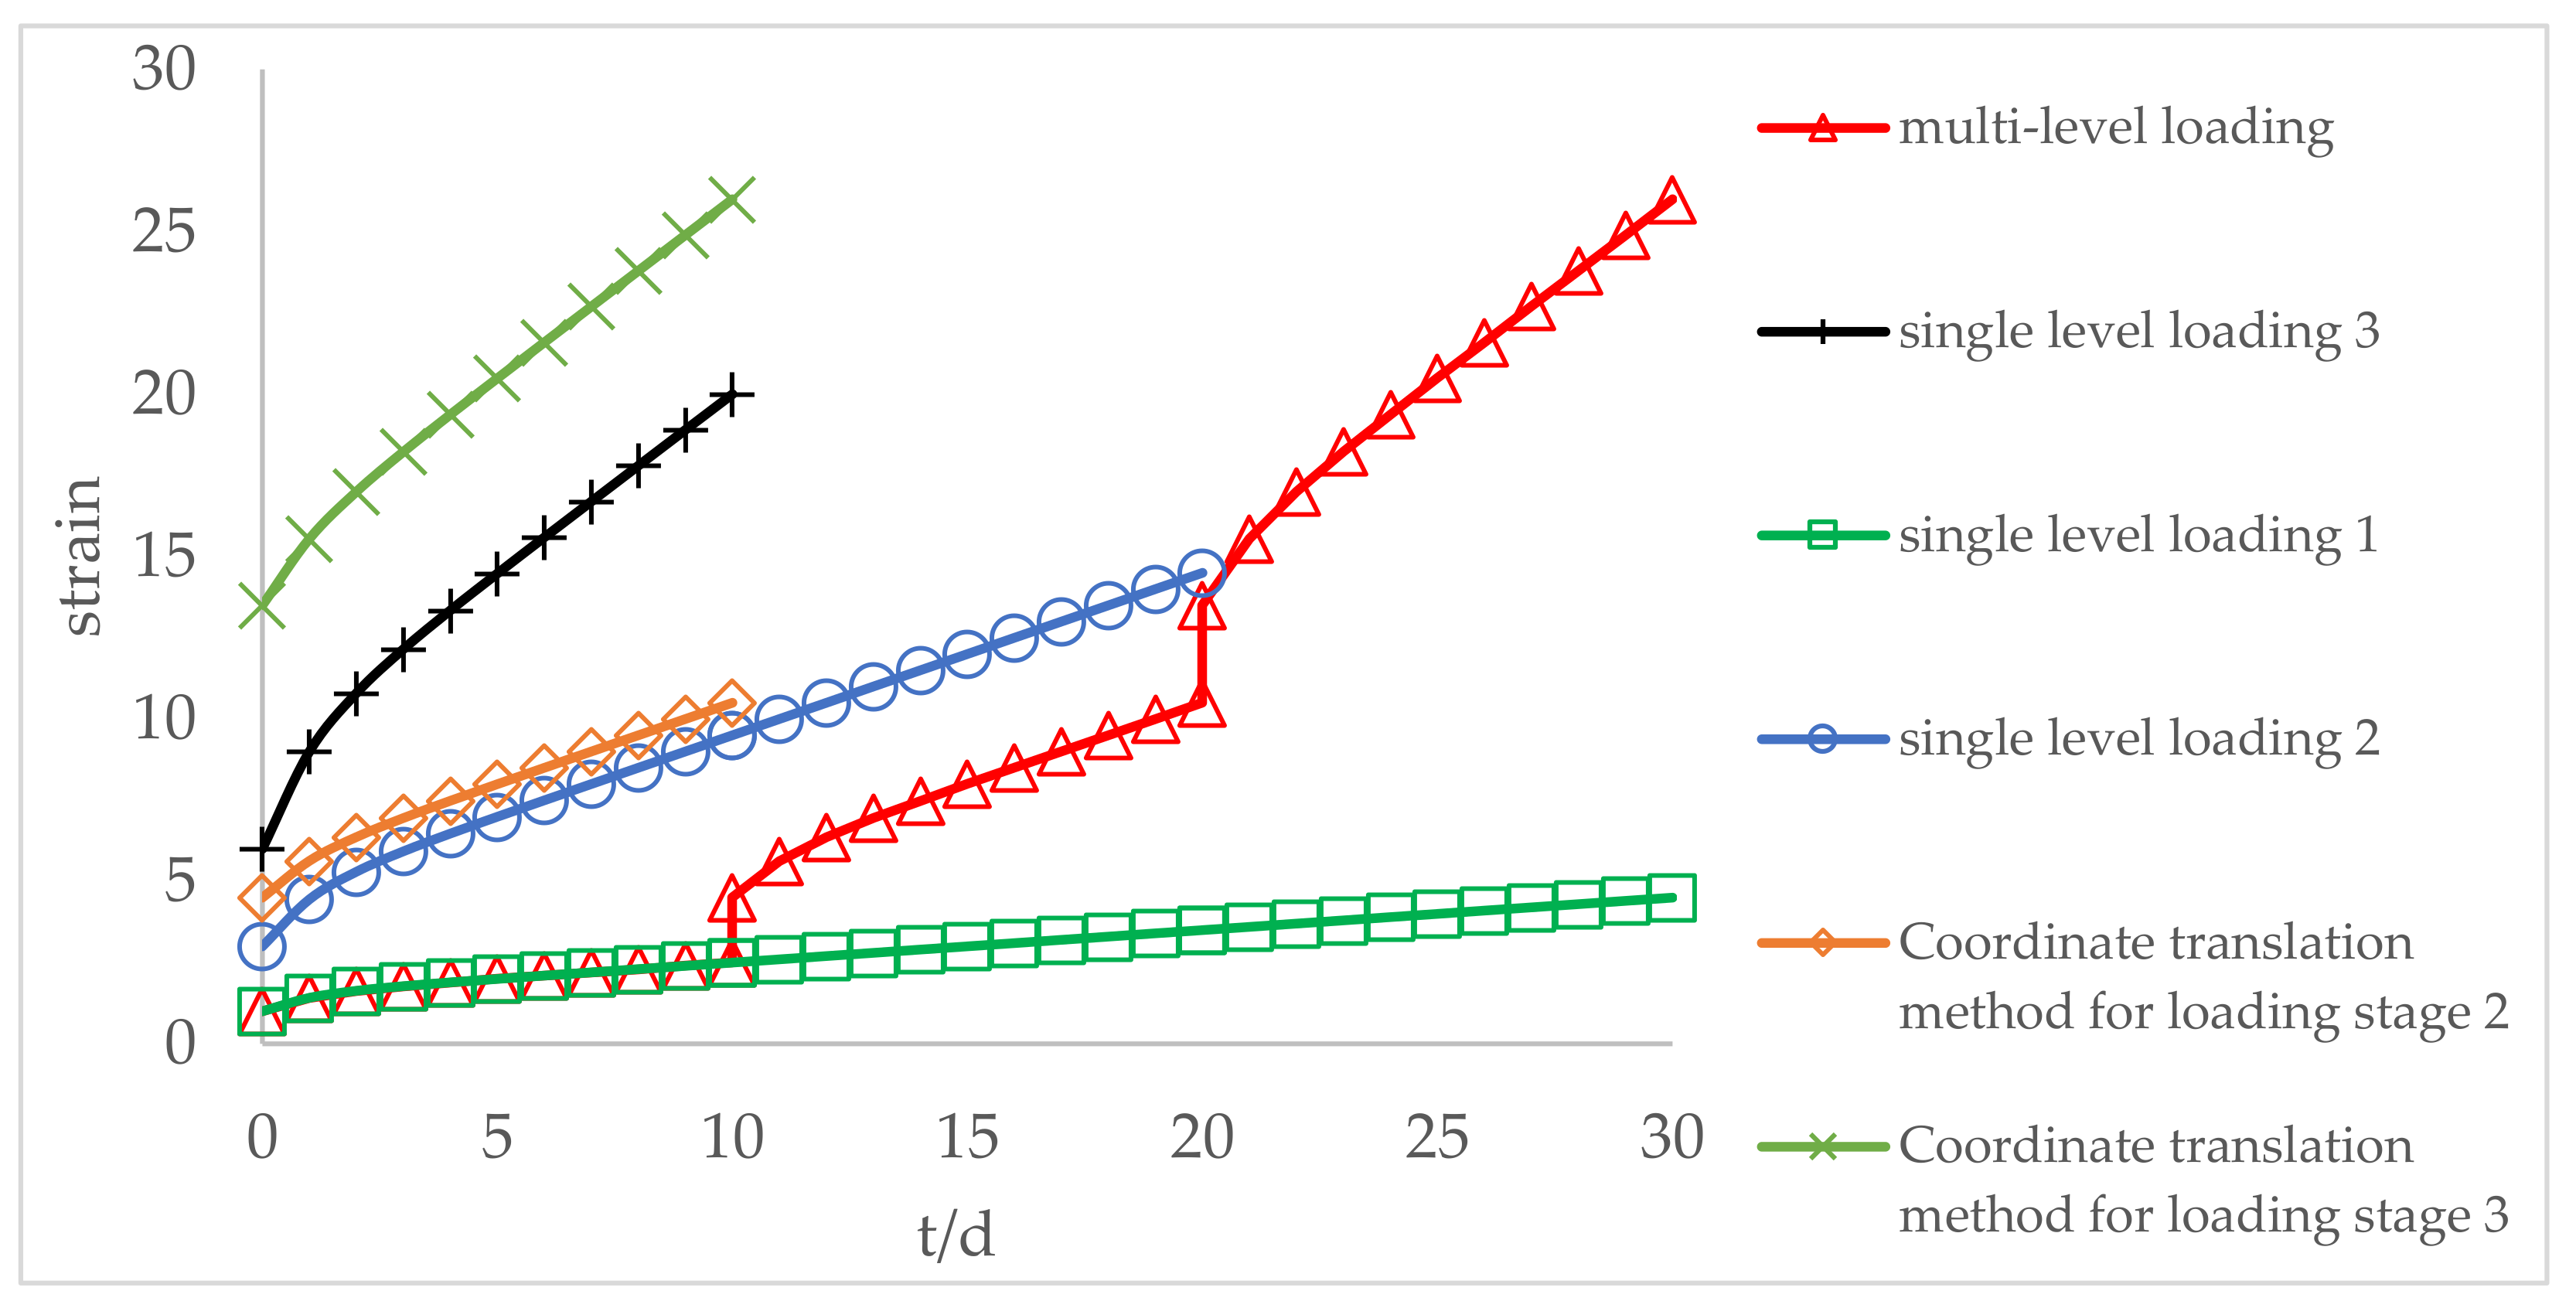
Figure 14.
Tri-axial creep curves of anhydrite rock salt (after Zhang et al. [49]).
Figure 14.
Tri-axial creep curves of anhydrite rock salt (after Zhang et al. [49]).
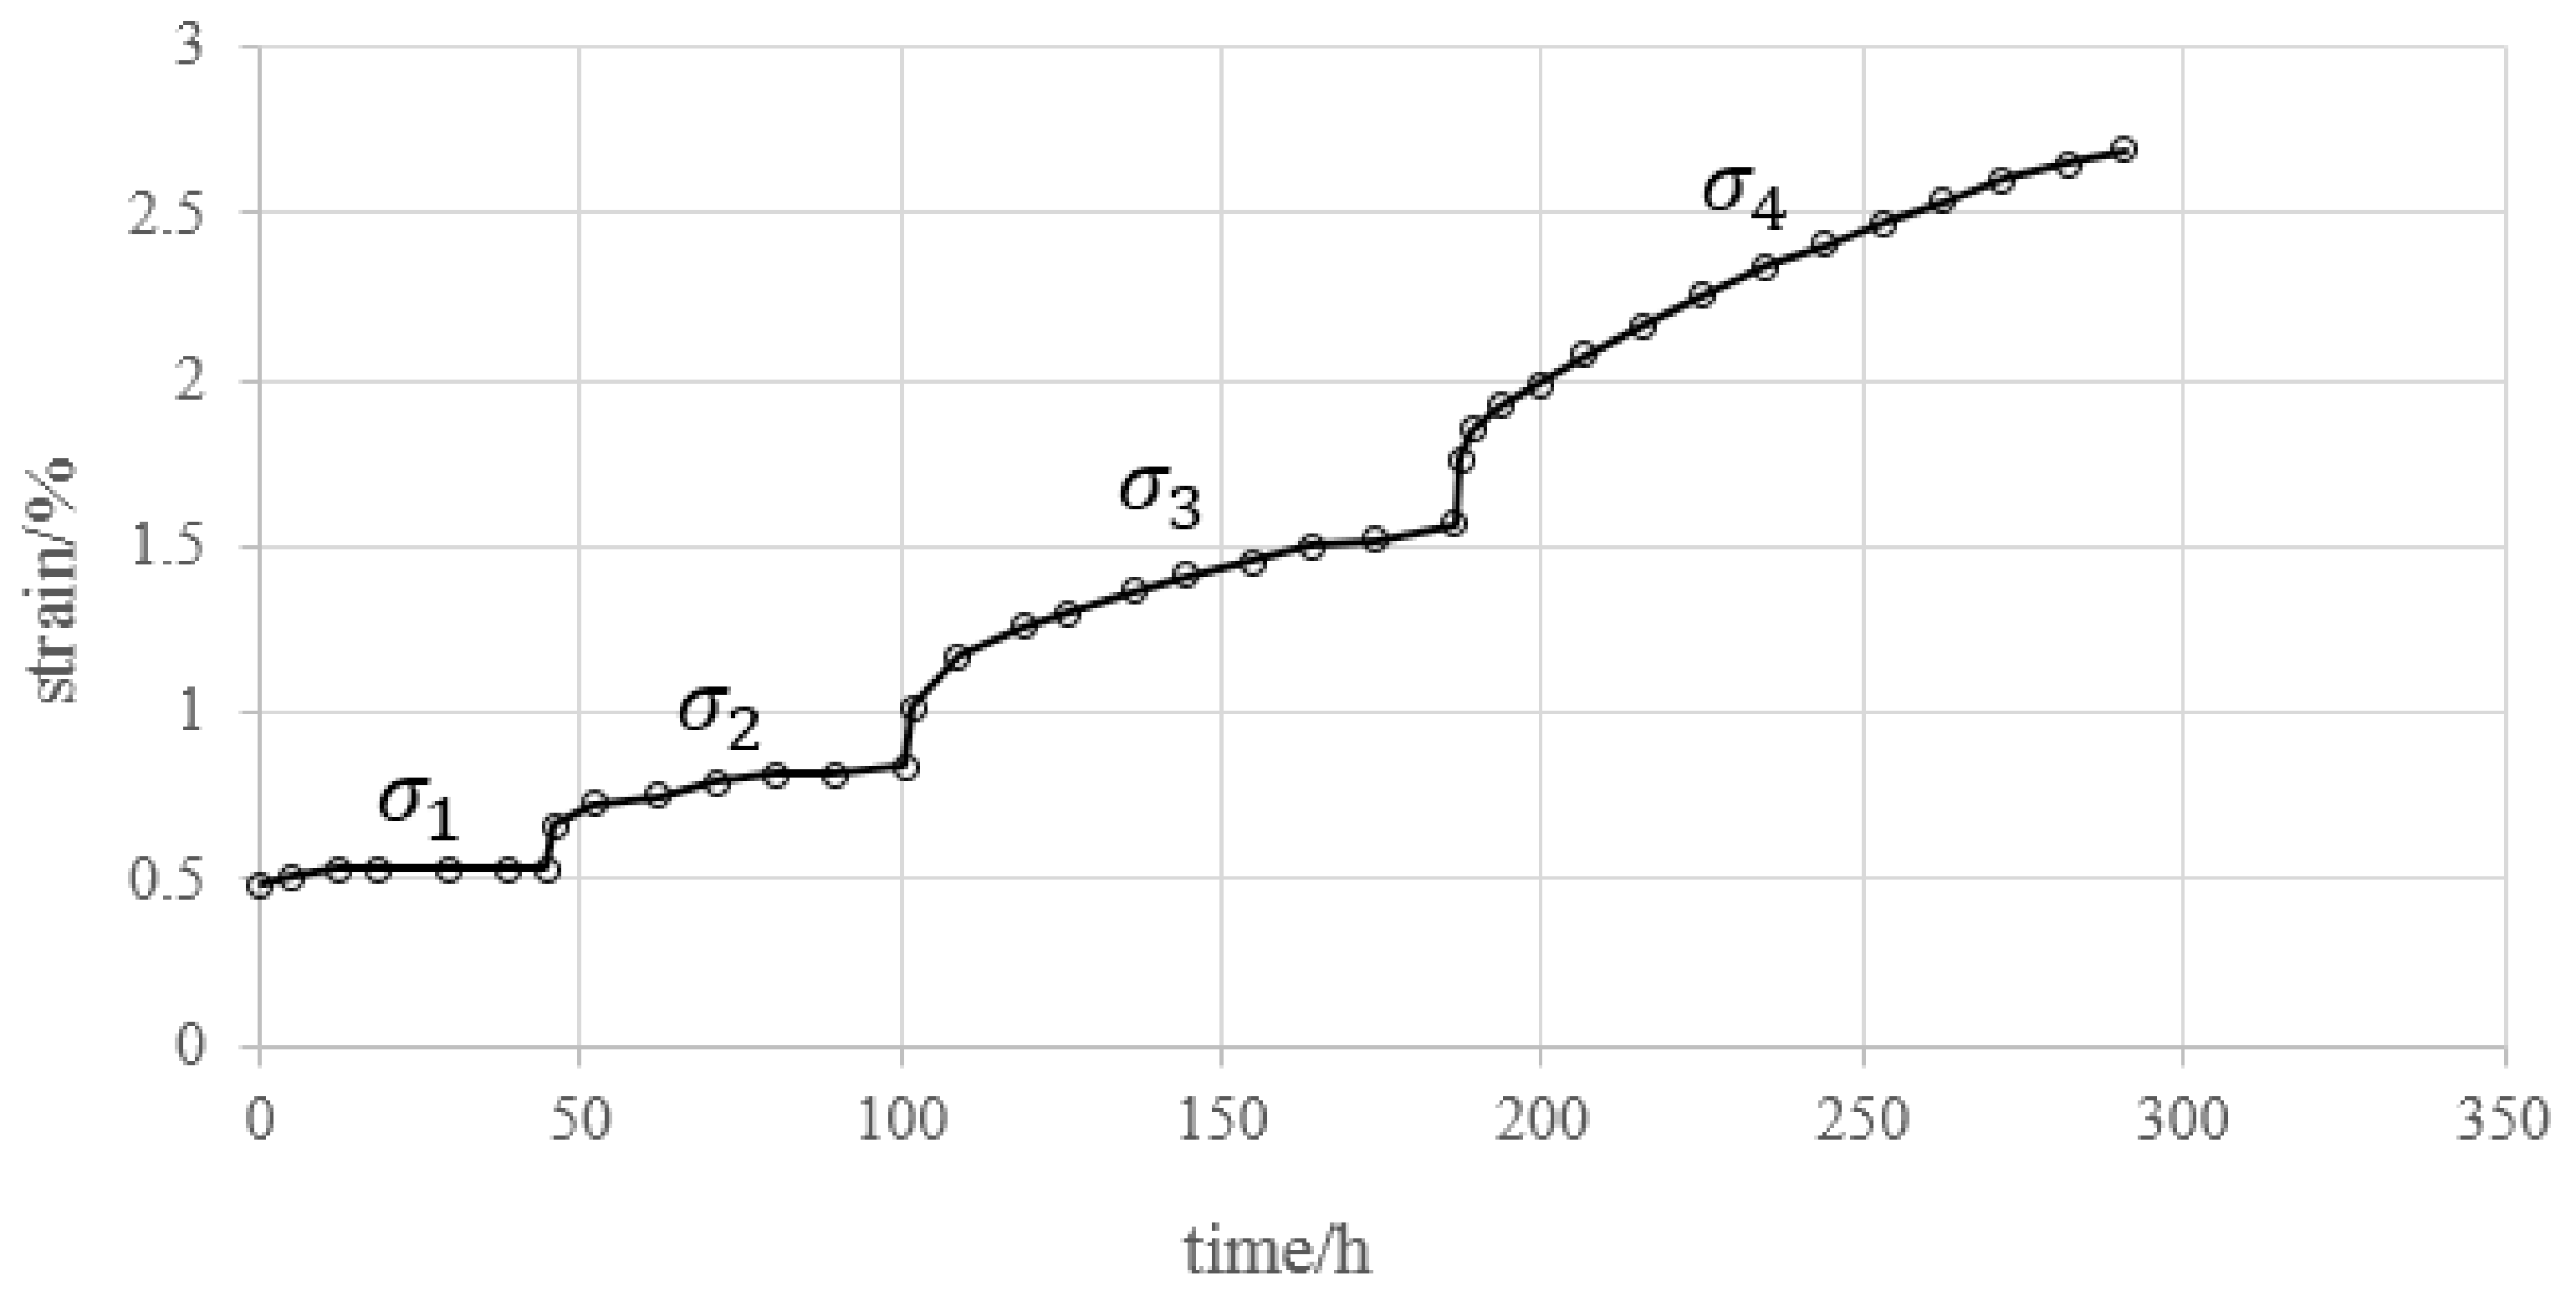
Figure 15.
Creep strain decomposition of specimen under multi-step loading.
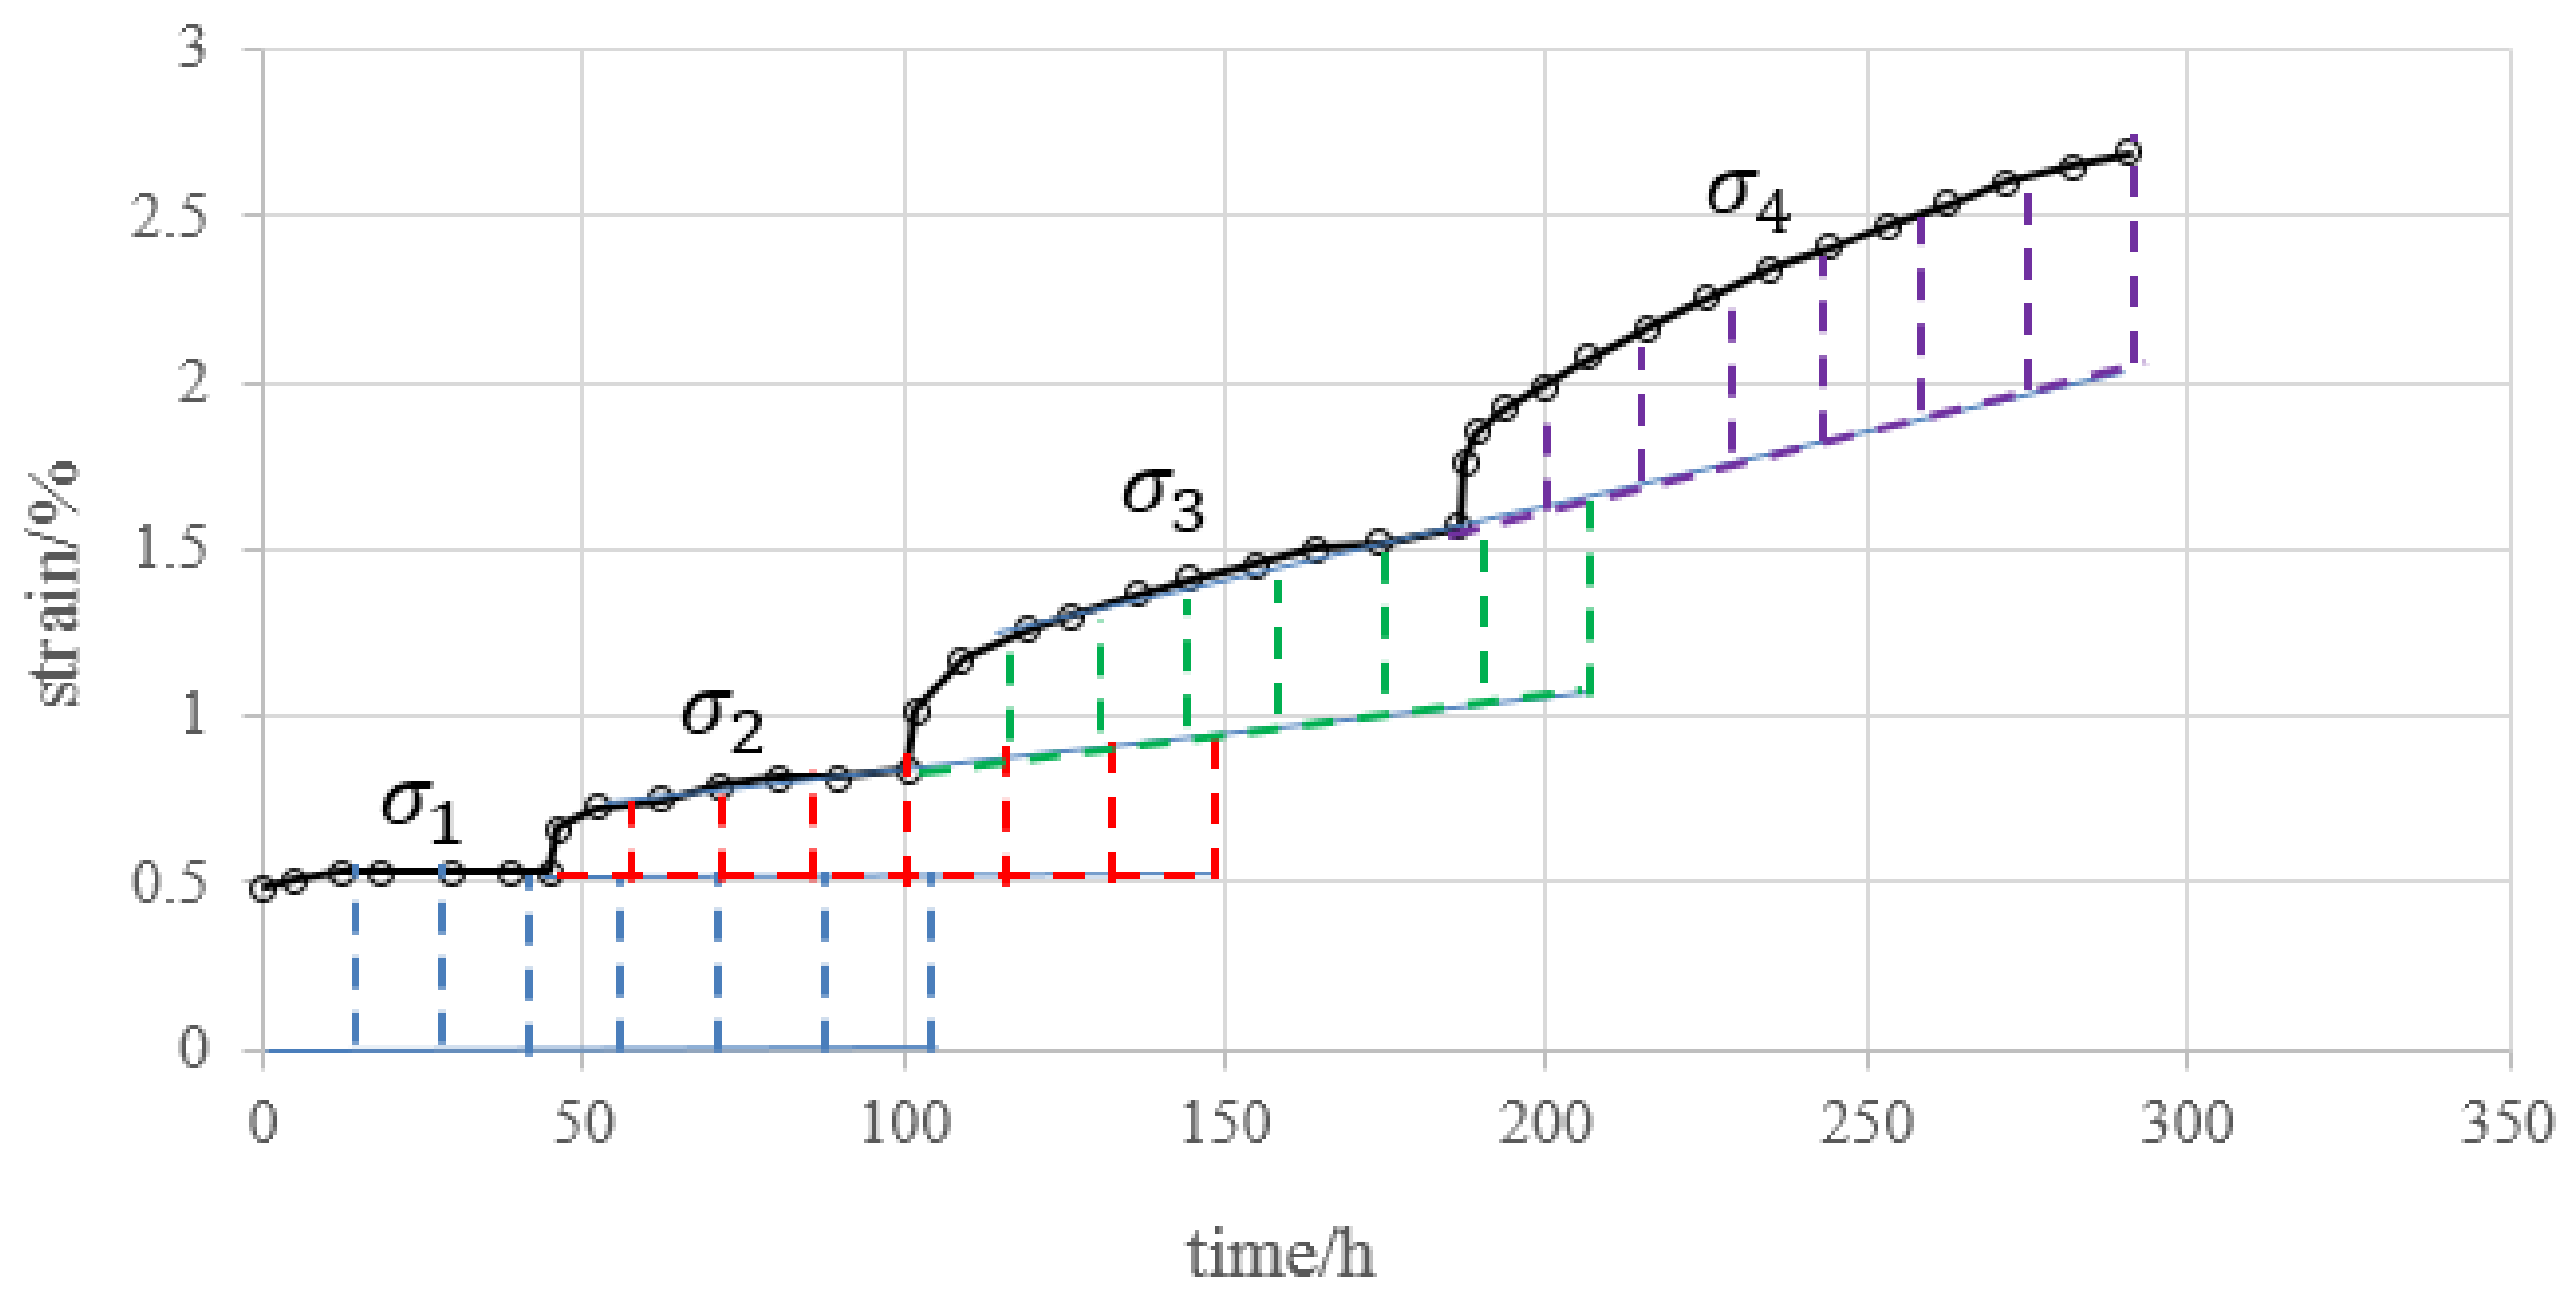
Figure 16.
Estimated creep strains under single-step loading of anhydrite rock salt.
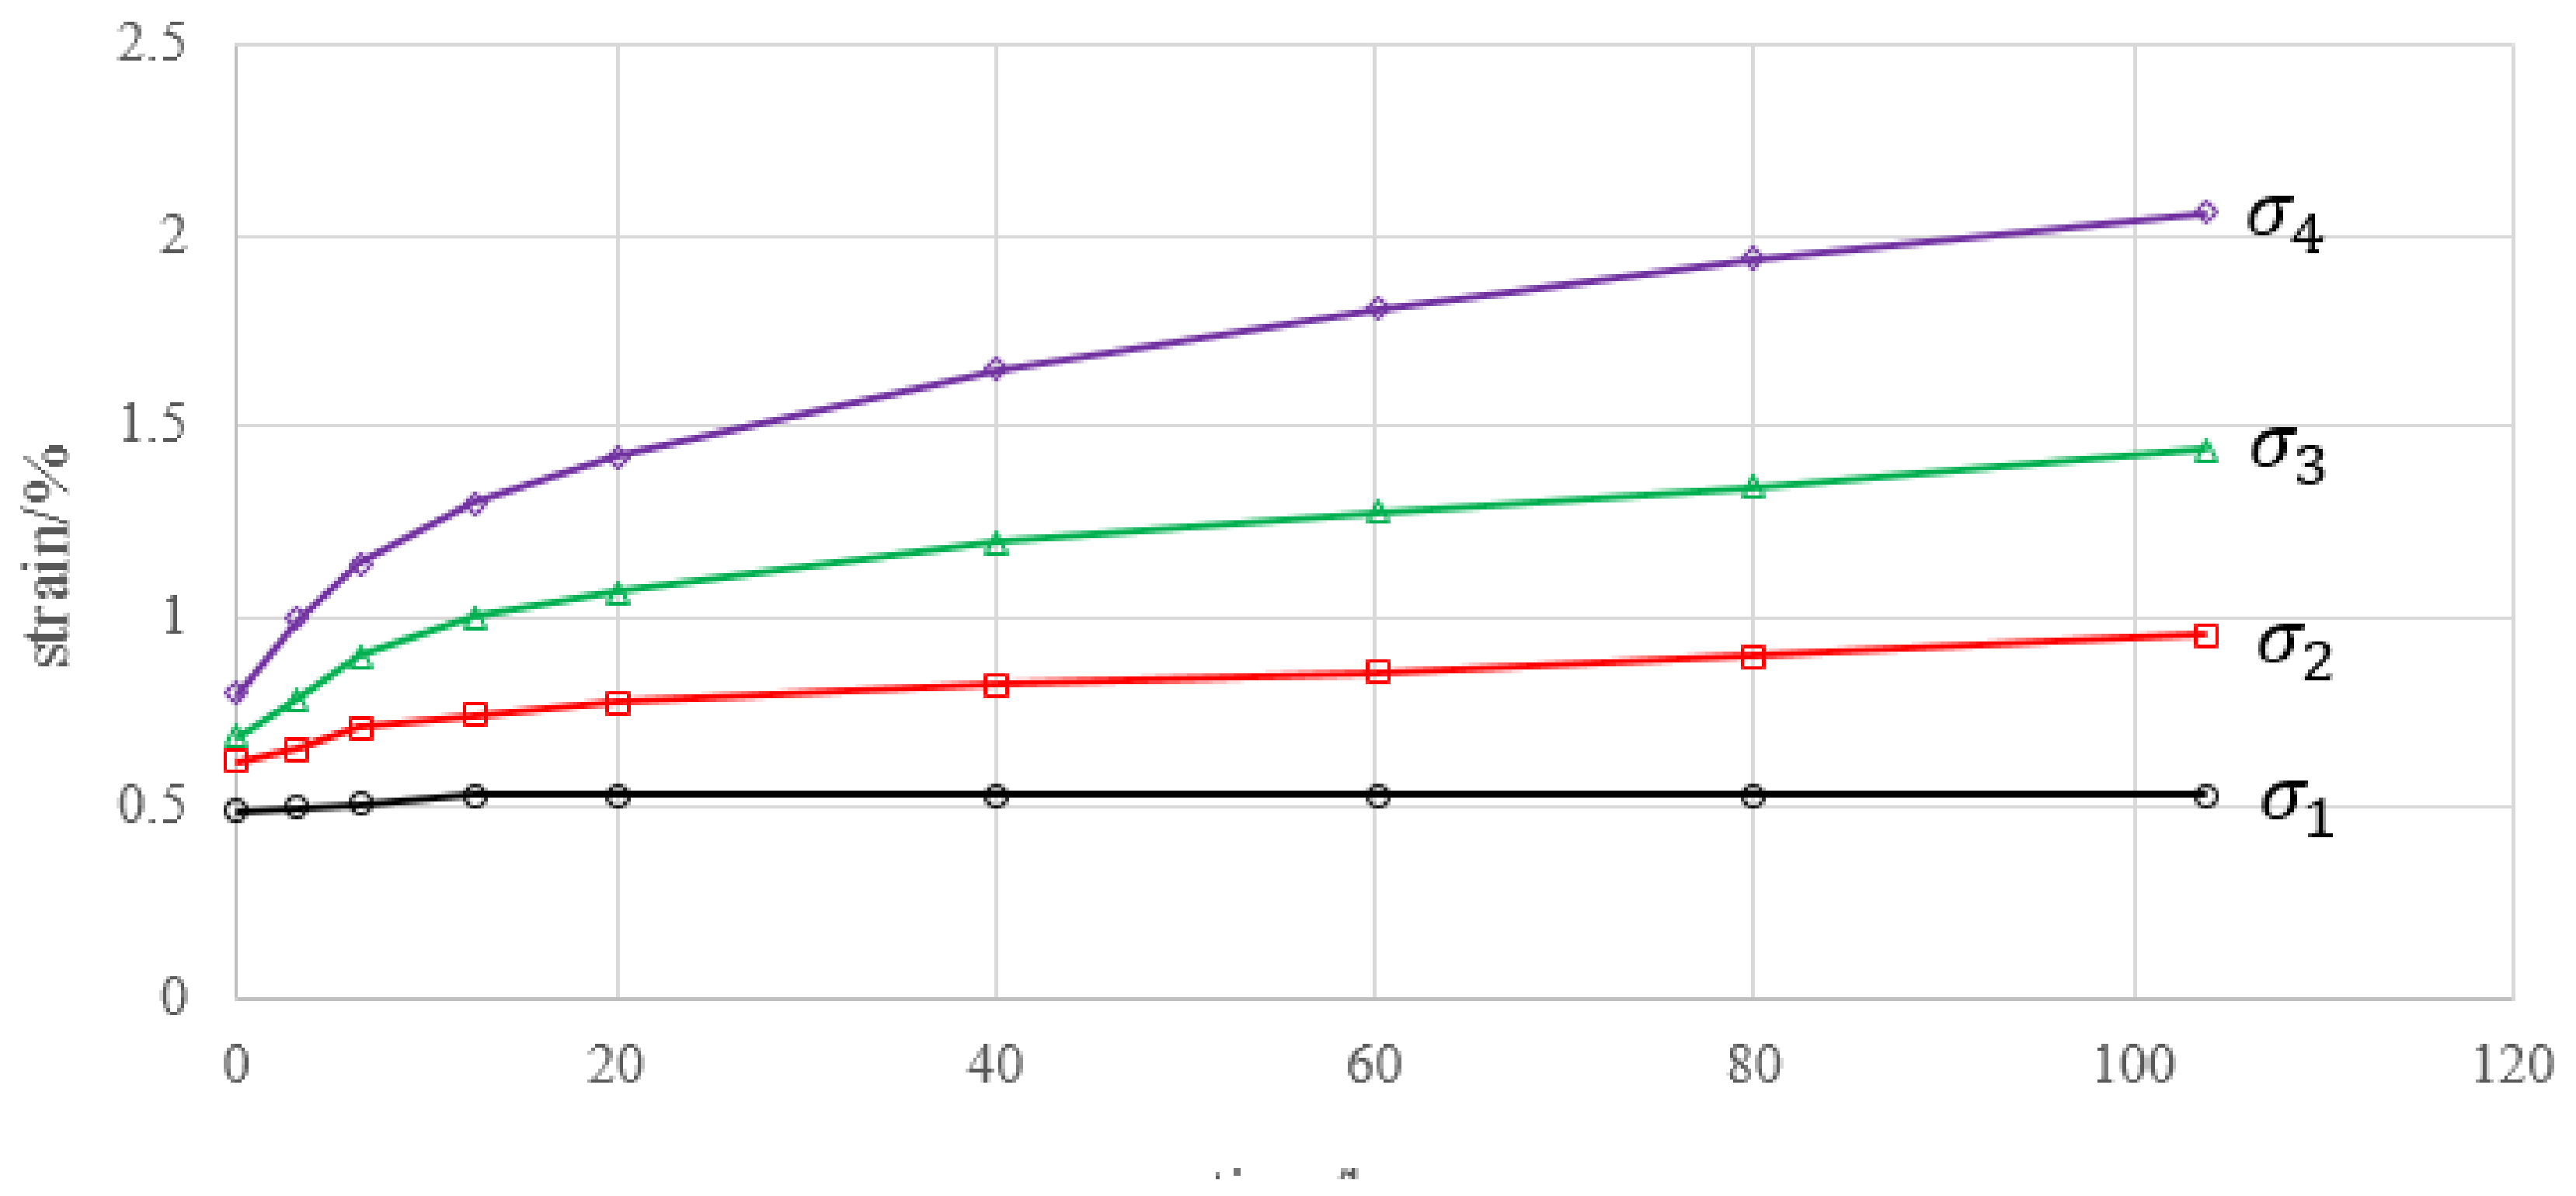
Figure 17.
Comparison of the Nishihara model and experimental curves under single-step loading. (a) Anhydrite rock salt; (b) Glauberite rock salt; (c) Argillaceous rock salt.
Figure 17.
Comparison of the Nishihara model and experimental curves under single-step loading. (a) Anhydrite rock salt; (b) Glauberite rock salt; (c) Argillaceous rock salt.
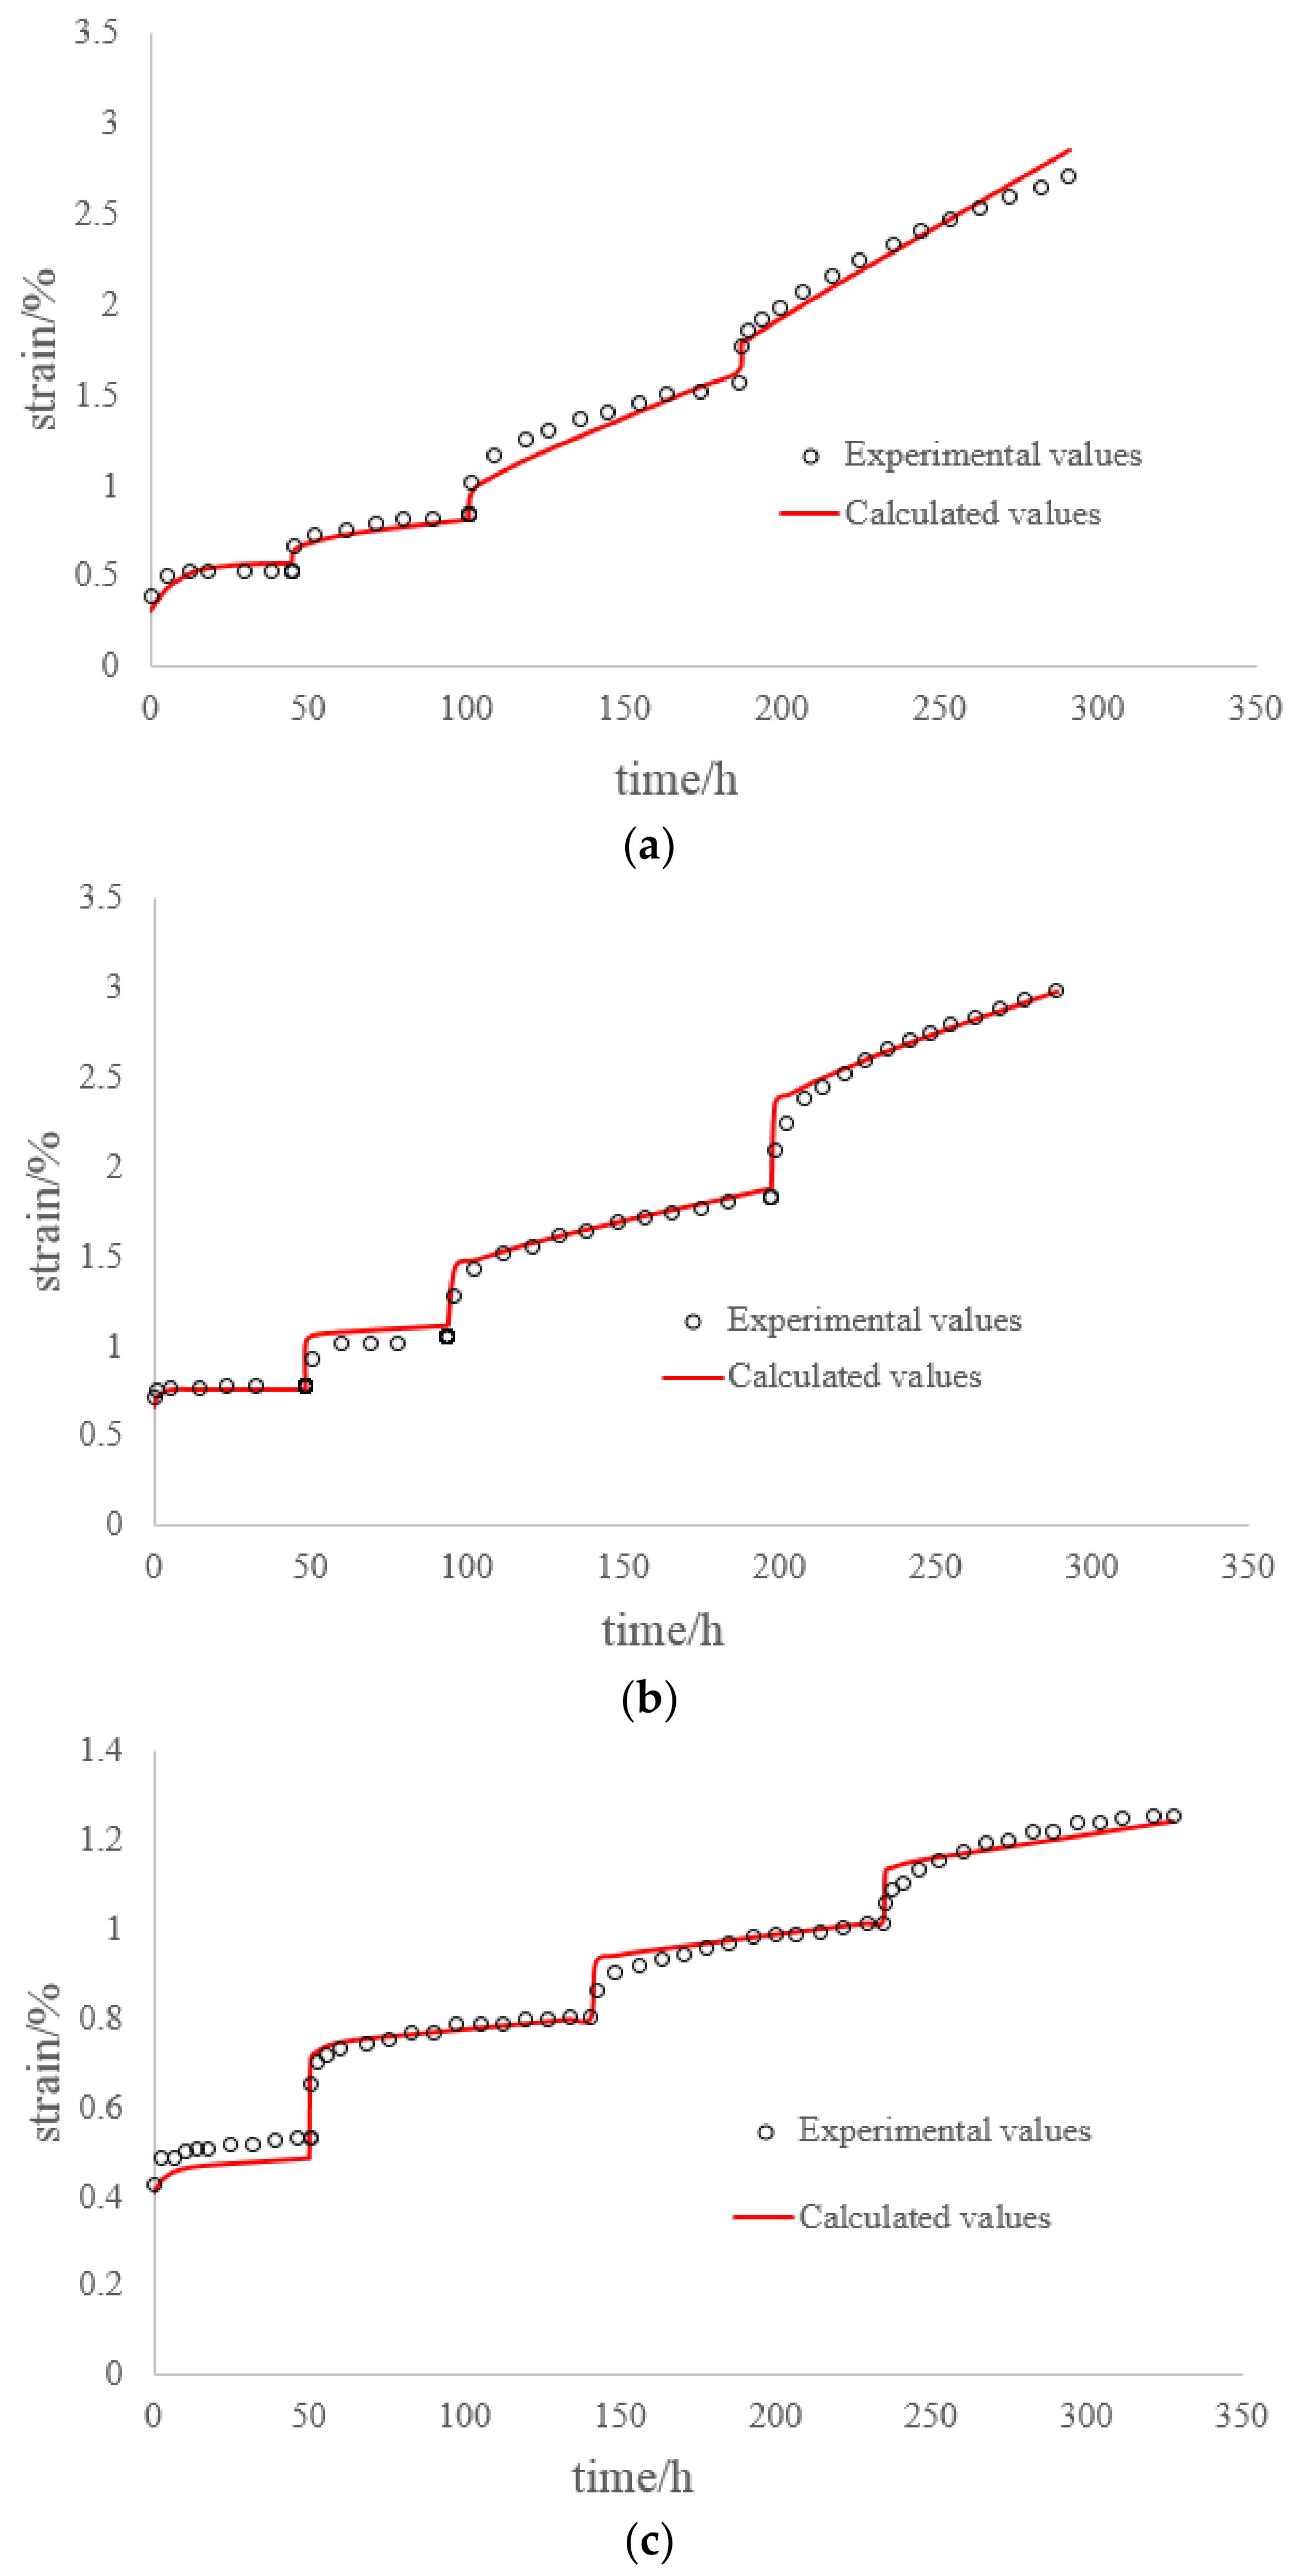
Figure 18.
Comparison of the Nishihara model and experimental curves under multi-step loading. (a) Anhydrite rock salt; (b) Glauberite rock salt; (c) Argillaceous rock salt.
Figure 18.
Comparison of the Nishihara model and experimental curves under multi-step loading. (a) Anhydrite rock salt; (b) Glauberite rock salt; (c) Argillaceous rock salt.

Table 1.
Constitutive equations and creep equations for seven rheological models.
| Rheological Model | Constitutive Equation | Creep Equation |
|---|---|---|
| Maxwell | ||
| Kelvin | ||
| H-K | ||
| H|M | ||
| Burgers | ||
| Bingham | ||
| Nishihara |
Table 2.
Creep properties described by different rheological models.
| Rheological Properties | Creep | Transient Deformation | Relaxation | Elastic After-Effect | Viscous Flow | Deformation Limit |
|---|---|---|---|---|---|---|
| Maxwell | YES | YES | YES | NO | YES | NO |
| Kelvin | YES | NO | NO | YES | NO | YES |
| H-K | YES | YES | YES | YES | NO | YES |
| H|M | YES | YES | YES | YES | NO | YES |
| Burgers | YES | YES | YES | YES | YES | NO |
| Bingham | YES | YES | YES | NO | YES | NO |
| Nishihara | YES | YES | YES | YES | YES | NO |
Table 3.
Parameters of the H-K model.
| σ0 (MPa) | E1 (MPa) | E2 (MPa) | η1 (MPa·d) | η2 (MPa·d) | |
|---|---|---|---|---|---|
| σ1 | 10.0 | 10.0 | 20.0 | 20.0 | - |
| σ2 | 15.0 | 10.0 | 20.0 | 20.0 | - |
Table 4.
Parameters of the Burgers model.
| σ0 (MPa) | E1 (MPa) | E2 (MPa) | η1 (MPa·d) | η2 (MPa·d) | |
|---|---|---|---|---|---|
| σ1 | 10.0 | 10.0 | 20.0 | 20.0 | 200.0 |
| σ2 | 30.0 | 10.0 | 20.0 | 20.0 | 200.0 |
Table 5.
Parameters of Nishihara model.
| σ0 (MPa) | E1 (MPa) | E2 (MPa) | η1 (MPa·d) | η2 (MPa·d) | σs (MPa) | |
|---|---|---|---|---|---|---|
| σ1 | 10.0 | 10.0 | 10.0 | 20.0 | 50.0 | 15.0 |
| σ2 | 30.0 | 10.0 | 10.0 | 20.0 | 50.0 | 15.0 |
| σ3 | 60.0 | 10.0 | 10.0 | 20.0 | 50.0 | 15.0 |
Table 6.
Creep parameters of rocks.
| Rock Type | G0 (GPa) | G1 (GPa) | η1 (GPa·h) | η2 (GPa·h) | K (GPa) | τs (MPa) |
|---|---|---|---|---|---|---|
| Anhydrite rock salt | 3.5 | 3.0 | 25.5 | 52.1 | 7.6 | 27.0 |
| Glauberite rock salt | 0.94 | 4.2 | 5.6 | 76.3 | 2.0 | 15.1 |
| Argillaceous rock salt | 2.1 | 10.9 | 42.6 | 1003.5 | 4.6 | 4.1 |
© 2018 by the authors. Licensee MDPI, Basel, Switzerland. This article is an open access article distributed under the terms and conditions of the Creative Commons Attribution (CC BY) license (http://creativecommons.org/licenses/by/4.0/).
Share and Cite
MDPI and ACS Style
Yang, W.; Gamage, R.P.; Huang, C.; Luo, G.; Guo, J.; Wang, S. Loading History Effect on Creep Deformation of Rock. Energies 2018, 11, 1462. https://doi.org/10.3390/en11061462
AMA Style
Yang W, Gamage RP, Huang C, Luo G, Guo J, Wang S. Loading History Effect on Creep Deformation of Rock. Energies. 2018; 11(6):1462. https://doi.org/10.3390/en11061462
Chicago/Turabian StyleYang, Wendong, Ranjith Pathegama Gamage, Chenchen Huang, Guangyu Luo, Jingjing Guo, and Shugang Wang. 2018. "Loading History Effect on Creep Deformation of Rock" Energies 11, no. 6: 1462. https://doi.org/10.3390/en11061462
Note that from the first issue of 2016, this journal uses article numbers instead of page numbers. See further details here.