1. Introduction
A promising technology for the conversion of hydrogen and carbon dioxide to methane for the purpose of energy storage and biogas upgrading is biological hydrogen methanation (BHM) by using methanogenic archaea [
1].
Independent of the reactor concept used, BHM offers the advantage of being very tolerant of impurities in the product gas [
2]. Additionally, BHM is very flexible in terms of load changes [
3] and can be switched from stand-still to full load within hours, although it is based on a biological conversion by living organisms. BHM is also characterized by its high conversion efficiency [
1].
However, biological reactor concepts are not very high performing [
3]. The gas hourly space velocity (GHSV), which refers to the gases entering a reactor, can be used as a performance parameter [
4]. In catalytic concepts, it is up to 5000 h
−1 [
3]. Only maximum values of 300 h
−1 are given for the BHM [
5], which are very optimistic and have not yet been reached. More realistic values are significantly less than 100 h
−1 [
3].
Due to their advantageous design, trickle bed reactors (TBR) are increasingly gaining attention today and recent studies intend to improve reactor performance [
4,
6,
7,
8]. TBRs have the advantage of very high phase contact surfaces, which increases the gas-liquid mass transfer and thus the productivity of the entire system [
7].
To further improve the gas-liquid mass transfer and thus the performance, test series in TBRs with different pressures have already been investigated [
4]. In this case, the output could be increased significantly by more than 30%. However, the technical effort required to operate the process at high pressures is comparatively high and the question arises as to whether the effort is economically justified [
4].
BHM is a process involving biological metabolism, which means that performance can be enhanced through the process temperature. Methanogens span a huge temperature range [
9,
10]. A distinction is made between mesophilic (30–40 °C) and thermophilic (50–60 °C) temperature ranges [
11]. In anaerobic digestion, the growth rate of methanogenic archaea is higher at thermophilic temperatures, thus making the process faster and enabling higher organic loading rates [
12]. Therefore, in [
13] optimal conditions for anaerobic digestion at thermophilic temperatures could be determined. Many studies confirm the increasing efficiency and degradation rate of the process with rising temperatures [
14,
15,
16].
Recent studies on the BHM also indicate, that temperature has a substantial impact on the reaction velocity and the response time, which allows higher loading rates to be achieved [
17]. It is reported that the operation of a BHM system is significantly more efficient at 65 °C than at 55 °C [
18]. Reference [
19] are slightly more specific and describe an increase in the conversion of H
2 and CO
2 by 60%, with an increase in the process temperature from mesophilic (37 °C) to thermophilic (55 °C). In [
20], there is even a quadrupling of the conversion speed reported.
Higher performance at higher temperatures may be due to increased growth rates. Thermophilic methanogens have a growth rate that is 2 to 3 times higher than mesophilic methanogens [
11,
21,
22]. Beside these biological aspects, the increased metabolic activity has an accelerating impact on the physical mass transfer from the gaseous phase into the liquid biofilm. High metabolic processes keep the concentration of the diluted source gases low, thus resulting in larger concentration differences between the gas and the liquid phase which enhances the mass transfer rate and methane production [
23]. Although the solubility of gas decreases with rising temperatures, it is compensated by the increased growth rate and improved mass transfer [
17].
There are investigations of BHM at mesophilic and thermophilic temperatures, but the temperatures have not been varied within one study, especially with regard to different types of reactors.
Continuous stirred tank reactors (CSTR) are a main design for BHM. The investigations do not consider the influence of different temperatures. The investigated temperatures range from 37 °C [
24,
25] to 65 °C [
1,
5,
26,
27] without being varied within one examination. The use of different enriched cultures makes it more difficult to estimate the influence of temperature on the performance parameters. The majority of TBRs, another main design, operate at a temperature of 37 °C [
7,
8,
28]. The methane formation rate (MFR), a major reactor performance parameter representing the specific methane yield as a function of time [
4], reaches a maximum of 2.5 m
3 m
−3 d
−1 at this temperature level. In contrast, another study investigating TBRs achieved a MFR of 15.4 m
3 m
−3 d
−1 at a thermophilic temperature of 55 °C [
6]. The influence of the process temperature on important performance parameters, such as the MFR, is not sufficiently detailed in these studies.
A direct influence of the temperature on the conversion efficiency and MFR cannot be deduced from previous investigations of BHM, since temperature has not been studied in this context; especially if innovative TBR systems are used. However, studies have shown that the reaction speed of biological systems can be increased with rising temperatures, and thus should be considered in more detail. This would therefore represent a promising possibility to significantly increase the performance of BHM. In order to specify this more precisely, the aim of the study was the investigation of different temperatures on performance parameters such as GHSV, MFR, conversion and product gas quality of the BHM under consistent conditions using TBRs. A high practical demand of this investigation was to ensure a product gas with a high methane content. For this purpose, a continuously operated and automated test facility was developed and built up at the University of Hohenheim.
2. Methods
2.1. Experimental Setup
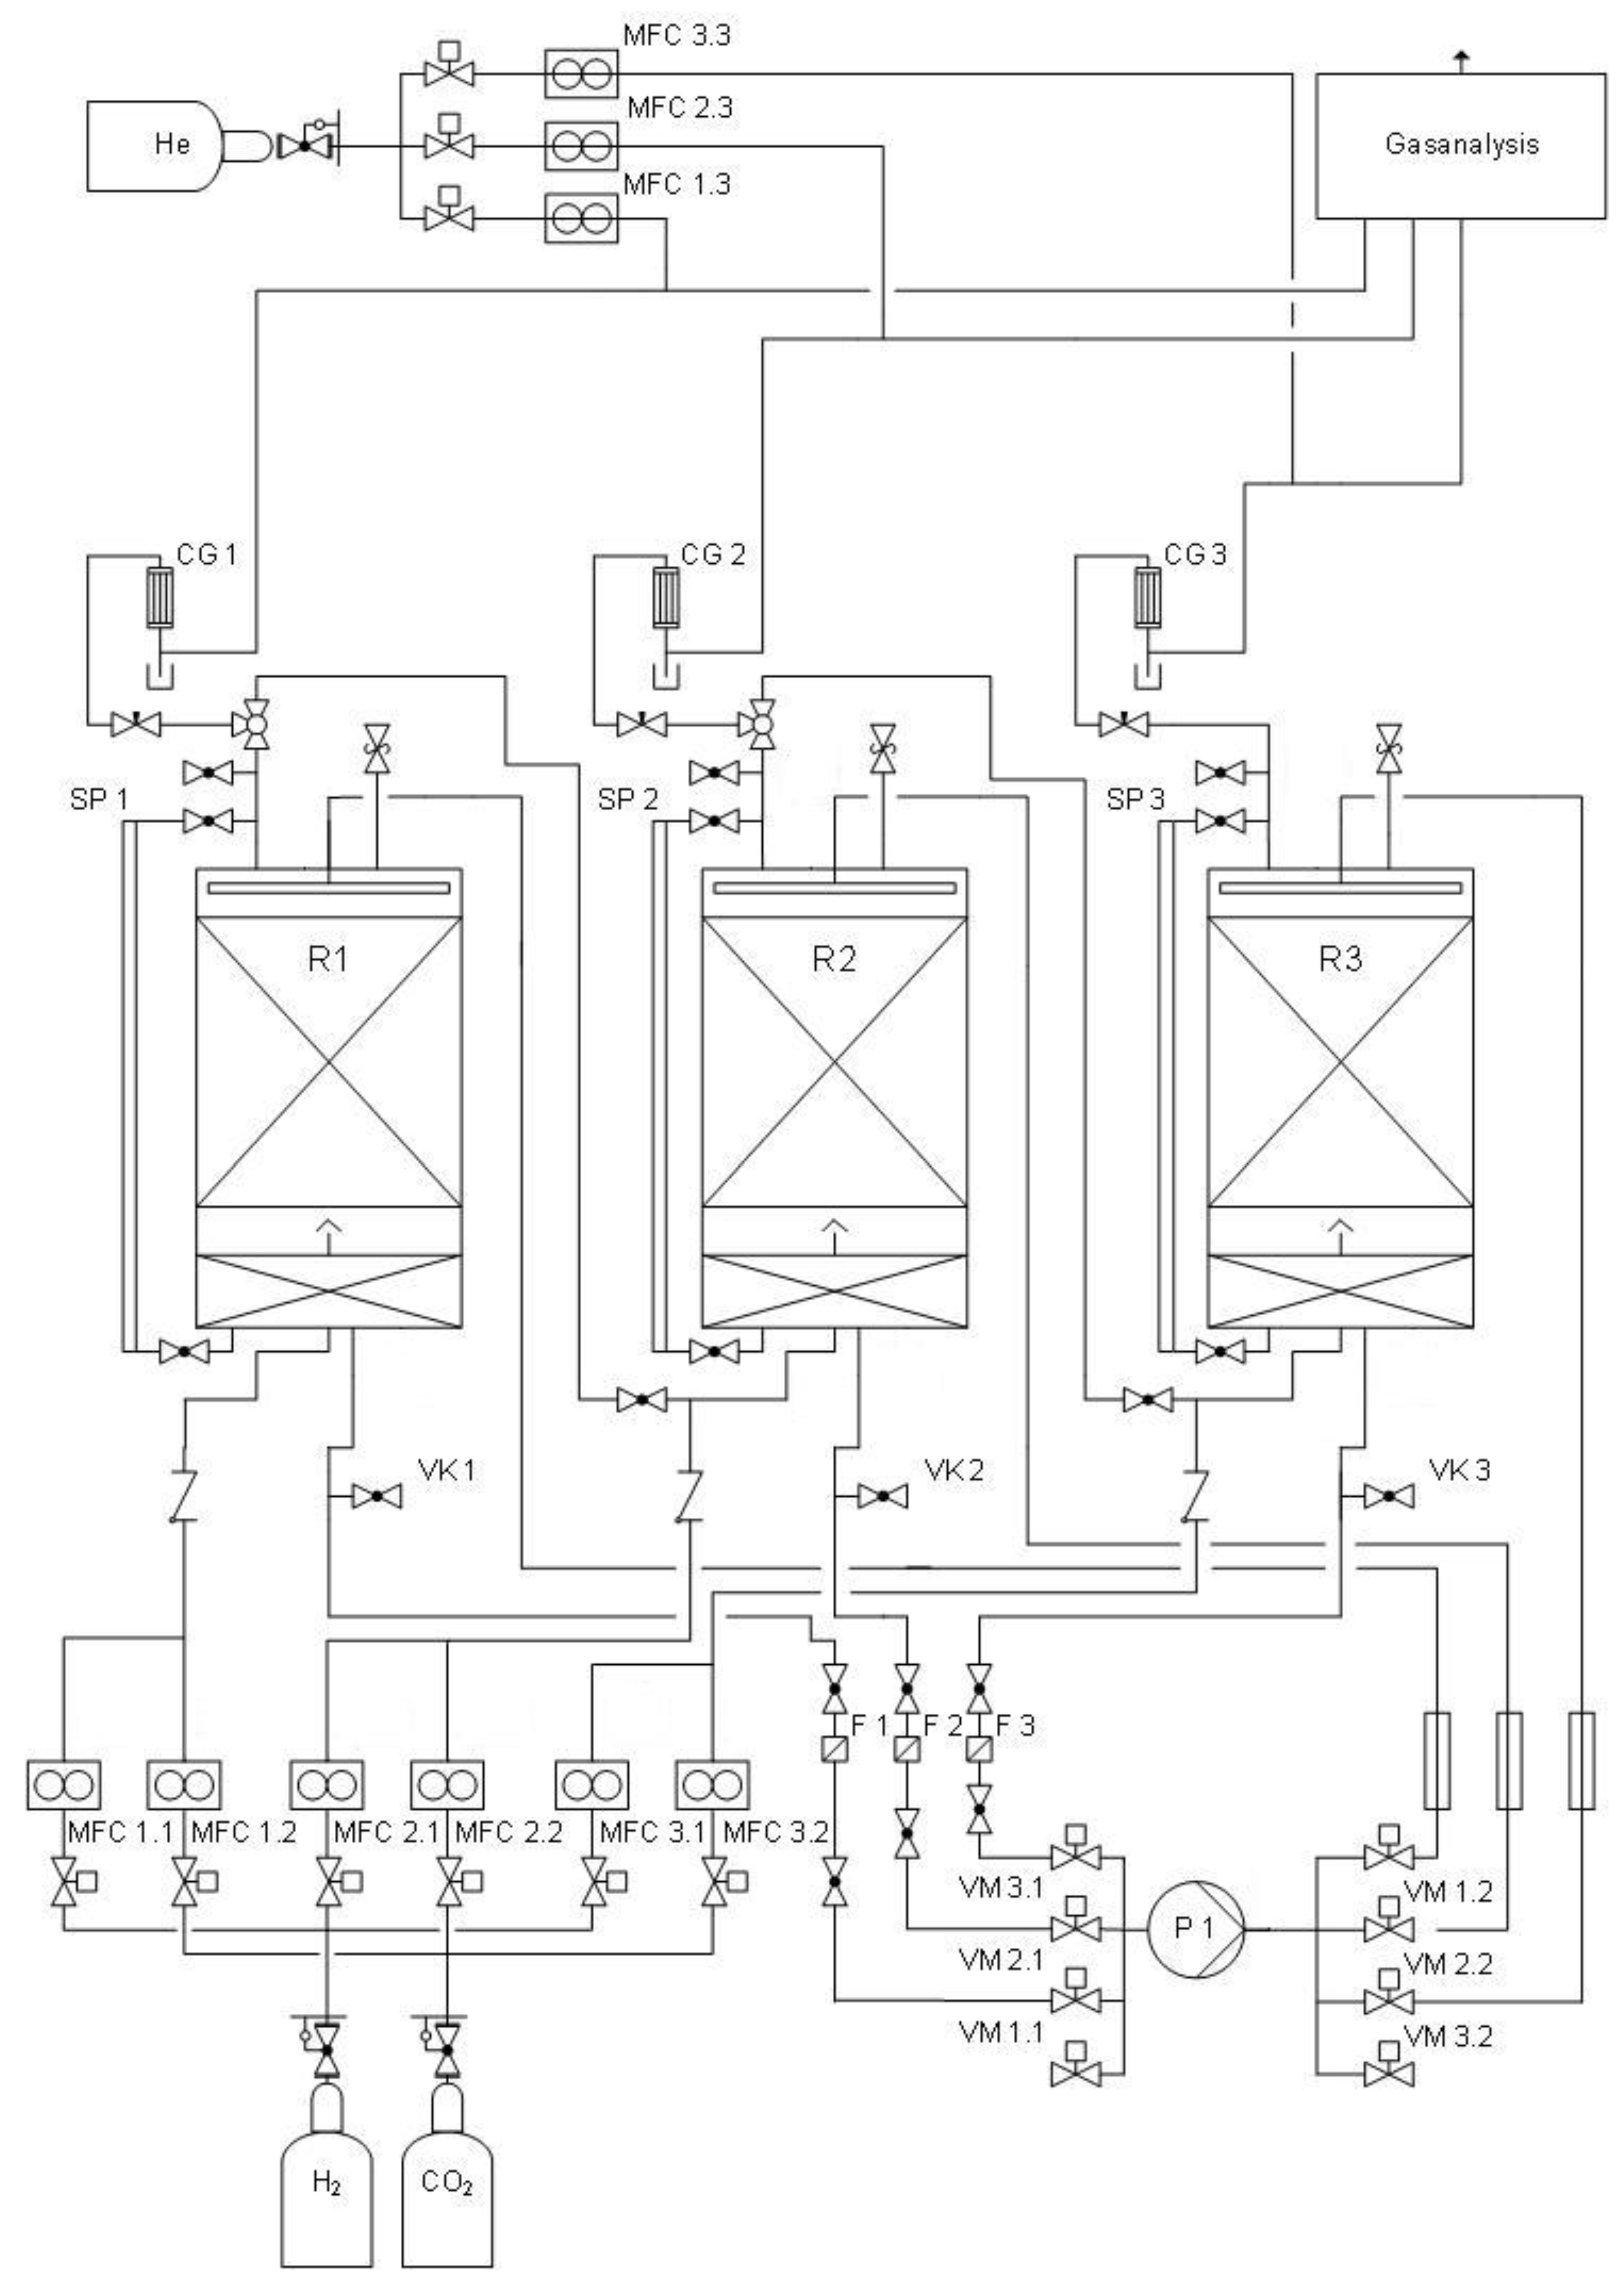
The experimental plant was realized with three identical TBRs. The structure of the plant is shown as a piping and instrumentation diagram in
Figure 1.
The reaction space of each reactor was equipped with a fixed and a trickle bed. The trickle bed in the gas phase had a volume of 13 L. It was filled with the HX09 packing elements from Christian Stöhr GmbH & Co. KG (Marktrodach, Germany), and had a total surface of 11.2 m2. The sump in the liquid phase at the bottom of the reactors were equipped with a 1.5 L fixed bed of the same packing elements, resulting in a total surface of 1.3 m2. This sums up to a total active volume of 14.5 L per reactor and a surface area of 12.5 m2 for immobilization of the microorganisms.
The effluent of an anaerobic filter [
29] was used as the process liquid to provide the necessary nutrients and was sprinkled over the fixed bed in counter current with the gases. This anaerobic filter was part of a two-stage lab-scale biogas system and was run at a pressure of up to 50 bars. When collecting the effluent, this methane reactor was operated at a continuous and stable mode. The liquid used did not contain significant amounts of acids or alcohols, which could affect the conversion of H
2 and CO
2. Due to the extremely low process liquid-based gas production, a correction of the results according to [
4] was not considered necessary.
As the process liquid passed through the trickle bed, it was accumulated in the sump of the fixed bed. With the magnetic valves VM 1.1–VM 3.2, it was possible to switch between various closed circuits, because a central pump (P 1) was used for circulation of the process liquid in all three reactors. The liquid filters (F 1, F 2, F 3) were used to protect the central gear pump P 1 against particles. SP 1, SP 2 and SP 3 were sighting tubes outside the reactor to control the filling level inside the reaction space. Half of the process liquid (1.4 L per reactor) was replaced before starting a new test procedure, because the water produced during the methanation process diluted the process liquid permanently
With mass flow controllers (MFC) MFC 1.1–MFC 3.2, the gases were injected into the reactors.
Using a mechanical pressure control valve at the top of the reactors, the product gases were released from the reaction chamber. For condensate removal, the product gases flowed through the gas coolers CG 1, CG 2 and CG 3.
The pressure sensors used were 261AS from ABB Ltd. (Zürich, Switzerland), and have a measuring range of 0–10 bar absolute with a basic accuracy of 0.1%. They have an operating temperature range from −40 °C to 85 °C and were equipped with a gold-coated membrane to prevent hydrogen corrosion. The temperature was measured between the sump and the trickle bed with the temperature sensor Easytemp TMR31 from Endress + Hauser Messtechnik GmbH + Co. KG (Reinach, Germany). For regular maintenance and calibration, the pH/Redox electrodes Memosens CPS16D of the same manufacturer were installed in the piping outside of the reactors.
2.2. Experimental Procedure
The test facility was in a condition ready for operation including a well-established biofilm of microorganisms [
4]. Therefore, a start-up period or preliminary testing phase was not necessary.
To investigate the influence of temperature on the methanation process, tests were done with this plant with four temperature levels: 40, 45, 50 and 55 °C. These levels were carried out in ascending order to enable the microorganisms to adapt to rising temperatures.
The trickle bed was sprinkled with the process liquid every 12 h for one minute with a circulation quantity of 60 L h
−1. As studies of TBRs have shown, especially from the petrochemical industry [
30,
31,
32,
33], such a trickling strategy has positive effects on the conversion of the source substances. Own tests confirmed an improved conversion of CO
2 and H
2 and sufficient nutrient supply for a stable operation.
The flowrates of the mass flow controllers were adjusted to 5 L h−1 CO2 and 20 L h−1 H2 to achieve a stoichiometric ratio of CO2 to H2 of 1:4. Due to the low inaccuracies of the mass flow controllers, the real quantities of the educt gases were additionally calculated using the results of the gas analysis.
The investigation of the temperature levels was carried out simultaneously in the three reactors for a duration of 148–161 h each at a constant operating pressure of 5 bar absolute. Previous studies and reports have shown that this elevated process pressure has a positive impact on MFR compared to lower pressure levels [
4].
2.3. Analytical
The quality of the product-gases was analysed every 30 min by a 3000 L gas chromatograph from Inficon GmbH, Cologne, Germany.
In order to determine the gas quantity, a specific and constant amount of helium (0.5 L h−1) was added to the product gas of each reactor. With this tracer gas and the analysis of the gas proportions by gas chromatography, the amount of the product gas and the individual components were calculated.
The process liquid was sampled at the beginning and end of each temperature level. It was analysed for the content of volatile fatty acids, the chemical oxygen demand as well as the conductivity and salinity. Volatile fatty acids were analysed with a CP-3800 gas chromatograph from Varian Medical Systems. With the Hach Lange cuvette test (LCK014), the chemical oxygen demand (COD) was measured. The conductivity and salinity were determined by dipping the conductivity tube of an EC300 from VWR International GmbH (Darmstadt, Germany), into the untreated sample.
2.4. Calculations
The MFR and GHSV were calculated to evaluate the performance of the reactors regarding quantitative parameters. The MFR (Equation (1)) describes the methane yield per day independent of the reactor volume.
FV,CH4,out and
FV,CH4,in is the volumetric flow rate in and out of the reactor (Götz et al., 2016).
VR describes the volume of the reaction space of the reactor which amounts to 14.5 L in case of our lab-scale system.
The
GHSV describes the volumetric flow rate (
FV,G,in) at standard temperature and pressure (STP) (1013 mbar, 273 K) of the feed gas without any inert gases as a function of the reaction space of a reactor [
3].
In addition to the methane content in the product gas, the conversion of both feed gases was calculated. It is defined in Equation (3), where
Fn,i,in describes the incoming and
Fn,i,out the outcoming H
2 or CO
2 in L·h
−1.
The retention time (
RT) was calculated as a function of
VR and the volumetric flow of the incoming gases
FV,G,in. The volume reduction during the conversion of CO
2 and H
2 to CH
4 was not taken into account for this calculation.
The statistical software ‘‘R Studio” (V0.99.903, RStudio, Inc., Boston, MA, USA) was used for all calculations, as well as for the statistical analysis with the Kruskal Wallis Test and subsequently Tukey’s Test with a
p-value of
p < 0.05 [
34,
35]. The
p-value indicates the probability of error and was chosen with <5%, since it is a level of significance common in statistics.
3. Results and Discussion
3.1. Operating Parameters
In the experiments, four temperature levels between 40 and 55 °C were investigated, which were adjusted in parallel in all three reactors. The respective results were summarized as an arithmetic average. As shown in
Table 1, the different temperature levels could be set with high stability and accuracy. The largest deviation was observed at 40.41 ± 0.12 °C with a target value of 40 °C.
The operating pressure was set at 5 bar for all temperature levels. Due to the improved solubility of the CO
2 at rising pressures, this comparatively low pressure should prevent low pH values. The pH values finally reached a range of 7.44 ± 0.09 at 40 °C to 7.57 ± 0.08 at 50 °C and was thus in a optimal range for methanogenesis [
36]. Although the process fluid is continuously diluted by the formed water during methanation reaction within the different experimental phases, no significant drop in pH was observed. These small fluctuations indicate a high buffering capacity of the process liquid used.
The amount of hydrogen introduced ranged from 20.83 L h−1 at temperature level 50 to 22.01 L h−1 at temperature level 45, so slightly more hydrogen was introduced into the reactors as set. However, since too much CO2 was also introduced, an almost stoichiometric ratio of CO2:H2 in the range 1:3.94 to 1:3.97 was achieved. Due to small fluctuations in the flow rates and constant pressures, the retention times of 2.75 to 2.89 h were also constant to guarantee consistent reaction conditions.
3.2. Analysis of the Process Liquid
The tests were sampled at the beginning and end of each temperature level. With regard to the analysis of the acids, acetic acid enrichment of 0.11 ± 0.02 g kg−1 was observed at the end of temperature level 45. Furthermore, a propionic acid concentration of 0.06 ± 0.01 g kg−1 was measured at the end of temperature level 55. In the remaining experiments, no acid concentrations were observed in the process liquid. Due to stable methane formation rates across all experiments, no negative influence of this low acid formation is assumed. With regard to further investigations with this methanation concept, attention should be paid to the aspect of acid production, respectively acid accumulation.
The salinity of the process liquid was measured in particular to monitor its dilution. Some experiments observed a decrease in salinity as is the case when the process liquid becomes more diluted. At temperature level 55, the salinity decreased from 2.43 ± 0.06 ppt to 2.17 ± 0.06 ppt, which was the largest difference during the experiments. Furthermore, a maximum of 2.63 ± 0.05 ppt and a minimum of 2.17 ± 0.06 ppt were achieved, which is in the optimum range for methanogenic microorganisms [
37].
The COD can also be considered stable. It ranged between 2568 ± 427 g L−1 O2−1 at temperature level 40 and 3745 ± 140 g L−1 O2−1 at temperature level 45. In contrast to salinity, there was no sign of a decline in the COD due to increasing dilution.
Overall, the analyses of the process liquid indicate a stable biological process over the duration of the experiments.
3.3. Performance Parameters
Rising temperatures increase the reaction speed and the growth rate and thus the performance of biological systems [
11,
17,
21,
22]. This was confirmed by the conversion rates of the experiments, which increased with increasing temperature. In the case of hydrogen, the conversion rate could be continuously increased from 97.68 ± 0.01% at 40 °C to 99.24 ± 0.00% at 55 °C. Since CO
2 was introduced into the reactors slightly over stoichiometrically, its conversion rates were at a lower level, but could also be increased significantly from 96.42 ± 0.00% to 98.10 ± 0.01%.
In regard to BHM in the TBR, the literature describes an ideal ratio of CO
2 to H
2 of 1:3.76, in which a complete conversion of the gases should be possible [
7]. In the experiments carried out, the ratio was 1:3.94 to 1:3.97. Nevertheless, the conversion rates still suggest a CO
2 proportion that was slightly too high, which means that the published optimum ratio cannot be confirmed in these experiments. A complete conversion seems more likely with a stoichiometric ratio.
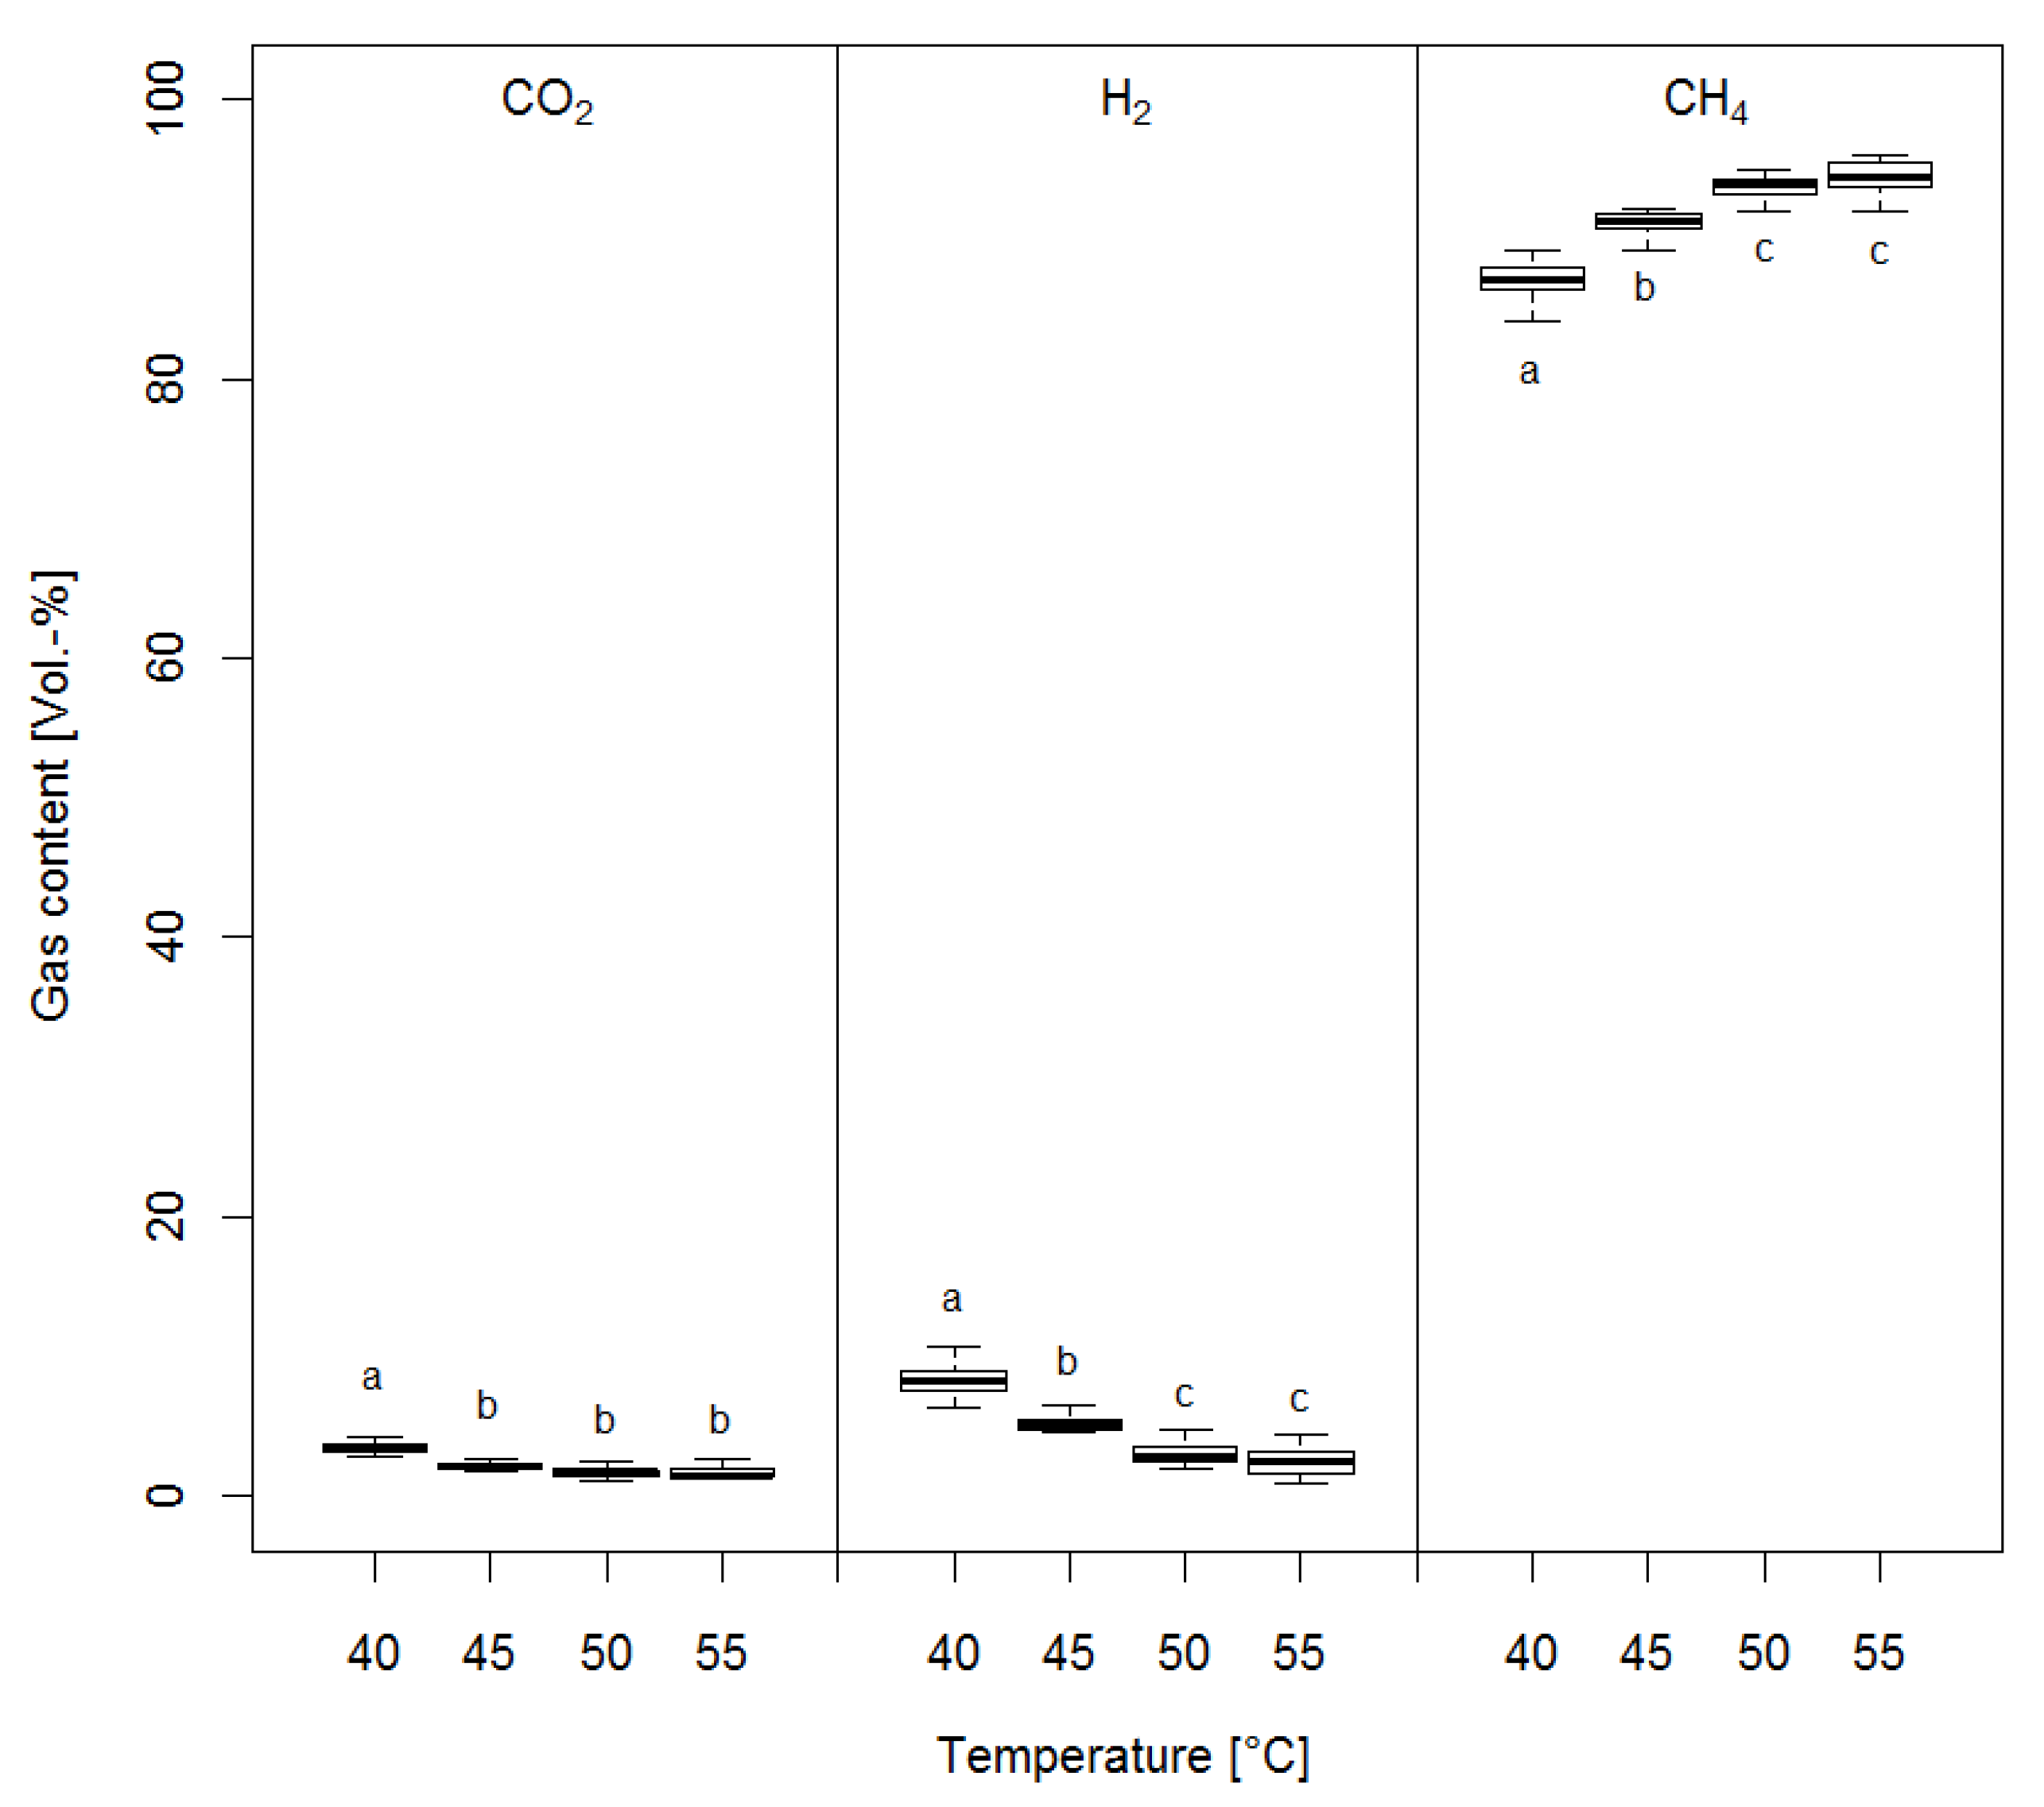
With increasing conversion rates of H2 and CO2, the quality of the product gas also increased. Thus, the methane content could be increased from 88.29 ± 2.12 vol % at 40 °C to 94.99 ± 0.81 vol % at 55 °C. However, no significant differences could be detected between the temperature levels of 50 and 55 °C.
As the methane content increased, the proportion of CO
2 and H
2 in the product gas was continuously reduced. Therefore, the average H
2 content was reduced from 8.34 ± 1.54 vol % at 40 °C to 3.17 ± 0.79 vol % at 55 °C. Due to the stoichiometric reaction ratio, the proportion of CO
2 was reduced only from 3.26 ± 0.51 vol % to 1.83 ± 0.34 vol % (
Figure 2). This confirms the assumption that a stoichiometric ratio should be targeted for a complete conversion of the educt gases.
The GHSV in these tests ranged from 1.80 ± 0.07 h
−1 to 1.90 ± 0.09 h
−1. Although the values differ between the temperature levels, the differences were not statistically significant. The same was for the MFR, which was achieved in the range 8.46 ± 0.45–8.85 ± 0.45 m
3 m
−3 d
−1. The temperature increase therefore only increased the gas quality. Differences in the amount of gas produced could not be determined and can be traced back to slightly different amounts of injected gas between the experiments. Another reason for this could be the reduction in the volume by a factor of 5 during the biological methanation process, which was also observed and described in [
4].
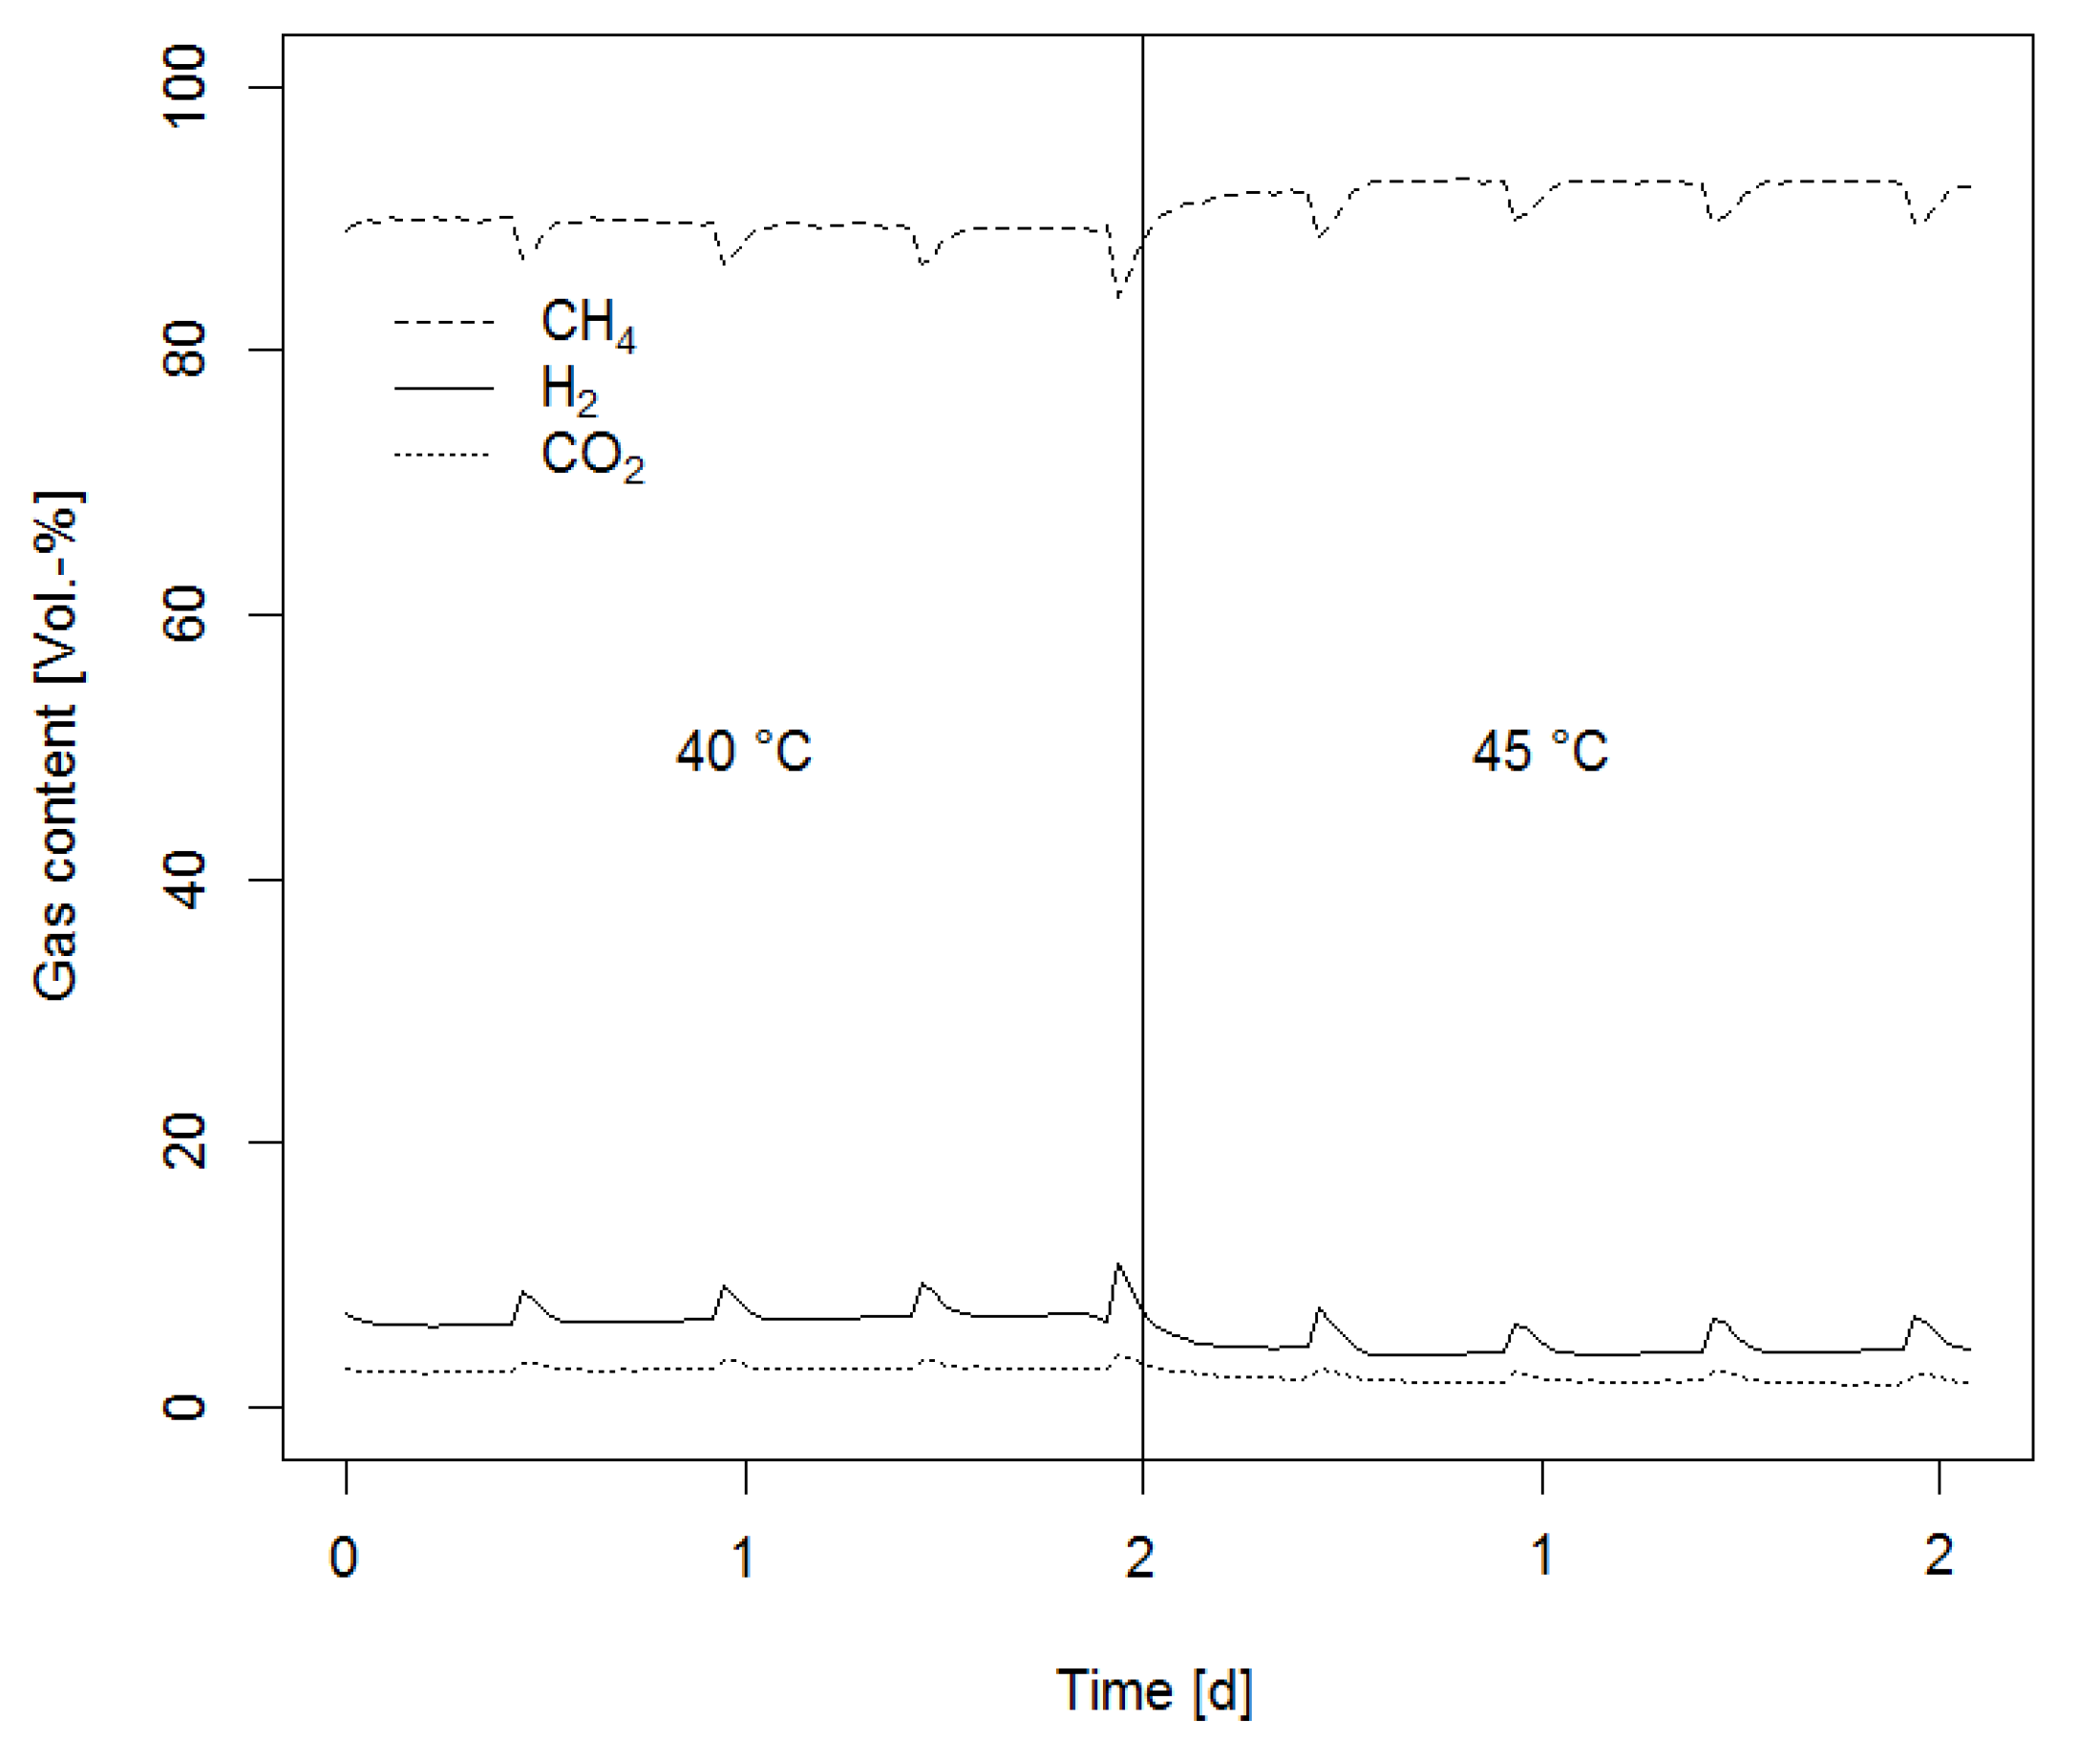
In addition to increasing conversions with rising temperatures, the tests also showed that the adaptation of microorganisms to higher temperatures occurred very quickly.
Figure 3 shows a section of the experiments, incorporating the transition from 40 to 45 °C. It is apparent that the proportion of CH
4 increased immediately after the temperature rose and the conversion of CO
2 and H
2 was improved. The adaptation of microorganisms to changing temperatures is carried out directly in this reactor concept and demonstrates high flexibility and stability of the process. Also, the direct influence of the process liquid sprinkling on the product gas quality is shown. The CH
4 content decreased and the H
2 and CO
2 content rose immediately after each circulation. After about 2 h, the gas qualities returned to the previous level.
The experiments confirm further studies on TBR that high methane contents can be achieved with this reactor concept [
4,
6,
7,
8]. For long-term tests, [
7] achieved an almost complete conversion of CO
2 and H
2 with a methane content of 98 vol % with an MFR of 1.49 m
3 m
−3 d
−1; with a slightly higher MFR of 1.9 m
3 m
−3 d
−1, a methane content of 96 vol % was achieved [
8]. The best results by far were achieved with an MFR of 15.4 m
3 m
−3 d
−1 and methane contents >98 vol % [
6] which show the high potential of this concept.
The results confirm studies of other biological systems with regard to temperature increases in BHM [
18,
19,
20]. However, the increases were lower than described there. In [
19], an increase in conversion of 60% was observed with a rise in temperature from mesophilic (37 °C) to thermophilic (55 °C) and [
20] reported a quadrupling of the conversion. These dramatic increases seem not to be plausible in the view of the reported results here. There were no increases of this magnitude detected. However, the conversion and methane content were already at a high level of 88.29 ± 2.12 vol %, at the beginning of the experiments. This was because a product gas with a high methane content relevant to practice was to be produced at the end of the experiments. Further increases from this high starting level are more difficult to achieve.
Overall, the experiments showed that the conversion of BHM is significantly improved with rising temperatures and contributes to a further increase of the gas-liquid-mass transfer in TBR.


