Development of Heat Transfer Surface Area Enhancements: A Test Facility for New Heat Exchanger Designs


Abstract
:1. Introduction
2. Test Samples
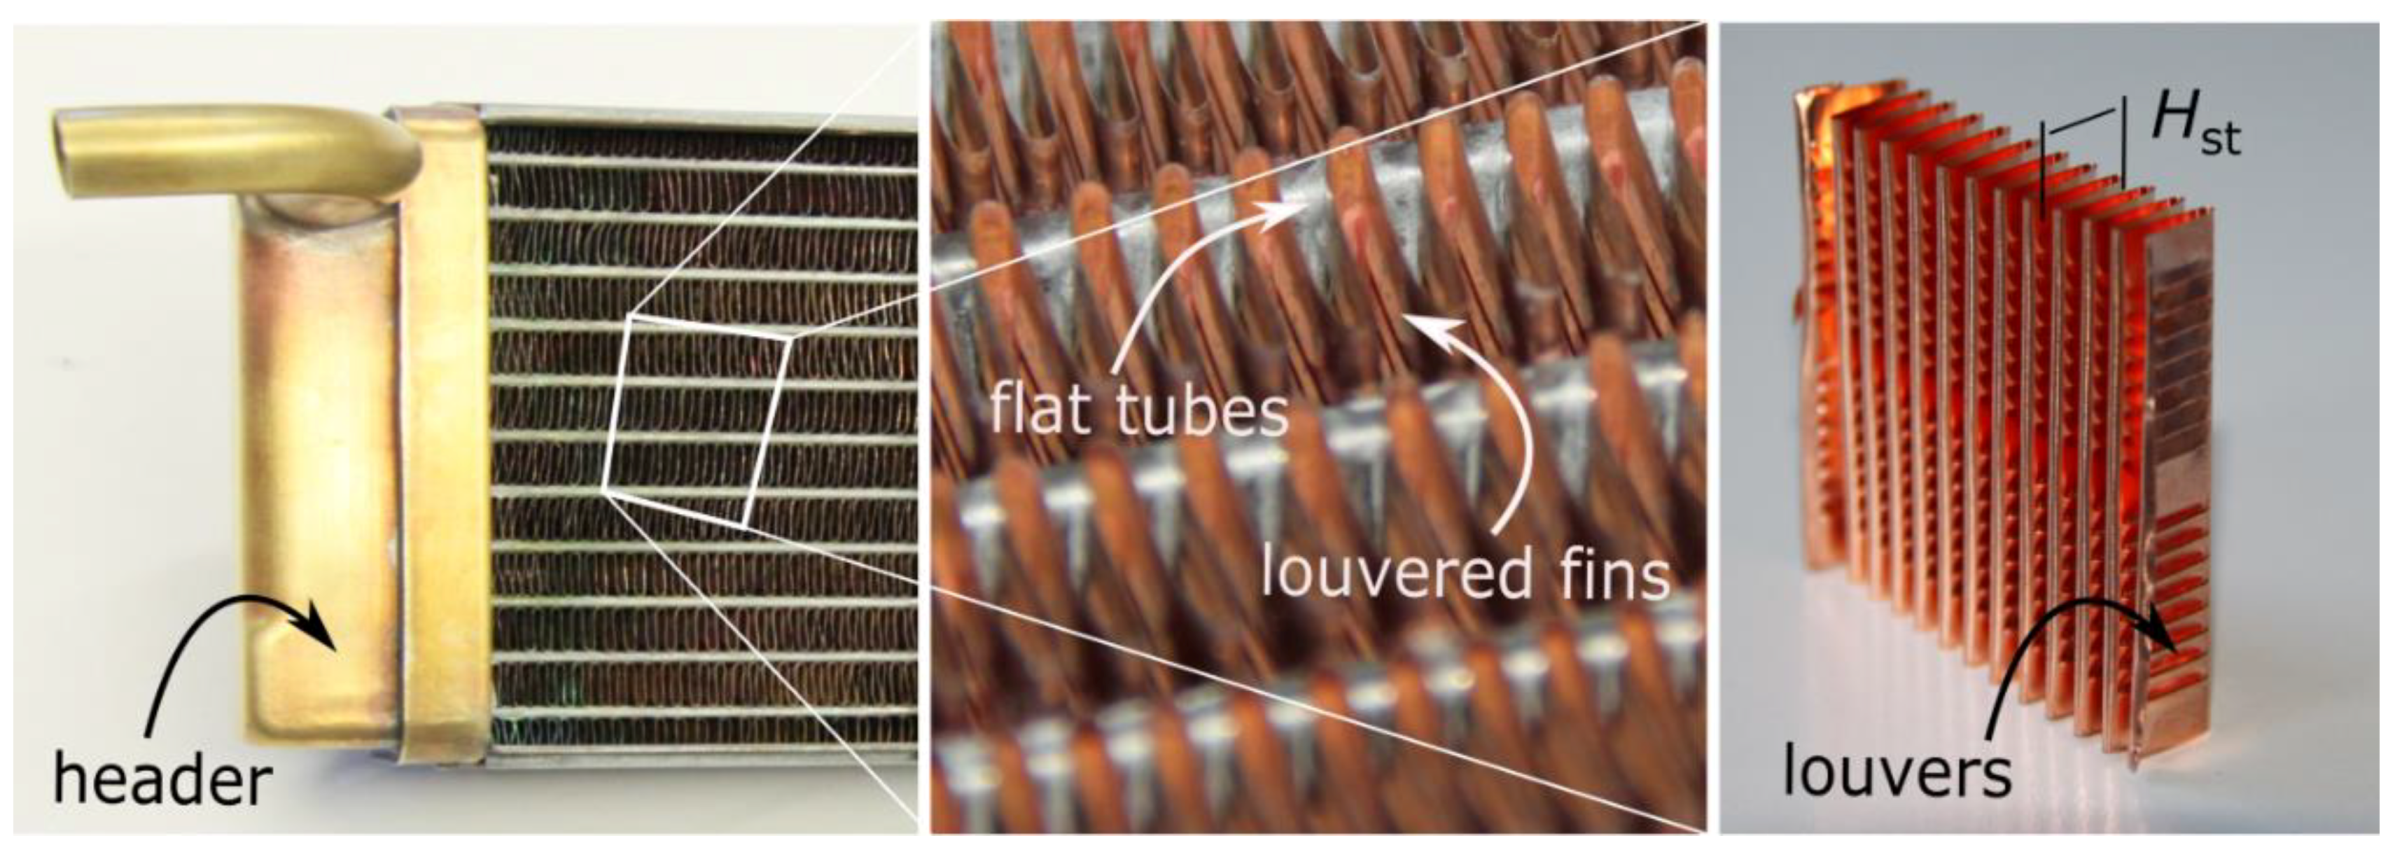
2.1. Louvered Fins
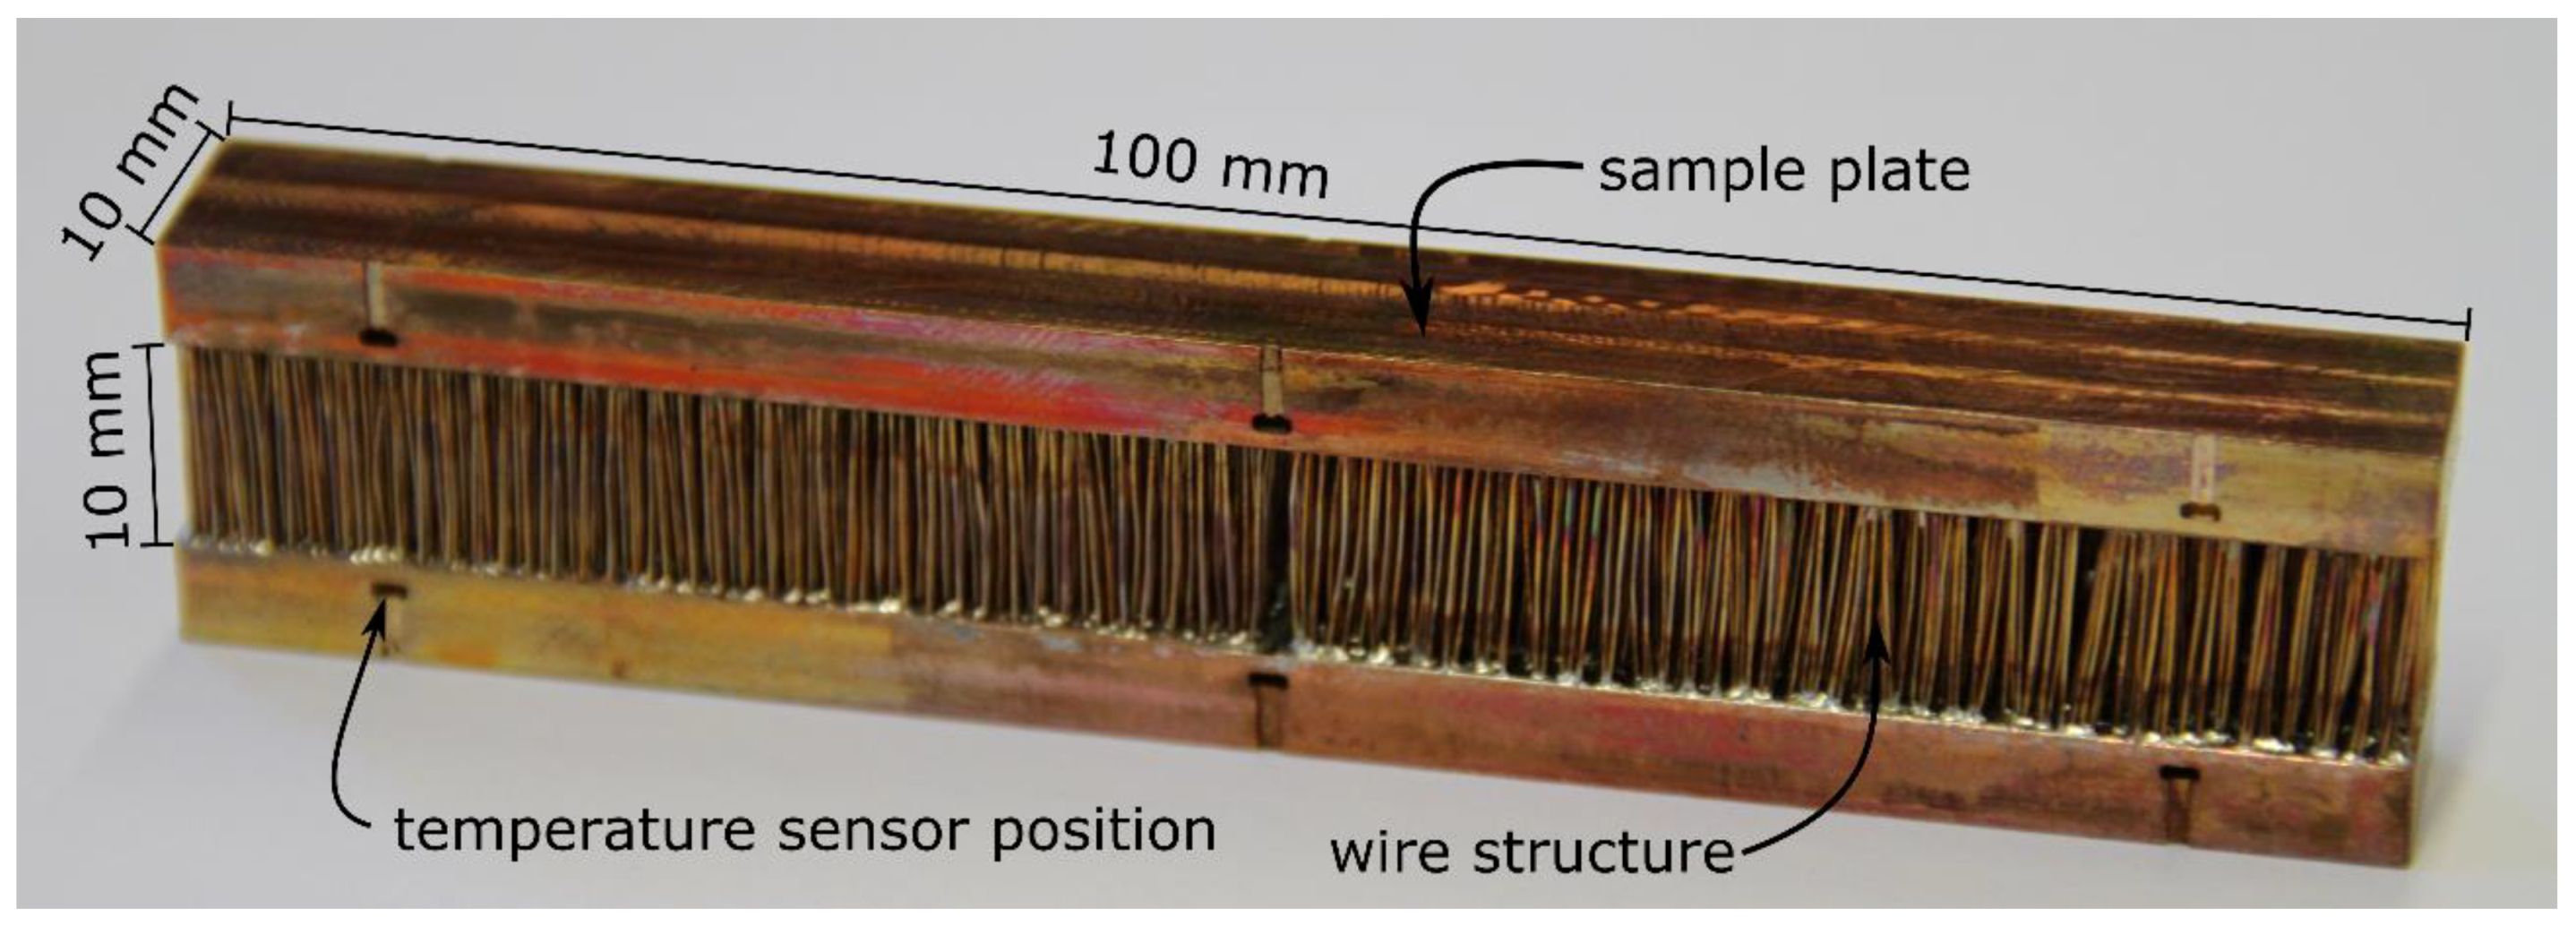
2.2. Micro Pin Fins
3. Experimental Setup
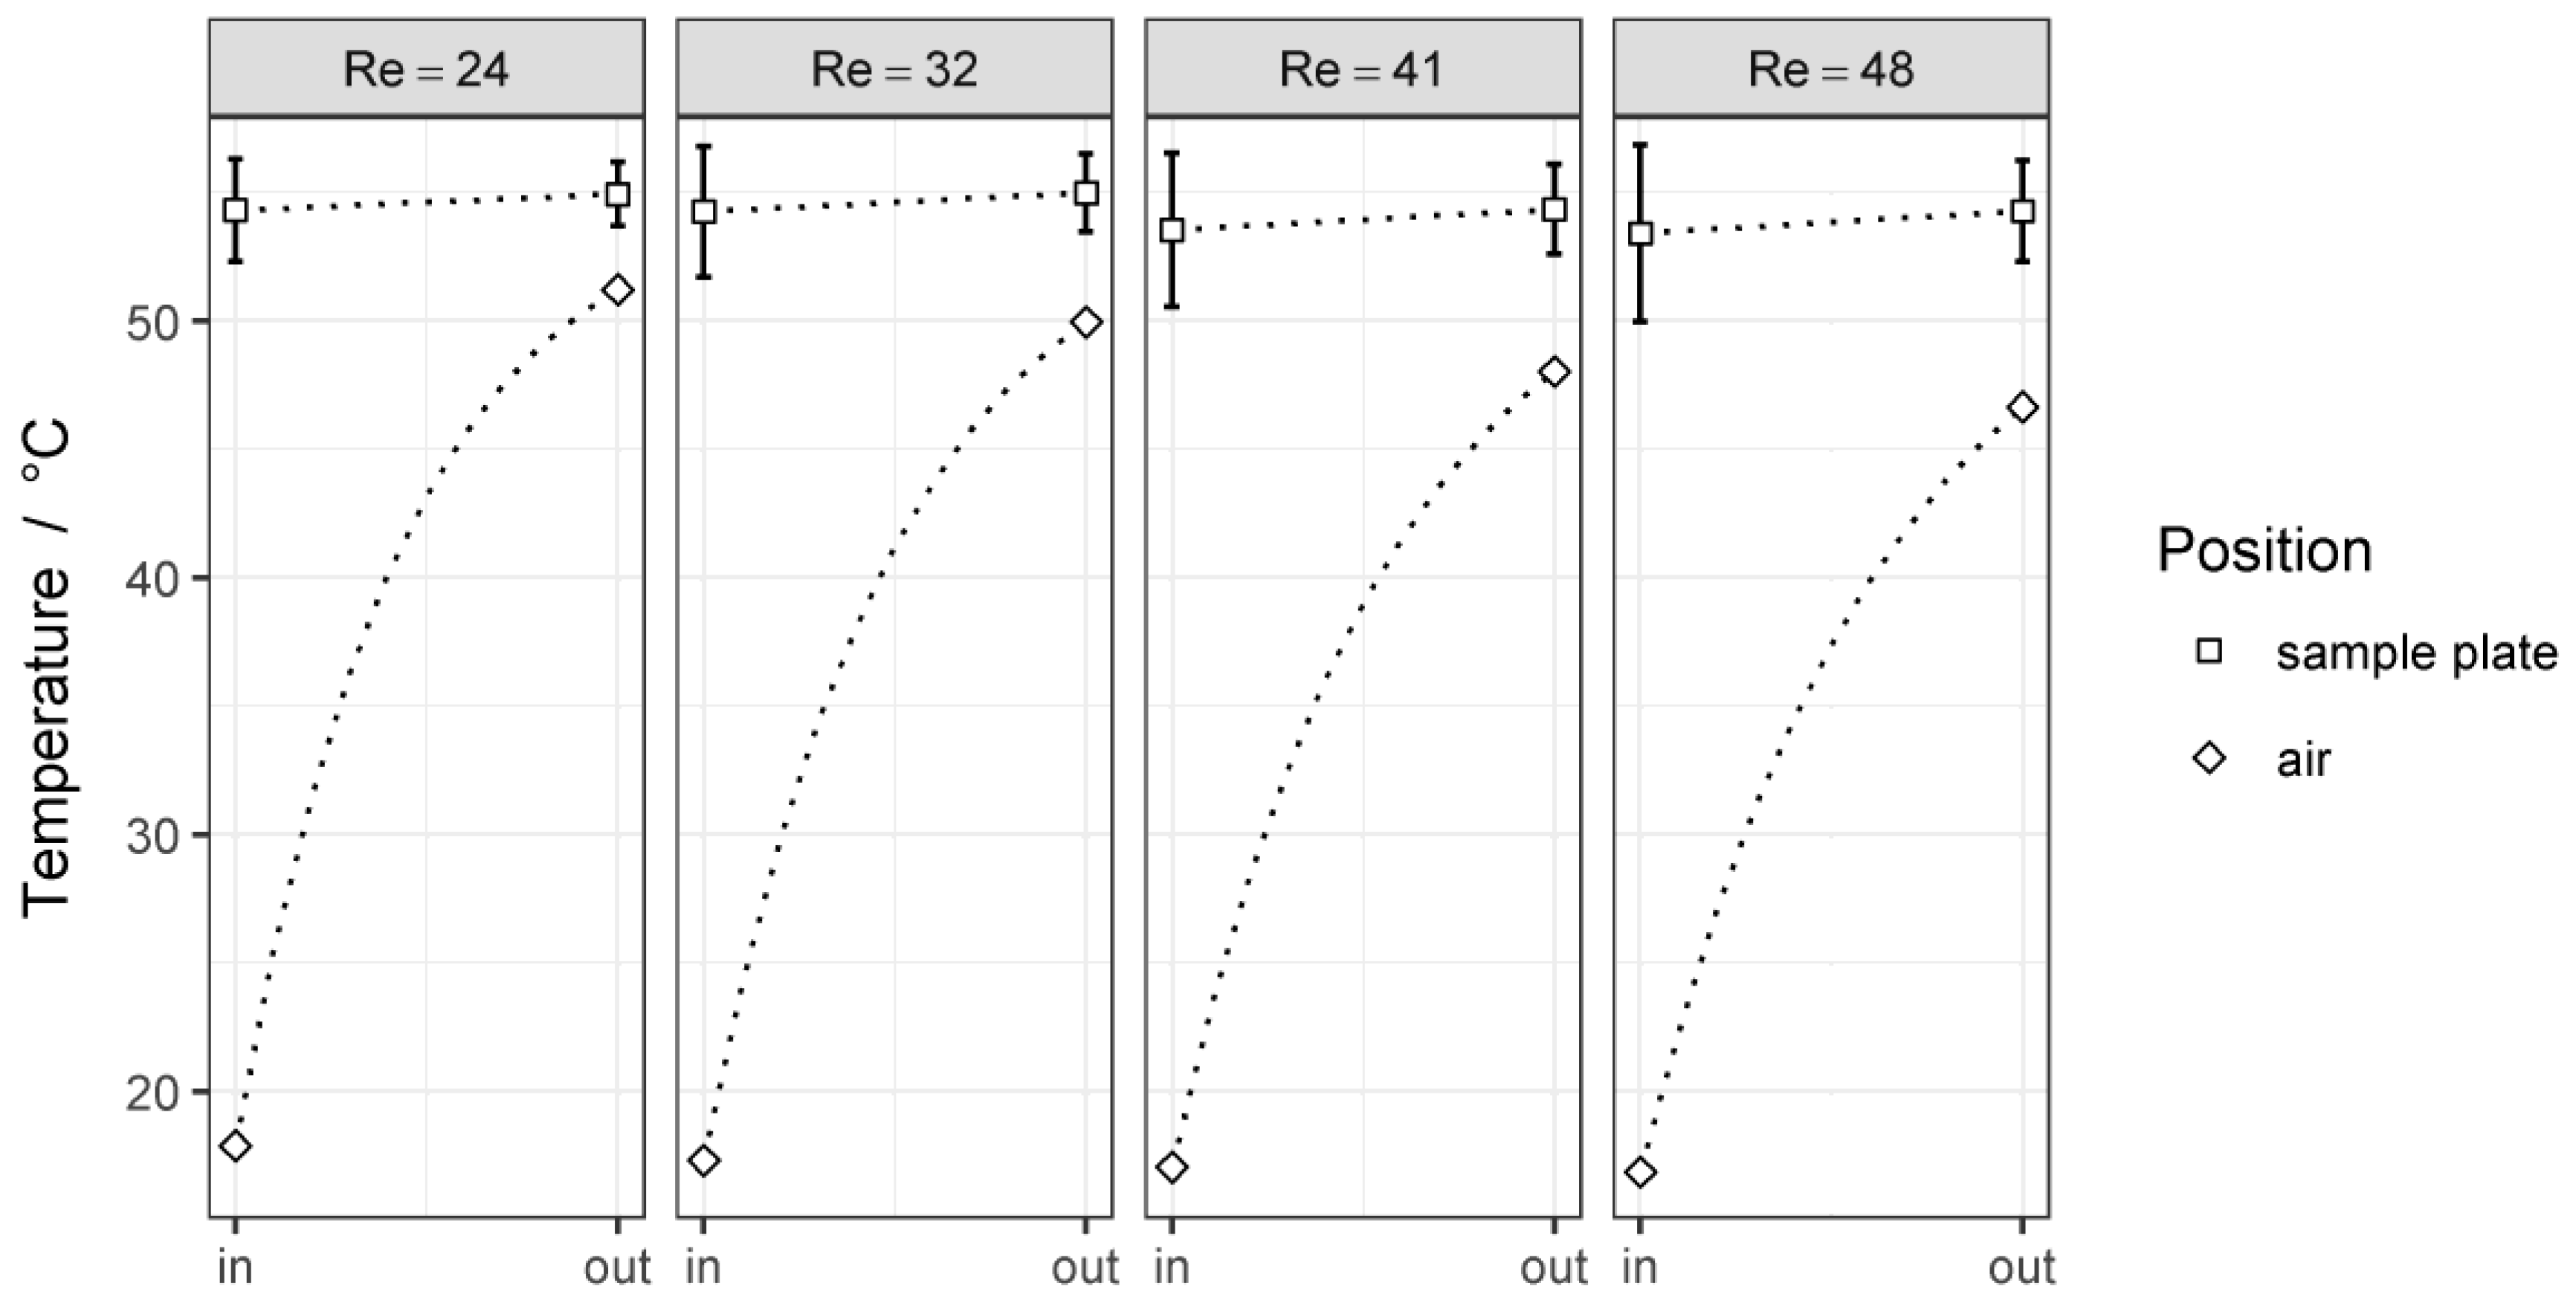
3.1. Test Set-Up
3.2. Data Reduction Parameters
3.3. Uncertainty Analysis
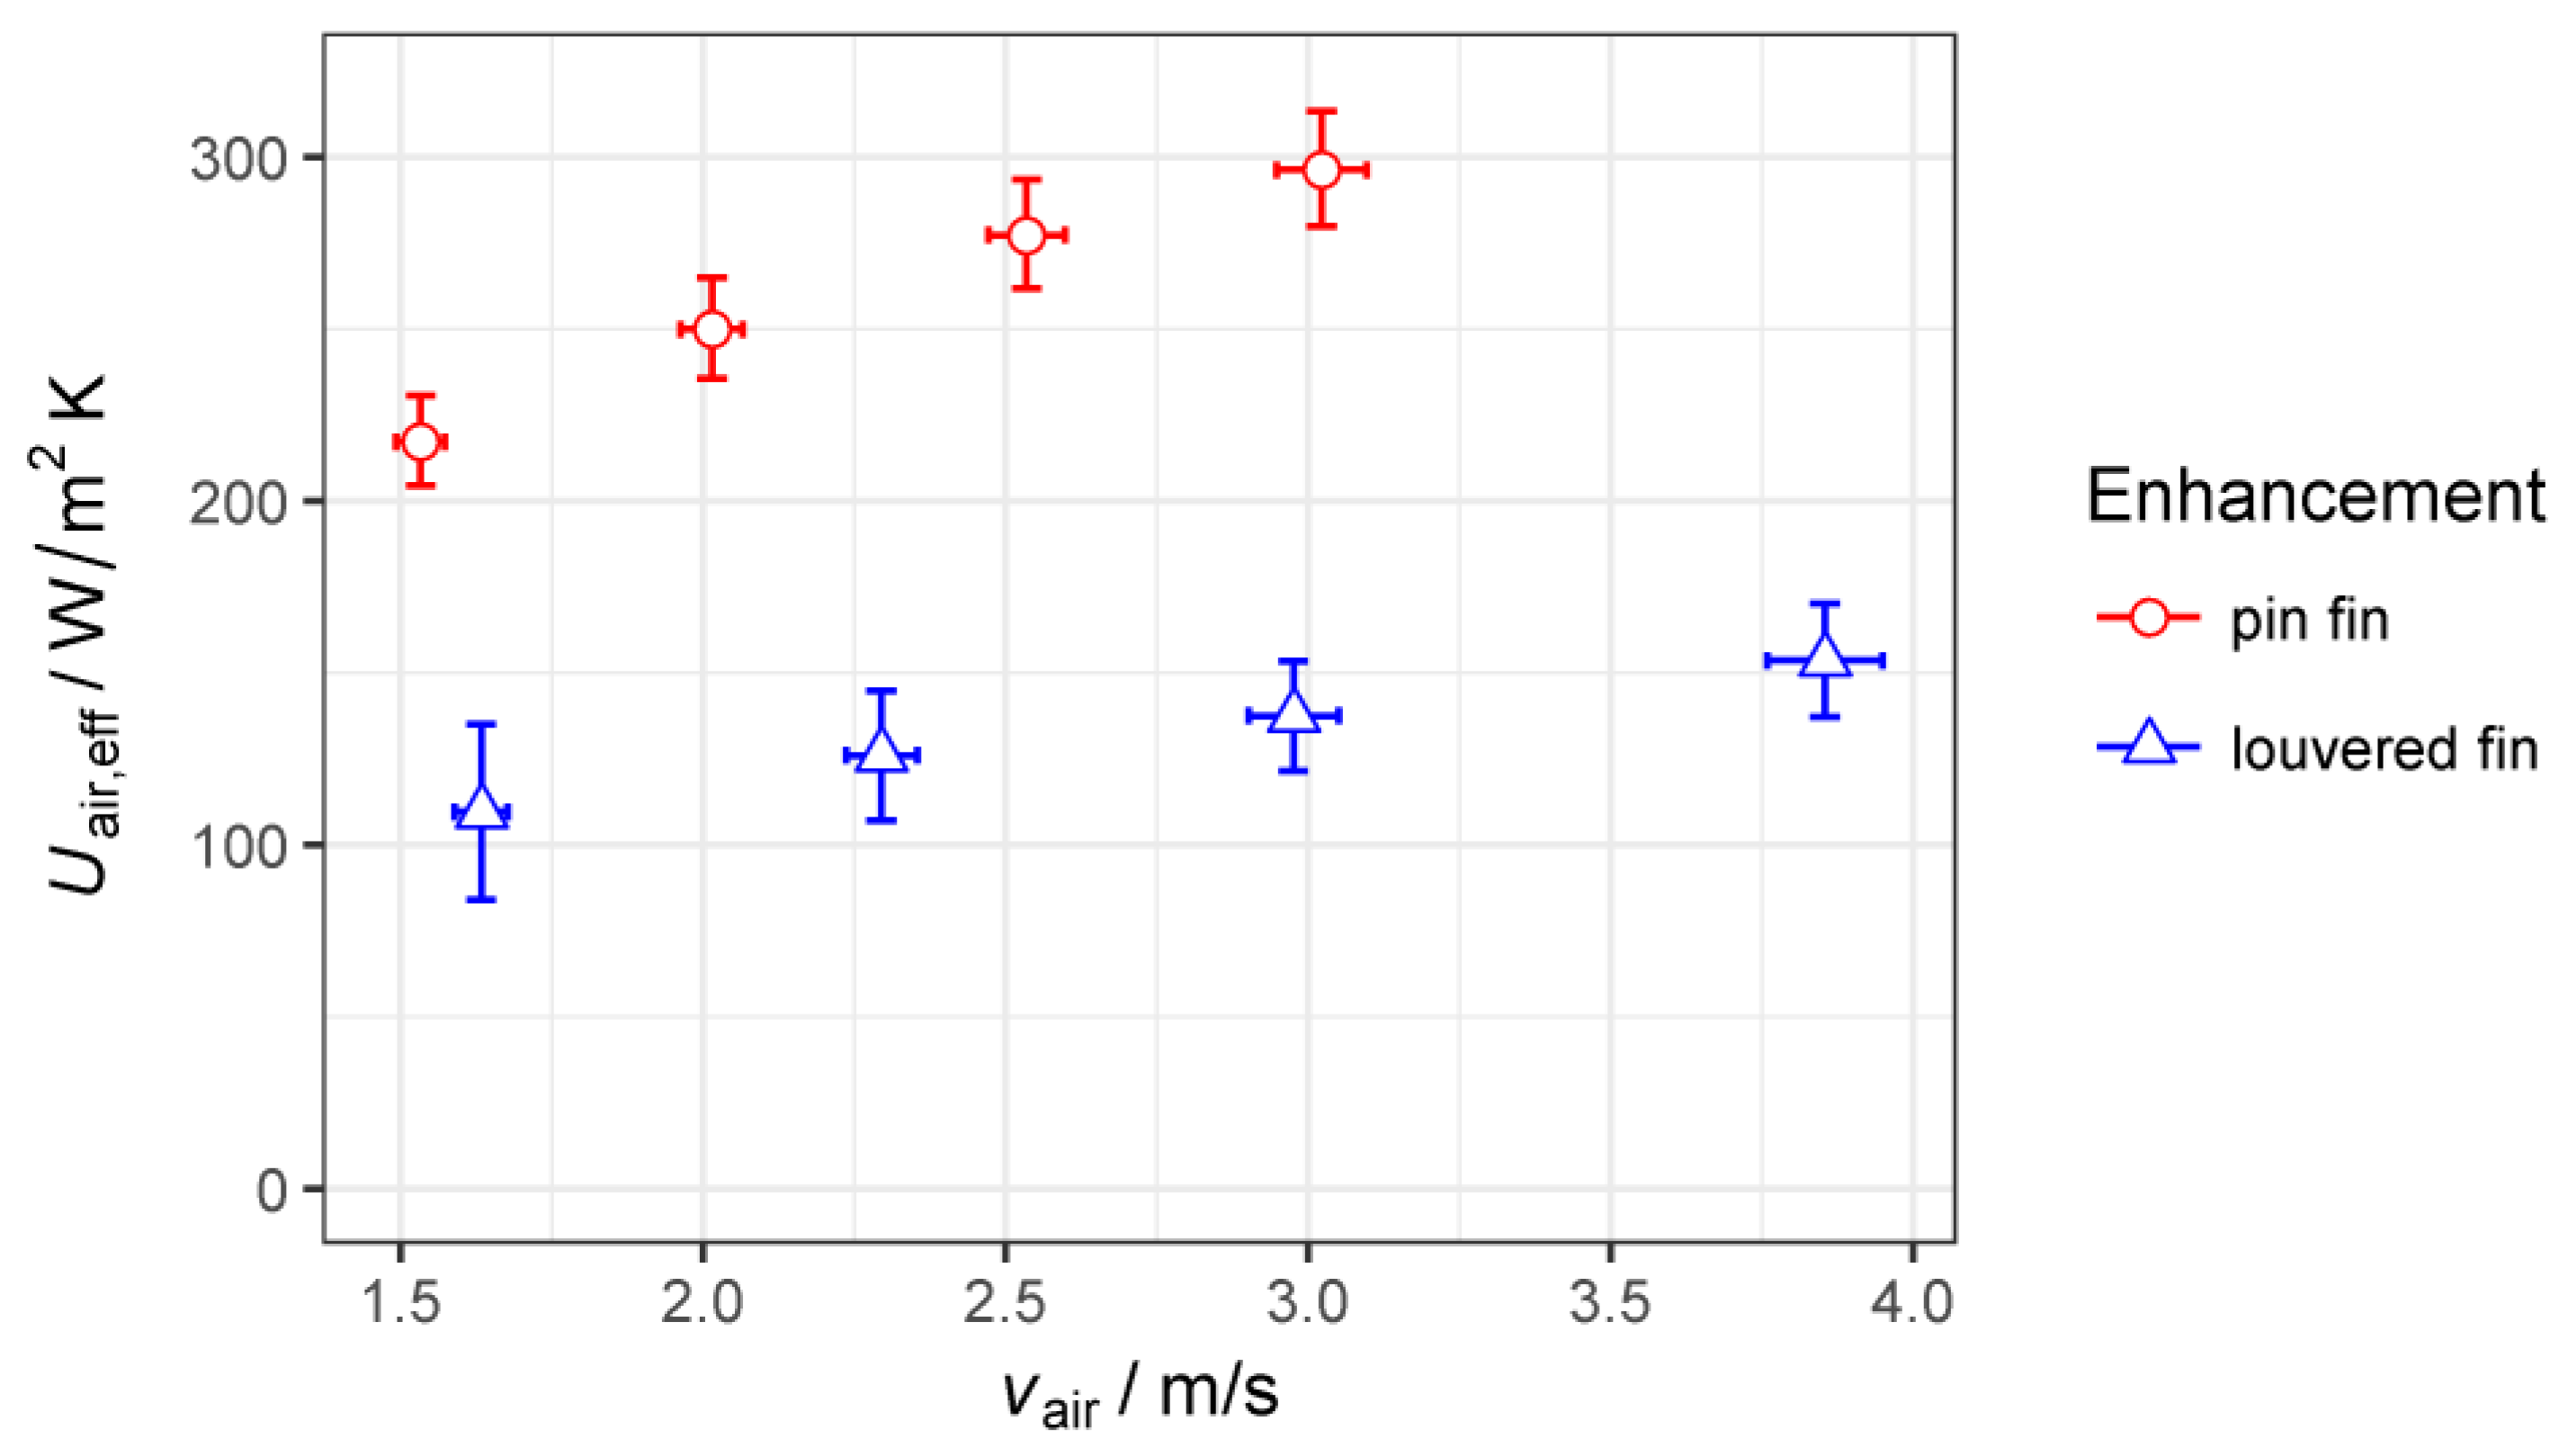
4. Performance Evaluation
5. Discussion
6. Conclusions
- A test facility for thermo-hydraulic performance measurements of small scale heat transfer surface area enhancements has been constructed.
- A performance comparison of different heat exchanger structures can be realized with less manufacturing costs than in standard tests.
- An innovative micro pin fin structure and a louvered fin reference structure have been evaluated; other types of enhancement, such as foams, are suitable for measurement as well.
- The geometrical inaccuracy, the deformation of wire arrays, improper wire contacting, and vortex shedding on the back side might influence the performance; their impact has not been evaluated.
- The uncertainties of Nusselt number and Fanning friction factor for the micro pin fin structure is below 7% and 6%, respectively.
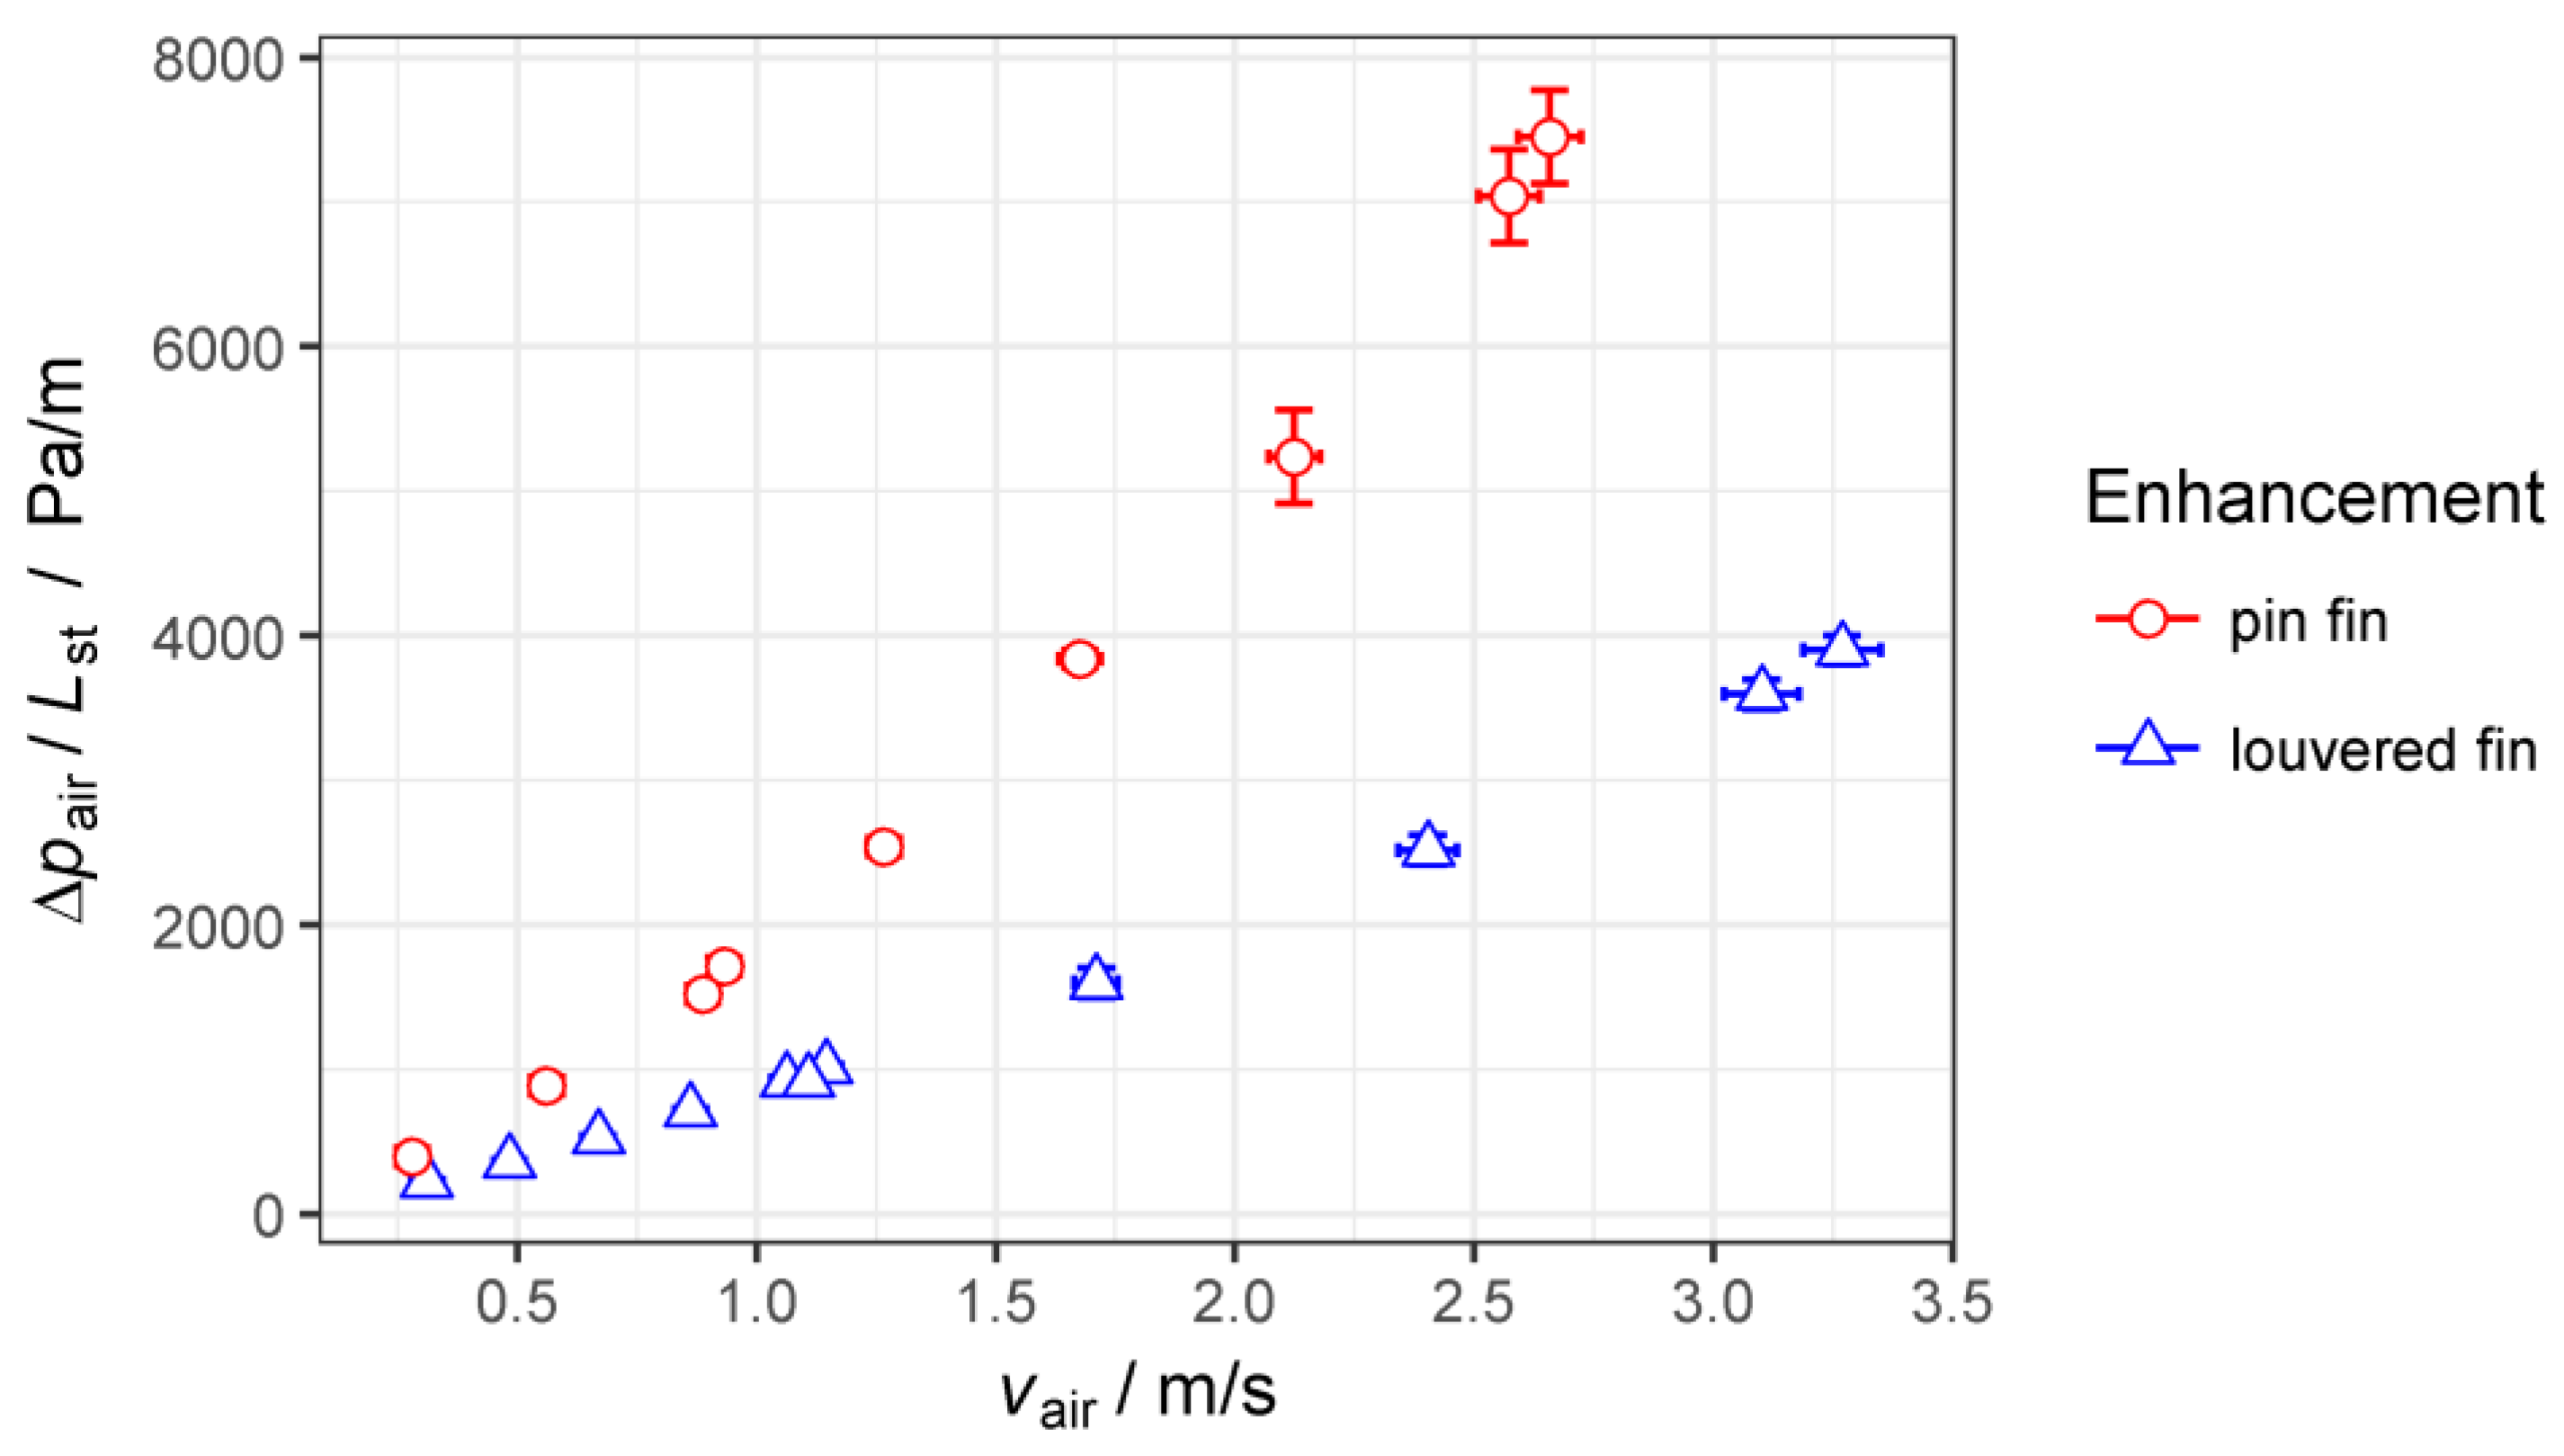
- The micro pin fin wire structure shows twice the heat transfer coefficient and twice the pressure drop compared to a louvered fin reference; thus a more compact heat exchanger with similar performance and less material usage is conceivable.
Author Contributions
Acknowledgments
Conflicts of Interest
Nomenclature
| area (m²) | |
| specific heat (J/kg·K) | |
| diameter, thickness or characteristic length (m) | |
| Fanning friction factor | |
| height (m) | |
| convection heat transfer coefficient (W/m²K) | |
| thermal conductivity (W/m K) | |
| length (m) | |
| l | wire pitch (m) |
| mass flow rate (kg/s) | |
| number of wires or fins | |
| Nusselt number | |
| power (W) | |
| pressure (Pa) | |
| heat transfer rate (W) | |
| Reynolds number | |
| temperature (K) | |
| temperature difference (K) | |
| overall heat transfer coefficient (W/m²K) | |
| volume (m³) | |
| volume flow rate (m³/s) | |
| velocity | |
| humidity ratio (kg/kg) | |
| Greek Symbols | |
| β | heat transfer surface area density (m²/m³) |
| δ | thickness of walls or fins (m) |
| effectiveness | |
| dynamic viscosity (kg/m s) | |
| extended surface efficiency | |
| fin efficiency | |
| ρ | density (kg/m³) |
| porosity | |
| Subscripts | |
| air | air side |
| ch | characteristic value |
| channel | domain before and after the test core |
| cond | air flow conditioning system |
| eff | effective |
| el | electric |
| in | inlet |
| fins | related to one or several (louvered) fins |
| HTS | heat transfer surface |
| HX | heat exchanger |
| HXelm | heat exchanger element (without header) |
| lat | perpendicular to the air flow direction; lateral |
| long | in air flow direction; longitudinal |
| m | mean |
| meas | measured value |
| out | outlet |
| p | primary surface; tube or plate wall |
| saplt | sample plate |
| st | domain between tubes for heat transfer enhancement structure |
| wire | related to one or several wires |
Appendix A. Fin Efficiency and Extended Surface Efficiency
References
- Tian, J.; Kim, T.; Lu, T.J.; Hodson, H.P.; Queheillalt, D.T.; Sypeck, D.J.; Wadley, H. The effects of topology upon fluid-flow and heat-transfer within cellular copper structures. Int. J. Heat Mass Transf. 2004, 47, 3171–3186. [Google Scholar] [CrossRef]
- Girlich, D. Grundsatzuntersuchungen zum Einsatz Offenporiger Metallschäume in der Luft-, Kälte- und Wärmetechnik Abschlussbericht; Laufzeit: 01.11.2002 bis 31.10.2004; M-Pore GmbH: Dresden, Germany, 2006. [Google Scholar]
- Hutter, C.; Büchi, D.; Zuber, V.; Rudolf von Rohr, P. Heat transfer in metal foams and designed porous media. Chem. Eng. Sci. 2011, 66, 3806–3814. [Google Scholar] [CrossRef]
- Boomsma, K.; Poulikakos, D.; Zwick, F. Metal foams as compact high performance heat exchangers. Mech. Mater. 2003, 35, 1161–1176. [Google Scholar] [CrossRef]
- Iwai, H.; Kawakami, S.; Suzuki, K.; Tsujii, J.; Abiko, T. Performance Evaluation of Wire Spring Fin for Compact Plate-Fin Heat Exchangers. In Proceedings of the Enhanced, Compact and Ultra-Compact Heat Exchangers: Science, Engineering and Technology, Whistler, BC, Canada, 11–16 September 2005. [Google Scholar]
- Sypeck, D.J.; Wadley, H.N.G. Multifunctional microtruss laminates: Textile synthesis and properties. J. Mater. Res. 2001, 16, 890–897. [Google Scholar] [CrossRef]
- Xu, J.; Tian, J.; Lu, T.J.; Hodson, H.P. On the thermal performance of wire-screen meshes as heat exchanger material. Int. J. Heat Mass Transf. 2007, 50, 1141–1154. [Google Scholar] [CrossRef]
- Liu, Y.; Xu, G.; Luo, X.; Li, H.; Ma, J. An experimental investigation on fluid flow and heat transfer characteristics of sintered woven wire mesh structures. Appl. Therm. Eng. 2015, 80, 118–126. [Google Scholar] [CrossRef]
- Prasad, S.B.; Saini, J.S.; Singh, K.M. Investigation of heat transfer and friction characteristics of packed bed solar air heater using wire mesh as packing material. Sol. Energy 2009, 83, 773–783. [Google Scholar] [CrossRef]
- Li, C.; Wirtz, R.A. Development of a High Performance Heat Sink Based on Screen-Fin Technology; University of Nevada: Reno, NV, USA, 2003. [Google Scholar]
- Van Andel, E. Heat Exchanger and Method for Manufacturing Same. Patent Application No. EP0714500 B1, 7 January 1999. [Google Scholar]
- Bonestroo, J.P. Calculation Model of Fine-Wire Heat Exchanger. Master’s Thesis, Twente University, Enschede, The Netherlands, 2012. [Google Scholar]
- Sahiti, N. Thermal and Fluid Dynamic Performance of Pin Fin Heat Transfer Surfaces. Ph.D. Thesis, Universität Erlangen, Nürnberg, Germany, 2006. [Google Scholar]
- Fugmann, H.; Laurenz, E.; Schnabel, L. Wire Structure Heat Exchangers—New Designs for Efficient Heat Transfer. Energies 2017, 10, 1341. [Google Scholar] [CrossRef]
- Petroski, S.J. An Investigation of the Performance of Confined, Saw-Tooth Shaped Wire-On-Tube Condensers; Air Conditioning and Refrigeration Center, College of Engineering, University of Illinois: Champaign, IL, USA, 1999. [Google Scholar]
- Kim, T.; Zhao, C.Y.; Lu, T.J.; Hodson, H.P. Convective heat dissipation with lattice-frame materials. Mech. Mater. 2004, 36, 767–780. [Google Scholar] [CrossRef]
- Verein Deutscher Ingenieure. In Wärmeatlas, 9th ed.; Springer: Berlin/Heidelberg, Germany, 2002.
- Fugmann, H.; Oltersdorf, T.; Schnabel, L. Metal Wire Structures as Heat Transfer Surface Area Enlargement—Design Study and Potential Analysis for Air-to-Water Heat Pumps. In Proceedings of the 12th IEA Heat Pump Conference, Rotterdam, The Netherlands, 15–18 May 2017. [Google Scholar]
- Fugmann, H.; Tahir, A.J.; Schnabel, L. Woven Wire Gas-To-Liquid Heat Exchanger. In World Congress on Mechanical, Chemical and Material Engineering; MCM15; Avestia Publishing, International ASET Inc.: Ottawa, ON, Canada, 2015. [Google Scholar]
- Shah, R.K.; Sekulić, D.P. Fundamentals of Heat Exchanger Design; Wiley: Hoboken, NJ, USA, 2003. [Google Scholar]
- GUM. Guide to the Expression of Uncertainty in Measurement (Deutsche Übersetzung); DIN Deutsches Institut für Normung e.V.: Berlin, Germany, 1999. [Google Scholar]
- Fugmann, H.; Schnabel, L.; Frohnapfel, B. Heat Transfer and Pressure Drop Correlations for Laminar Flow in an In-line and Staggered Array of Circular Cylinders. 2018; in press. [Google Scholar]
- Kim, M.-H.; Bullard, C.W. Air-side thermal hydraulic performance of multi-louvered fin aluminum heat exchangers. Int. J. Refrig. 2002, 25, 390–400. [Google Scholar] [CrossRef]


| Present Study | Petroski [15] | Prasad [9] | Tian et al. [1] | Kim [16] | Hutter [4] | |
|---|---|---|---|---|---|---|
| sample height (mm) | 8.15–10 (variable) | 50.8–152 (variable) | 25 | 10 | 12 | 7 |
| sample length (mm) | 10–30 | 622 | 750 | 60 | 127 | 200 |
| sample geometry | micro pin fin | saw-tooth | wire screen | square, diamond cells | LFM | metal foams, porous media |
| temperature measurement method | Pt100 + Pt106 | thermo-couple (type T) | thermo-couple (type T) | thermo-couple (type T) | thermo-couple (type T) | thermo-couple (type K) |
| heating method | electric heating pad | water | solar radiation | electric heating pad | electric heating pad | wrap-around heating cord |
| uncertainty heat transfer (Nusselt number deviation) | 6.6% | 6.4–8.7% | 6.0% | 5.4% | 8.3% | ---- |
| Unit | Parameter | Wire Structure | Louvered Fin | |
|---|---|---|---|---|
| wire diameter/fin thickness | mm | 0.25 | 0.04 | |
| channel height | mm | 10 | 8.15 | |
| sample length | mm | 10 | 32 | |
| number of wires/fins | - | 2296 | 50 | |
| heat transfer surface area (inkl top and bottom sample plate) | m2 | 0.0198 | 0.058 | |
| volume of structure | m² | 1 × 10⁻⁵ | 2.6 × 10⁻⁵ | |
| material | - | - | Cu-ETP | Cu-ETP |
| thermal conductivity of wire/fin material | W/mK | 385 | 385 | |
| lateral wire/fin distance (perpendicular to flow direction) | mm | 1.21 | 2 | |
| longitudinal wire distance (in flow direction) | mm | 0.35 | - | |
| mass specific surface area | m²/kg | - | 1.95 | 6.21 |
| porosity | % | 88.4 | 96.0 | |
| effective heat conductivity | W/mK | 46.2 | 15.52 | |
| volume specific weight | kg²/m³ | - | 1009 | 361 |
| volume specific surface area | m²/m³ | 1970 | 2240 |
| Dimension | Sensor Uncertainty (Rectangular Distr.) | Additional Uncertainty (Normal Distr.) | Combined Uncertainty | |
|---|---|---|---|---|
| K | 0.1 | 0.26 | 0.27 | |
| K | 0.1 | 0.09 | 0.11 | |
| K | 0.1 | 0.41–0.70 | 0.41–0.70 | |
| K | 0.1 | 0.25–0.40 | 0.26–0-40 | |
| Pa | 0.54–2.8 | 0 | 0.31–1.62 | |
| kg/s | 4.0–7.7 | 0 | 2.4–4.4 |
| Input | Output | |||||||||
|---|---|---|---|---|---|---|---|---|---|---|
[K] | [m/s] | [W] | [W] | [K] | [K] | [K] | [-] | [W/m²K] | [-] | |
| micro pin fin | 17.9 | 1.6 | 60 | 61 | 54.3 | 54.9 | 51.2 | 0.90 | 217.1 | 0.93 |
| 17.3 | 2.1 | 76 | 78 | 54.3 | 55.0 | 50.0 | 0.86 | 249.8 | 0.92 | |
| 17.1 | 2.7 | 90 | 93 | 53.5 | 54.3 | 48.0 | 0.83 | 277.2 | 0.91 | |
| 16.9 | 3.2 | 104 | 107 | 53.4 | 54.3 | 46.7 | 0.79 | 296.1 | 0.91 | |
| louvered fin | 21.2 | 1.7 | 47 | 45 | 49.0 | 50.2 | 49.6 | 0.98 | 109.5 | 0.92 |
| 21.2 | 2.4 | 67 | 66 | 50.8 | 52.3 | 51.0 | 0.96 | 125.9 | 0.91 | |
| 21.6 | 3.1 | 83 | 83 | 50.9 | 52.5 | 50.4 | 0.93 | 137.4 | 0.91 | |
| 21.5 | 4.0 | 104 | 101 | 50.1 | 51.8 | 48.8 | 0.90 | 153.5 | 0.90 | |
© 2018 by the authors. Licensee MDPI, Basel, Switzerland. This article is an open access article distributed under the terms and conditions of the Creative Commons Attribution (CC BY) license (http://creativecommons.org/licenses/by/4.0/).
Share and Cite
Fugmann, H.; Di Lauro, P.; Sawant, A.; Schnabel, L. Development of Heat Transfer Surface Area Enhancements: A Test Facility for New Heat Exchanger Designs. Energies 2018, 11, 1322. https://doi.org/10.3390/en11051322
Fugmann H, Di Lauro P, Sawant A, Schnabel L. Development of Heat Transfer Surface Area Enhancements: A Test Facility for New Heat Exchanger Designs. Energies. 2018; 11(5):1322. https://doi.org/10.3390/en11051322
Chicago/Turabian StyleFugmann, Hannes, Paolo Di Lauro, Aniket Sawant, and Lena Schnabel. 2018. "Development of Heat Transfer Surface Area Enhancements: A Test Facility for New Heat Exchanger Designs" Energies 11, no. 5: 1322. https://doi.org/10.3390/en11051322