Article

Study on the Incentives Mechanism for the Development of Distributed Photovoltaic Systems from a Long-Term Perspective

1
School of Electrical & Electronic Engineering, North China Electric Power University, Baoding 071003, China
2
State Grid Hebei Electric Power Supply Co., Ltd., Shijiazhuang 050022, China
3
State Key Laboratory of Alternate Electrical Power System with Renewable Energy Sources, Baoding 071003, China
4
Department of Electrical Engineering, Pontificia Universidad Católica de Chile, Santiago 7820436, Chile
5
Centro de Energía UC, Santiago 7820436, Chile
*
Authors to whom correspondence should be addressed.
Energies 2018, 11(5), 1291; https://doi.org/10.3390/en11051291
Submission received: 11 April 2018 / Revised: 10 May 2018 / Accepted: 15 May 2018 / Published: 18 May 2018
(This article belongs to the Special Issue Recent Research Progress for Energy Policy)

Abstract

:
Sharing the benefits of distribution systems from the integration of distributed photovoltaic systems (DGPVs) with investors is vital to the coordinated development of DGPVs and active distribution systems (ADN). The investment and development of DGPVs, incentive policies, and the development of distribution system interact, and the interactions vary with the changes in the on-grid capacity of DGPVs. In this paper, an event-driven co-simulation platform is built to simulate the abovementioned interaction among DGPVs, ADN, and incentive policy under a long-term time frame. The platform includes an investment model of DGPV investors and an ADN model with consideration of the growth of the ADN. On this platform, we study how multiple factors, including incentive system, global horizontal radiance (GHR), and cost, affect the investment and integration of DGPVs in the future 10 years. Simulation and analysis showed that investors’ decisions are more sensitive to variation in GHR and cost, followed by variation in tariff system, subsidy, and self-use ratio. Distribution subsidies have certain impact on the development of DGPV and could partially replace the national and provincial capacity and generation subsidies. When the on-grid capacity reaches a certain level, the distribution subsidy reaches a dynamic equilibrium.

1. Introduction

The contradiction between the continuously increasing energy demand, depletion of fossil resources, and need for greenhouse gas reduction places renewable energy in an unparalleled position in the world [1,2]. Especially for China, as the largest energy consumer and carbon dioxide (CO2)-emitting country in the world, lowering the percentage of electricity from coal-fired energy is of great importance [3]. Renewable energy generation, especially solar photovoltaic (PV) power, has drawn great attention because it can be directly integrated into the distribution system [4].
The National Development Reform Commission of China has defined distributed photovoltaic system (DGPV) projects as “projects with generation on or close to the user site, instantaneously consumed by end users themselves, i.e., self-consumed, and for which redundant power can be grid-connected and the system can be balanced in the grid” [5]. Since 2009 in China, under the government’s support, distributed PV has had considerably development [6]. Along with development, the limitation on the capacity of a PV project has increased from 6 MW in 2012 to 20 MW in 2014 [7,8,9]. In addition to the specific problems caused by the operation perspective, such as solar PV power forecasting on different temporal-spatial scales [10,11,12,13], optimal operation of building integrated PV system [14], baseline estimation for demand response with high penetration of DGPV [15], and methods to improve the generation efficiency of PV panels [16], the issues related to incentives mechanisms for the development of distributed PV from a long-term perspective should be given higher priority from the policy maker perspective.
In many countries, subsidies are irreplaceable for the economic feasibility of PV projects [9,17,18]. Since 2013, the Chinese government has implemented a large number of incentive policies for DGPV, and China’s PV market-development strategy has witnessed a series of policy changes since then [6,19]. National capacity subsidies, which are upfront subsidies, have been an important means to promote the development of DGPVs. However, fraud is inevitable without an effective supervision system [6,19]. The feed-in-tariff (FIT) has become the mainstream national subsidy. Since 2017, China, as well as other countries, enacted a FIT decline policy [20]. However, if there is no major technological breakthrough leading to a drop in the cost, and only considering the single state subsidy mechanism, the Chinese government should not stop subsidies until 2032 [21].
The incentive policies at the national level are indispensable, but the impact of grid-connected distributed generation (DG) on the distribution network should not be ignored. The upfront subsidy or FIT can only reflect the determination of the government, not the involvement of the distribution system. Therefore, from the distribution level, designing a multi-level subsidy mechanism is necessary, considering the DG subsidies based on the actual network loss and load rate, as well as the impact of the DG operation on the distribution network operation and management to provide guidance to the investment in DG. Given the scale of China’s goals for DGPV growth, its deployment direction in China in response to policy changes is an important topic [6].
For this purpose, we built an event-driven co-simulation platform to simulate the interaction among DGPVs, distribution system, and incentive policy, as well as the evolution of ADN under the interaction from a long-term perspective. On this platform, we studied the effect of the variation in the compound incentive system, global horizontal radiance (GHR), and cost on the investment and integration of DGPVs in the future 10 years.
The rest of the paper is organized as follows: we briefly introduce the co-simulation platform in Section 2. In Section 3, we introduce the modeling of factors that affect the DGPV investment. In Section 4, we complete simulation and analyze the corresponding results. The last section draws conclusions and implications based on the outcomes of the study.

2. Proposed Method

The system dynamics (SD) method is a well-accepted method for studying the long-term dynamics of a complex system. The uncertainties involved in the long-term timeframe are normally simulated by Monte Carlo simulation and stochastic programming. For example, the electricity demand-supply balance in the power system in China was studied using the SD method [22]. The effect of the current subsidy system on the development of PVs was previously reported [21,23], whereas the Monte Carlo simulation was used to cover the probabilistic feature in the risks of the development of PV technologies [23]. Our study aimed to simulate the effect of DGPV on the distribution system, which requires solving nonlinear functions. Along with the development of ADN, the variety and complexity of interactions between multiple entities will increase continuously; even the typical topology of the distribution network will change. Previous studies have not used abstract models in SD to address the abovementioned complexity. Open source simulation platforms for distribution systems have been developed, such as the GridLAB-DTM distribution system simulator [24,25]. By integrating a power system simulator into the SD method, the complexity of the evolution of the ADN can be fully captured. Therefore, in this paper, an event-driven co-simulation platform is proposed to study the evolution of ADN under a long-term timeframe. The main outlined of this platform is provided in Figure 1.
On the platform, multiple events were simulated to capture the interaction among policy, DGPVs’ investors, and ADN, and to drive the evolution of the ADN, as shown in Table 1. Events 1, 2, 3, and 8 affect the investor’s decision on the investment in DGPVs, and further change the integration capacity of DGPV into the ADN. Events 5 and 6 affect the operation and upgrade of the distribution system. The benefit obtained by the distribution system from the integration of DGPVs will then change, which in return affect the revenue of the DGPV investors. On the platform, the DG’s investment decision, benefit calculation, and feeder group’s upgrades were simulated by MATLAB (R2016a, MathWorks, Natick, MA, USA), whereas the operation of the distribution system under changing conditions was simulated by GridLAB-DTM. The parameters that varied during the simulation are summarized in Table 2.

3. Modelling of Factors Affecting the Development of DGPV

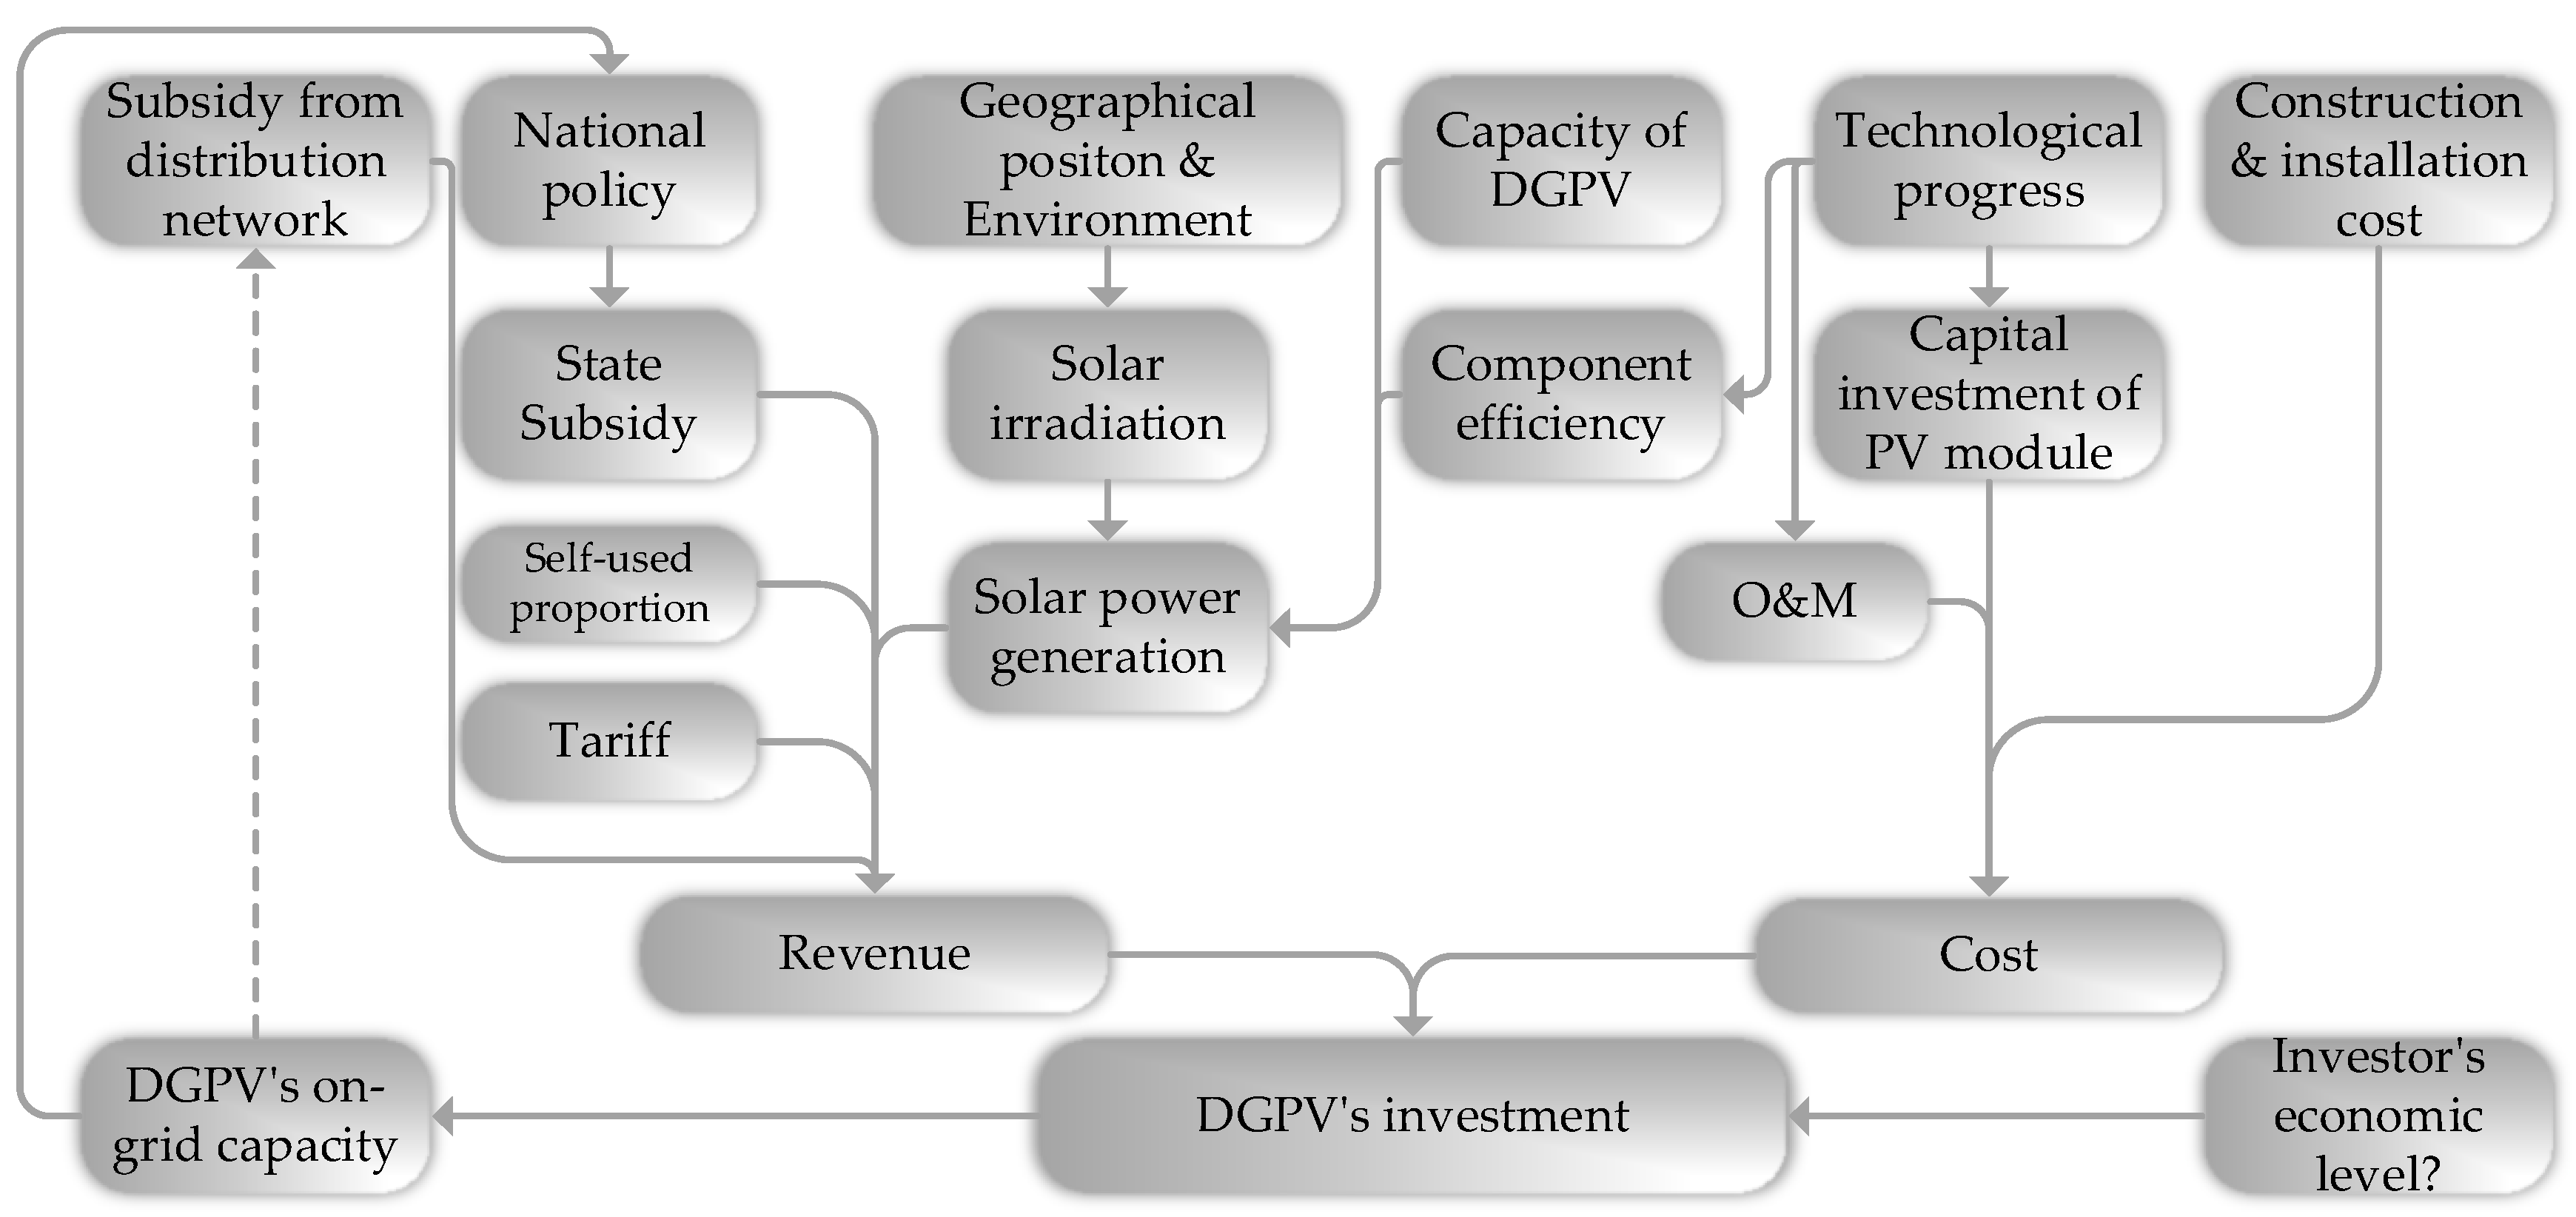
Figure 2 shows the factors that affect DGPV investment from the DGPV point of view. The willingness of investors to invest in DGPV is mainly decided by a DGPV project’s internal return rate (IRR). When the investment decreases or/and revenue increases, IRR increases. Then the DGPV investment willingness increases. The dashed line in Figure 2 denotes the distribution subsidy decided by the benefit that the distribution system obtains from the integration of DGPVs, which is analyzed by this study in the following sections.
As shown in Figure 2, the revenue and cost decide the investment into DGPVs. As a long-term study, we used the monthly average in the following calculation. The monthly DGPV income I m includes the sale of DGPV electric energy I E , m , which is decided by the monthly produced electricity E m and the sales price P E [28], firm power capacity I P , m or green certificates I G C , m , and ancillary services I A S , or certified emission reduction units (CER) I C D M . These relationships are shown as [6,7,28,29]:
I m = I E , m + I P , m + I G C ,   m + I A S , m + I C D M , m
I E , m = ( 1 A s e l f ) E m ( P E , m ¯ + F I T ) + A s e l f E m ( P E , m + F I T )
The current FIT policy for DGPV distinguishes between self-consumed and excess generated electricity. Self-consumed generation is reimbursed at the local retail rate of electricity. A s e l f denotes the percentage of self-consumed solar electricity,   P E , m is the retail price for the self-consumed electricity, and P E , m ¯ is the price applied to the non-self-consumed portion. Excess generation fed into the grid at the time of generation will be purchased by the local grid enterprises at the local wholesale benchmark price of non-sulfur coal-fired generation (around 0.35–0.45 CNY/kWh in China) [6]. In this study, ICDM, IGC,m, and Ip,m were obtained from the benefit that the distribution system obtains from the integration of DGPV, which is introduced in Section 3.5.
In the following subsection, we calculate or estimate the key factors that affect DGPV investment defined in Equation (2).

3.1. Current Incentive Systems in China

Subsidy has had a crucial role in multiple countries for promoting the development of distributed power generation. Table 3 provides a summary of subsidy policies for several cities and provinces in China in 2014 [6,30,31]. The improvement of the financing environment, the increase in the corporate attention, and the improvement in the operational experience of the industry have provided a good opportunity for the development of the DGPV market. The subsidies are undergoing changes, for example, a 10% annual decline.

3.2. Investment in DGPV

According to the statistics, the cost of DGPV has been decreasing and reached a level that makes the investment into DGPV economically feasible in some areas or countries even without subsidies, such as in Chile. 
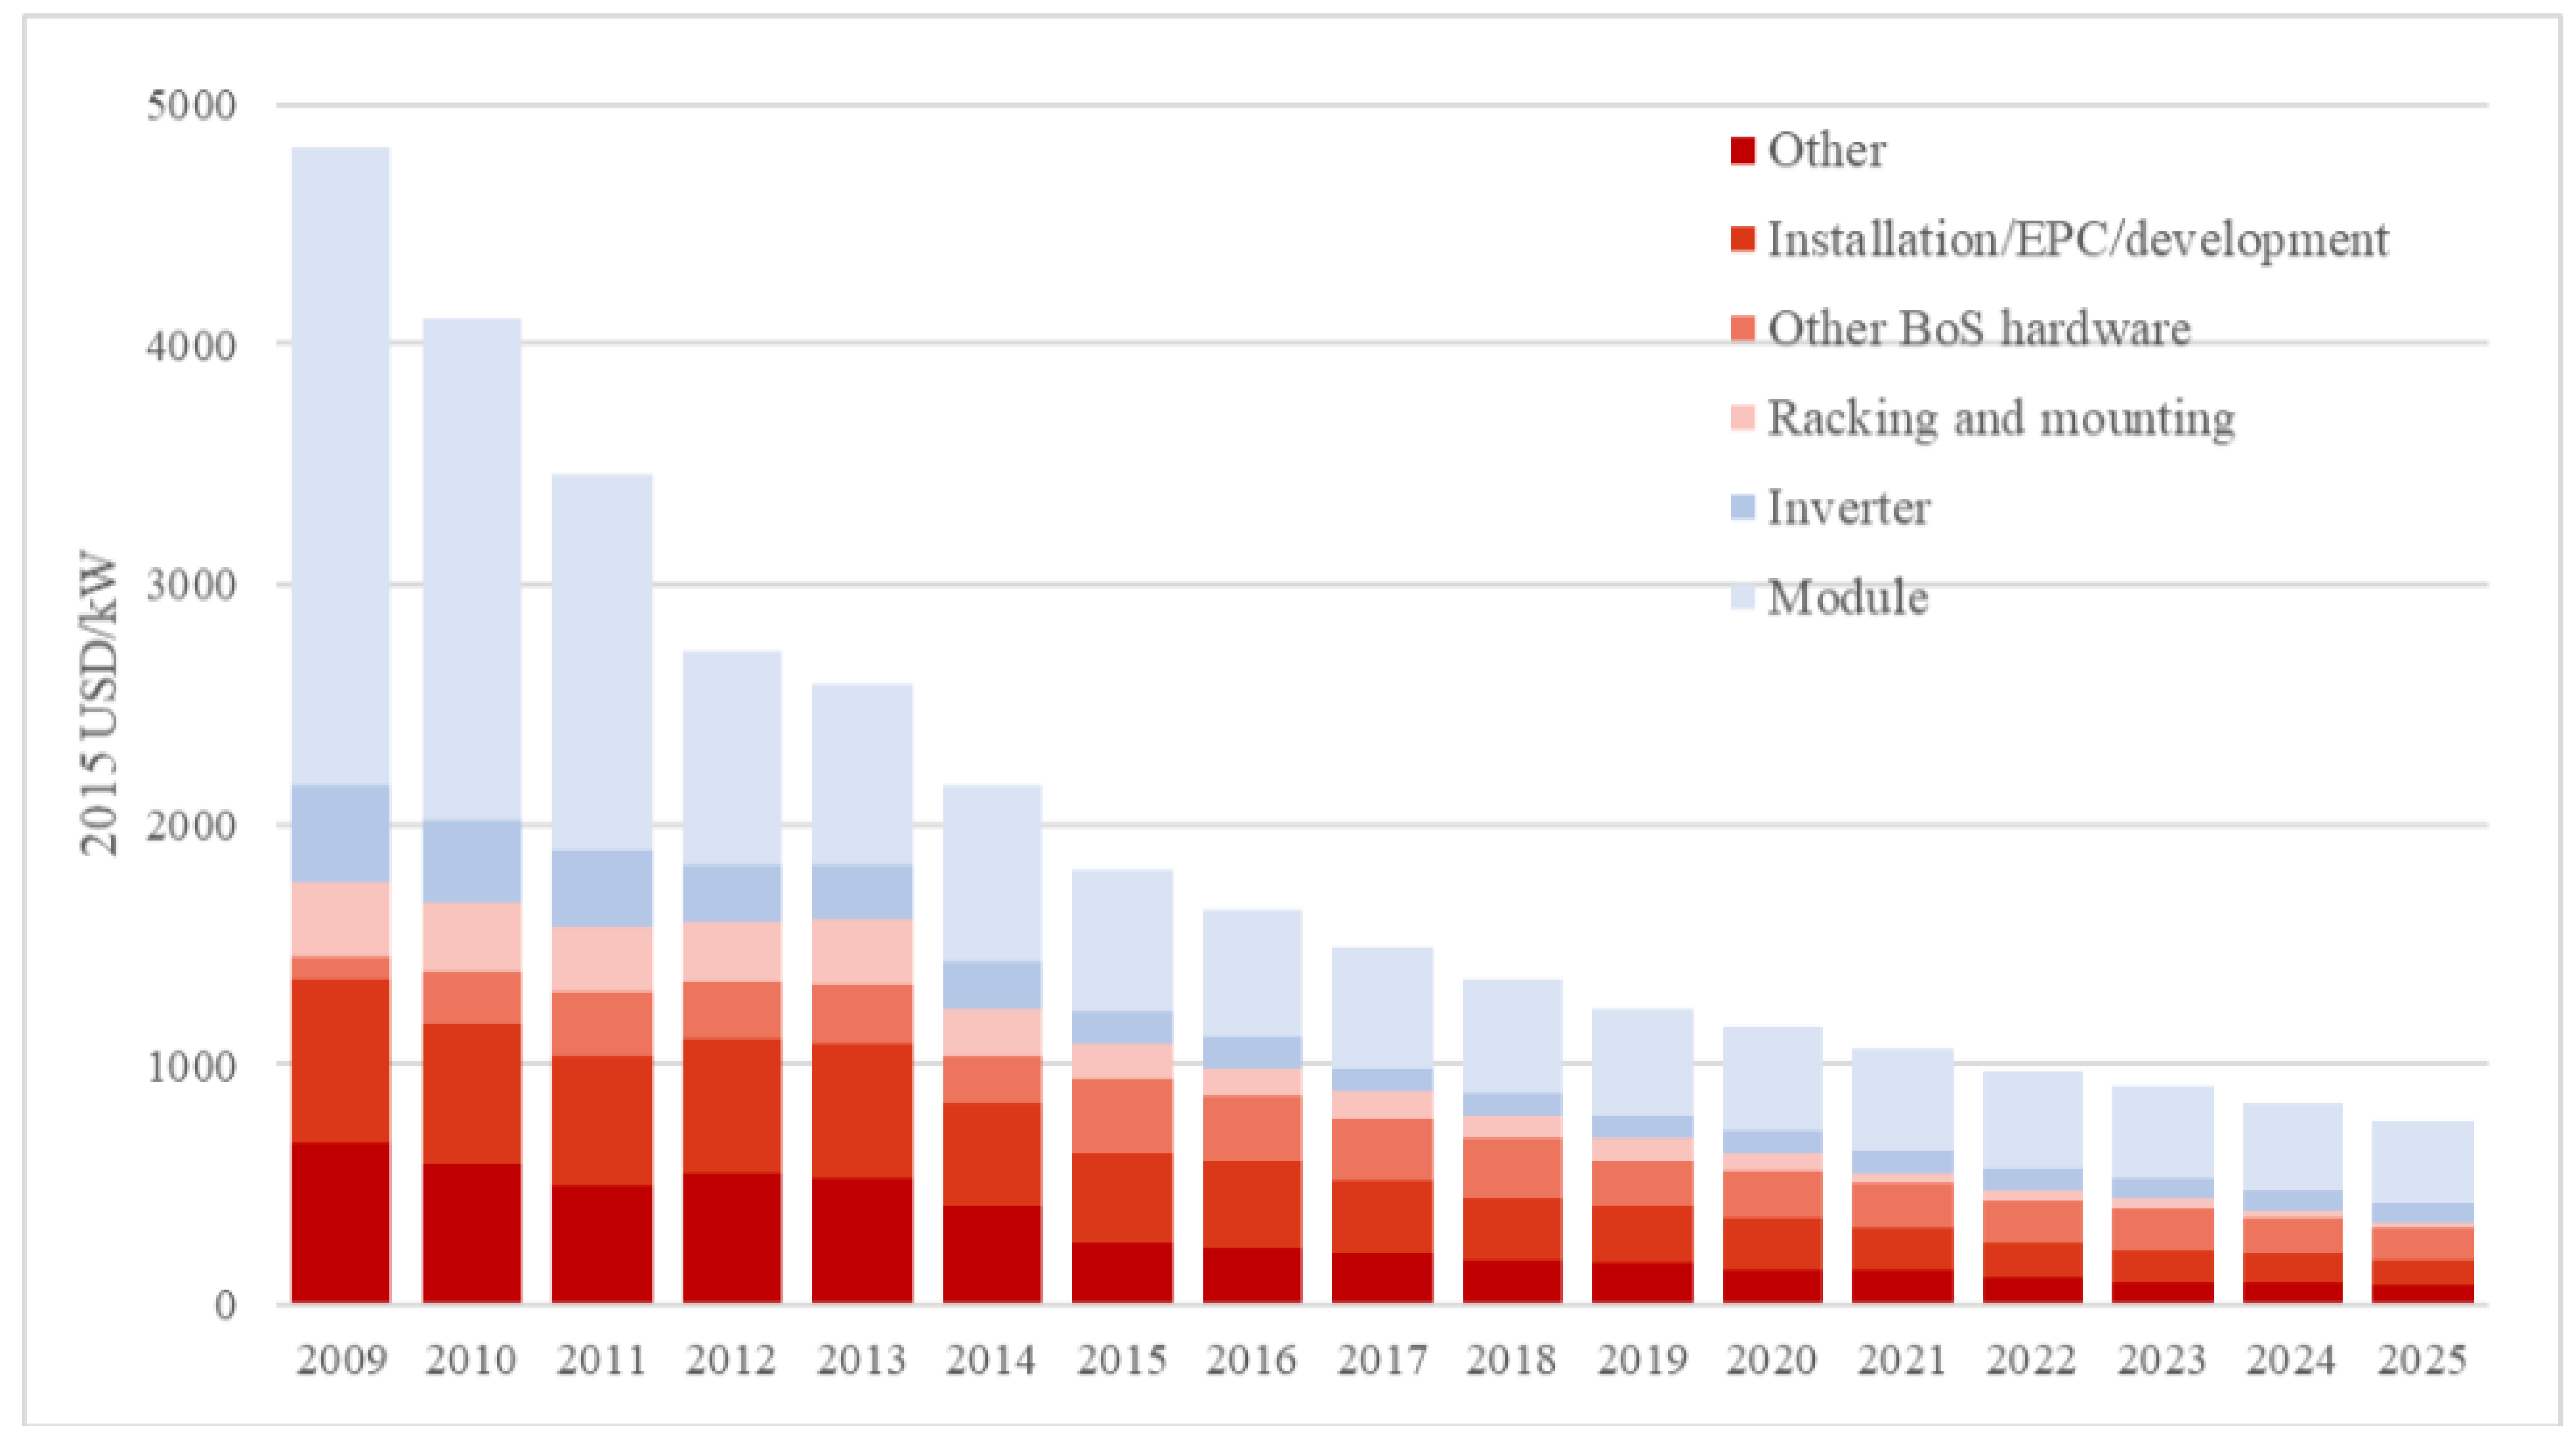
Figure 3 displays the average global weighted total installed costs of utility-scale solar PV according to the historical data and expectation [30,31]. The decline in the total installed cost of DGPV will be slower without considering the scale economic effect. Another aspect that requires attention is the slowing down of the decreasing trend. Undoubtedly, the next round of motivation for investment will reside in the reforms of the subsidy and tariff systems and the increase in generation efficiency.
The investment costs into DGPVs include equipment purchase, installation, and grid connection costs ( C I N V ) and operation and maintenance expenses ( C O & M , t ). The purchase and installation costs for PV systems mainly include two parts: hardware costs (mainly including photovoltaic modules, inverters, stents, and lines) and soft costs (mainly including labor, profit margins, and design costs). The former accounts for 70% of the total cost, whereas the latter accounts for the remaining 30%. The cost of installing a DGPV system with a capacity of about 1–10 MW is about 7–10 CNY/W [6]. Grid connection costs include grid interconnection charges and service charges. Currently, no integration or service fees are charged from the grid as an incentive for investment.
According to Zhang et al. [6], maintenance costs C O & M , t are 0.1 CNY/kWh, which increase at a rate of 2.5% annually because of equipment deterioration. Costs can be annualized over the economic lifetime of the DGPV (e.g., 20 years) remunerating the capital with a rate r as shown in Equation (3). Furthermore, since C O & M , t are essentially annual costs, the total annualized cost C t can be calculated by Equations (3) and (4):
A V I = r C I N V 1 ( 1 + r ) n
C t = A V I + C O & M , t

3.3. DGPV Income

The average daily electricity production Ed depends on the average daily Globe Horizontal Radiation per month G H R ¯ d , the gain associated with the angle of the solar panels R G a i n , the area of panels A, and the energy conversion efficiency from radiation to electricity η s y s [28]:
E d = G H R ¯ d · R G a i n · A · η s y s
where η s y s can be divided into module efficiency η m and Performance Ratio (PR):
η s y s = η m · P R
For residential PV, PR mainly depends on the following de-ratings [28,32]:
P R = η s h · η I A M · η d e g · η t e m · η m i s · η s o i l · η n e t · η m p p · η i n v
where the efficiencies in Equation (7), from left to right, are power losses of nearby shadows, incident angle modifier, module degradation, temperature, mismatch effect, soiling effect, wiring, maximum power point, and inverter efficiency, respectively.
The PV module efficiency η m at standard test conditions (atmospheric mass (AM) 1.5, irradiance G H I 0 is a constant equal to 1000 W/m2, and battery temperature 25 °C) can be expressed as:
η m = p [ q G H I G H I 0 + ( G H I G H I 0 ) m ] · ( 2 + r + s )
In this work, the Kyocera LA361K51 module with parameters p = 15.39, m = 0.0794, q = −0.177, r = −0.09736, and s = −0.8998 was used.
Studies showed that the average monthly system efficiency η s y s decays over time due to the effect of the degradation of the modules from approximately +6% to –6%, with respect to the standard efficiency of the module, within a period of 20 years [28]. Since our study aimed at the generation of a PV module under a long-term timeframe, the mean η ¯ s y s can be used to determine the average monthly converted energy of the PVs without losing much information. Therefore, as an example, the monthly module efficiency for the Dongcheng District in Beijing is shown in Table 4.
Ed, or E m 30   E d , were used for simulation depending on the tariff system of the study.

3.4. Estimation of Investment Capacity

The effect of the integration of DGPV on the operation and planning of distribution systems varies with the increase in the integration capacity. Therefore, the benefit obtained from the integration of a DGPV also varies, which in return affects the investment into DGPVs. In this section, a model is built to estimate the investment capacity of the DGPV while considering the interaction between the development of DGPVs and the evolution of the distribution system.
The decision to invest in a DGPV project is determined by its economic feasibility, which is commonly reflected by IRR. IRR represents the discount rate that is expected to be achieved by the investment, which is the discount rate when the total amount of capital inflows is equal to the total amount of capital outflows (Net Present Value = 0). In general, the project is considered to be economically feasible when IRR is greater than or equal to the benchmark rate of return:
n = 0 N C n ( 1 + I R R ) n = 0
where C n represents net cash flow in year n (cash inflow minus cash outflow) and N represents the lifetime of the project.
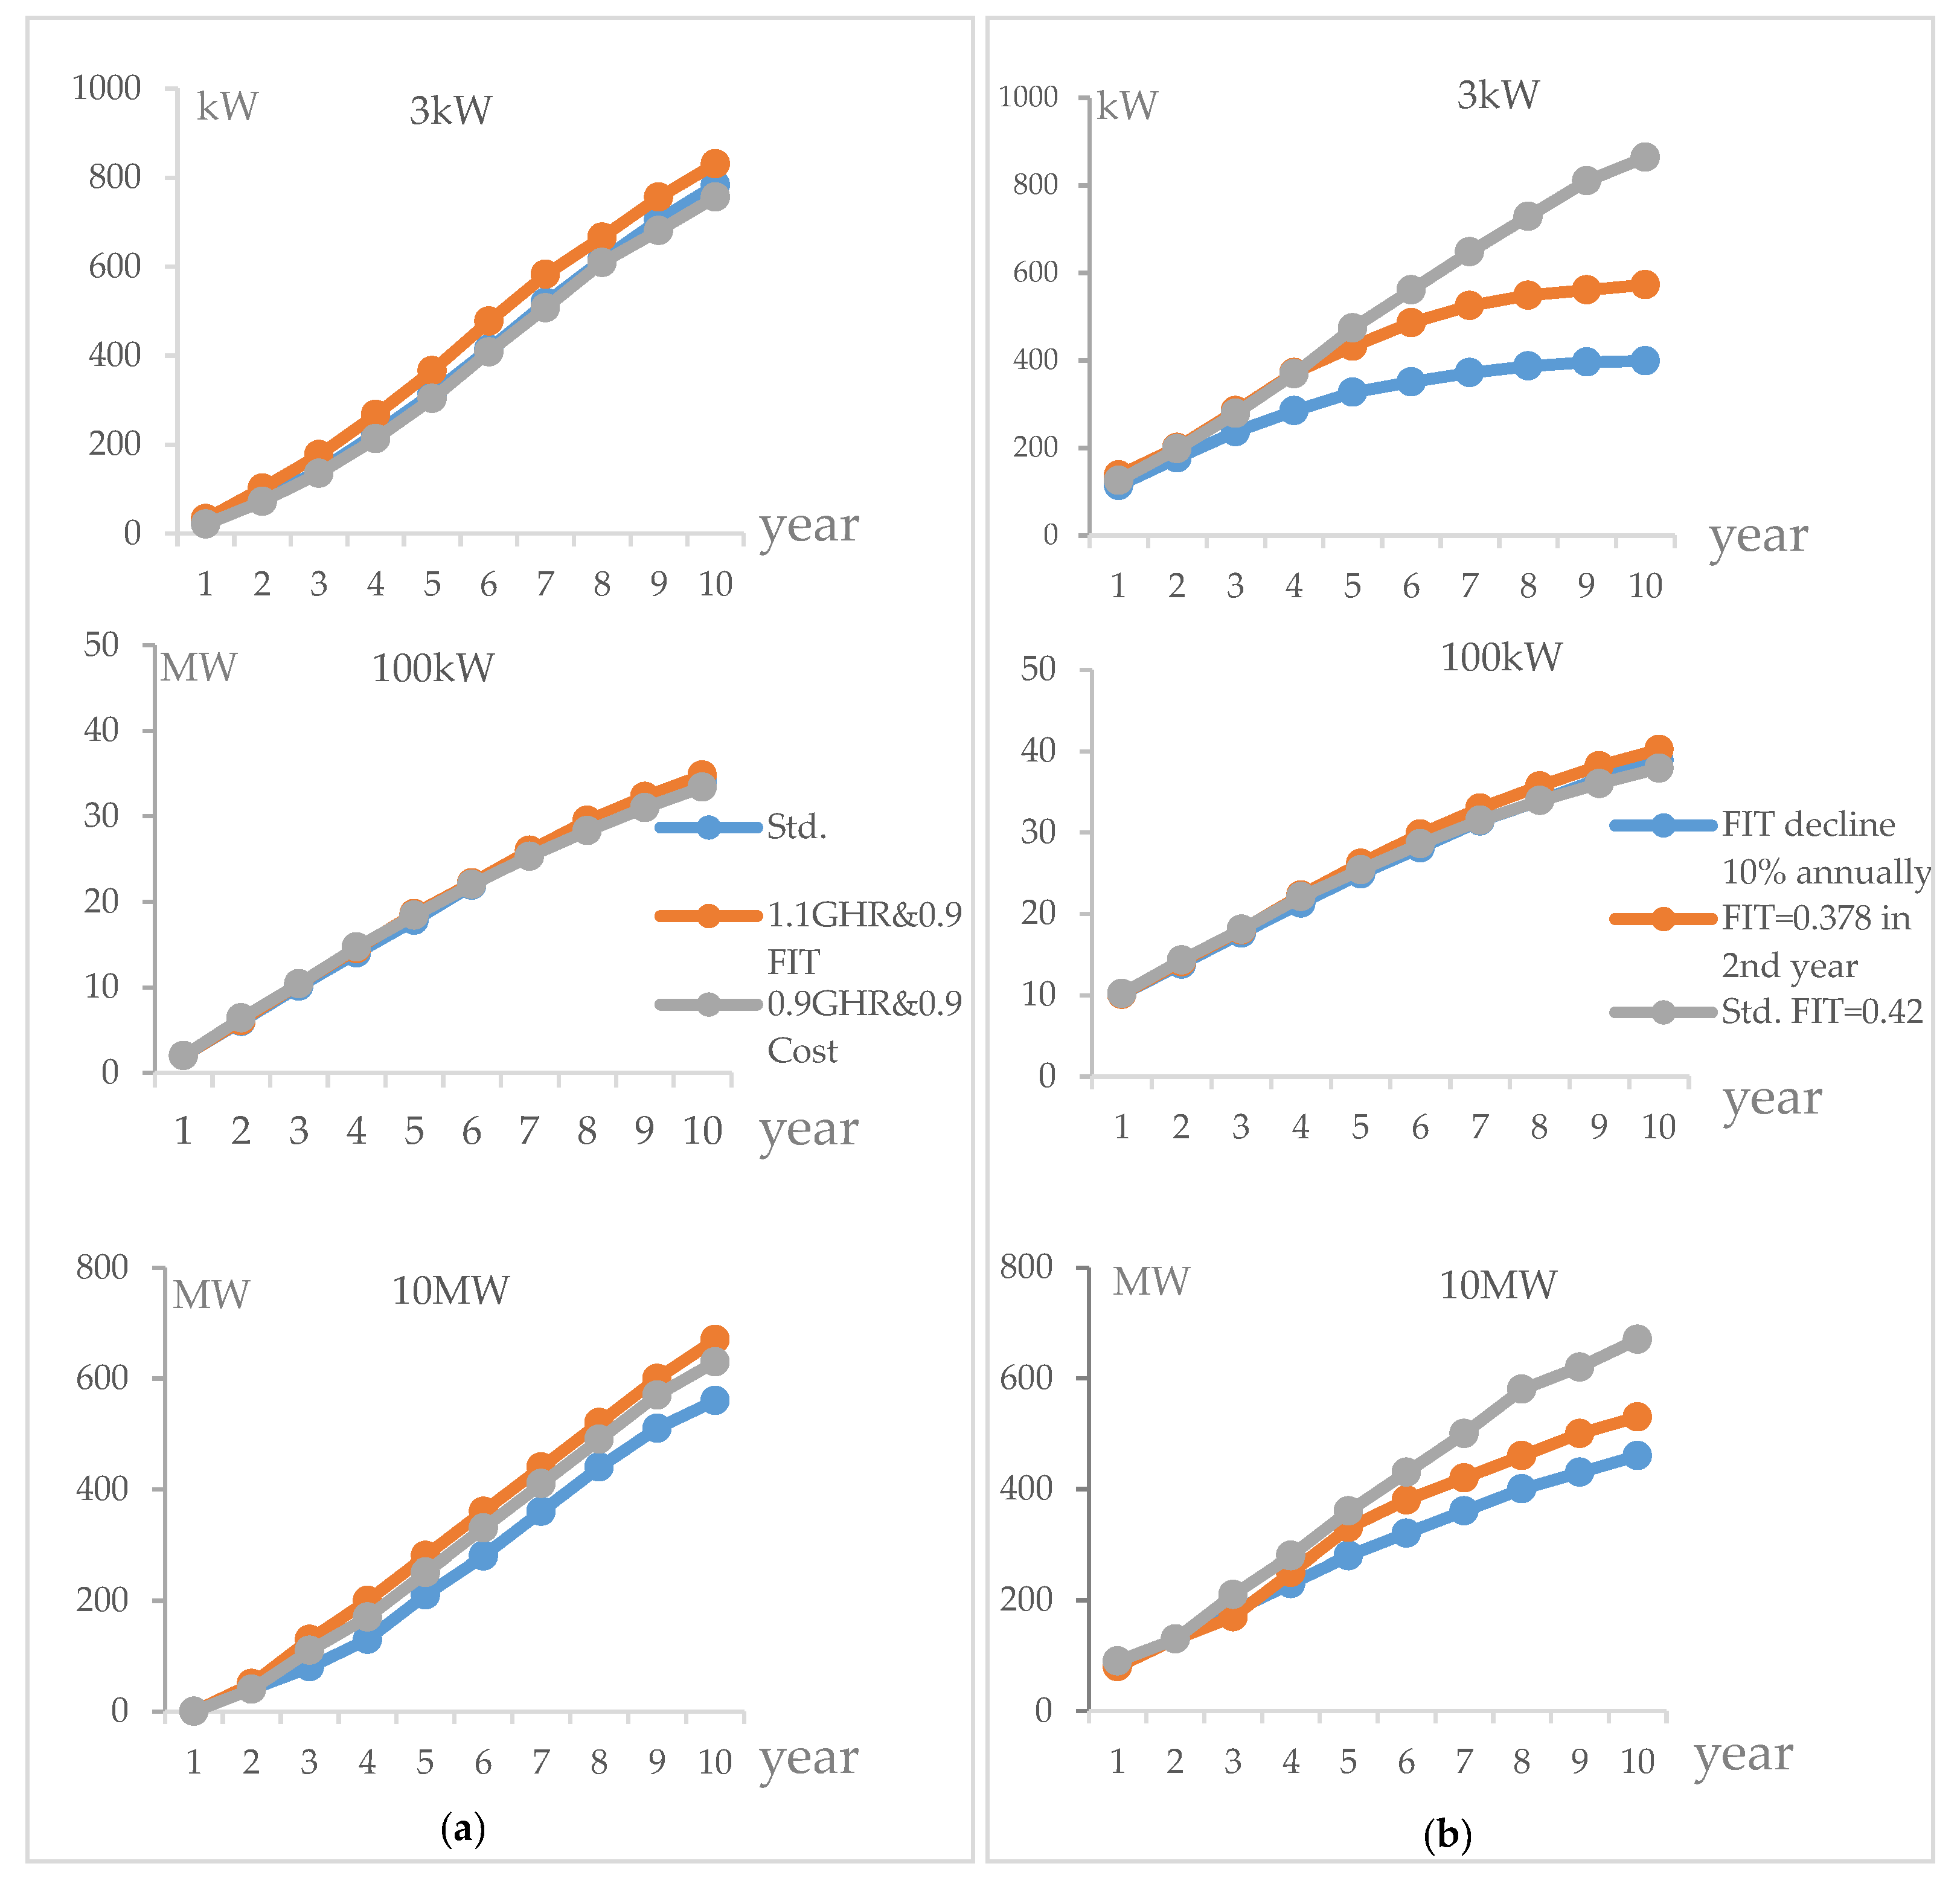
DGPVs with different capacities have different IRR. According to the classification of the investor and the related integration regulation in China, we created three capacity levels in this study: 3 kW, 100 kW, and 10 MW, to represent the typical capacity of a residential rooftop DGPV, small and medium industrial and commercial rooftop DGPV, and large enterprise or government-built DGPV projects. The 3 kW DGPV capacity was estimated according to the power consumption of typical household appliances outlined in Table 5.
The capacity of 10 MW was set according to the regulation of the state grid in China [6]. In this regulation, PV modules with a capacity of 10 MW or lower can be integrated into the low voltage side of a 10-kV system. DGPVs with a capacity greater than 10 MW will connect to the high voltage side of the transformer at the starting end of a 10-kV feeder, which has no effect on the reduction of network losses of the feeders. Therefore, we did not consider DGPVs with a capacity greater than 10 MW in this study. When IRR is used as a measure of the level of return of investment in distributed generations, investors of PV modules with different capacities have different minimum attractive rates of return (MARR), as displayed in Table 6.
The decision to invest is mainly decided by a project’s economic feasibility, which is affected by a city’s economic development, per capita income, awareness of technology, policies, etc. These factors determine the potential investor’s willingness to invest in DGPV. Figure 4 shows the model we built to estimate the investment capacity into DGPVs with consideration of the main factors that affect the decision and capacity of the investment. The population of the city decides the volume of the potential investors. Among the potential investors, part of them are willing to invest in DGPV projects. This percentage is decided by the five-year-averaged IRR of DGPV projects, MARR, and the popularity of the generation technology. However, being willing does not mean that the potential investor will invest in the project. In this study, we used the probabilistic method to simulate the uncertainty due to the subjectivity of potential investors. We used binomial sampling to sample people with investment willingness to decide the number of investors and the capacity of projects.

3.5. Potential Benefits from a Distribution System Perspective

Based on the assumptions about DGPV coordinated operation and management, distribution network, and load, the integration of DGPV entails multiple benefits, including the mitigation of energy shortages, reduction of network losses, decrease the loading level of the equipment, and the deferral of investments in the construction of the distribution network. Figure 5 outlines the benefits from the DGPV integration into the distribution network. In this study, we consider carbon emission benefit, line loss reduction benefit, and upgrade deferral benefit as examples. The distribution subsidy provided to DGPV investors from the distribution system side originate from these three benefits.

3.5.1. Carbon Emission Benefit

Carbon emission is considered representative of the emissions when studying the environmental benefits of DGPVs. The carbon emission benefit of DGPV (B0) is defined as the value of the carbon emission reduction of the annual generation of DGPV (equivalent generation of desulfurized coal-fired generator):
B 0 = E t · E M · P = I G C , m
where EM is the carbon emissions per kWh generation from coal-fired generator units (t/kWh) and P is the international carbon trading price (CNY/t). For example, the annual generation of 1 kW DGPV in the Beijing area [6] is 1364.884 kWh. The carbon emission per kWh generation by a coal-fired generator is 86.4725 g/kWh. If the international carbon-trading price is 107.5 CNY/t [6], the theoretical carbon emission value for a DGPV in the Beijing area is 12.7 CNY/year·kW.

3.5.2. Line Loss Deduction Benefit

The line loss deduction benefit ( B 1 ) per unit DGPV is mainly related to the amount of reduced losses (L), the wholesale price ( R d s ), and the total capacity of DGPV (S), calculated as:
B 1 = L × R d s S

3.5.3. Upgrade Deferral Benefit

The overload of feeders and transformers is the direct reason for upgrading a distribution system. When upgrading overloaded feeders, distribution companies have different upgrade mechanisms. When a feeder reaches its maximum loading, only upgrading the feeder and not its downstream networks is not economically sound. On the contrary, upgrading a larger part of the distribution network, including the heavy loaded feeder, will be more beneficial. Therefore, we used the following upgrade strategy [33]. The distribution network is divided into different feeder collections. If one feeder is heavy loaded, all feeders belonging to the same collection are upgraded at the same time. The deferral time of the feeder collection is estimated by the time differences between the feeder collection with DGPV and without DGPV when they reach the same loading level. The feeder collection of the test system used in this paper is shown in Figure A1, and the feeder collection configuration and upgrade cost are outlined in Table A1.
The upgrade deferral benefit of the investment mainly depends on the cost of network upgrade and the delay time [33]. After the integration of the DGPV, the equivalent load at the integration point decreases, thereby reducing the power transmission from the upstream feeders. The time during which the feeder or transformers are overloaded with the increase of load is delayed. The difference between the net present value of the postponed investment and the cost of the original planned investment, taking into account the time value of the funds, is the deferral value of the investment in the distribution network. The benefit of DG upgrade deferral ( B 2 ) can be expressed as:
B 2 = C S ( 1 1 e ρ t )
where C is the cost of upgrade of feeders, t is the delay time, S is the capacity of DGPV, and ρ is the interest rate.
Finally, the benefit from the integration of a DGPV is:
V a l u e = B 0 + B 1 + B 2
We assumed that part of the benefit obtained from DGPV integration can be converted into distribution network subsidies; therefore, the subsidy collected per unit DGPV, I d n s , from the distribution company is:
I d n s = β × V a l u e
where β is the return rate of benefits, which is decided by the distribution company. Even if β is 100%, within 10 years, the distribution network subsidies cannot replace the state subsidies [29]. Therefore, in this study, we assigned the value of 100% to β .

4. Case Study

4.1. Matching DG Power Generation and Loading Level of IEEE-13 Test System

The IEEE-13 Node Test Feeder (Figure A1) was used as the test system in this study. It not only includes common distribution equipment such as overhead lines, cables, shunt capacitors, and transformers, but also the typical characteristics of a distribution system with a high load rate and three-phase load imbalance. Therefore, although the IEEE-13 node system is small, it is sufficient as a small distribution network system, being widely used in a variety of distribution network simulation tests.
The DGPV annual power generation capacity, calculated according to the annual installed capacity of DGPV in an ordinary city, does not match the original parameters of the IEEE-13 system. Therefore, the actual DGPV installed capacity C r e a l must be multiplied by a certain coefficient φ (the matching coefficient) to obtain the installed capacity C f i t that is integrated into the IEEE-13 system for further simulation:
φ = C f i t C r e a l
For example, we used the installed capacity of DGPV in Beijing in 2014 (140 vMW) as C r e a l , then C f i t is:
C f i t = W D G P V W D G P V p e r
where W D G P V is the annual generation of the DGPVs in the IEEE-13 system, W D G P V p e r is the annual generation per unit DGPV, and:
W D G P V = W A × α 1 × α 2
where W A represents the total annual generation of the system, α 1 represents the proportion of the annual generation of all PV modules to the annual generation of the system, which is 0.4% in this example, and α 2 indicates the proportion of the annual generation capacity of all DGPVs to the annual generation capacity of all PVs, which is 47% in this example. Therefore, the matching coefficient for Beijing is φ = 1.95 × 10 4 .

4.2. Standardized Sensitivity Analysis for DGPV Investment Model

From Figure 4, the main DG investment decision model parameters include (retail) electricity price (EP), installation cost, self-consumption ratio (Aself), FIT, MARR and GHR. To observe the sensitivity of DG investment willingness to the variation in any single parameter, we conducted a sensitivity analysis. The parameters for a standard case (the column labelled as “standard” in Table 7) is shown in Table 8. Only one parameter varies in each simulation in the group (+10% or −10%) from the standard case, and other parameters remain unchanged. According to the DGPV definition, self-consumption is promoted. From the estimation of daily electricity consumption of household appliances provided in Table 5, the electricity consumption of refrigerators, drinking machines, and air conditioning accounts for over 70% of the daily electricity consumption. According to the retail prices and purchasing prices in the Beijing area, the higher the consumption rate, the higher the IRR [6]. Without restrictions on the self-consumption rate, higher consumption rates will be preferred to achieve a higher IRR. Therefore, we chose a self-consumption rate of 0.8 for the DGPVs with three different capacities in this study.
The sensitivity of the five-year averaged IRR, total number of potential DGPV investors, and cumulative investment capacity due to the changes in parameters are shown in Figure 6. The y-axis is the relative variation of the output of the control groups from the output of the standard case.
From the standardized sensitivity analysis: (1) Investments into the three different capacities are most sensitive to changes in the capital investment in a PV system (cost) and GHR, followed by MARR, FIT, and electricity tariff (EP). (2) Comparison shows that, in terms of cumulative investment capacity, investments into 10 MW DGPV are more sensitive to the variation in capital investment (cost) and GHR, followed by investments of 10 MW and 100 kW. Investors of 100-kW DGPV are less sensitive to the reduction of FIT than those in the other two categories. Therefore, to fully promote the development of DGPV, different FIT could be designed for 3 kW and 100 kW investors. For example, state subsidies of residential DGPV (3 kW) increase accordingly, whereas those for 100-kW DGPV decrease accordingly.

4.3. Sensitivity Analysis of Long-Term Effect of FIT, GHR, and Cost

In this subsection, we compare the following cases to determine the impact of a downward FIT on the development of DGPVs. We provide the FIT, GHR, and investment costs for different cases in Table 9. In 2017, a new regulation on the state subsidy of DGPVs was issued [18]. From the second year of investment, FIT decreased to 0.378 CNY/kWh. Case 1 is designed according to this change in FIT.
The simulation results are provided in Figure 7, showing that: (1) In areas with a 10% higher GHR, the FIT decline scheme does not cause significant decrease in the accumulative capacity of DGPVs. For the 3 kW and 100 kW categories, the DGPV on-grid capacity at the end of 10th year is even slightly more than of the standard case. (2) In area with a 10% lower GHR, when FIT remains at 0.42 CNY/kWh and capital investment decreases by 10%, the on-grid capacity at the end of the 10th year had no significant changes compared to the standard case. Specifically, 10 MW projects are not sensitive to the decline in the FIT subsidy, but sensitive to the decrease in capital investment. Therefore, in this case, even in lower GHR areas, the cumulative integration capacity outweighs the standard case. (3) By comparing the standard case, case 1, and case 2, without subsidies from other sources, the decrease in the FIT scheme affects the investment into 3 kW DGPV the most, followed by the 10 MW category. The investment into 100 kW is affected the least, because the economic infeasibility of 10 MW projects turns more investors to 100 kW projects.

4.4. Long-Term Effect of FIT and Distribution Network Subsidy

Figure 8 shows the changes in the development of DGPV under a compound subsidy of FIT and a distribution subsidy. FIT = 0 means only the distribution network provides a subsidy by considering the value of emission reduction, line loss reduction, and upgrade deferral. No state subsidy is considered. FIT = 0.42 CNY/kWh means only a state subsidy is provided.
During the first simulation year, because the integration capacity is small and the deferral benefit is large, the integration benefit is relative large. As the integration capacity grows, the distribution benefit stabilizes, as shown in Figure 8a. Figure 8b shows that the distribution benefit can replace 20% of the FIT for the cumulative on-grid DGPV capacity (including all three different capacity categories) to reach the same on-grid integration scale as that of the base case with no distribution benefit and FIT = 0.42 CNY/kWh. Figure 8c–e show the increase in integration capacity of each capacity category in detail. With a distribution benefit, the on-grid capacity of the 3 kW and 10 MW DGPVs can reach the same level at the end of the 10th year when FIT is reduced by 10%. Even when FIT is reduced by 50%, with a distribution benefit, the on-grid capacity of the 100 kW DGPV still attains the same capacity.

5. Conclusions

We have established an event-driven co-simulation platform to study the evolution of ADN under a long-term timeframe. In detail, the simulation platform includes a DGPV investor investment model, an ADN model at different stages with different demands, and the cumulative integration capacity of DGPVs, and the corresponding distribution upgrade, calculation of the distribution benefit due to the DGPV integration, the changes on state subsidy, and the growth of the city.
We analyzed the sensitivity of the main influencing factors to the investment decision model, and concluded that investments into 3 kW DGPV projects are most sensitive to changes in parameters. If GHR, costs, FIT, and electricity prices change slightly, investments in 3 kW DGPV will fluctuate significantly. Investments in 100 kW DGPV are less sensitive to the changes in all factors. Differentiating FIT is recommended for DGPVs with different capacities or investors in different areas. From a long-term viewpoint, the distribution network subsidy can replace 10–20% of the FIT for the integration capacity to reach the same level in a 10-year time period. A rapidly declining FIT can be feasible only when the same proportion of reduction is achieved in the investment costs.

Author Contributions

All authors have worked on this manuscript together and all authors have read and approved the final manuscript. H.R., C.S. and Z.M. established the model; C.S. and J.C. performed the simulations; H.R., D.W., J.L. and F.W. analyzed the data; H.R. and C.S. wrote the paper.

Funding

David Watts thanks the financial support provided by CORFO (Corporación de Fomento de la Producción) under the project 13CEI2-21803, Center for Solar Energy Technology FCR—CSET (Centro de Tecnologías para Energía Solar) and Research Grant CONICYT/FONDAP/15110019 and CONICYT/ FONDECYT/1181136.

Acknowledgments

This work was supported partially by National Natural Science Foundation of China (Grant No. 51577067), the National Key Research and Development Program of China (Grant No. 2018YFB0904203), the Beijing Natural Science Foundation of China (Grant No. 3162033), the State Key Laboratory of Alternate Electrical Power System with Renewable Energy Sources (Grant Nos. LAPS18008), the Science and Technology Project of State Grid Corporation of China (SGCC), the Open Fund of State Key Laboratory of Operation and Control of Renewable Energy & Storage Systems (China Electric Power Research Institute) (No. 5242001600FB).

Conflicts of Interest

The authors declare that the grant, scholarship, and/or funding mentioned in the Acknowledgments section do not lead to any conflict of interest. Additionally, the authors declare that there is no conflict of interest regarding the publication of this manuscript.

Appendix A

Figure A1. The feeder collection of IEEE-13 system for system upgrade in this study [33].
Energies 11 01291 g0a1
Table A1. Feeder collection configuration and upgrade cost.
Feeder GroupPhase SequenceLength (m)Single Feeder Capacity Before/After UpgradeUpgrade Cost (CNY/kW)Cost (104 CNY)
1BACN1219.2 × 6730/10953357294.0732
2CBN243.84 × 4230/340158241.7648
3CABN152.4 × 3340/530143765.5272
4ABCN152.4 × 3329/483143753.11152
5CAN91.44 × 2230/340136035.904
6CN91.44230/340133435.2176
7AN243.84310/32913776.27912

References

  1. Kannan, N.; Vakeesan, D. Solar energy for future world: A review. Renew. Sustain. Energy Rev. 2016, 62, 1092–1105. [Google Scholar] [CrossRef]
  2. Shafiee, S.; Topal, E. When will fossil fuel reserves be diminished? Energy Policy 2009, 37, 181–189. [Google Scholar] [CrossRef]
  3. Zhang, D.; Wang, J.; Lin, Y.; Si, Y.; Huang, C.; Yang, J.; Huang, B.; Li, W. Present situation and future prospect of renewable energy in China. Renew. Sustain. Energy Rev. 2017, 76, 865–871. [Google Scholar] [CrossRef]
  4. Chen, Q.; Wang, F.; Hodge, B.M.; Zhang, J.; Li, Z.; Shafie-khah, M.; Catalão, J.P.S. Dynamic price vector formation model-based automatic demand response strategy for PV-Assisted EV charging stations. IEEE Trans. Smart Grid 2017, 8, 2903–2915. [Google Scholar] [CrossRef]
  5. National Development Reform Commission (NDRC). Notice about Playing the Role of the Price Lever to Promote the Healthy Development of Photovoltaic Industry. Available online: http://www.ndrc.gov.cn/zcfb/zcfbtz/201308/t20130830_556000.html (accessed on 16 May 2018). (In Chinese)
  6. Zhang, F.; Deng, H.; Margolis, R.; Su, J. Analysis of distributed-generation photovoltaic deployment, installation time and cost, market barriers, and policies in China. Energy Policy 2015, 81, 43–55. [Google Scholar] [CrossRef]
  7. National Grid Company. Notice on Providing Grid Connection Service for DG PV Projects (Provisional). Available online: http://xxgk.yichun.gov.cn/ycgdgs/xxgk/gzdt/gggs/201210/t20121029_198172.html (accessed on 16 May 2018). (In Chinese)
  8. National Energy Agency (NEA). Notice on Further Implementation of Policies Relevant to Distributed Photovoltaic Power Generation. Available online: http://zfxxgk.nea.gov.cn/auto87/201409/t20140904_1837.htm (accessed on 16 May 2018). (In Chinese)
  9. Zhang, S.; He, Y.X. Analysis on the development and policy of solar PV power in China Renew. Sustain. Energy Rev. 2013, 21, 393–401. [Google Scholar] [CrossRef]
  10. Wang, F.; Mi, Z.; Su, S.; Zhao, H. Short-term solar irradiance forecasting model based on artificial neural network using statistical feature parameters. Energies 2012, 5, 1355–1370. [Google Scholar] [CrossRef]
  11. Wang, F.; Zhen, Z.; Mi, Z.; Sun, H.; Yang, G.; Su, S. Solar irradiance feature extraction and support vector machines based weather status pattern recognition model for short-term photovoltaic power forecasting. Energy Build. 2015, 86, 427–438. [Google Scholar] [CrossRef]
  12. Wang, F.; Zhen, Z.; Liu, C.; Mi, Z.; Hodge, B.-M.; Shafie-khah, M.; Catalão, J.P.S. Image phase shift invariance based cloud motion displacement vector calculation method for ultra-short-term solar PV power forecasting. Energy Convers. Manag. 2018, 157, 123–135. [Google Scholar] [CrossRef]
  13. Sun, Y.; Wang, F.; Wang, B.; Chen, Q.; Engerer, N.A.; Mi, Z. Correlation feature selection and mutual information theory based quantitative research on meteorological impact factors of module temperature for solar photovoltaic systems. Energies 2017, 10, 7. [Google Scholar] [CrossRef]
  14. Wang, F.; Zhou, L.; Ren, H.; Liu, X.; Talari, S.; Shafie-khah, M.; Catalao, J.P.S. Multi-objective Optimization Model of Source-Load-Storage Synergetic Dispatch for Building Energy System Based on TOU Price Demand Response. IEEE Trans. Ind. Appl. 2018, 54, 1017–1028. [Google Scholar] [CrossRef]
  15. Wang, F.; Li, K.; Liu, C.; Mi, Z.; Shafie-khah, M.; Catalao, J.P.S. Synchronous Pattern Matching Principle Based Residential Demand Response Baseline Estimation: Mechanism Analysis and Approach Description. IEEE Trans. Smart Grid 2018, 3053, 1–13. [Google Scholar] [CrossRef]
  16. Marinic-Kragic, I.; Nizetic, S.; Grubisic-Cabo, F.; Papadopoulos, A.M. Analysis of flow separation effect in the case of the free-standing photovoltaic panel exposed to various operating conditions. J. Clean. Prod. 2018, 174, 53–64. [Google Scholar] [CrossRef]
  17. Chen, Z.S.; Su, S.I. Photovoltaic supply chain coordination with strategic consumers in China. Renew. Energy 2014, 68, 236–244. [Google Scholar] [CrossRef]
  18. Jo, J.H.; Loomis, D.G.; Aldeman, M.R. Optimum penetration of utility-scale grid-connected solar photovoltaic system in Illinois. Renew. Energy 2013, 60, 20–26. [Google Scholar] [CrossRef]
  19. Yuan, J.; Sun, S.; Zhang, W.; Xiong, M. The economy of distributed PV in China. Energy 2014, 78, 939–949. [Google Scholar] [CrossRef]
  20. National Development Reform Commission (NDRC). Regulation on the FIT of PV Generation; No. 2196 Price Regulation. Available online: http://www.ndrc.gov.cn/zcfb/gfxwj/201712/t20171222_871322.html (accessed on 16 May 2018). (In Chinese)
  21. Guo, X.; Guo, X. China’s photovoltaic power development under policy incentives: A system dynamics analysis. Energy 2015, 93, 589–598. [Google Scholar] [CrossRef]
  22. Han, J.; Tan, Z. Models for evolution of China electricity system in long run. Syst. Eng. Theory Pract. 2010, 30, 1521–1529. [Google Scholar]
  23. Jeon, C.; Shin, J. Long-term renewable energy technology valuation using system dynamics and Monte Carlo simulation: Photovoltaic technology case. Energy 2014, 66, 447–457. [Google Scholar] [CrossRef]
  24. Cohen, M.A.; Callaway, D.S. Effects of distributed PV generation on California’s distribution system, Part 1: Engineering simulations. Sol. Energy 2016, 128, 126–138. [Google Scholar] [CrossRef]
  25. Cohen, M.A.; Kauzmann, P.A.; Callaway, D.S. Effects of distributed PV generation on California’s distribution system, part 2: Economic analysis. Sol. Energy 2016, 128, 139–152. [Google Scholar] [CrossRef]
  26. Statistics of Population Growth Rate in China in 2014. Available online: http://data.stats.gov.cn/easyquery.htm?cn=C01&zb=A0302&sj=2014 (accessed on 26 March 2016).
  27. Li, W. Risk Analysis of Power Systems—Models, Methods, and Applications; John Wiley & Sons: Hoboken, NJ, USA, 2005. [Google Scholar]
  28. Bustos, C.; Watts, D.; Ayala, M. Financial risk reduction in photovoltaic projects through ocean-atmospheric oscillations modeling. Renew. Sustain. Energy Rev. 2017, 74, 548–568. [Google Scholar] [CrossRef]
  29. Sun, C.; Ren, H.; Mi, Z.; Watts, D.; Zhou, J. The Long-Term Effect of Incentives on the Development of DGPV Considering the Interaction among DGPV’s Investors and Distribution System; ISGT: Torino, Italy, 2017. [Google Scholar]
  30. PV-Tech. NRDC Document Resource Center. Available online: http://www.sdpc.gov.cn/ (accessed on 23 May 2017).
  31. Chinese Renewable Energy Industry Association. 2014. Available online: http://www.chnreia.org/fagui/ (accessed on 25 May 2017).
  32. Brown, C.; Guichard, A.; Lyons, D. Analysis of the potential for wind and solar energy systems in Antarctica. Engineering 1996, 18, 111–124. [Google Scholar]
  33. Gil, H.A.; Joos, G. On the Quantification of the Network Capacity Deferral Value of Distributed Generation. IEEE Trans. Power Syst. 2006, 21, 1592–1599. [Google Scholar] [CrossRef]
Figure 1. Event-driven co-simulation framework for the evolution of an active distribution network (ADN).
Energies 11 01291 g001
Figure 2. Factors that affect distributed photovoltaic system (DGPV) investment. The dashed line indicates the relationship being studied in this paper.
Energies 11 01291 g002
Figure 3. Average global weighted total system costs breakdown for utility-scale solar photovoltaic (PV) systems, 2009–2025.
Energies 11 01291 g003
Figure 4. DGPV investment model.
Energies 11 01291 g004
Figure 5. Benefits of DGPV integration into the distribution network.
Energies 11 01291 g005
Figure 6. Standardized sensitivity analysis results. (a) 3 kW; (b) 100 kW; (c) 10 MW.
Energies 11 01291 g006aEnergies 11 01291 g006b
Figure 7. Long-term effect of parameter changes on cumulative DGPV integrated capacity for a period of 10 years. (a) The comparison of standard case, case 3, and 4; (b) the comparison of standard case, case 1, and 2.
Energies 11 01291 g007
Figure 8. (a) Integration benefit of DGPV, (b) the cumulative integrated capacity of DGPVs, and (ce) the accumulative integration capacity of the three capacity categories. In (a), “Dis. B” means distribution benefit.
Energies 11 01291 g008
Table 1. Event and update cycles.
EventUpdate CycleDescription
1. External condition update1 yearPopulation, cost of PV panels, etc.
2. Policy/subsidy changeN/AReview the evolution of ADN under specific policy/subsidy over a 10-year period
3. Air quality update1 yearRenew the air quality index based on net emission reductions
4. DG investment decision3 monthsDetermine the number and capacity of DG investment projects
5. DG capacity update3 monthsConstruction time for a 3 kW DGPV
6. Load increase3 months-
7. Operation of distribution system1 hSimulate the operation of distribution network under ever-changing conditions
8. Benefit of DGs’ integration1 yearBe calculated according to the change in power flow distribution when the integrated capacity of DGPVs changes
Table 2. Variation in parameters during the simulation.
Annually Changed FactorsTrendPercentage and Explanation
PopulationUp+0.5%/year [26]
Load demandUp+2%/year [27]
O & M costsUp+2.5%/year [6]
Electricity priceUp+1%/year, based on historical data [6]
Investment of distributed PV panelsDownPredicted based on the two-factor learning curve [23]
Population interested in new technology Up+5% to reflect the increase of awareness of new technology
Table 3. List of subsidy policies for typical cities in China.
City/ProvinceNational Subsidy (CNY/KWh)Provincial Subsidy (CNY/Kwh)Upfront Subsidy (CNY/W)GHI AreaNote
Jiangxi0.420.23–44180–5016, Level 4-
Shandong0.78 5016–5852, Level 3-
Henan-0.15016–5852, Level 3-
Anhui0.2524180–5016, Level 4-
Jiangsu0.73-5016–5852, Level 3-
Hebei0.78-5016–6680, Level 3-2-
Shanghai0.25–0.55-4180–5016, Level 4-
Zhejiang0.10.350.34180–5016, Level 45% investment refund
Shanxi0.050.15016–6680, Level 3-2Tax refund
Beijing-0.35852–6680, Level 2-
Guangzhou-0.25016–5852, Level 3-
Table 4. Monthly photovoltaic (PV) module efficiency η m (Dongcheng District, Beijing).
Month G H R m (kWh/m2/Month) G H I (W/m2) η m (%)Wind Velocity (m/s) η s y s
Jan73.47102.0414.452.111.47%
Feb90.44125.6115.032.311.93%
Mar131.44182.5616.32.512.94%
Apr153.6213.3316.942.713.45%
May183.21254.4617.772.614.11%
Jun173.7241.2517.512.313.90%
Jul155.31215.7116.991.913.49%
Aug145.39201.9316.711.813.27%
Sep131.1182.0816.291.812.93%
Oct105.09145.9615.52.012.31%
Nov73.2101.6714.441.811.46%
Dec63.2487.8314.081.811.18%
Table 5. Daily electricity consumption of household appliances for two to four people in 100 m2 in China.
Household AppliancesPower (kW) × Daily Use Time (h)
Refrigerator0.035 × 24
Drinking machine (single hot)0.032 × 24
Air conditioning (cold and warm) × 21.6 × 8
TV0.22 × 4
Lighting × 40.2 × 4
Desktop computer0.25 × 3
Electric water heater 50 L1 × 1
Rice cooker 5 L0.8 × 1
Microwave oven0.8 × 1
Washing machine0.25 × 1
Table 6. Parameter setting of three specifications DGPV [6].
CapacityMARRCostConstruction Time
3 kW8%9.5 CNY/W3 months
100 kW9%9 CNY/W6 months
10 MW10%8.5 CNY/W12 months
Table 7. Parameters for sensitivity analysis of investment model.
ParameterStandard (Std)Control Group
GHR G H R B e i j i n g G H R B e i j i n g ± 10 %
EPDepends on time E P B e i j i n g ± 10 %
CostDepends on type C o s t B e i j i n g ± 10 %
Aself0.80.88/0.72
FIT0.42 CNY/kWh0.462/0.378 CNY/kWh
MARR0.10.11/0.09
Table 8. Related parameters of the standard case.
ParameterSetting
Percentage of self-consumption0.8
Life time of PV25 years
Power factor of PV0.9
Maintenance of PV0.1 CNY/kWh
Retail tariffResidential and commercial tariff in Beijing
Matching factor of DGPV capacity1.95 × 10–4, a factor to scale the integration capacity of DGPV of Beijing area to IEEE-13 system
Population7016, scaled according to IEEE-13 system
Policy awareness0.6
P E , m ¯ 0.3754 CNY/kWh
Wholesale tariff0.513875 CNY/kWh (average tariff for non-agriculture consumer in Beijing)
Inverter Cost0.8 CNY/kW (10-year life time)
Carbon emission value in Beijing12.7 CNY/Year·kW
Table 9. Parameter settings for sensitivity analysis of the long-term effects of the feed-in tariff (FIT), global horizontal radiance (GHR), and cost. No distribution subsidy is considered.
CasesFITGHRCost
Standard0.42 CNY/kWh G H R B e i j i n g C s t d , depends on the type
Case 10.37 CNY/kWh for the second year of investment, then remains unchanged [20] G H R B e i j i n g C s t d
Case 2FIT decline scheme G H R B e i j i n g C s t d
Case 3FIT decline scheme G H R B e i j i n g + 10 % C s t d
Case 40.42CNY/kWh G H R B e i j i n g 10 % C s t d   10 %
FIT decline scheme: FIT is 0.42 CNY/kWh during the first year of investment, then decreases by 10% annually.

