Architecture Optimization of Hybrid Electric Vehicles with Future High-Efficiency Engine


State Key Laboratory of Automotive Simulation and Control, Jilin University, Changchun 130025, China
*
Author to whom correspondence should be addressed.
Energies 2018, 11(5), 1148; https://doi.org/10.3390/en11051148
Submission received: 27 March 2018
/
Revised: 18 April 2018
/
Accepted: 1 May 2018
/
Published: 4 May 2018
(This article belongs to the Special Issue The International Symposium on Electric Vehicles (ISEV2017))
Abstract
:The great development of engine technologies can help to improve the engine characteristics and performance: a better thermal efficiency and an extending fuel economy area, which will subsequently decrease the fuel consumption and thus influence the overall architecture of the vehicle. In this paper, an investigation is carried out to assess the influence of the high-efficiency engine on the transmission gear numbers. First, according to the relevant studies and the integration of the advanced engine technology, a future engine fuel consumption map is obtained, based on which, the preliminary simulations are applied to explore the best match between the transmission and the proposed future engine from the perspective of fuel consumption. The simulation results indicate that the transmission with four gears is the best option to match the future engine while maintaining good fuel economy and meeting the driving demands. Then, based on this conclusion, a new hybrid powertrain architecture, which includes four gears for the engine, is introduced and analyzed in detail, with the advantage of seamless gear shift due to the compensation torque of the motor. Finally, to further examine the fuel economy and gear shift quality of the proposed powertrain, the dynamic model is established and the simulation results demonstrate that the new powertrain architecture shows a good fuel consumption performance and the gear shift process can be achieved without power interruption.
1. Introduction
The internal engine, as an important power source in our daily life, successfully transfers the energy stored in the fossil fuel into the power and energy required for the mobile applications. However, as non-renewable energy resources, the fuel storage and availability on the planet are limited and the increasing depletion has aroused people’s attention [1], which in return inspires and motivates automotive companies to focus on the advanced engine technologies to improve the engine characteristics. Besides, hybrid electric vehicle (HEV), combining the merits of motor and engine, also shows a promising potential of fuel-saving capacity [2,3,4]. When the vehicle operates in a low load and in low speed conditions, only the motor supplies the required torque, and in the high load and high speed conditions, both the motor and engine get involved in the operation to satisfy the power requirements.
As for the improvements of the engine performance, numerous actions have been done, such as the optimization of engine structure and the utilization of advanced and sophisticated control strategies. Atkinson cycle is the most commonly used technology, where more energy is transferred into the useful work, especially for hybrid electric vehicles, which can compensate for the weakness of the Atkinson engine through the help of motor [5,6]. Apart from the Atkinson cycle, other technologies, such as the cooled exhaust gas recirculation (EGR) and optimized cylinder structure are also helpful to enhance the efficiency. Some of the technologies are fully explored and exploited by the relevant automobile companies such as Toyota (Toyota, Aichi, Japan), Honda (Minato City, Tokyo, Japan), Chevrolet (Detroit, MI, USA), Mazda (Fuchu, Hiroshima, Japan), Hyundai (Seoul, South Korea) and Kia (Seoul, South Korea) et al. The engine designed by Honda R&D Co. Ltd. (Tokyo, Japan) could achieve 38.9% thermal efficiency and operation at a compression ratio of 17 and an EGR rate above 30% could achieve the target brake thermal efficiency of 45% [7,8]. Hyundai and Kia Corp. also claimed that the new Kappa 1.6 L gasoline direct injection (GDI) engine could obtain the engine thermal efficiency of almost 40% [9]. In addition, as to engines with different specifications and displacements, Toyota Motor Corp. applied different methods and technologies to improve the fuel consumption characteristics [10]. According to the results, the area with low fuel consumption extended greatly and a better brake specific fuel consumption (BSFC) value was obtained, thus the engine thermal efficiency was further enhanced, and even 45% engine thermal efficiency was achieved with the technology of the lean boosted concept [11].
In addition to conventional spark ignition (SI), low temperature combustion (LTC) is promising to improve the fuel economy, especially for the HEVs, where the powertrain electrification can offer extra power to drive the vehicle and decouple the engine and the vehicle, facilitating the engine to work in a high-efficiency area. A great amount of work has been done to explore the LTC engines from various aspects. In [12,13], a homogeneous charge compression ignition (HCCI) engine was utilized in a series HEV, and three kinds of energy management controls (EMC) were designed to investigate their influence on the fuel economy of series HEVs. In [14], a dual-fuel, reactivity controlled compression ignition (RCCI) engine was used in a series HEV to estimate the influence on fuel economy and emissions performance. Solouk, A. et al. applied a HCCI/RCCI/SI multi-mode engine in a series extended range electric vehicle, and the results under city driving cycle showed that the multi-mode engine had a better fuel economy compared with the engines which had only one combustion mode [15]. Similarly, for a mild HEV, a multimode engine (SI/HCCI) was also applied by Nuesch, S. et al. [16]. In addition, the HCCI/RCCI/SI engines were integrated with parallel hybrid electric configurations in [17,18] to select the optimal electrification level.
Nowadays, electro-mechanical compound hybrid transmission is another effective way to improve the overall vehicle performance. Due to the characteristics of fast response, wide speed range and pollution-free, the motor is suitable to serve as another power source for the HEVs. Commonly, the HEVs can be divided into three types: series configuration, parallel configuration and parallel-series combined configuration [19,20,21,22,23], and extensive research has been done to improve the performance of these HEVs, such as drivability [23], fuel economy and emissions [24]. In [25], a novel powertrain architecture for the HEV is proposed and the full utilization of its function investigated. Except for these HEV architectures, from the viewpoint of industrial application, Toyota hybrid system (THS), which currently is the best-selling and leading hybrid system, realizes the transmission function through the planetary gear set. Similarly, two planetary gear sets are adopted by General Motors to accomplish the powertrain function [26]. Moreover, a new sports hybrid series is developed by the Honda R&D Co., Ltd. to realize a better fuel efficiency [27]. Compared with the powertrain architectures mentioned above, automated manual transmission (AMT), with a much simpler structure and lower cost, has a higher efficiency of 92–98% [28]. Therefore, taking these merits into account, AMT is still a good choice for the HEVs.
Generally speaking, the appropriate match between the engine and the transmission can increase the engine efficiency, reduce the fuel consumption and enhance the powertrain performance. How to optimize the integration between the advanced future engine and various kinds of HEV configurations is also a research hotspot. In [29,30], engines with high efficiency were applied on numerous vehicles with different powertrain configurations, and the results depicted that with the increase of hybridization, HEVs could provide more opportunities for engines to operate in higher efficiencies. From the overall findings in [31], the optimal gear selection is highly dependent on vehicle and engine application. In [32], a range of hypothetical gasoline engines with lower and wider BSFC contours in the core operating region were created, and the influence of these hypothetical engines on the transmission gear selection was conducted, as well as the fuel consumption improvement.
Based on the research mentioned above, this paper mainly focuses on the following two points:
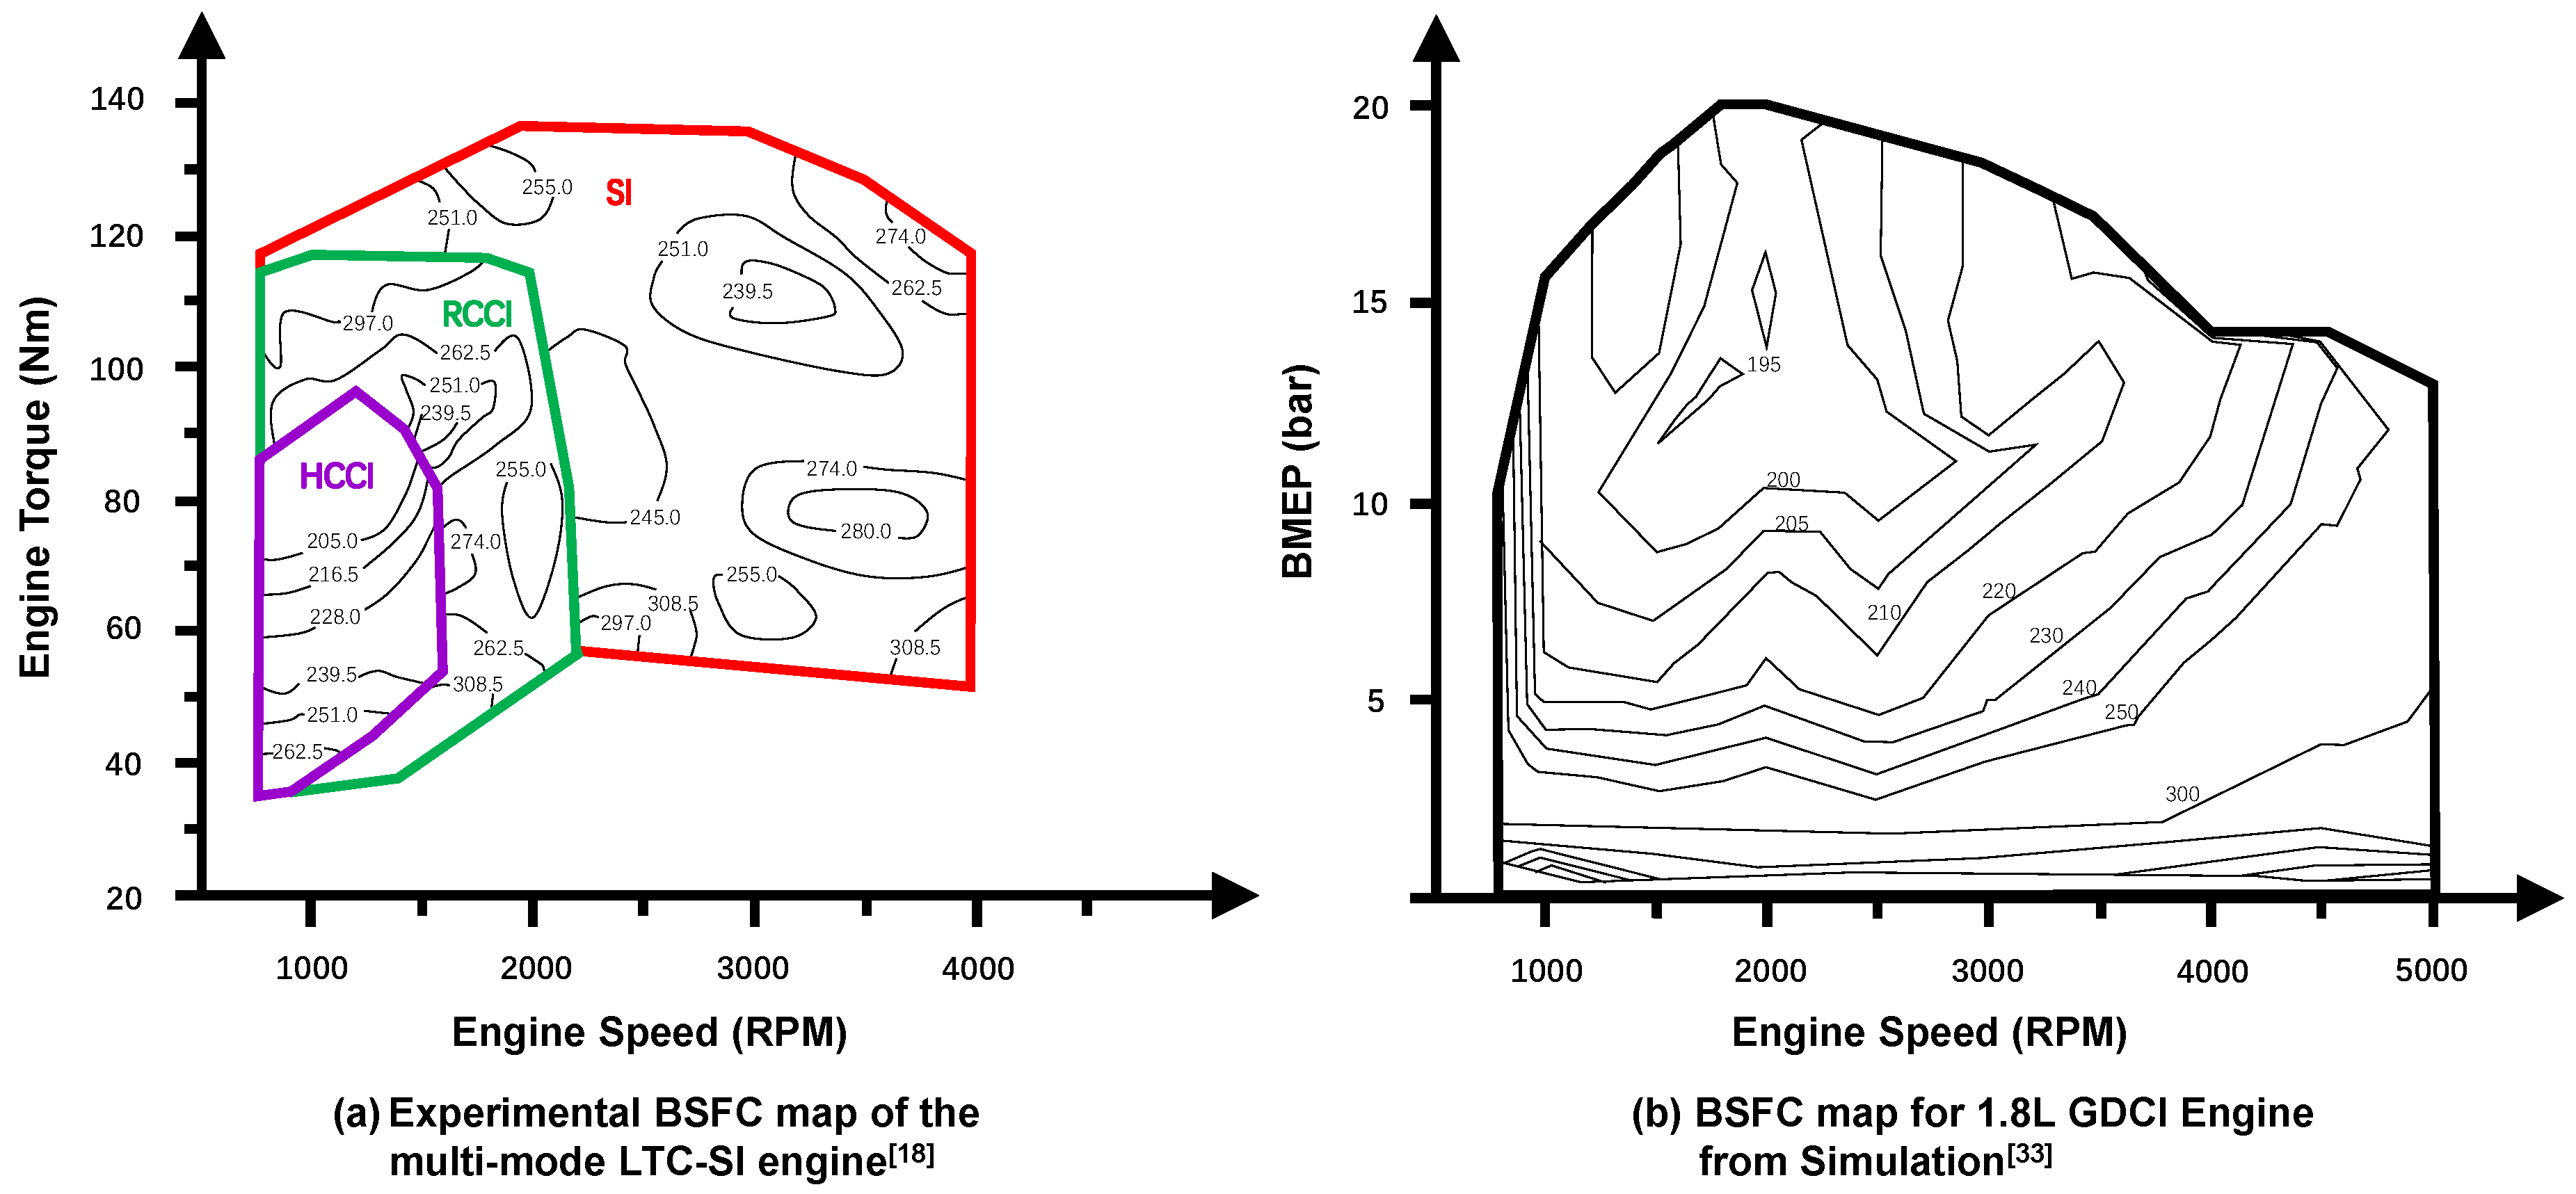
First, the influence of the high-efficiency engine on the transmission gear numbers is investigated. With the help of LTC technology, an experimental BSFC map for a 2.0 L engine, with 202.5 Kw maximum power, is obtained by Solouk, A. et al. [18] and is shown in Figure 1a. In addition to LTC technology, the gasoline direct injection compression ignition (GDCI) engine is also used in Delphi company (Gillingham, Kent, UK), which pre-heats the air before flowing it into the throttle to satisfy the gasoline compression ignition condition, thus improving the overall engine efficiency. In addition, by using GDCI technology, a simulated BSFC map for a 1.8 L engine with 130 Kw maximum power is generated in [33], which can be seen in Figure 1b. Brake mean effective pressure (BMEP) can be considered as another way to represent the engine output torque. Integrating these two generated engine BSFC maps, we propose a synthesized hypothetical engine BSFC map with extending fuel economy area and low BSFC value, which is illustrated in Section 2. In addition, for the transmission architecture, the gear numbers will vary in accordance with different engines to meet the corresponding power and fuel economy demand. So, for the HEV equipped with the proposed future engine, the influence on the transmission architecture is investigated with the implementation of dynamic programming (DP) algorithm.
Then, based on the conclusions of the first point, a novel HEV powertrain architecture, supplying four gears for the engine operating condition, and two gears for the motor operating condition, is proposed. This powertrain can also realize seamless gear shift with the aid of the compensation torque of the motor. To further testify the working performance of the proposed HEV powertrain, the dynamic model is established in software AMESim (Version 10, Siemens Product Lifecycle Management Software Inc., Munich, Germany) and simulations are conducted.
The structure of the paper is organized as follows: Section 2.1 is the overview of the optimization problem, and Section 2.2 introduces the modeling process of the vehicle, engine, motor, and battery. Then, dynamic programming algorithm is introduced and adopted in Section 2.3 to analyze the influence of future engine on the AMT structure. Furthermore, the simulation results are displayed in Section 2.4. In Section 3, based on the DP simulation results, a novel powertrain architecture is proposed, and the working modes and the gear shift process of the new powertrain architecture are explained and analyzed. In Section 4, the fuel consumption and gear shift quality are verified with the help of software AMESim. Finally, conclusions are given in Section 5.
2. Optimization of Gear Numbers for HEVs
2.1. Overview
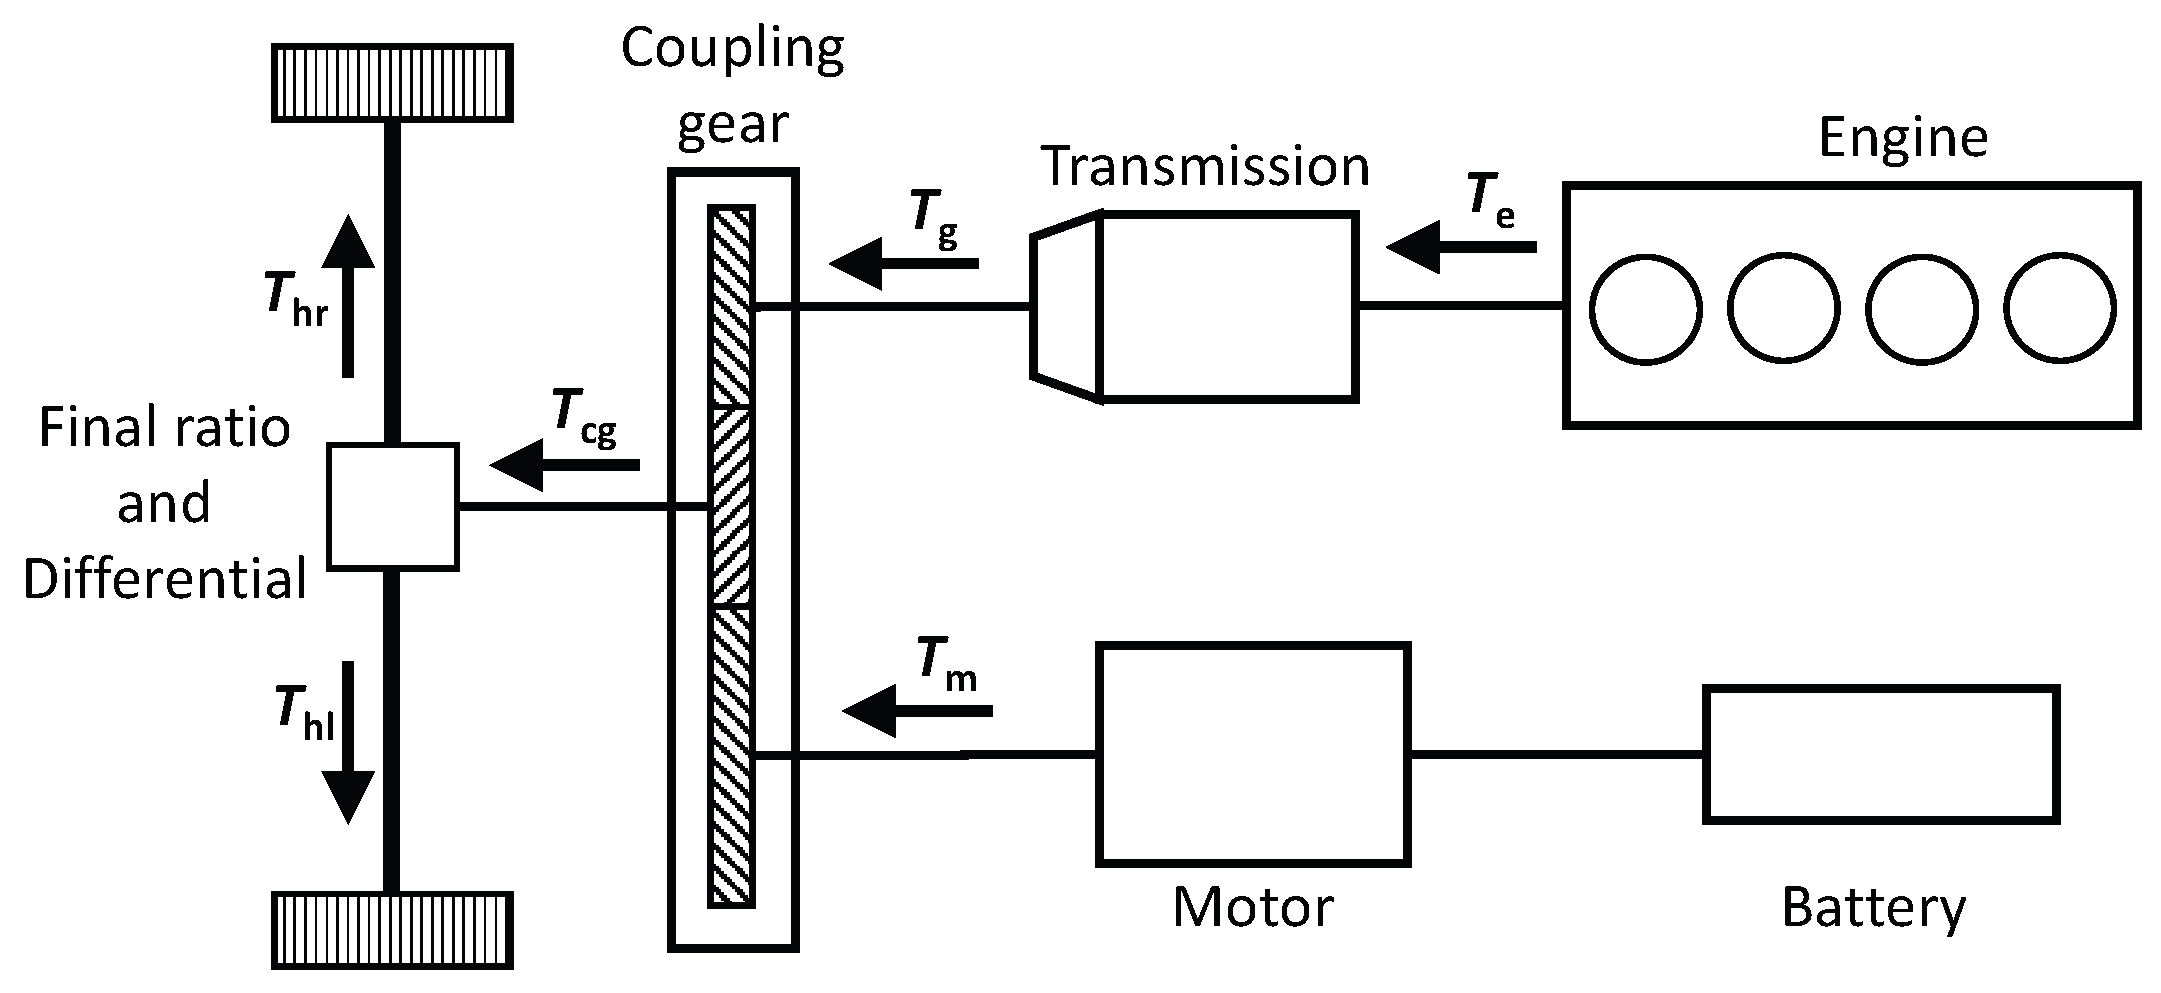
The parallel HEV is applied in this paper, which is shown in Figure 2, and the torque flow shown in the figure represents the condition in which the engine and the motor work simultaneously to drive the vehicle. Furthermore, the vehicle technical parameters used in this paper are shown in Table 1.
The investigation about the influence of the future engine on the HEV powertrain architecture can be seen as an optimal control problem, whose mathematical optimization formulation is as follows:
where and are the initial and final time, is the control variable, is the state variable, is the fuel consumption and is the penalty function.
2.2. Modeling Process
2.2.1. Vehicle Mathematic Model
The longitudinal motion dynamic equation of the vehicle can be described as:
The torque equation is:
where is the demand torque at the wheel, m is the vehicle gross mass, g is the acceleration of gravity, is the road gradient, f is the rolling resistance coefficient, is the air resistance coefficient, S is the face area, v is the vehicle velocity, is the rotational mass coefficient, is the vehicle acceleration, r is the tire radius, is the output torque of the engine, is the output torque of the motor, is the gearbox ratio, is the main reducer ratio, and are the coupling ratio of engine and motor, respectively.
2.2.2. Engine Mathematic Model
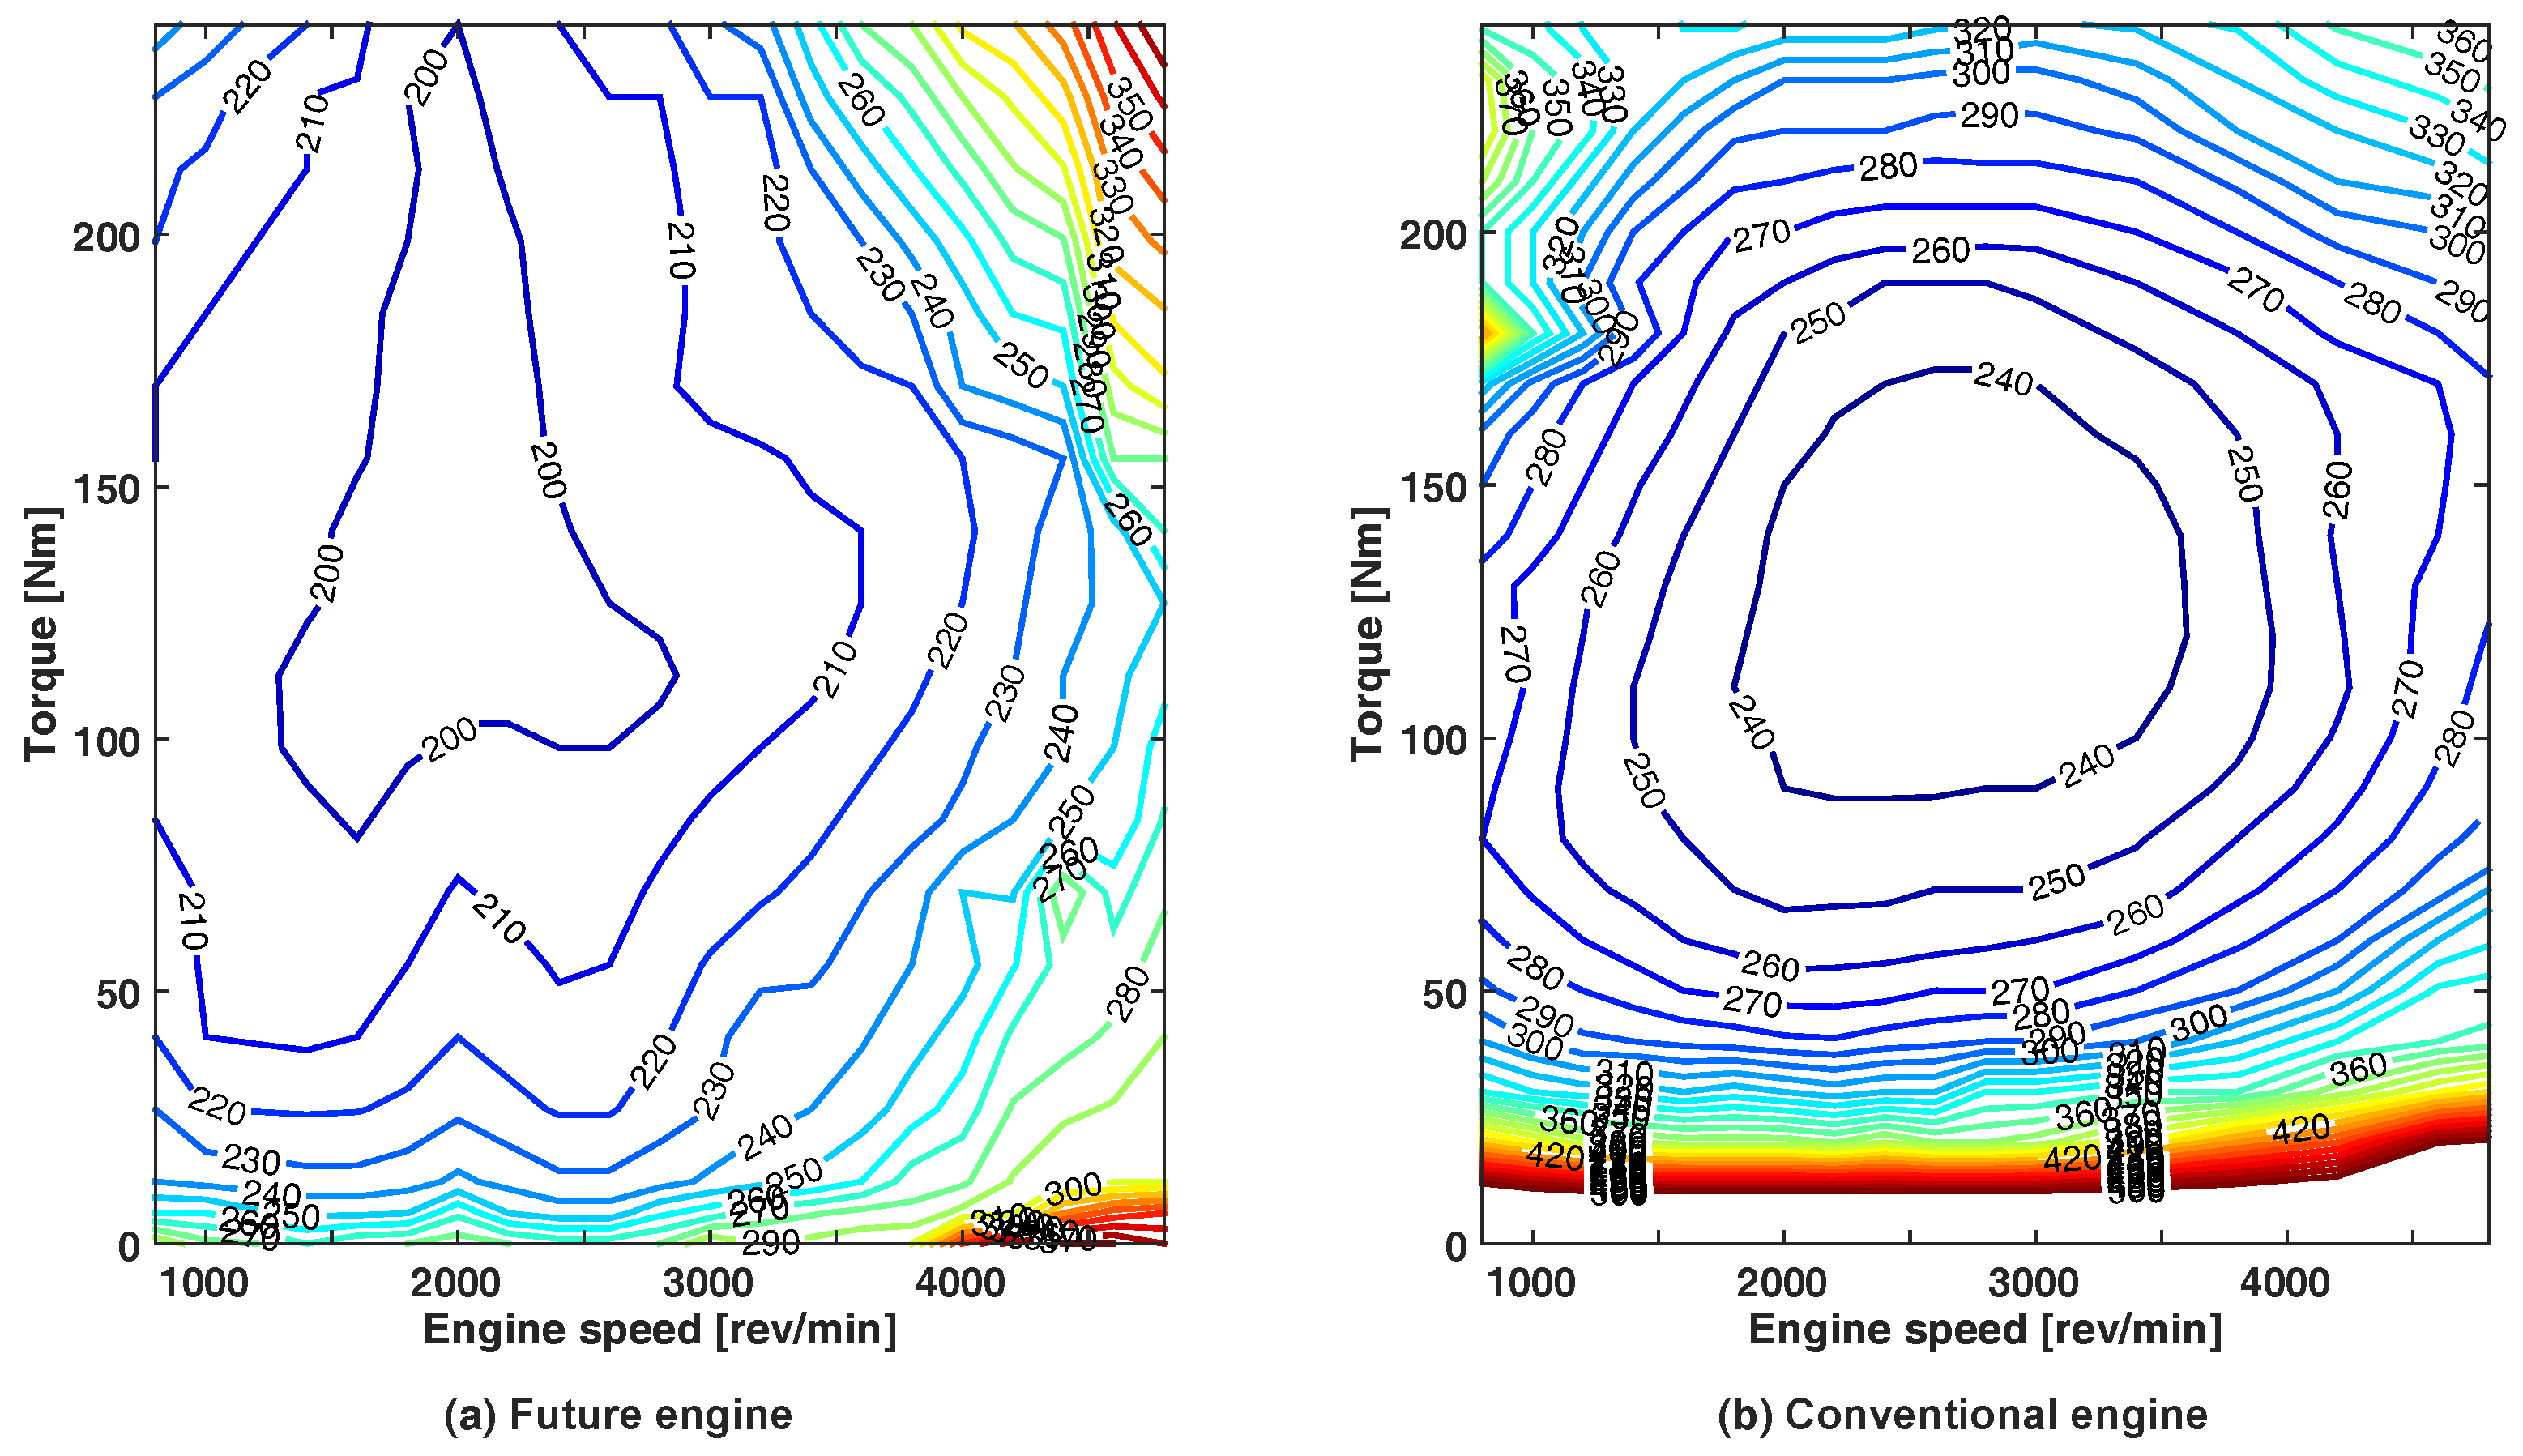
According to the literature and research reviews in the introduction, engine fuel consumption will continue to decrease with future engine designs as engineering and technologies progress [34]. Therefore, inspired by the previous research in literature [18,33], in addition to the consideration of the transition fuel penalty between different modes mentioned in [35], a hypothetical engine BSFC map is proposed, with the lower BSFC value and extending fuel economy area whereas the operating ranges (speed range and output torque range) are held fixed. The proposed engine BSFC map is shown in Figure 3a, and as a contrast, a conventional engine BSFC map is applied in Figure 3b.
2.2.3. Motor Mathematic Model
In terms of the diverse driving conditions and states of vehicle components, the role of the motor in the HEV can be different. When the vehicle operates at the low speed and low torque condition, the motor works as a traction motor to supply the required power, and the function is:
Moreover, in the low state of charge (), the motor serves as a generator to charge the battery, and the function is:
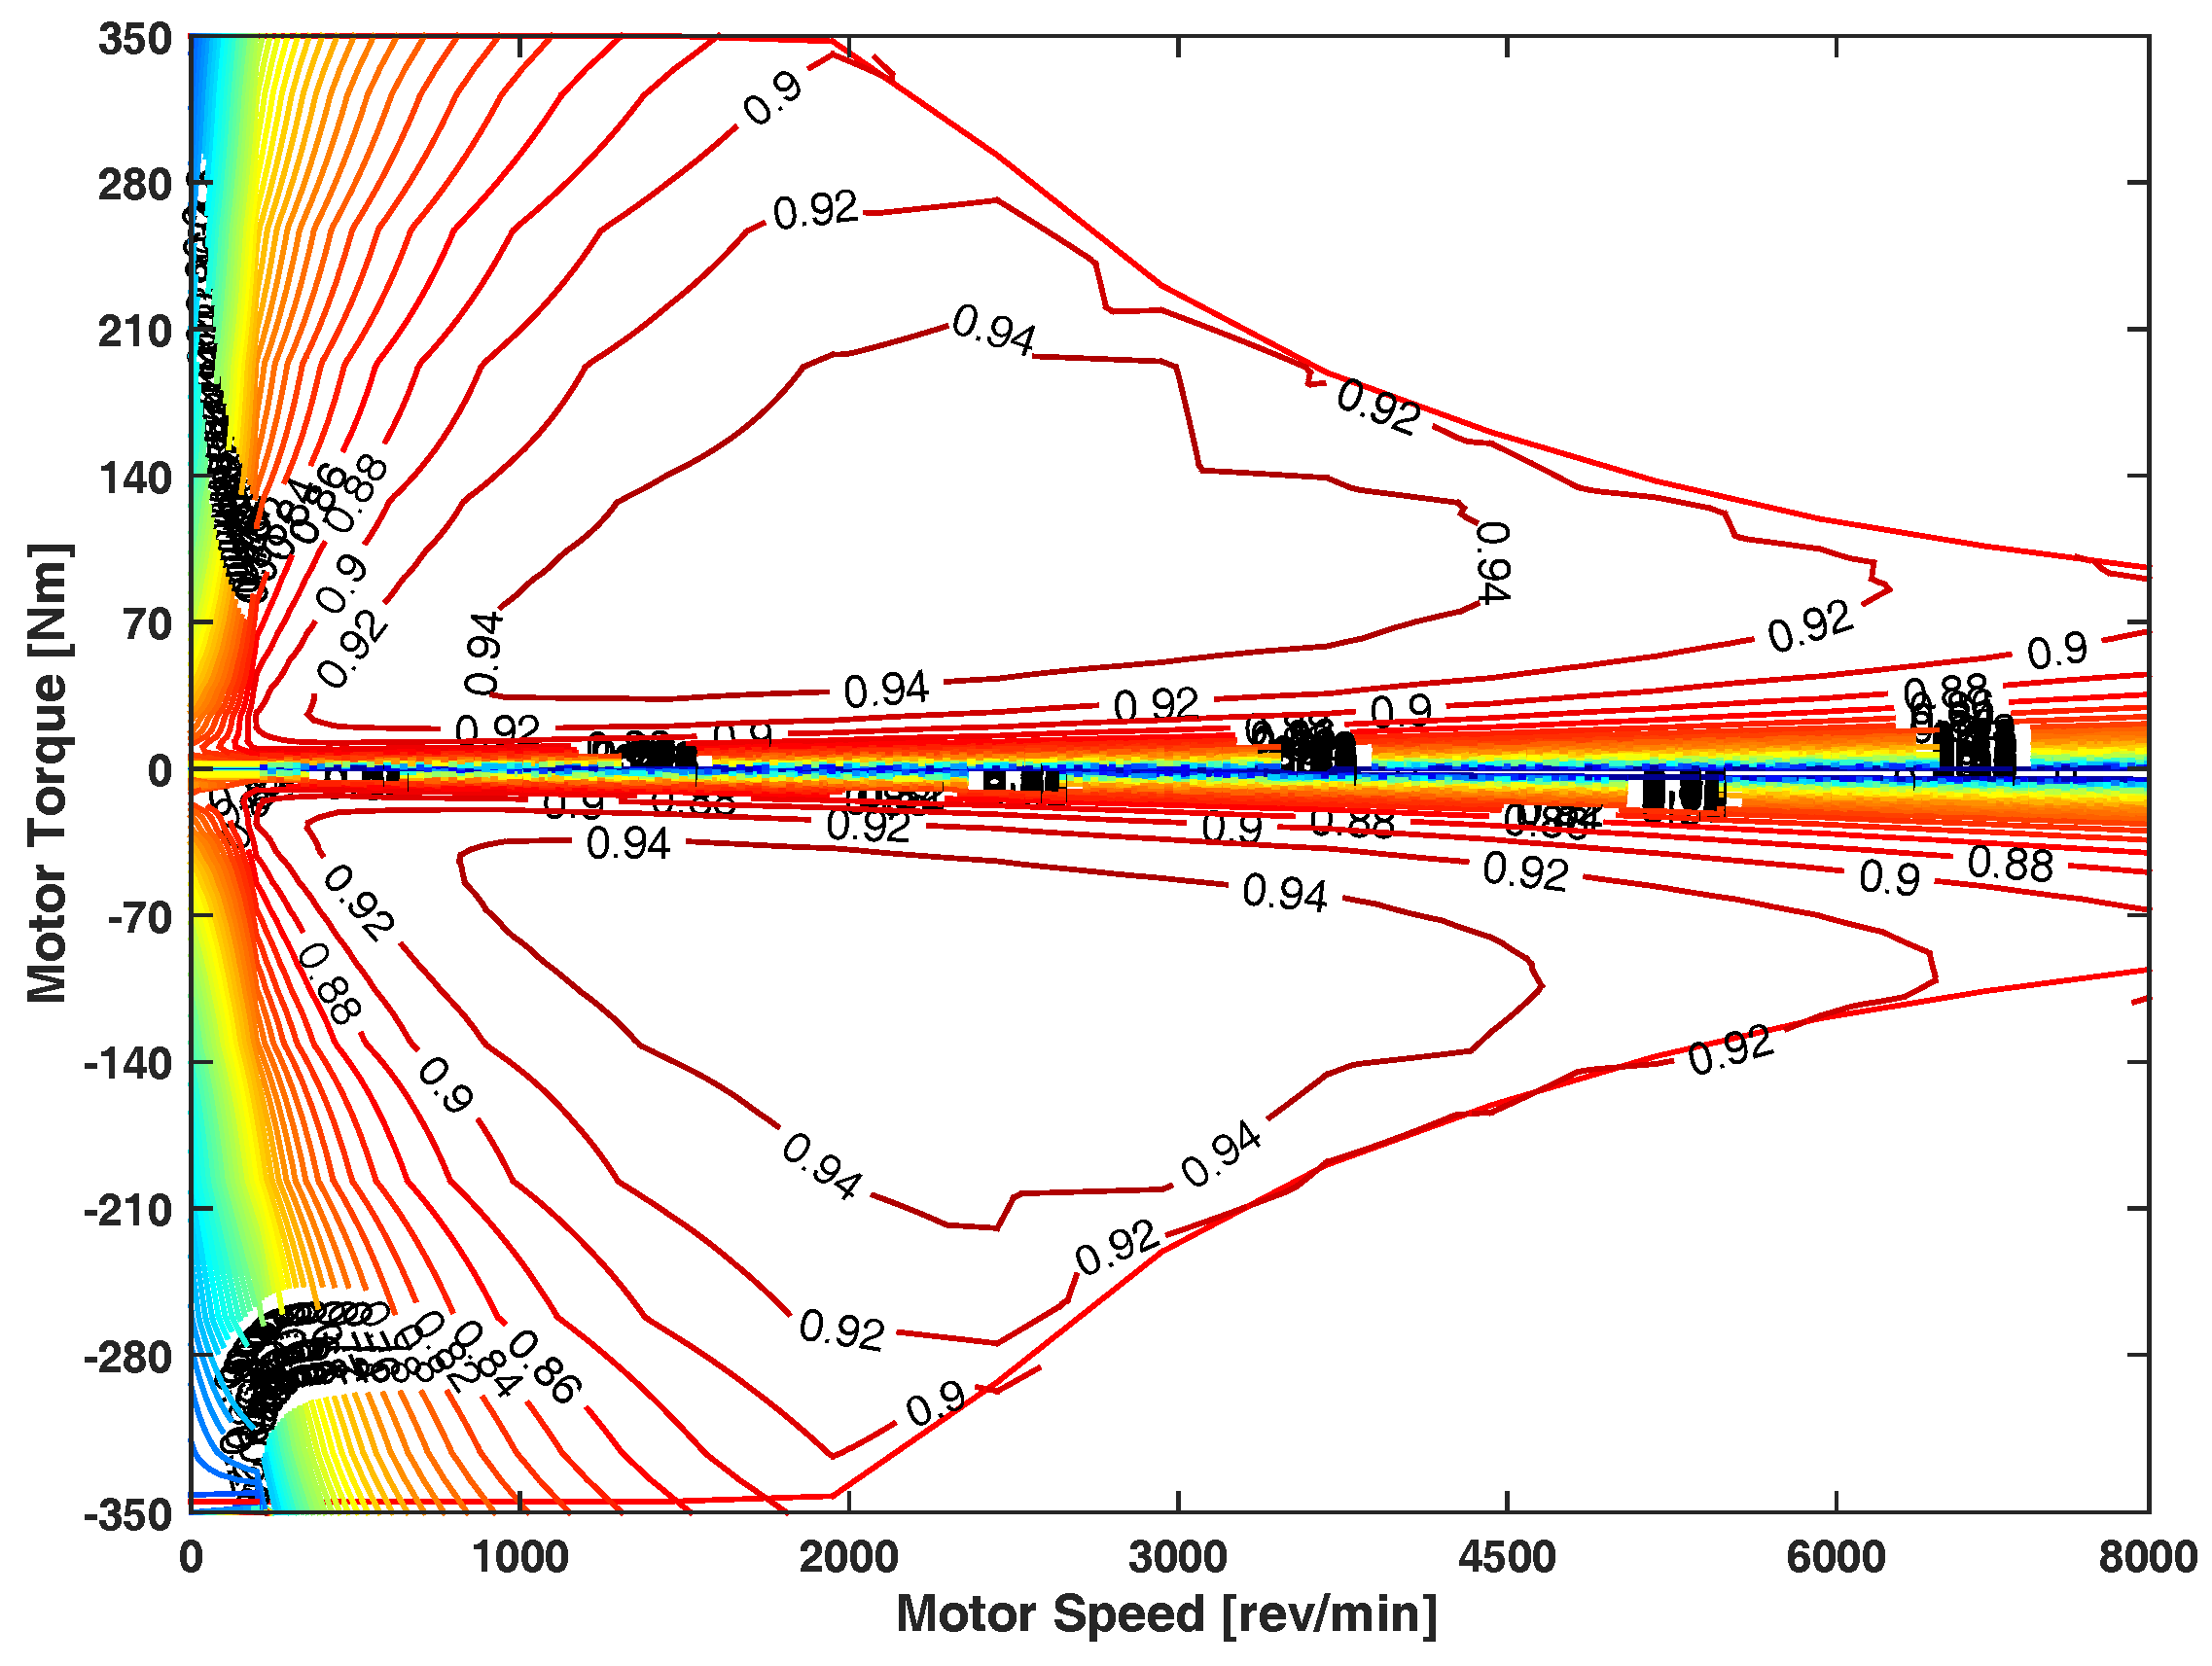
where and are the efficiency of the motor and the generator, respectively, is the power of the motor, and is the power of the generator. The motor efficiency map is shown in Figure 4.
2.2.4. Battery Mathematic Model
The equivalent circuit model of battery is depicted in Figure 5.
Just like the different role of motor, the working states of the battery also change accordingly, namely, the charging state and discharging state, so the battery internal current equations are:
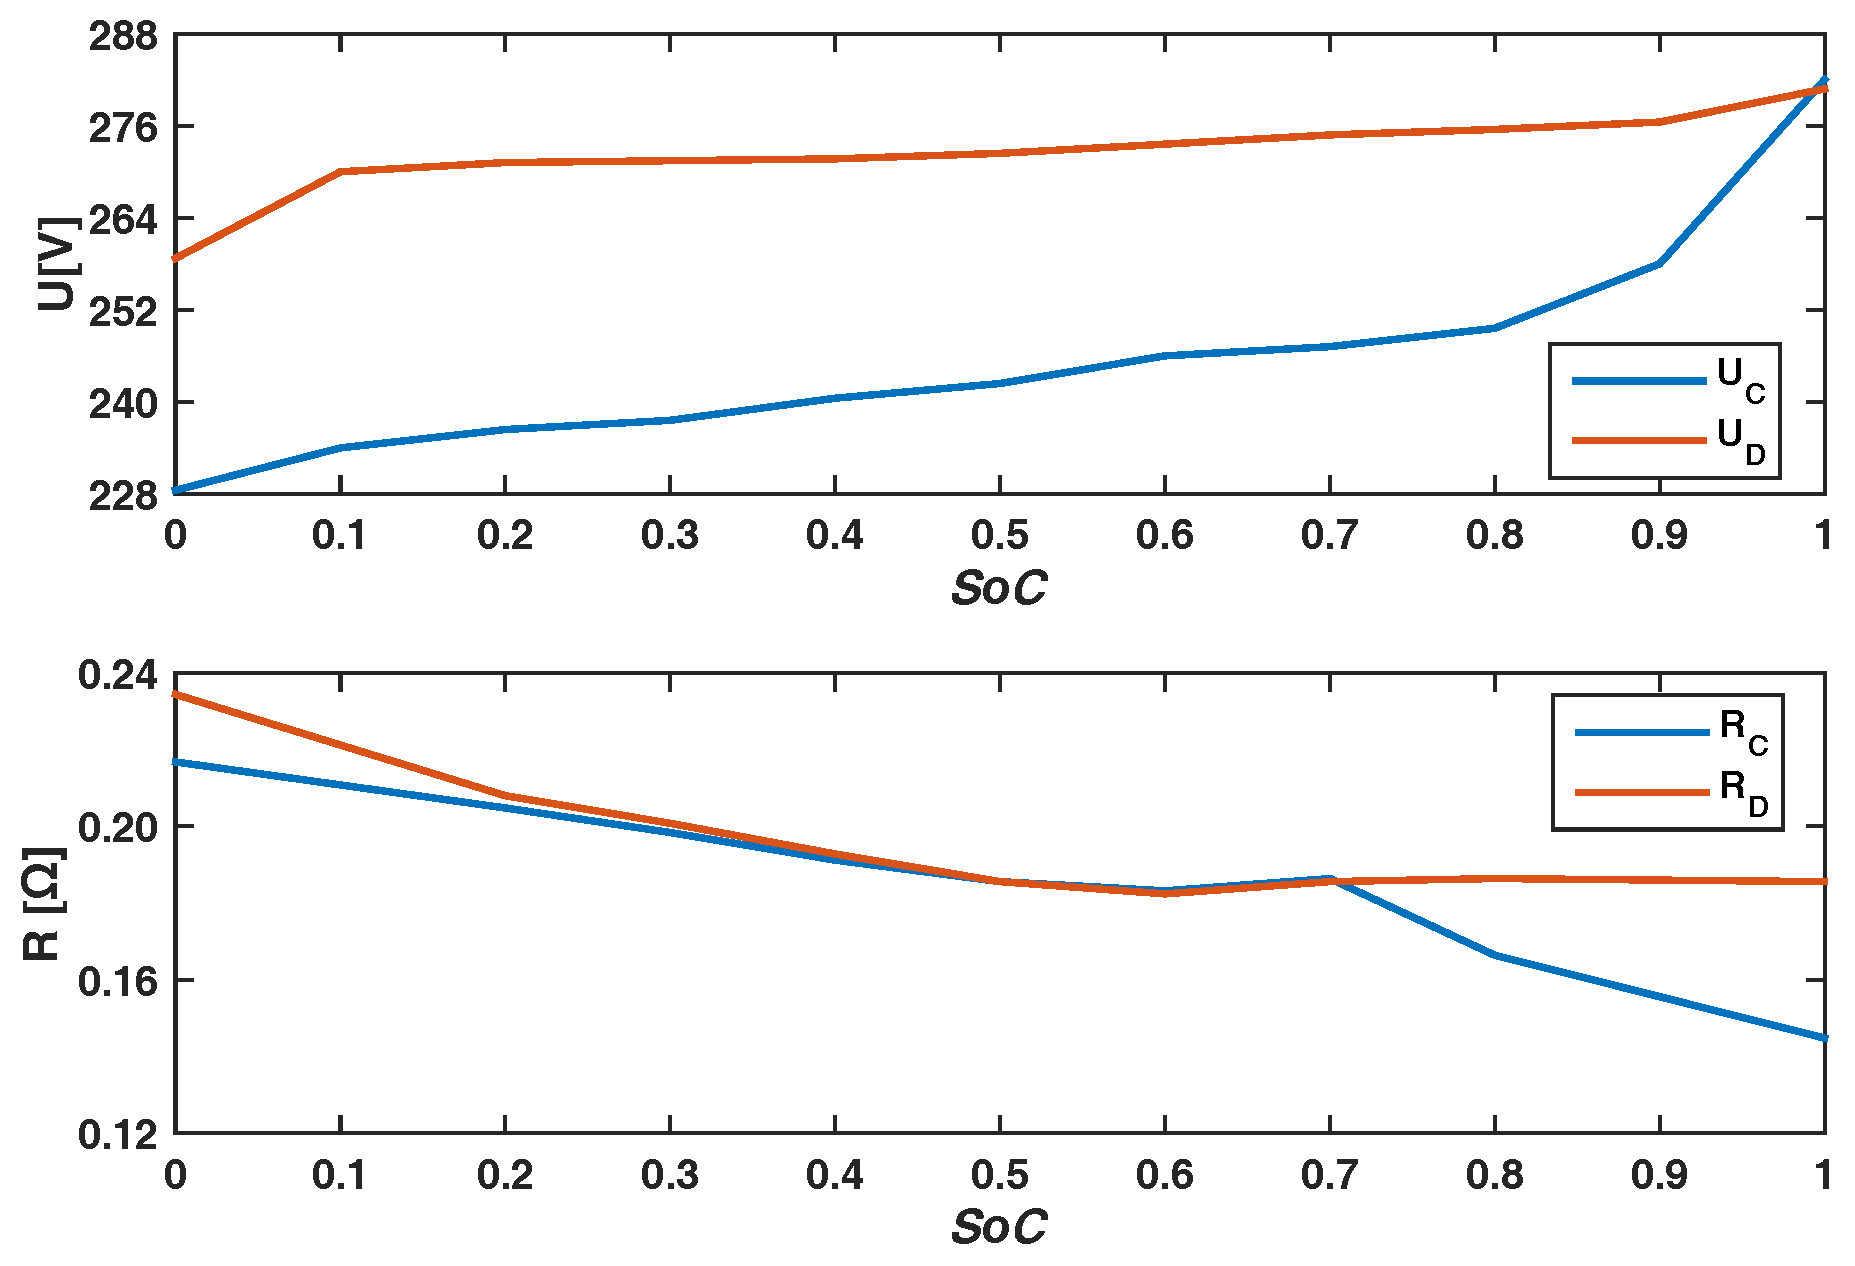
where U is the battery voltage, I is the battery current, P is the battery power, and R is the battery internal resistance. Moreover, the subscript C and D represent the charging state and discharging state of the battery, respectively.
The characteristic curves of battery open circuit and battery internal resistance versus are shown in Figure 6.
2.3. Dynamic Programming
Dynamic programming algorithm is one branch of the operational research and supplies a new approach to the multi-stage decision-making process [36,37]. The key of DP algorithm is decomposition and discretization, namely, the complete multi-stage process is divided into a series of subproblems. In solving any subproblem, the principle is to find the optimal solution from a variety of possible solutions, and in this way, all the subproblems are solved sequentially and useful information can be used for the next subproblem. Finally, when every subproblem is resolved, the whole process is achieved and the optimal result is obtained.
Just as formulated in Equaiton (1), the optimal control problem is composed of the following parameters: stage variable, state variable, and control variable [38], and the optimal solution is to find the minimum of Equation (1).
In this paper, for a given driving cycle, the whole driving cycle is divided into N stages, and the time interval at each stage is 1 s. In addition, the state of charge () of the battery is then chosen as the state variable, whose range of value is [0.4, 0.8]. Furthermore, the working states of the engine and the motor are mainly determined by two factors: one is the torque distribution between the engine and the motor, and the other is the gear state of the transmission, so the engine torque and the gear state are selected as the control variables. Furthermore, the basic inequality and equality constraints on state variable, control variables and other parameters are listed as follows:
and the transfer function of the state variable is:
where , and are the battery , battery current and battery increment at kth stage, respectively; is the battery at (k+1)th stage, C is the battery capacity, is the time interval between two stages; and the subscripts min and max are the minimum and maximum values of the variables.
In each stage k and each state m, the fuel consumption is decided by the engine speed and engine torque:
where can be obtained from the engine BSFC map.
Moreover, the penalty function is requested to limit the high frequency of gearbox shift:
where is the penalty coefficient, and are the gear states at ()th stage and kth stage, respectively.
Then, for each state m, the cost function from stage N to stage k is:
So, the final optimal solution is the minimum of the cost function:
When all the subproblems are resolved, the backward process of the DP algorithm is completed and all the relevant optimal parameters sequences are obtained. Then, the next step is the forward calculation process of DP algorithm to find the optimal strategy. Finally, the optimal results based on the DP algorithm can be achieved.
2.4. Simulation and Results
In order to fully reflect the real road conditions and make the results more pervasive and convincing, three driving cycles have been selected including New European Drive Cycle (NEDC), J1015 and Urban Dynamometer Driving Schedule (UDDS). The vehicle speed trajectories of each driving cycle are shown in Figure 7.
Five groups of transmission gears are applied to find the best match between the transmission and the proposed future engine. There are two principles for the transmission gear ratios selection in this paper:
- Considering the utilization rate of each gear (the vehicle has less opportunities to work under lower gear states), the ratios between adjacent gears satisfy: , where is the ith gear ratio.
- The highest and lowest gear ratios are selected to satisfy the vehicle driving performance, that is, the maximum speed can be reached when the vehicle is driving under the highest gear; the vehicle can drive under the maximum grade when it is under the lowest gear.
In terms of these principles, different gear ratios of each transmission are selected in Table 2.
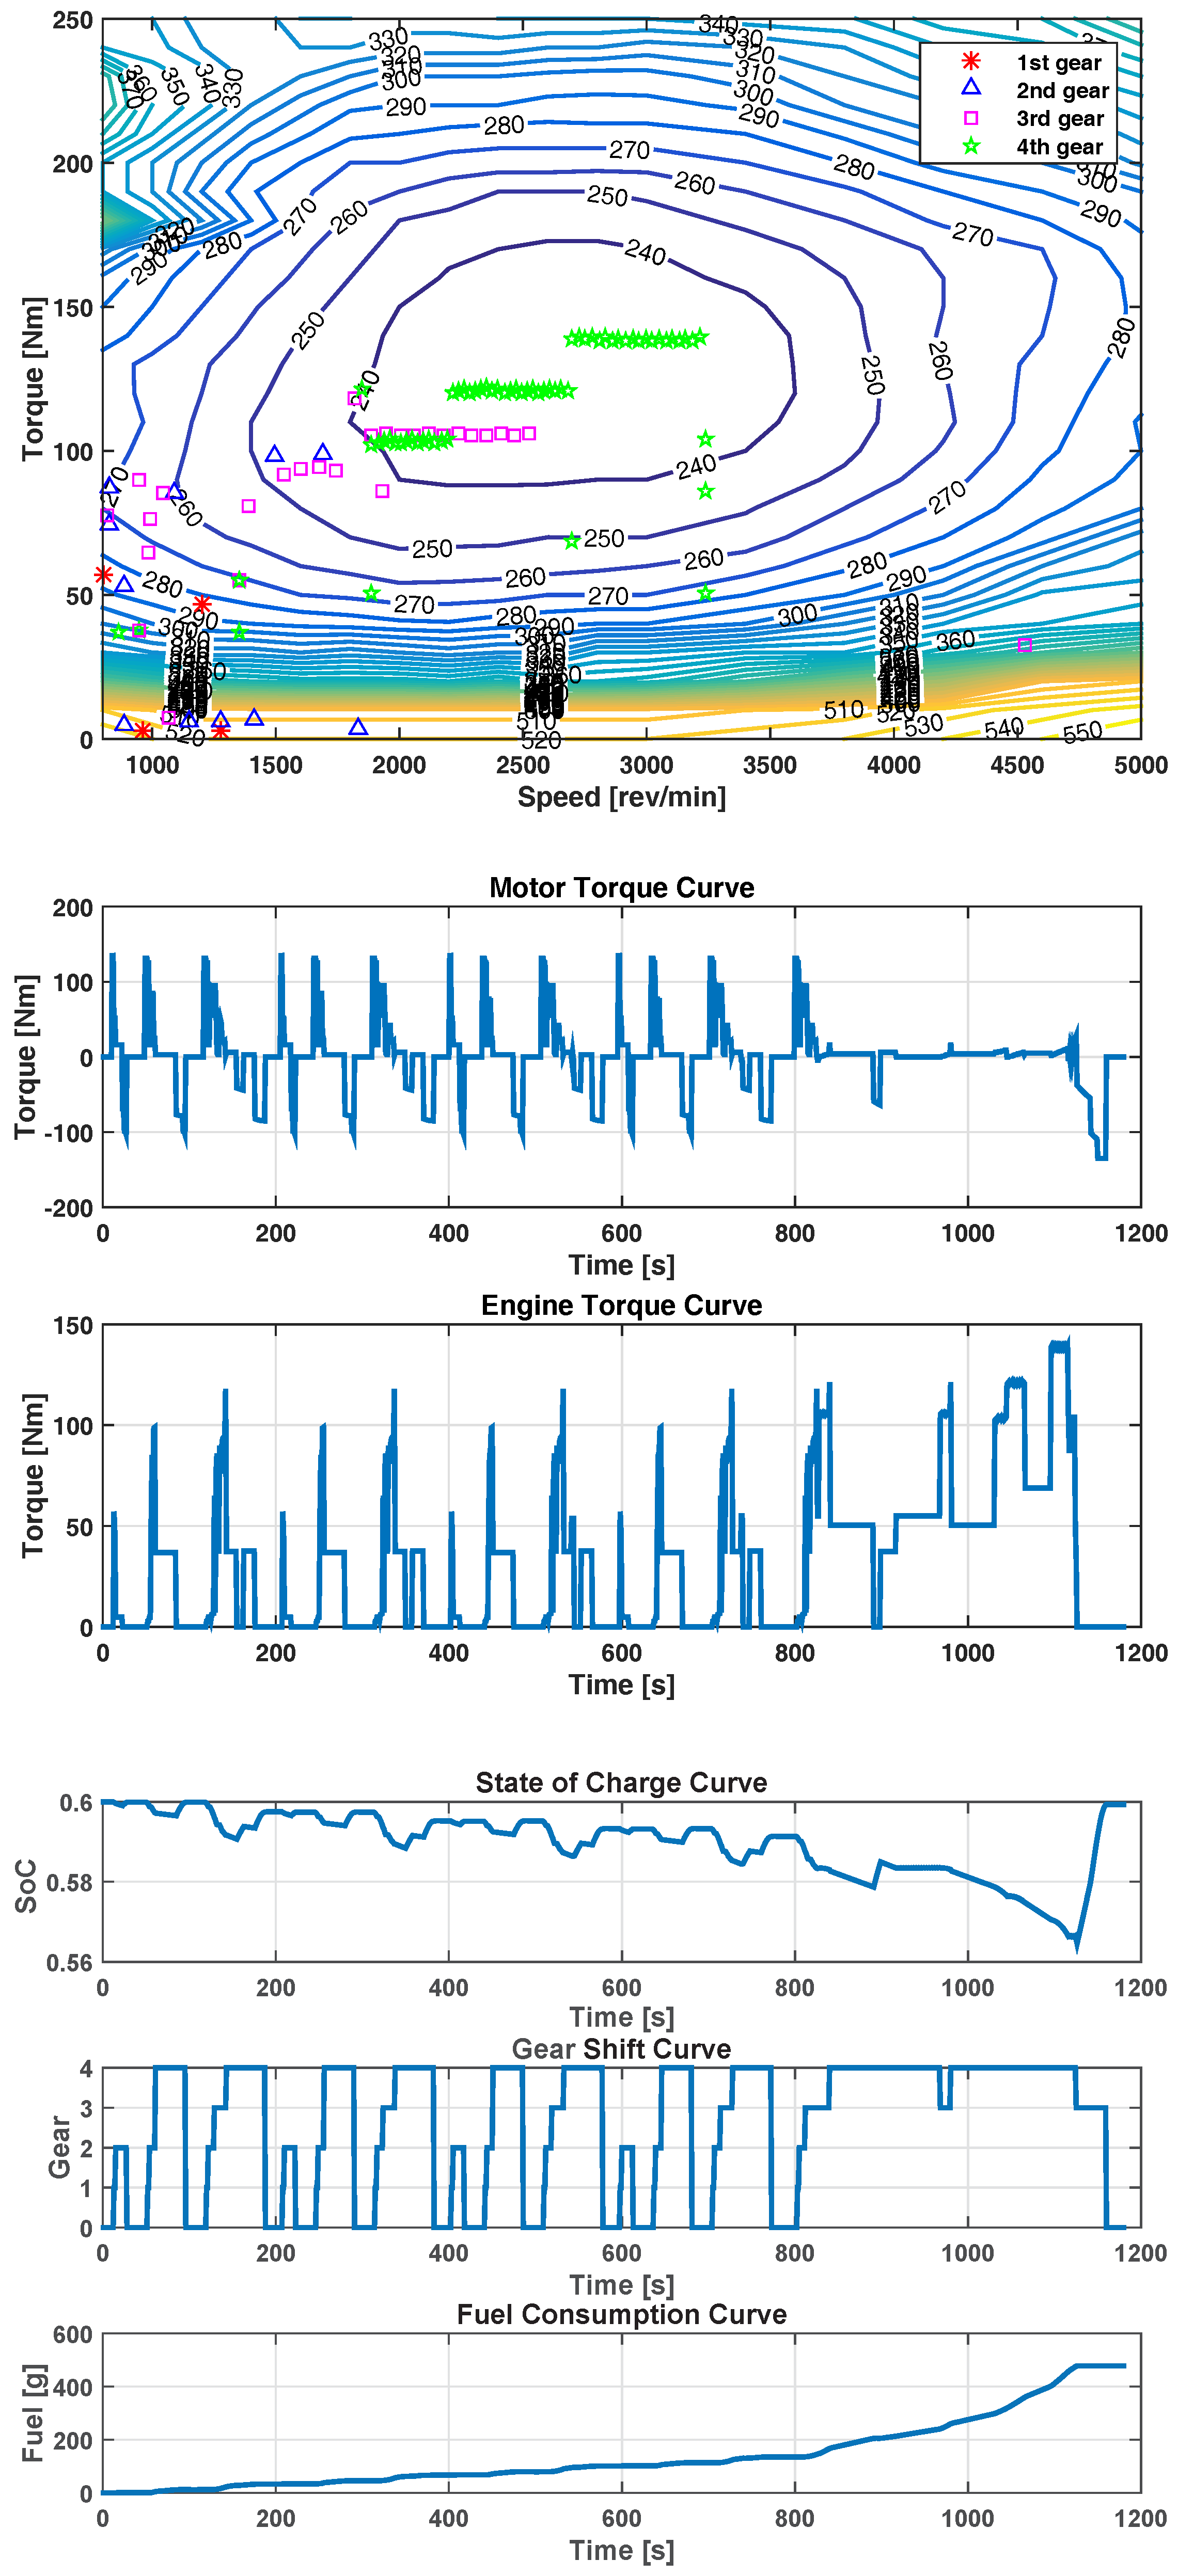
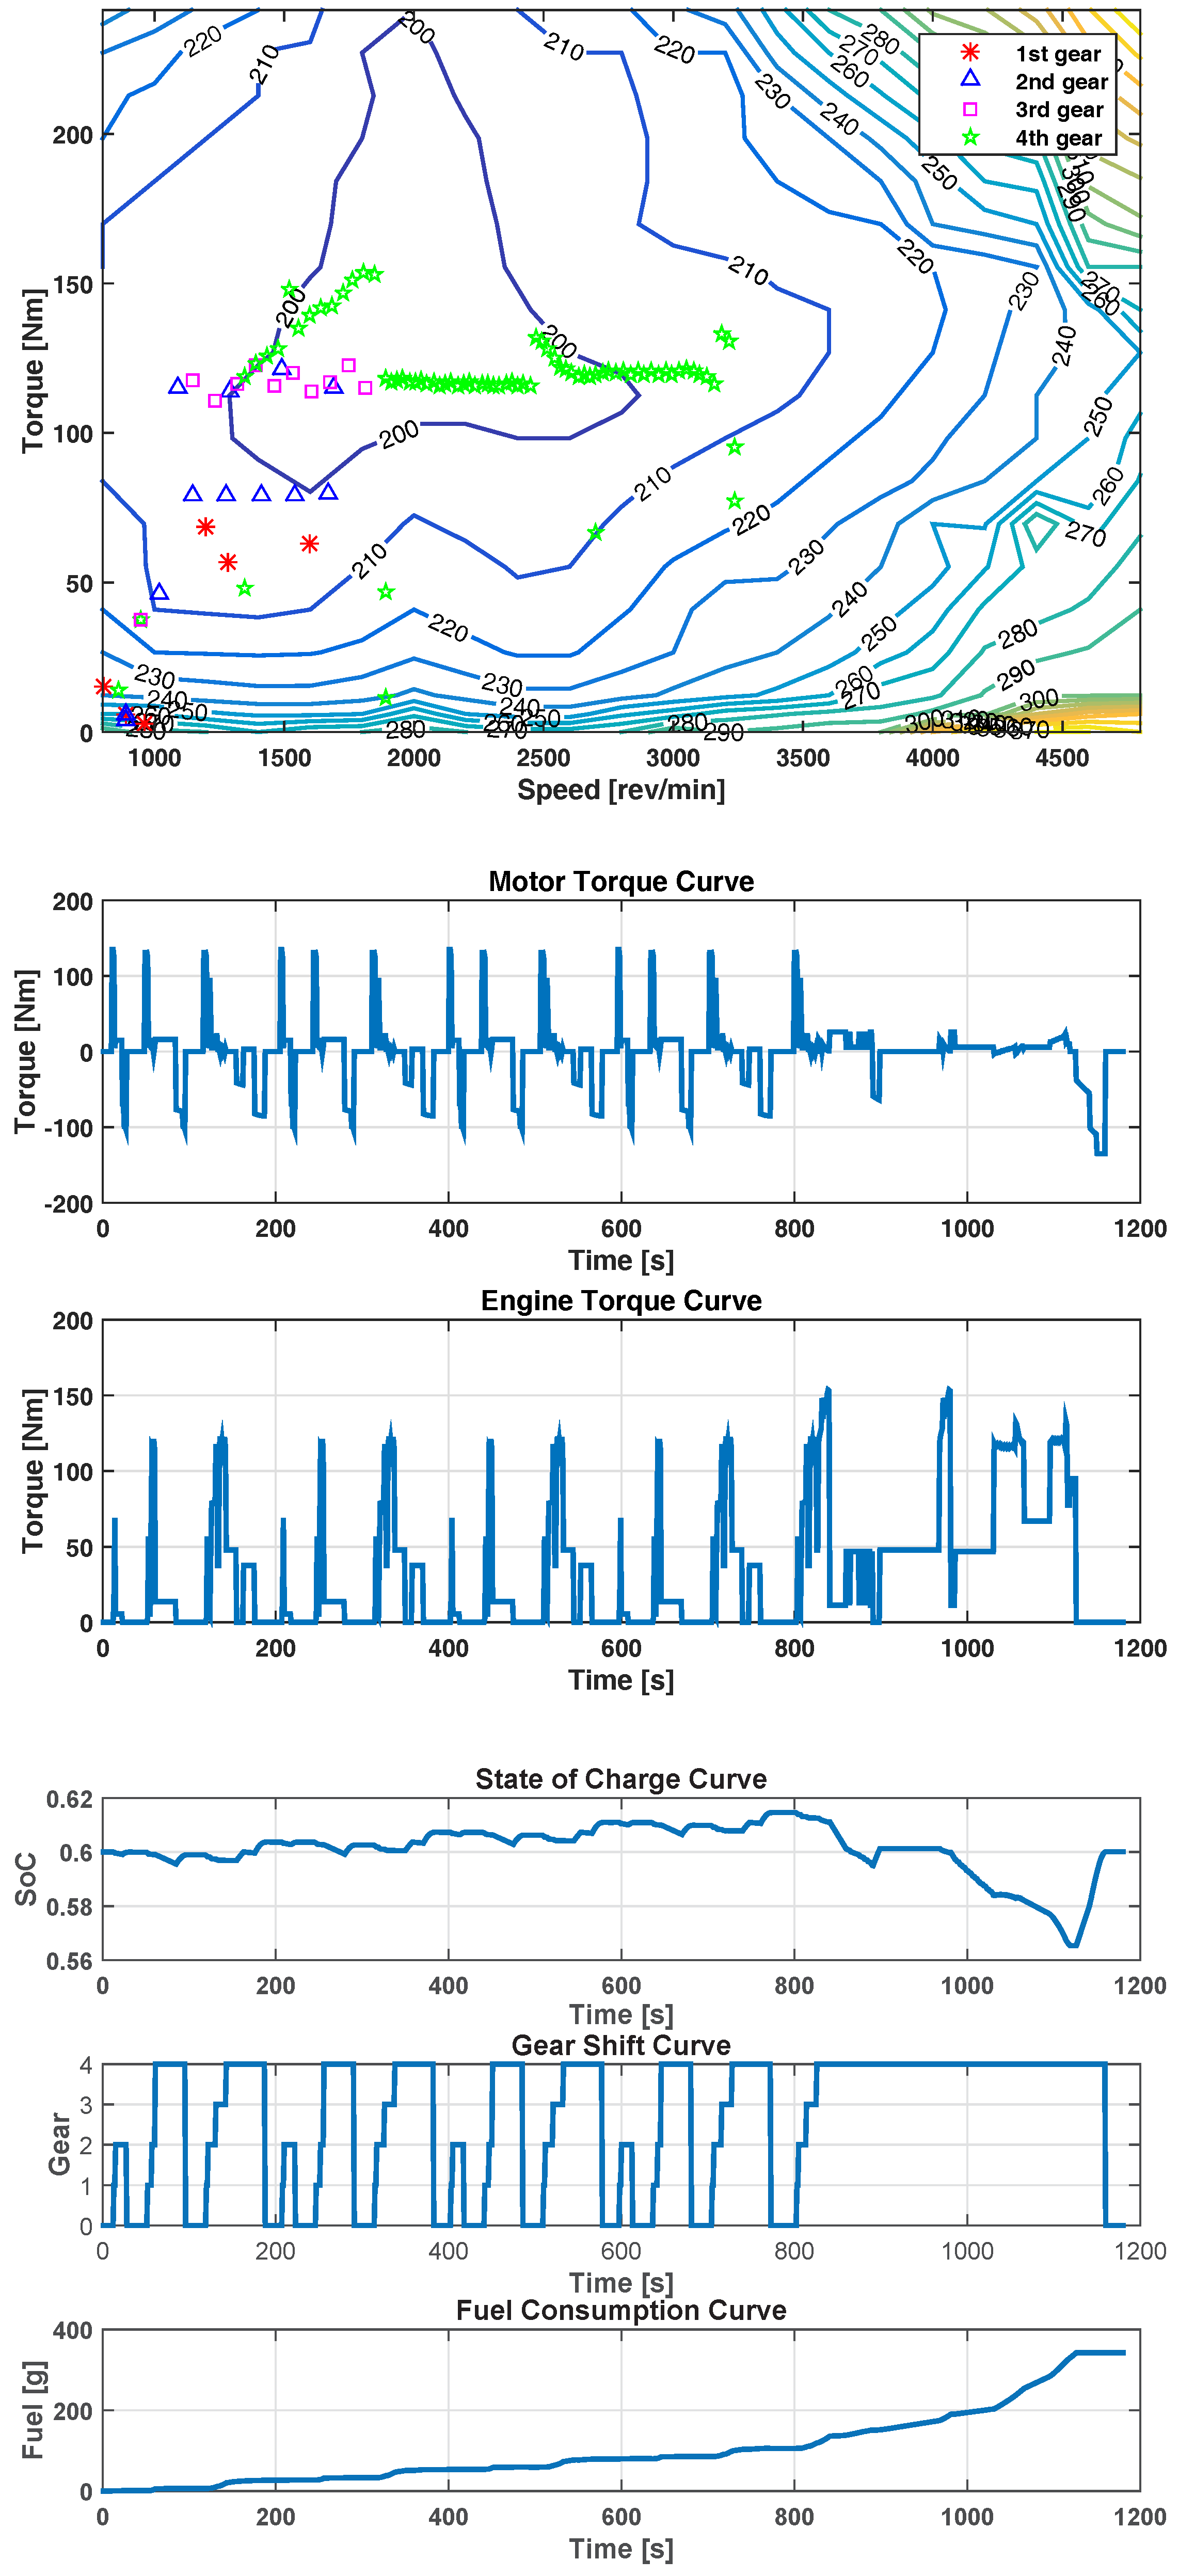
All the simulations are conducted in the MATLAB software (Version R2012b, The MathWorks, Inc., Natick, MA, USA) and a total of 30 simulations are required to run all combinations of two engines, three driving cycles and five groups of different gear ratios. Here, we take four gear numbers as an example to illustrate the simulation results in the NEDC condition. The simulation results are shown in Figure 8 and Figure 9, where Figure 8 represents the simulation results with the conventional engine and Figure 9 represents the results with the future engine.
For a fair comparison, the charge-sustaining condition is applied where the final value does not change significantly compared with the initial value. The results comparison between Figure 8 and Figure 9 are listed as follows:
- As can be seen from the first subplots of these two figures, for the conventional engine, only parts of the operating points are located in the fuel economy area. However, for the future engine with the extended fuel economy area, through the appropriate selection of gear ratios, most engines working points fall in the fuel economy area, thus increasing the working efficiency of the engine.
- For the whole NEDC driving cycle, the fuel consumption of the conventional engine under four gear transmission is 477 g, while for the future engine, the result is about 342 g, illustrating a great fuel consumption improvement.
- The engine and the motor could work in a coordinated manner to supply the required torque. The value of the battery is closely related to the vehicle condition (required speed and torque) and the motor/generator conditions (output speed and torque), and the charge-sustaining condition could be achieved when finishing the whole driving cycle.
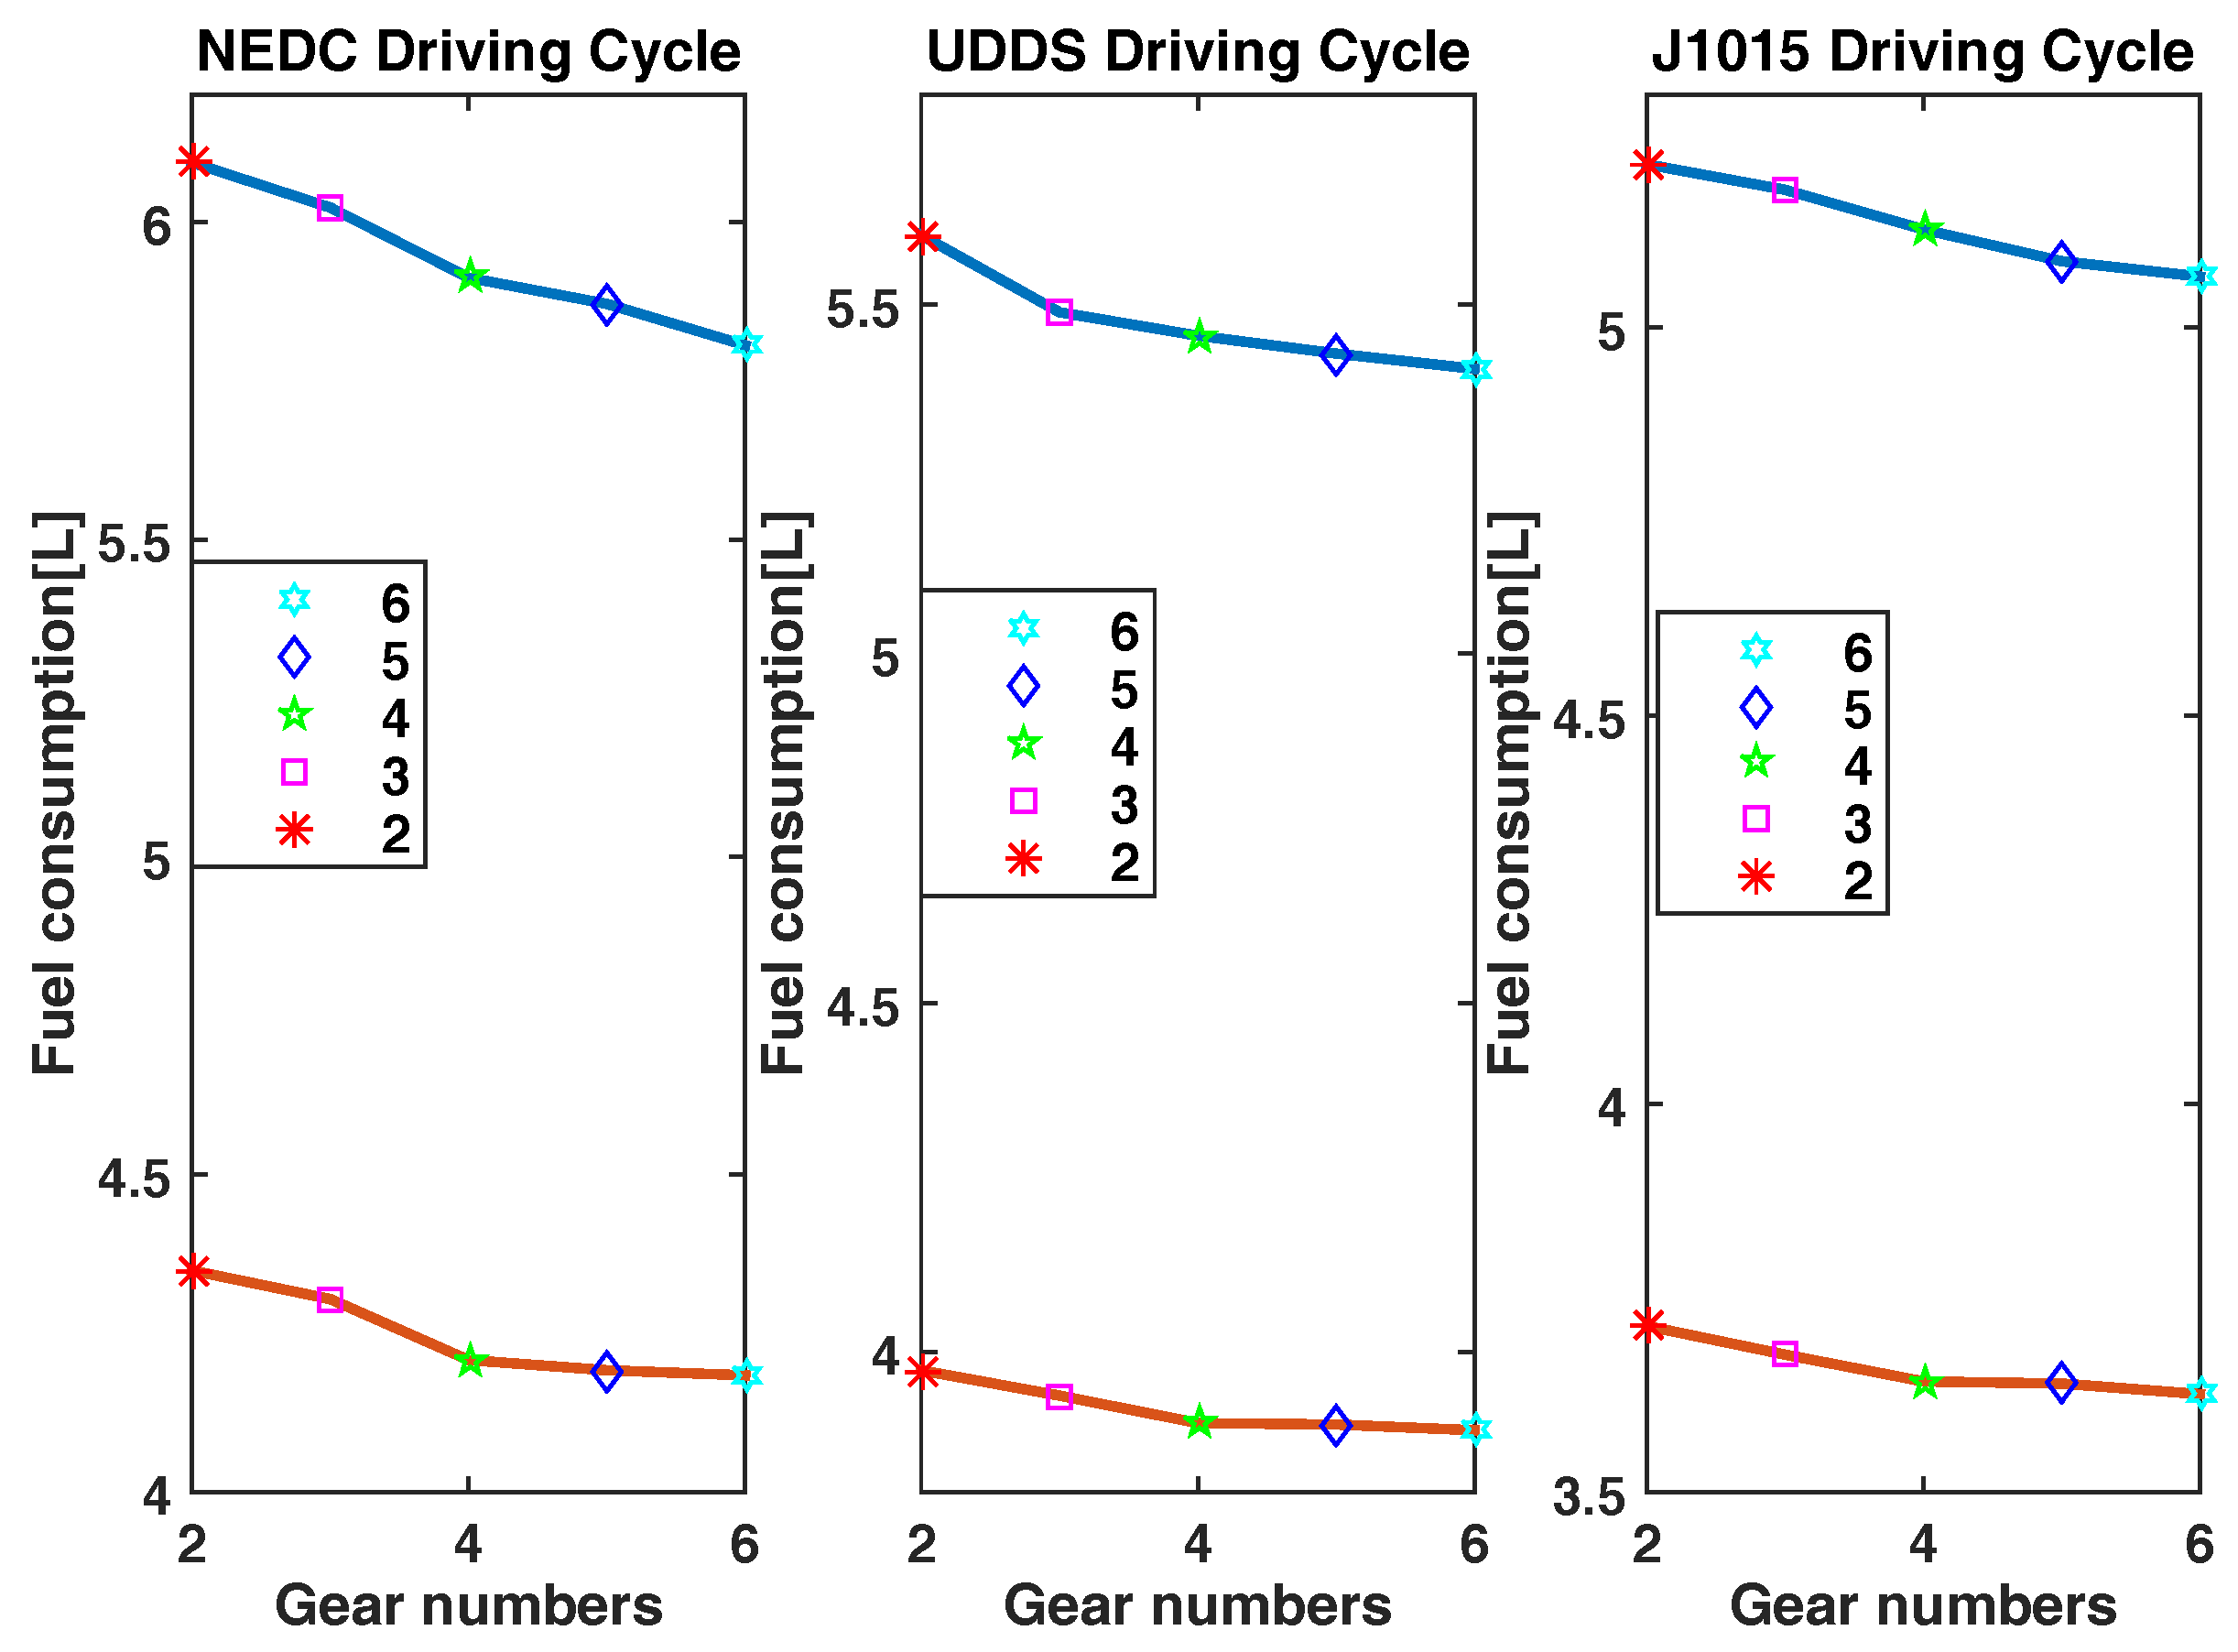
Similarly, the simulation results of other gear numbers can be obtained in the same way. For convenient comparison between different driving cycles, the final fuel consumption is chosen as the evaluation criteria and all the data are converted into the 100-kilometer fuel consumption. The relevant results are shown in Figure 10.
As can be seen from Figure 10, no matter what the driving cycle is, the final fuel consumption of the future hypothetical engine decreases greatly, compared with the results based on the conventional engine. In addition, with the increase of gear numbers, the corresponding fuel consumptions decrease because more gear numbers mean the engine has more opportunities to work in the fuel economy area. However, the decrease rate of the fuel consumption in different gear numbers is not always the same. Under all the three driving cycles, four gears are the turning point of the fuel consumption decrease rate, where the decrease rate from two gears to four gears is more obvious than that from the four gears to the six gears. The fuel consumption differences among four gears, five gears, and six gears are very small and the fuel consumption value can almost be seen as the same. Therefore, it can be assumed that a future transmission with four gears can be deemed as a reasonable choice to match the future engine with extended fuel economy area to achieve a satisfactory performance. Besides, the four-gear transmission also has great advantages from the viewpoint of cost and control complexity. Hence, in the next section, we first propose a novel architecture of powertrain, and construct an AMESim model of this powertrain. Based on this model, simulations are conducted to evaluate the fuel consumption and gear shift quality.
3. Working Modes and Gear Shift Process of the Proposed Powertrain
The parallel hybrid electric vehicle has been applied in various research [17,18], and in this paper, a novel parallel HEV powertrain architecture [39] is proposed, as is shown in Figure 11a. Figure 11b shows that the powertrain gear ratio consists of engine gear ratio and motor gear ratio , and can be calculated as : (1) The engine torque is transmitted through the synchronizer 10 located in the engine output shaft. The engine gear ratio is when the synchronizer 10 is locked with the low speed gear, and is when the synchronizer 10 is locked with the high speed gear; (2) The torque on the motor output shaft is either transmitted through the synchronizer 4 or the clutch. The motor gear ratio is when the synchronizer 4 is locked and the clutch is released, conversely, the motor gear ratio is . Thus, this automated manual transmission can provide four gears for the engine operating condition, and two gears for the motor condition, which can fully maximize the engine’s and motor’s capacities. A starter motor is equipped with the engine (which is not shown in the figure), so that the engine can be started when necessary. Besides, the dry clutch is located behind the transmission so as to realize the seamless gear shift process, which is a major problem of conventional AMT. Both the fuel consumption and gear shift quality are analyzed to verify that the transmission with four gears can guarantee the vehicle driving performance.
3.1. Working Modes
There are three modes that the powertrain architecture can operate: electric vehicle (EV) driving mode, HEV under-powered driving mode and HEV over-powered driving mode.
3.1.1. EV Mode
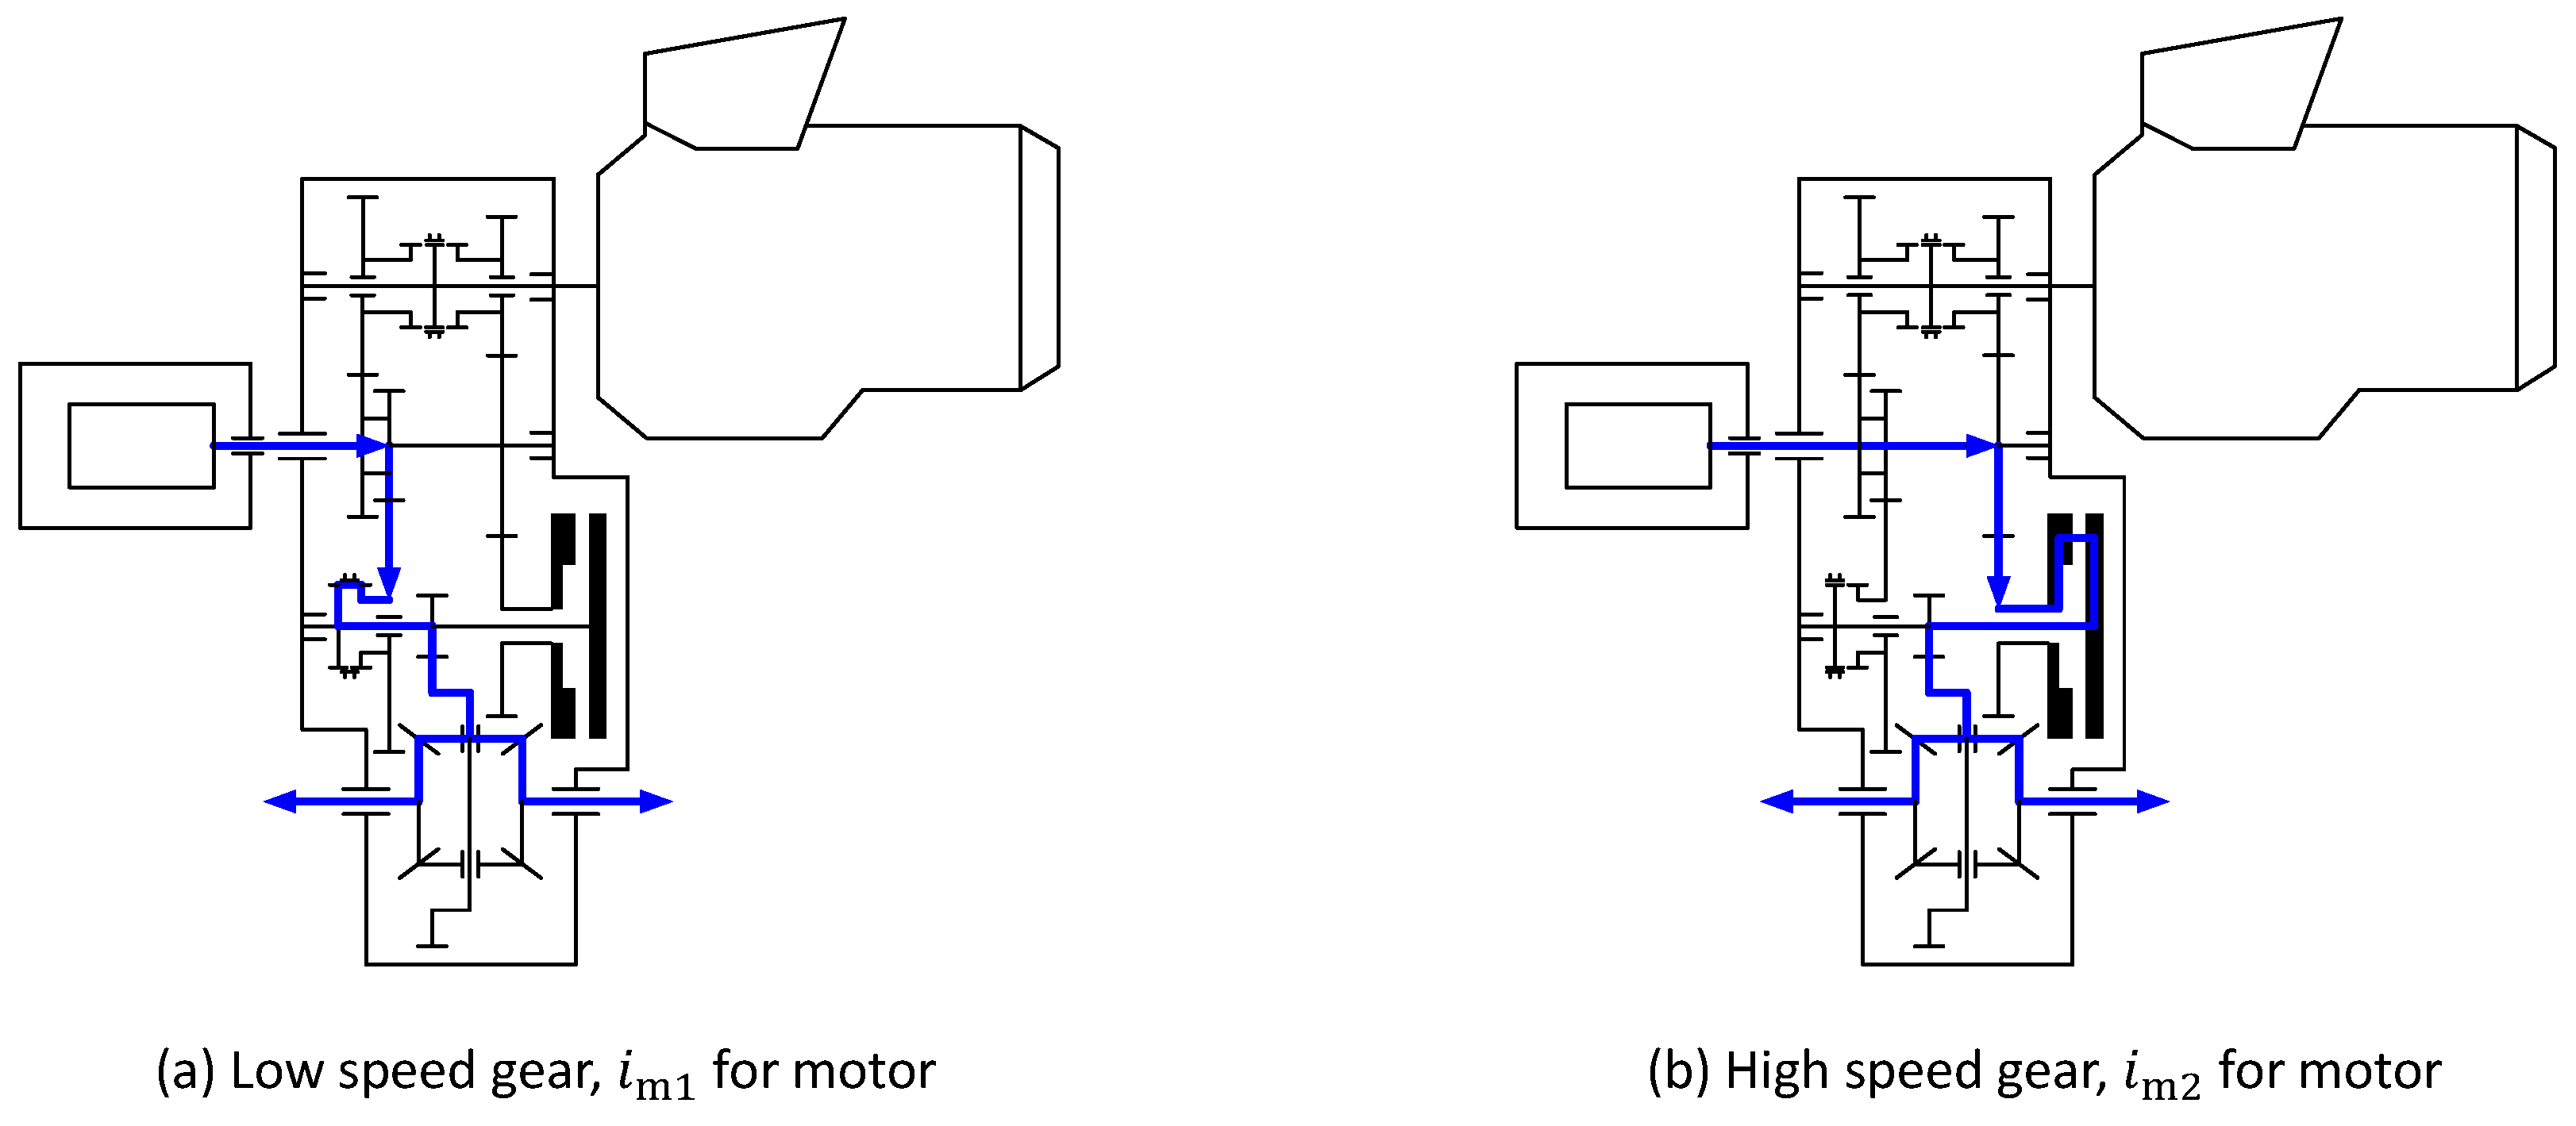
When the vehicle operates in EV mode, only the motor supplies the demand power and the engine is not involved; there are two gears, as shown in Figure 12, which are called low speed gear and high speed gear. In the low speed gear, the motor torque is transmitted to the vehicle through the synchronizer, while through the clutch in the high speed gear.
3.1.2. HEV Mode
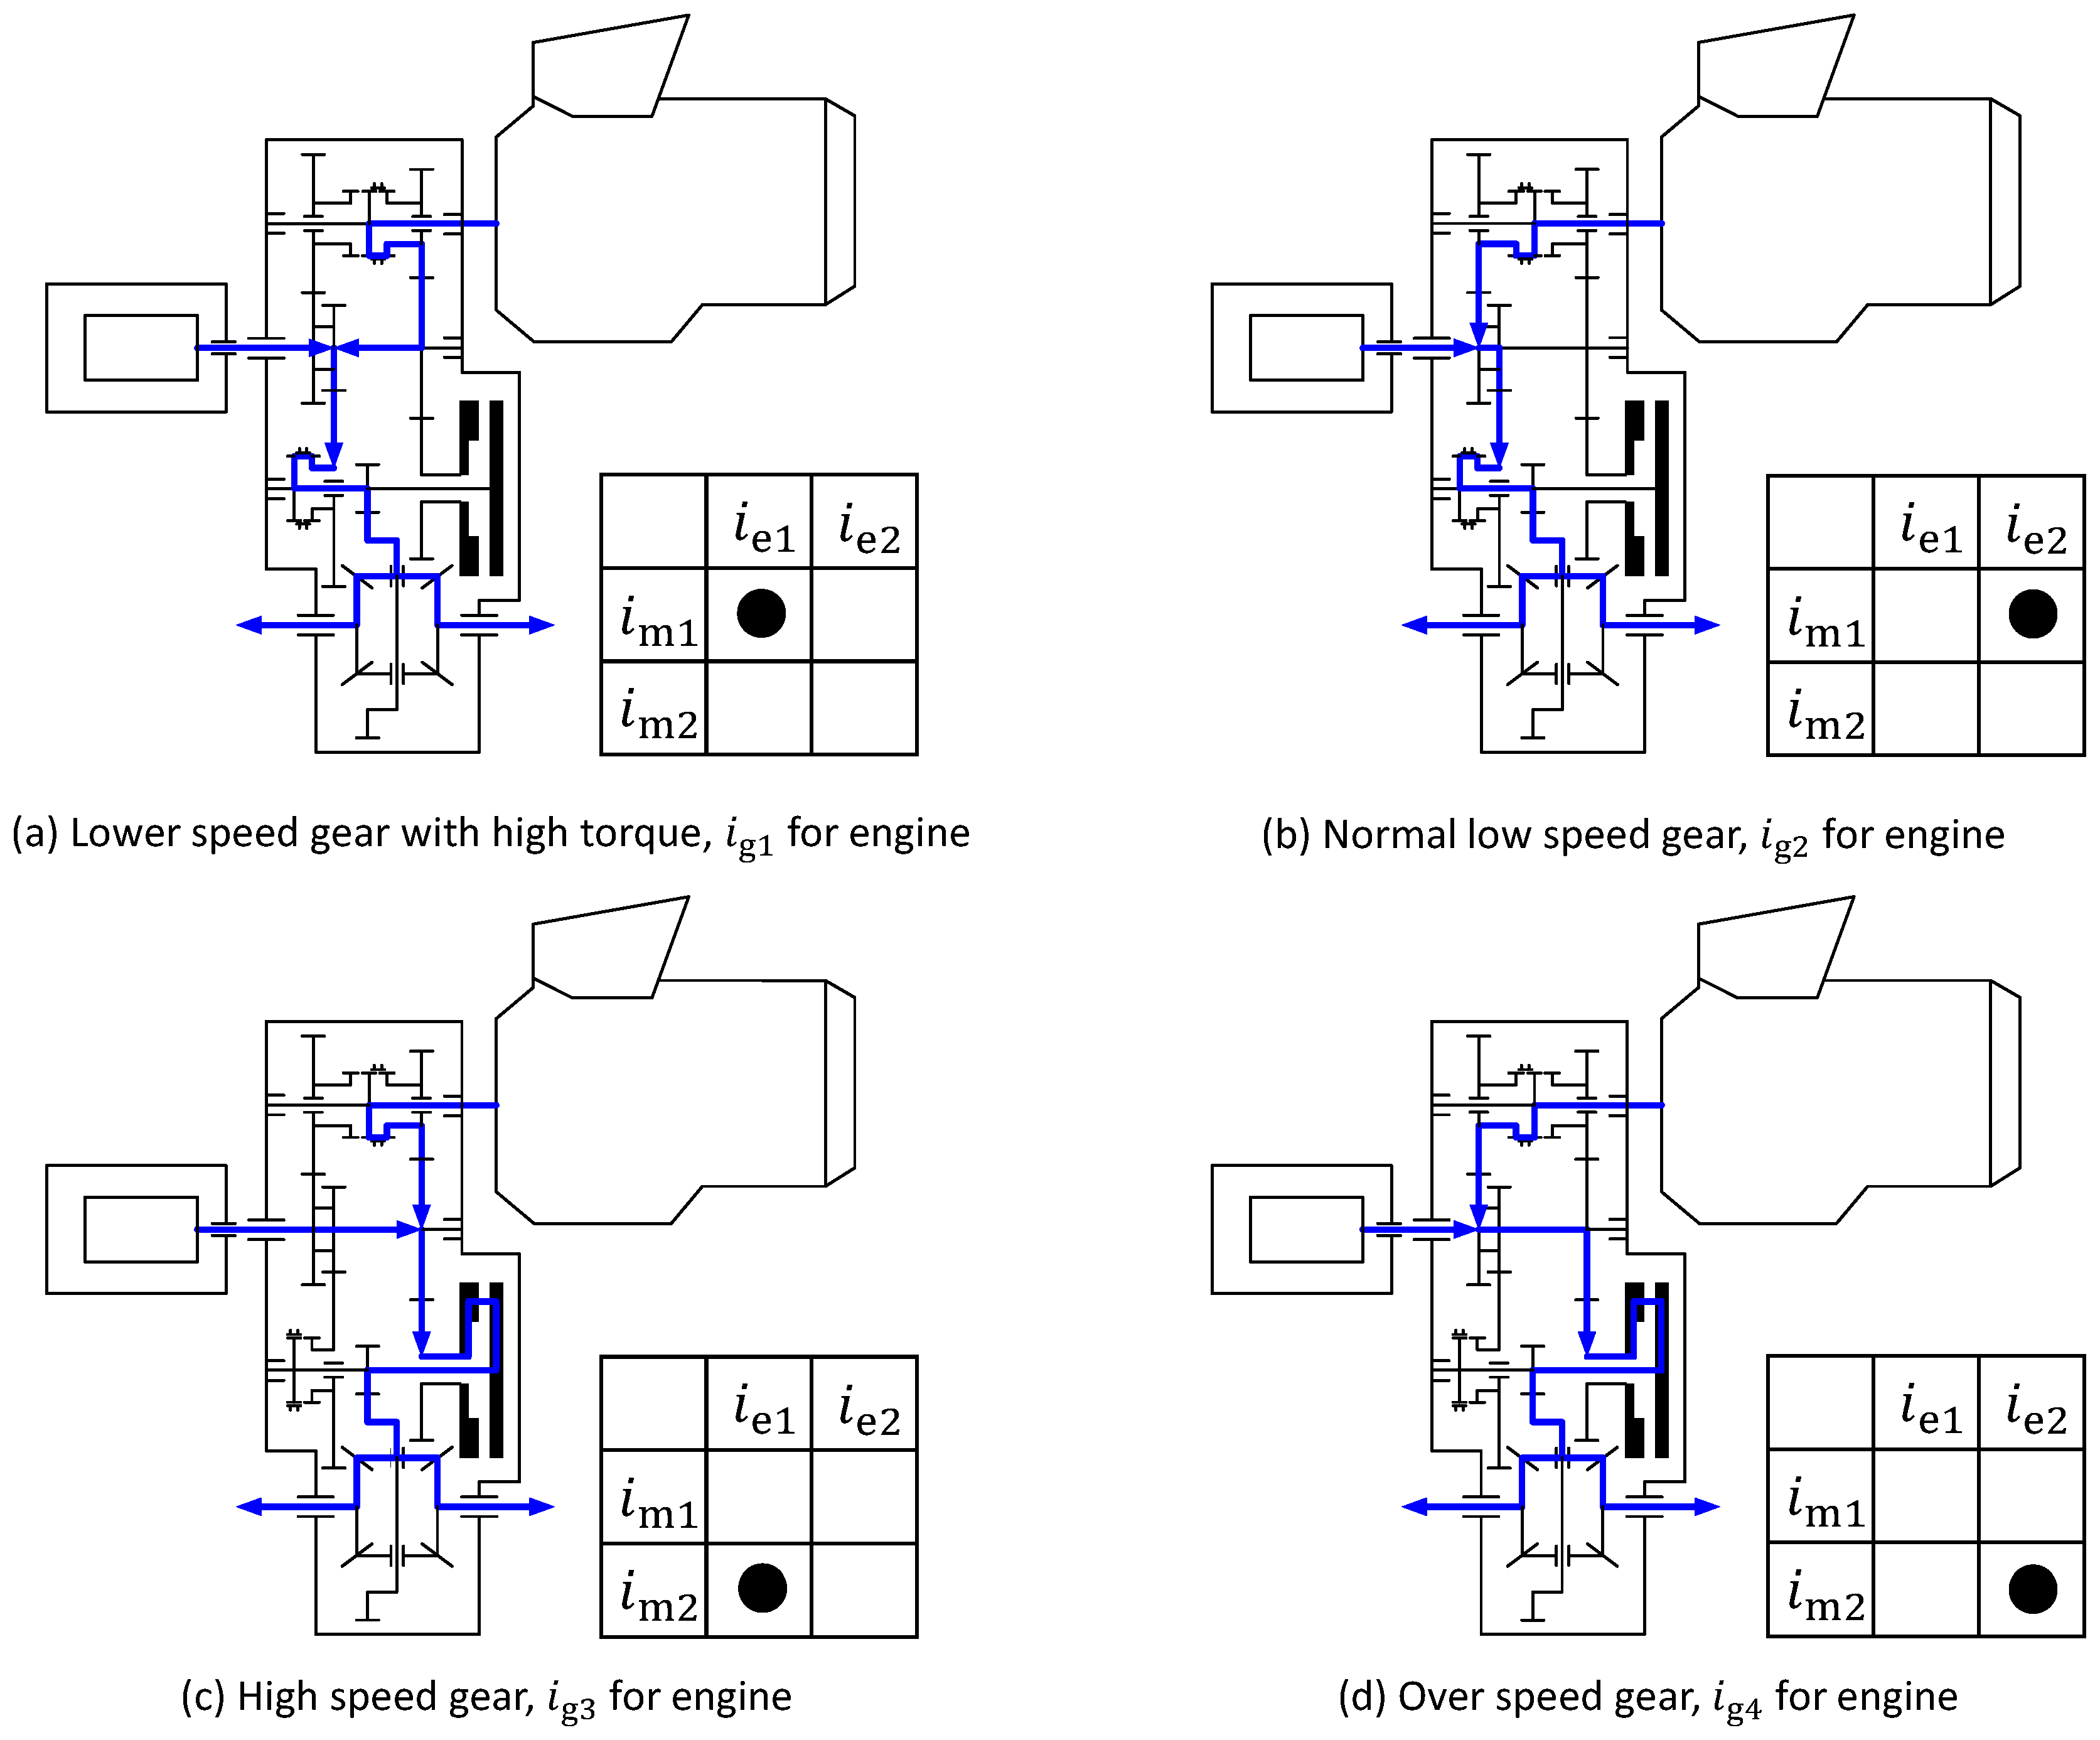
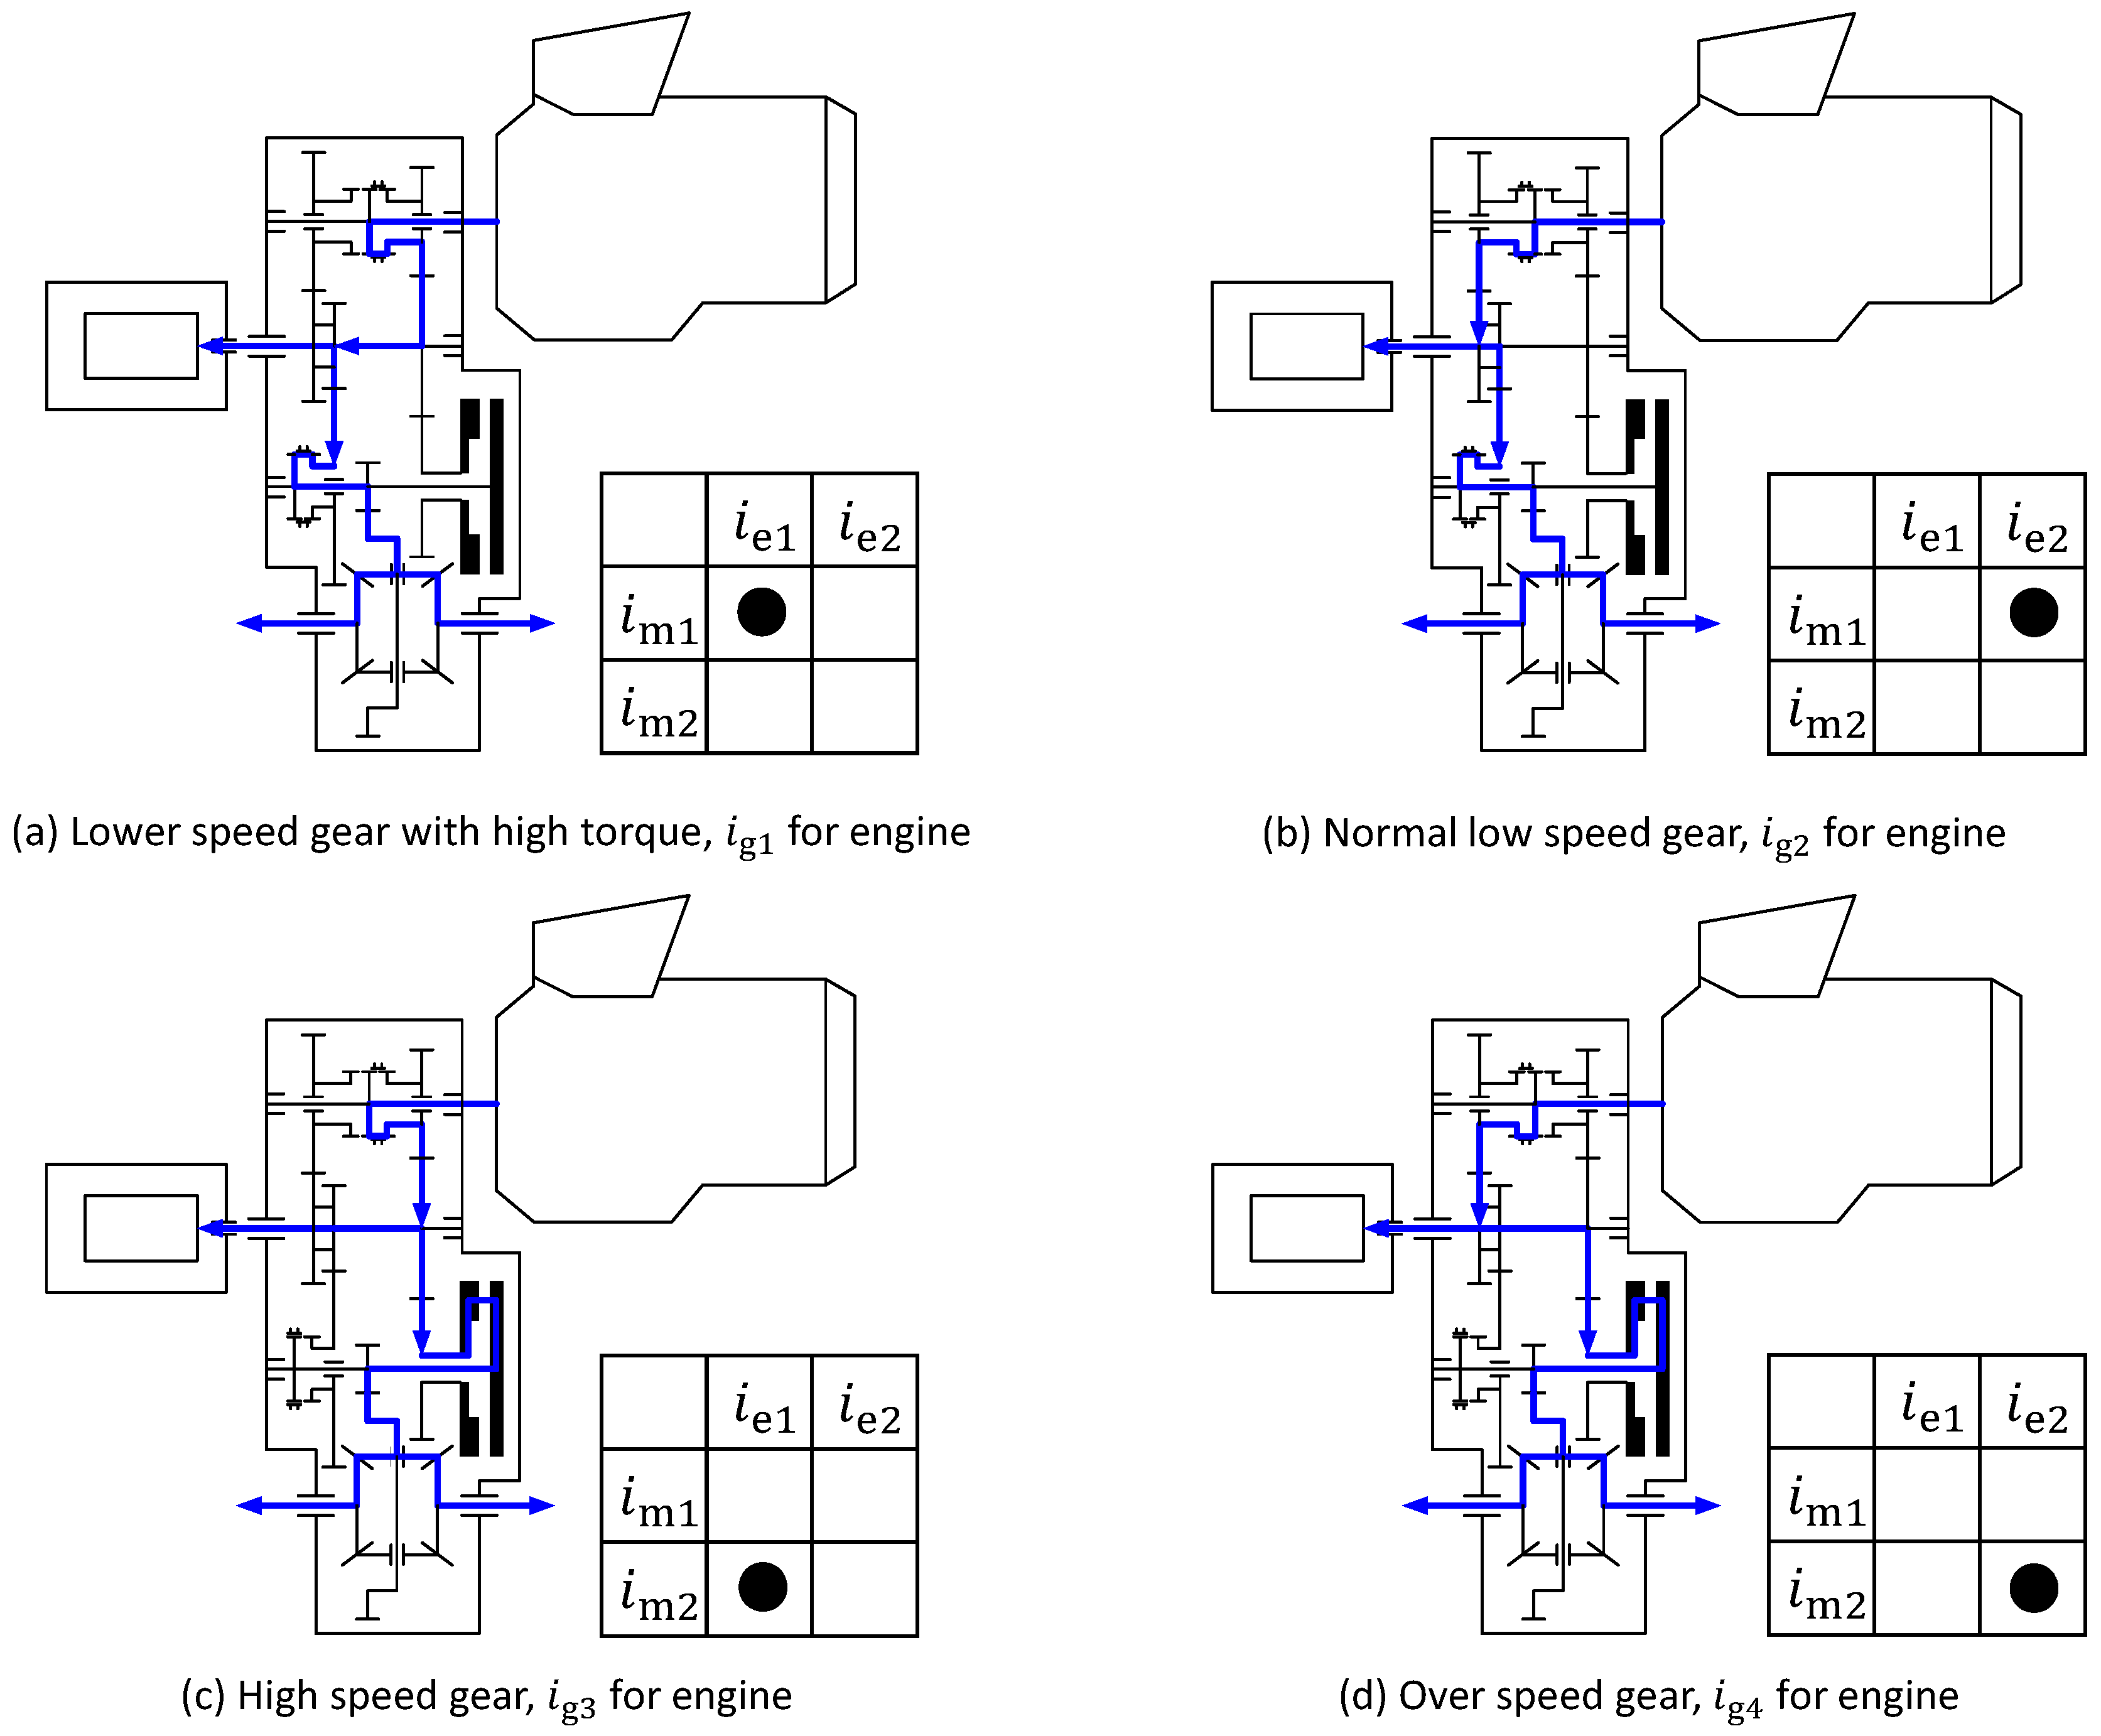
Similarly, in HEV mode, both the engine and motor get involved in the operation and the transmission supplies four gears to the engine. Moreover, there exists two different occasions in the HEV mode, which are labeled as the under-powered driving mode and the over-powered driving mode. In the under-powered driving mode, both the engine and motor act as the power source to supply the power, but in the over-powered driving mode, the motor serves as a generator to charge the battery and the engine not only contributes to the vehicle, but also drives the motor to charge the battery. Figure 13 and Figure 14 illustrate the power routes of these two driving modes.
The working modes will change according to the different states of the relevant parameters, such as the demanded vehicle torque, of the battery, and so on. Here, the transition process from the EV mode to the HEV mode is taken as an example to introduce the mode switch process. When the value is sufficient, the engine is off and only the motor contributes to the driving power, which is called the EV mode. When the acceleration pedal is pressed or the vehicle resistance becomes larger, wherein the motor cannot provide the required torque individually, the engine is started by the starter motor. After the engine speed adjustment, the synchronizer on the engine output shaft is engaged and the required power is supplied by the engine and the motor together, which is the HEV under-powered driving mode.
When the value is less than a specific lower threshold (e.g., < 0.3), the starter motor also starts the engine; in this condition, however, the motor works as a generator and the engine not only contributes to the vehicle, but also drives the motor to charge the battery, which is the HEV over-powered driving mode.
3.2. Gear Shift Process
3.2.1. EV Mode
Here, the gear upshift process from the low speed gear to the high speed gear in the EV mode is taken as an example to be analyzed in detail. In the low speed gear, the power is transmitted through the synchronization of the first synchronizer 4, and when the gear upshift instruction is given, the torque phase begins, and the clutch starts to engage gradually. As a result, the torque transmitted by the clutch increases gradually while that transmitted by the synchronizer decreases. When the torque transmitted by the synchronizer is zero, the synchronizer separates with the low speed gear, which means the end of the torque phase and the beginning of the inertia phase. In the inertia phase, the clutch continues to engage, and the motor speed is regulated to guarantee the fast and smooth engagement of the clutch. Finally, the clutch is locked up and the gear upshift process from the low speed gear to the high speed gear is finished. Due to the function of the clutch, there always exist power transmitted to the vehicle and the gear upshift process can be completed without power interruption. Opposite to the gear upshift process, the gear downshift process begins from the inertia phase and ends with the torque phase. For more details about the gear shift process, refer to [39].
3.2.2. HEV Mode
Due to the high similarity of the four gear shift processes in the HEV mode, the gear upshift process from the low speed gear to the high speed gear is also taken as an example to be analyzed in this mode. Just like the EV mode, firstly, the clutch starts to engage gradually, and the torque transmitted by the clutch increases and transmitted by the first synchronizer 4 decreases, separately. When the torque transmitted to the vehicle through the first synchronizer is zero, the synchronizer separates with the low speed gear. At the same time, the torque from the engine decreases, and when engine’s torque goes to zero, the second synchronizer 10 is separated from the third gear wheel. Then, the engine speed adjustment process will occur. When the engine speed is close to the fourth gear speed, the second synchronizer engages and the gear shift process of the engine shaft is finished. In addition, the clutch continues to engage until it is locked up. Finally, the engine and motor continue to work together to drive the vehicle and the gear upshift process in the HEV mode is achieved.
4. Performance Validation of the Proposed Powertrain
To validate the quality and performance of the novel powertrain architecture, a simulation model is constructed in the software AMESim (Version 10, Siemens Product Lifecycle Management Software Inc., Munich, Germany), and the arrangement is shown in Figure 15. Apart from the data listed in Table 1, other parameters which are necessary to conduct the simulation are listed in Table 3.
4.1. Fuel Consumption
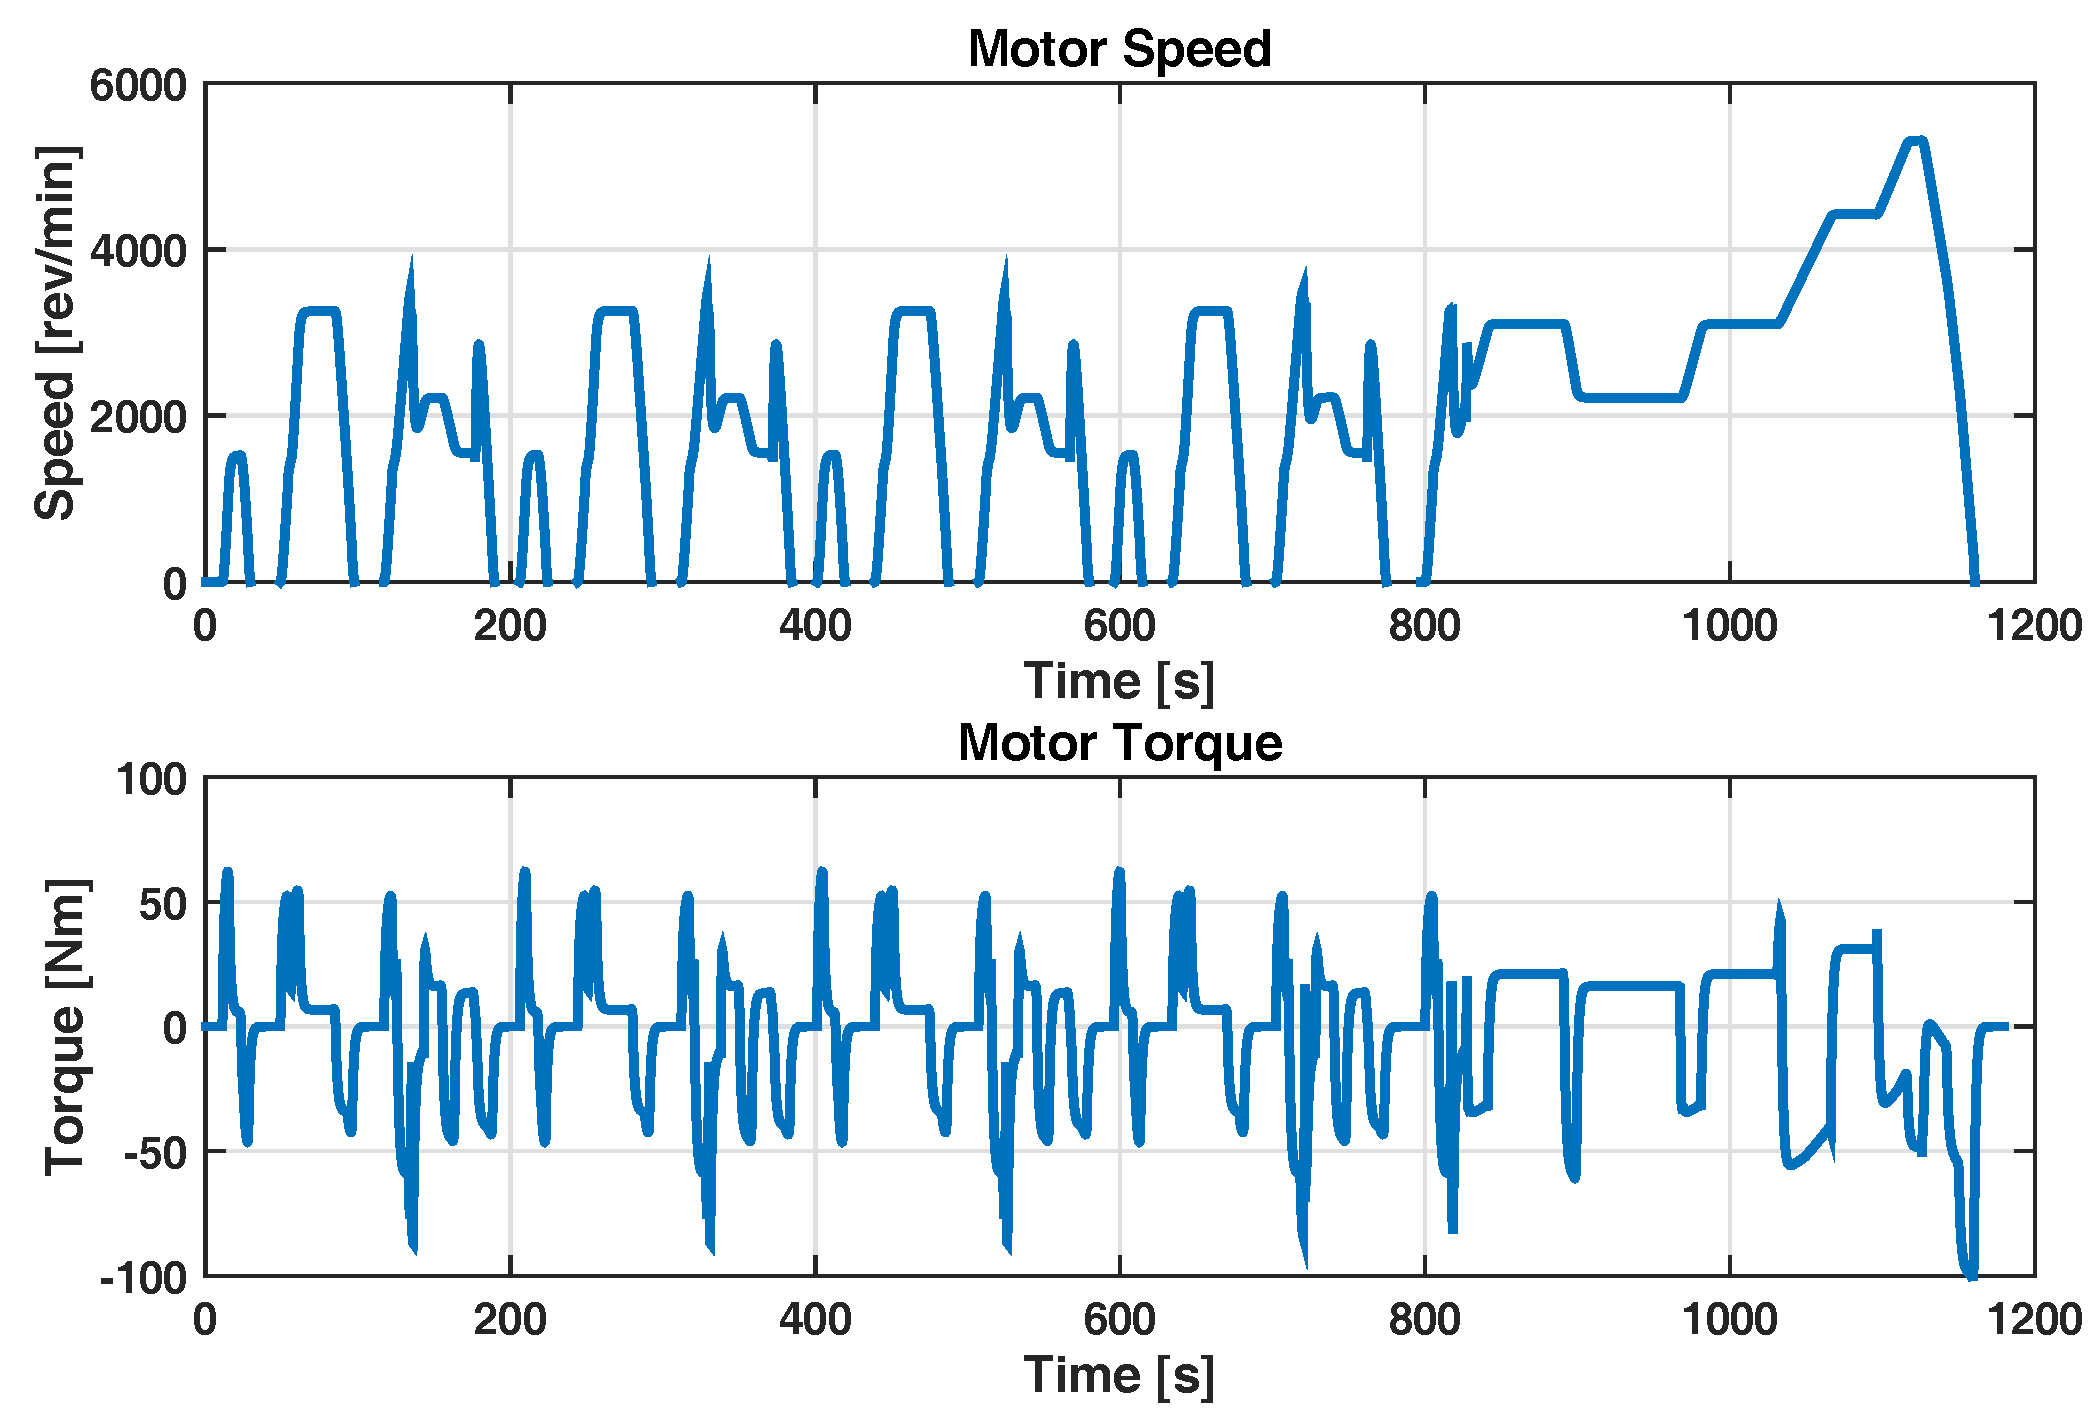
Similarly, NEDC is chosen as the operating condition, and the working states of the vehicle components, including the engine, the motor and value of the battery, are depicted in Figure 16 and Figure 17, respectively.
As shown in Figure 16 and Figure 17, the novel powertrain architecture can satisfy the driving demands through the cooperation between the engine and motor. The four gears for the engine and the two gears for the motor ensure that the two power sources can choose the appropriate gears so that they can work in a high-efficiency area, and for a 1.8 t vehicle operating under the charge-sustaining condition, the fuel consumption is 4.30 L/100 km.
4.2. Gear Shift Quality
4.2.1. Gear Shift Process
The shift process from the low speed gear to the high speed gear in the EV mode is taken as an example to be analyzed, whose gear upshift process can be divided into two phases: the torque phase and the inertia phase, and the dynamic characteristics of the powertrain can be listed as follows.
The torque applied on the wheels can be represented as:
Firstly, when the vehicle operates in the low speed gear:
In the torque phase, the clutch starts to engage, and the equation between and satisfy:
Then, when the torque transmitted by the first synchronizer is zero, the synchronizer separates with the gear and the torque phase is finished, so the torque equations become:
where is the torque applied on the wheels, is the torque on the driven gear of the first synchronizer, is the torque transmitted by the clutch, is the torque transmitted by the motor, is the main reducer ratio, and are the low speed gear and high speed gear ratio in the EV mode.
The next step is the inertia phase and the main task in this phase is the adjustment of the motor speed that further realizes the synchronization of the clutch.
At the start of the inertia phase, the motor speed equation is:
When the speed of the clutch driving disk is close to the speed of the driven disk, the clutch is locked up, and the motor speed equation is:
where, is the motor speed, and are the rotational speed of the left and right wheels.
4.2.2. Gear Shift Results
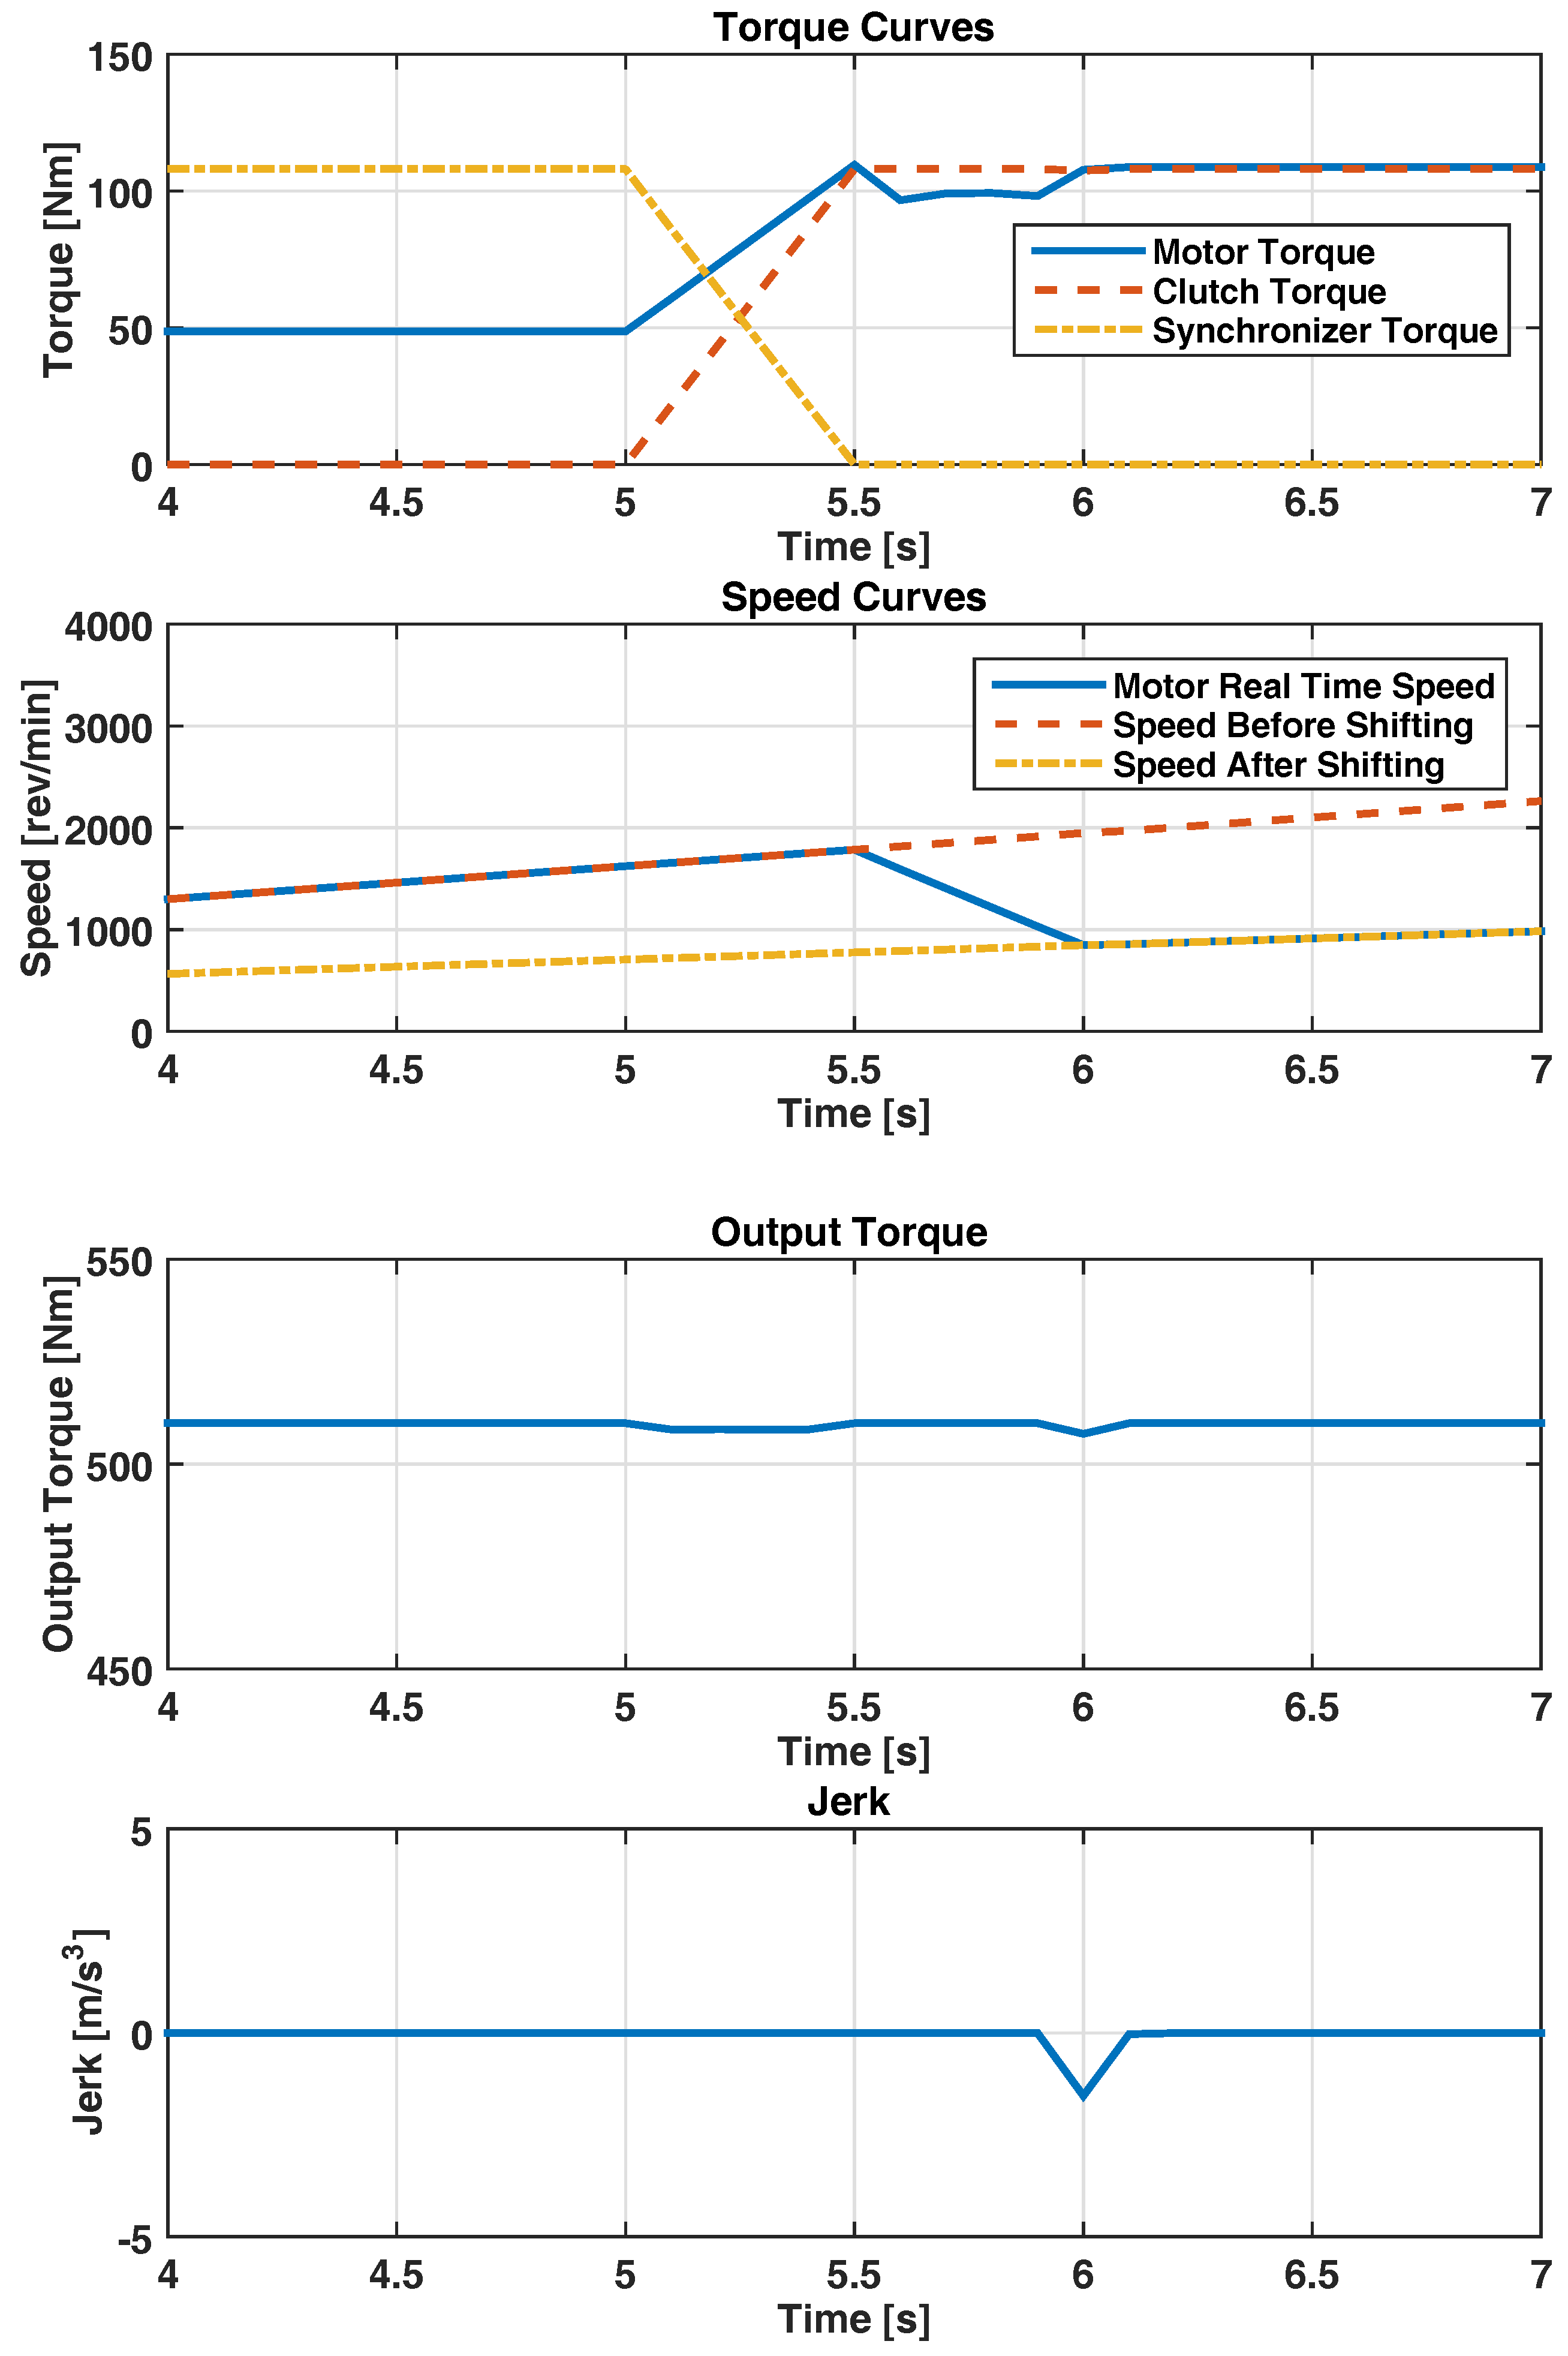
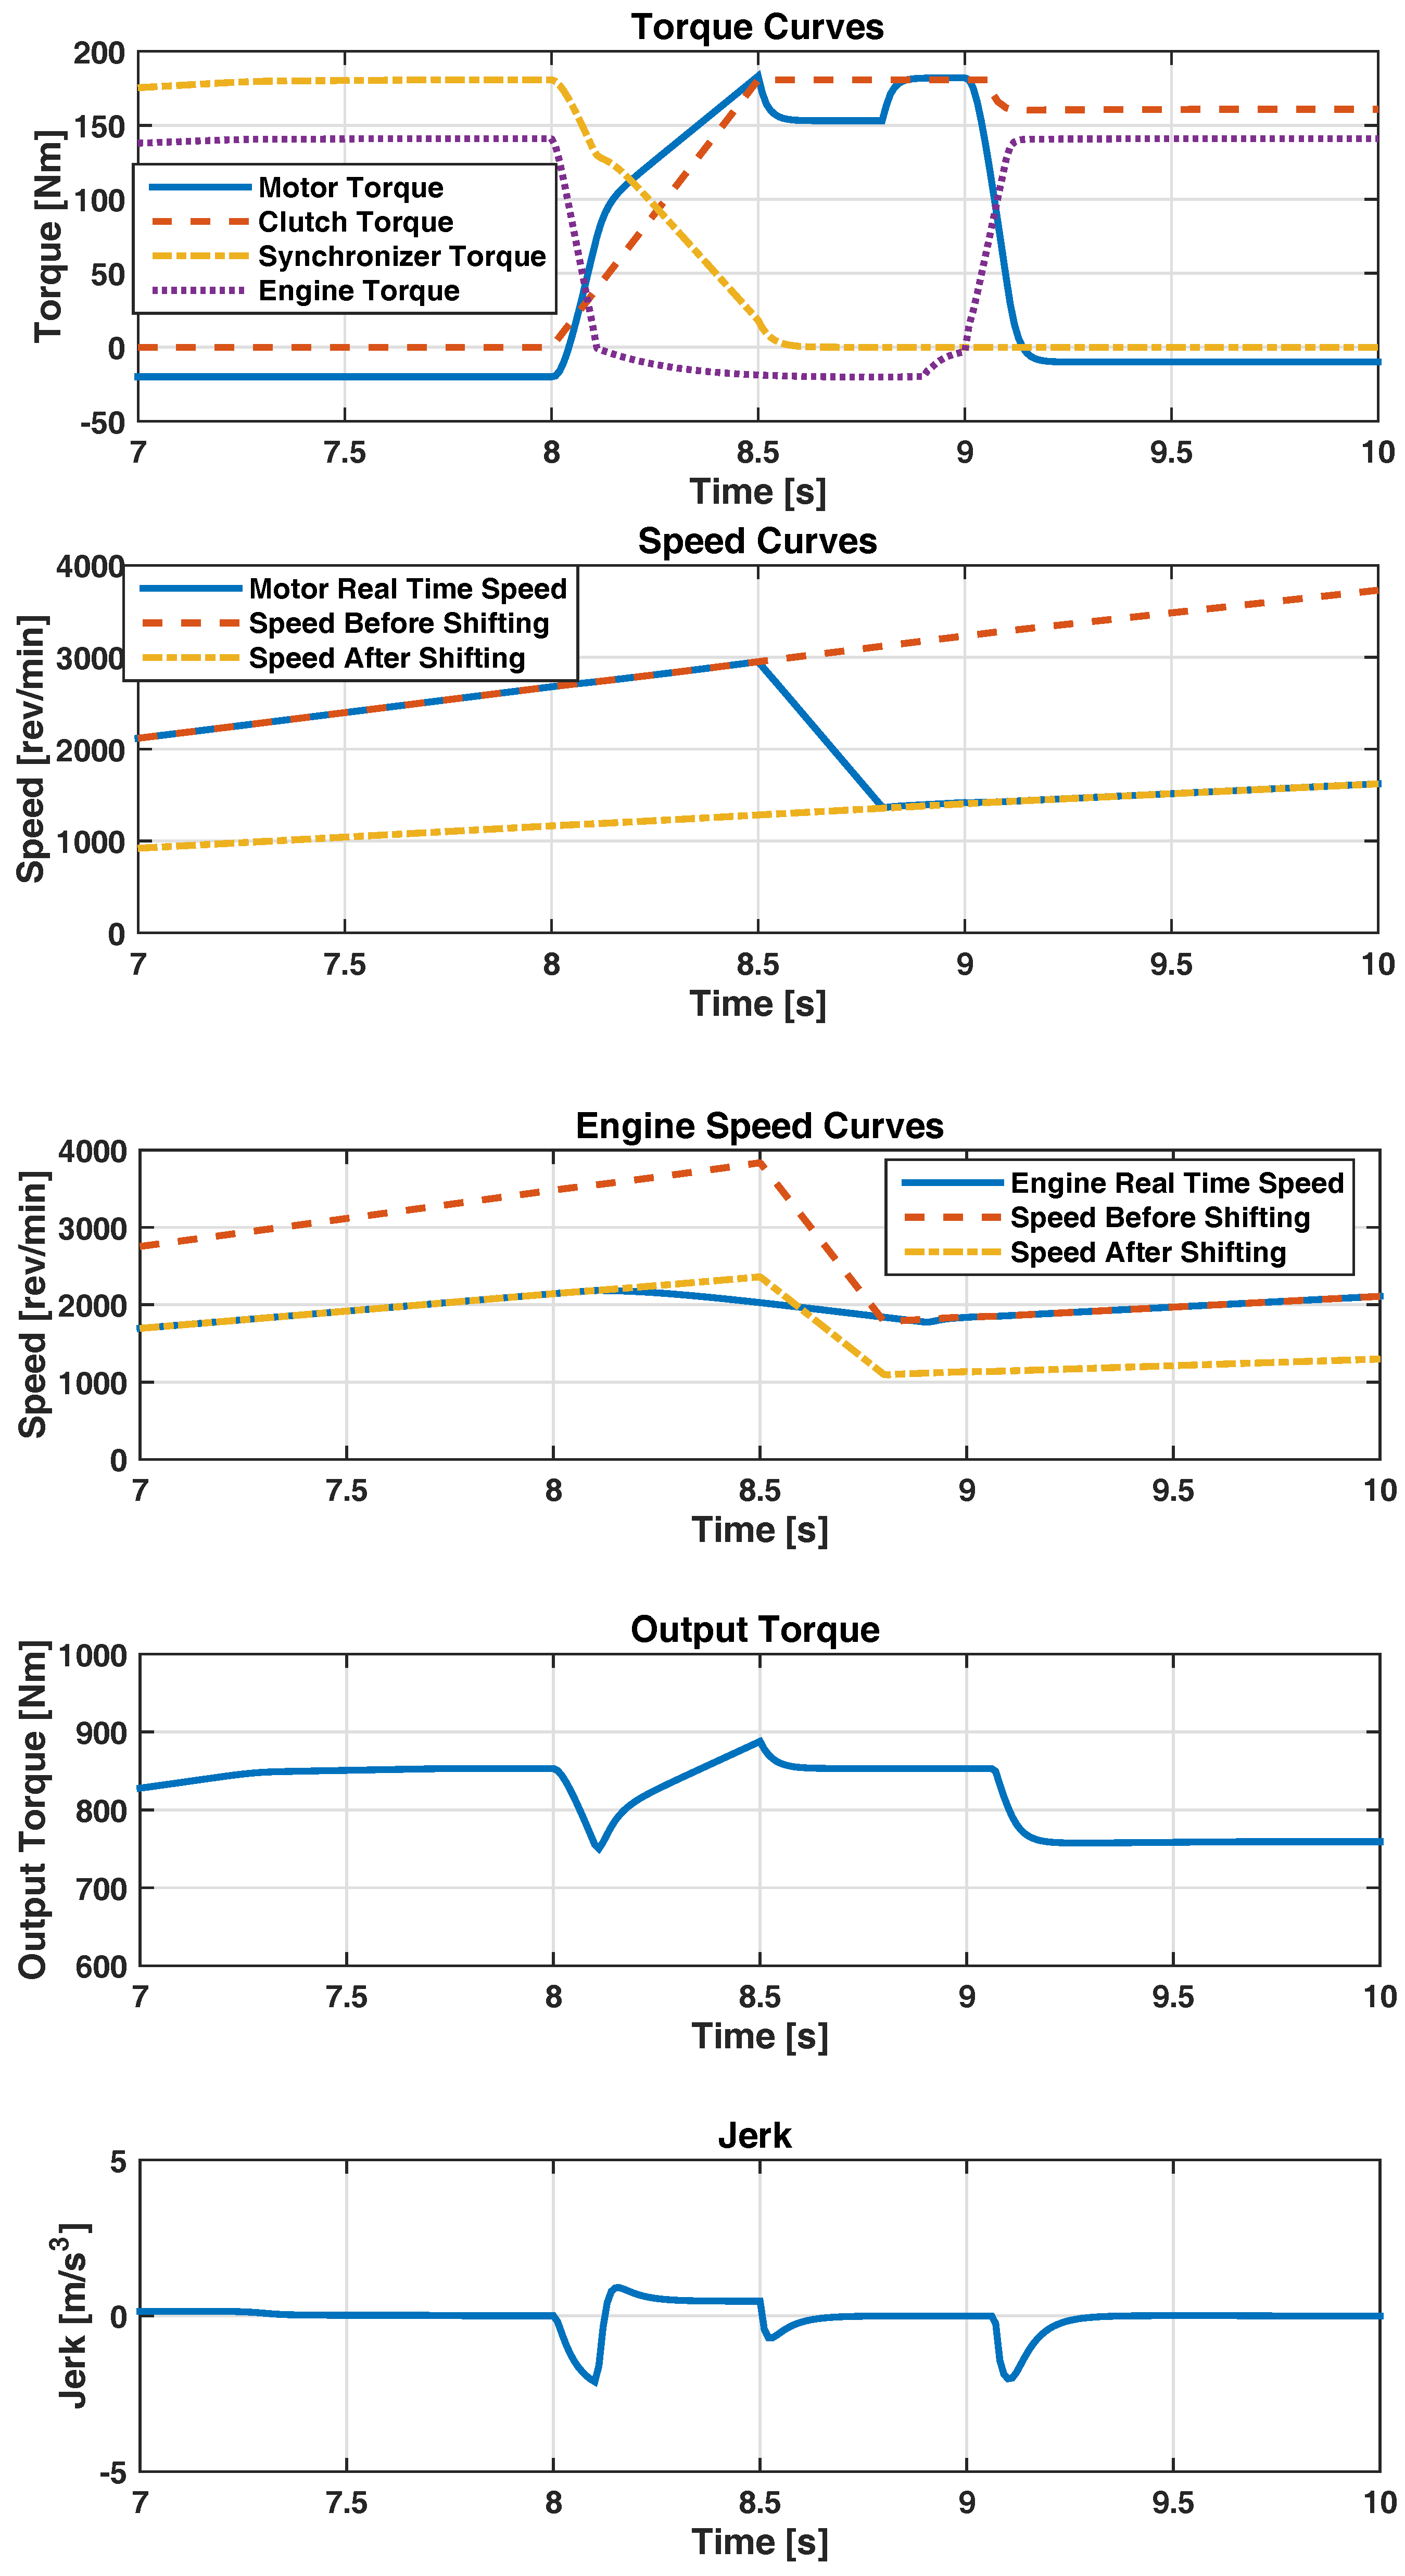
The gear upshift processes in the EV mode from Figure 12a,b and in the HEV mode from Figure 13b,c are taken as examples and results are shown in Figure 18 and Figure 19, respectively.
In the EV mode, the gear shift process starts at 5 s. As described before, in the torque phase, the clutch engages gradually so that the torque of the clutch increases, and the torque transmitted by the first synchronizer decreases, correspondingly. At the same time, the motor increases the output torque to compensate the torque hole. When the torque transmitted by the first synchronizer becomes zero, the synchronizer disengages completely and the inertia phase begins. In the inertia phase, the motor torque will decrease significantly so that the motor speed can be adjusted quickly to keep track of the output speed. Then, when the speed difference of the clutch is zero, the clutch engages completely and the gear shift process is finished.
The difference between the EV mode and HEV mode is that, during the gear shift process of HEV, the engine also needs to go through the speed adjustment process so that the gear shift in the first transmission input shaft can be achieved successfully. It can be seen from Figure 19 that motor speed and engine speed can both track the desired speed rapidly and smoothly without large fluctuation.
In addition, from the output torque in Figure 18 and Figure 19, it can be concluded that the gear shift process is accomplished without the power interruption, in spite of the output torque’s slight fluctuation due to the influence of engine torque and motor torque adjustment. Furthermore, the maximum vehicle jerk in the EV mode and the HEV mode are 1.66 m/s3 and 2.12 m/s3, respectively, which guarantee the drivability during the gear shift process.
5. Conclusions
Inspired by the engine developments and improvements, the effect of high-efficiency engine on the powertrain architecture is considered and the main conclusions can be summarized as follows:
- According to the massive studies, advanced technologies and developments, a future engine model with better thermal efficiency and extended fuel economy area is set up.
- The relation between the future engine and the gearbox gear numbers are explored, and the simulation results indicate that for the HEVs, the gearbox with only four gears can satisfy the driving demand and the future engine shows a better performance of fuel consumption compared with the conventional engine.
- Based on the simulation results, a new powertrain architecture is introduced which can supply four gears for the engine operating condition and two gears for the motor operating condition. Besides, one highlight of this powertrain architecture is the gear shift process which can be achieved without power interruption.
- The fuel consumption and gear shift process of this new powertrain architecture are simulated in the AMESim software, and the simulation results demonstrate that the fuel consumption for a 1.8 t vehicle operating under the charge-sustaining condition is 4.30 L/100 km. In addition, the gear shift process in the EV mode and HEV mode can be completed without power interruption and the maximum jerk are 1.66 m/s3 and 2.12 m/s3, respectively.
Author Contributions
B.G. and J.H. were responsible for the dynamic programming algorithm, simulation conduction and results analysis. L.Z. proposed the future engine map. L.Z. and Y.L. wrote and revised the paper in language.
Acknowledgments
This work was supported in part by the National Nature Science Foundation of China under Grant No. 61520106008 and Grant No. 61522307, China Automobile Industry Innovation and Development Joint Fund under Grant No. U1664257, and Program for JLU Science and Technology Innovative Research Team No. 2017TD-20.
Conflicts of Interest
The authors declare no conflict of interest.
References
- Solouk, A.; Shahbakhti, M. Energy Optimization and Fuel Economy Investigation of a Series Hybrid Electric Vehicle Integrated with Diesel/RCCI Engines. Energies 2016, 9, 1020. [Google Scholar] [CrossRef]
- Al-Alawi, B.M.; Bradley, T.H. Review of hybrid plug-inhybrid and electric vehicle market modeling Studies. Renew. Sustain. Energy Rev. 2013, 21, 190–203. [Google Scholar] [CrossRef]
- Hannan, M.A.; Azidin, F.A.; Mohamed, A. Hybrid electric vehicles and their challenges: A review. Renew. Sustain. Energy Rev. 2014, 29, 135–150. [Google Scholar] [CrossRef]
- Pisu, P.; Rizzoni, G. A Comparative Study Of Supervisory Control Strategies for Hybrid Electric Vehicles. IEEE Trans. Control Syst. Technol. 2007, 15, 506–518. [Google Scholar] [CrossRef]
- Feng, R.H.; Li, Y.T.; Yang, J.; Fu, J.Q.; Zhang, D.M.; Zheng, G.Z. Investigations of Atkinson Cycle Converted from Conventional Otto Cycle Gasoline Engine. SAE Tech. Pap. 2016. [Google Scholar] [CrossRef]
- Pertl, P.; Trattner, A.; Abis, A.; Schmidt, S.; Kirchberger, R.; Sato, T. Expansion to Higher Efficiency— Experimental Investigations of the Atkinson Cycle in Small Combustion Engines. SAE Tech. Pap. 2012. [Google Scholar] [CrossRef]
- Ikeya, K.; Takazawa, M.; Yamada, T.; Park, S.; Tagishi, R. Thermal Efficiency Enhancement of a Gasoline Engine. SAE Int. J. Engines 2015, 8, 1579–1586. [Google Scholar] [CrossRef]
- Yonekawa, A.; Ueno, M.; Watanabe, O.; Ishikawa, N. Development of New Gasoline Engine for ACCORD Plug-in Hybrid. SAE Tech. Pap. 2013. [Google Scholar] [CrossRef]
- Hwang, K.; Hwang, I.; Lee, H.; Park, H.; Choi, H.; Lee, K.; Kim, W.; Kim, H.; Han, B.; Lee, J.; et al. Development of New High-Efficiency Kappa 1.6 L GDI Engine. SAE Tech. Pap. 2016. [Google Scholar] [CrossRef]
- Yamada, T.; Adachi, S.; Nakata, K.; Kurauchi, T.; Takagi, I. Economy with superior thermal efficient combustion (ESTEC). SAE Tech. Pap. 2014. [Google Scholar] [CrossRef]
- Nakata, K.; Nogawa, S.; Takahashi, D.; Yoshihara, Y.; Kumagai, A.; Suzuki, T. Engine technologies for achieving 45% thermal efficiency of SI engine. SAE Int. J. Engines 2016. [Google Scholar] [CrossRef]
- Solouk, A.; Shahbakhti, M.; Mahjoob, M.J. Energy Management and Control of a Hybrid Electric Vehicle With an Integrated Low Temperature Combustion (LTC) Engine. Dyn. Syst. Control 2014. [Google Scholar] [CrossRef]
- Solouk, A.; Shahbakhti, M. Modeling and energy management of an HCCI-based powertrain for series hybrid and extended range electric vehicles. Int. J. Powertrains 2017, 6, 1–33. [Google Scholar] [CrossRef]
- Hanson, R.; Spannbauer, S.; Gross, C.; Reitz, R.D.; Curran, S.; Storey, J.; Huff, S. Highway Fuel Economy Testing of an RCCI Series Hybrid Vehicle. SAE Tech. Pap. 2015. [Google Scholar] [CrossRef]
- Solouk, A.; Shakiba-herfeh, M.; Kannan, K.; Solmaz, H.; Dice, P.; Bidarvatan, M.; Kondipati, N.N.T.; Shahbakhti, M. Fuel Economy Benefits of Integrating a Multi-Mode Low Temperature Combustion (LTC) Engine in a Series Extended Range Electric Powertrain. SAE Tech. Pap. 2016. [Google Scholar] [CrossRef]
- Nuesch, S.; Stefanopoulou, A.G. Multimode combustion in a mild hybrid electric vehicle. Part 1: Supervisory control. Control Eng. Pract. 2016, 57, 99–110. [Google Scholar] [CrossRef]
- Solouk, A.; Shakiba-Herfeh, M.; Shahbakhti, M. Analysis and control of a torque blended hybrid electric powertrain with a multi-mode LTC-SI engine. SAE Int. J. Altern. Powertrains 2017, 6, 54–67. [Google Scholar] [CrossRef]
- Solouk, A.; Shakiba-Herfeh, M.; Arora, J.; Shahbakhti, M. Fuel consumption assessment of an electrified powertrain with a multi-mode high-efficiency engine in various levels of hybridization. Energy Convers. Manag. 2017, 155, 100–115. [Google Scholar] [CrossRef]
- Zhang, L.P.; Qi, B.N.; Zhang, R.S.; Liu, J.C.; Wang, L.Q. Powertrain design and energy management of a novel coaxial series-parallel plug-in hybrid electric vehicle. Sci. China Technol. Sci. 2016, 59, 618–630. [Google Scholar] [CrossRef]
- Guzzella, L.; Sciarretta, A. Vehicle Propulsion Systems; Springer: Berlin/Heidelberg, Germany; New York, NY, USA, 2007; pp. 73–77. ISBN 978-3-540-74691-1. [Google Scholar]
- Williamson, S.S. Energy Management Strategies for Electric and Plug-in Hybrid Electric Vehicles; Springer: New York, NY, USA, 2013; pp. 7–13. ISBN 9781461477105. [Google Scholar]
- Jager, B.; Keulen, T.; Kessels, J. Optimal Control of Hybrid Vehicle; Springer: Berlin, Germany, 2013; pp. 1–12. ISBN 978-1-4471-5075-6. [Google Scholar]
- Jauch, C.; Tamilarasan, S.; Bovee, K.; Guvenc, L.; Rizzoni, G. Modeling for drivability and drivability improving control of HEV. Control Eng. Pract. 2018, 70, 50–62. [Google Scholar] [CrossRef]
- Johnson, V.H.; Wipke, K.B.; Rausen, D.J. HEV Control Strategy for Real-Time Optimization of Fuel Economy and Emissions. Mccarthy 2000. [Google Scholar] [CrossRef]
- Walker, A.; McGordon, A.; Hannis, G.; Picarelli, A.; Breddy, J.; Carter, S.; Vinsome, A.; Jennings, P.; Dempsey, M.; Willows, M. A Novel Structure for Comprehensive HEV Powertrain Modelling. In Proceedings of the 2006 IEEE Vehicle Power and Propulsion Conference, VPPC 2006, Windsor, UK, 6–8 September 2006; pp. 1–5. [Google Scholar]
- Conlon, B.M.; Blohm, T.; Harpster, M.; Holmes, A.; Palardy, M.; Tarnowsky, S.; Zhou, L. The Next Generation “Voltec” Extended Range EV Propulsion System. SAE Int. J. Altern. Powertrains 2015, 4, 248–259. [Google Scholar] [CrossRef]
- Higuchi, N.; Sunaga, Y.; Tanaka, M.; Shimada, H. Development of a New Two-Motor Plug-In Hybrid System. SAE Int. J. Altern. Powertrains 2013, 2, 135–145. [Google Scholar] [CrossRef]
- Hofman, T.; Ebbesen, S.; Guzzella, L. Topology optimization for hybrid electric vehicles with automated transmissions. IEEE Trans. Veh. Technol. 2012, 61, 2442–2451. [Google Scholar] [CrossRef]
- Delorme, A.; Rousseau, A.; Wallner, T.; Ortiz-Soto, E.A.; Babajimopoulos, A.; Assanis, D.N. Evaluation of homogeneous charge compression ignition (HCCI) engine fuel savings for various electric drive powertrains. In Proceedings of the The 25th World Battery, Hybrid and Fuel Cell Electric Vehicle Symposium & Exhibition, Shenzhen, China, 5–9 Noverber 2010. [Google Scholar]
- Lawler, B.; Ortiz-Soto, E.; Gupta, R.; Peng, H.; Filipi, Z.S. Hybrid Electric Vehicle Powertrain and Control Strategy Optimization to Maximize the Synergy with a Gasoline HCCI Engine. SAE Int. J. Engines 2011, 4, 1115–1126. [Google Scholar] [CrossRef]
- Robinette, D.L.; Wehrwein, D. Automatic Transmission Gear Ratio Optimization and Monte Carlo Simulation of Fuel Consumption with Parasitic Loss Uncertainty. SAE Int. J. Commer. Veh. 2015, 8, 45–62. [Google Scholar] [CrossRef]
- Robinette, D.L.; Singh, T. Internal Combustion Engine—Automatic Transmission Matching for Next Generation Power Transfer Technology Development in Automotive Applications. SAE Int. J. Engines 2016, 9, 1863–1880. [Google Scholar] [CrossRef]
- Sellnau, M.C.; Sinnamon, J.; Hoyer, K.; Kim, J.; Cavotta, M.; Husted, H. Part-Load Operation of Gasoline Direct-Injection Compression Ignition (GDCI) Engine. Sae Tech. Pap. 2013, 2, 29–38. [Google Scholar]
- Zhao, L.C.; Gao, B.Z.; Wu, J.Z.; Chen, H. Optimization of gear number for hybrid electric vehicles using dynamic programming. In Proceedings of the 2017 Chinese Automation Congress (CAC), Jinan, China, 20–22 October 2017; pp. 6646–6650. [Google Scholar]
- Solouk, A.; Tripp, J.; Shakiba-Herfeh, M.; Shahbakhti, M. Fuel consumption assessment of a multi-mode low temperature combustion engine as range extender for an electric vehicle. Energy Convers. Manag. 2017, 148, 1478–1496. [Google Scholar] [CrossRef]
- Nüesch, T.; Elbert, P.; Flankl, M.; Onder, C.; Guzzella, L. Convex Optimization for the Energy Management of Hybrid Electric Vehicles Considering Engine Start and Gearshift Costs. Energies 2014, 7, 834–856. [Google Scholar] [CrossRef]
- Elbert, P.; Ebbesen, S.; Guzzella, L. Implementation of Dynamic Programming for n-Dimensional Optimal Control Problems with Final State Constraints. IEEE Trans. Control Syst. Technol. 2013, 21, 924–931. [Google Scholar] [CrossRef]
- Wang, X.; He, H.; Sun, F.; Zhang, J. Application Study on the Dynamic Programming Algorithm for Energy Management of Plug-in Hybrid Electric Vehicles. Energies 2015, 8, 3225–3244. [Google Scholar] [CrossRef]
- Chen, H.; Gao, B.; Guo, L.; Liang, Q.; Xiang, Y. Hybrid Power Driving Device for Vehicle and Control Method Thereof. U.S. Patent US9370993B2, 12 March 2014. [Google Scholar]
Figure 1.
Engines with extended fuel economy area and low brake specific fuel consumption (BSFC).

Figure 2.
Configuration of the HEV (hybrid electric vehicle, is the engine output torque; is the transmission output torque; is the motor output torque; is the output torque of coupling gear; and are the torques on the left half shaft and right half shaft, respectively).
Figure 2.
Configuration of the HEV (hybrid electric vehicle, is the engine output torque; is the transmission output torque; is the motor output torque; is the output torque of coupling gear; and are the torques on the left half shaft and right half shaft, respectively).

Figure 3.
Engine fuel consumption map.

Figure 4.
Motor efficiency map.

Figure 5.
Battery model.
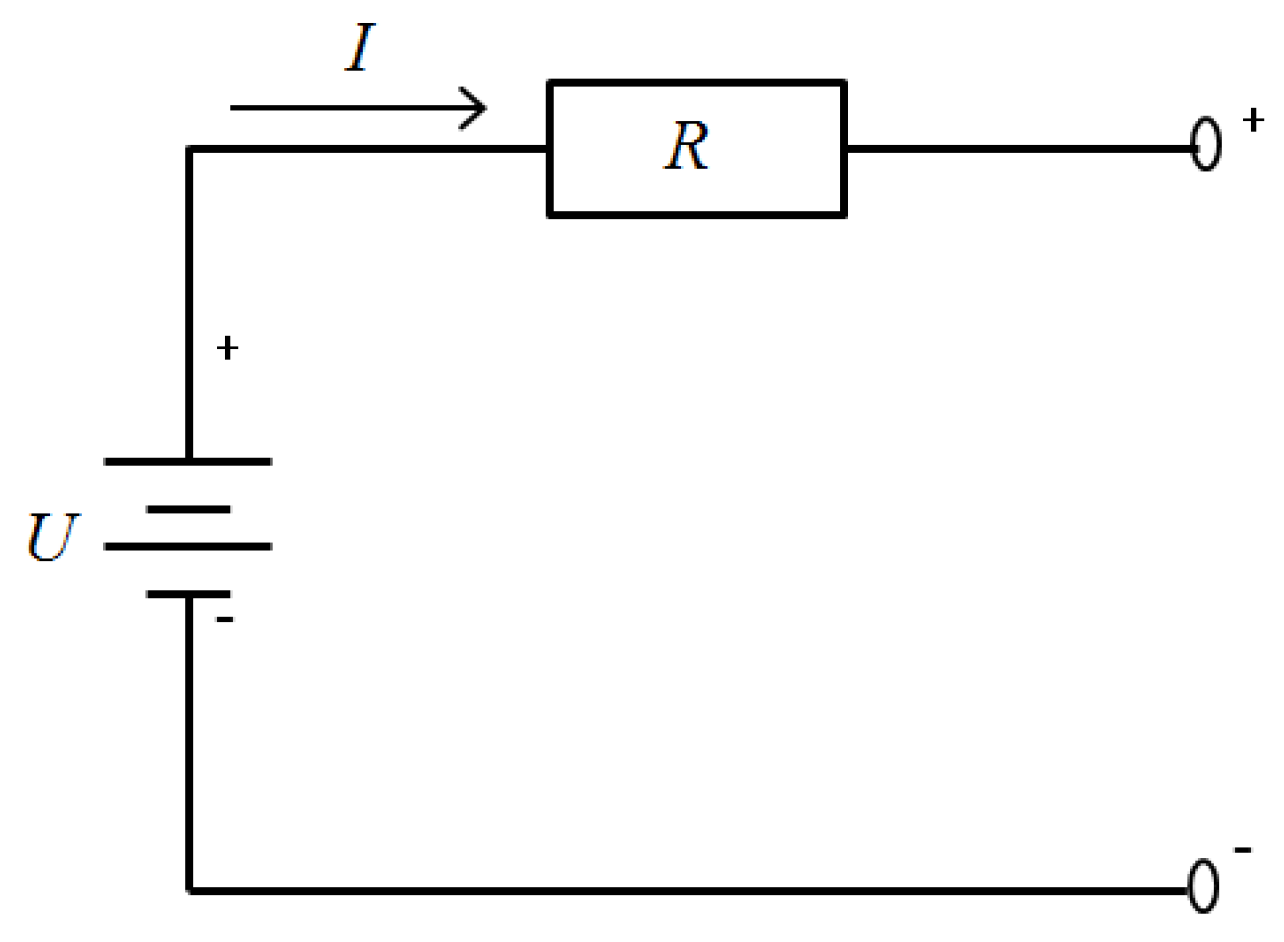
Figure 6.
The characteristic curves of battery.
Figure 7.
NEDC, J1015 and UDDS driving cycle.
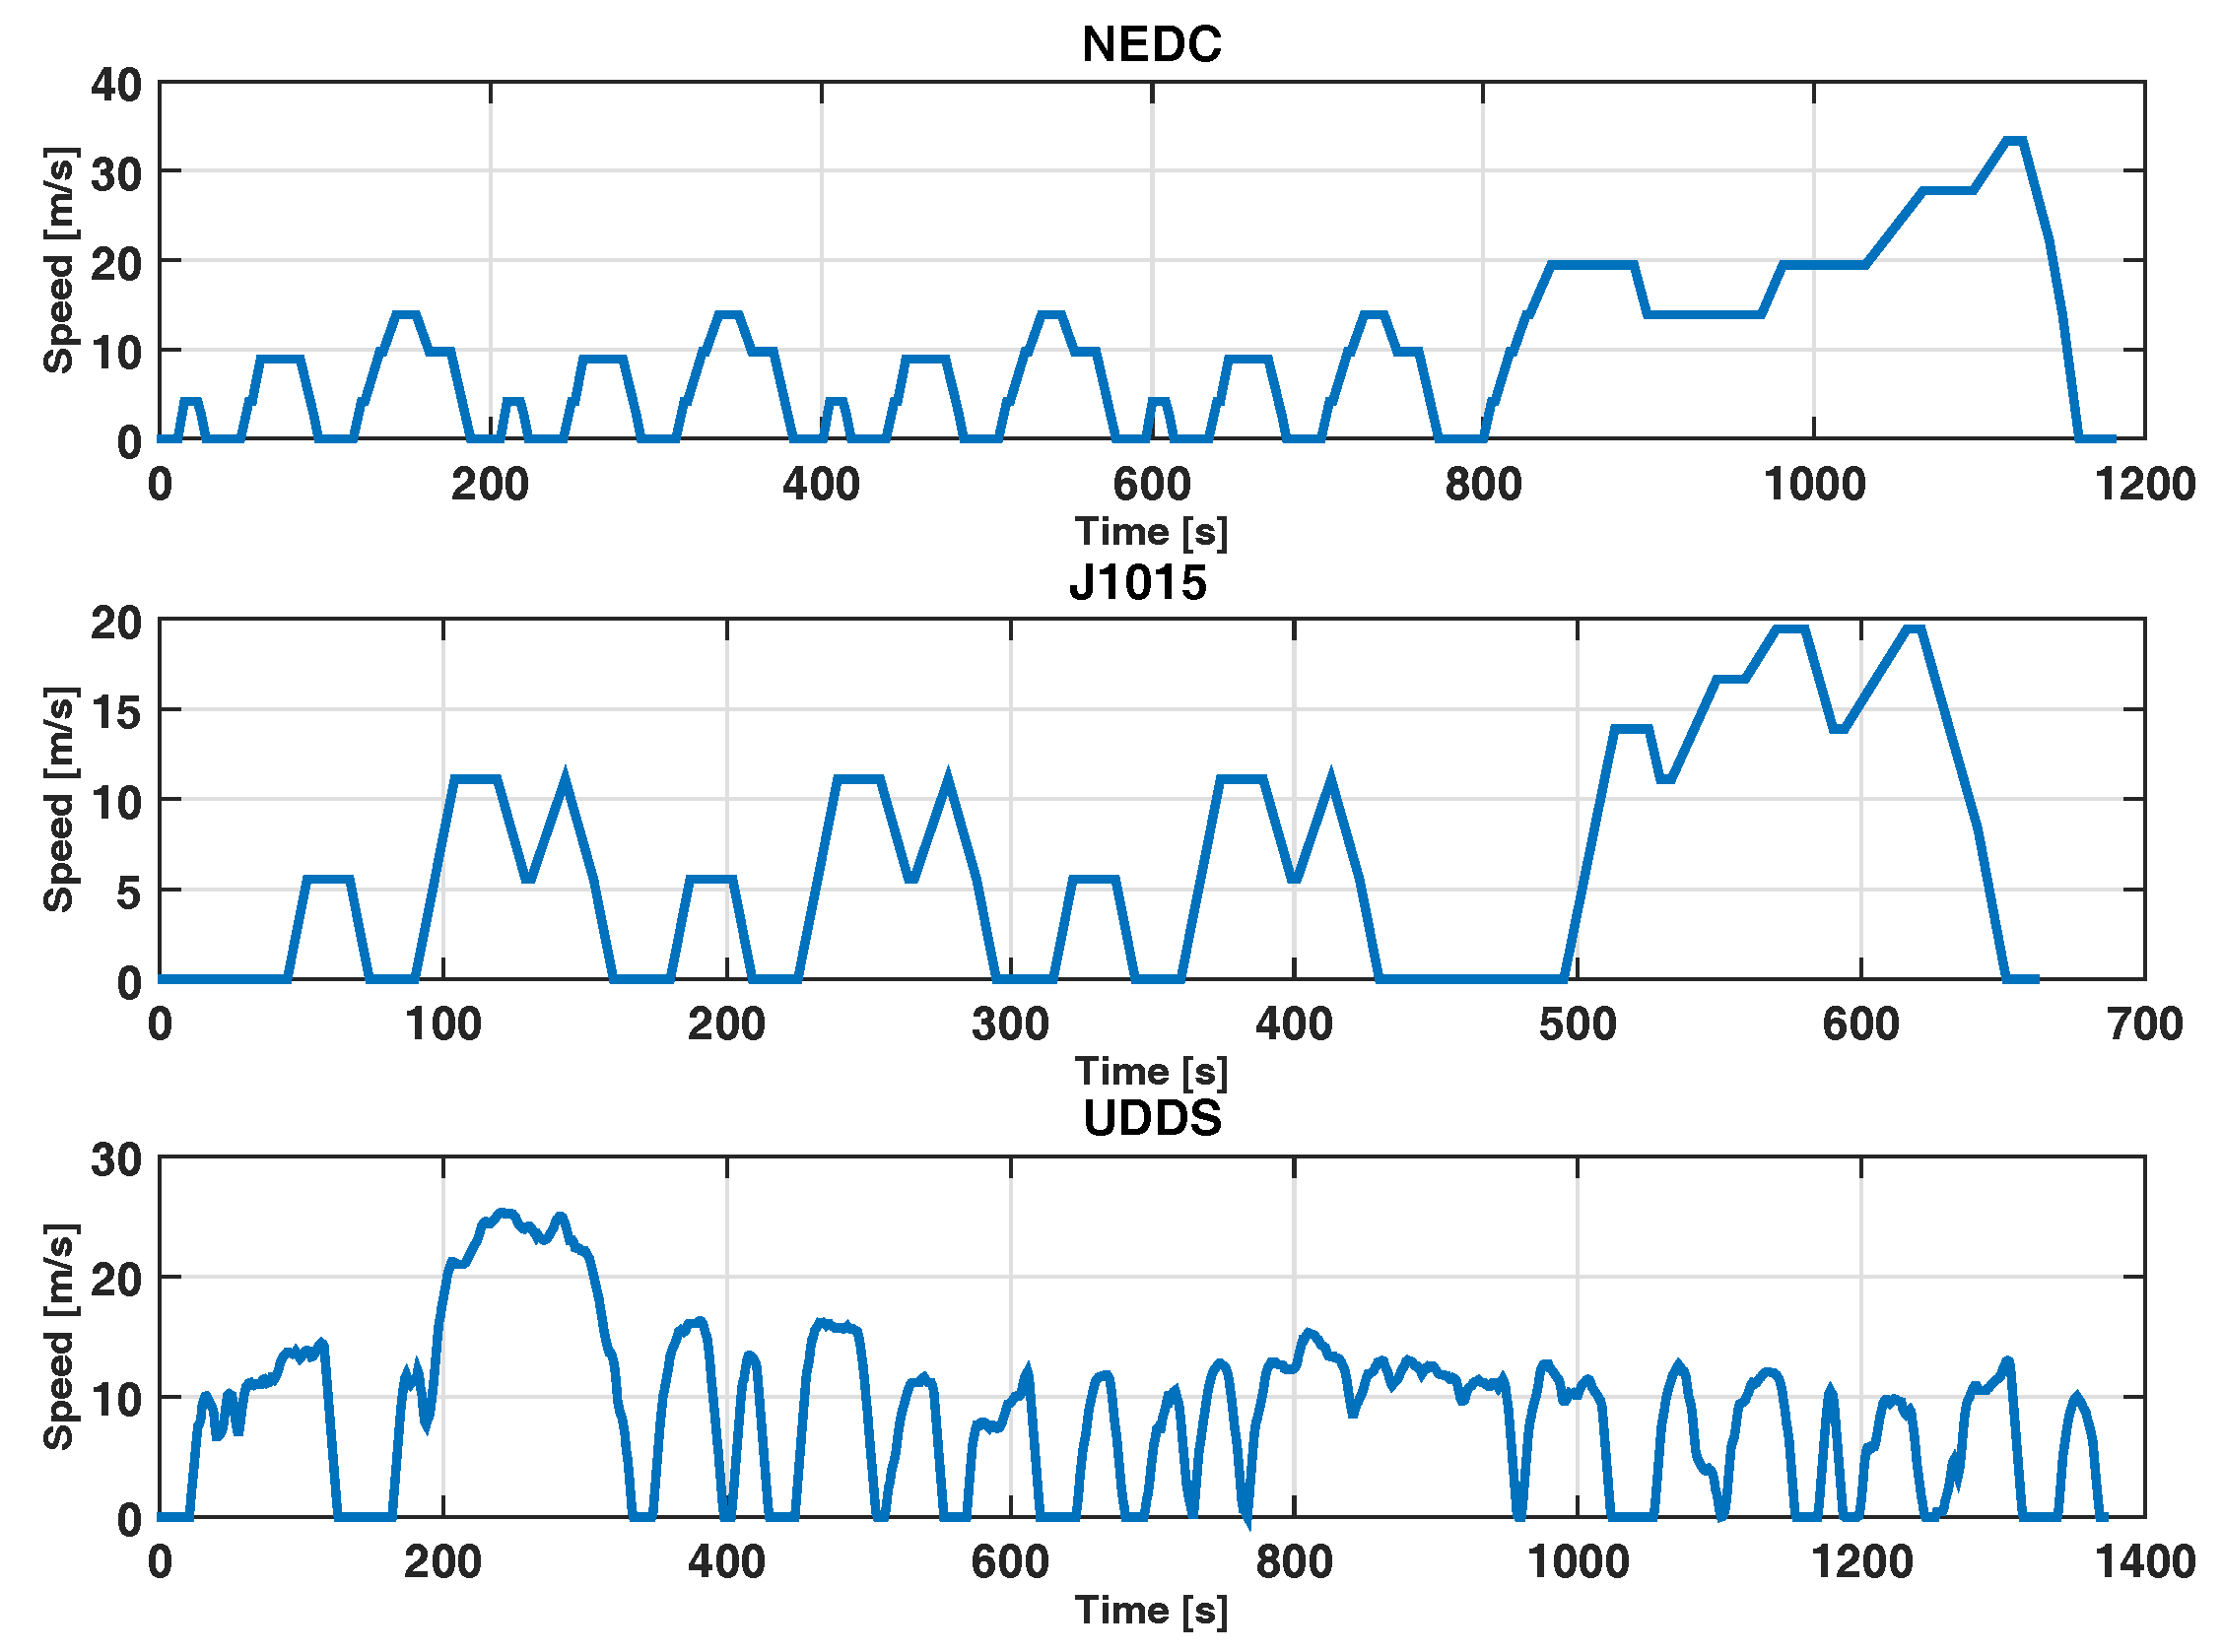
Figure 8.
Results of the conventional engine.

Figure 9.
Results of the future engine.

Figure 10.
Simulation results. The blue line is the fuel consumption of the conventional engine, and the brown line is the fuel consumption of the future engine.
Figure 10.
Simulation results. The blue line is the fuel consumption of the conventional engine, and the brown line is the fuel consumption of the future engine.

Figure 11.
Powertrain architecture and gear ratios [39]. 1. driven gear wheel of main reducer; 2. half axle; 3. first gear wheel; 4. first synchronizer; 5. driving gear wheel of main reducer; 6. second gear wheel; 7. electric motor; 8. third gear wheel; 9. first input transmission shaft; 10. second synchronizer; 11. fourth gear wheel; 12. engine; 13. fifth gear wheel; 14. second input transmission shaft; 15. six gear wheel; 16. dual-plate dry clutch; 17. output transmission shaft; 18. differential; : engine gear ratio; : motor gear ratio.
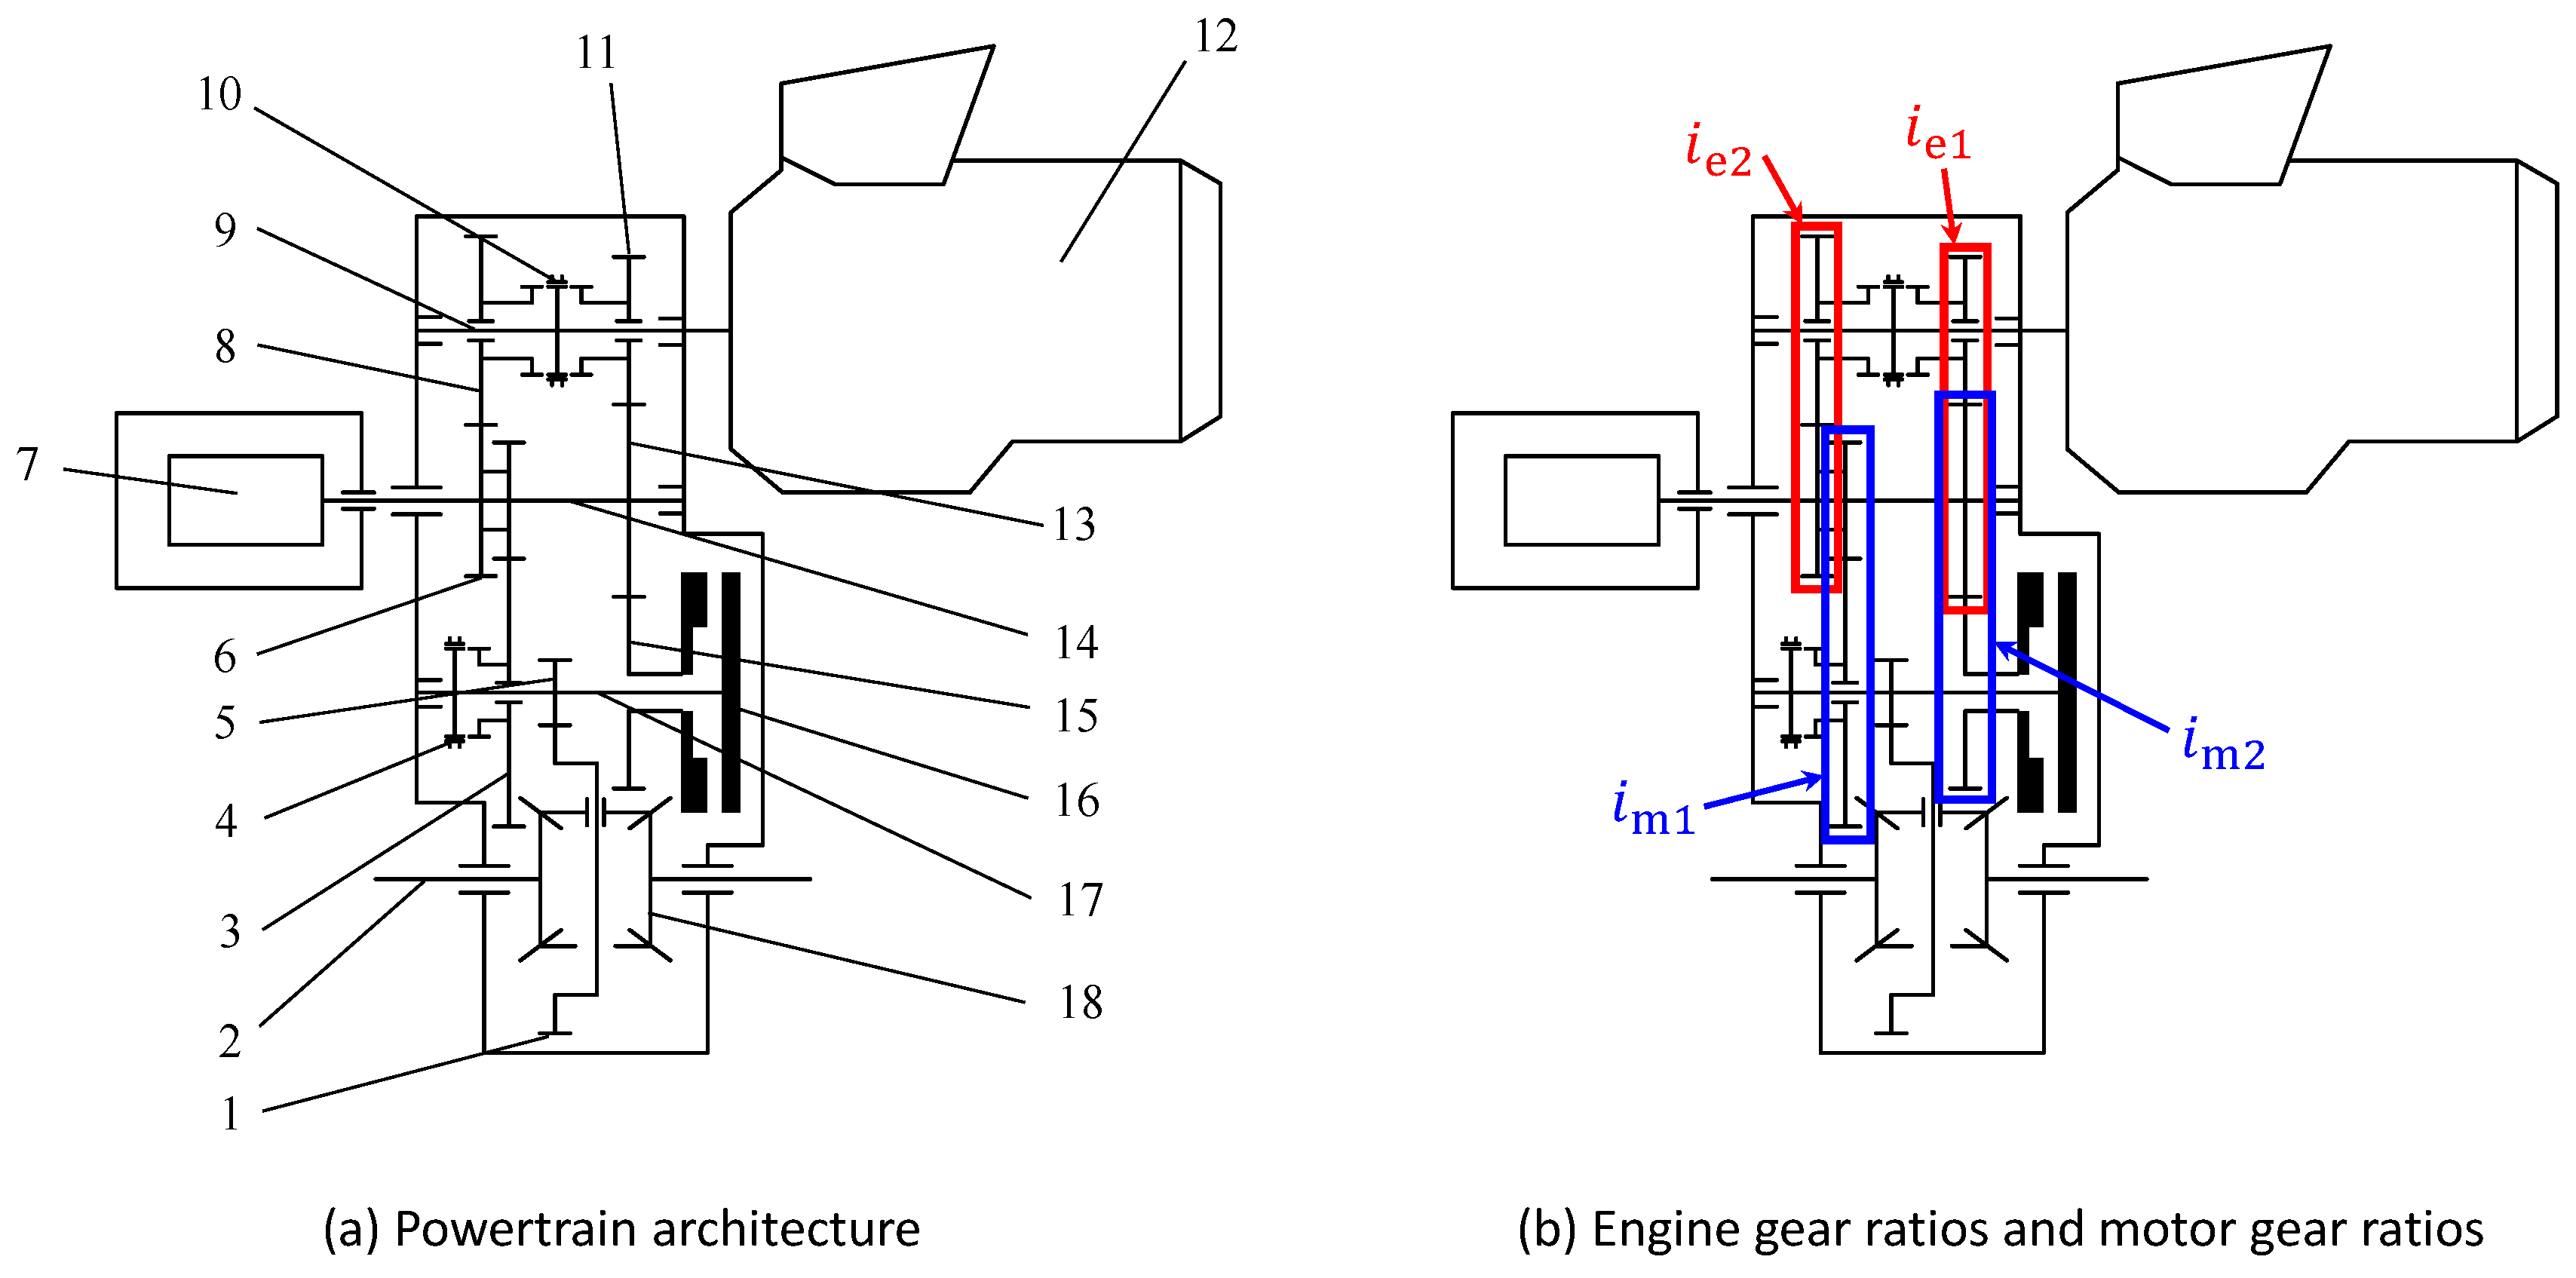
Figure 12.
EV mode.

Figure 13.
HEV under-powered driving mode.

Figure 14.
HEV over-powered driving mode.

Figure 15.
AMESim model.

Figure 16.
Simulation results of Engine and Battery.
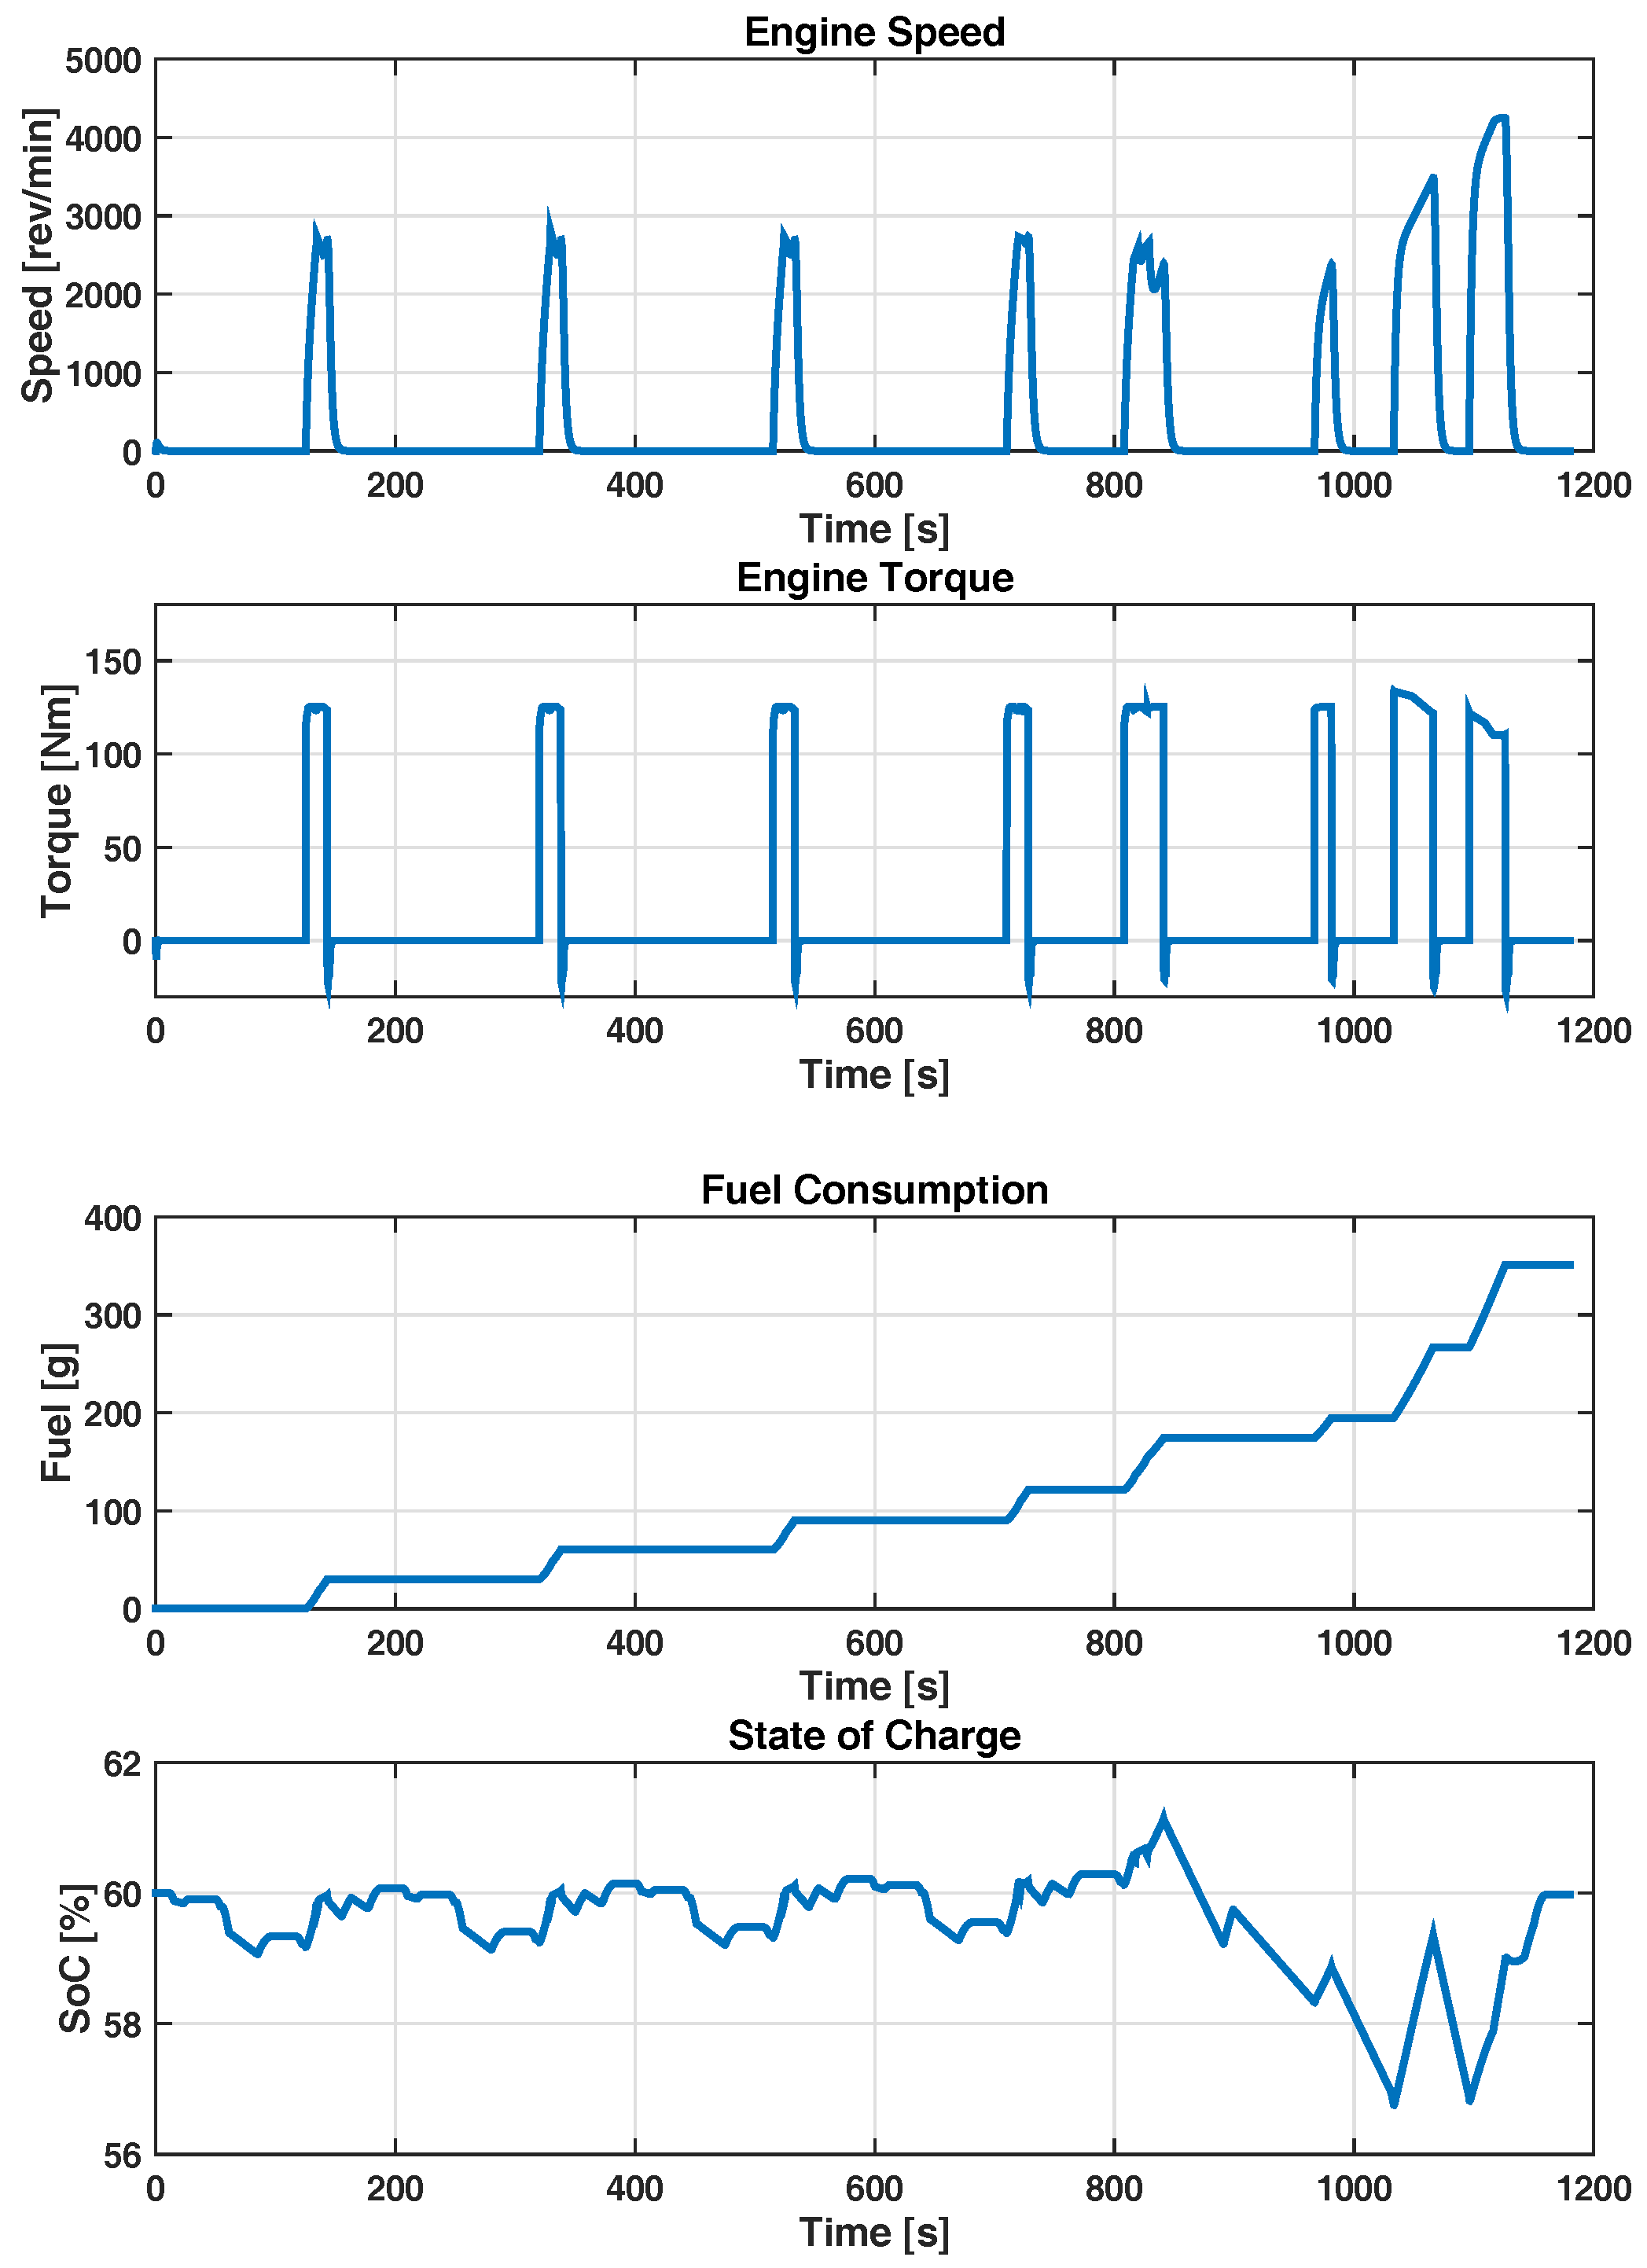
Figure 17.
Simulation results of Motor.

Figure 18.
Results of gear shift results in the EV mode.

Figure 19.
Results of gear shift results in the HEV mode.


Table 1.
Parameters of the vehicle and the components.
| Vehicle | ||
|---|---|---|
| m | Vehicle gross mass | 1800 (kg) |
| r | Tire radius | 0.37 (m) |
| S | Face area | 2.10 (m2) |
| Rotational mass coefficient | 1.2 | |
| Main reducer ratio | 4.235 | |
| f | Rolling resistance coefficient | 0.01 |
| Road gradient | 0 | |
| Air resistance coefficient | 0.32 | |
| Engine coupling ratio | 1 | |
| Motor coupling ratio | 1.5 | |
| Engine | ||
| Maximum engine speed | 5000 (rpm) | |
| Maximum engine power | 85 (Kw) | |
| Maximum engine torque | 241 (Nm) | |
| Motor | ||
| Maximum motor power | 70 (Kw) | |
| Maximum motor speed | 8000 (rpm) | |
| Maximum motor torque | 350 (Nm) | |
| Battery | ||
| C | Battery capacity | 19.5 (Ah) |
Table 2.
Gear Numbers and Gear Ratios.
| Gear Numbers | Gear Ratios |
|---|---|
| Six Gears | 3.994 2.482 1.582 1.112 0.912 0.795 |
| Five Gears | 3.769 2.095 1.433 1.079 0.851 |
| Four Gears | 3.526 1.956 1.247 0.892 |
| Three Gears | 3.165 1.739 1.087 |
| Two Gears | 2.910 1.140 |
Table 3.
Parameters of the AMESim model.
| Air density | 1.2 (kg·m3) | |
| Engine inertia | 0.15 (kg·m2) | |
| Maximum friction torque of the clutch | 350 (Nm) | |
| Inertia of motor output shaft | 0.015 (kg·m2) | |
| Damp of motor output shaft | 4.19 × 10⁻⁵ (Nm/(rad/s)) | |
| Inertia of one tire | 0.805 (kg·m2) |
© 2018 by the authors. Licensee MDPI, Basel, Switzerland. This article is an open access article distributed under the terms and conditions of the Creative Commons Attribution (CC BY) license (http://creativecommons.org/licenses/by/4.0/).
Share and Cite
MDPI and ACS Style
Hong, J.; Zhao, L.; Lei, Y.; Gao, B. Architecture Optimization of Hybrid Electric Vehicles with Future High-Efficiency Engine. Energies 2018, 11, 1148. https://doi.org/10.3390/en11051148
AMA Style
Hong J, Zhao L, Lei Y, Gao B. Architecture Optimization of Hybrid Electric Vehicles with Future High-Efficiency Engine. Energies. 2018; 11(5):1148. https://doi.org/10.3390/en11051148
Chicago/Turabian StyleHong, Jinlong, Liangchun Zhao, Yulong Lei, and Bingzhao Gao. 2018. "Architecture Optimization of Hybrid Electric Vehicles with Future High-Efficiency Engine" Energies 11, no. 5: 1148. https://doi.org/10.3390/en11051148
Note that from the first issue of 2016, this journal uses article numbers instead of page numbers. See further details here.