Theoretical Modeling and Parameter Analysis of Micro-Pulsed Plasma Thruster


Abstract
:1. Introduction
2. Theoretical Modeling Method
2.1. Ablation Model
2.1.1. First Ablation Stage
2.1.2. Second Ablation Stage
2.1.3. Third Ablation Stage
2.2. Modified Electromechanical μPPT Model
- This model approximates the μPPT system as an electromechanical device with an electric circuit interacting with a dynamic system [26].
- The mass of Teflon ablation accumulates with the discharge process in the working process of μPPT, and this is different from the hypothesis of the conventional model, hence higher model accuracy is achieved. Moreover, the ablative mass, m(t), can be obtained by integrating the mass flow in Equation (10).
- Only the gas dynamic force and the Lorenz force are considered in the force analysis of the current sheet.
- The plasma produced by the ablation is in a state of complete ionization.
- The ratio of the single pulse discharge energy absorbed by the surface of the Teflon solid, γ, is assumed to be a constant value.
- The thruster is assumed to be in an ideal and stable working state.
3. Method Validation
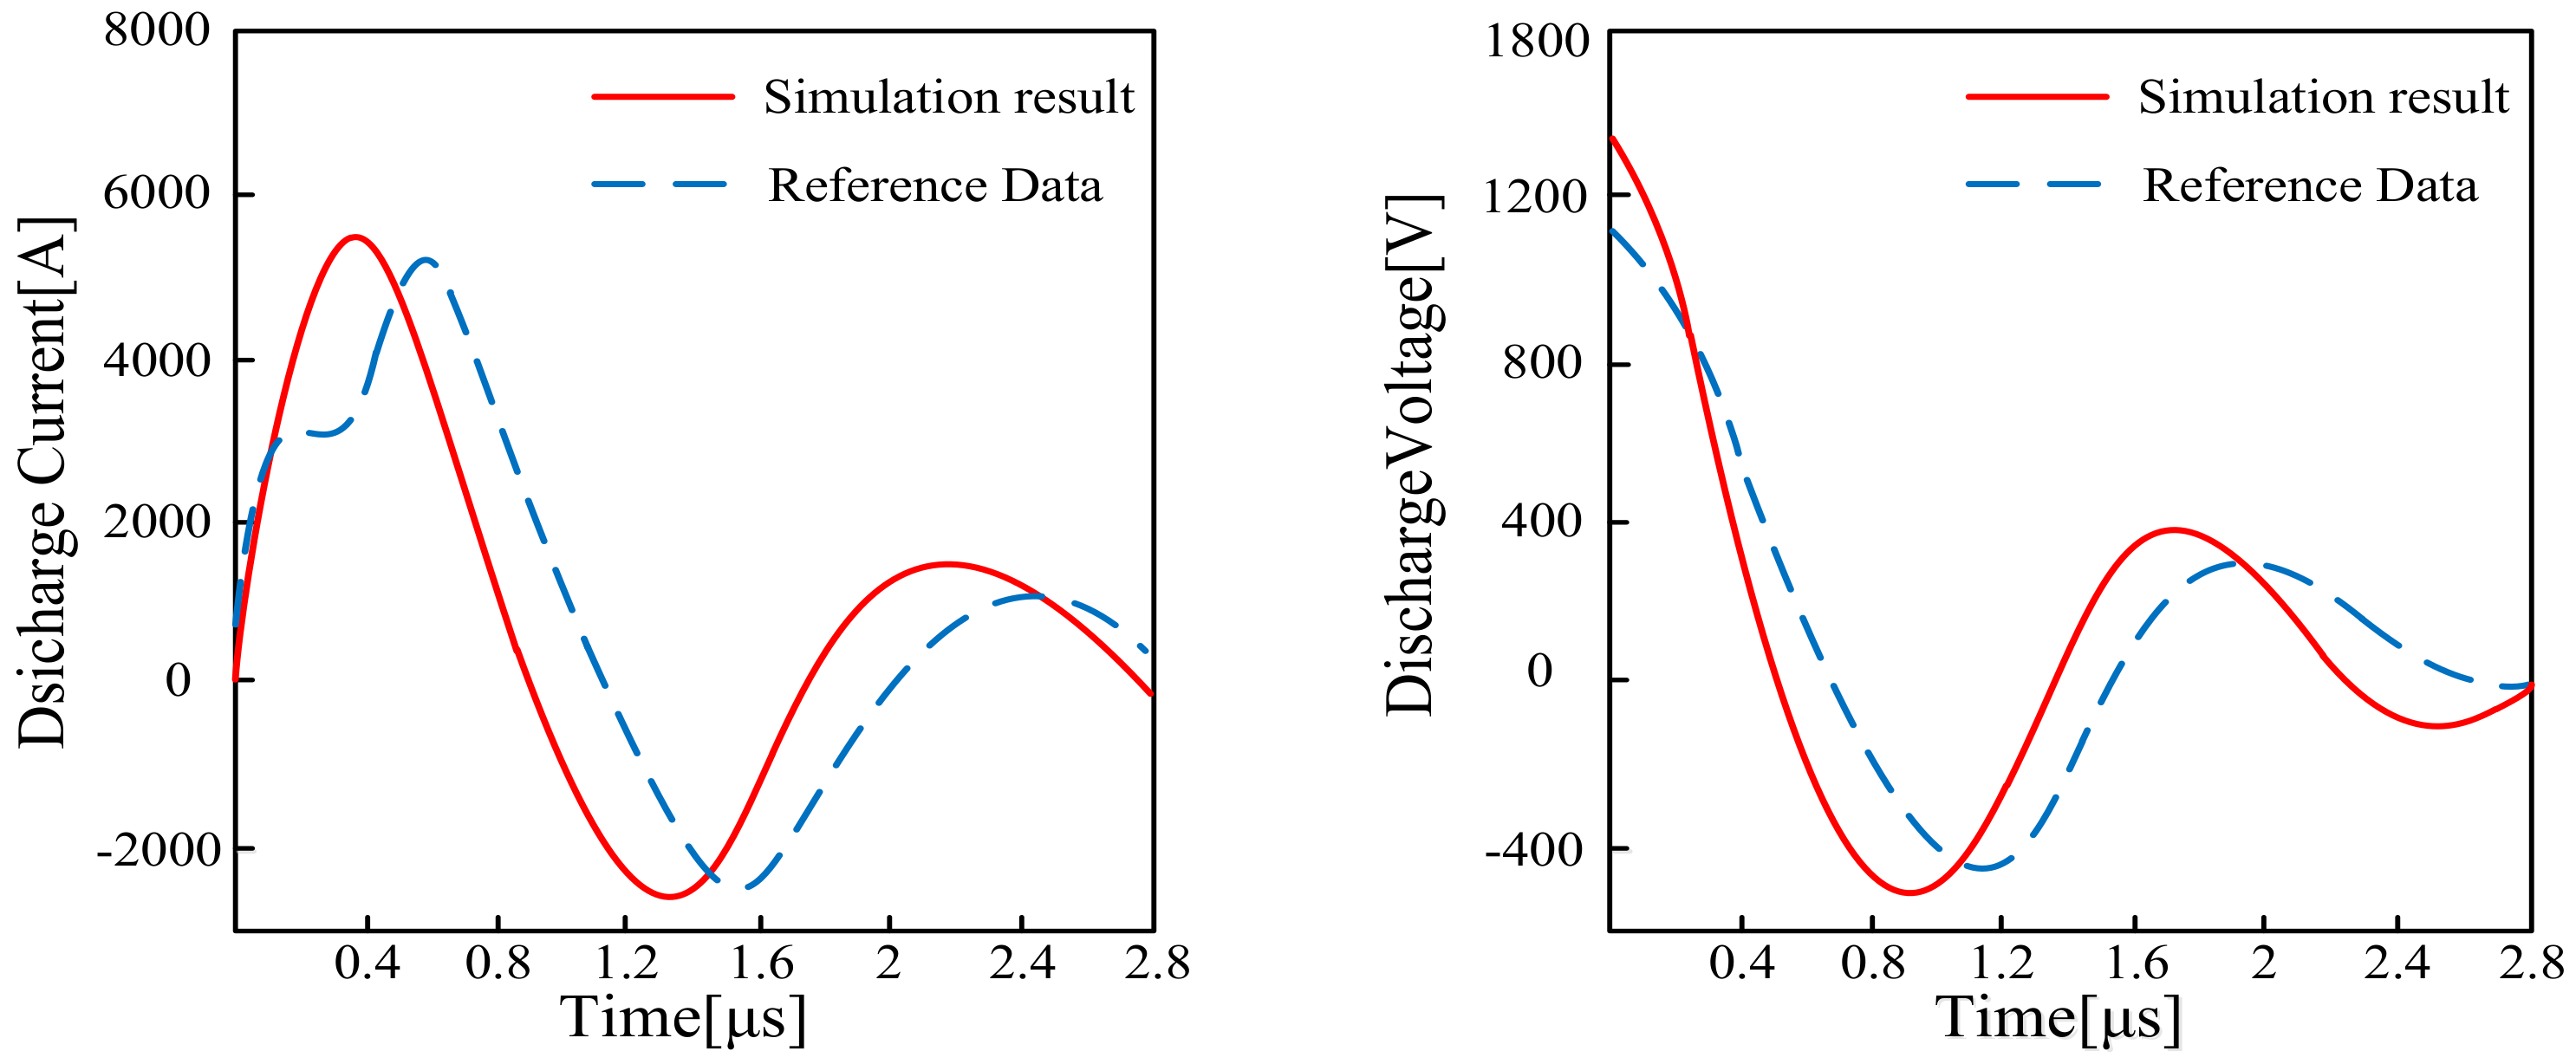
3.1. Discharge Waveform Comparison
3.2. Ablation Parameters Comparison
3.3. Perfomance Parameters Comparison
4. Parameter Analysis
4.1. Electrical Parameters
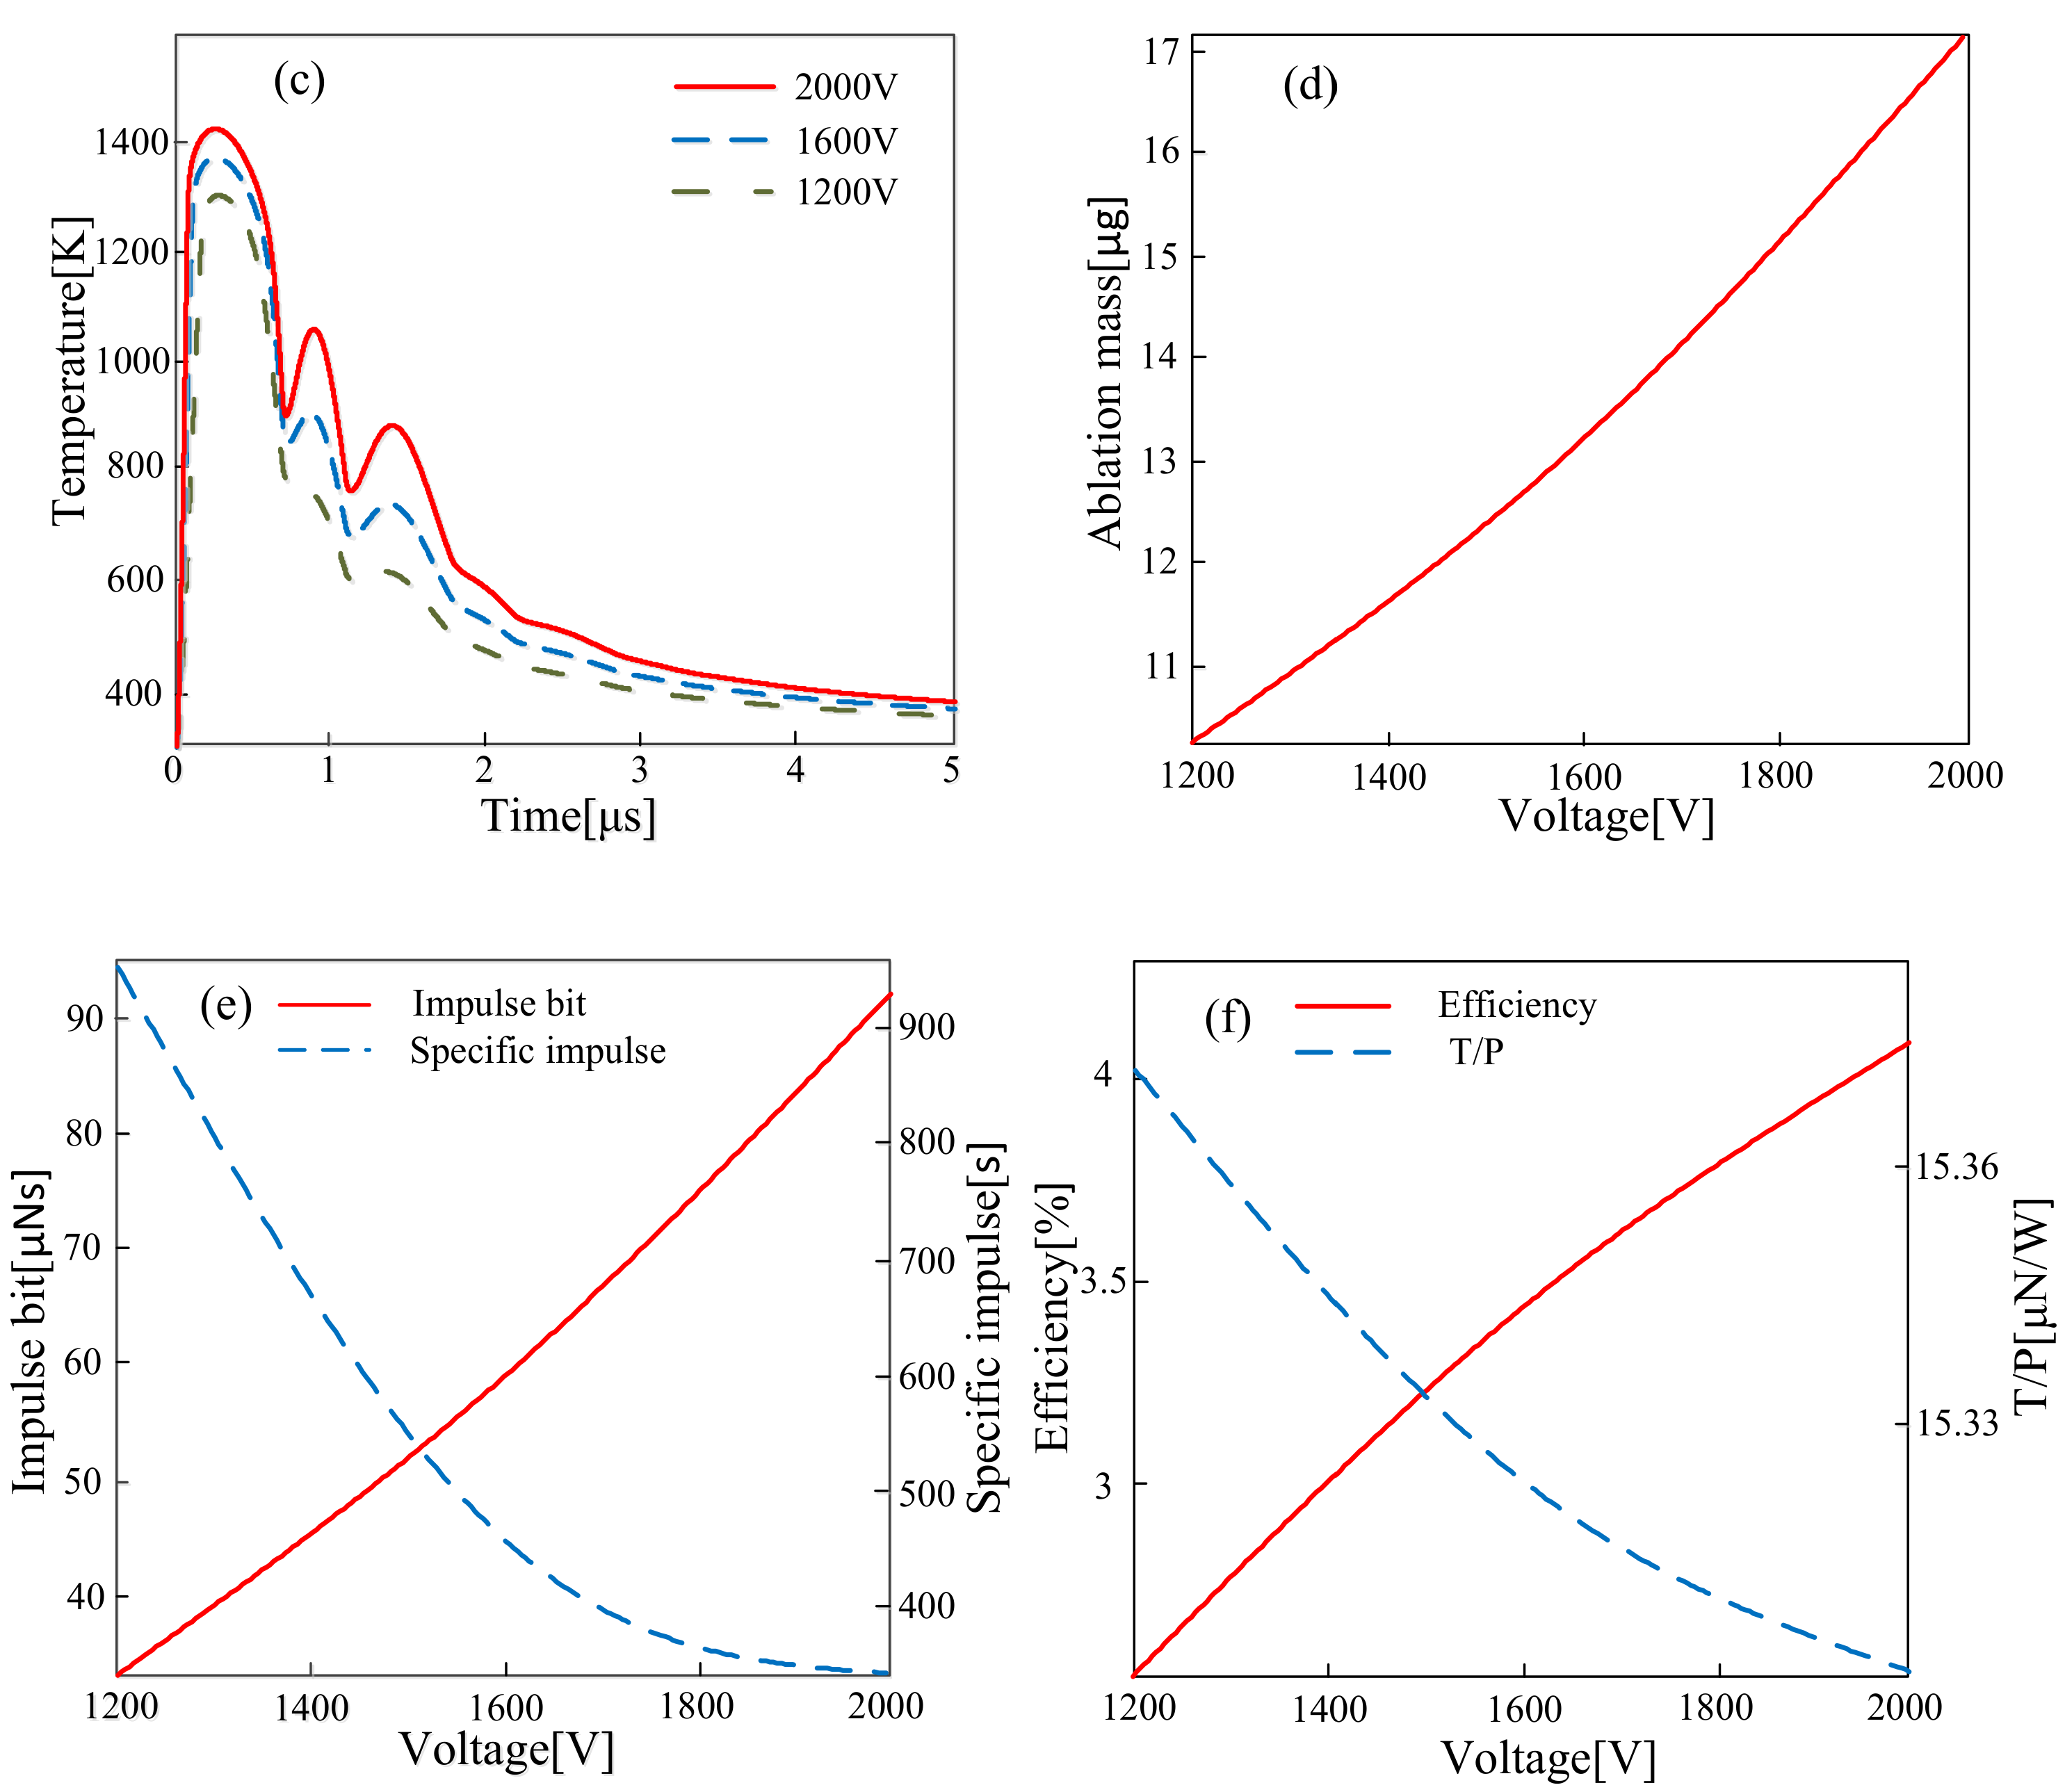
4.1.1. Initial Discharge Voltage
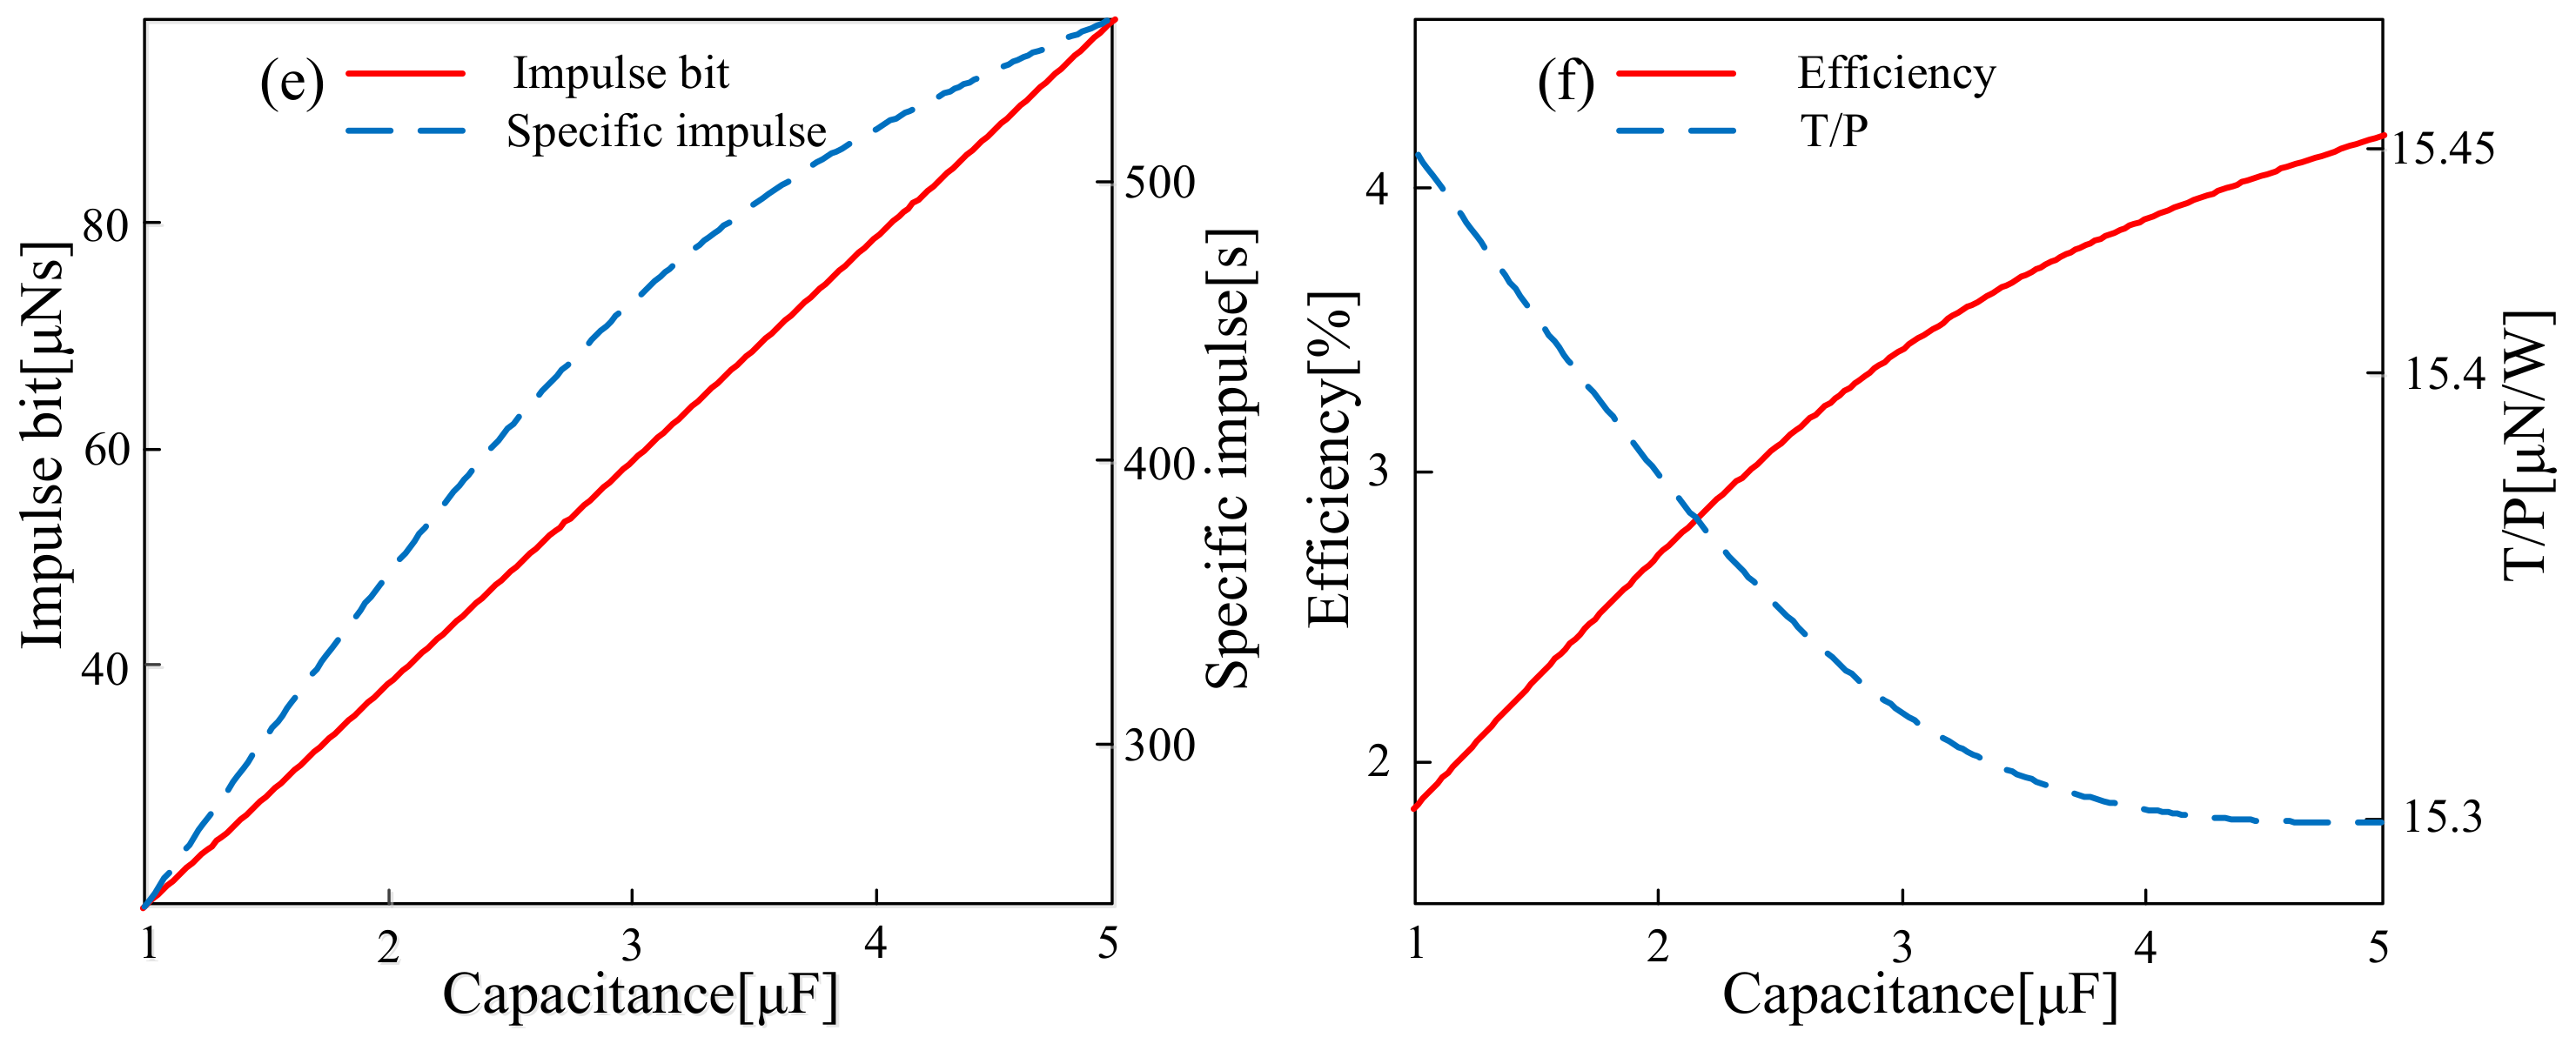
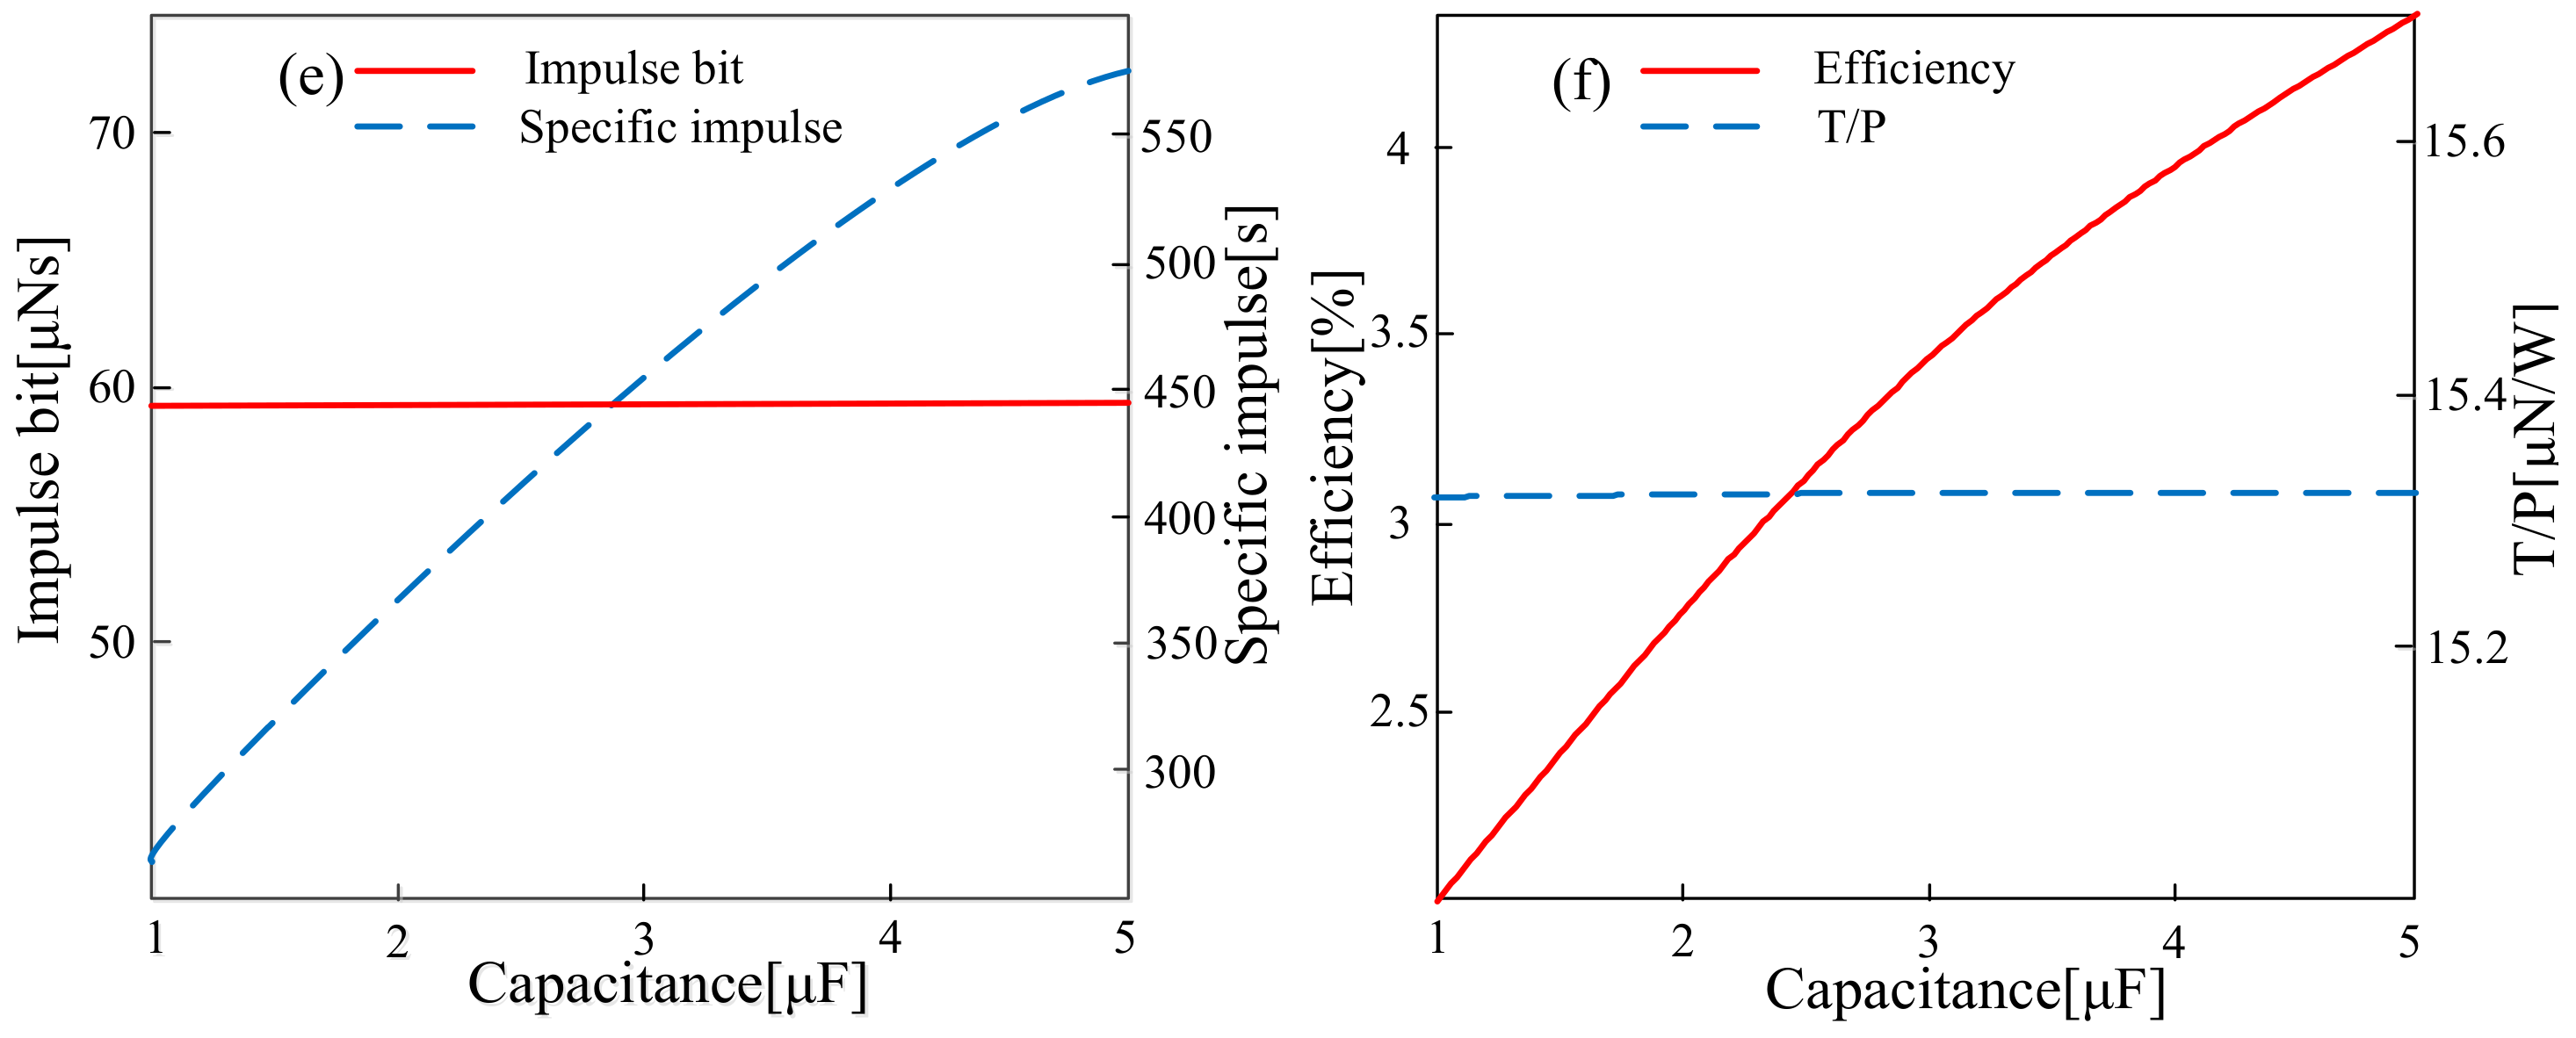
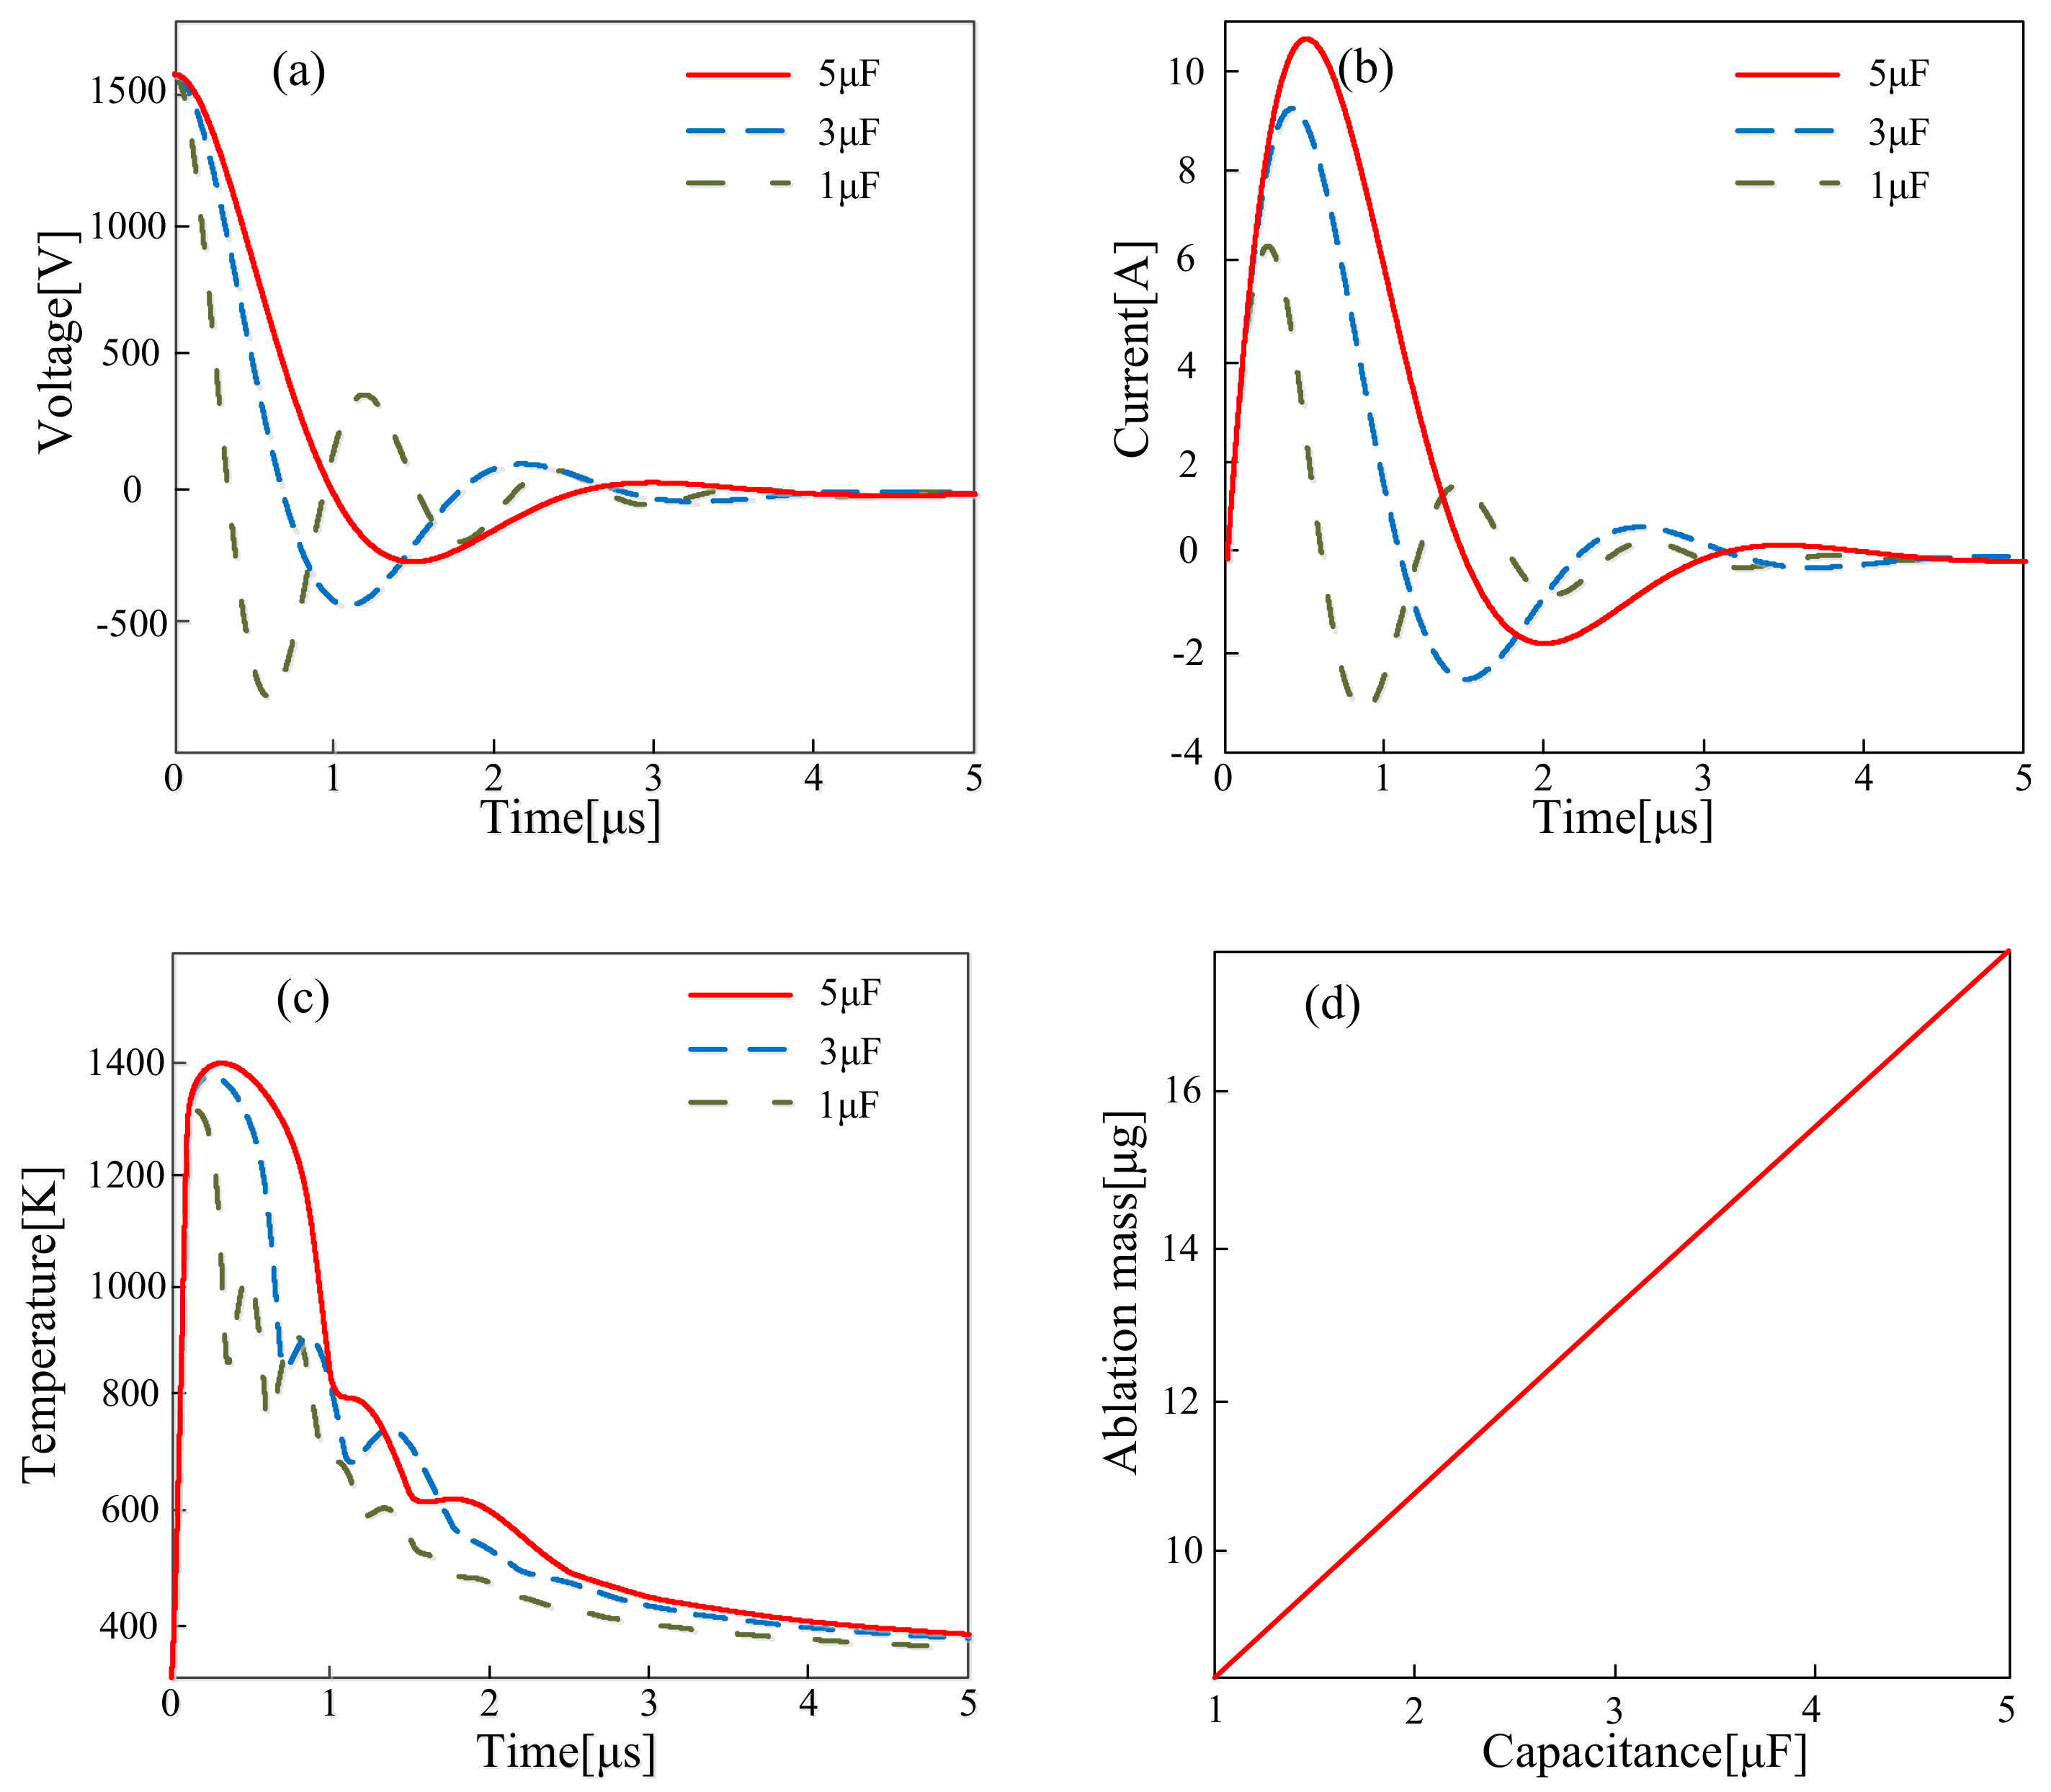
4.1.2. Capacitance
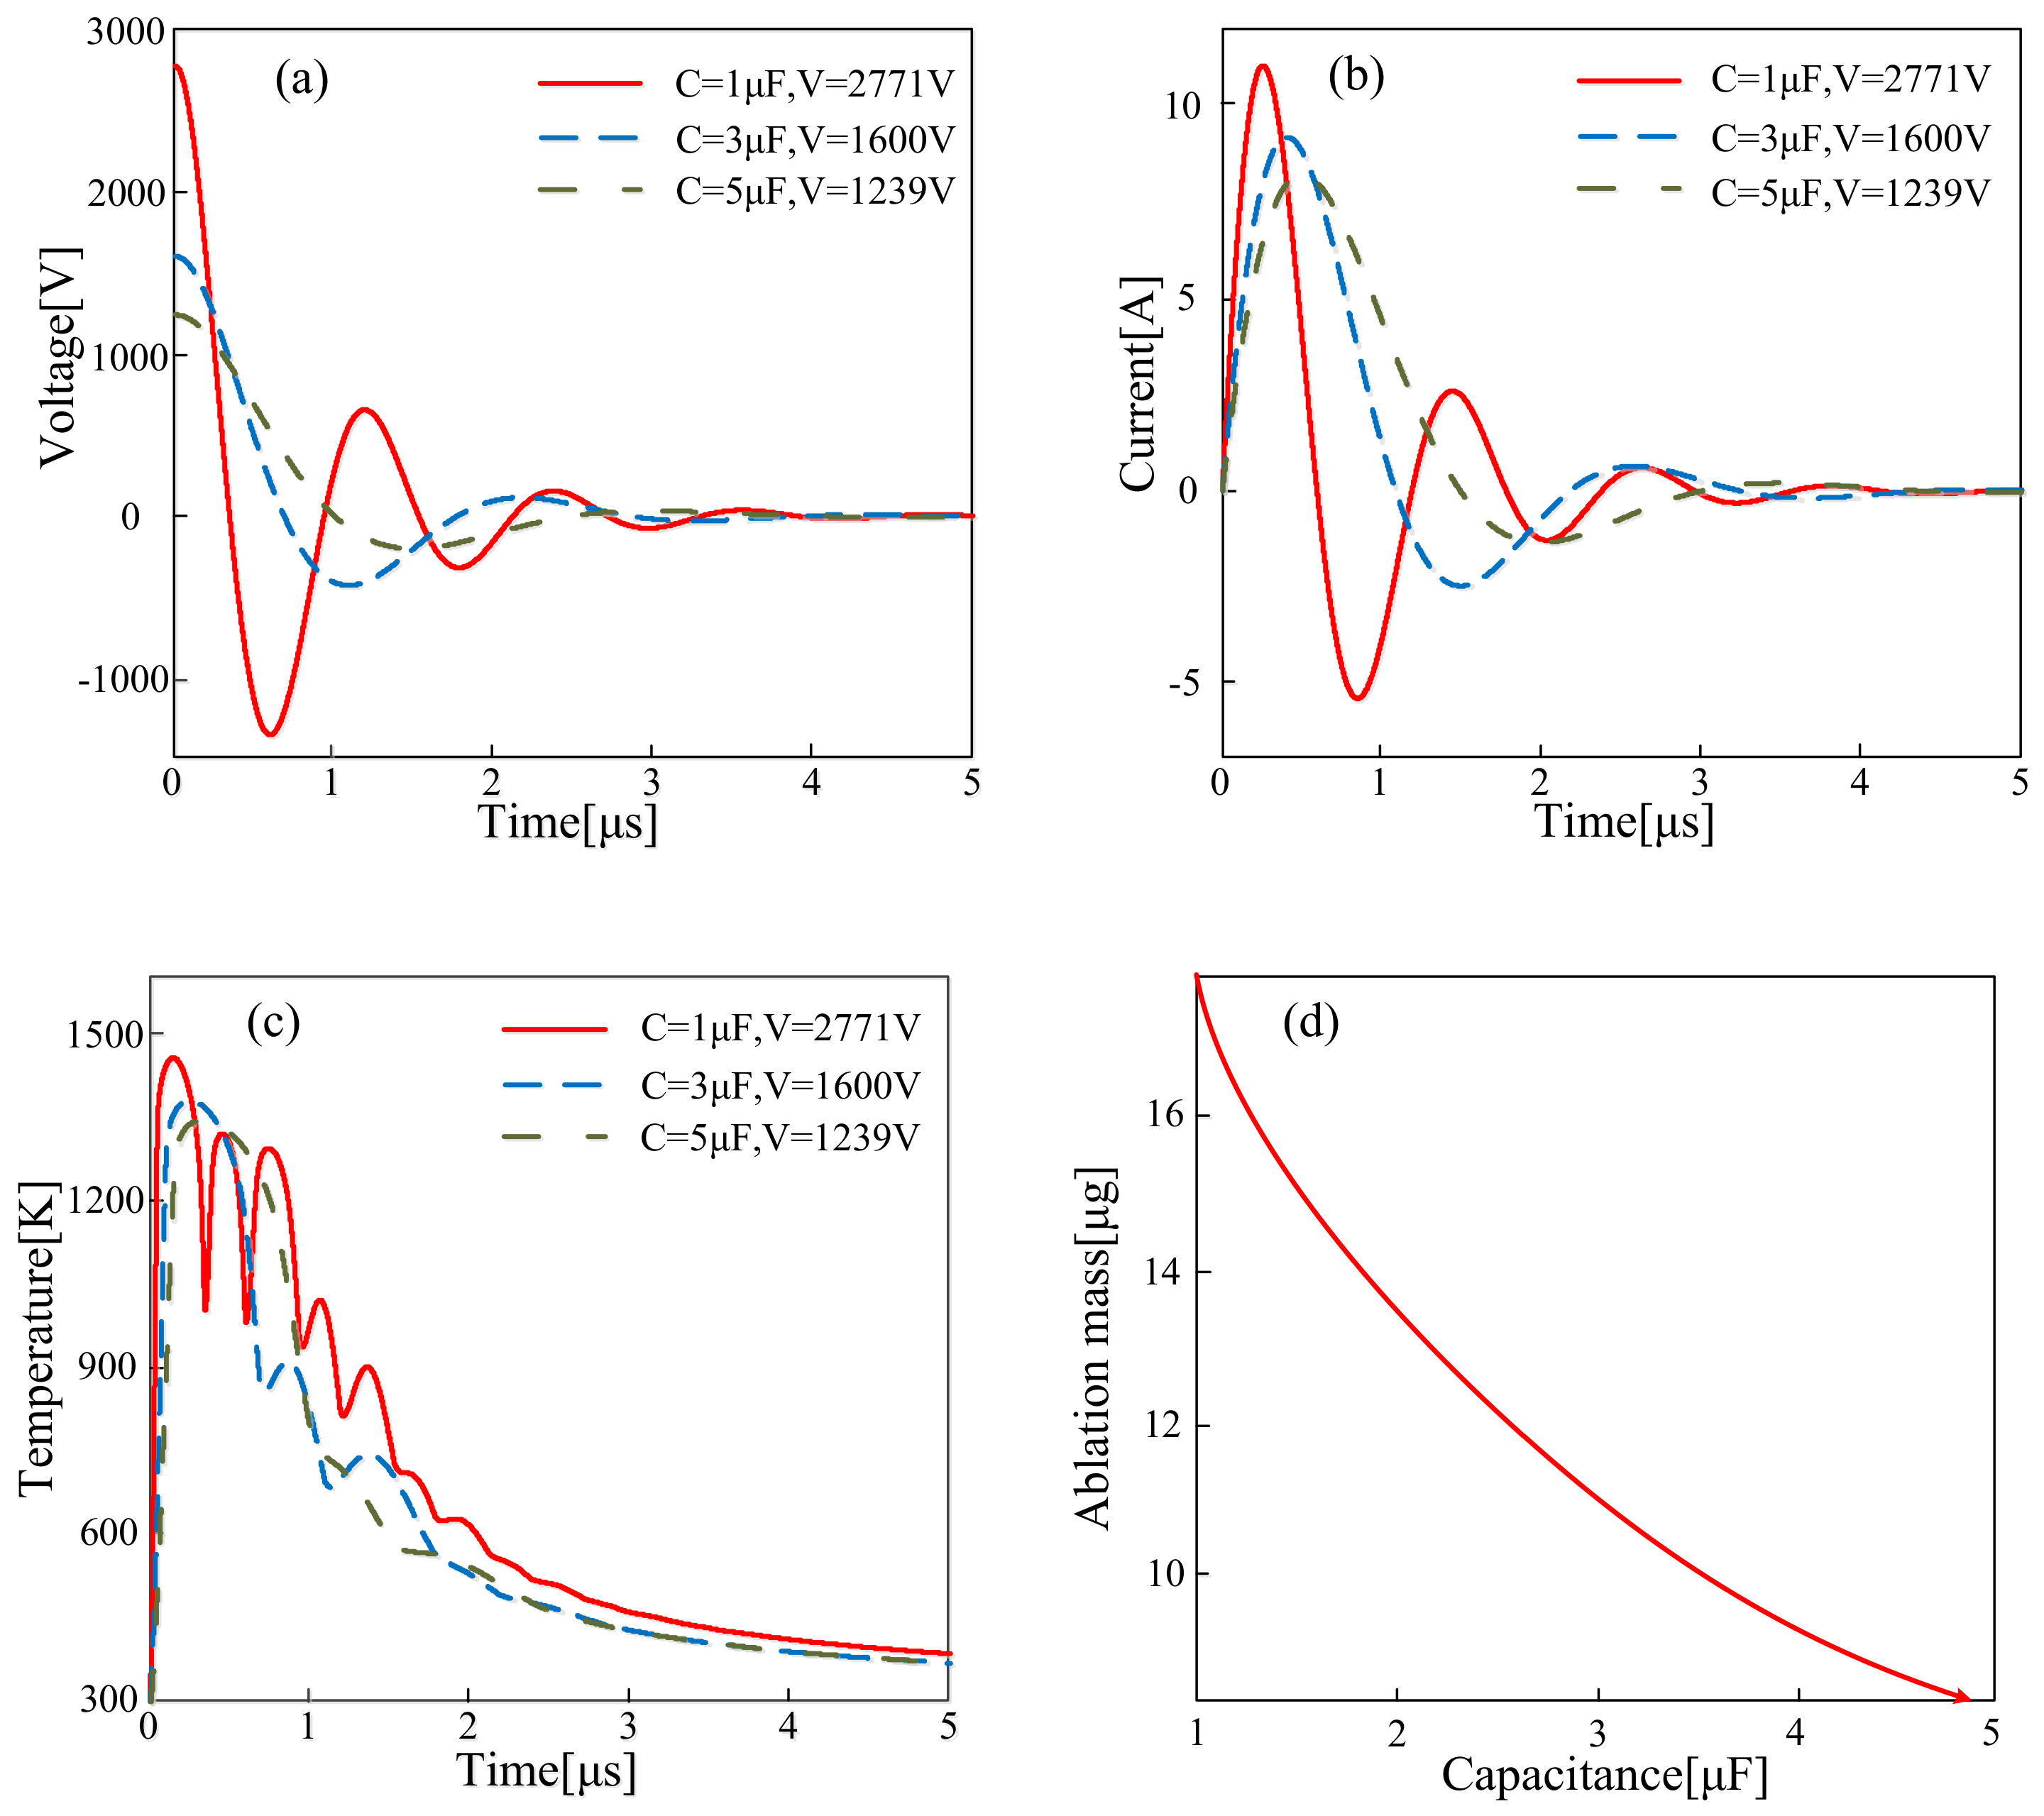
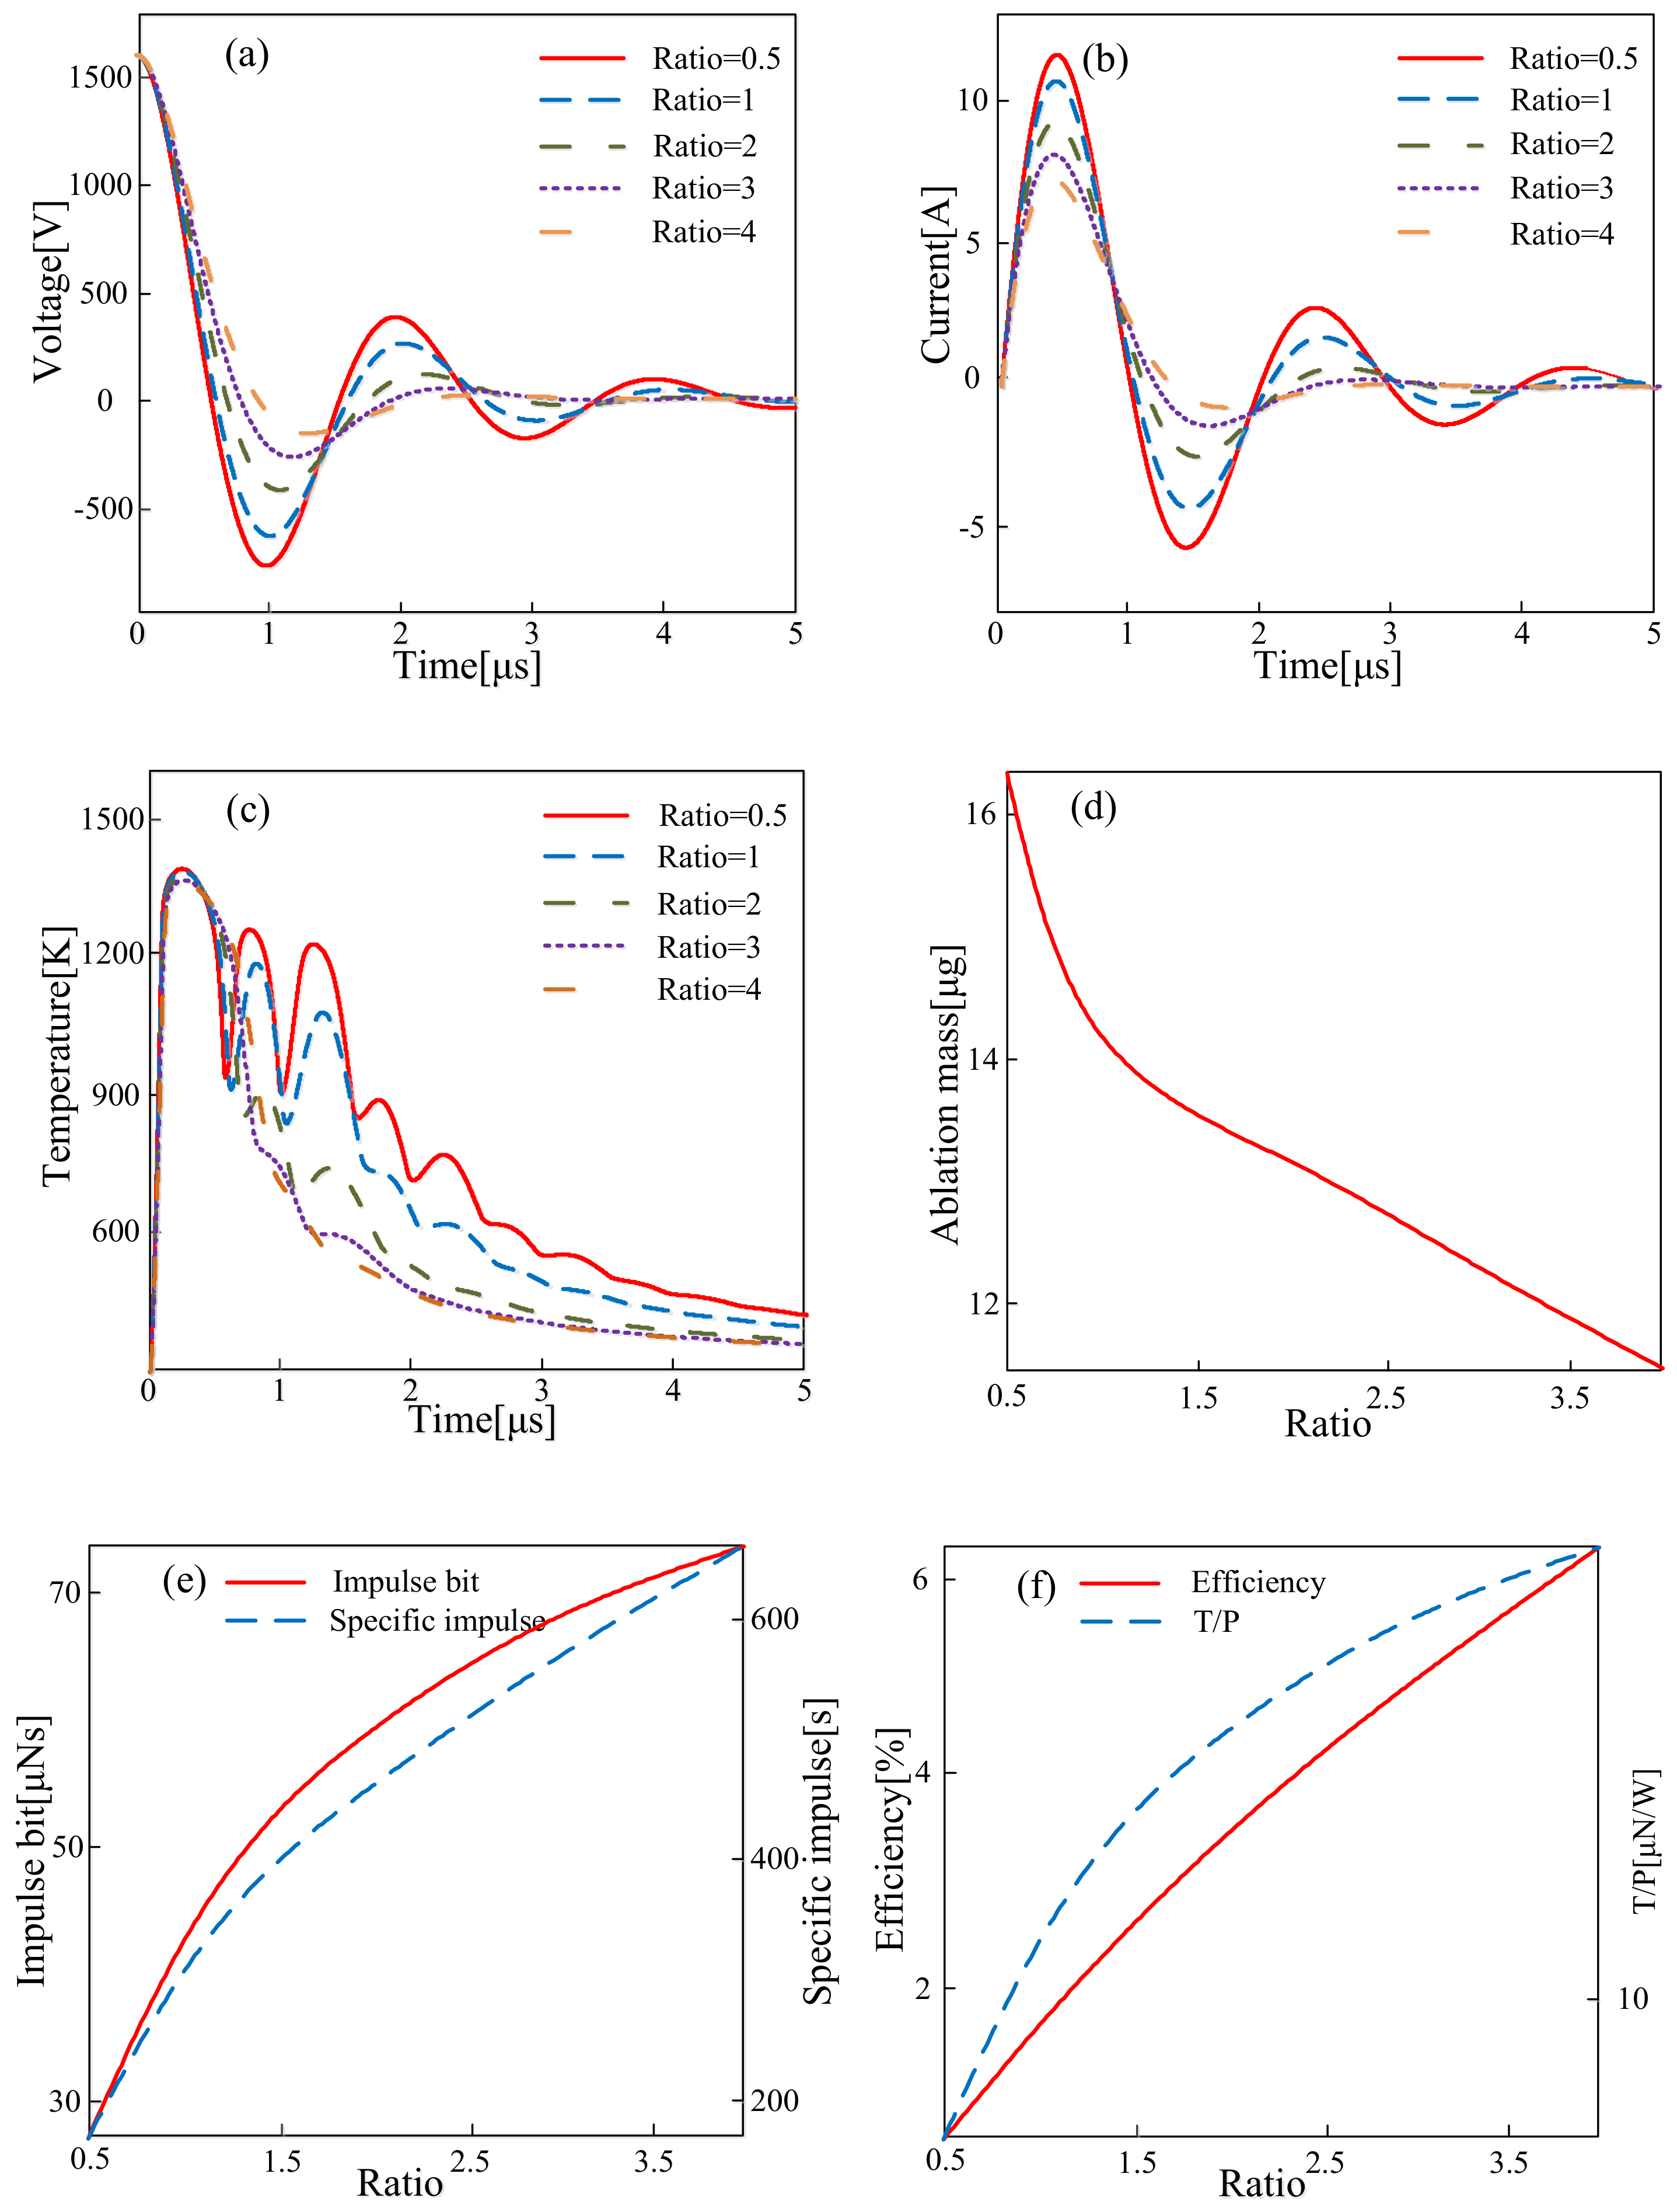
4.1.3. Different Capacitance–Initial Voltage Ratios under the Same Discharge Energy
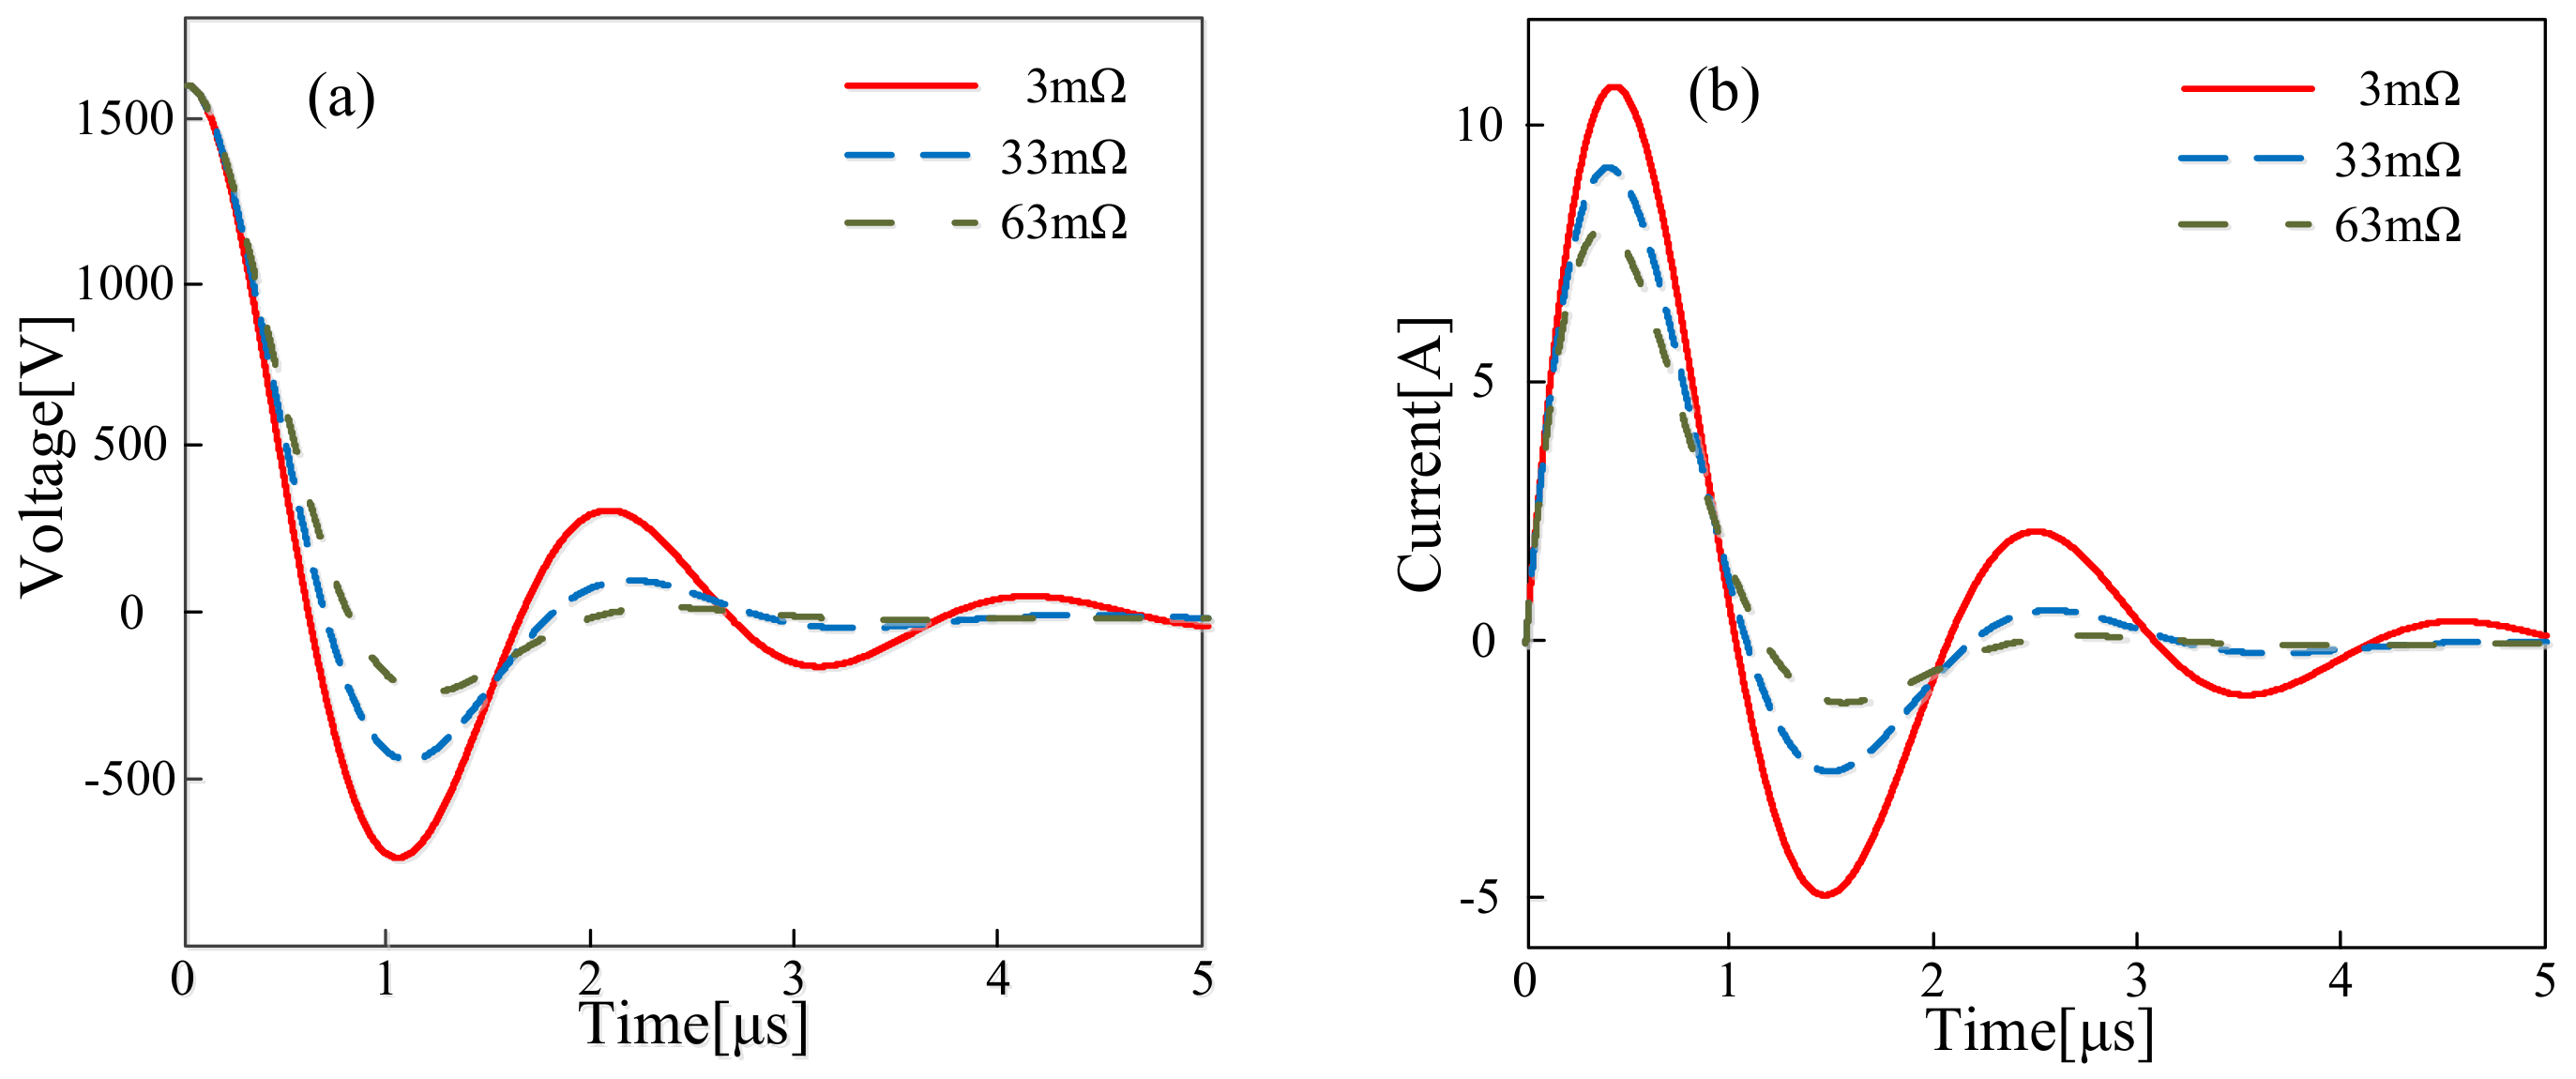
4.1.4. External Resistance
4.2. Structual Parameters
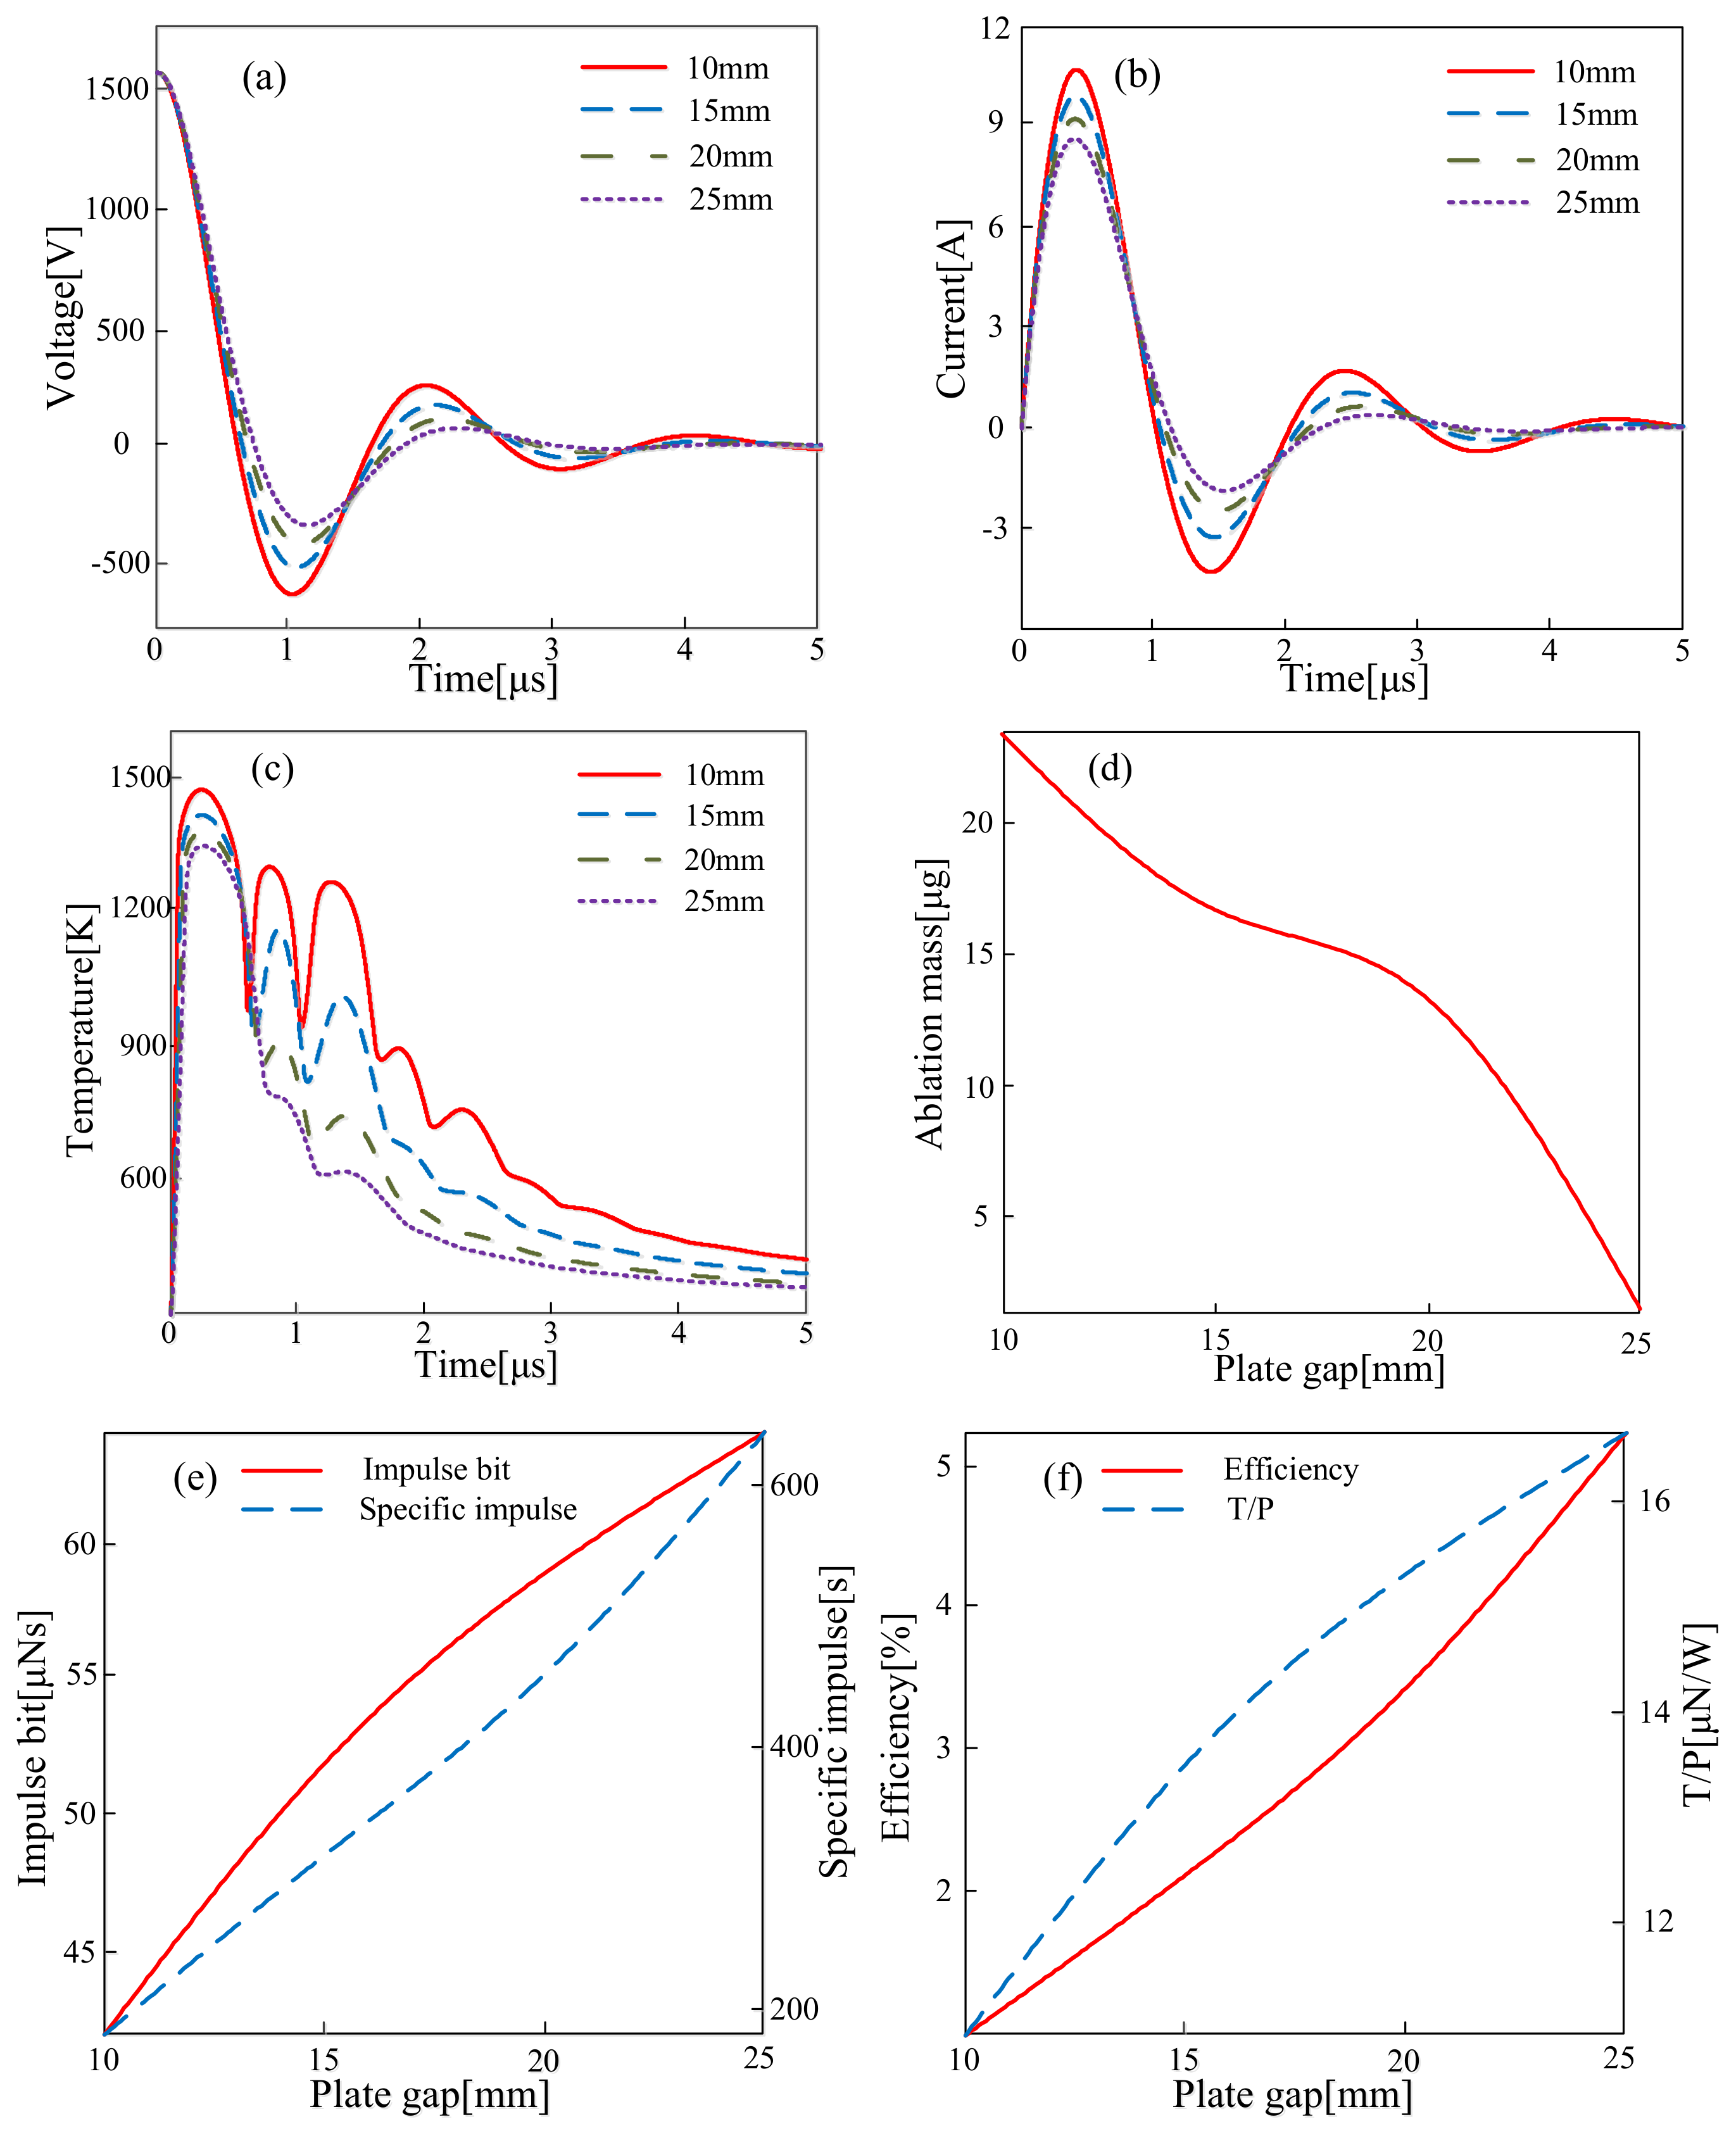
4.2.1. Plate Gap
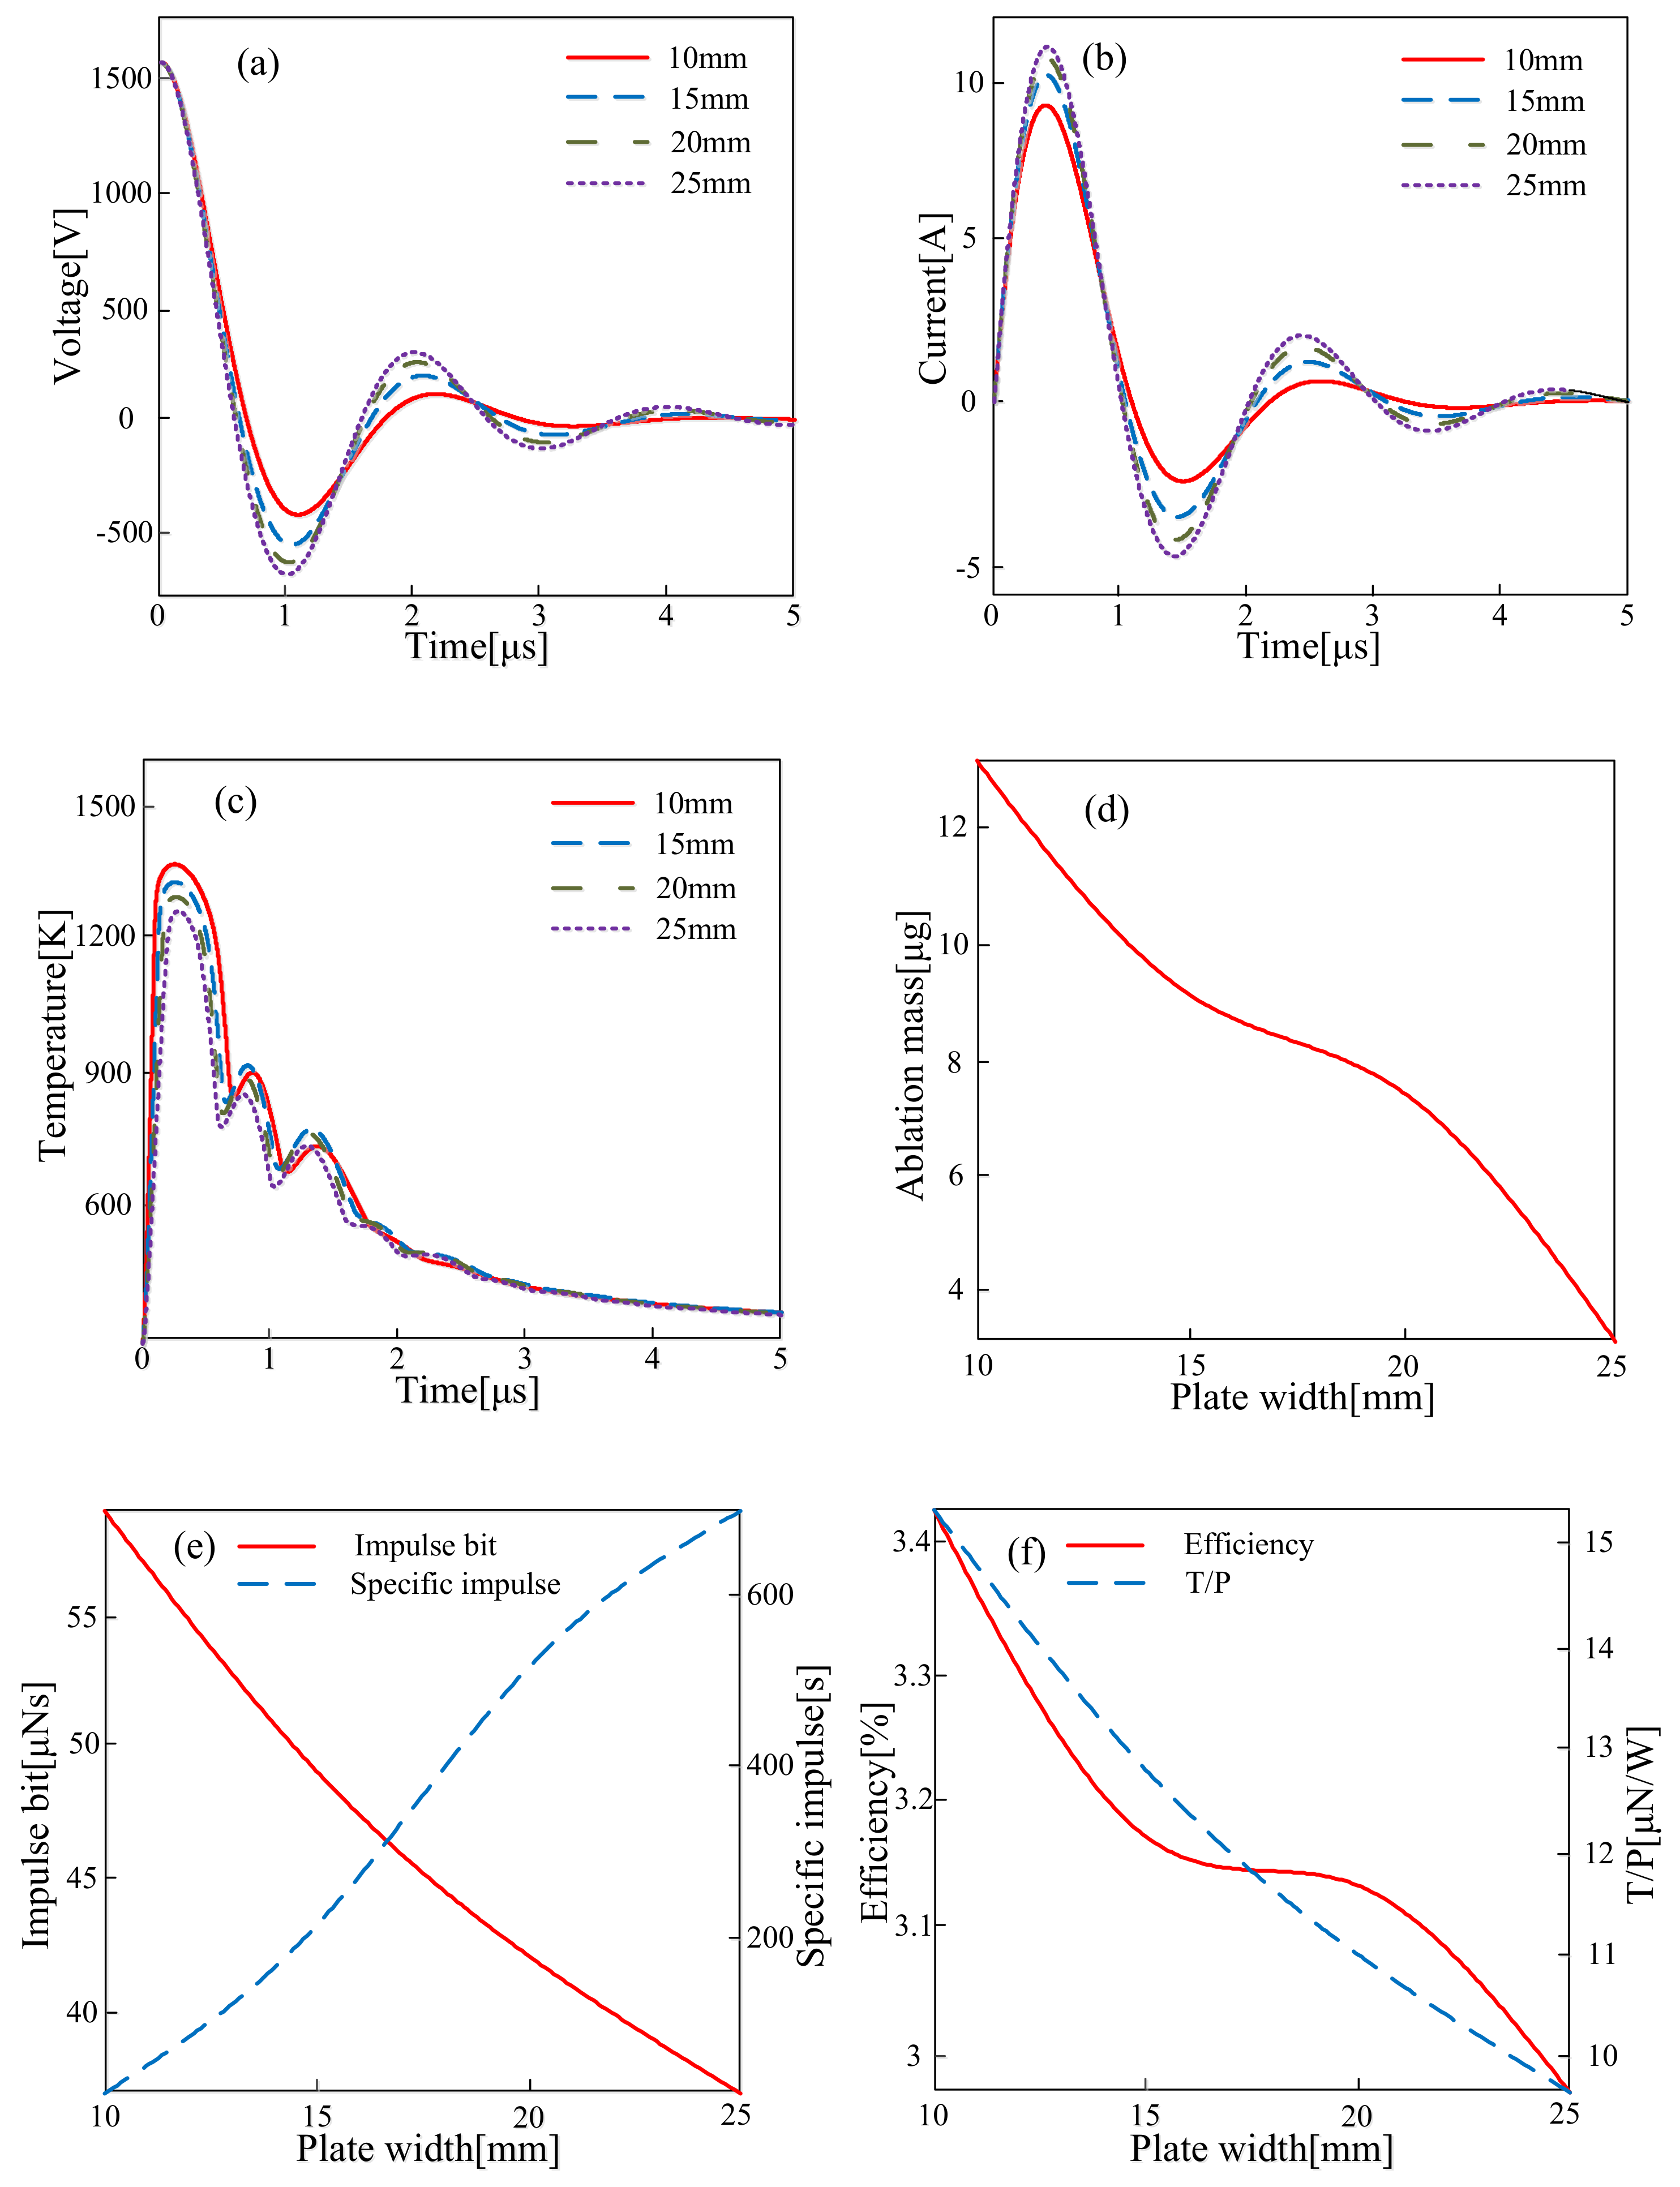
4.2.2. Plate Width
4.2.3. Different Plate Gap–Width Ratios under the Constant Ablation Area
5. Conclusions
- Different ways of increasing the discharge energy have different effects on the performance of μPPT. Larger capacitances can effectively weaken the oscillation characteristics of the circuit and improve the performance, except the impulse bit, specific impulse, and efficiency. Meanwhile, an increase in the initial discharge voltage enlarges the impulse bit but reduces the specific impulse due to the explosion of the ablation mass in the high initial discharge voltage. Moreover, under constant discharge energy, the combination of high capacitance and small initial voltage can enhance the specific impulse.
- The loss of Ohmic heat, which is due to large resistance, causes the loss of discharge energy, resulting in decreased performance, including the specific impulse, impulse bit, and efficiency. Therefore, larger circuit resistances should be avoided in order to prevent the decrease in performance from becoming serious.
- Under the constant ablation surface area, the ablation mass, peak value of discharge current, and degree of oscillation decline with increased plate gap-width ratio. On the contrary, the impulse bit, specific impulse, and efficiency have a positive relation with the plate gap-width ratio. Thus, a high plate gap-to-width ratio can improve μPPT performance.
Author Contributions
Acknowledgments
Conflicts of Interest
Nomenclature
| Ap | pre-exponential factor, s−1 |
| C | capacitance value, F |
| Cs | specific heat capacity under the solid state, J/(kg·K) |
| Cm | specific heat capacity under the melt state, J/(kg·K) |
| Ea | activation energy, J/kg |
| Ep | specific depolymerization energy, J/kg |
| E′ | consumed energy at every pulse time, J |
| d | thickness of the electrodes, m |
| FA | gas dynamic force, N |
| FL | Lorenz force, N |
| H0 | latent heat of the solid-to-gel phase transition, J/kg |
| h | plate gap, m |
| I | circuit discharge current, A |
| Isp | specific impulse, s |
| Ibit | impulse bit, N·s |
| k | thermal conductivity, W/(m·K) |
| L | initial length of the Teflon solid layer, m |
| Lm | location of melting phase interface, m |
| LT | sum of loop self-inductance, H |
| Lc | capacitor self-inductance, H |
| Le | wire and lead self-inductance, H |
| Lpe | plate electrode geometry self-inductance, H |
| ΔL | moving distance of the ablative surface, m |
| m | cumulative ablation mass, kg |
| mass flux, kg/s | |
| ne | volumic electron number, m3 |
| Qm | energy released per unit time and volume, W/m3 |
| R | universal gas constant, Ω |
| Rc | resistance of the capacitor, Ω |
| Re | resistance of the wires and leads, Ω |
| Rps | resistance of the plate electrodes, Ω |
| Rp | plasma resistance, Ω |
| Rt | sum of the loop resistance, Ω |
| T | temperature, K |
| Te | electron temperature, K |
| Ts | surface temperature, K |
| Tp | phase-transition temperature, K |
| T/P | ratio of thrust to power |
| t | time, s |
| t′ | time period of a single pulse, s |
| V | discharge voltage, V |
| Va | acoustic velocity, m/s |
| w | plate width, m |
| x | vertical distance, m |
| kinematic speed, m/s | |
| ρ | density, kg/m3 |
| ρ0 | mean density, kg/m3 |
| ρr | reference density, kg/m3 |
| τ0 | thermal relaxation time, s |
| μ0 | permeability of the vacuum |
| σ | Boltzmann constant |
| η | efficiency |
| γ | absorption ratio of discharge energy |
| ε | absorption coefficient of ablation surface |
| Subscript | |
| s | under the solid state |
| m | under the melt state |
References
- Keidar, M.; Boyd, I.D.; Antonsen, E.L.; Burton, R.; Spanjers, G.G. Optimization Issues for a Micropulsed Plasma Thruster. J. Propuls. Power 2004, 22, 48–55. [Google Scholar] [CrossRef]
- Pottinger, S.J.; Scharlemann, C.A. Micro Pulsed Plasma Thruster Development. In Proceedings of the 30th International Electric Propulsion Conference, Florence, Italy, 17–20 September 2007. [Google Scholar]
- Thio, Y.C.F.; Cassibry, J.; Wu, S. Modeling the MSFC MK-1 Pulsed Plasma Thruster. In Proceedings of the Plasmadynamics and Lasers Conference, San Diego, CA, USA, 24–27 June 2013. [Google Scholar]
- Misra, K. Mathematical Modeling of Liquid-fed Pulsed Plasma Thruster. Aerospace 2018, 5, 13. [Google Scholar] [CrossRef]
- Neudorfer, J.; Stindl, T.; Stock, A.; Schneider, R.; Petkow, D.; Roller, S.; Munz, C.D.; Auweter-Kurtz, M. Three-Dimensional Simulation of Rarefied Plasma Flows Using a High Order Particle in Cell Method. In High Performance Computing in Science & Engineering; Springer: Berlin/Heidelberg, Germany, 2011; Volume 7984, pp. 593–604. [Google Scholar]
- Krejci, D.; Seifert, B.; Scharlemann, C. Endurance Testing of a Pulsed Plasma Thruster for Nanosatellites. Acta Astronaut. 2013, 91, 187–193. [Google Scholar] [CrossRef]
- Eslava, S.A. Design of a Micro-Pulsed Plasma Thruster; AIAA: Reston, VA, USA, 2014. [Google Scholar]
- Cassibry, J.T.; Thio, F.; Markusic, T.E.; Wu, S.T. Numerical Modeling of a Pulsed Electromagnetic Plasma Thruster Experiment. J. Propuls. Power 2015, 22, 628–636. [Google Scholar] [CrossRef]
- Jahn, R.G.; Lyman, F.A. Physics of Electric Propulsion; McGraw-Hill: New York, NY, USA, 1968. [Google Scholar]
- Turchi, P.J.; Mikellides, P.G. Modeling of Ablation-Fed Pulsed Plasma Thrusters; AIAA 95-2915; AIAA: Reston, VA, USA, 1995. [Google Scholar]
- Hart, P.J. Resistance of a High-Intensity Arc. J. Appl. Phys. 1962, 33, 2983. [Google Scholar] [CrossRef]
- Vondra, R.J.; Thomassen, K.; Solbes, A. Analysis of Solid Teflon Pulsed Plasma Thruster. J. Spacecr. Rocket. 1970, 7, 1402–1406. [Google Scholar]
- Wei, R. The Diffusion Model for PPT and the Solution of a Simplified MHD Equation Set. Chin. J. Space Sci. 1982, 2, 319–326. (In Chinese) [Google Scholar]
- Zhang, H.; Wu, J.-J.; Zhang, D.-X.; Zhang, R.; He, Z. A new electromechanical model for the simulation of the abaltion process of Pulsed Plasma Thruster. Acta Phys. Sin. 2013, 62, 1–6. (In Chinese) [Google Scholar]
- Laperriere, D.; Gatsonis, N.; Demetriou, M. Electromechanical Modeling of Applied Field Micro Pulsed Plasma Thrusters. In Proceedings of the AIAA/ASME/SAE/ASEE Joint Propulsion Conference & Exhibit, San Jose, CA, USA, 14–17 July 2013. [Google Scholar]
- Cassady, R.J.; Hoskins, W.A.; Campbell, M.; Rayburn, C. A micro pulsed plasma thruster (PPT) for the “Dawgstar” spacecraft. In Proceedings of the Aerospace Conference Proceedings, Big Sky, MT, USA, 25 March 2000. [Google Scholar]
- Huang, T.; Wu, Z.; Liu, X.; Xie, K.; Wang, N.; Cheng, Y. Modeling of gas ionization and plasma flow in ablative pulsed plasma thrusters. Acta Astronaut. 2016, 129, 309–315. [Google Scholar] [CrossRef]
- Ciaralli, S.; Coletti, M.; Gabriel, S.B. Results of the qualification test campaign of a Pulsed Plasma Thruster for Cubesat Propulsion (PPTCUP). Acta Astronaut. 2016, 121, 314–322. [Google Scholar] [CrossRef]
- Coletti, M.; Ciaralli, S.; Gabriel, S.B. PPT Development for Nanosatellite Applications: Experimental Results. IEEE Trans. Plasma Sci. 2015, 43, 218–225. [Google Scholar] [CrossRef]
- Zhang, Y.; Zhang, D.; Wu, J.; He, Z.; Zhang, H. A novel laser ablation plasma thruster with electromagnetic acceleration. Acta Astronaut. 2016, 127, 438–447. [Google Scholar] [CrossRef]
- Zhang, Y.; Zhang, D.; Wu, J.; Li, J.; He, F. Non-Fourier heat conduction and phase transition in laser ablation of polytetrafluoroethylene (PTFE). Acta Astronaut. 2017, 140, 338–350. [Google Scholar] [CrossRef]
- Arai, N. Transient Ablation of Teflon in Intense Radiative and Convective Environments. AIAA J. 1979, 17, 634–640. [Google Scholar] [CrossRef]
- Gatsonis, N.A.; Juric, D.; Stechmann, D.P. Numerical Analysis of Teflon Ablation in Pulsed Plasma Thrusters; AIAA 2007-5227; AIAA: Reston, VA, USA, 2007. [Google Scholar]
- Zhang, Z.; Liu, D.Y. Advanced in the study of non-Fourier heat conduction. Adv. Mech. 2000, 3, 446–456. [Google Scholar]
- Keidar, M.; Boyd, I.D.; Beilis, I.I. Electrical Discharge in the Teflon Cavity of a Coaxial Pulsed Plasma Thruster. IEEE Trans. Plamsa Sci. 2000, 28, 376–385. [Google Scholar] [CrossRef]
- Cho, M.; Sung, H.G. Theoretical Modeling of Pulsed Plasma Thruster Performance with Teflon Ablation. Int. J. Aeronaut. Space Sci. 2017, 18, 138–143. [Google Scholar] [CrossRef]
- Tahara, H.; Edamitsu, T.; Sugihara, H. Performance Characteristics of Electrothermal Pulsed Plasma Thrusters with Insulator-Rod-Arranged Cavities and Teflon-Alternative Propellants. In Proceedings of the 30th International Electric Propulsion Conference (IEPC-2007-337), Florence, Italy, 17–20 September 2007. [Google Scholar]
- Lin, G.; Karniadakis, G. High-Order Modeling of Micro-Pulsed Plasma Thrusters. In Proceedings of the Theoretical Fluid Mechanics Meeting, St. Louis, MO, USA, 24–26 June 2002. [Google Scholar]
- Gatsonis, N.A.; Demetriou, M.A. Prospects of Plasma Flow Modeling and Control for Micro Pulsed Plasma Thrusters; AIAA 2004-3464; AIAA: Reston, VA, USA, 2004. [Google Scholar]
- Zhang, Y.; Zhang, D.; Wu, J.; He, Z.; Deng, X. A thermal model for nanosecond pulsed laser ablation of aluminum. AIP Adv. 2017, 7, 1–15. [Google Scholar] [CrossRef]
- Stechmann, D.P. Numerical Analysis of Transient Teflon Ablation in Pulsed Plasma Thrusters; Worcester Polytechnic Institute: Worcester, MA, USA, 2007. [Google Scholar]
- Vondra, R.; Thomassen, K.; Solbes, A. Analysis of Solid Teflon Pulsed Plasma Thruster; AIAA Paper 70-179; AIAA: Reston, VA, USA, 1970. [Google Scholar]
- Zhang, D.; Wu, J.; Zhang, R.; Zhang, H.; He, Z. High precision micro-impulse measurements for micro-thrusters based on torsional pendulum and sympathetic resonance techniques. Rev. Sci. Instrum. 2013, 84, 125113. [Google Scholar] [CrossRef] [PubMed]
- Schonherr, T. Investigation of Performance and Plasma Dynamics of the Pulsed Plasma Thruster ADD SIMP-LEX; The University of Tokyo: Tokyo, Japan, 2011. [Google Scholar]


| Parameters | Values |
|---|---|
| Thermal conductivity under a solid state (ks) | (5.023 + 6.11 × 10⁻² T) × 10−2 W/(m·K) |
| Thermal conductivity under a melt state (km) | (87.53 − 0.14 T + 5.82 × 10⁻⁵ T2) × 10−2 W/(m·K) |
| Density under a solid state (ρs) | (2.119 + 7.92 × 10⁻⁴ T − 2.105 × 10⁻⁶ T2) × 103 kg/m3 |
| Density under a melt state (ρm) | (2.07 – 7 × 10⁻⁴ T) × 103 kg/m3 |
| Reference density (ρr) | 1933 kg/m3 |
| Specific heat capacity under a solid state (Cs) | 514.9 + 1.563 T J/(kg·K) |
| Specific heat capacity under a melt state (Cm) | 904.2+0.653 T J/(kg·K) |
| Absorption coefficient of the surface (ε) | 0.92 |
| Pre-exponential factor (Ap) | 3.1 × 10¹⁹ s−1 |
| Activation energy (Ea) | 3.473 MJ/kg |
| Specific depolymerization energy (Ep) | 1.774 × 10⁶ − 279.2 T J/kg |
| Absorption ratio of discharge energy (γ) | 0.05 |
| Parameters | Values | Parameters | Values |
|---|---|---|---|
| Initial discharge voltage (V0) | 1720 V | Plate length (l) | 20 mm |
| Capacitance resistance (Rc) | 56 mΩ | Capacitance (C) | 4 μF |
| Capacitance inductance (Lc) | 41.5 nH | Impulse time (t′) | 0.4 μs |
| Plate gap (h) | 20 mm | Plasma temperature (Te) | 1.5 eV |
| Plate width (w) | 10 mm | Electron density (ne) | 1021 m3 |
| Parameters | Values | Parameters | Values |
|---|---|---|---|
| Initial discharge voltage (V0) | 1360 V | Plate length (l) | 6 mm |
| Capacitance resistance (Rc) | 30 mΩ | Capacitance (C) | 2 μF |
| Capacitance inductance (Lc) | 34 nH | Impulse time (t′) | 0.4 μs |
| Plate gap (h) | 30 mm | Plasma temperature (Te) | 1.5 eV |
| Plate width (w) | 10 mm | Electron density (ne) | 1021 m3 |
| Performance Parameters | Simulation Results | Experimental Results | Experimental Results in Coletti’s Paper [19] |
|---|---|---|---|
| Specific impulse (Isp) | 628.90 s | 613. 84 s | 650 ± 56 s |
| Impulse bit (Ibit) | 85.26 μN·s | 91. 32 μN·s | 90 ± 8.1 μN·s |
| Ablation mass (m) | 13.8 μg | 15.7 μg | 14.2 ± 2.6 μg |
| Performance Parameters | Simulation Results | Experimental Results [14] |
|---|---|---|
| Specific impulse (Isp) | 297.84 s | 300 s |
| Impulse bit (Ibit) | 34.63 μN·s | 31.2 μN·s |
| Ablation mass (m) | 11.5 μg | 10 μg |
© 2018 by the authors. Licensee MDPI, Basel, Switzerland. This article is an open access article distributed under the terms and conditions of the Creative Commons Attribution (CC BY) license (http://creativecommons.org/licenses/by/4.0/).
Share and Cite
Ou, Y.; Wu, J.; Zhang, Y.; Li, J.; Tan, S. Theoretical Modeling and Parameter Analysis of Micro-Pulsed Plasma Thruster. Energies 2018, 11, 1146. https://doi.org/10.3390/en11051146
Ou Y, Wu J, Zhang Y, Li J, Tan S. Theoretical Modeling and Parameter Analysis of Micro-Pulsed Plasma Thruster. Energies. 2018; 11(5):1146. https://doi.org/10.3390/en11051146
Chicago/Turabian StyleOu, Yang, Jianjun Wu, Yu Zhang, Jian Li, and Sheng Tan. 2018. "Theoretical Modeling and Parameter Analysis of Micro-Pulsed Plasma Thruster" Energies 11, no. 5: 1146. https://doi.org/10.3390/en11051146
APA StyleOu, Y., Wu, J., Zhang, Y., Li, J., & Tan, S. (2018). Theoretical Modeling and Parameter Analysis of Micro-Pulsed Plasma Thruster. Energies, 11(5), 1146. https://doi.org/10.3390/en11051146