1. Introduction
Photovoltaics (PV) nowadays has become a very mature and developed technology. Beside the technology advantages, photovoltaics also became one of the cheapest electricity sources. Here, we are not speaking about big PV plants, but also about small household PV systems. Of course the PV electricity price in small household systems in competitive only if the whole consumer electricity price, together with all taxes, is considered. To maximize the rate of return, prosumers have to consume as much PV energy as possible by themselves or should be included in a net-metering/net-billing scheme. The system is economically feasible in all countries where the PV electricity met the household grid parity.
After the rapid drop or even a complete abolishment of the feed-in-tariffs for PV across Europe some years ago, the interest in large PV system plants has dropped. On the other hand, due to the low PV system prices per kW, as also due to new supporting schemes, like net-metering in some countries [
1], small household PV systems are becoming more and more attractive. The net-metering scheme is in a way very customer-friendly since the prosumers usually do not have to take care about the self-consumption because the used and the produced energy is balanced and charged on monthly or annual basis. A net-metering prosumer has just to balance the total energy consumption and production.
If a prosumer is not included in any incentive scheme, then he or she has an interest to consume the PV energy directly. In this case the PV energy production forecast becomes very important. The way that we are living today in the developed world is changing. While on one hand, more and more people want to be energy independent or just to lower their electricity bill, on the other hand, new electricity appliances, like smart household appliances, smart heating systems, and last but not least, electric cars, are penetrating into households. Especially, electric cars will affect the household electrical energy and power demand from grid tremendously. However, to keep the electric system reliably like it was in the past and to simultaneously introduce renewable energy sources and new energy intensive consumers, we need to develop a reliable forecasting system that will help to balance the consumption and production.
There are already several PV power and energy forecasting systems or services [
2,
3,
4,
5,
6], but they are in general too complicated or too expensive for a household prosumer. Additionally, since the electric consumers are not fully automated in a smart-house system [
7,
8], the user has to manually decide when to use which appliance as a load. i.e., if the prosumer has the energy forecast for the next day he can decide whether to use the washing machine today or tomorrow and at what time; whether to heat up the water tank for the central heating with the electricity form the grid today or to keep the minimum requirements and wait until tomorrow for the sun; and, whether to charge the electric car or the battery bank above the required capacity or not.
In this paper we would like to present a way to predict the power and energy production with the use of the local meteorological forecast and public available models. Since the reliability and quality of the data is low, we will describe all of the problems and solutions when using these data. Additionally, all of the results will be presented together with their uncertainties.
2. Energy Forecasting
There are two different ways of PV system energy forecasting: annual and daily. The first solution is used when a new PV system is planned [
9]. The calculations are based on the average annual irradiation data on the location. The irradiation data can be obtained from the actual measured values at a local meteorological station [
10], from measured satellite data [
11], or modelled [
12,
13,
14]. Measured data are usually averaged over a certain period of time, i.e., over the last 10 years to get the data as reliable as possible. Also, the modelled data are based on measured data from selected meteorological stations and then inter- or extrapolated to the desired location. In addition, to the irradiation data, we have to know or determine the local horizon to estimate the shading losses of the planed PV system. Simple PV system energy forecasting calculations use just these data and estimate all other losses (mismatch losses, temperature losses, Joule losses in cabling, inverter losses) with a single empirically defined parameter [
15]. More comprehensive calculations also take into account the information of the mean temperature at the location, calculate the mismatch losses with regard to the selected PV module, and include a simulation of cabling and inverter losses. The result of this energy forecast simulation is usually the expected PV system final energy yield (
YF), which is given in kWh/kW, or in some cases, also the expected performance ratio (
PR). The uncertainty of the calculations is relatively low and can lie below 10% when good quality data is used.
The daily energy forecasting methodology is more complicated since it predicts the actual energy output of a PV system for the next day. The result is usually given on an hourly basis. This energy forecast became more and more important in the recent years when the share of the renewable energy sources became noticeable in the whole electricity portfolio of the local energy distributor. For an energy distributor, it is crucial to know the behaviour of very dynamic energy sources to maintain the electricity supply reliable and stable. But, beside the big energy distributors, the PV energy forecasting is important also to the investor, especially if the produced energy is self-consumed. A good and reliable PV energy forecasting will become more and more important in the future with smart houses, smart appliances, and last but not least, with electric cars. An energy balance in households with self-consumption will become very important since the interest of the prosumer is to consume as much self-produced energy as possible.
Currently, there are already several companies that offer a complete PV monitoring system, together with the energy forecasting service [
4,
5]. The forecasting usually depends on the satellite meteorological data and weather forecasting simulation software. However, for a prosumer with a small PV system of several kW, this service is too expensive or is too complicated.
To our knowledge, there is no model on the market that relies only on the local weather forecast without the knowledge of the forecasted irradiance value. The existing short-term forecasting models start with the forecasted irradiance value [
16,
17,
18,
19]. According to [
18], forecasting global solar irradiance is the same problem as forecasting the PV power output. The modelling of the clearness index is usually done by an auto regressive function [
12,
18] or neural networks [
20]. In our approach the PV, energy forecast is purely based on the weather forecast of the local meteorological agency [
10]. Since we wanted to make a model that is capable to predict the PV energy output on the current weather forecast without the knowledge of the weather history, we could not use any auto regression or self-learning techniques.
3. Modelling
Using the weather forecast data of the local meteorological station, the solar irradiation information is hidden in the weather type information like cloudy, partially sunny, sunny… Beside the weather type information, also temperature information and forecast of precipitation are available. While the accuracy of the temperature forecast is usually acceptable, the main problem presents the irradiation forecast, since no irradiance value is given.
The modelling methodology in the paper is divided in three sections with regard to modelled parameter: irradiation modelling form the actual weather forecast, irradiation transposition to plane-of-array, and PV system energy output modelling.
The methodology is based on the daily weather forecast and data of the last four years (2014–2017) by the Slovenian meteorological agency—ARSO [
10]. Each forecast was issued in the early hours of the day and it is valid for the day of issuing and two consecutive days.
3.1. Weather Conditions—Irradiation Modelling
The forecast weather data is given in three-hour period for the issuing date and two consecutive days. The data includes five different weather conditions: clear sky, mostly clear, partly cloudy, prevailingly cloudy, and overcast. Additionally, there is information of the precipitation in three steps: light, moderate and heavy rain or snow-fall. Beside the weather conditions, also the ambient temperature and wind speed data is available. Wind data was not considered in the paper, since the local wind conditions usually deviate largely from the forecasted regionally valid value.
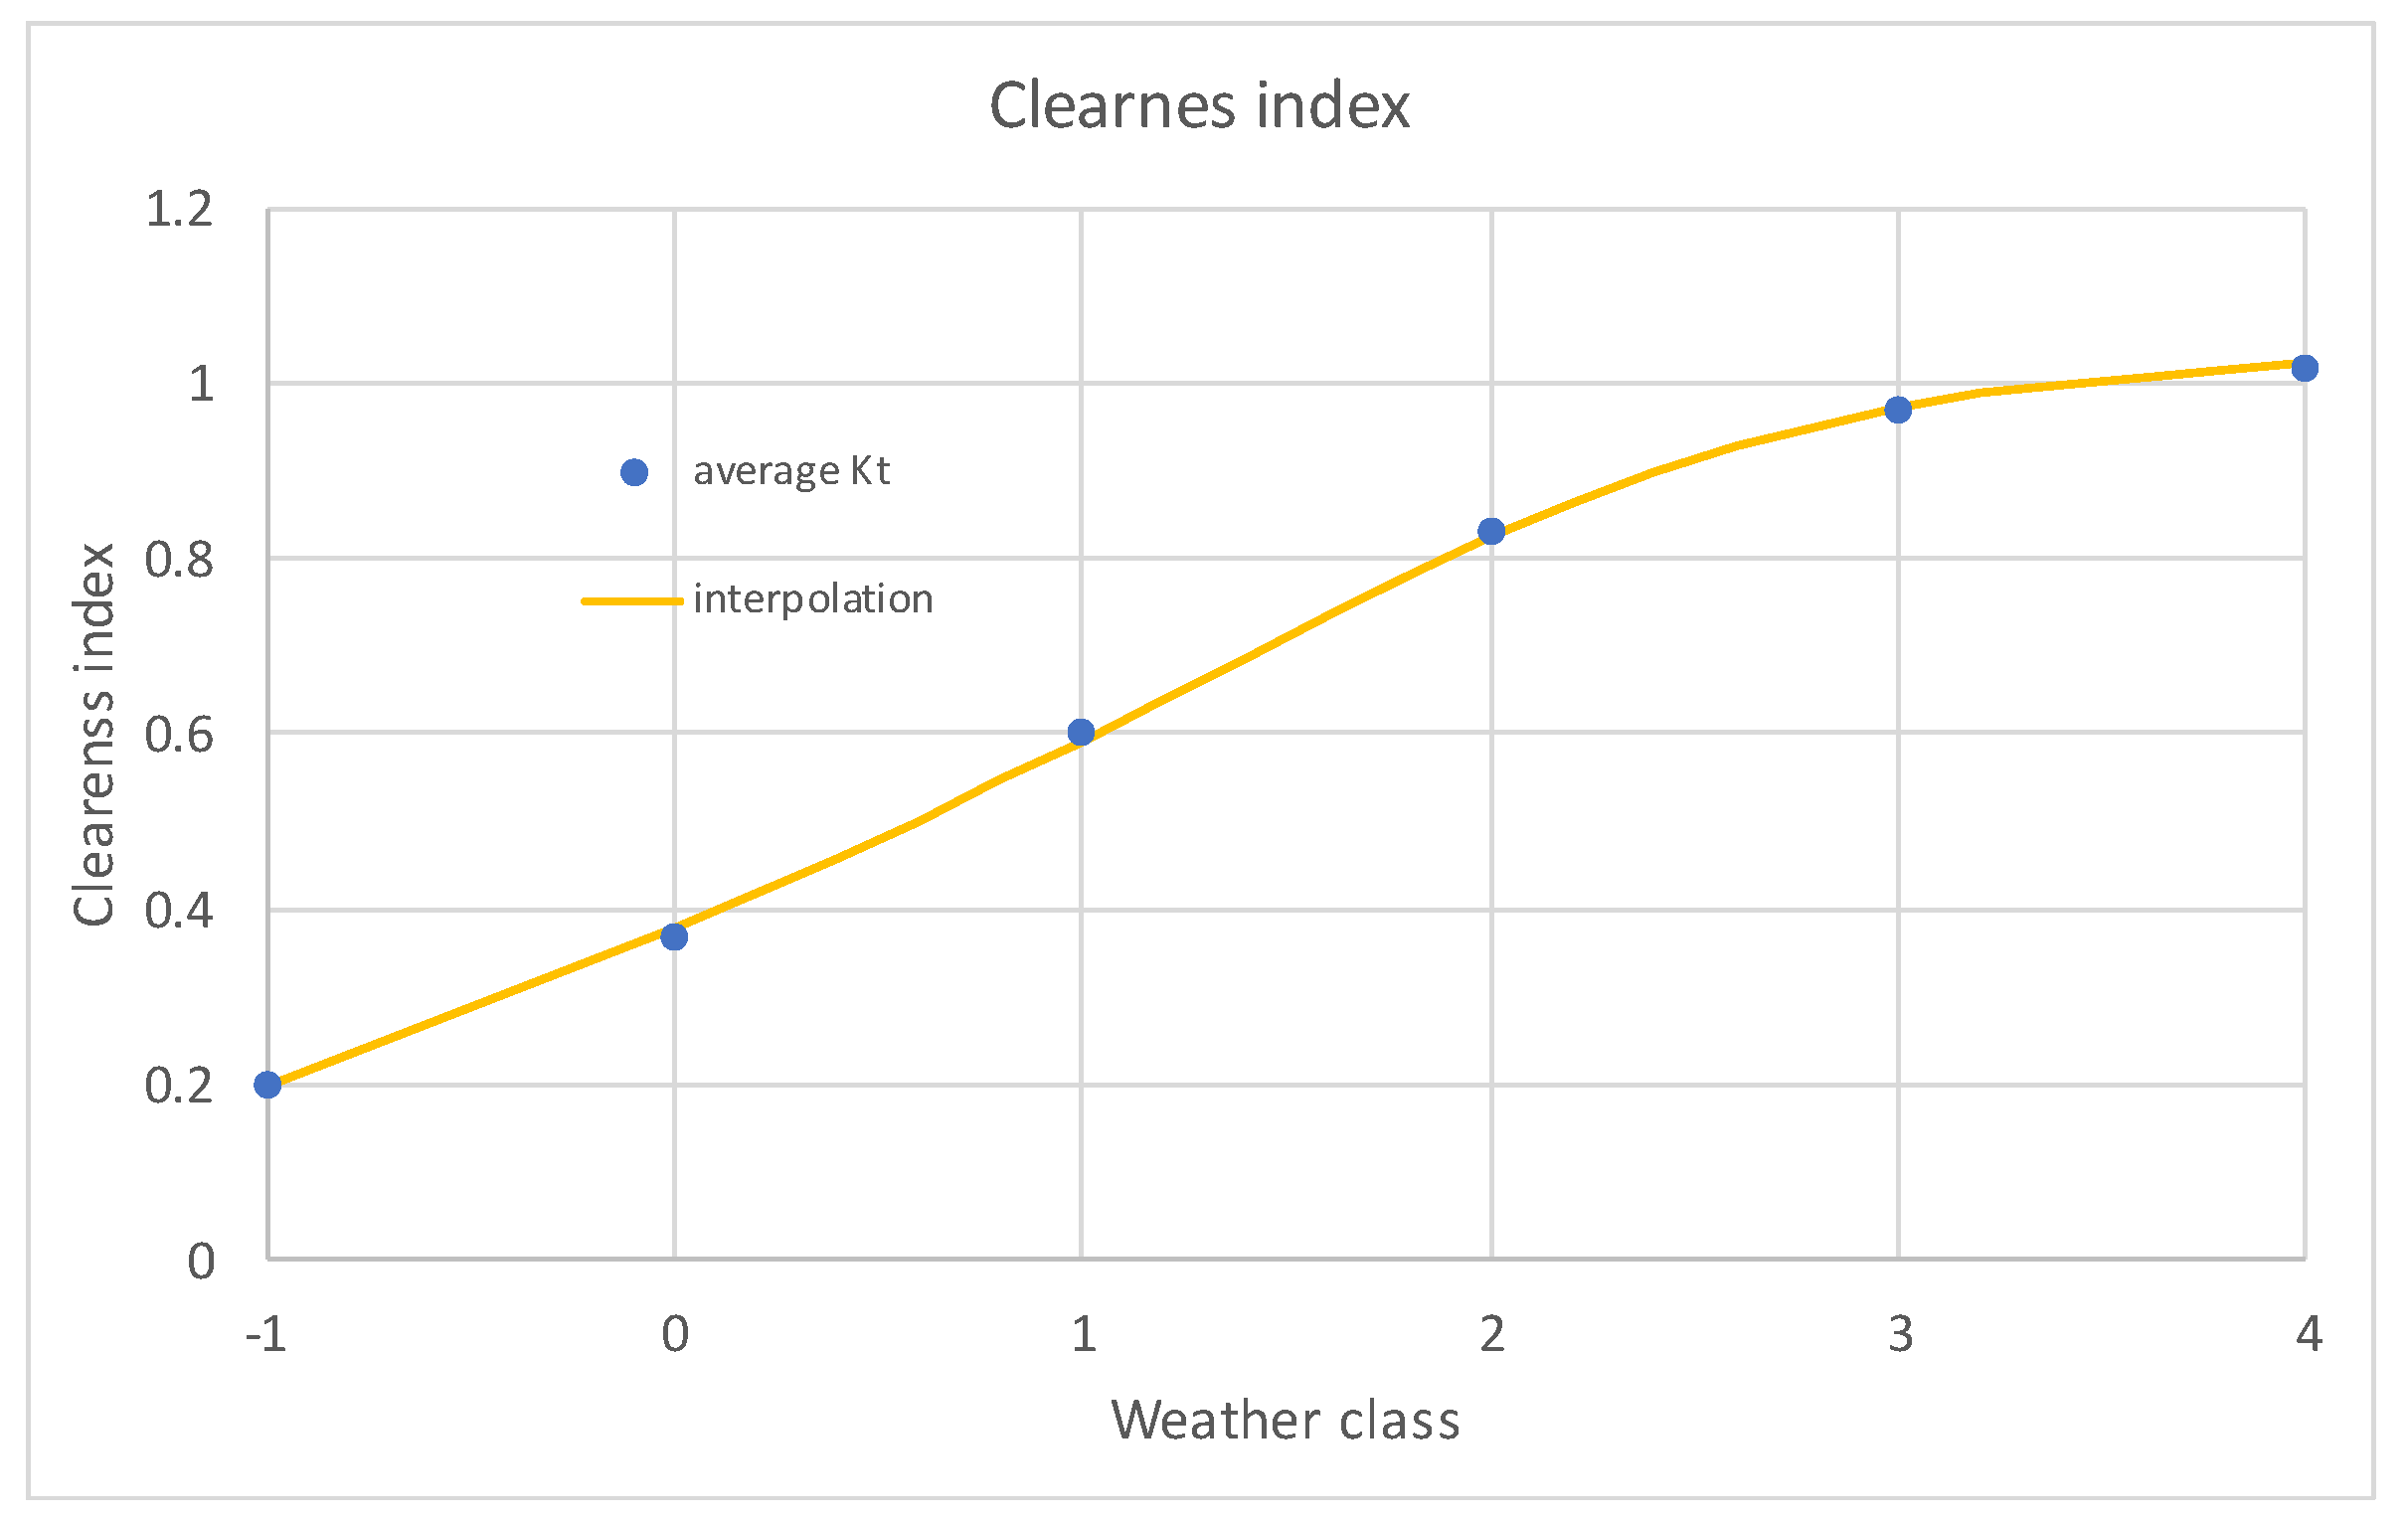
The weather data we divide into five main classes (
wc) (marked from 0 to 4 in the paper) plus one additional class for a really dark weather conditions with heavy rainfalls (marked as −1). To each class, we define a clearness index (
Kt). The clearness index was derived from the measured irradiance value of the weather report at the same meteorological station and calculated clear sky irradiance (
Gcs). The value is an average clearness index at the selected weather condition, since this approach gave better results than the regression analysis over all the values. We used two clear sky models (Inechien [
21] and Heliosat-1 [
22]) however, the Heliosat-1 clear sky model gave better results and is presented in this study. Separately, we derived the average clearness index also for overcast days with a heavy rainfall. The data is collected and presented in
Table 1.
Over the derived data we made a 5th order polynomial interpolation that was used in the further calculations of the clearness index (
Figure 1). The clearness indexes were derived for the location Ljubljana, but could be valid for any location in the central Europe where the weather is forecasted in five classes.
During the input data analysis, we could observe some correlation between the accuracy of the defined clearness index and the constancy of the forecasted weather, as also large changes between the forecasts of the prevailing, current and successive hour. The actual value of the
wc was therefore in the first round taken from the weather forecast for the selected hour and in the second round calculated from the previous forecasts (
k0,i,
k−1,i,
k−2,i) for the observed
i-th hour and the forecast of the preceding (
k0−1h,i) and successive (
k0+1h,i) hour. The actual expected weather condition was defined as the weighted arithmetic mean of the five weighted forecasted values (Equation (2)). The weights were defined by the optimisation procedure with the RMS error as a criterion. The resulting weights are presented in
Table 2.
Table 2 shows that the weights of the latest forecast
Wk0, i are dominant in all cases, except in the case of an overcast weather condition. The influence of the precipitation was taken into account in a way that the light rainfall changes the
wc for one third, moderate rainfall for two thirds, and heavy rain for the whole weather class. The solar irradiance for the observed location was calculated by multiplying the clearness index with the clear sky irradiance value.
Since only five weather classes are given in the weather forecast, the reliability of the irradiance is not at the highest level. The uncertainties are presented by the Root-Mean-Square (RMS) error of the relative deviation of the measured value [
10] from the simulated one, and the R-squared (R
2) factor, which is similar to the correlation factor:
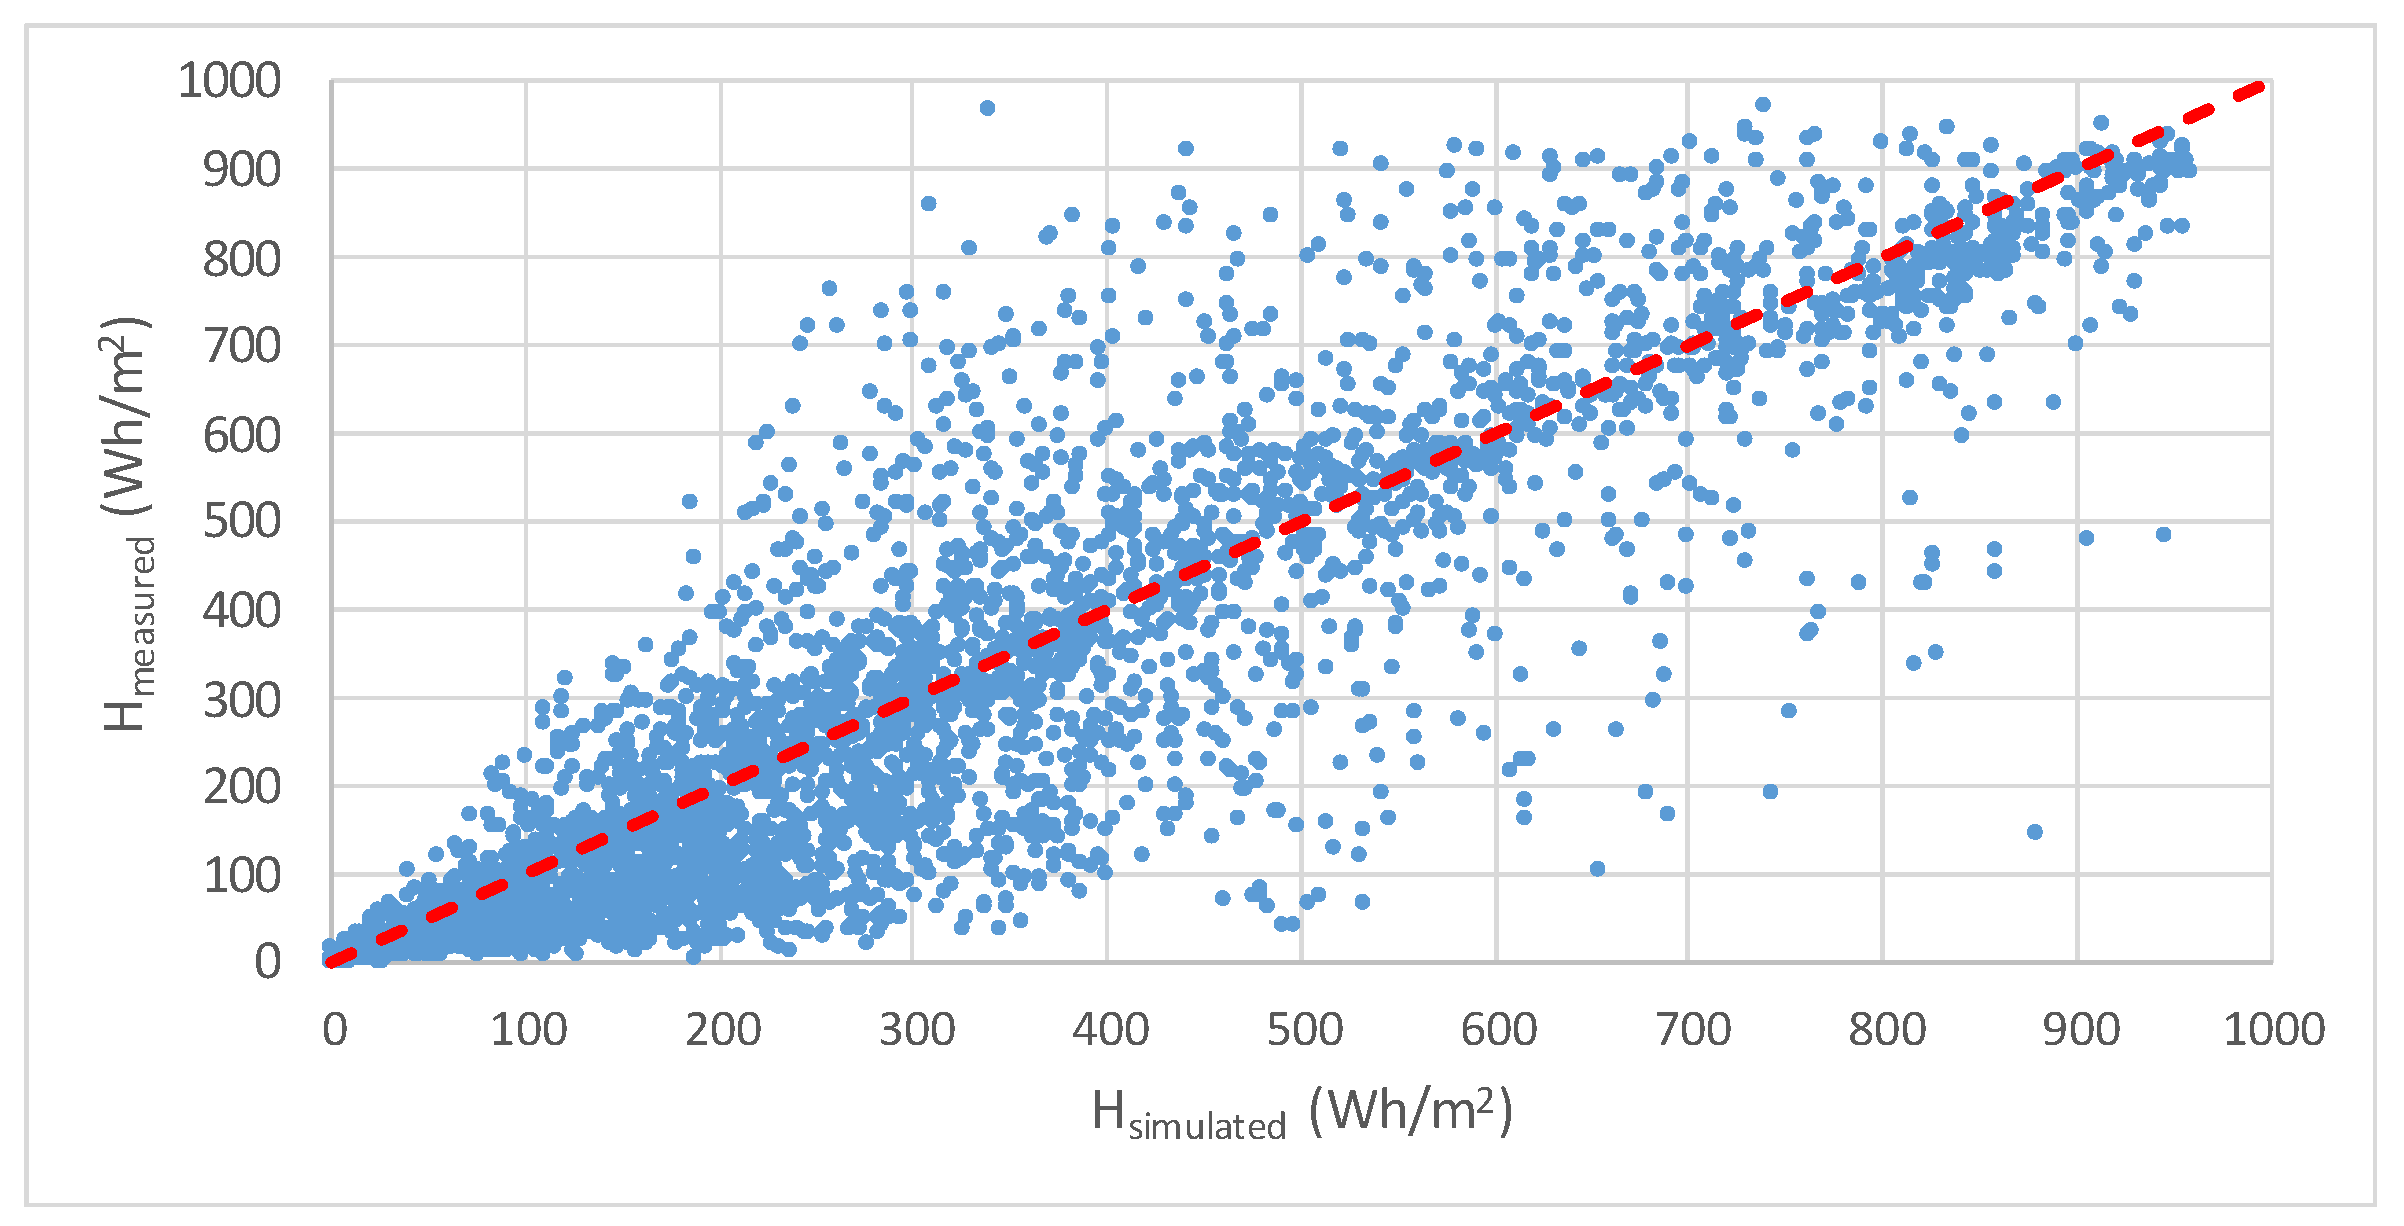
Figure 2 shows the measured vs. simulated hourly irradiation for Ljubljana, Slovenia for the last three and a half years. The RMS error of the relative difference between the measured and the simulated value is 44%. The R
2 factor is 0.79.
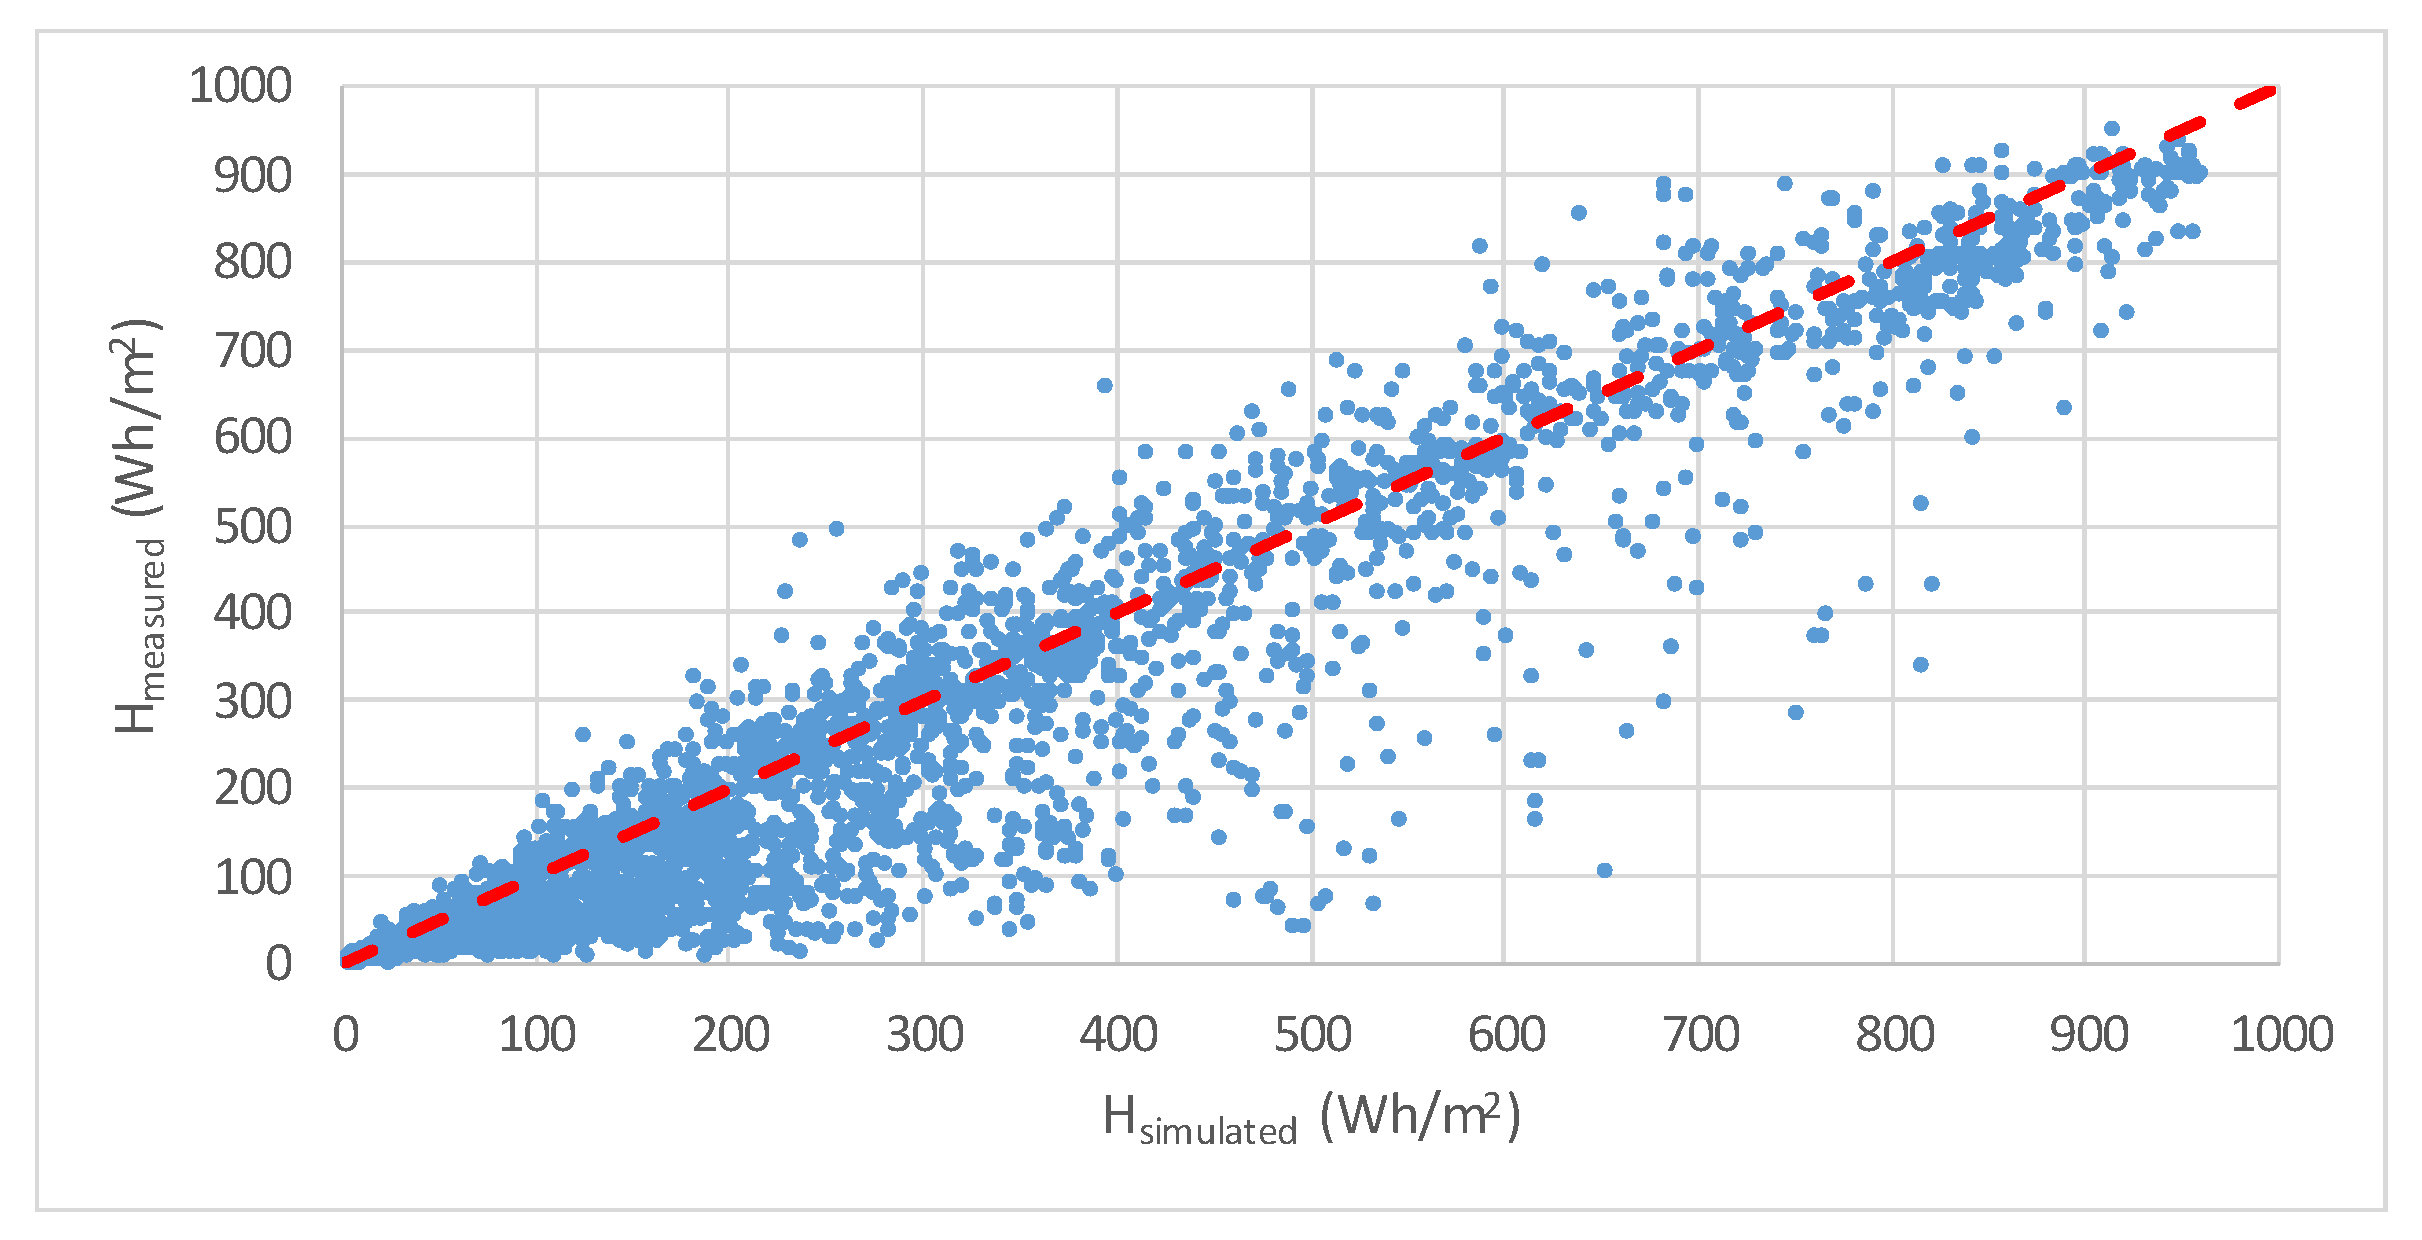
To improve the reliability of the data and to remove all of the outliers, we decided to work only with data where the actual weather condition deviates from the forecasted one for not more than one weather class. In the four years around 65% of the data match the criteria. The results are presented in
Figure 3. The RMS error is much lower (34%) and the R
2 factor reaches 0.91. The main problem to simulate the irradiance is at overcast conditions where the solar irradiance is relatively low.
Table 3 presents the RMS error and the R
2 factor for all weather conditions separately.
When only the latest forecasted weather class value is used, the RMS error over all weather conditions changes very slightly to a value of 33.7%. However, the use of averaged weighted forecasted values is advisable when the whole input data (not limited to −1 ≤ (wcforecast − wcmeasured) ≤ 1) is used. In that case, the RMS error drops from 55.9 to 46.7%.
3.2. Transposition of Irradiation to Plane-of-Array
To calculate the plane-of-array irradiation, we have to know the diffuse share of the irradiation. Several transposition models were tested [
23,
24,
25,
26], but finally our previously developed solar irradiation model SISIM [
27] with the modified Louche [
23] global to diffuse model was used to calculate the diffuse part of the light. Plane-of-array irradiation was calculated by the most used and cited Perez et al. [
28] model. According to our previous work, the error of the horizontal to plane-of array irradiation model is around 10% for irradiance values over 200 W/m
2 and 40% for low irradiance conditions when the transposition to south 30° is made.
In our case, we transform the irradiation to an orientation of 25° east and an inclination of 30°, which is the position of our PV system that is used as a reference and verification object for our study (
Figure 4). The R
2 factor between the simulated and measured values is 0.98, while the RMS error is 33%.
3.3. PV System Output Modelling
There are several ways how to model the power output of the PV system. The simplest way is to calculate with the basic equation [
29]:
where
Prated is the rated PV system power,
Gsim,i the simulated/measured irradiance,
GSTC = 1000 W/m
2,
Tmodule,i module temperature and
γ power temperature coefficient of the module, and
PLF is the power loss factor. The drawback of the equation is the absence of the system losses and the influence of the degradation mechanisms. However, all these influences can be included in the equation as a
PLF, which is due to the degradation time dependent.
The other was is to use analytical or heuristic models to calculate the PV system performance. In general, these models need some additional information, like
I-V curve of a module or at least the measured weather data at the observed location, which are usually not available for an owner of a household size PV system. While the analytical models, that need knowledge of many measured
I-V curves at different combinations of irradiance and temperature, heuristic models rely on measured power output and weather data. The benefit of the heuristic model is that the parameters can be frequently and automatically defined from the PV system data, which means that the models automatically include the influence of the degradation mechanisms, seasonal or other temporary changes in the energy output. Anyhow, measurements of the PV system power, solar irradiance, and ambient or module temperature are needed. Several heuristic model are already available [
30,
31,
32,
33]. They differ from each other in how many coefficients they need and the type of interpolation (linear, bilinear, non-linear). We decided to use a relatively simple but efficient non-linear model with three coefficients [
30].
where
Gpoa is plane-of-array irradiance and a, b, c fitting parameters that were derived from the measurements of our PV system [
33]. Since the model parameters are usually extracted from temperature compensated values, the temperature compensation is added to the model:
To improve the model even further, especially at lower irradiance values at larger incidence angles, we can add incidence angle dependence factor [
34]:
where
θs is the solar incidence angle and
ar the angular loss factor, typically 0.2.
In
Figure 5, the measured vs. simulated PV system output is presented. The RMS error of the heuristic and linear model is 12% and 14%, respectively.
4. Results
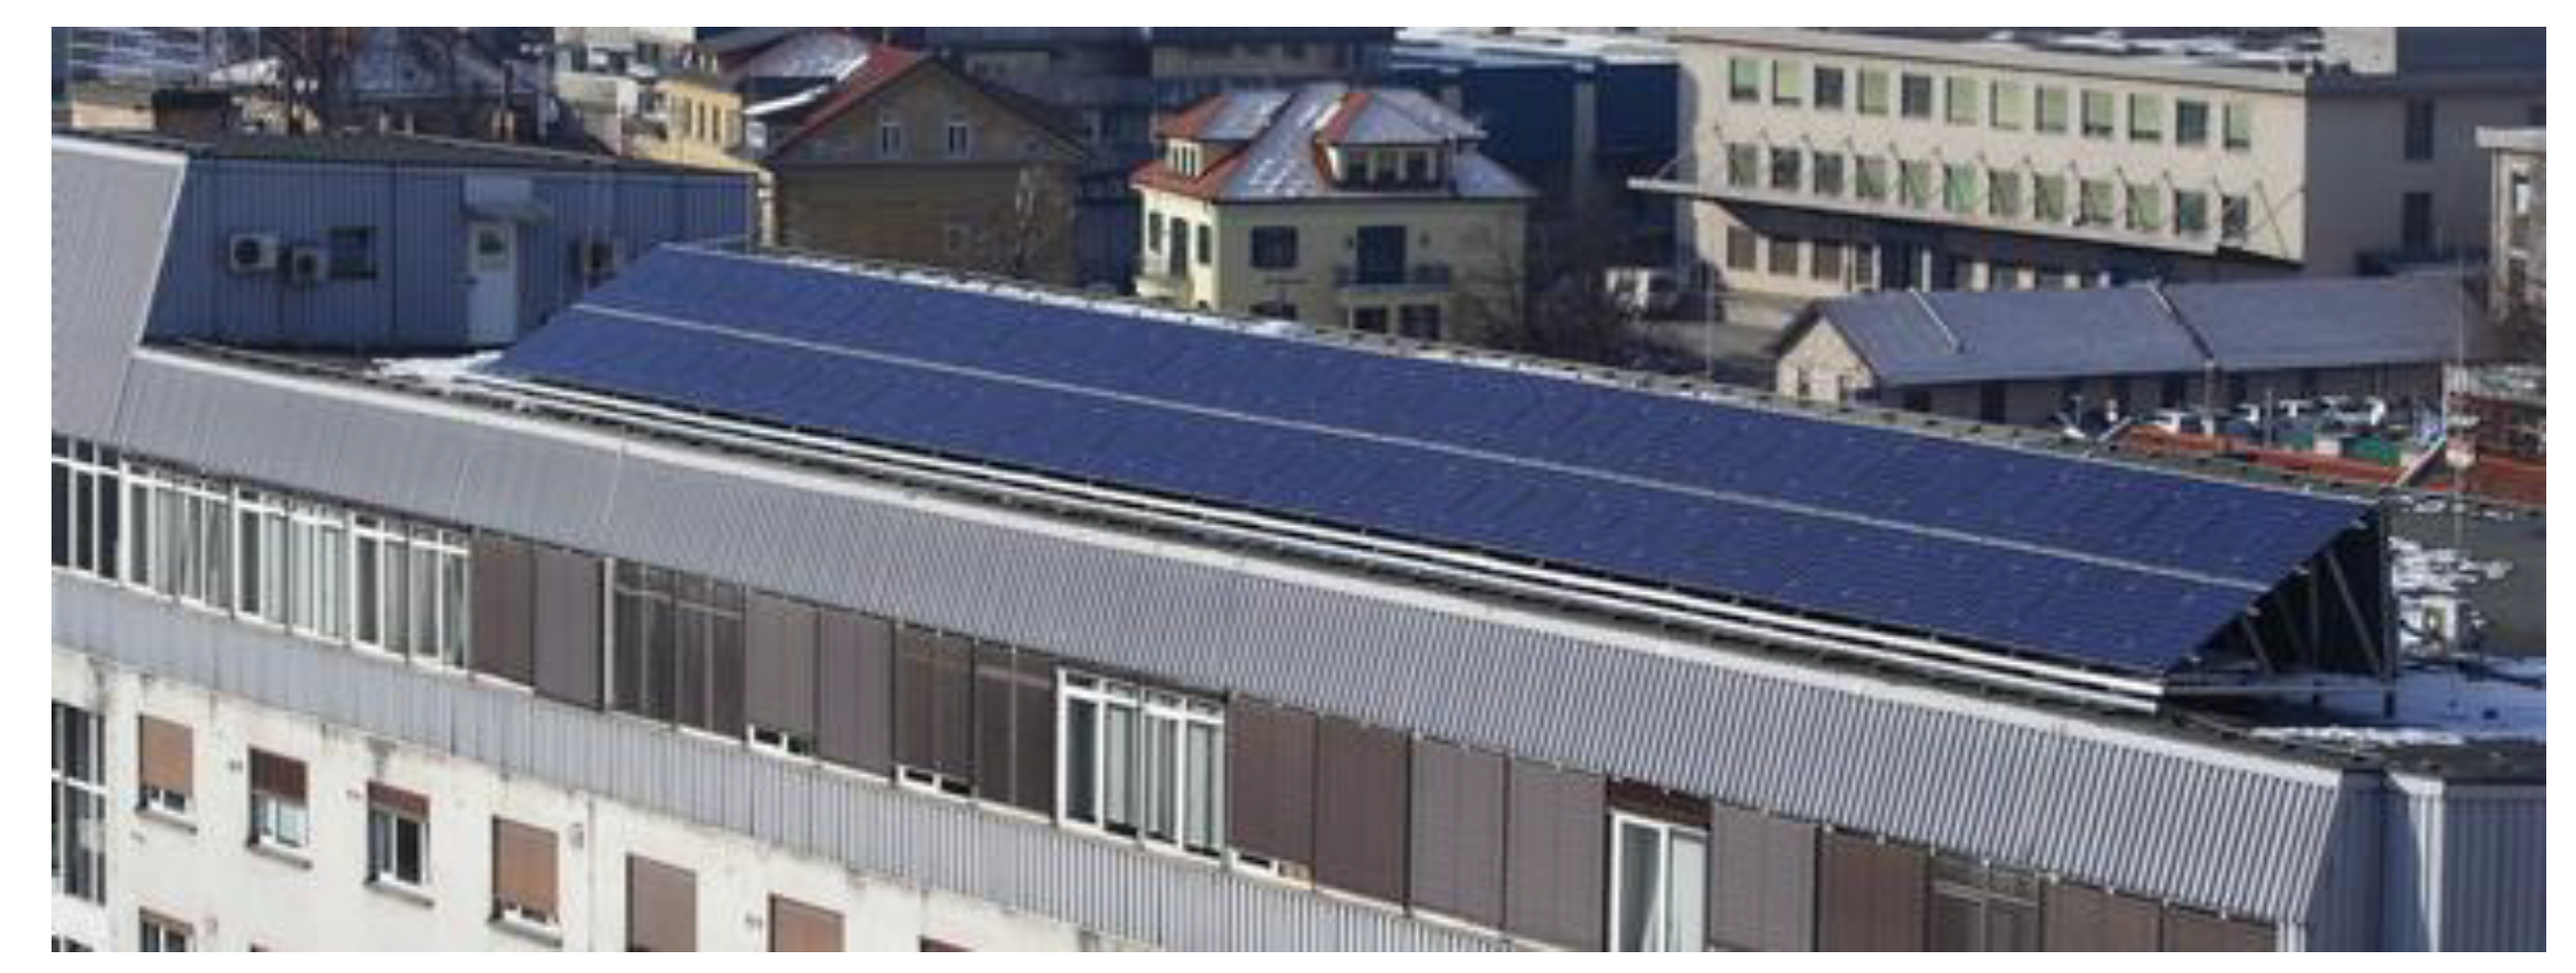
The PV system forecast methodology that is presented in the previous section is applied to a rooftop PV system for verification. The PV system is mounted on the roof of Faculty of Electrical Engineering in Ljubljana (46.067° N, 14.517° E), Slovenia. The orientation of PV modules is 25° east with an inclination angle of 30°. There are no obstacles that could shade the PV modules and influence the PV system energy production. A photo of the PV system is presented in
Figure 6.
The PV system was installed at the end of 2010, and since June 2014 the weather forecast data from ARSO [
10] are logged.
4.1. PV System Energy Forecast Validation
As already mentioned, we simulate the PV system energy output on the forecasts from the local meteorological station and use the measured data of irradiance, temperature, and PV system energy production for verification from our PV system test site. To present all of the steps together with the uncertainties of the results we used the weather data that deviate from the actual measured conditions for not more than one weather class.
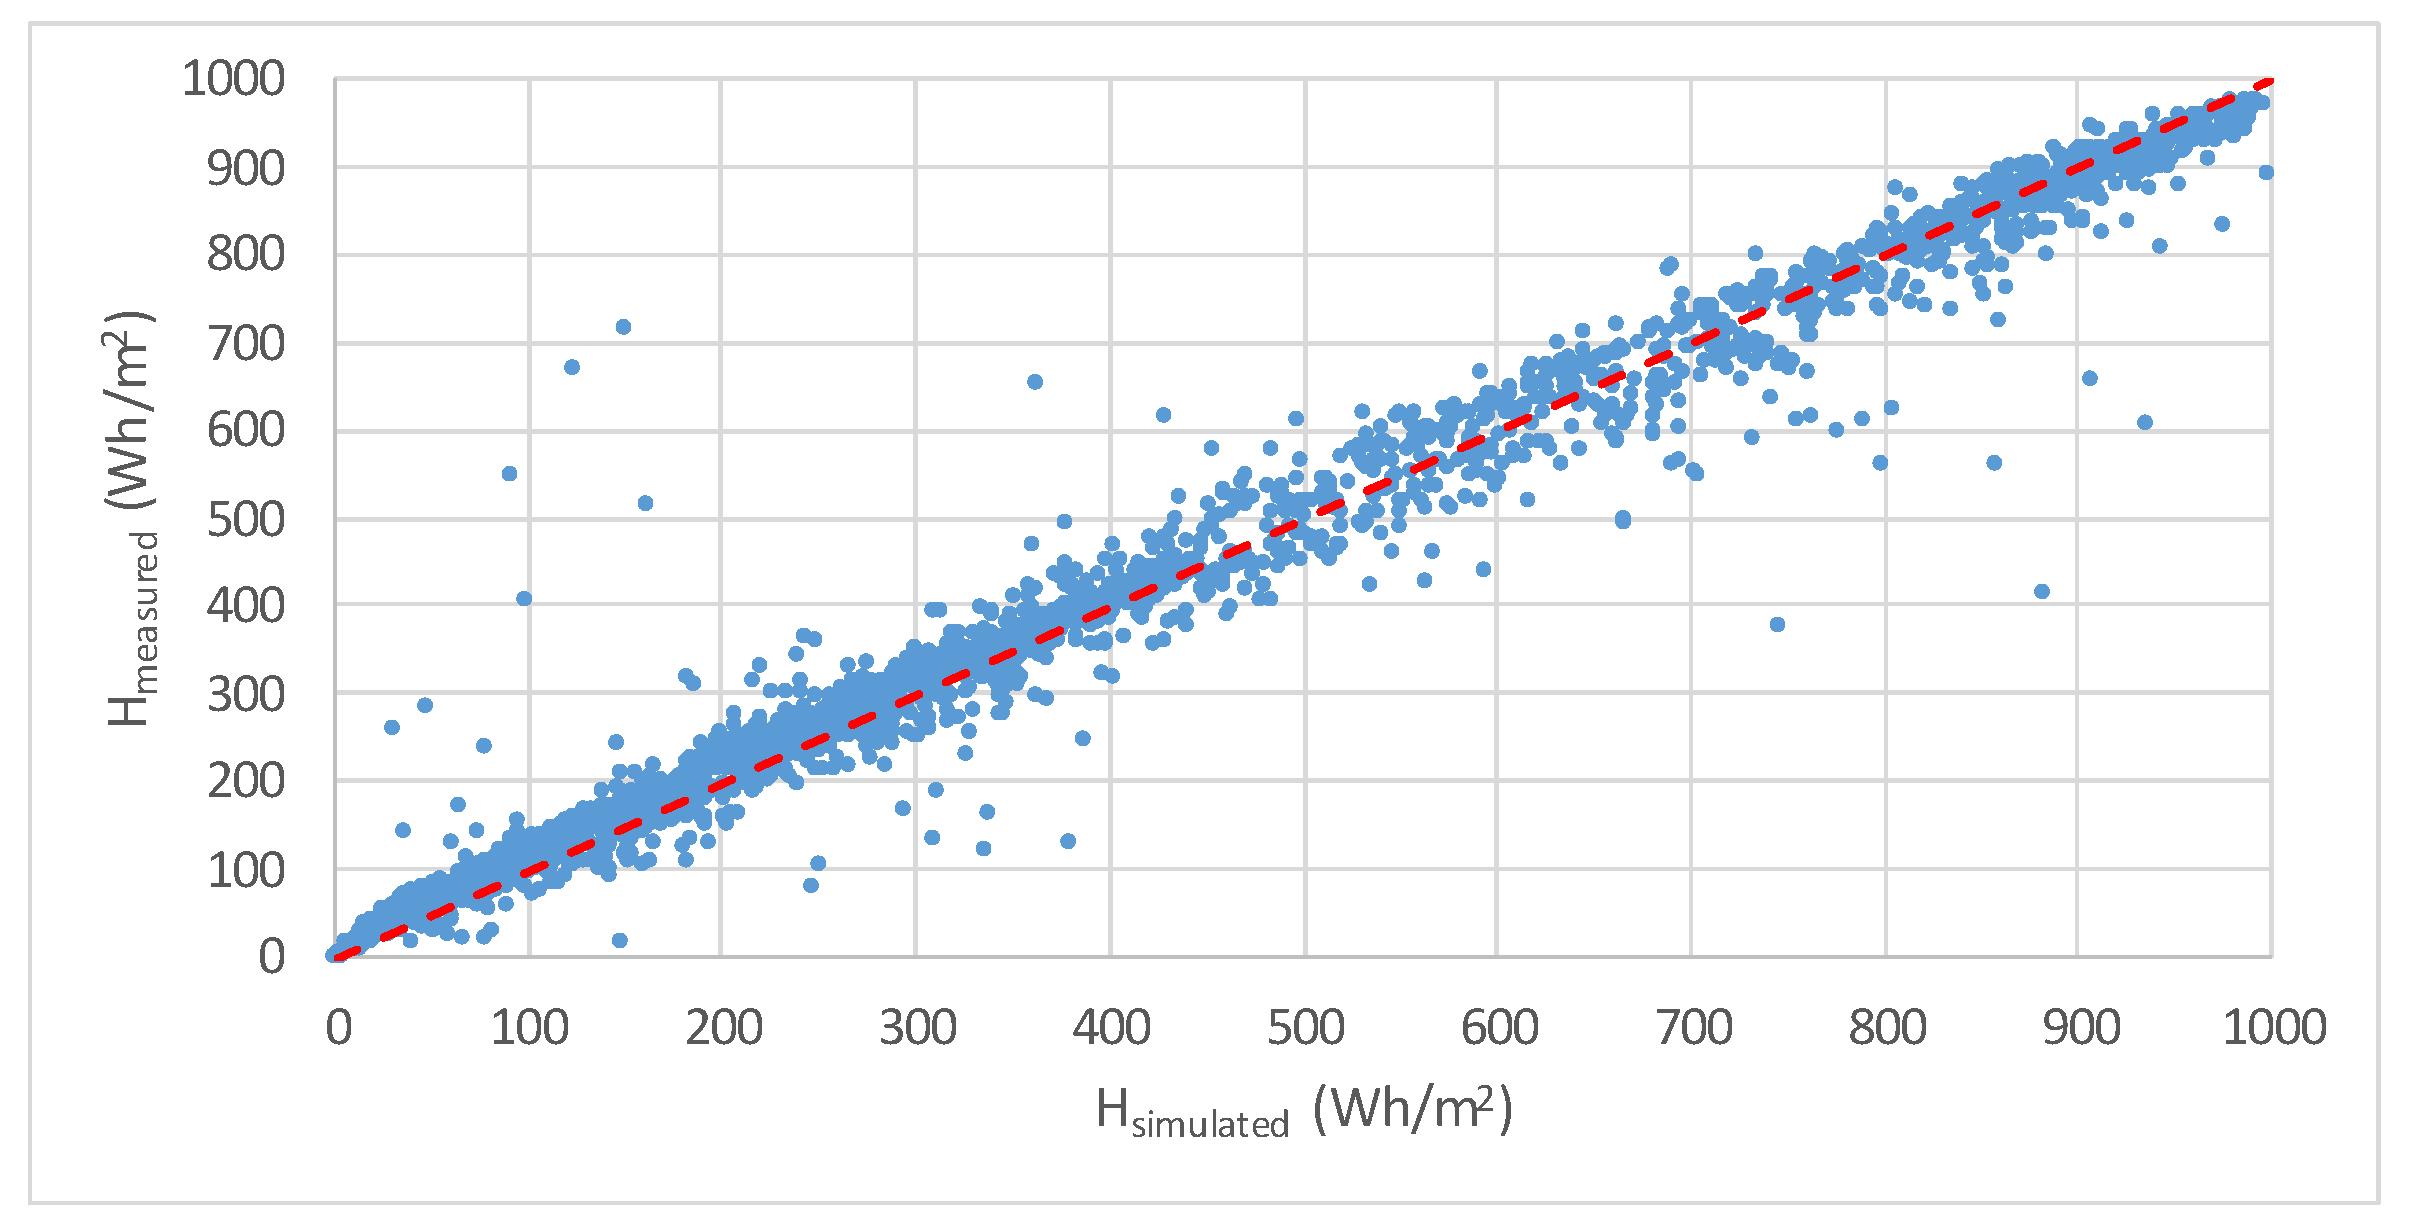
The solar irradiation on a horizontal plane with the RMS error of 34.1% and R
2 of 0.91 was already presented in
Figure 3. Transposition of the simulated solar irradiation to the plane-of-array adds another 15% of error to the results (
Figure 7). The RMS error of the plane-of-array irradiation is 44.4%, while the correlation factor R
2 is 0.89.
From the plane-of-array irradiation values, we calculated the predicted energy output of the modules. The module temperature was calculated from the solar irradiance and ambient temperature values by the Equation [
35]:
where
TNOCT is the module temperature at nominal operating conditions (
NOCT:
G = 800 W/m
2,
Tambient = 20 °C).
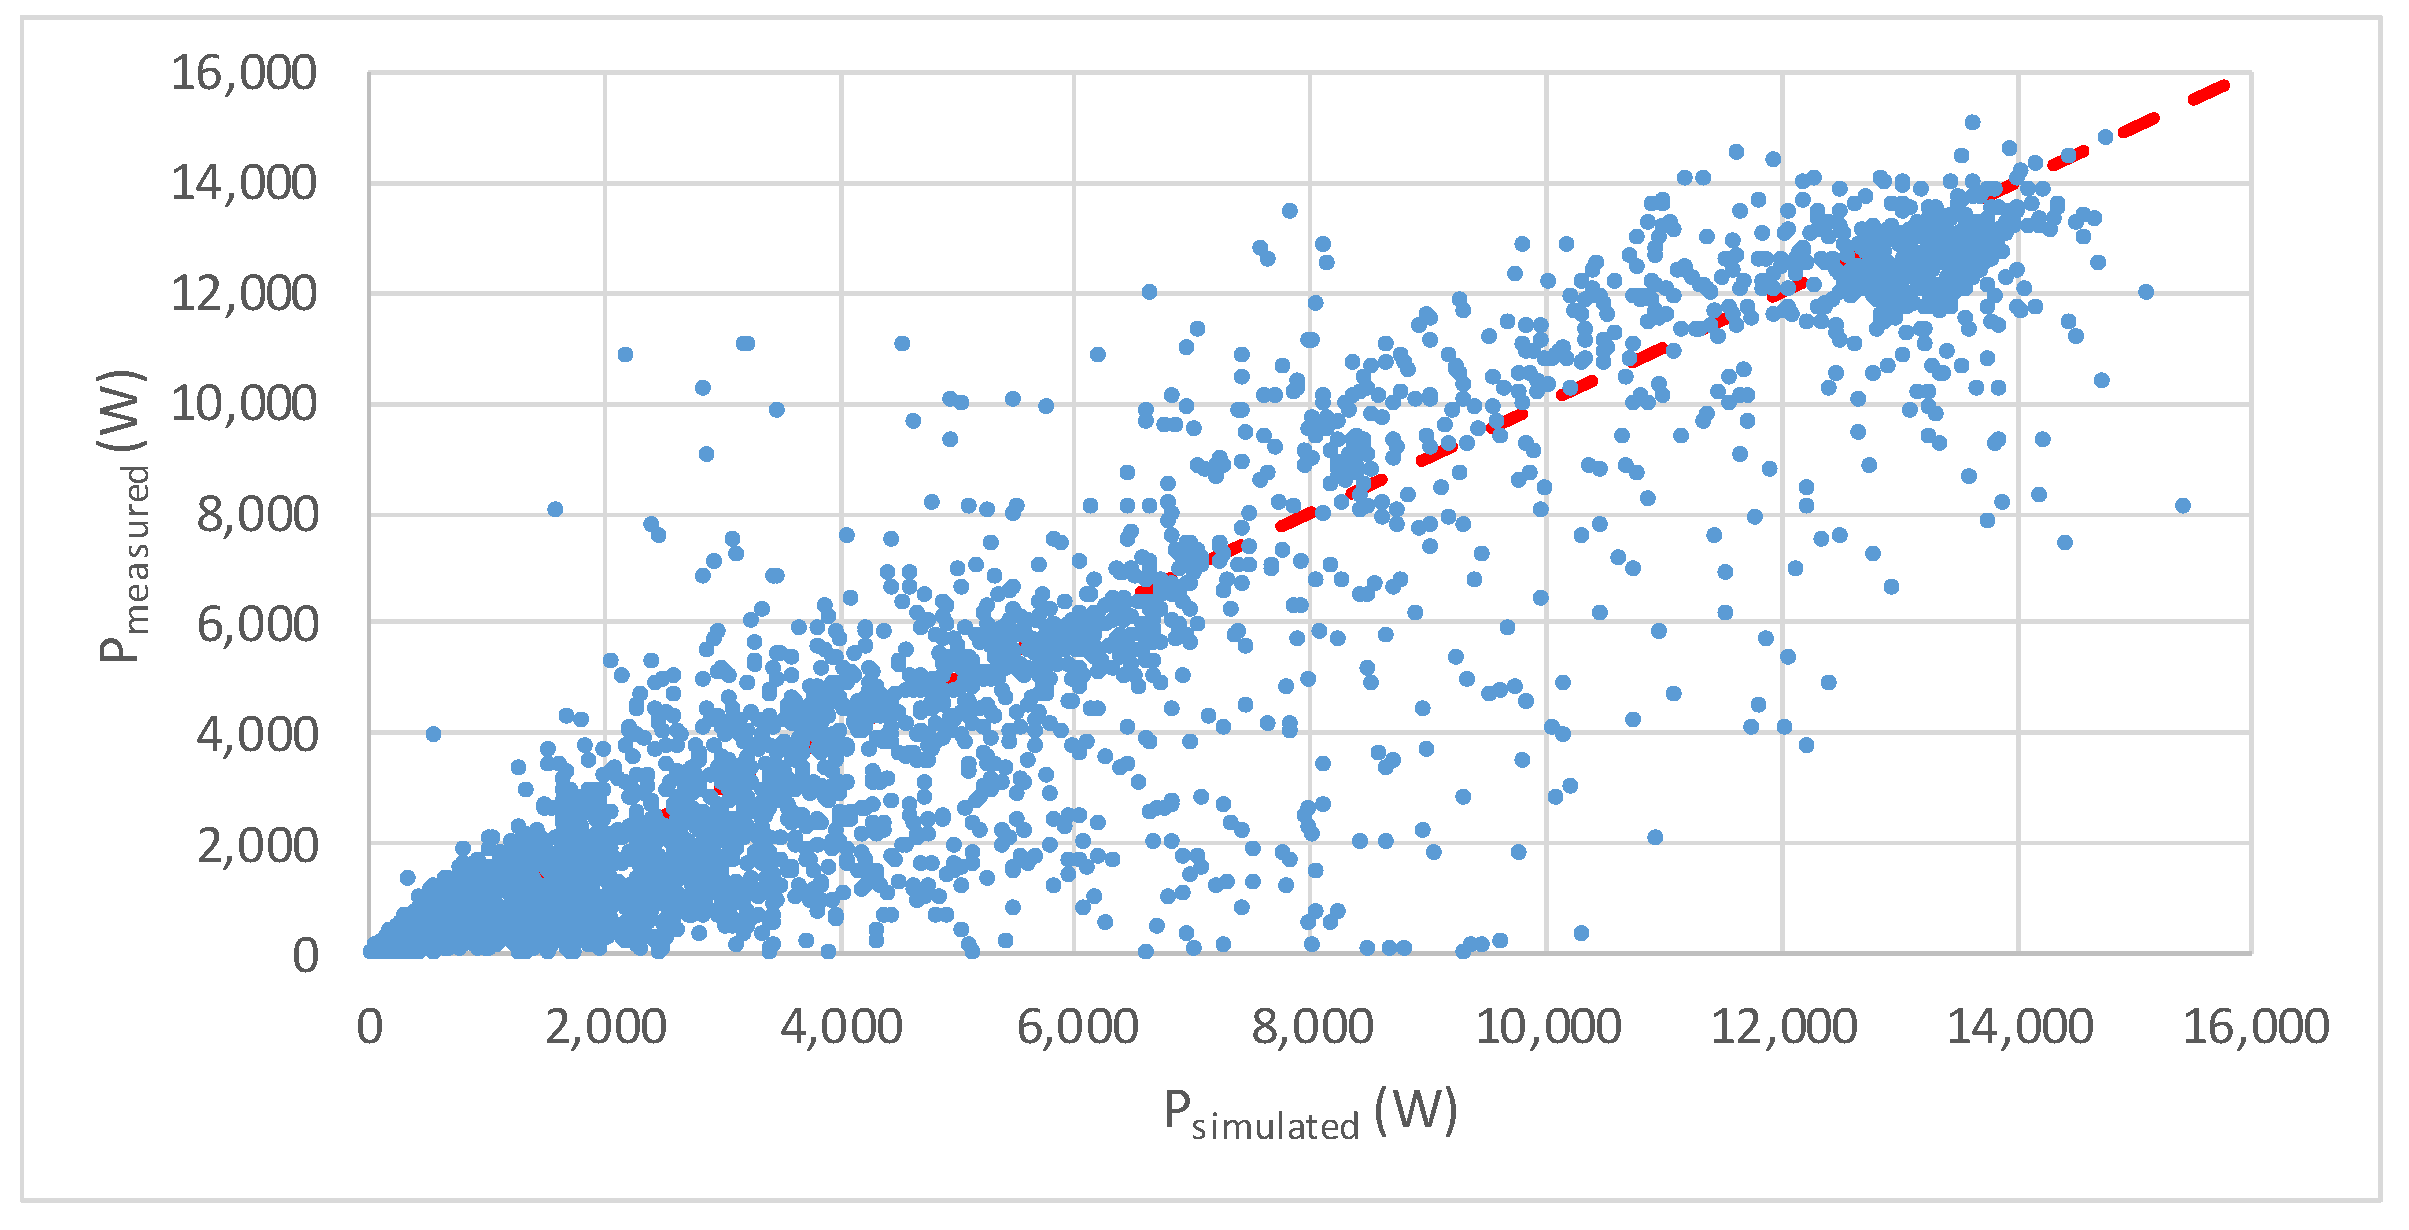
TNOCT of the modules is 44 °C. The predicted PV system energy output using Equations (4) and (5) vs. the measured PV system energy output is presented in
Figure 8.
The RMS error is 64.6% and the R
2 factor 0.85. The errors for each weather class are presented in
Table 4.
4.2. PV Energy Output Forecast for Three Successive Days
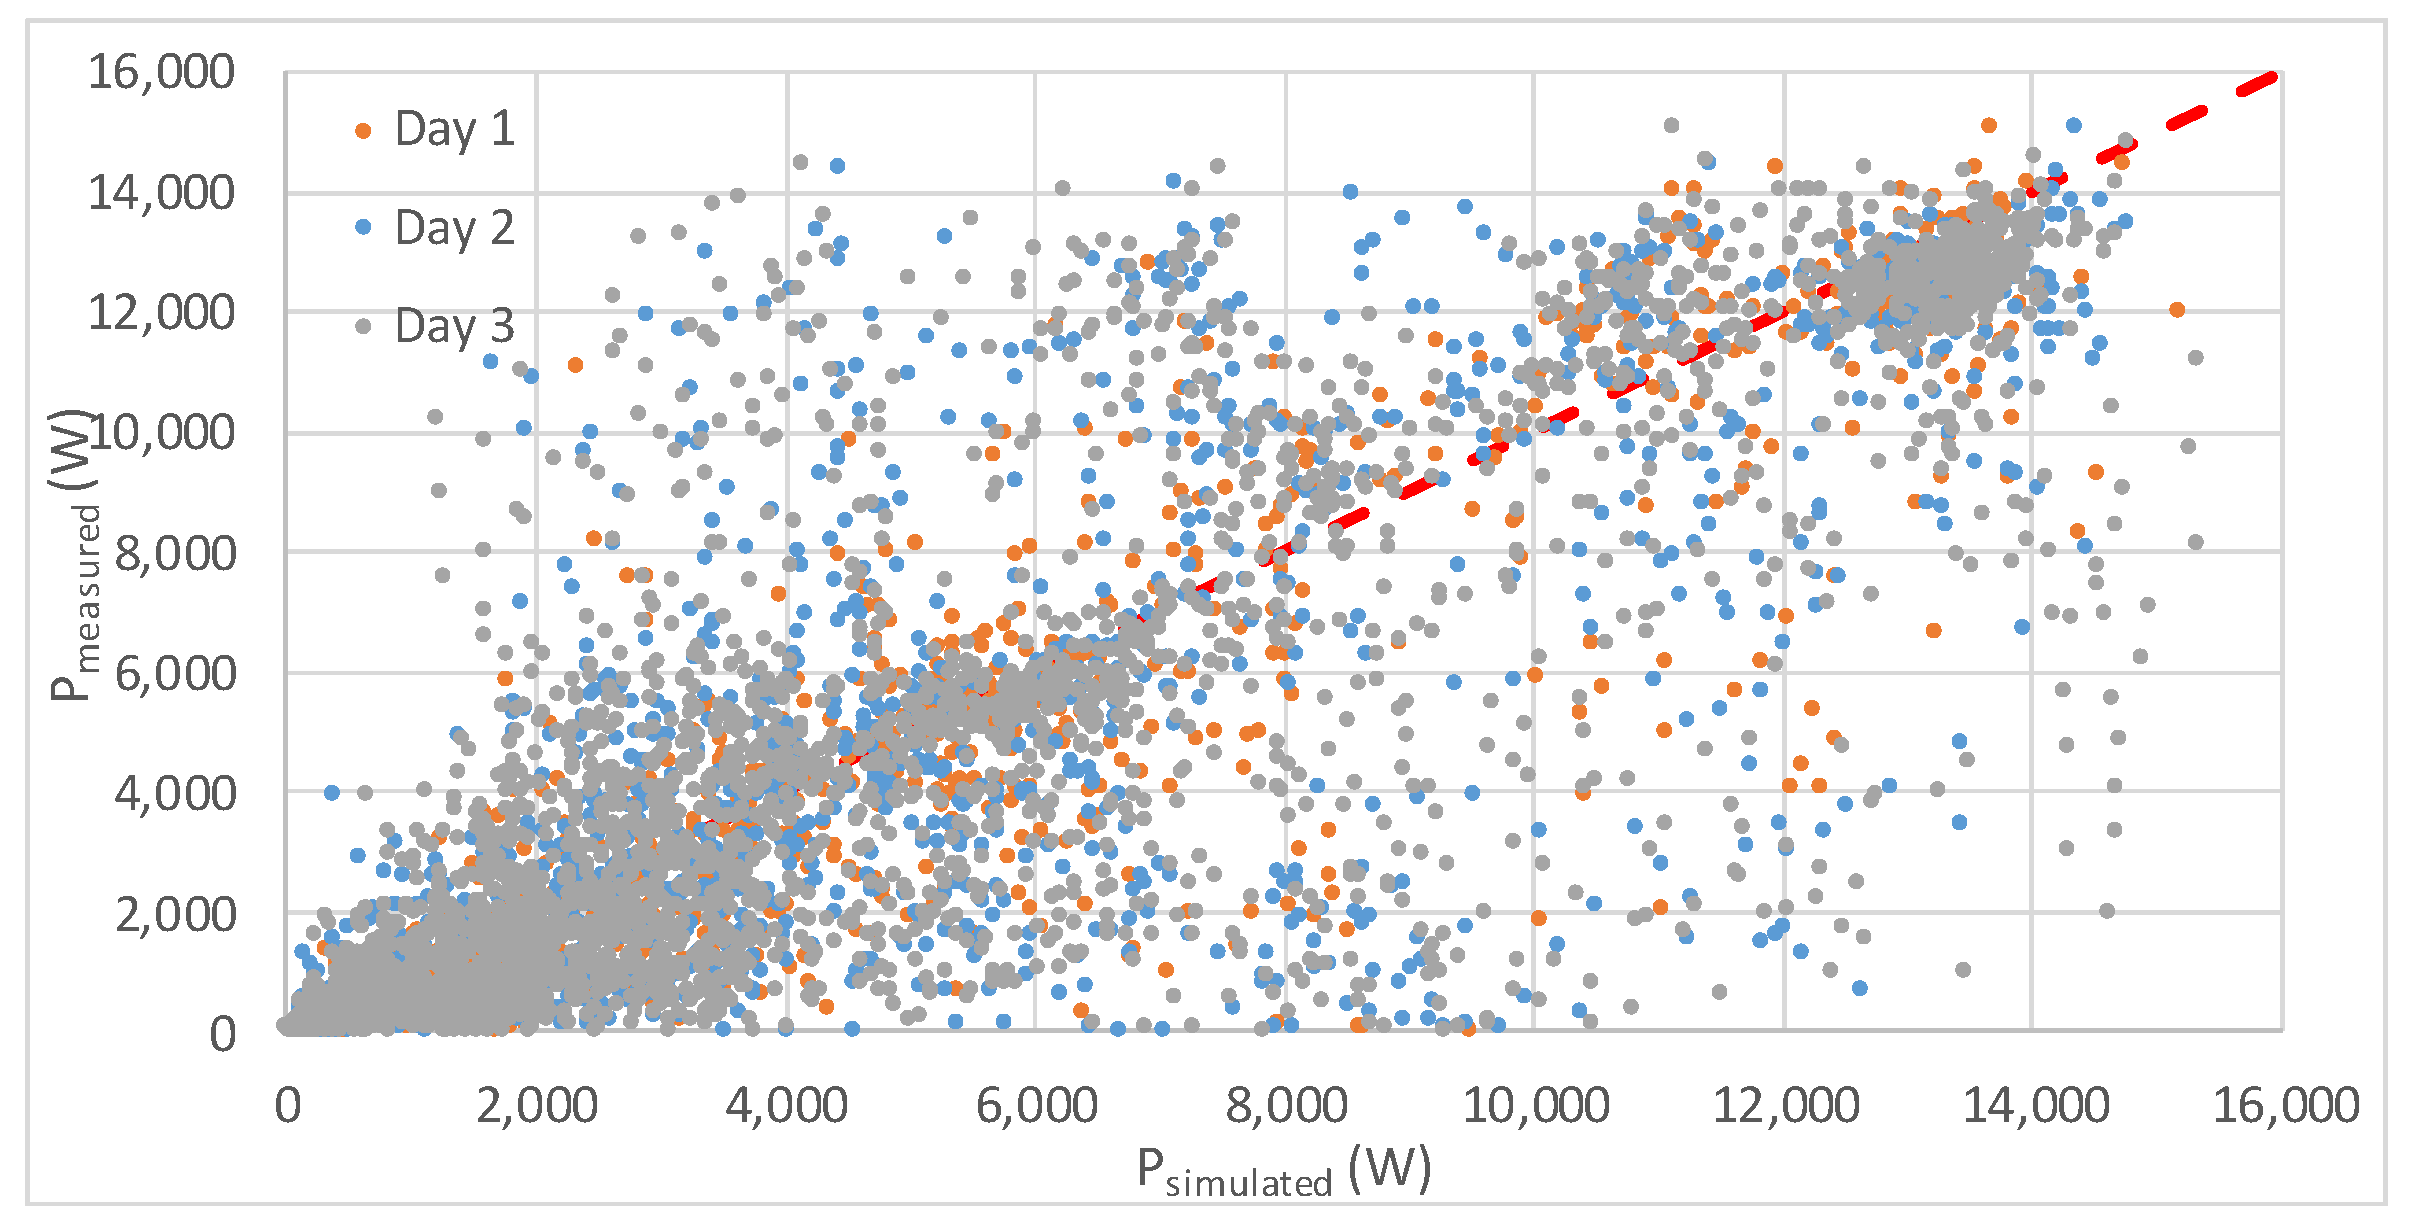
While in the previous subsection, we were using the filtered forecast data to present the best possible results, we are here using the unfiltered forecast data like they are available to the end user. In
Figure 9 and
Table 5, the forecasted energy output and uncertainties are presented for the three successive days. The correlation factor R
2 drops from the first to the third forecasted day, while the RMS error of the third day is lower, which could be due to a better weather forecast correlation.
5. Discussion
It is not so easy to get a reliable power energy output forecast of PV system of the forthcoming days if the high quality data is not available. The most important parameter that influences the reliability of the forecasted results is irradiance. If the value of the solar irradiance is not directly modelled and forecasted, then we have to take into account large deviations in the results. When the irradiance is calculated from discrete weather conditions, we have to be aware that just the discretisation introduces an error of around 20%. This value we could observe when we compare the measured irradiance data with the irradiance data simulated from the observed discrete weather conditions that exclude the forecasting uncertainty. The forecasting uncertainty is the highest in our research. In the observed four years only 65% of the forecasted weather conditions differ from the actual one for maximum one class.
When including the forecast uncertainty, the plane-of-array transposition, and PV system output simulation uncertainty, we end at an RMS error of more than 80%. However, the R2 factor that shows the correlation between the measured and simulated data is still over 0.80. The main deviations we could observe at mostly sunny and partly cloudy day, where scattered clouds can have no influence on the energy production although we predicted a lower production. On the other hand, we could observe forecasted and observed clear sky weather conditions, but a low irradiance level due to fog in the winter months. But, this is related to the weather forecast data quality. Our weather forecast source does not have the information about the fog.
To improve the reliability of the PV energy output forecast from the weather condition data we have to constantly calculate the averaged expected wc (Equation (2)) and detect the weather stable and non-stable periods. During our work, we could improve the reliability for some forecasted unstable weather periods with the use of the wc information of previous days and preceding forecasts, but the solutions were not applicable to the whole set of available data, since no correlation of the behaviour between these unstable weather periods could be found.
6. Conclusions
We have presented a PV energy forecast solution from public available weather forecast data. Since the forecast data is usually given in discrete weather conditions, the simulation of the needed hourly irradiance data is a subject of lower reliability. However, following the results and the correlation between the simulation and measurements, the methodology is useful for PV energy prediction in households where prosumers do not have the weather parameter data and do not want to pay for a PV system monitoring and forecast service.
When only discrete weather conditions are available, we have no information about the solar irradiance, which is crucial to predict the PV system power output. The solar irradiance level has to be simulated out of the selected clearness index and the calculated clear sky irradiance. Only this step due to discrete weather conditions introduces an RMS error of around 35%. To that value, we have to add the transposition RMS error of at least of 30% and power output prediction RMS error of 20%. Finally, the RMS of the resulted PV system energy output over four years is 85%. With the correlation of forecasted data, we could achieve an RMS error of 65%. In favor of this simple approach speaks also the R2 factor, which is around 0.85 for the forecasted energy power output.
However, we have to be aware that the results include also the weather forecast uncertainty. In our set of data, we could observe that only 65% of the forecasted wc deviates from the observed one for one class, and only 43% of the forecasts met the actual condition. Additionally, we get a 20% error due to the weather classes instead of using an irradiance model. The uncertainties of the used transposition and PV output models are 33% and 12%, respectively.
Our simulations showed that due to high uncertainties in the weather data, also the simplest linear equation for power output could be used.


