Article

Influence of Operating Conditions and Crushing Chamber on Energy Consumption of Cone Crusher

1
School of Mechanical Engineering, University of Science and Technology Beijing, Beijing 100083, China
2
Equipment Manufacturing Branch Company of Anshan Iron and Steel Group Mining Co., Ltd., Anshan 114000, China
*
Author to whom correspondence should be addressed.
Energies 2018, 11(5), 1102; https://doi.org/10.3390/en11051102
Submission received: 1 February 2018 / Revised: 28 March 2018 / Accepted: 24 April 2018 / Published: 1 May 2018
(This article belongs to the Section I: Energy Fundamentals and Conversion)

Abstract

:
This paper provides an energy consumption model and explains how the operating conditions and structural parameters of a crushing chamber affect energy consumption. Energy consumption is closely related to compressive pressure and displacement. The relationship between pressure, displacement and structural parameters is discussed. The influence of operating parameters on pressure and displacement based on the law of motion of material is examined. Energy consumption can be obtained by the product of pressure and displacement. In consideration of the pressure on the liner surface, which varies according to both height and circumference, an infinitesimal method was used to solve the issue of energy consumption. We validated the predicted energy consumption during breakage with experimental data from a PYGB1821 cone crusher which was consistent with the measured results. Finally, we provide an explanation of the influence of operating parameters and structural parameters on compressive pressure and displacement as well as energy consumption.

1. Introduction

Cone crushers are commonly used instruments in the secondary and tertiary crushing of rock material in the minerals industry. With the development of the modern social economy, the amount of material needed to be crushed has gradually increased along with a proportional rise in energy consumption. However, cone crushers typically have very low efficiency, which directly relates to their economic benefit [1,2]. Therefore, further studies on energy consumption related to the crushing process are necessary.
Currently, several models are used to estimate the energy requirement during comminution, such as Bond’s model and Rittinger’s model [2,3]. Bond’s model frequently has been used to calculate the energy consumption in comminution [2,3,4]. However, Bond’s model may be not accurate in terms of different particle size distribution. To address this, Lindqvist [5] modified the energy model to estimate the energy consumption for different size distributions. The influence of particle size distribution on energy consumption was also investigated using fractal theory [6,7,8]. Apart from particle size distribution, particle size and shape may also affect energy requirements [9]. Fengnian Shi [10] estimated the energy required for a desired size reduction using a Julius Kruttschnitt (JK) size-dependent breakage model. A similar study was conducted by Nadolski [11]. Additionally, the minimum practical energy requirements of particle comminution, or threshold energy, was studied using a JK size-dependent breakage model. Bonfils [12] modified the JK size-dependent breakage model which had previously considered the particle shape. However, the relationship between energy and size reduction was found to be discrete according to the above-mentioned energy models. Subsequently, Zhang [13] developed a continuum approach for predicting energy consumption in comminution. Nevertheless, energy absorption during breakage is not only consumed by the rock fragmentation process but also dissipated as a result of friction, wear, and acoustic emission. Mütze [14] found that energy consumption caused by flow losses was less than 0.1% of the energy requirement, despite the fact that the energy which was consumed by pure elastic deformation was almost 15% [15].
The relationship between energy requirements and size reduction can be obtained by the energy models described above. However, when a crusher is operated at different conditions, the energy requirement cannot be computed according to existing energy models. Consequently, Numbi [16] developed an energy consumption model with two control variables, the speed and closed side setting of the jaw crusher. Johansson [17] estimated energy consumption according to the forces acting on the static jaw. In addition to mathematical modeling, Discrete Element Modelling (DEM) could also be used to simulate energy consumption. Quist [18,19] predicted energy consumption for different closed side setting cases and speeds with DEM techniques. A similar study was conducted by Cleary [20] who found that energy consumption was sensitive to material strength.
In this paper, a mathematical model is introduced to study the influence of operating conditions and structure of a crushing chamber on energy consumption. Then, the mathematical computation tools, Maple and MATLAB, are employed to solve this model. Finally, the model is calibrated on the basis of an industrial experiment.

2. Energy Consumption Analysis

The total energy consumption in a cone crusher can be divided into several parts: no-load mechanical energy of the cone crusher, energy consumption during breakage, energy loss due to the wear of mantle and bowl liner, and energy loss caused by thermoplastic effects and sound wave propagation [14]. This paper considers no load energy consumption E0 and energy consumption during comminution E1. E1 may be obtained by the product of force F and displacement s [17]. Therefore, a characteristic equation of energy consumption model can be expressed as equation (1).
E = E 0 + E 1 = E 0 + 0 s act F ( s ) d s ,
To estimate the energy requirement in size reduction according to Equation (1), pressure p is needed to calculate the force on the liner. Pressure is related to material properties, operating parameters, and structural parameters of the cone crusher.

3. Prediction Model of Breakage Energy

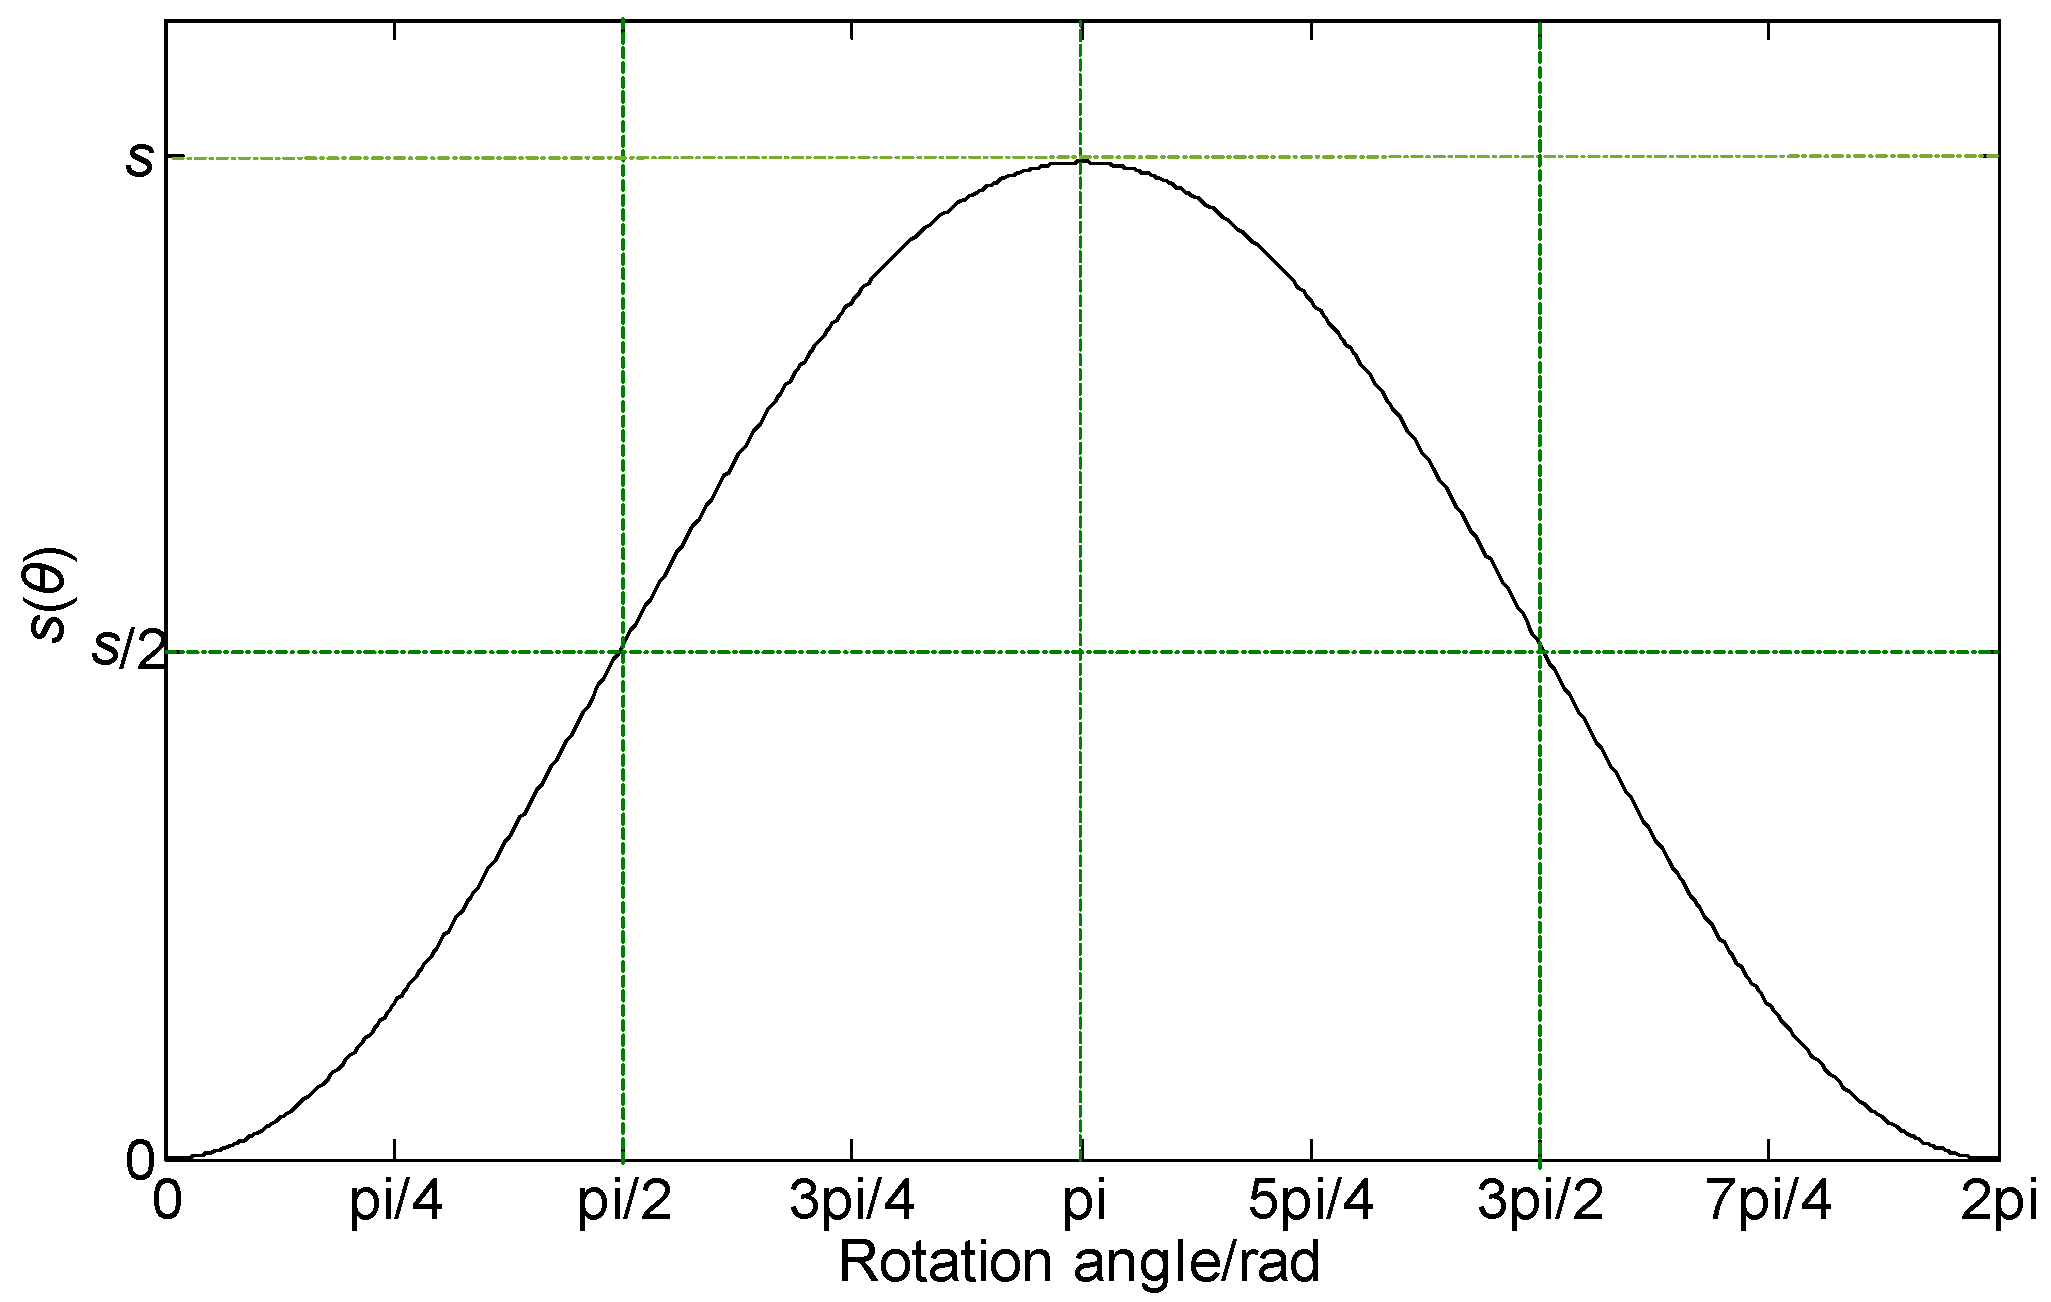
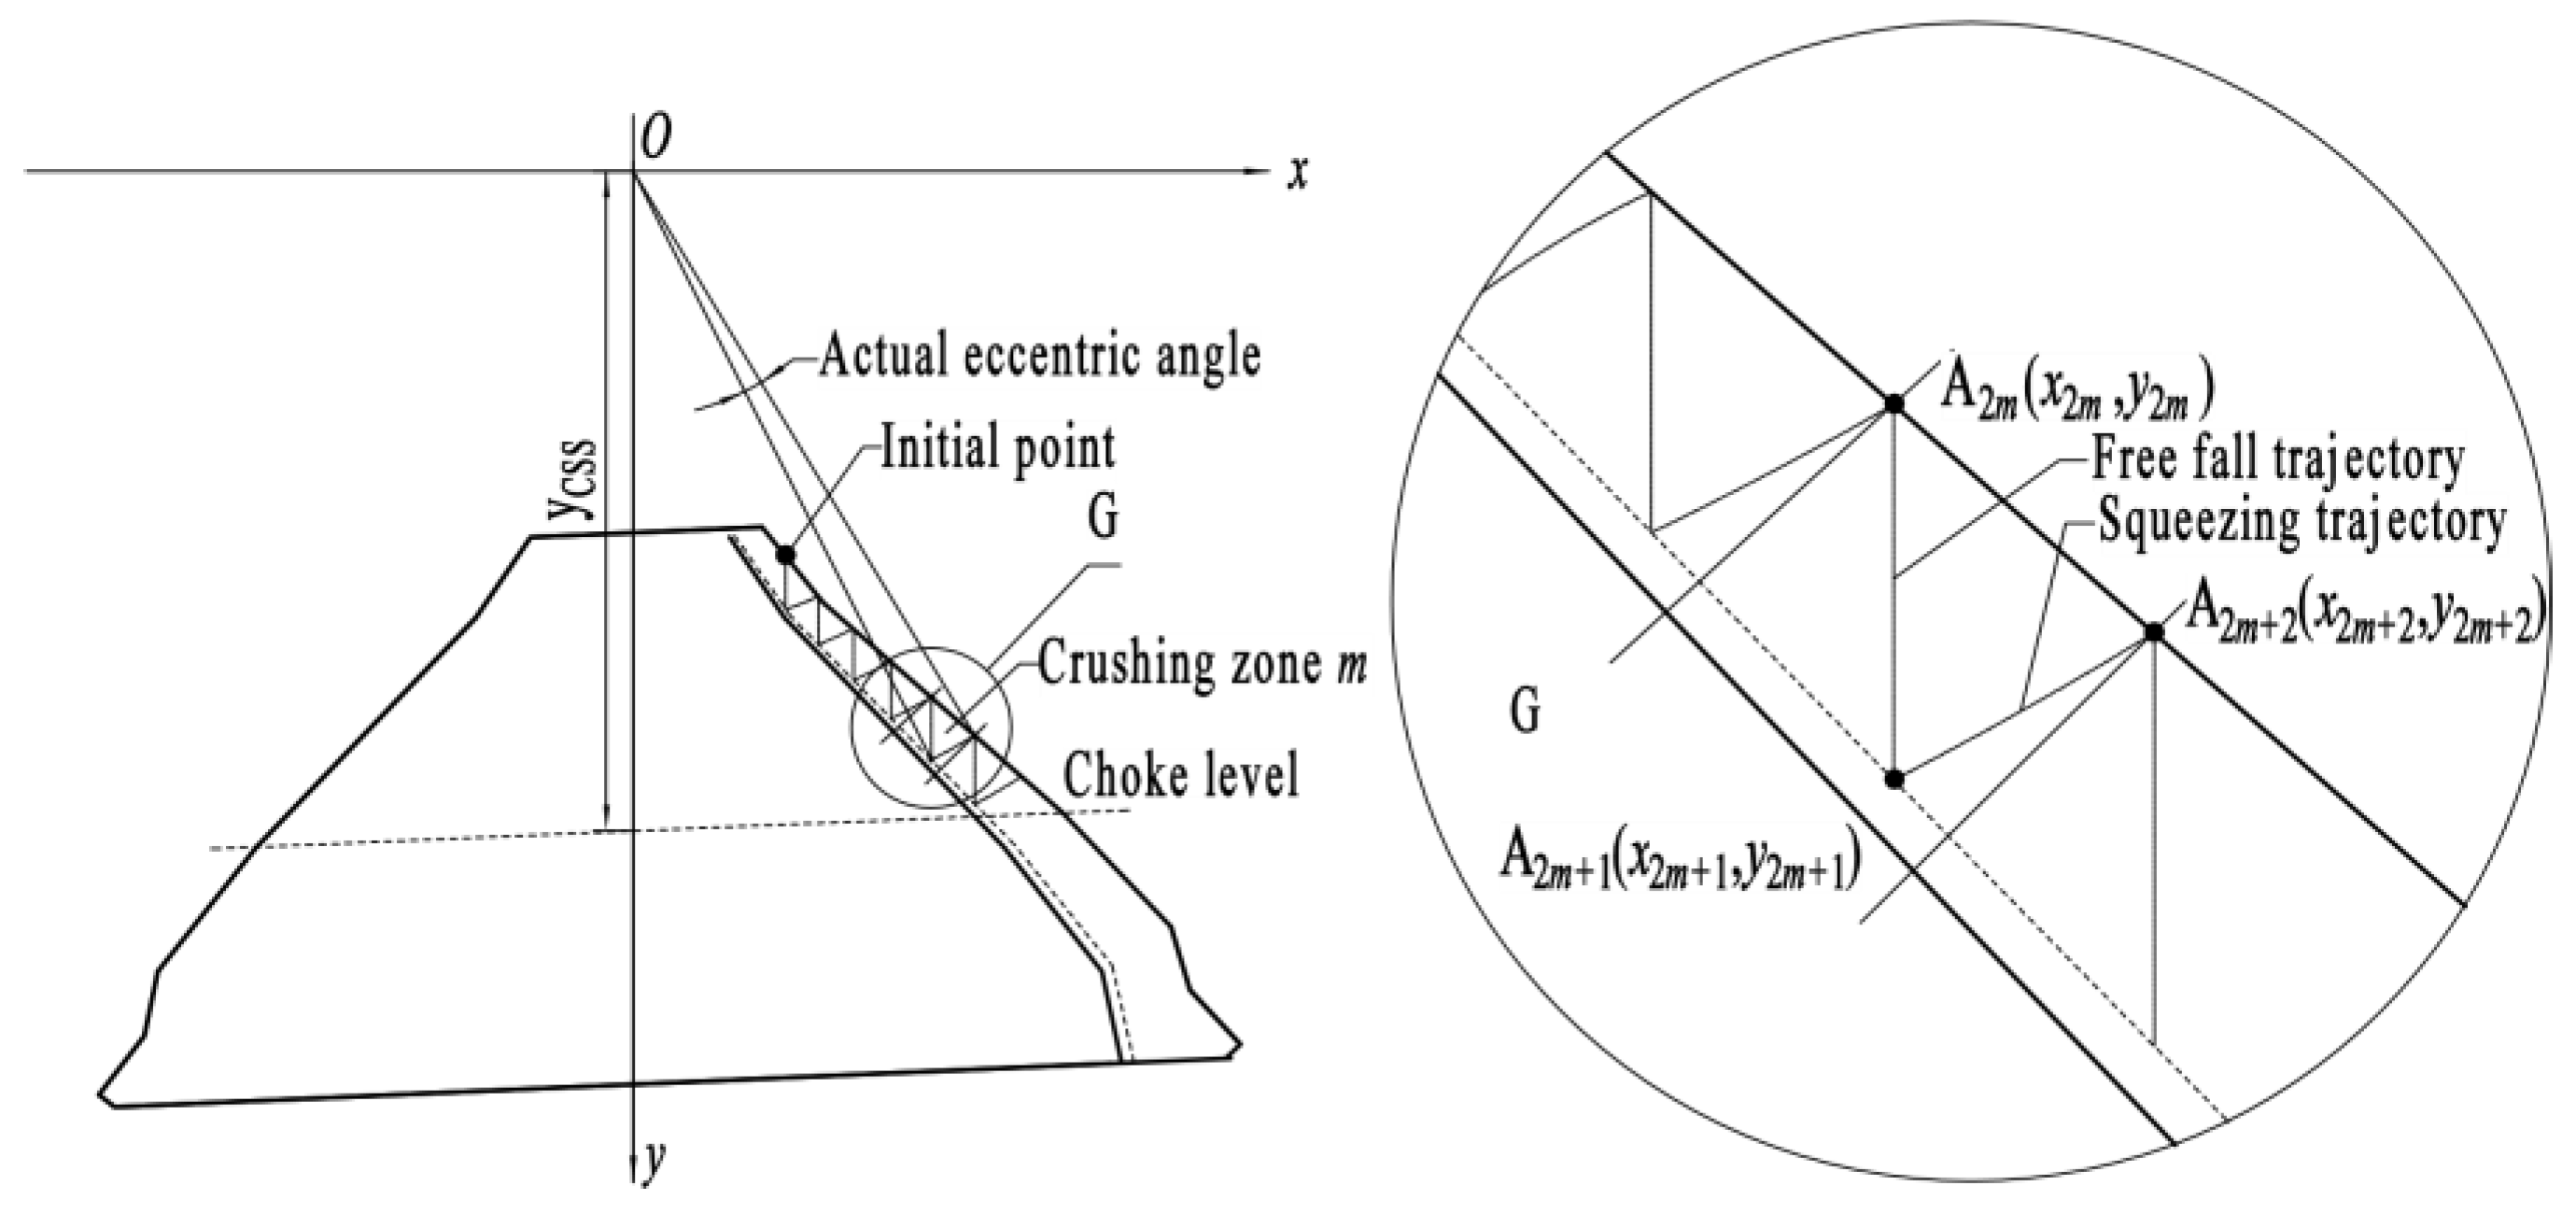
3.1. Crushing Pressure Model of the Liner

Pressure on the liner surface is influenced by compression ratio i and feed size distribution σ for a given material [17,21]. Moreover, the compression ratio varies with the speed of mantle and structure parameters, as does crushing pressure, which can be observed in Figure 1. The maximum pressure is at the closed side setting (CSS), while the minimum pressure is at the open side setting (OSS). The pressure at the OSS is approximately equal to 0. Pressure on the liner surface can be expressed as Equation (2).
p = f 1 ( i , σ ) ,
To investigate the pressure on the liner surface, compression ratio should be expressed with the structural parameters of the crushing chamber. Compression ratio, i.e., the ratio of stroke to the height before compression, can be calculated as Equation (3).
i ( θ ) = s ( θ ) b ,
where b represents the height before compression. s(θ) is the stroke when the mantle rotates angle θ.
The material height before compression is equal to the width of OSS and can be calculated as Equation (4).
b = R 2 + s / 2 R 1 ,
where R2 is the radius of bowl liner. R1 is the radius of the mantle. Stroke s is a special case of s(θ).
s(θ) reflects the compression process, and it is presented in Appendix A.
s ( θ ) = R ( θ ) + s 2 R 1 ,
where
R ( θ ) = R 1 2 s 2 sin 2 θ 4 s cos θ 2 ,
s = 2 γ 0 R 1 2 + y 2 ,
Consequently, we can obtain the variation of s(θ) according to Equations (5)–(7). s(θ) increases nonlinearly with rotation angle, as shown in Figure 2. The growth rate of s(θ) presents an increasing trend from 0 to π/2. Nevertheless, it shows the opposite trend between π/2 and π.
Finally, the compression ratio can be obtained by Equations (3)–(7). However, the compression ratio is also influenced by the speed of the mantle. A higher speed is preferred to ensure high productivity of the cone crusher. When the mantle is operated at a higher speed, the actual compression ratio iact may be less than the nominal compression ratio i, and the material will pass through the crushing chamber by free fall and squeezing, as shown in Figure 1b. Clearly, the actual stroke sact is less than s when the mantle accelerates away rapidly enough. Taking crushing zone m as an example (Figure 3), the material first falls from A2m to A2m+1. Time of free fall is tm+1. Next, it is squeezed from A2m+1 to A2m+2. Squeezing time is tm+2. The coordinates of A2m, A2m+1 and A2m+2 are (x2m, y2m), (x2m+1, y2m+1), and (x2m+2, y2m+2), respectively. n is the mantle speed. k is the actual stroke coefficient. When the initial point coordinates are given, the actual stroke and material height (Appendix A) can be calculated according to Figure 4.
Then iact can be written as Equation (8).
i act ( θ ) = s act ( θ ) b act = s ( θ + β π ) R 2 + 0.5 s act ( π ) R 1 ,
The other influence factor of crushing pressure, i.e., size distribution coefficient, represents the dispersion of particle size.
σ = j = 1 q λ j ( d j d ) 2 / d ,
where λj is the yield of particle size j. q is the number of particle sizes. d j is determined by the mean size of particle j. d is the average size of all particles.
Finally, the crushing pressure can be obtained by Equations (2), (8) and (9).

3.2. Modeling of Energy Consumption

The product of crushing pressure, projected area of the mantle, and the stroke is equal to the work performed by the mantle. The work is then multiplied by the speed of mantle according to Equation (10).The equation corresponds to the energy consumption during rock fragmentation.
E 1 = 16.667 n cos α 0 s act 0 A act p ( i act , σ ) d A d s = 16.667 n cos α y 0 y max 0 s act 0 l act p ( i act , σ ) d l d s d y ,
where Aact is the projected area of the mantle and equals the product of arc length l and the height of the mantle. y0 is the distance between the suspension point O and the top of the mantle. ymax is the distance between the suspension point and the bottom of the bowl. lact is the actual arc length of mantle during squeezing.
However, the motion of mantle is not a simple rotation around its axis. It is difficult to perform an integral for Equation (10). Therefore, coordinate transformation was performed to simplify the calculation. The z-axis was translated to the position where x = s/2. The rotation angle of mantle changed from θ to φ correspondingly, as shown in Figure 1a. Then, the rotation angle φ could be obtained according to the law of sines.
φ = θ arcsin s sin θ 2 R 1 ,
Thus, energy consumption can be expressed as Equation (12).
E = E 0 + 16.667 n cos α y 0 y max ( 1 k ) π π 0 R ( φ ) + s / 2 R 1 p ( i act , σ ) R 1 d s ( φ ) d φ d y ,
Energy consumption per hour could be calculated according to Equation (12). The energy conservation of a crusher is particularly important and attracts considerable attention. However, the energy requirement per hour cannot estimate whether the cone crusher is energy-efficient or not. It could be evaluated by the energy consumption per unit production. Therefore, it was necessary to calculate the production of the cone crusher. The production Q equals to the integral of mass-flow field over the choke level of crushing chamber [22].
Q = 60 n ρ { π ( 3 k ) π 0 60 ( θ k π ) 2 π n R 2 [ R 2 R ( θ ) ] v down d t down d θ ( 1 k ) π π 60 ( 1 k ) π 2 π n 60 θ 2 π n R 2 [ R 2 R ( θ ) ] v up d t up d θ }
where ρ is the material density. vdown is the free fall velocity of material. vup is the upward speed of material. tdown is the free fall time. tup is the squeezing time.
According to Equations (12) and (13), energy consumption per unit production can be presented as Equation (14).
E ¯ = E Q = E 0 cos α + 16.667 n y 0 y max π φ π 0 R ( φ ) + s R 1 p ( i act , σ ) R 1 d s ( φ ) d φ d y Q cos α

4. Example

4.1. Experiment

To verify the model of energy consumption, industrial experiments were conducted on a PYGB1821 cone crusher at Anshan Iron and Steel Group Mining Co., Ltd. (Anshan, China). Energy consumption, feed size distribution, and structural parameters of the crushing chamber were measured. Table 1 shows the energy consumption of the cone crusher.
Material density was 2730 kg/m3. Feed particle size distribution was as shown in Table 2.
Table 3 shows the parameters of cone crusher.
Crushing pressure is necessary to compute the energy consumption and can be obtained by the piston and die test. The pressure required to compress material to a given compression ratio is equal to the pressure response in the piston [9]. Pressures, which were recorded at the piston tests, could be used for the establishment of the pressure model. According to Bengtsson [9], the pressure is influenced by the compression ratio and feed size distribution. Accordingly, the pressure on unit area can be expressed as follow [23].
p = i 2 ( 263.01 σ 2 + 393.673 σ 51.603 ) + i ( 189.563 σ 2 127.947 σ + 51.452 ) ,

4.2. Results Analysis

We assumed that the no-load energy consumption was constant at the given speed [16]. According to Table 1, average no-load energy consumption and total energy consumption were 241.11 kW·h and 385.10 kW·h, respectively. The simulated energy consumption could be obtained by Equation (12), and it was 383.52 kW·h. The simulated value was 1.58 kW·h less than the average experimental value. Moreover, the 95% confidence interval of energy consumption ranged from 381.56 kW·h to 388.63 kW·h. The simulated value was in the 95% confidence interval. Therefore, the model could be used to predict the energy consumption of the cone crusher.

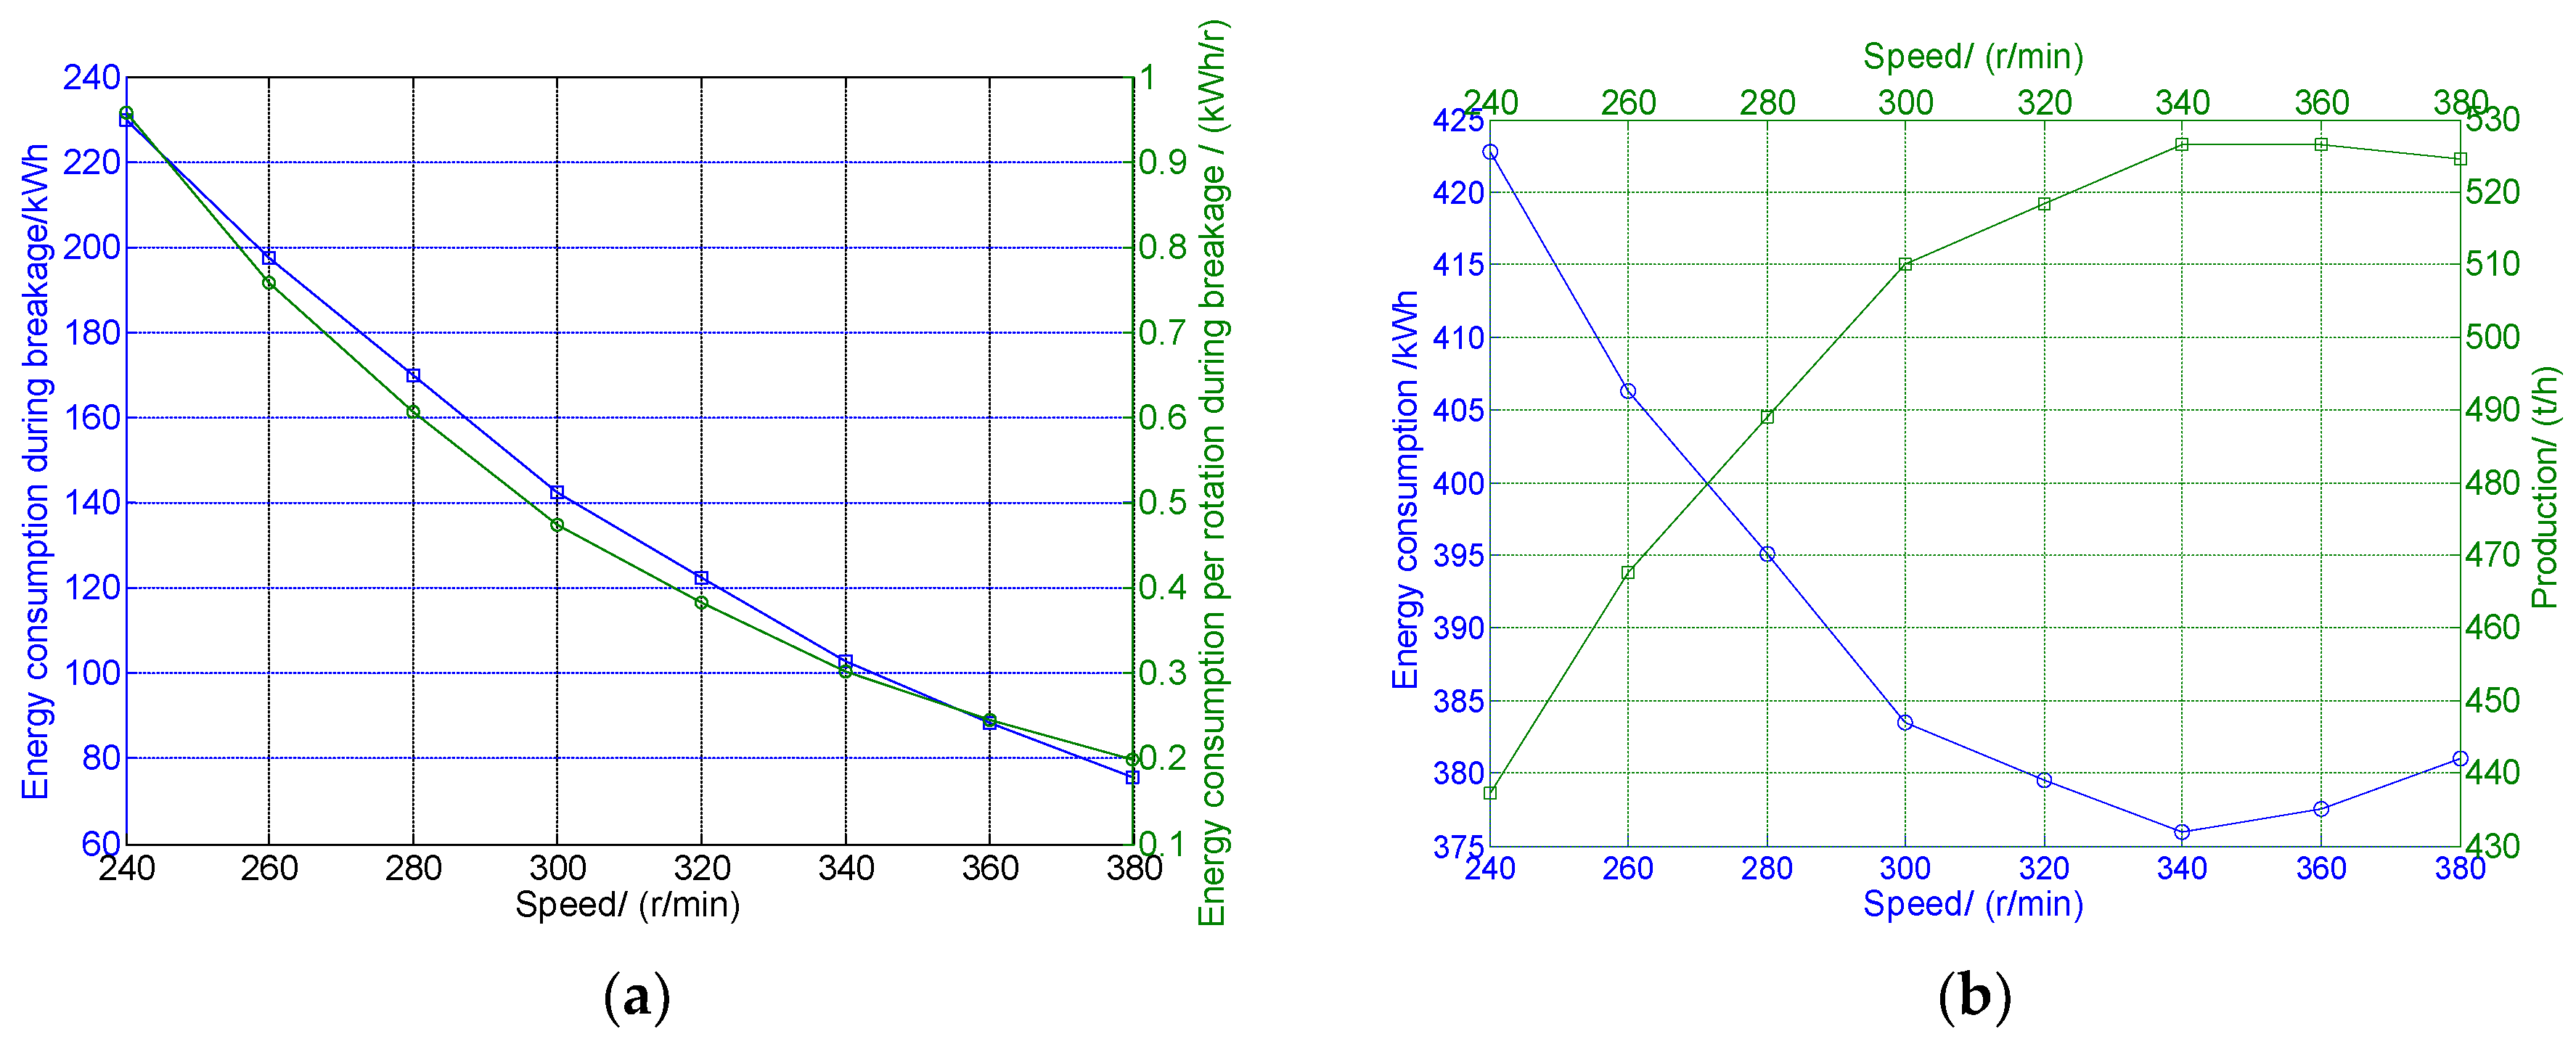
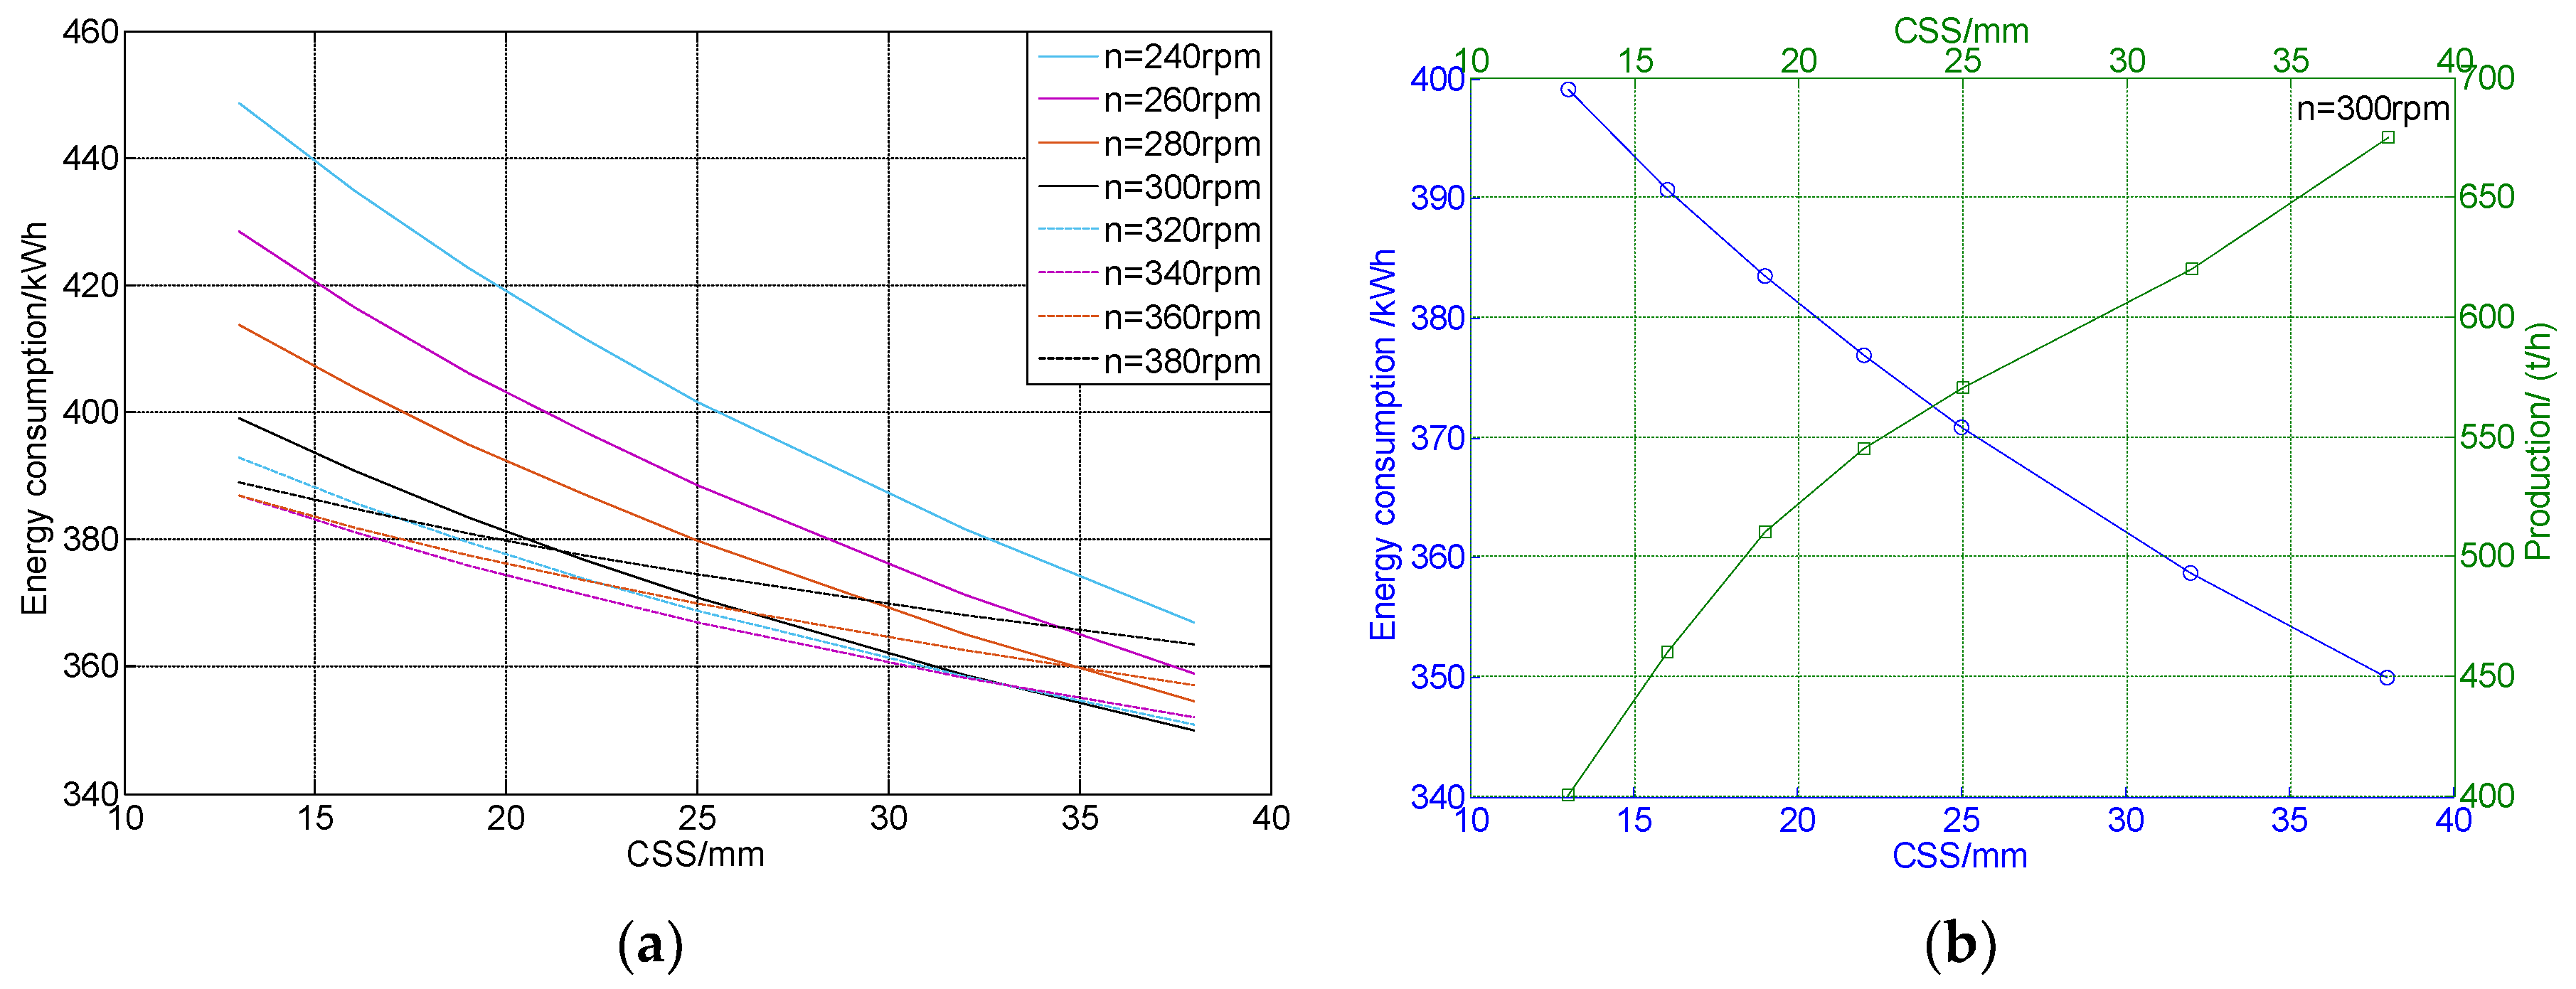
4.3. Influencing Factors of Energy Consumption

Energy consumption is related to the pressure and displacement in the direction of pressure. For the given rock material, the pressure primarily depends on the compression ratio. Accordingly, the compression ratio and displacement are predominantly influenced by mantle speed and structure parameters of the crushing chamber in the cone crusher. As illustrated in Figure 5a, actual compression ratio presented a downward trend with the increase of speed. Notably, the compression ratio had a positive correlation with the pressure, and the compression ratio and pressure under different speeds shared a similar trend. Figure 5b shows the relationship between pressure and actual stroke.
Displacement, the other influencing factor of energy consumption with different speeds, depends on the effective squeezing time and squeezing velocity. First, effective squeezing time was calculated based on Figure 4. As shown in Figure 6, the color-filled markers represent actual squeezing time. When the mantle ran at a speed lower than 340 rpm, actual squeezing time equaled 30/n. While the speed was more than 360 rpm, actual squeezing time was less than 30/n. Namely, the higher the speed, the less squeezing time, which indicated lower energy utilization. Moreover, actual squeezing time gradually decreased in proportion to increase in compression number.
Next, the velocity under different mantle speeds was calculated [22]. Figure 7a illustrates the variation of the velocity particularly within the squeezing process. The maximum squeezing velocity should be at the angle of π/2. When the speed was greater than 360 rpm, squeezing velocity gradually decreased, which was not beneficial to crushing rock material. Next, displacement is shown in Figure 7b. It was observed that the actual stroke increased in relationship to a decrease of speed. That is to say, the stroke had a negative correlation with speed.
Finally, energy consumption under different speeds was computed based on Equation (10). It can be seen from Figure 8 that speed had significant effects on energy consumption. Energy consumption during breakage at 280 rpm was about 73.96% as much as that at 240 rpm. Moreover, breakage energy had a positive correlation with speed. However, this did not indicate energy consumption presented an upward tendency with the increase of speed, as illustrated in Figure 8b. The energy consumption was also influenced by the no-load mechanical energy of the cone crusher: the higher the speed, the more no-load energy consumption, and the less energy consumption during breakage. Therefore, energy consumption could fluctuate with the increase of speed.
The structural parameters of a crushing chamber predominantly include the eccentric angle, nip angle, CSS, etc. The influence of eccentric angle and nip angle on compressive pressure is presented in Figure 9. The increase of eccentric angle leads to an increase of pressure. As eccentric angle is directly proportional to the stroke s, and b is almost invariant. Accordingly, it can be concluded that compression ratio presents a positive correlation with eccentric angle according to Equation (3), as does the pressure. Therefore, breakage energy increased with eccentric angle and speed, as shown in Figure 10a. Energy consumption of a cone crusher may have fluctuated with the increase of speed when the eccentric angle was more than 1.8°, as can be seen in Figure 10b. As such, the proportion of no-load energy consumption in total energy consumption may have changed with the eccentric angle.
The other structural parameter, nip angle, can be expressed as Equation (16).
α 0 = α 1 ( α ± γ 0 ) ,
where α1 is the base angle of bowl liner. Usually, value range of nip angle is 21°~23°.
An increase in the nip angle led to a small increase in the energy consumption, as illustrated in Figure 11. The action of nip angle ensured that the rock particle did not slide upwards. The adjustment range of the nip angle was narrow. Additionally, the change of the nip angle was significantly less than the base angle. Therefore, energy consumption was not subjected to the nip angle, according to Equation (10).
Finally, CSS also strongly influenced energy consumption and could be regulated by adjusting the height of the bowl. CSS can be presented as:
CSS = R 2 R 1 s 2 ,
Compressive pressure for various CSS can be calculated by Equations (15) and (17). It is clear from Figure 12a that the pressure decreased with an increase of CSS, while the actual stroke remained unchanged. Therefore, the breakage energy consumption showed the same trend with pressure, as shown in Figure 12b. Accordingly, energy consumption can be calculated according to Equation (12). The energy consumption showed a downward trend with an increase of CSS and also in a nonlinear way, as illustrated in Figure 13a CSS is one of the most important factors in determining the product size: the bigger the CSS, the bigger the product size. Thus, the energy requirement in size reduction will decrease. Finally, the relationship among the production, CSS, and energy consumption is as shown in Figure 13b. Energy consumption decreased with an increase of CSS; however, production showed the opposite trend.

5. Discussion

In the present study, we developed an energy consumption model of a cone crusher and investigated the influence of operating conditions and structure parameters on energy consumption. Our results demonstrated that energy consumption was sensitive to speed, eccentric angle, and CSS. This is notable because it provides guidance for chamber design and energy optimization.
Energy consumption depended on both pressure and displacement. Both the pressure and displacement decreased with an increase in speed. Consequently, breakage energy consumption showed a downward trend with speed, as illustrated in Figure 5b and Figure 8a. The result is similar to the findings of Johansson and Cleary [19,20]. However, the energy consumption of cone crusher may show different trends with breakage energy consumption because the energy consumption was also influenced by no-load mechanical energy. Therefore, the relationship between energy consumption and speed, either positive or negative correlation, depends on the proportion of breakage energy consumption in total energy consumption. As can be seen from Figure 8b, energy consumption gradually decreased with an increase in speed. The production increased firstly with speed and then decreased. Moreover, the maximum squeezing velocity was at the angle of π/2, as shown in Figure 7a.The design speed should ensure that the initial squeezing velocity of material is less than the maximum squeezing velocity. As a result, speed and production both need to be considered to optimize the energy consumption of the cone crusher.
Structural parameters, eccentric angle, and CSS had a significant influence on the breakage energy consumption. However, this was not the case for the nip angle. Since the eccentric angle was an important factor for the displacement, the greater the displacement, the more pressure was exerted. Accordingly, the breakage energy consumption was correspondingly higher. When the eccentric angle was more than 1.8°, the energy consumption of cone crusher also fluctuated with the increase of speed. Clearly, the eccentric angle affected the speed of minimum energy consumption. CSS is a particle size controller parameter. Both breakage energy consumption and energy consumption of a cone crusher showed a downward trend with an increase of CSS; the size of crushed material increased with CSS. Therefore, the energy which was used to crush the material decreased. This result was in agreement with the findings of Cleary [20]. Surprisingly, the nip angle, which usually ranges from 21° to 23°, had nearly no influence on energy consumption. The influence of nip angle on pressure and displacement was not obvious. The action of the nip angle is to guarantee that the material does not slide upwards. That is to say, the influence of nip angle on energy consumption could be ignored when we optimized the energy consumption.
The model could be used to show the influence of some parameters on energy consumption, although it exhibited several defects which made the predicted value less than the average experimental value. Energy consumption caused by flow losses, thermoplastic effects, and sound wave propagation are ignored. Another explanation for the discrepancy is material heterogeneity. Both the particle size and particle shape may have influence the pressure and energy consumption. These issues could be explored to improve prediction accuracy in a further study.

6. Conclusions

A mathematical model was developed to study the influence of speed, eccentric angle, nip angle, and CSS on the energy consumption of a cone crusher. This model was calibrated and validated based on a PYGB1821 crusher at Anshan Iron and Steel Group Mining Co. Ltd.
In general, speed, eccentric angle, and CSS had a significant influence on energy consumption. However, nip angle was found to have negligible influence. The predicted energy consumption at the speed of 240 rpm was 39.25 kW·h higher than that at 300 rpm. When the speed was 380 rpm, the energy consumption was only 90.13% of that at 240 rpm. Moreover, the relationship between energy consumption and speed, either in terms of a positive or negative correlation, was also influenced by eccentric angle. The eccentric angle presented a positive correlation with energy consumption. An increase in eccentric angle from 1.3° to 2° (a 53.84% increase) led to an 18.68% increment, while the next 53.84 % increase led to a further 27.87% increment. In addition, when the CSS was 38 mm, the energy consumption was only about 87.68% as much as that at 13 mm.
The model provides an effective means for quantifying the influence of operating parameters and structural parameters on energy consumption. Furthermore, the model also explains how the operating parameters and structural parameters affect energy consumption. Therefore, the model could be used to provide a reference for further study on how to match and optimize operating parameters and structural parameters.

Author Contributions

Ruiyue Liu and Boqiang Shi conceived and designed the calculations and experiments; Guoguang Li and Hongjun Yu had contributed to perform the experiments. Ruiyue Liu wrote the paper.

Acknowledgments

The industrial experiments were carried out at Anshan Iron and Steel Group Mining Co., Ltd. Yaoming Su and the others staffs are gratefully acknowledged for providing information and support.

Conflicts of Interest

The authors declare no conflict of interest.

Nomenclature

Asurface area of liner, m2
bmaterial height before compression, m
bactactual material height before compression, m
CSSclosed side setting
d the average size of all particles, mm
d j the mean size of particle j, mm
Eenergy consumption of cone crusher, kW·h
E0no-load mechanical energy, kW·h
E1energy consumption during breakage, kW·h
Fstressstress on the liner, N
icompression ratio
iactactual compression ratio
kactual stroke coefficient
lactthe actual arc length of mantle during squeezing, m
larc length, m
mcrushing zone
nmantle speed, r/min
Osuspension point
OSSopen side setting
O1the center of the mantle
O2the center of the bowl liner
ppressure on the mantle, MPa
qthe number of particle sizes
Qproduction, t/h
R1radius of the mantle, m
R2radius of bowl liner, m
R(θ)distance between the center O2 of the bowl liner and the surface of the mantle, m
sstroke, m
sactactual stroke, m
s(θ)the stroke when the mantle rotates angle θ, m
tdownfree fall time of choke level, s
tupsqueezing time of choke level, s
tm+1free fall time of crushing zone m, s
tm+2squeezing time of crushing zone m, s
vdownthe free fall velocity of material, m/s
vupthe upward speed of material, m/s
ycssordinate of closed side setting, m
ymaxthe distance between the suspension point O and the bottom of the bowl, m
y0the height under the suspension point O, m
x2mabscissa of A2m, m
y2mordinate of A2m, m
x2m+1abscissa of A2m+1, m
y2m+1ordinate of A2m+1, m
x2m+2abscissa of A2m+2, m
y2m+2ordinate of A2m+2, m
αbase angle of the mantle, °
α0nip angle, °
α1base angle of the bowl liner, °
βactual squeezing angle, °
γ0eccentric angle, °
θrotation angle of mantle around the center of bowl liner, °
λjthe yield of particle size j
ρmaterial density, kg/m3
σfeed size distribution
φrotation angle of mantle around its center, °

Appendix A

(1)
Stroke
s(θ) can be presented as Equation (A1).
s ( θ ) = b + R ( θ ) R 2
R(θ) can be calculated according to the law of cosines.
R ( θ ) = R 1 2 s 2 sin 2 θ 4 s cos θ 2
The stroke s is expressed as:
s = 2 γ 0 R 1 2 + y 2
The material height before compression can be calculated as Equation (A4).
b = R 2 + s / 2 R 1
Substituting Equation (A4) into Equation (A1) gives:
s ( θ ) = R ( θ ) + s 2 R 1
(2)
Actual material height and actual stroke
Actual material height is expressed as:
b act = R 2 + s act ( π ) 2 R 1
Actual stroke can be presented as:
s act ( θ ) = s ( θ + β π )
where
β = k π
Actual stroke coefficient is expressed as:
k = n t m + 2 30
To obtain the actual material height and stroke, it is essential to establish the relation between coordinates and time. The slope of A2m+1A2m+2 is formulated as:
y 2 m + 2 y 2 m + 1 x 2 m + 2 x 2 m = tan ( α γ 0 )
The free fall distance of material can be expressed as:
y 2 m + 1 y 2 m = 1 2 g t m + 1 2
The motion cycle of mantle is expressed as:
t m + 1 + t m + 2 + 0.01 = 60 n
The actual eccentric angle can be formulated as:
2 γ 0 n t m + 2 30 = arctan ( x 2 m + 2 y 2 m + 2 ) arctan ( x 2 m y 2 m + 1 )
The abscissa of A2m+2 can be expressed as:
x 2 m + 2 = x 2 m + 2 γ 0 n t m + 2 30 x 2 m 2 + y 2 m + 1 2 sin ( arctan ( y 2 m + 2 x 2 m + 2 ) γ 0 n t m + 2 30 )
The ordinate of A2m+2 is formulated as:
y 2 m + 2 = y 2 m + 1 2 γ 0 n t m + 2 30 x m 2 + y m + 1 2 cos ( arctan ( y 2 m + 2 x 2 m + 2 ) γ 0 n t m + 2 30 )
The coordinates and time can be obtained by solving Equations (A10)–(A15). Finally, calculation results can be used to compute the actual material height and actual stroke.

References

  1. Holmberg, K.; Kivikytö-Reponen, P.; Härkisaari, P.; Valtonen, K.; Erdemir, A. Global energy consumption due to friction and wear in the mining industry. Tribol. Int. 2017, 115, 116–139. [Google Scholar] [CrossRef]
  2. Legendre, D.; Zevenhoven, R. Assessing the energy efficiency of a jaw crusher. Energy 2014, 74, 119–130. [Google Scholar] [CrossRef]
  3. Petrakis, E.; Stamboliadis, E.; Komnitsas, K. Evaluation of the relationship between energy input and particle size distribution in comminution with the use of piecewise regression analysis. Part. Sci. Technol. 2016, 35, 479–489. [Google Scholar] [CrossRef]
  4. Terva, J.; Kuokkala, V.T.; Valtonen, K.; Siitonen, P. Effects of compression and sliding on the wear and energy consumption in mineral crushing. Wear 2018, 398–399, 116–126. [Google Scholar] [CrossRef]
  5. Lindqvist, M. Energy considerations in compressive and impact crushing of rock. Miner. Eng. 2008, 21, 631–641. [Google Scholar] [CrossRef]
  6. Deng, Y.; Chen, M.; Jin, Y.; Zou, D. Theoretical analysis and experimental research on the energy dissipation of rock crushing based on fractal theory. J. Nat. Gas Sci. Eng. 2016, 33, 231–239. [Google Scholar] [CrossRef]
  7. Martins, S. Size-energy relationship in comminution, incorporating scaling laws and heat. Int. J. Miner. Process. 2016, 153, 29–43. [Google Scholar] [CrossRef]
  8. Xu, Y.; Wang, Y. Size effect on specific energy distribution in particle comminution. Fractals 2017, 25, 1750016. [Google Scholar] [CrossRef]
  9. Bengtsson, M.; Svedensten, P.; Evertsson, C.M. Characterization of Compressive Breakage Behavior. In Proceedings of the XXIII International Mineral Processing Congress, Istanbul, Turkey, 3–8 September 2006. [Google Scholar]
  10. Shi, F. A review of the applications of the JK size-dependent breakage model part 2: Assessment of material strength and energy requirement in size reduction. Int. J. Miner. Process. 2016, 157, 36–45. [Google Scholar] [CrossRef]
  11. Nadolski, S.; Klein, B.; Kumar, A.; Davaanyam, Z. An energy benchmarking model for mineral comminution. Miner. Eng. 2014, 65, 178–186. [Google Scholar] [CrossRef]
  12. Bonfils, B.; Ballantyne, G.R.; Powell, M.S. Developments in incremental rock breakage testing methodologies and modelling. Int. J. Miner. Process. 2016, 152, 16–25. [Google Scholar] [CrossRef]
  13. Zhang, C.; Nguyen, G.D.; Kodikara, J. An application of breakage mechanics for predicting energy-size reduction relationships in comminution. Powder Technol. 2016, 287, 121–130. [Google Scholar] [CrossRef]
  14. Mütze, T. Energy dissipation in particle bed comminution. Int. J. Miner. Process. 2015, 136, 15–19. [Google Scholar] [CrossRef]
  15. Mütze, T. Modelling the stress behaviour in particle bed comminution. Int. J. Miner. Process. 2016, 156, 14–23. [Google Scholar] [CrossRef]
  16. Numbi, B.P.; Zhang, J.; Xia, X. Optimal energy management for a jaw crushing process in deep mines. Energy 2014, 68, 337–348. [Google Scholar] [CrossRef]
  17. Johansson, M.; Bengtsson, M.; Evertsson, C.M.; Hulthén, E. A fundamental model of an industrial-scale jaw crusher. Miner. Eng. 2017, 105, 69–78. [Google Scholar] [CrossRef]
  18. Quist, J.; Evertsson, C.M. Cone crusher modelling and simulation using DEM. Miner. Eng. 2016, 85, 92–105. [Google Scholar] [CrossRef]
  19. Johansson, M.; Quist, J.; Evertsson, C.M.; Hulthén, E. Cone crusher performance evaluation using DEM simulations and laboratory experiments for model validation. Miner. Eng. 2017, 103–104, 93–101. [Google Scholar] [CrossRef]
  20. Cleary, P.W.; Sinnott, M.D.; Morrison, R.D.; Cummins, S.; Delaney, G.W. Analysis of cone crusher performance with changes in material properties and operating conditions using DEM. Miner. Eng. 2017, 100, 49–70. [Google Scholar] [CrossRef]
  21. Wu, J.; Bai, H.; Li, Q.; Ma, D. Grain size distribution effect on the hydraulic properties of disintegrated coal mixtures. Energies 2017, 10, 612. [Google Scholar] [CrossRef]
  22. Evertsson, C.M. Cone Crusher Performance. Ph.D. Thesis, Chalmers University of Technology, Gothenburg, Sweden, July 2000. [Google Scholar]
  23. Ma, Y.; Fan, X.; He, Q. Prediction of cone crusher performance considering liner wear. Appl. Sci. 2016, 6, 404. [Google Scholar] [CrossRef]
Figure 1. Cross section of crushing chamber: (a) surface pressure distribution of the mantle; (b) material movement trajectory.
Energies 11 01102 g001
Figure 2. The variation of s(θ).
Energies 11 01102 g002
Figure 3. Crushing zone m.
Energies 11 01102 g003
Figure 4. The flow chart of actual stroke coefficient.
Energies 11 01102 g004
Figure 5. Compression ratio and pressure for various speeds: (a) relation of compression ratio vs. the height of mantle; (b) relation of compressive pressure vs actual stroke.
Energies 11 01102 g005
Figure 6. The influence of speed on squeezing time: (a) relation of compression number vs. squeezing time with speed ranging from 240 rpm to 300 rpm; (b) relation of compression number vs. squeezing time with speed ranging from 320 rpm to 380 rpm.
Energies 11 01102 g006
Figure 7. Squeezing velocity and actual stroke for various speed: (a) relation of speed vs. squeezing velocity; (b) relation of speed and actual stroke.
Energies 11 01102 g007
Figure 8. Energy consumption and production when varying speed: (a) relation of speed vs. energy consumption during breakage; (b) relation of speed, production and energy consumption.
Energies 11 01102 g008
Figure 9. The influence of eccentric angle and nip angle on pressure: (a) relation of eccentric angle vs. pressure; (b) relation of nip angle and pressure.
Energies 11 01102 g009
Figure 10. Energy consumption for various eccentric angle and speed: (a) relation of eccentric angle vs. breakage energy consumption; (b) relation of eccentric angle vs. energy consumption of cone crusher.
Energies 11 01102 g010
Figure 11. Energy consumption when varying the nip angle and speed: (a) relation of nip angle vs. breakage energy consumption; (b) relationship of nip angle vs. energy consumption of cone crusher.
Energies 11 01102 g011
Figure 12. The influence of CSS on pressure and breakage energy: (a) relation of CSS vs. pressure; (b) relation of CSS vs. breakage energy consumption.
Energies 11 01102 g012
Figure 13. Relation of CSS and energy consumption: (a) CSS vs. energy consumption; (b) CSS, production and energy consumption.
Energies 11 01102 g013
Table 1. Energy consumption and material level.
Energy Consumption
/(kW·h)
Material Level/%Energy Consumption
/(kW·h)
Material Level/%Energy Consumption
/(kW·h)
Material Level/%
235.030374.2865.51374.0360.45
235.770370.2065.80375.0358.33
235.520387.5066.98376.6957.64
235.030387.3367.82369.0456.60
239.10391.9067.45391.1563.14
245.330383.4267.68391.1564.06
245.080384.6767.77393.8263.40
244.170402.7168.50424.3365.36
245.830407.0367.13424.3362.85
242.010386.5869.21402.7162.38
244.670399.3070.23402.7163.72
241.760384.6767.13375.0367.25
244.170394.4867.91384.6769.36
242.010382.5168.00386.5869.21
376.9470.02396.2368.87375.0367.59
380.1062.50399.8070.28396.6471.38
371.4566.29 387.0857.06379.8562.64
370.9566.03 372.8653.27373.8661.2
373.8665.89 380.60 60.39 374.53 59.81
380.3566.72 374.53 61.89 369.29 59.03
383.4267.39 379.85 62.64 387.3367.53
380.3566.72373.86 61.20 378.1965.83
Table 2. Feed particle size distribution.
Particle Size/mmFeed Size Distribution/%
Test Number
123
+1002.514.131.87
−100~+668.6913.2512.05
−66~+4219.4216.7322.03
−42~+3019.3918.3417.92
−30~+2415.1312.7211.35
−24~+1230.3132.1730.77
−12~+73.341.973.52
−7~+50.270.130.29
−5~00.940.560.20
Table 3. Structural parameters of crushing chamber and operating parameters.
CoefficientValue
Maximum radius of the mantle/m0.8039
Maximum radius of the bowl liner/m0.917
Abscissa of initial point/m0.1878
Ordinate of initial point/m0.3333
Ordinate of CSS/m0.727
Height under the suspension point O/m0.3412
Height of bowl liner/m0.8732
Base angle of mantle/°50.5
Base angle of bowl liner/°48
Nip angle/°21
Eccentric angle/°2.5
Closed set setting/mm19
Speed/(r/min)300

