Energy-Related CO2 Emission in China’s Provincial Thermal Electricity Generation: Driving Factors and Possibilities for Abatement


Abstract
:1. Introduction
2. Literature Review on China’s Thermal Electricity Generation
3. Methodology
3.1. Calculation of CO2 Emissions
3.2. Shapley/Sun Index
3.3. Slack-Based Measure of Efficiency
4. Energy Consumption and IDA Results
4.1. Data Sources
4.2. Energy Consumption and CO2 Emissions
4.3. The Results of IDA
5. Environmental Efficiency and Shadow Prices
5.1. Data Sources
5.2. Environmental Efficiency
5.3. Shadow Prices
6. Conclusions
Author Contributions
Acknowledgments
Conflicts of Interest
References
- Zhao, Q.R.; Chen, Q.H.; Xiao, Y.T.; Tian, G.Q.; Chu, X.L.; Liu, Q.M. Saving forests through development? Fuelwood consumption and the energy-ladder hypothesis in rural Southern China. Transform. Bus. Econ. 2017, 16, 199–219. [Google Scholar]
- Chen, J.D.; Cheng, S.L.; Nikic, V.; Song, M.L. Quo Vadis? Major Players in Global Coal Consumption and Emissions Reduction. Transform Bus Econ. 2018, 17, 112–132. [Google Scholar]
- Mi, Z.; Meng, J.; Guan, D.; Shan, Y.; Song, M.; Wei, Y.; Liu, Z.; Hubacek, K. Chinese CO2 emission flows have reversed since the global financial crisis. Nat. Commun. 2017, 8, 1712. [Google Scholar] [CrossRef] [PubMed]
- Du, L.; Mao, J. Estimating the environmental efficiency and marginal CO2, abatement cost of coal-fired power plants in China. Energy Policy 2015, 85, 347–356. [Google Scholar] [CrossRef]
- Xie, B.C.; Fan, Y.; Qu, Q.Q. Does generation form influence environmental efficiency performance? An analysis of China’s power system. Appl. Energy 2012, 96, 261–271. [Google Scholar]
- Dietzenbacher, E.; Los, B. Structural decomposition techniques, sense and sensitivity. Econ. Syst. Res. 1988, 10, 307–324. [Google Scholar] [CrossRef]
- Su, B.; Ang, B.W. Structural decomposition analysis applied to energy and emissions, some methodological developments. Energy Econ. 2012, 34, 177–188. [Google Scholar] [CrossRef]
- Su, B.; Ang, B.W. Attribution of changes in the generalized Fisher index with application to embodied emission studies. Energy 2014, 69, 778–786. [Google Scholar] [CrossRef]
- Wang, H.; Ang, B.W.; Su, B. Assessing drivers of economy-wide energy use and emissions: IDA versus SDA. Energy Policy 2017, 107, 585–599. [Google Scholar] [CrossRef]
- Shao, S.; Liu, J.; Geng, Y.; Miao, Z.; Yang, Y. Uncovering driving factors of carbon emissions from China’s mining sector. Appl. Energy 2016, 166, 220–238. [Google Scholar] [CrossRef]
- Ang, B.W.; Su, B. Carbon emission intensity in electricity production, a global analysis. Energy Policy 2016, 94, 56–63. [Google Scholar] [CrossRef]
- Yan, Q.Y.; Yin, J.T.; Baležentis, T.; Daiva, M.; Dalia, S. Energy-related GHG emission in agriculture of the European countries, an application of the Generalized Divisia Index. J. Clean. Prod. 2017, 162, 686–694. [Google Scholar] [CrossRef]
- Goh, T.; Ang, B.W.; Su, B.; Wang, H. Drivers of stagnating global carbon intensity of electricity and the way forward. Energy Policy 2018, 113, 149–156. [Google Scholar] [CrossRef]
- İpek-Tunç, G.; Türüt-Aşık, S.; Akbostancı, E. A decomposition analysis of CO2, emissions from energy use, Turkish case. Energy Policy 2009, 37, 4689–4699. [Google Scholar] [CrossRef]
- Andreoni, V.; Galmarini, S. Decoupling economic growth from carbon dioxide emissions, a decomposition analysis of Italian energy consumption. Energy 2012, 44, 682–691. [Google Scholar] [CrossRef]
- Kaivooja, J.; Luukkanen, J.; Panula-Ontto, J.; Vehmas, J.; Chen, Y.; Mikkonen, S.; Auffermanna, B. Are structural change and modernization leading to convergence in the CO2 economy? Decomposition analysis of China, EU and USA. Energy 2014, 72, 115–125. [Google Scholar] [CrossRef]
- Liu, Z.; Liang, S.; Geng, Y.; Xue, B.; Xi, F.; Pan, Y.; Zhang, T.; Fujita, T. Features, trajectories and driving forces for energy-related GHG emissions from Chinese mega cities, the case of Beijing, Tianjin, Shanghai and Chongqing. Energy 2012, 37, 245–254. [Google Scholar] [CrossRef]
- Li, D.; Wang, D. Decomposition analysis of energy consumption for a freeway during its operation period, a case study for Guangdong, China. Energy 2016, 97, 296–305. [Google Scholar] [CrossRef]
- Zhang, W.; Li, K.; Zhou, D.; Zhang, W.; Gao, H. Decomposition of intensity of energy-related CO2, emission in Chinese provinces using the LMDI method. Energy Policy 2016, 92, 369–381. [Google Scholar] [CrossRef]
- Papagiannaki, K.; Diakoulaki, D. Decomposition analysis of CO2, emissions from passenger cars, the cases of Greece and Denmark. Energy Policy 2009, 37, 3259–3267. [Google Scholar] [CrossRef]
- Goh, T.; Ang, B.W. Quantifying CO2 emission reductions from renewables and nuclear energy—Some paradoxes. Energy Policy 2018, 113, 651–662. [Google Scholar] [CrossRef]
- Wang, J.F.; He, S.T.; Qiu, Y.; Liu, N.; Li, Y.J.; Dong, Z.F. Investigating driving forces of aggregate carbon intensity of electricity generation in China. Energy Policy 2018, 113, 249–257. [Google Scholar] [CrossRef]
- Wang, Q.; Jiang, X.T.; Li, R. Comparative decoupling analysis of energy-related carbon emission from electric output of electricity sector in Shandong province, China. Energy 2017, 127, 78–88. [Google Scholar] [CrossRef]
- Sun, J.W. Changes in energy consumption and energy intensity, a complete decomposition model. Energy Econ. 1988, 20, 85–100. [Google Scholar] [CrossRef]
- Albrecht, J.; François, D.; Schoors, K. A Shapley decomposition of carbon emissions without residuals. Energy Policy 2002, 30, 727–736. [Google Scholar] [CrossRef]
- Ang, B.W.; Liu, F.L.; Chew, E.P. Perfect decomposition techniques in energy and environmental analysis. Energy Policy 2003, 31, 1561–1566. [Google Scholar] [CrossRef]
- Hoekstra, R.; Van den Bergh, J.C.J.M. Comparing structural and index decomposition analysis. Energy Econ. 2003, 25, 39–64. [Google Scholar] [CrossRef]
- Li, T.; Baležentis, T.; Makuteniene, D.; Streimikiene, D.; Kriščiukaitienė, I. Energy-related CO2 emission in European Union agriculture, Driving forces and possibilities for reduction. Appl. Energy 2016, 180, 682–694. [Google Scholar] [CrossRef]
- Yu, S.; Wei, Y.M.; Wang, K. Provincial allocation of carbon emission reduction targets in China, an approach based on improved fuzzy cluster and Shapley value decomposition. Energy Policy 2014, 66, 630–644. [Google Scholar] [CrossRef]
- Zhang, Y.J.; Wang, A.D.; Da, Y.B. Regional allocation of carbon emission quotas in China, evidence from the Shapley value method. Energy Policy 2014, 74, 454–464. [Google Scholar] [CrossRef]
- Alves, M.R.; Moutinho, V. Decomposition analysis and innovative accounting approach for energy-related CO2 (carbon dioxide) emissions intensity over 1996–2009 in Portugal. Energy 2013, 57, 775–787. [Google Scholar] [CrossRef]
- Perman, R. Natural Resources and Environmental Economics; Addison Wesley Longman: London, UK, 2003. [Google Scholar]
- Wei, C.; Löschel, A.; Liu, B. An empirical analysis of the CO2, shadow price in Chinese thermal power enterprises. Energy Econ. 2013, 40, 22–31. [Google Scholar] [CrossRef]
- Zhou, P.; Ang, B.W.; Poh, K.L. Measuring environmental performance under different environmental DEA technologies. Energy Econ. 2008, 30, 1–14. [Google Scholar] [CrossRef]
- Wang, Z.; He, W.; Chen, K. The integrated efficiency of economic development and CO2 emissions among Asia Pacific Economic Cooperation members. J. Clean. Prod. 2016, 131, 765–772. [Google Scholar] [CrossRef]
- Song, M.L.; Fisher, R.; Wang, J.L.; Cui, L.B. Environmental performance evaluation with big data: Theories and methods. Ann. Oper. Res. 2016, 1–14. [Google Scholar] [CrossRef]
- Cooper, W.W.; Tone, K.; Seiford, L.M. Undesirable Outputs Models. Data Envelopment Analysis, a Comprehensive Text with Models, Applications References, and DEA-Solver Software Cdrom; Kluwer Academic Publishers: Boston, MA, USA, 1999. [Google Scholar]
- Wei, C.; Ni, J.; Du, L. Regional allocation of carbon dioxide abatement in China. China Econ. Rev. 2012, 23, 552–565. [Google Scholar] [CrossRef]
- Malla, S. CO2 emissions from electricity generation in seven Asia-Pacific and North American countries, a decomposition analysis. Energy Policy 2009, 37, 1–9. [Google Scholar] [CrossRef]
- He, Y.X.; Tao, W.J.; Zhang, S.L.; Yang, W.H.; Li, F.R. Decomposition analysis of China’s electricity intensity with LMDI method. Int. J. Glob. Energy Issues 2009, 32, 34–48. [Google Scholar] [CrossRef]
- Wang, W.C.; Mu, H.L.; Kang, X.D.; Song, R.C.; Ning, Y.D. Changes in industrial electricity consumption in China from 1998 to 2007. Energy Policy 2010, 38, 3684–3690. [Google Scholar] [CrossRef]
- Zhang, M.; Liu, X.; Wang, W.; Zhou, M. Decomposition analysis of CO2, emissions from electricity generation in China. Energy Policy 2013, 52, 159–165. [Google Scholar] [CrossRef]
- Cao, Y.; Wang, X.; Li, Y.; Tan, Y.; Xing, J.B.; Fan, R.X. A comprehensive study on low-carbon impact of distributed generations on regional power grids, a case of Jiangxi provincial power grid in China. Renew. Sust. Energy Rev. 2016, 53, 766–778. [Google Scholar] [CrossRef]
- Zhou, G.H.; Chung, W.; Zhang, Y.X. Carbon dioxide emissions and energy efficiency analysis of China’s regional thermal electricity generation. J. Clean. Prod. 2014, 83, 173–184. [Google Scholar] [CrossRef]
- Yan, Q.Y.; Zhang, Q.; Zou, X. Decomposition analysis of carbon dioxide emissions in China’s regional thermal electricity generation, 2000–2020. Energy 2016, 112, 788–794. [Google Scholar] [CrossRef]
- Fei, R.; Lin, B. Technology gap and CO2 emission reduction potential by technical efficiency measures, a meta-frontier modeling for the Chinese agricultural sector. Ecol. Ind. 2017, 73, 653–661. [Google Scholar] [CrossRef]
- Hao, Y.; Chen, H.; Wei, Y.M.; Li, Y.M. The influence of climate change on CO2 (carbon dioxide) emissions, an empirical estimation based on Chinese provincial panel data. J. Clean Prod. 2016, 131, 667–677. [Google Scholar] [CrossRef]
- Liu, Z.; Geng, Y.; Lindner, S.; Guan, D. Uncovering China’s greenhouse gas emission from regional and sectoral perspectives. Energy 2012, 45, 1059–1068. [Google Scholar] [CrossRef]
- Xu, S.C.; He, Z.X.; Long, R.Y. Factors that influence carbon emissions due to energy consumption in China, decomposition analysis using LMDI. Appl. Energy 2014, 127, 182–193. [Google Scholar] [CrossRef]
- Ma, C. A multi-fuel, multi-sector and multi-region approach to index decomposition, an application to China’s energy consumption 1995–2010. Energy Econ. 2014, 42, 9–16. [Google Scholar] [CrossRef]
- Wang, M.; Feng, C. Decomposition of energy-related CO2 emissions in China, An empirical analysis based on provincial panel data of three sectors. Appl. Energy 2017, 190, 772–787. [Google Scholar] [CrossRef]
- Murty, M.N.; Kumar, S.; Dhavala, K.K. Measuring environmental efficiency of industry, a case study of thermal power generation in India. Environ. Resour. Econ. 2007, 38, 31–50. [Google Scholar] [CrossRef] [Green Version]
- Cai, W.; Wang, C.; Chen, J. Revisiting CO2, mitigation potential and costs in China’s electricity sector. Energy Policy 2010, 38, 4209–4213. [Google Scholar] [CrossRef]
- Zhou, P.; Ang, B.W.; Wang, H. Energy and CO2 emission performance in electricity generation, a non-radial directional distance function approach. Eur. J. Oper. Res. 2012, 221, 625–635. [Google Scholar] [CrossRef]
- Zhang, N.; Zhou, P.; Choi, Y. Energy efficiency, CO2, emission performance and technology gaps in fossil fuel electricity generation in Korea, A meta-frontier non-radial directional distance function analysis. Energy Policy 2013, 56, 653–662. [Google Scholar] [CrossRef]
- Bi, G.B.; Song, W.; Zhou, P.; Liang, L. Does environmental regulation affect energy efficiency in China’s thermal power generation? Empirical evidence from a slacks-based DEA model. Energy Policy 2014, 66, 537–546. [Google Scholar] [CrossRef]
- Duan, N.; Guo, J.P.; Xie, B.C. Is there a difference between the energy and CO2, emission performance for China’s thermal power industry? A bootstrapped directional distance function approach. Appl. Energy 2016, 162, 1552–1563. [Google Scholar] [CrossRef]
- Wang, K.; Zhang, J.; Wei, Y.M. Operational and environmental performance in China’s thermal power industry, Taking an effectiveness measure as complement to an efficiency measure. J. Environ. Manag. 2017, 192, 254–270. [Google Scholar] [CrossRef] [PubMed]
- Zhang, N.; Choi, Y. Total-factor carbon emission performance of fossil fuel power plants in China, a metafrontier non-radial Malmquist index analysis. Energy Econ. 2013, 40, 549–559. [Google Scholar] [CrossRef]
- Yu, Y.; Qian, T.; Du, L. Carbon productivity growth, technological innovation, and technology gap change of coal-fired power plants in China. Energy Policy 2017, 109, 479–487. [Google Scholar] [CrossRef]
- Shapley, L.S. A Value for n-Person Games; Princeton University Press: Princeton, NJ, USA, 1953. [Google Scholar]
- Song, M.L.; Wang, S.H. Market competition, green technology progress and comparative advantages in China. Manag. Decis. 2018, 56, 188–203. [Google Scholar] [CrossRef]
- Song, M.L.; Peng, J.; Wang, J.L.; Dong, L. Better resource management: An improved resource and environmental efficiency evaluation approach that considers undesirable outputs. Resour. Conserv. Recycl. 2016, 128, 197–205. [Google Scholar] [CrossRef]
- DES (Department of Energy Statistics, National Bureau of Statistics of China). China Energy Statistical Yearbook; China Statistical Press: Beijing, China; 2001–2014.
- NBS (National Bureau of Statistics, China). China Statistical Yearbook; China Statistics Press: Beijing, China; 2001–2014.
- Eggleston, H.S.; Buendia, L.; Miwa, K.; Ngara, T.; Tanabe, K. 2006 IPCC guidelines for national greenhouse gas inventories. IPCC Intergov. Panel Clim. Chang. 2006, 1, 39. [Google Scholar]
- CEC (China Electricity Council). China Electric Power Industry Statistics Analysis; Statistical Information Department of China Electricity Council: Beijing, China, 2001–2014.


| Fuel Type | Unit | Conversion Factor | ||
|---|---|---|---|---|
| Coal | Raw coal | 1 | 104 tn | 0.714 kg ce/kg |
| Cleaned coal | 2 | 104 tn | 0.900 kg ce/kg | |
| Other washed coal | 3 | 104 tn | 0.286 kg ce/kg | |
| Briquettes | 4 | 104 tn | 0.700 kg ce/kg | |
| Gangue | 5 | 104 tn | 0.179 kg ce/kg | |
| Coke | 6 | 104 tn | 0.971 kg ce/kg | |
| Other cooking products | 7 | 104 tn | 1.500 kg ce/kg | |
| Oil | Crude oil | 8 | 104 tn | 1.429 kg ce/kg |
| Gasoline | 9 | 104 tn | 1.471 kg ce/kg | |
| Diesel oil | 10 | 104 tn | 1.457 kg ce/kg | |
| Fuel oil | 11 | 104 tn | 1.429 kg ce/kg | |
| Petroleum coke | 12 | 104 tn | 1.092 kg ce/kg | |
| Other petroleum | 13 | 104 tn | 1.400 kg ce/kg | |
| Gas | Coke oven gas | 14 | 108 m3 | 0.614 kg ce/m3 |
| Blast furnace gas | 15 | 108 m3 | 1.286 kg ce/104 m3 | |
| Converter gas | 16 | 108 m3 | 2.714 kg ce/104 m3 | |
| Other gas | 17 | 108 m3 | 0.657 kg ce/m3 | |
| Liquefied petroleum gas (LPG) | 18 | 104 tn | 1.714 kg ce/kg | |
| Refinery gas | 19 | 104 tn | 1.571 kg ce/kg | |
| Natural gas | 20 | 108 m3 | 1.330 kg ce/m3 | |
| Liquefied petroleum gas (LNG) | 21 | 104 tn | 1.757 kg ce/kg | |
| Others | Other energy | 22 | 104 tce | 1.000 kg ce/kg |
| Heat | 23 | 1010 kJ | 0.034 kg ce/106 J | |
| Fuel | Unit | (tc/TJ) | (%) | (kg CO2/TJ) | (MJ/ton or MJ/m3) |
|---|---|---|---|---|---|
| Raw coal | 104 ton | 25.8 | 100 | 94,600 | 20,908 |
| Cleaned coal | 104 ton | 25.8 | 100 | 94,600 | 26,344 |
| Other washed coal | 104 ton | 25.8 | 100 | 94,600 | 8363 |
| Briquettes | 104 ton | 26.6 | 100 | 97,500 | 20,908 |
| Gangue | 104 ton | 25.8 | 100 | 94,600 | 8372 |
| Coke | 104 ton | 29.2 | 100 | 107,100 | 28,435 |
| Other cooking | 104 ton | 25.8 | 100 | 94,600 | 28,435 |
| Crude oil | 104 ton | 20.0 | 100 | 73,300 | 41,816 |
| Gasoline | 104 ton | 18.9 | 100 | 69,300 | 43,070 |
| Diesel oil | 104 ton | 20.2 | 100 | 74,100 | 42,652 |
| Fuel oil | 104 ton | 21.1 | 100 | 77,400 | 41,816 |
| Petroleum coke | 104 ton | 26.6 | 100 | 97,500 | 31,980 |
| Other petroleum | 104 ton | 20.0 | 100 | 73,300 | 41,816 |
| Coke oven gas | 108 m3 | 12.1 | 100 | 44,400 | 16,726 |
| Blast furnace gas | 108 m3 | 70.8 | 100 | 259,600 | 3767 |
| Converter gas | 108 m3 | 49.6 | 100 | 181,900 | 7953 |
| Other gas | 108 m3 | 12.1 | 100 | 44,400 | 5227 |
| LPG | 104 ton | 17.2 | 100 | 63,100 | 50,179 |
| Refinery gas | 104 ton | 15.7 | 100 | 57,600 | 46,055 |
| Natural gas | 104 ton | 15.3 | 100 | 56,100 | 38,931 |
| LNG | 108 m3 | 15.3 | 100 | 56,100 | 51,486 |
| Provinces | GDP of Province (CNY Billion in 2000 Price) | Energy Use (Mtce) | CO2 Emissions (Mt) |
|---|---|---|---|
| Beijing | 6432 | 5.69 | 15.08 |
| Tianjin | 3462 | 12.85 | 35.32 |
| Hebei | 10,261 | 54.00 | 143.62 |
| Shanxi | 3755 | 54.59 | 147.56 |
| Inner Mongolia | 3131 | 72.24 | 199.06 |
| Liaoning | 9498 | 36.97 | 100.51 |
| Jilin | 3970 | 19.68 | 53.88 |
| Heilongjiang | 6411 | 25.20 | 68.98 |
| Shanghai | 9706 | 39.01 | 105.94 |
| Jiangsu | 17,401 | 75.16 | 204.65 |
| Zhejiang | 12,493 | 45.10 | 121.77 |
| Anhui | 5904 | 52.57 | 143.62 |
| Fujian | 7658 | 20.85 | 56.62 |
| Jiangxi | 4075 | 14.66 | 39.90 |
| Shandong | 16,961 | 76.05 | 207.10 |
| Henan | 10,279 | 60.34 | 164.46 |
| Hubei | 7212 | 21.11 | 56.17 |
| Hunan | 7225 | 17.95 | 48.03 |
| Guangdong | 21,851 | 63.42 | 167.90 |
| Guangxi | 4231 | 13.19 | 33.00 |
| Hainan | 1072 | 2.83 | 7.55 |
| Chongqing | 3643 | 9.13 | 24.15 |
| Sichuan | 7991 | 18.92 | 51.85 |
| Guizhou | 2095 | 25.30 | 69.18 |
| Yunnan | 4091 | 16.96 | 45.26 |
| Shannxi | 3670 | 23.34 | 63.83 |
| Gansu | 2142 | 14.64 | 40.32 |
| Qinghai | 536 | 3.03 | 8.38 |
| Ningxia | 600 | 16.53 | 45.70 |
| Xinjiang | 2774 | 16.30 | 44.76 |
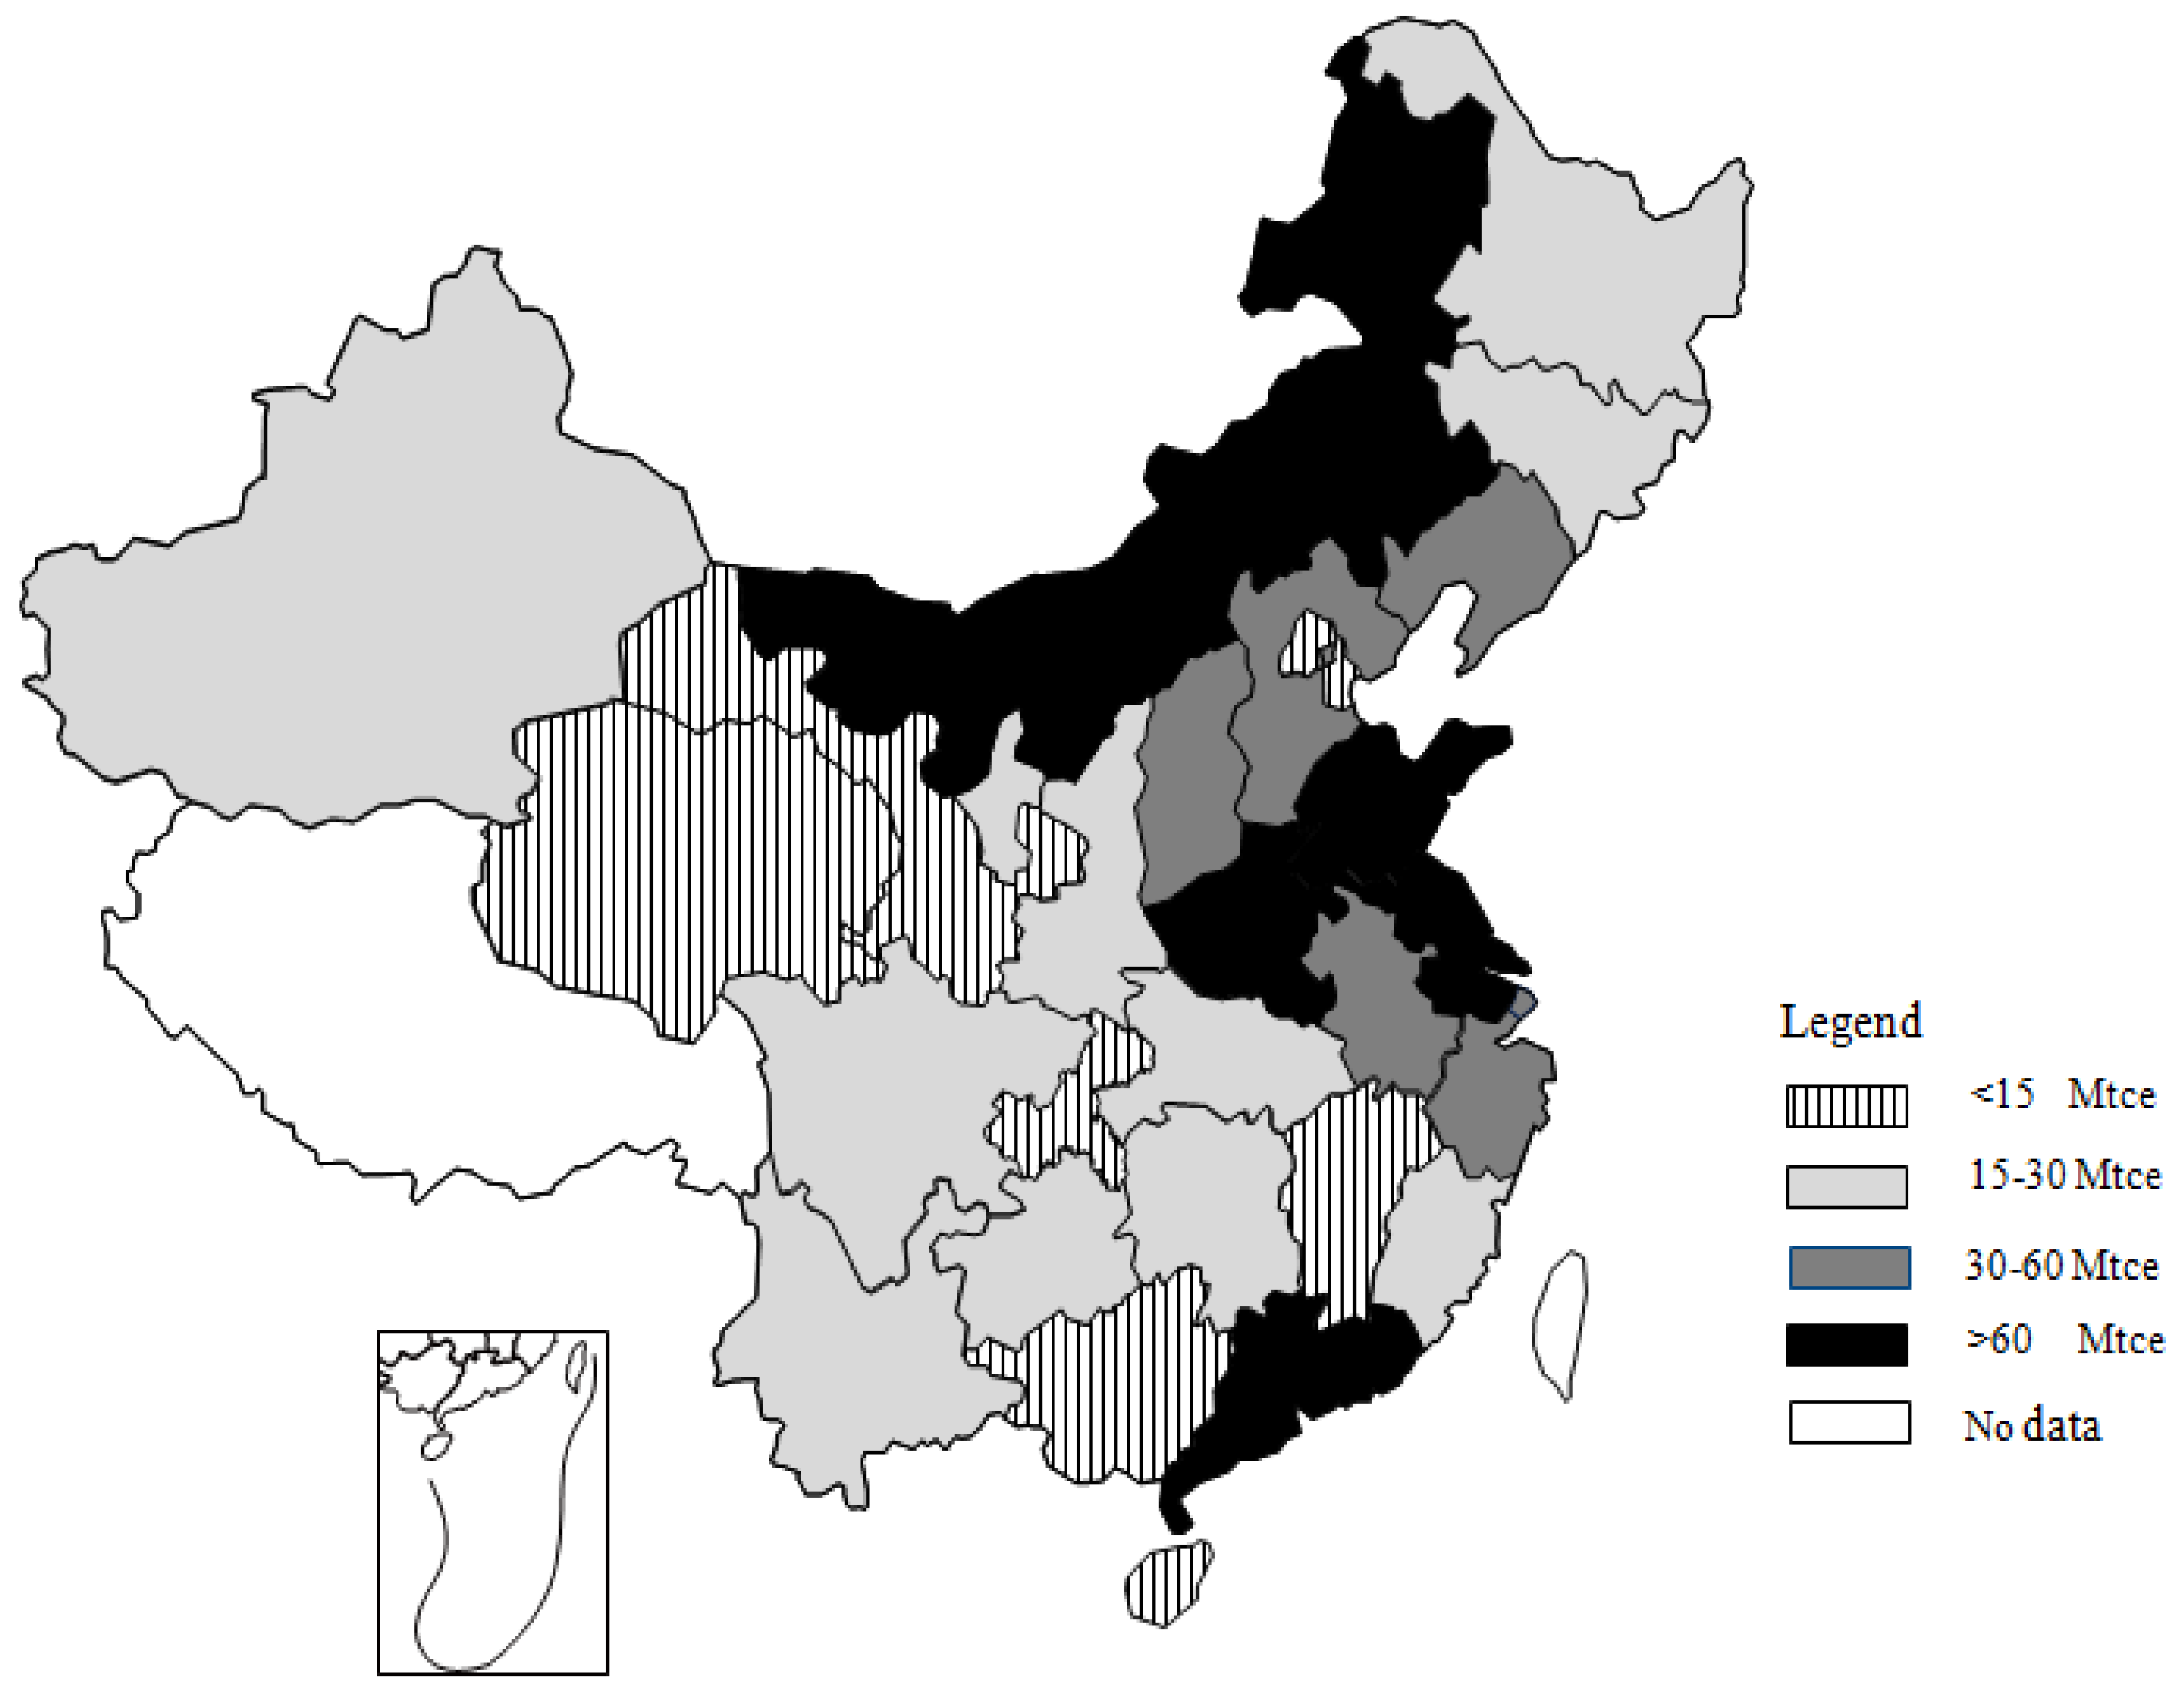
| Mean Energy Consumption | Provinces/Provincial Power Grids |
|---|---|
| <15 Mtce | Hainan, Qinghai, Beijing, Chongqing, Tianjin, Guangxi , Gansu, Jiangxi |
| 15–30 Mtce | Xinjiang, Ningxia, Yunnan, Hunan, Sichuan, Jilin, Fujian, Hubei, Shannxi, Heilongjiang, Guizhou |
| 30–60 Mtce | Liaoning, Shanghai, Zhejiang, Anhui, Hebei, Shanxi |
| >60 Mtce | Henan, Guangdong, Inner Mongolia, Jiangsu, Shandong |
| Provinces | Inputs | Desirable Output | Undesirable Output | ||
|---|---|---|---|---|---|
| Coal Fuel (Mtce) | Non-Coal Fuel (Mtce) | Installed Capability (104 kW) | Electricity (108 kW·h) | CO2 Emissions (Mt) | |
| Beijing | 5.21 | 0.48 | 441 | 228 | 15.08 |
| Tianjin | 12.67 | 0.22 | 786 | 397 | 35.32 |
| Hebei | 51.27 | 2.7 | 2750 | 1471 | 143.62 |
| Shanxi | 52.61 | 1.98 | 2981 | 1471 | 147.56 |
| Inner Mongolia | 71.58 | 0.66 | 3370 | 1490 | 199.06 |
| Liaoning | 35.86 | 1.11 | 2030 | 968 | 100.51 |
| Jilin | 19.41 | 0.27 | 929 | 406 | 53.88 |
| Heilongjiang | 24.69 | 0.51 | 1398 | 614 | 68.98 |
| Shanghai | 37.44 | 1.57 | 1512 | 757 | 105.94 |
| Jiangsu | 73.39 | 1.76 | 4506 | 2303 | 204.65 |
| Zhejiang | 42.67 | 2.43 | 3204 | 1403 | 121.77 |
| Anhui | 51.71 | 0.89 | 1895 | 906 | 143.62 |
| Fujian | 20.11 | 0.74 | 1469 | 641 | 56.62 |
| Jiangxi | 14.32 | 0.39 | 892 | 371 | 39.9 |
| Shandong | 73.98 | 2.49 | 4633 | 2203 | 207.1 |
| Henan | 59.06 | 1.28 | 3382 | 1550 | 164.46 |
| Hubei | 20.08 | 1.03 | 1339 | 543 | 56.17 |
| Hunan | 17.2 | 0.75 | 1153 | 473 | 48.03 |
| Guangdong | 54.11 | 9.32 | 4100 | 1953 | 167.9 |
| Guangxi | 11.85 | 1.34 | 789 | 327 | 33 |
| Hainan | 2.63 | 0.21 | 227 | 84 | 7.55 |
| Chongqing | 8.58 | 0.55 | 523 | 240 | 24.15 |
| Sichuan | 18.54 | 0.38 | 1025 | 404 | 51.85 |
| Guizhou | 24.94 | 0.36 | 1321 | 675 | 69.18 |
| Yunnan | 16.24 | 0.72 | 796 | 337 | 45.26 |
| Shannxi | 22.9 | 0.43 | 1370 | 667 | 63.83 |
| Gansu | 14.52 | 0.12 | 865 | 405 | 40.32 |
| Qinghai | 3 | 0.03 | 152 | 78 | 8.38 |
| Ningxia | 16.37 | 0.22 | 787 | 388 | 45.7 |
| Xinjiang | 16.01 | 0.3 | 934 | 380 | 44.76 |
| Year | 2000 | 2001 | 2002 | 2003 | 2004 | 2005 | 2006 | 2007 | 2008 | 2009 | 2010 | 2011 | 2012 | 2013 | Mean | Rank | |
|---|---|---|---|---|---|---|---|---|---|---|---|---|---|---|---|---|---|
| Provinces | |||||||||||||||||
| Beijing | 0.38 | 0.41 | 0.42 | 0.42 | 0.39 | 0.37 | 0.43 | 0.44 | 0.52 | 0.58 | 0.64 | 0.66 | 0.80 | 1.00 | 0.53 | 2 | |
| Tianjin | 0.42 | 0.46 | 0.49 | 0.79 | 0.51 | 0.47 | 0.45 | 0.47 | 0.43 | 0.37 | 0.39 | 0.41 | 0.40 | 0.42 | 0.46 | 4 | |
| Hebei | 0.38 | 0.40 | 0.40 | 0.39 | 0.40 | 0.38 | 0.35 | 0.38 | 0.35 | 0.34 | 0.29 | 0.30 | 0.33 | 0.34 | 0.36 | 13 | |
| Shanxi | 0.96 | 1.00 | 0.52 | 0.56 | 0.37 | 0.39 | 0.34 | 0.34 | 0.28 | 0.27 | 0.33 | 0.35 | 0.35 | 0.33 | 0.46 | 5 | |
| Inner Mongolia | 0.26 | 0.22 | 0.23 | 0.26 | 0.30 | 0.24 | 0.23 | 0.23 | 0.19 | 0.21 | 0.21 | 0.18 | 0.19 | 0.25 | 0.23 | 26 | |
| Liaoning | 0.27 | 0.33 | 0.36 | 0.34 | 0.31 | 0.32 | 0.35 | 0.36 | 0.36 | 0.34 | 0.26 | 0.26 | 0.27 | 0.22 | 0.31 | 17 | |
| Jilin | 0.26 | 0.22 | 0.25 | 0.21 | 0.20 | 0.21 | 0.22 | 0.24 | 0.19 | 0.18 | 0.18 | 0.15 | 0.14 | 0.14 | 0.20 | 27 | |
| Heilongjiang | 0.19 | 0.23 | 0.23 | 0.25 | 0.27 | 0.29 | 0.24 | 0.29 | 0.25 | 0.20 | 0.22 | 0.21 | 0.23 | 0.30 | 0.24 | 25 | |
| Shanghai | 0.07 | 0.08 | 0.08 | 0.10 | 0.09 | 0.08 | 0.07 | 0.07 | 0.06 | 0.08 | 0.41 | 0.52 | 0.49 | 0.40 | 0.19 | 28 | |
| Jiangsu | 0.34 | 0.37 | 0.39 | 0.42 | 0.40 | 0.38 | 0.42 | 0.47 | 0.48 | 0.46 | 0.49 | 0.51 | 0.50 | 0.42 | 0.43 | 6 | |
| Zhejiang | 0.28 | 0.30 | 0.32 | 0.32 | 0.26 | 0.23 | 0.31 | 0.36 | 0.37 | 0.38 | 0.42 | 0.44 | 0.44 | 0.47 | 0.35 | 14 | |
| Anhui | 0.02 | 0.04 | 0.08 | 0.54 | 1.00 | 0.05 | 0.03 | 0.03 | 0.02 | 0.04 | 0.40 | 0.44 | 0.37 | 0.36 | 0.24 | 24 | |
| Fujian | 0.31 | 0.24 | 0.38 | 0.49 | 0.48 | 0.44 | 0.41 | 0.45 | 0.42 | 0.43 | 0.38 | 0.42 | 0.37 | 0.37 | 0.40 | 9 | |
| Jiangxi | 0.12 | 0.15 | 0.20 | 0.32 | 0.26 | 0.25 | 0.29 | 0.27 | 0.27 | 0.28 | 0.25 | 0.35 | 0.34 | 0.36 | 0.27 | 23 | |
| Shandong | 0.52 | 1.00 | 0.38 | 0.28 | 0.36 | 0.33 | 0.32 | 0.33 | 0.36 | 0.36 | 0.34 | 0.34 | 0.33 | 0.36 | 0.40 | 8 | |
| Henan | 0.31 | 0.30 | 0.32 | 0.30 | 0.28 | 0.28 | 0.28 | 0.31 | 0.30 | 0.33 | 0.26 | 0.34 | 0.33 | 0.36 | 0.31 | 18 | |
| Hubei | 0.21 | 0.29 | 0.30 | 0.31 | 0.16 | 0.22 | 0.27 | 0.30 | 0.22 | 0.32 | 0.25 | 0.30 | 0.28 | 0.34 | 0.27 | 22 | |
| Hunan | 0.24 | 0.23 | 0.23 | 0.26 | 0.28 | 0.42 | 0.29 | 0.29 | 0.27 | 0.33 | 0.26 | 0.28 | 0.25 | 0.29 | 0.28 | 20 | |
| Guangdong | 0.31 | 0.31 | 0.32 | 0.39 | 0.33 | 0.31 | 0.31 | 0.34 | 0.31 | 0.35 | 0.36 | 0.40 | 0.37 | 0.39 | 0.34 | 16 | |
| Guangxi | 0.23 | 0.22 | 0.26 | 0.41 | 0.50 | 0.16 | 0.19 | 0.20 | 0.21 | 0.28 | 0.33 | 0.29 | 0.26 | 0.33 | 0.28 | 21 | |
| Hainan | 0.23 | 0.21 | 0.20 | 0.37 | 0.45 | 0.51 | 0.53 | 0.48 | 0.43 | 0.40 | 0.42 | 0.46 | 0.44 | 0.43 | 0.40 | 10 | |
| Chongqing | 0.13 | 0.73 | 1.00 | 0.35 | 0.21 | 0.25 | 0.23 | 0.26 | 0.20 | 0.24 | 0.34 | 0.28 | 0.28 | 0.31 | 0.34 | 15 | |
| Sichuan | 0.05 | 0.07 | 0.15 | 0.17 | 0.13 | 0.11 | 0.12 | 0.10 | 0.09 | 0.22 | 0.34 | 0.28 | 0.28 | 0.22 | 0.17 | 30 | |
| Guizhou | 0.62 | 0.77 | 1.00 | 1.00 | 0.97 | 0.93 | 1.00 | 0.33 | 0.29 | 0.37 | 0.35 | 0.37 | 0.40 | 0.41 | 0.63 | 1 | |
| Yunnan | 0.32 | 0.16 | 0.22 | 0.17 | 0.24 | 0.14 | 0.16 | 0.15 | 0.13 | 0.22 | 0.17 | 0.12 | 0.05 | 0.09 | 0.17 | 29 | |
| Shannxi | 0.32 | 0.29 | 0.27 | 0.39 | 0.33 | 0.37 | 0.43 | 0.42 | 0.34 | 0.30 | 0.36 | 0.49 | 0.54 | 0.56 | 0.39 | 12 | |
| Gansu | 0.36 | 0.38 | 0.40 | 0.41 | 0.53 | 0.43 | 0.42 | 0.41 | 0.39 | 0.33 | 0.35 | 0.34 | 0.35 | 0.36 | 0.39 | 11 | |
| Qinghai | 0.31 | 0.41 | 0.52 | 1.00 | 0.60 | 0.29 | 0.24 | 0.24 | 0.38 | 0.44 | 0.39 | 0.36 | 0.34 | 0.39 | 0.42 | 7 | |
| Ningxia | 0.41 | 0.39 | 0.30 | 0.32 | 0.52 | 0.83 | 0.89 | 0.93 | 0.35 | 0.31 | 0.30 | 0.37 | 0.39 | 0.39 | 0.48 | 3 | |
| Xinjiang | 0.24 | 0.23 | 0.25 | 0.26 | 0.26 | 0.31 | 0.32 | 0.35 | 0.34 | 0.29 | 0.34 | 0.36 | 0.31 | 0.38 | 0.30 | 19 | |
| Provinces/Provincial Power Grids | Abatement Costs | |||
|---|---|---|---|---|
| Mean (Yuan/ton in 2013 Price) | Rank | CV | Rank | |
| Beijing | 711 | 3 | 0.142 | 12 |
| Tianjin | 594 | 20 | 0.155 | 9 |
| Hebei | 615 | 13 | 0.087 | 20 |
| Shanxi | 590 | 21 | 0.188 | 6 |
| Inner Mongolia | 560 | 25 | 0.039 | 27 |
| Liaoning | 612 | 14 | 0.055 | 24 |
| Jilin | 558 | 26 | 0.093 | 16 |
| Heilongjiang | 606 | 15 | 0.041 | 26 |
| Shanghai | 560 | 24 | 0.179 | 8 |
| Jiangsu | 619 | 12 | 0.052 | 25 |
| Zhejiang | 694 | 4 | 0.023 | 30 |
| Anhui | 464 | 29 | 0.386 | 2 |
| Fujian | 656 | 6 | 0.089 | 18 |
| Jiangxi | 628 | 11 | 0.079 | 21 |
| Shandong | 631 | 10 | 0.093 | 17 |
| Henan | 603 | 18 | 0.065 | 23 |
| Hubei | 654 | 7 | 0.104 | 15 |
| Hunan | 650 | 8 | 0.089 | 19 |
| Guangdong | 711 | 2 | 0.026 | 28 |
| Guangxi | 674 | 5 | 0.153 | 10 |
| Hainan | 722 | 1 | 0.147 | 11 |
| Chongqing | 646 | 9 | 0.296 | 4 |
| Sichuan | 597 | 19 | 0.118 | 14 |
| Guizhou | 466 | 28 | 0.332 | 3 |
| Yunnan | 569 | 23 | 0.137 | 13 |
| Shaannxi | 605 | 17 | 0.068 | 22 |
| Gansu | 578 | 22 | 0.182 | 7 |
| Qinghai | 512 | 27 | 0.271 | 5 |
| Ningxia | 444 | 30 | 0.388 | 1 |
| Xinjiang | 605 | 16 | 0.024 | 29 |
© 2018 by the authors. Licensee MDPI, Basel, Switzerland. This article is an open access article distributed under the terms and conditions of the Creative Commons Attribution (CC BY) license (http://creativecommons.org/licenses/by/4.0/).
Share and Cite
Yan, Q.; Wang, Y.; Baležentis, T.; Sun, Y.; Streimikiene, D. Energy-Related CO2 Emission in China’s Provincial Thermal Electricity Generation: Driving Factors and Possibilities for Abatement. Energies 2018, 11, 1096. https://doi.org/10.3390/en11051096
Yan Q, Wang Y, Baležentis T, Sun Y, Streimikiene D. Energy-Related CO2 Emission in China’s Provincial Thermal Electricity Generation: Driving Factors and Possibilities for Abatement. Energies. 2018; 11(5):1096. https://doi.org/10.3390/en11051096
Chicago/Turabian StyleYan, Qingyou, Yaxian Wang, Tomas Baležentis, Yikai Sun, and Dalia Streimikiene. 2018. "Energy-Related CO2 Emission in China’s Provincial Thermal Electricity Generation: Driving Factors and Possibilities for Abatement" Energies 11, no. 5: 1096. https://doi.org/10.3390/en11051096