Gas Supply, Pricing Mechanism and the Economics of Power Generation in China

1
School of Economics and Management, North China Electric Power University, Beijing 102206, China
2
Beijing Key Laboratory of New Energy and Low-Carbon Development, North China Electric Power University, Beijing 102206, China
*
Author to whom correspondence should be addressed.
Energies 2018, 11(5), 1058; https://doi.org/10.3390/en11051058
Submission received: 28 March 2018
/
Revised: 20 April 2018
/
Accepted: 24 April 2018
/
Published: 25 April 2018
Abstract
:During the “13th Five-Year Plan” period, green energy is the top priority for China. China has realized that natural gas, as a low-carbon energy source, fits with the nation’s energy demand and will play a critical role in the energy transition, but the actual industry development is slower than expected. By analyzing the major gas corporations around the world, the paper finds that the key factors of the sector are supply and price of the energy resource. A comprehensive analysis on domestic and foreign imported gas reveals a trend of oversupply in China in the future. Given the critical import dependence, China has introduced a series of gas price reforms since 2013, which have led to negative impacts on important gas consumption sectors including power generation. With the levelized cost of electricity (LCOE) model, we find that under the prevailing gas supply structure and price level, the economy of utility gas power generation will remain unprofitable, while combined cooling heating and power (CCHP) is only commercially feasible in coastal developed regions. If continuing, such a trend will not only bring forth disastrous consequences to gas power industry, but also damage the upstream gas industry, more importantly, impede the energy transition. We conclude the paper with policy implications on pricing mechanism reform, developing domestic unconventional gas and the R&D of gas turbine.
1. Introduction
The essential energy policy of China is to increase the contribution of natural gas on the whole in recent years [1], resulting from natural gas’s lower emissions of carbon dioxide and air pollutants. China’s energy supply has been dominated by coal power, making China the world’s largest emitter of carbon dioxide, which is obviously unsustainable. Natural gas is generally considered a kind of cleaner energy much less polluting than coal [2]. Therefore, replacing coal with natural gas is an important component of the strategy for the transformation of China’s sustainable development targets [3]. At present, gas accounts for about 6% of China’s primary energy supply [4], which is well below the global average of 24%. According to the China National Energy Strategy Action Plan announced in 2014. Gas’s proportion will exceed 10% by 2020 [1].
Overall, China’s natural gas power generation (NGPG) has only just started. Compared with the USA or UK where NGPG installed capacity is more than one-third of the total installed capacity, NGPG is still less prominent in China [5]. In the light of the China Electricity Council (CEC) public figures, China’s NGPG installed capacity is 66.37 GW accounting for only 4.35% of the national total capacity, and the gas generation is about 165.8 TWh with an increase of 24.4% accounting for only 2.9% of the total in 2015 [6]. Currently, coal, hydropower and wind power are the top three power sources in China, accounting for 59.01%, 20.95% and 8.57% of the total, respectively [7]. Due to the environmental pollution and ecological destruction in recent years, the traditional power structure dominated by coal-fired power has been criticized for the fact that the utilization hours dropped significantly from 4778 h in 2014 to 4364 h in 2015.
As an efficient, clean and flexible energy, NGPG is highly regarded. China’s future target is to gradually increase the proportion of NGPG in the power source mix [8]. To achieve the above objective, China must address the issue of NGPG first. This article is devoted to looking for a solution for the overall industry chain. Firstly, by comparing the development status of the natural gas industry (NGI) in China and major gas-developed countries, the successful experience of NGI in major natural gas-developed countries is summarized and enlightenment about the development of China’s NGI could be obtained. On this basis, we examine the basic situation of the upstream industry of the NGI chain of analyzing and forecasting the supply of natural gas in China. Furthermore, this article analyzes the future trend of China’s downstream natural gas market from the perspectives of consumption potential and pricing reform. Finally, considering the development of the whole NGI chain. This paper applies to LCOE model to quantitatively calculate the real cost of NGPG, and puts forward the relevant policy recommendations.
This article is organized as follows: Section 2 compares and analyzes the development status of NGI in China and major gas-developed countries. Section 3 analyzes and forecasts the natural gas supply in China. Section 4 examines the future trend of China’s natural gas consumption and the pricing reform. Section 5 calculates the real cost of NGPG employing LCOE model and the final section summarizes the paper and make several policy recommendations.
2. Development Status of NGI
2.1. NGI Development Process in the US
Under the dual guarantee of natural gas reserves and environmental protection laws, the US has become the global leader in gas production and consumption. In 2010, the proven reserves in the US are 7.7 trillion m3, ranking sixth in the world. The development of the US NGI includes three stages: start-up period (before 1945), development period (1945–1970) and the mature stage (after 1970) [9].
At the start-up period, the initial size of the US NGI was low. The infrastructure such as gas pipelines continued to be improved, and the scope and scale of utilization gradually expanded [10]. After 1945, all local governments successively issued various policies of natural gas, like designation of wellhead fees and collection of pipe fees, etc. The price of natural gas was in a cost-added manner and took the interests of producers and consumers into consideration in 1945–1970, so the price of natural gas was lower than that of the alternative fuels, resulting in the rapid development of the NGI in this period. With the vigorous construction of infrastructure, the output and consumption of natural gas rapidly increased with an average annual increment of 19.4 billion cubic meters (bcm) and growth of 7.1%. In 1945, gas consumption exceeded 100 bcm. In 1963, the US Congress adopted the Clean Air Act, accelerating the adjustment of the energy consumption structure. In 1973, a consumption of 624 bcm was recorded.
Since the 21st century, with the revolutionary exploitation of shale gas, the cost and price of conventional gas have dropped sharply, which has further stimulated the consumption of the downstream market [11]. The production increased from 500 bcm in 2005 to 600 bcm in 2010, with an average annual growth rate of nearly 4%. In 2009, the US surpassed Russia and became the world’s largest producer of natural gas with shale gas accounting for 23% of the total.
The gas consumption structure in the US has basically changed in a balanced manner [12]. As shown in Figure 1, power generation played a crucial role in the increase of downstream market consumption. Gas consumption for power generation surpassed that of residents and was classified second in the consumer structure in 1988. In 2012, it surpassed industrial gas consumption and reached the top spot. In 2016, NGPG (34%) exceeded coal power generation (30.4%) and became the dominant power source in the US. According to Figure 1, it could be seen that industry is the major driving force in the NGI development stage of the US. After entering the mature period, the consumption in the municipal and commercial areas has stabilized, making power generation being the most important driving force for the growth of natural gas consumption.
The reasons why the US gas industry could achieve such great success can be roughly summarized in the following aspects:
- (1)
- Abundant resource reserves. From 1945 to 1970, the US discovered 185 gas fields with 12.47 trillion cubic meters (tcm). The output maintained rapid growth, laying the foundation for the development and expansion of the NGI.
- (2)
- Competitive prices. In the rapid advance period, the price of gas was only 15–25% of oil and 25–40% of coal. Obviously, gas has advantages over coal and petroleum.
- (3)
- Perfect infrastructure. From 1950 to 1970, trunk pipelines increased from 175,000 to 404,000 km. By 1966, the whole nation had gradually become integrated in an interconnected pipeline, which created the conditions for the gas market to expand. As of 2015, the total length of the US piping has reached 550,000 km and the distribution lines have reached 2 million km.
- (4)
- Strict environmental protection policies. From Air Pollution Control Act of 1955 to Clean Air Act of 1963, Air Quality Control Act of 1967 and the Clean Air Act of 1970, the US gradually managed to create a normative environmental law system, of which the most important achievement was the establishment of air quality labeling. This reflected the superiority of gas as a kind of clean energy.
2.2. NGI Development Process in European
In 2010, combined cooling heating and power (CCHP) in Europe accounted for 18% of total power generation and made CO2 emissions decrease of 150 million tons [13]. Like the US, the rapid development of gas consumption in the UK also took about 30 years (1970–2000), with an average annual increment of 2.9 bcm and growth of 7.4% [10,12]. In 2000 the gas consumption in the UK reached a peak of 96.8 bcm. The development of the North Sea gas field was the foundation for natural gas use in the UK and the environmental issue was the key to promoting natural gas consumption. In the early days of NGI in the UK, gas was mainly consumed to control smog, which is very similar to China’s predicament. Since 1990, due to the breakthrough of gas turbine technology, both NGPG capacity and generation have been progressively spreading. In 2015, the generation accounted for 27% of the total consumption in the UK. The driving forces behind the success of NGI in the UK can be summarized as follows:
- (1)
- Managing smog was an opportunity for the UK to rapidly develop natural gas. Environmental problems in London prompted the government to promulgate the Clean Air Act in 1952, which put forward measures to ban the emission of black smoke, raised the height of chimneys and established a smoke-free zone.
- (2)
- The exploitation of the North Sea gas field provided a resource base for natural gas consumption.
- (3)
- Competitive pricing boosted the pace of development. The price of natural gas in UK was linked to oil price to maintain a reasonable parity relationship.
European economies represented by Britain and other developed economies have successfully formed a competitive natural gas market, following the process of moving from monopoly to free market economy in the reform of NGI [12]. The biggest difference between the development of NGI in Europe and China is that gas is more competitive than other energy sources in Europe, because European natural gas is an abundant resource with lower prices, which is the significant point for the expansion of the gas market. Besides, the European environmental protection policies and laws are very stringent, making discharging pollutants subject to paying heavy taxes, which improves the economic efficiency of natural gas consumption.
2.3. Inspiration to China’s NGI Development
In the process of energy transformation in other countries, the energy structure adjustment has mostly followed the trend of “reducing coal and increasing gas” [12,14]. In recent years, China has strongly advocated its energy transformation and many experts agree that gas is very essential in this process. The evolution of NGI in all countries has relied heavily on power generation. Throughout the gas utilization all over the world, industrial fuel account for 40%, power generation is 37%, urban gas is 21% and transportation is 2% [15]. In major gas-developed countries like the UK and Japan, the natural gas consumption for power generation is responsible for 71% of the total consumption and 65% corresponds to the latter part of the rapid development period of the NGI, respectively [10]. According to China’s specific national conditions, successful development of the NGPG industry will determine the success of China’s energy restructuring to a certain extent. It is worth noting that China is transforming the mode of economic development and implementing energy conservation and emission reduction to drive the energy structure transitionf. What’s more, haze phenomena have forced clean energy usage to grow, making the share of coal consumption drop from 71.1% in 2006 to 66% in 2013 [16]. Thus, it can be concluded that the development background of China’s NGI is similar to that in the UK that achieved the restructuring of the energy structure by decreasing the proportion of coal consumption in the process of industrial structure optimization and smog control.
From the experience of major gas-developed nations, there are four major driving forces for the growth of natural gas consumption (Figure 2), which are all closely linked to the economy of NGPG. In terms of policies, China has promulgated some effective and specific policies in recent years and clearly defined its strategic positioning. For example, in October 2011, the China National Energy Administration (NEA) issued Guidance on the Development of Distributed Natural Gas Resources Opinions which are the first guidance on distributed energy [17]. In equipment, the government has attached great attention to the development of gas turbines, so as to fundamentally change the status quo of China’s gas turbine use which is lagging behind the world average [18]. In 2014, Shanghai Electric invested 400 million euros to acquire a 40% stake in Ansaldo Energy, one of the world’s top five heavy-duty gas turbine suppliers, which is a key step for breaking the deadlock [19].
Although China’s NGPG industry has made remarkable achievements in recent years, there still exist many obstacles. First and foremost, the harshest obstacle is “high price” and “difficult grid connection”, which hinders and plagues its development. Secondly, it is a widespread sense that China’s energy resource mix is characterized by rich coal, less oil and least gas. Finally, the upstream natural gas price is higher, making the economy and competitiveness of NGPG projects inferior. To solve the three problems of China’s NGI development, it makes sense to investigate whether the gas supply can meet the downstream market’s demand in the future, why gas prices are so high, and how the gas price reform influences the entire industrial chain. Besides, it is equally meaningful to explore the current economic level of NGPG in China, including both centralized and distributed forms.
3. Analysis on China’s Natural Gas Supply
3.1. Domestic Gas Production
In the traditional view, China’s fossil fuels are characterized by “rich coal, less oil and least gas”, with reserve-production ratios of 62%, 12% and 29%, respectively [20]. However, with the improvement of China’s exploration technology, the understanding of the reserves of fossil fuel is being constantly refreshed. According to the latest round of dynamic national oil and gas resource assessment results released by the Ministry of Land and Resources (MLR) in 2015, China’s conventional gas reserves were 18%, indicating that China’s natural gas resources are stable and there is still a great potential for exploration and exploitation [21].
3.1.1. Conventional Natural Gas Supply and Prospects
At the end of 2014, China’s conventional gas production was 1.5 tcm and remaining recoverable resources were estimated at 38.5 tcm. In 2014, China’s natural gas newly-added proven geological reserve was 1036.4 bcm, with an increase of 77%, exceeding 1 tcm for the first time. The 2013 National Dynamic Assessment of Oil and Gas Resources promulgated by MLR in 2015 showed that China’s conventional natural gas geological resources amount was 68 tcm and recoverable resources amount was 40 tcm, with an increase of 33 tcm and 1.8 bcm, respectively, compared with 2007 [21]. Meanwhile, 12 tcm of proven reserves were ascertained, which is merely 18%, revealing that China has rich reserves of gas.
3.1.2. Unconventional Natural Gas Supply and Prospects
According to the evaluation of coalbed methane (CBM) resources completed by the MLR in 2009, the geological resources are estimated to be 36.81 tcm with a depth of less than 2000 m, which is ranked third in the world [22]. In 2014, CBM proven reserves totaled 60.093 bcm, 1.5 times more than last year [21]. New proven technologies showed recoverable reserves are 30.503 bcm, with an increase of 159% over the previous year. From 2010 to 2014, China’s CBM production was on an upward trend (Table 1). In February 2015, the NEA issued the CBM Exploration and Development Action Plan, setting a more detailed and explicit target for CBM in the “13th Five-Year Plan” period [23].
From 2009 to 2012, MLR evaluated the shale gas potential [24]. The evaluation object comprised of 41 basins (regions), 87 evaluation units and 57 shale gas-bearing formations. The results showed that there are some 134 tcm of shale gas resources (excluding Qinghai-Tibet region) and 25 tcm of recoverable resources in China.
The success of the US in shale gas has inspired China to greatly appreciate and promote the exploration and development of shale gas. Three Chinese state-owned oil enterprises have formulated new policies on this emerging unconventional gas at the same time. The State Council and local governments have formulated a series of policies to assist shale gas exploitation. In 2012, the Ministry of Finance (MF) and NEA required the central finance system to subsidize mining enterprises with a standard of 0.4 yuan/cm for 2012–2015 [25]. In 2015, MF and NEA decided to develop a new subsidy policy with a standard of 0.3 yuan/cm for 2016–2018 and 0.2 yuan/cm for 2019–2020 [26]. By the end of 2014, the total investment in shale gas reached 23 billion yuan and resulted in ideal exploration results (Table 2). Geological reserves of shale gas have attained nearly 500 bcm, of which only 1.3 bcm were produced in 2014 [27].
In terms of coal gas, at the end of the 11th Five-Year plan, National Development and Reform Commission (NDRC) approved four demonstration projects in Inner Mongolia, Liaoning and Xinjiang [28]. During the 12th Five-Year Plan period, 17 projects were approved with a total supply capacity of 70 bcm per year [29]. However, due to the environmental impact caused by the mining process, the prospects of coal gas are not optimistic, and the scope of production and use will also be restricted in the future.
Based on the data of China’s domestic natural gas resources, it can be estimated that the domestic supply capacity will reach 175 bcm by 2020 (Figure 3). According to 13th Five-Year Plan, by 2030, the total supply capacity will reach 235 bcm [30]. It is obvious that both conventional and unconventional natural gas is relatively plentiful in China.
However, all of the above estimations are under ideal conditions. Actually, we need to analyze the above data from a quantitative point of view. Any kinds of unsatisfactory conditions will cause a certain amount of compression. First of all, the biggest impact issue comes from downstream markets. Future growth of the downstream market is a key factor affecting gas’s expansion, but right now the situation is not optimistic [31]. If such a weak state can’t be changed as soon as possible, the upstream production and investment will be squeezed in the coming years. As mentioned before, the development of NGPG industry not only plays a major role in the adjustment of the national energy structure, but also matters in promoting the development of upstream industries. For conventional natural gas, if the market does not recover in time, it can be conservatively estimated that the production will be 130 bcm in 2020, and the surplus in such circumstances is 100–200 bcm [32]. If demand can resume rapidly, it is still expected the production target of 185 bcm can be reached by 2030.
Secondly, the current level of technology and equipment as well as the cost of mining is important. Currently, the circumstances of unconventional gas are more complicated. Although the exploration is corroborated by various policies, the outlook is not affirmative. The geological conditions, the lack of core technologies, the lag of the equipment and the overlap of mineral rights lead to interest disputes between coal enterprises and CBM enterprises [33]. In addition to economic problems, environmental issues are also the major challenges. In the context of China’s low carbon and environmental protection policy, the prospect of coal gas will be too bright. Although shale gas is considered to be very promising by the Chinese government and has made remarkable achievements, the gradual decline of consumption downstream can’t be alleviated [34]. Furthermore, the exploration and mining costs of shale gas are higher, making the upstream companies have no motivation to invest. Hence, whether China’s shale gas industry can succeed as much as the US depends on whether the demand in the downstream market can stimulate the Chinese upstream gas suppliers.
3.2. Natural Gas Imports
3.2.1. LNG Supply and Prospects
China became a liquified natural gas (LNG) importer in 2006 and surpassed Spain as the third largest importer in the world in 2013. In 2014, China imported a total of 19.5 million tons of LNG, with an increase of 10.3% over 2013 and accounting for about 8% of total global trade. The LNG receiving stations of the three major companies CNPC, Sinopec and CNOOC imported 5.39 million tons, 210,000 tons and 14.25 million tons of LNG, respectively, of which more than 80% are long-term trade. In 2016, China consumed 210.3 bcm and produced 138.4 bcm of LNG, with a gap of 71.9 bcm.
As of November 2015, 11 LNG receiving stations were made available for operation with a total capacity of 47.8 million tons/year. In addition, there are five more stations under construction and two stations under expansion with a combined capacity of 21 million tons/year. Even if only the above five innovation projects and two expansion projects are added during the “13th Five-Year Plan” period, the designed capacity of imported stations will exceed 70 million tons/year in 2020, fully meeting the import needs [35].
Meanwhile, the construction of small and medium sized transfer stations is also accelerating. Following the Shanghai No. 5 Ditch and Dongguan Jiufeng, the third LNG transfer station was put into operation in Chengmai, Hainan Province in 2014. Fangcheng port in Guangxi, Guanghui and Shenzhen reserves peak shaving project is also in construction, and now have entered the pre-production status.
According to the contracts signed by the three major companies and their overseas projects, the total supply of LNG long-term contracts that China can implement in 2030 will exceed 40 million tons/year, and the supply of these agreements and receive ability are basically matched (Figure 4). In recent three years, China’s long-term trade contracts are entering a window of implementation, and the total additional resources have exceeded the amount of imported LNG in 2014, which means that coastal areas are required to add nearly 10 bcm of new market space annually for imported LNG resources. In addition, the three major companies are also involved in the Canadian LNG project, and China and the US signed the largest long-term contract (amounting to 253.5 billion U.S. dollars) in history in 2017, including the import of LNG, the development of shale gas, and the cooperation in the development of natural gas in Alaska [36]. These agreements offer an important guarantee for the future supply of LNG.
Built on the above discussion, the maximum supply capacity of LNG imported into China is determined by the receiving capacity of the LNG receiving stations. By 2020, after the above-mentioned projects are put into operation, the capacity will surpass 60 million tons/year, and will exceed 80 million tons/year in 2030. More investors will participate since China has no special restrictive policies on the trade of natural gas and construction of LNG terminals.
According to the convention and rules of “take-or-pay-off” in global natural gas transactions, the signed contract amount determines the minimum amount of imported [37]. China’s LNG supply in 2020 will exceed 40 million tons/year, and reach about 55 bcm/year, which can provide space for peak season across the quarter gas storage although less than the design capacity of receiving stations. It should be noted that some contracts may implement the minimum gas consumption standards or transfer LNG to other countries. However, considering spot imports, the actual quantity should not fall below the contract imports. In 2030, with the complete liberalization of China’s natural gas market, the capacity of LNG receiving terminals will mount to 100 bcm a year or even more, with an average annual increase of about 4.5 bcm.
3.2.2. Piped Gas Supply and Prospects
In the past decade, China has constructed several long-distance intercontinental transport pipelines to distribute natural gas in the northwest, southwest, northeast and at sea. The northeastern China-Russian gas pipeline is also under construction in an orderly manner. At present, China has two gas import channels including Central Asia Pipelines (CAP and Burma Pipelines (BP). Between them, CAP have put three lines into operation (A, B and C) with a combined transmission capacity of 55 bcm/year, and Burma line can reach 12 bcm/year. Meanwhile, there are D-Line of Central Asia gas pipeline and the China-Russian East Line natural gas pipeline under construction, with a transmission capacity of 30 bcm/year and 38 bcm/year, respectively. In 2014, the total import volume of piped gas in China was about 31.3 bcm, with an increase of 14% over 2013 (Table 3).
In May 2014, China-Russia eastern gas purchase and sales contracts were signed between CNPC (Beijing, China) and Gazprom Industrial Co., Ltd. (Moscow, Russia) with contractual gas supply of 38 bcm/year and a supply period of 30 years. In August 2015, Gazprom claimed that it will start providing natural gas to China from 2019 to 2021 [38]. For the continued construction of long-distance pipelines in China’s four major gas sources and the future accession of the US, China’s piped gas supply is guaranteed.
To sum up, if China-Russia eastern pipeline is operational, the total imported design capacity will reach 105 bcm/year by 2020. However, due to the gradually increasing period of gas supply, the actual imports in 2020 should be 60–70 bcm/year [39]. At present, the speed of construction of East Line is accelerating and it is expected to be completed in two years. Moreover, the D-Line in Central Asia and the China-Russian West Line project may start construction or even finish during 13th Five-Year plan period. Of course, this depends on the domestic market demand. If the demand cannot match the needed scale, the NDRC may slow down the pace of projects. After all, the construction cost of the long-distance trans-national pipeline is expensive.
Coupled with the amount of LNG, in 2020, the total amount of China’s natural gas imports will be 122 bcm/year. By 2030, with the complete liberalization of China’s natural gas market, China’s total natural gas imports will reach 265 bcm/year.
All of the above figures are the subject of the debate and prospects of the supply of natural gas, reflecting the situation of the upstream NGI in China, which is also the difference between China and the major gas-developed countries like the US and the UK. At present, China’s natural gas market has not reached the level of the US and the UK, and the upstream natural gas supply is still dominated by the three state-owned enterprises, CNPC, Sinopec and CNOOC. Besides, the exploitation rights of major gas fields, the ownership of long-distance pipelines, LNG receiving stations and the import rights of gas are all monopolized by them. As shown in Figure 5, the particularity of China’s natural gas industrial structure is obvious and is not expected to ungergo major changes in a short period.
4. Analysis on China’s Natural Gas Consumption and Price
4.1. Consumption Potential of China’s Natural Gas Market
Through the discussion in the previous section, China’s natural gas resources provide sufficient space for the development of the market, and the key is whether China’s natural gas market has the potential in the future to absorb the resources provided by upstream industries. After years of rapid growth, China has become the third largest gas consumer in the world [40]. However, the main indicators of gas consumption remain at a low level. For instance, China’s per capita gas consumption was 135 m3/year in 2014, while the global average was 467 m3/year. Compared with developed countries, China’s natural gas market is still in infancy and there will be more room in the future (Figure 6). According to the development experience of the US and the UK, China’s NGI will develop rapidly in the next 30 years [10]. Based on the world average level, China’s 1.4 billion people will consume more than 650 bcm of natural gas each year in the future, most of which are used to replace coal.
It is estimated that natural gas will become the world’s second largest energy source, accounting for about 25% of global energy consumption by 2030 due to the drastic increase in demand for NGPG [41]. Besides, controlling atmospheric pollution and responding to climate change is the important factors in promoting the development of natural gas market. Figure 7 shows the comparison of the non-renewable energy consumption structure between the world average and China in 2015, revealing that the proportion of coal consumption in China is much higher than the world average, while the proportion of natural gas consumption is far below the world average. The 13th Five-Year Period is an important period for China to adjust the structure and improve the mechanism of the natural gas market. The implementation of environmental protection policies and the success of the reform of the natural gas market will be the key factors affecting the development of China’s natural gas market.
China’s natural gas consumption rose from 46.4 bcm in 2005 to 167.6 bcm in 2013 with an average annual growth rate of 17.4% (CNPC, 2014) [42]. As Figure 8 shows, the share of natural gas rose from 2.6% in 2005 to 6.4% in 2013 (National Bureau of Statistics, 2015). In 2013, the contribution of natural gas is well below than those of coal and oil, which are 66% and 18%, respectively. According to the 12th Five-Year Plan, the target natural gas consumption will be 230 bcm in 2015, while the actual amount was only 193.2 bcm [43].
As of 2013, industry remained the largest gas user in China (Figure 9), consuming about 5 bcm gas (31% of total), followed by the residential sector (19% of the total) and power and heating sector (18% of the total). Except for chemical industries, the volumes of gas use in other sectors have increased substantially, showing that China’s gas policies that discourage using gas as a raw material for the chemical industry and encourage power industry to shift from coal to natural gas to address air pollution and reduce CO2 emissions (NRDC, 2012) worked [44]. However, there is still a certain gap between the natural gas consumption structures in China and the US or the UK.
From 2000 to 2013, the natural gas consumption in power generation, gas and water production and supply industries increased from 0.81 bcm to 25.73 bcm with an average annual growth rate of 30.4%, much higher than that of total social electricity consumption, of which most are used for NGPG. To carry forward the sustainable development, breaking the bottleneck in the management of power and natural gas industries as well as the hardware constraints of gas turbine equipment is required.
NGPG is part of the most promising industries in NGI. In 2014, the installed capacity of NGPG in China is 55.67 GW, accounting for 4.1% of the total and power generation of NGPG are 118.3 TWh, accounting for 2.2% of the total, less than the world average [45]. If China can reach the world average level, China’s downstream natural gas market will have a potential of at least 100 bcm. From the perspective of energy replacement, if half of direct-fired coal which is nearly 1.2 billion tons can be replaced by natural gas, about 300 bcm of market space can be created [46]. Hence, it can be anticipated that China’s NGPG industry has a broad space for development. According to NGPG demand forecast in 13th Five-Year Plan released by the CEC [47], by 2020, China’s NGPG scale will be 100 GW, of which 40 GW are distributed, consuming 56.4 bcm of natural gas. With abundant supply of natural gas, a breakthrough will be achieved in the automation of gas equipment. By then, the NGPG industry will continue its rapid development. By 2030, the installed capacity of NGPG will exceed 200 million kW and the gas consumption will reach 142 bcm, making the NGPG industry become the second largest consumer segment of China’s natural gas market in the future. According to the “13th Five-Year Plan” of China, per capita natural gas consumption will reach approximately 207 cubic meters/person in 2020. According to the “13th Five-Year Plan” of China, per capita natural gas consumption will reach approximately 207 cubic meters/person in 2020, of which the gas demand for manufacturing, power generation and heating and residents will be 116.6 bcm, 56.4 bcm and 47.9 bcm. By 2030, the gas consumption of NGPG industry will reach 142 bcm, making NGPG become the second largest gas consumer sector in China, preceded only by residential gas consumption (Figure 10).
In line with the above discussion, China’s gas supply and demand are loose in the short-term and stable in long-term. As showed in Figure 11, the domestic natural gas market will remain oversupplied for a long time. At present, China is actively constructing an urban transmission and distribution network and LNG storage. Due to the oversupply of natural gas, China’s major enterprises will have to reduce domestic output and limit importing resources to balance the market. Besides, reducing upstream investment is another effective means. As a result, the production of unconventional natural gas such as shale gas, CBM and coal gas will decline owing to the high mining costs. Meanwhile, construction of imported gas pipeline may be delayed, and the disbursement agreement of LNG can only be sold at lower prices in the international market. According to the current quantity, the market space left for domestic gas is only about 160 bcm. Natural gas prices in China also forced the NDRC to implement a nationwide gas price reform in 2010 due to the year-on-year increasing foreign dependence, which may affect the downstream NGI a lot, and this is what will be discussed next.
4.2. China’s Natural Gas Prices Reform and Its Impacts
Thanks to the tremendous resource potential and production capacity, China’s natural gas price has been at a low level for a long time, and the government-led resource allocation mode worked repeatedly, determining the gas price based on the “cost-plus-profit” model [48]. However, in order to develop the natural gas-related industries and provide stable and reliable resources to the domestic market, China’s natural gas outputs increased from 27.2 bcm in 2000 to 32.2 bcm in 2014 with an annual growth rate of 11.8%, but it was still lower relative to the growth rate of gas consumption. From Figure 12, it could be observed that there is a gap between China’s natural gas production and consumption, and the foreign dependence of natural gas has been increasing. At that time, the government did not realize that the import of natural gas would have a huge impact on domestic natural gas price. Until 2008, China maintained the natural gas price at a low level rely on its domestic resource potential. However, as the external dependence increased, it is difficult to maintain the balance.
Before 2010, China practiced the old gas pricing system based on the domestic production costs [49]. After 2010, with the increase of LNG imports and piped gas, the gate price under the old price system was significantly lower than imported price, causing many gas suppliers to suffer serious losses. Moreover, the previous mechanism can’t reflect the gas demand changes because it is linked with the supply costs only [50,51]. Therefore, in 2010, China introduced a new mechanism to establish a link between the price of natural gas and the price of imported fuels and to change the domestic gate stations pricing methods from the original “cost-plus-profit” to the “net return value of the market”, making the market mechanism play a bigger role in the pricing process [52,53]. The new mechanism contributes to solving the issues like huge corporate losses and tight market supply caused by inversion of price.
The main difference between the old and new pricing systems is the calculation of wellhead costs [54]. Under the former, wellhead price is largely based on actual production costs. But in the latter, it is calculated by subtracting the pipe fee from the city gate price for international volume in Shanghai (PCGPIN). This reform is generally intended to narrow the price gap between domestic and imported gas and reduce the losses of upstream. However, China’s natural gas prices were on the rise after the reform, and the reasons behind it are worth discussing.
4.2.1. Impacts on Gas Producers and Importers
As shown in Figure 13, China’s gas market is different from the US or the UK ones. It is a essentially a complete monopoly. There are hardly any private enterprises that can obtain the rights of exploitation and importation. The three companies own and operate over 90% of the natural gas infrastructure, production, import, transportation and storage businesses. CNPC is China’s largest natural gas supplier and pipeline operator, accounting for 67.3% of China’s domestic natural gas supply in 2013.
Taking PetroChina as an example, Figure 14 compares the profitability of PetroChina’s gas and pipeline business under the old and new pricing models. Under the old pricing model, the ex-plant pricing approach was applied for both domestic and imported pipeline gas. According to its 2014 annual report (PetroChina, 2014) [55], PetroChina earned about 40 billion yuan on the sales of natural gas and pipeline operations in 2012. At the same time, they paid about 42 billion yuan for importing gas from Central Asia. As a result, the company lost 2 billion yuan in 2012. In 2013, PetroChina paid a similar amount for importing gas, but after the introduction of the new pricing system in 2013, PetroChina earned about 71 billion yuan from the sales of natural gas and pipeline operations. As a consquence, PetroChina obtained a net profit of about 29 billion yuan (or about 5 billion dollars) in 2013.
The details of the difference in performance in 2012 and 2013 can be illustrated by price information provided in Figure 15. It can be concluded that value-added tax (VAT) included border prices of pipeline imports were similar in 2012 and 2013, indicating that the reform did not have a significant impact on the price of imported natural gas. However, ex-plant prices at Xinjiang which were 5.50 $/MMBtu in 2012 but 10.1 $/MMBtu in 2013, were quite different, making PetroChina obtain a profit of 28.9 billion yuan in 2013 [52,55,56].
4.2.2. Impacts on End Users
As distributors, if the increased price can’t be transferred to the end users, the profits will be greatly affected. Gate price is controlled by NDRC and the retail price was supervised by the local governments. From the perspective of social stability, the government will not allow a large increase in residential gas prices. Quite the opposite, it will keep the residential gas prices of end users at a low level. Figure 16 presents the retail price for the residential sector, the city gate price for existing volume gas supply and the city gate price for incremental volume gas supply in the first adjustment period (from 10 July 2013 to 31 August 2014) (CNPC, 2014; NDRC, 2013) [55,56]. The retail price for the residential sector is lower than the city gate price for the incremental volumes in most provinces, and for some provinces (e.g., Xinjiang, Ningxia, Sichuan and Jiangsu), it is even lower than the city gate price for the existing volumes, meaning that the natural gas use in the residential sector is subsidized either by the government or by other end users, which is exactly the opposite in Europe and the US. However, it would be hard to maintain the current residential gas price level if the city gate prices keep changing.
As the third largest natural gas sector, Power & Heating is especially sensitive to changes in natural gas prices. Figure 17 provides a comparison between the prices of different users in Beijing, Shanghai and Zhejiang during the initial adjustment period. The prices of gas used for heating are mostly regulated by local governments, while the price of gas used for power generation is regulated by the China’s central government. The price level of gas use in the power sector varies by province, but it is larger than the residential sector in all provinces. Local governments often provide subsidies for space-heating in households, as well as for power generation that contributes to regional air pollution control. Therefore, the profitability of the power sector depends heavily on subsidies from the local governments. Based on natural gas prices (shown in Figure 18 as 12.10 $/MMBtu for Beijing) and electricity price (also regulated by the China’s central government), it can be estimated that in Beijing the gas-fired combined heat and power (CHP) plant takes a loss of 0.11 yuan/kWh of power supply due to the increased gas price associated with the new pricing approach [55,56].
Although natural gas prices will have an overall impact on the entire downstream industry, natural gas is uniquely used as a raw material in some industries such as industry, transportation and chemical industry. However, the NGPG industry will be affected seriously. First of all, apart from NGPG, coal power, wind power, photovoltaic power and hydropower are available, which may reduce the proportion of NGPG. Besides, power industry is highly competitive, while NGPG industry takes natural gas as an input, whose economic efficiency will inevitably suffer a certain degree of detriment due to the increasing natural gas price.
As mentioned before, regardless of the fact that China’s domestic gas resources are abundant, it seems difficult to achieve the plan targets at once due to technical, economic, environmental and market-specific factors. From the perspective of supply balance, market will prioritize the long-term imported gas that has signed contracts before 2030. Domestic gas is just an important measure that regulates the balance between supply and demand. Besides, China’s major gas companies have benefited from the reform. The remaining natural gas resources that have not yet been mined in China are of poor quality and are difficult to reconnaissance and exploitation, and their mining costs are constantly increasing, resulting that the gas enterprises trend to continue importing natural gas rather than mine higher-cost domestic gas. Thus, domestic gas yield and R & D progress will slow down, and the foreign dependence of gas will keep rising.
If using the gas imported from Turkmenistan, taking Guangdong as an example, the cost will not be lower than 2.63 yuan/m3. If LNG is invoked as a gas source, the cost price to Guangdong province will not be less than 2.18 yuan/m3. The cost of natural gas used for NGPG in US is 0.876 yuan/m3. It can be therefore concluded that China’s NGPG is at a disadvantage when using imported natural gas.
Through the above discussion, we know that the supply of gas in China will be in an oversupply situation by 2030. Now, energy supply will stimulate development of downstream industry more than hinder it. However, due to the features of supply structure, the price will be high after the reform, which will seriously affect the economic efficiency of downstream industries. It is noteworthy that NDRC re-approved the national pipeline transmission fee and lowered the non-residential gas gate price (0.1 yuan/m3) on 29 August 2017, so as to decrease the cost of downstream business [57]. This demonstrates that the government has realized the negative impact of high gas prices. It is undeniable that the price reform will drive the changes in all downstream sectors. Depending on the new mechanism, the maximum profit comes from the wellhead fee because pipeline transmission fee has not enough space. In the future, balancing the interests between upstream and downstream industries should be the key point.
5. Cost Measurement of China’s NGPG
5.1. LCOE Model
The levelized cost of electricity (LCOE) refers to the cost of generating electricity per kilowatt hour during the construction and operation cycle of a power generation project [58]. It is a widely accepted method for calculating the cost of generating electricity with high transparency [59,60,61,62,63]. In this paper, we will use LCOE model to calculate the power generation costs of three major forms of NGPG. The costs of centralized NGPG will be calculated separately according to the base load and peak regulation. By calculating the ratio of the discounted value of the total cost of the 100 MW centralized NGPG project from initial construction to operation to the economic value of its energy output over the life cycle, the levelized discounted cost (electricity cost) a gas-fired power plant is obtained. The derivation process is as follows: considering the time value of the costs, we regard P as the present value, F as the final value and r as interest rate, then NPV is the set of multiple present values. LCOE can be defined based on identity of the NPV of revenues equals to the NPV of costs [58,59]:
Equation (1) represents the NPV of the revenues equals to the NPV of the costs. The product of LCOE and En is the total revenue of the system during its life cycle. Equation (1) can be transformed identically to yield Equation (2):
In the model, the annual fuel cost is assumed to increase at a rate of 2%. Based on the above formula, a complete calculation formula for LCOE is derived:
Because of the difference between distributed and centralized energy supply, when using LCOE model to calculate CCHP system, we need to make some adjustments to the model. Introduce Formulas (3)–(6) into Equation (2), and the LCOE of a CCHP system is calculated based on the Formula (7):
The meanings of symbols in above formulas are reported in Table 4.
The calculation formulas needed include:
- Fixed costs = depreciation + financial expenses + operating expenses
- Financial costs = total investment × annual interest rate
- Depreciation = total investment × annual depreciation rate
- Return on investment = total investment × self-owned funds × annual rate of return
- Loan Interest = Total Investment × Borrowed Funds × Liabilities Return
- Gas station fuel costs = gas consumption per kilowatt-hour × gas price
Heat converted electricity = heat supply/(per kilowatt-hour energy contained in the heat electricity compression COPheating coefficient) where COP is the coefficient of performance.
The cost of centralized NGPG, whether as a base load or a distributed form, is basically the same as that of traditional coal-fired power generation. Direct power generation costs generally include total investment depreciation costs, operating and maintenance costs and fuel costs. Generation cost plus the return on capital and loan interest constitutes the feed-in tariff. That is, when the generation cost is constant, an economic evaluation index such as internal rate of return and return on investment will form the lowest feed-in tariff. The ultimate-goal of this paper is to construct a LCOE model based on some financial evaluation indicators to calculate the real power generation cost of NGPG using the known data, which can make a reasonable analysis on the project investment income. Meanwhile, when building the LCOE model of CHP units, in addition to the direct on-grid electricity, heating calories should be measured and converted into electricity. Power supply systems referred in this article are all CHP models and the peaking units are not involved in heat supply and are calculated via the amount of on-grid electricity.
5.2. Model Parameters
5.2.1. Centralized Scenario
NGPG units generally need to take both base load and peak load at the same time. Under normal circumstances, annual utilization hours of peaking units are 1400 h and those of base load units are 4500 h. This paper chooses the centralized NGPG projects in typical provinces (Shanghai, Beijing, Zhejiang, Jiangsu, Guangdong and Hubei) as the representative units for analysis. In the parameter setting part, the price of gas is determined by the provincial Price Bureau. In terms of utilization hours, due to the peak-adjusting unit involved, the average utilization hours for each province were set varying from 2600 to 4000 h. The unit investment cost of the power plants was set at 3000 yuan. The service life was 20 years. The annual interest rate was 6% and the after-tax internal rate of return was 8%. Specific circumstances and industry data are established in Table 5.
The average unit capacity of the national centralized NGPG project is 300 MW, and the average gas price is 3.27 yuan/m3. Combined with additional parameters, the final calculated on-grid electricity price is 0.8716 yuan/kWh, of which 68% are the cost of gas. It is clear that the price of natural gas is the most important factor affecting the on-grid price of centralized NGPG projects. The result is regarded as a standard situation to measure.
When the centralized NGPG is used for peak load, the parameter setting is a little different from that of the base load, as shown in Table 6. Specifically speaking, a new parameter named electric compression coefficient is added and its value is placed at 3 in this paper. Taking Beijing as an example, the heating time in winter is 2880 h. Natural gas consumption per kilowatt-hour will be slightly different at different periods. If it is only used for power generation, gas consumption will be 0.2 m3/kWh. If it is used for power generation and heating, it will be 0.25 m3/kWh. For the convenience of calculating, set the time ratio of the two cases to 3:1 and the gas consumption of NGPG is 0.21 m3/kWh.
5.2.2. CCHP Scenario
In terms of the analytical framework, there is a difference in energy supply between centralized and distributed NGPG. To facilitate the model calculation, it is necessary to make a few changes to the model and parameters. For CCHP energy project unit, LCOE refers to the comprehensive cost of electricity generated, that is, the ratio of all costs incurred during operation of the CCHP energy system to all the energy supplied by the project. In this paper, the energy generated during the life cycle of a CCHP energy system includes not only the electricity generated by the gas turbine, but also the cold and heat energy provided by the system.
According to the characteristics of CCHP energy system that is capable of using the heat generated by the combustion of natural gas in stages, and the energy calculation method in this paper, the heat utilization of natural gas after complete combustion is divided into four parts (Figure 18). Energy flow 1 present the electricity generated by high-grade heat, and its heat utilization rate is λ, which is the thermal efficiency of gas turbine power generation. Energy flow 2 and 3 mean the cold and heat energy generated by middle-grade heat, whose utilization rate is η-λ. In the actual operation of the CCHP system, this part of heat is unlikely to be fully utilized, so in this article we introduced two ratio parameters called Un and Dn. When these two parameters change, energy flow 2 and 3′s size will change accordingly. Energy flow 2 is the cold and heat energy which CCHP system generated and consumed by consumers, and energy flow 3 is the unused cold and heat generated by the system. Overall, the energy flows 1 and 2 represent the utilized energy, and energy flow 3 and 4 means the lost energy caused by the low system efficiency and the lack of consumer market.
In this paper, the LCOE of CCHP system is calculated by measuring the total costs and energy outputs in the life cycle of the entire system. Because distributed energy supply is more complex than centralized one, the following parameters have been added to estimate the LCOE of distributed NGPG projects, as shown in Table 7. Besides, the parameter values for estimating the LCOE of distributed NGPG project need to make a slight modification based on Table 5.
Table 8 shows the parameter values in basic scenario and their floating ranges. Specifically, assuming that there are policies to support the remaining electricity to be on the grid, 90% of the electricity generated by the CCHP energy system is consumed, and the electricity consumption is allowed to fluctuate at 2% when conducting sensitivity analysis. Although the total efficiency of CCHP system can reach more than 80%, this paper set the benchmark value of 80% considering actual operational situation. Gas turbine operating hours are in the range of 4000–6000 h, and in benchmark scenario the value is 5000 h. Cold and heat consumption ratio refers to the proportion of cold and heat energy that can be bought out of the system. Due to the operation strategy of “determine the amount of electricity based on heat”, the economic efficiency of the system is outstanding, while the system is more dependent on the grid. In this paper, the cold and heat consumption ratio is set to be 70% in the basic scenario. In the sensitivity analysis, the LCOE of the system is considered separately when the consumption of cold and heat is low (40%) and high (100%). Compared to the traditional power generation equipment, the unit cost of CCHP system is higher, resulting difficulties in financing. Hence, this article sets no bank loans under the basic scenario. Cooling and heating time is 5832 h based on Beijing’s air conditioning opening hours, so the ratio is set to be 0.666. For different power grids, the cost of overpassing is about 40 yuan/MWh. Since the cost of overpassing is small, it isn’t considered when calculating the LCOE in this paper.
5.3. Calculation Results and Interpretation
5.3.1. Utility-Scale Gas Power
According to the parameter values of basic scenario, LCOE electricity prices of NGPG base load and peak load in the whole country are calculated. Table 9 displays the results, from which it can be seen that in the base load scenario, the LCOE of NGPG is 0.1324 $/kWh, and that a peak-shaving scenario is 0.1539 $/kWh. China’s average feed-in tariff is 0.11 $/kWh, lower than the LCOE of both load and peak scenarios.
As a peculiar use of NGPG, the peaking unit is flexible, and the cost is lower than that of conventional coal-fired units. Although the cost of gas-fired peaking unit is high, it also required to bear some efficient and flexible peak shaving tasks to ensure the electricity demand. Peak power price earnings can largely ease the pressure of business survival, because its load is generally peak load with high gold content. China’s current gas turbine start-up and peak-shaving mechanisms are established based on the two-part price. It will consume 800,000 m3 gas when gas turbine starts and stops once, at a cost of 213,600 yuan, which is gone far beyond the amount of government compensation. Besides, peaking units will stop and start more frequently due to its working principle, coupled with the hidden costs like overhauling costs and maintenance costs. Therefore, even in the peak-subsidy system, the economy of peaking unit is still poor. Most of the contemporary peaking gas units are of commonweal, playing a regulatory role. Moreover, to maintain the operation of peaking units, the government must subsidize these units for a long-term, which is a large financial burden on the government (Table 10).
For the LCOE structure of NGPG units, fuel costs accounted for 83% of the total cost in base-load units, and that in peaking unit accounted for 61% to 64% of the total, which can be explained by the scale effect. The generating capacity of base-load units are higher than peaking units, resulting that the return on capital equalized to per unit of electric power, taxes and depreciation costs of base-load units are less than those of the peaking units. According to the LCOE model, with a coal price of 87.6 $/ton, the fuel cost of a 600 MW coal-fired unit is about 0.038 $/kWh, accounting for about 63% of the total, which is similar to the proportion in NGPG. However, the absolute values of fuel costs of NGPG are 2.4 to 2.8 times that of coal-fired power generation. Obviously, the main reason for low economic competitiveness of NGPG lies in the high gas prices. Keeping extra parameters in LCOE model unchanged, if gas price reduces to 0.29 $/m3, the electricity price calculated by LCOE will be 0.098 $/kWh, consistent with the on-grid tariff of gas-fired electricity prescribed by Beijing Municipality.
From the composition of LCOE in Table 8, it could be seen that the on-grid electricity price of gas-fired electricity directly determines the competitiveness of NGPG, while the gas price in China is generally high after the gas pricing reform. In the southeastern provinces such as Shandong and Hunan, the gas prices are above 0.46 $/m3. At present, the prices of natural gas in many parts of the US are 0.09–0.12 $/m3, which is less than one-third of the gas price in China. This is likewise the main reason why natural gas in the US can flourish and replace coal-fired power.
Figure 19 presents the LCOE of centralized NGPG in base load in different provinces, revealing that the LCOE in Guangxi is highest, followed by Shandong and Anhui, and that in Yunnan is lowest. Furthermore, this paper selects six typical provinces and cities, that is, Shanghai, Beijing, Zhejiang, Jiangsu, Guangdong and Hubei, and these areas are all have sufficient supply and developed NGPG early. Figure 17 shows the comparison between the on-grid tariff and the LCOE of gas-fired electricity in the six typical areas, supposing that power utilization hours are 3500 h.
As can be observed from Figure 20, the LCOE of gas-fired electricity in different provinces is higher than the corresponding on-grid electricity prices announced by the typical provinces and cities. Only in Hubei is the on-grid electricity price comparable to the LCOE result, while in other provinces the difference between the two tariffs is around 0.046 $/kWh. Particularly, in Guangdong Province, the geographic location makes it need long-distance pipeline to transport natural gas, causing the natural gas is costly due to the high transportation fee. With the expansion of coastal LNG receiving stations, using LNG may reduce the cost of NGPG, but the poor economic efficiency of NGPG in Guangdong is still serious. Therefore, many companies just have to rely on government subsidies to make up their costs and are in low profits or even have a loss. In the future, if China’s carbon emissions trading market matures, the operation of NGPG industry will be even worse.
As fuel costs account for a higher share of total costs, reducing natural gas prices is critical to improve the economic efficiency of NGPG. If 1 m3 natural gas can produce 6 kWh of electricity, it is necessary to reduce gas prices by 0.28 $/m3 to make up the gap of 0.046 $/kWh. Besides, improving utilization hours and reducing unit cost can improve the project’s economic efficiency.
5.3.2. CCHP
According to the relevant literature, it can believe that the installed capacity per MW can cover about 50,000 square meters of building area. Therefore, in the commercial agglomeration area and the areas with high demands on cold, heat and electricity, it should select appropriate capacity of the unit and the thermoelectric ratio according to the actual need. In this scenario, it is still assumed that units of different capacity have good planning and policies promoting redundant power be on grid are perfect. Based on the basic operating parameters in the previous section, we can obtain the value and structure of LCOE of a CCHP system under separate capacities.
Under this scenario, the LCOE of CCHP system with different capacity is 0.1045–0.1137 $/kWh. LCOE become lower with the increase of unit capacity and heat utilization efficiency. With the same unit of fuel costs, large-capacity units have advantages. From the perspective of cost components (Figure 21), fuel costs make up about 85% of the total cost regardless of unit size.
To better understand the economy of CCHP energy system in different environments, this paper calculated the difference between the commercial electricity price and the LCOE of the 30 MW generating units in various provinces in China according to the climate characteristics, natural gas prices and commercial electricity prices of different provinces, as shown in Figure 22. It can be seen from the calculation results that in different regions, due to the different hot and cold supply time, natural gas prices and electricity prices, the profitability of various regions varies a lot. Overall, the loss-suffering provinces are mainly concentrated in the areas where the hot and cold supply time is depleted or the natural gas prices are high. Only in the economically developed eastern part of China has the CCHP energy system better economic efficiency under the standard scenario. This result shows that the LCOE mentioned in the previous section can reflect the economic efficiency of NGPG in the conditions that hot and cold supply time ratio reaches a certain level, which is determined by the objective climatic condition of the area CCHP energy system locates. If no other way to reduce costs is found, the future development of CCHP energy system in China will be greatly limited.
It can be seen from the calculation results that the proportion of fuel cost is the largest among the LCOE components in both centralized and distributed units. Furthermore, the sensitivity analysis technique is employed to observe the impact of fuel cost on the economic efficiency of NGPG in the two scenarios, respectively.
5.4. Sensitivity Analysis
5.4.1. Utility-Scale Gas Power
Sensitivity analysis is used to amend only the corresponding sensitivity factor in the baseline scenario to observe the impact of this factor on the overall LCOE. The results show that among the various factors affecting the centralized NGPG project, gas price is the most significant. The lower the natural gas price, the lower the overall cost.
In the case of a centralized genset, the analysis is based on the base-load. Figure 23 shows how LCOE changes when natural gas prices fluctuate, keeping other factors unchanged. Gas price has a significant positive effect on LCOE with a linear relationship. Supposing the power generation hour is 3500 h. The sensitivity coefficient of gas price to LCOE is 0.235 yuan/kWh, indicating that the LCOE will increase 0.235% when gas price increases 1%. As showed in Figure 24, when gas price rose from 2 yuan/m3 to 3.2 yuan/m3, the LOCE increased by 0.28 yuan/kWh, or 21%.
Taking Beijing and Shanghai as examples, the LOCE price just matches the current on-gird price when gas price reduced to 2 yuan/m3. In 2013, Shanghai implemented a single on-grid electricity price system. In October, the on-grid electricity price increased by 5 fen to 0.504 yuan/kWh, and the gas price also rose 0.4 yuan to 2.72 yuan/m3. If 1 m3 gas generates 5 kWh electricity, it means the cost of NGPG increased by nearly 8 fen/kWh, the power price increases 5 fen/kWh, remaining a gap of 3 fen/kWh to enterprises. By December 2015, Shanghai Municipality adopted a two-part on-grid price system to regulate the price standard, announcing that the monthly capacity price is 45.83 fen/kW, the electricity price is 0.4856 yuan/kWh and the converted electricity power price is 0.64 yuan/kWh. This price is much higher than the previous single electricity price, helping to ease the survival pressure of NGPG enterprises partly. According to the subsidies and electricity price diverting methods adopted by various provinces, in the three regional power grids, North China Power Grid, South China Power Grid and East China Power Grid, where NGPG is more concentrated, government subsidies and electricity price adjustment across the entire grid are adopted to make up the gap between NGPG on-grid tariff and coal-fired benchmark price, and the amount of subsidies and adjustments are shown in Table 11.
5.4.2. CCHP
Factors influencing the LCOE for CCHP systems under distributed scenarios are numerous. The results of the sensitivity analysis show that natural gas prices, energy consumption and on-grid power volume are the three major ones.
Firstly, the impact of fuel prices on the LCOE of the overall system is primarily concerned, mainly because fuel costs account for about 85% of total costs. As natural gas prices rise, the LCOE for all types of capacity units will inevitably increase (Figure 24). For units with different capacity, if the price of natural gas is set at 2 yuan/m3, the LCOE will be 0.56–0.6 yuan/kWh. In this scenario, CCHP system has a definite economic efficiency, revealing that natural gas prices affect the future development of NGPG market heavily.
Secondly, important factors affect the LCOE such as the ratio of the consumption of hot and cold energy. The ratio of the time of cooling and heating and the consumption of electricity, can be collectively referred to the proportion of total energy consumption. For units with different capacities, LCOE showed a downward trend when the hot and cold consumption ratio increased. When the ratio rises, the LCOE will drop 0.19–0.25 yuan/kWh. The increase of hot and cold time will make the LCOE decrease around 0.08 yuan/kWh. Finally, if on-grid power volume drops 20%, the LCOE will rise 0.1 yuan/kWh. Therefore, to reduce the costs of CCHP energy systems, it is necessary to take into account the local cold and heat demand and choose the high demand regions under the premise of meeting the power supply demand, making CCHP systems output higher cold and heat energy stably in a long run. Besides, better policies promoting excess power be on grid are important. However, China is not sufficient work in these aspects. If China can’t further seek ways to reduce costs, development size of CCHP will be limited.
From the above analysis, it is not hard to see that the core issue affecting the development of NGPG is natural gas price. The NGPG (especially centralized) still needs financial subsidies to realize the return on investment, which is not conducive to the expansion of industrial scale. Although China has promulgated downward adjustment policies on natural gas prices, it is not enough to help the NGPG industry to have a viable economic efficiency. Besides, China’s degree of dependence on imported natural gas is high, resulting the high natural gas prices in China due to the expensive long pipeline transportation costs and the low development of conventional and unconventional natural gas. Natural gas price reforms have benefited upstream companies, but downstream companies have suffered heavy losses. It is worth noting that China are strengthening the expansion of LNG imports in an attempt to improve the economic efficiency of the NGPG industry in coastal areas. However, according the above analysis, it is impossible to save NGPG enterprises in China by importing natural gas. The exploitation of unconventional oil and gas resources such as shale gas in the future may lower the price of natural gas, but it will hardly change in the short term. Therefore, China’s NGPG industry will be at a long-term trough before 2030.
6. Conclusions and Policy Implements
6.1. Conclusions
Overall, the resource endowment of China’s natural gas by 2030 is no longer an obstacle to the development of the natural gas market. According to the previous discussion, the natural gas market in China is in oversupply situation before 2030. Therefore, the upstream supply may become a catalyst to promote the development of the downstream natural gas market. As the sector with the most potential industry in the downstream natural gas market, the growth of NGPG industry is crucial to the development of China’s NGI and the transformation of the energy structure. However, the economic efficiency of NGPG is poor, making NGPG be unable to form a favorable competitive edge with the coal-fired power, wind power and other power generation industries.
From the LCOE calculation results, in a centralized scenario (including the base load and peak shaving), the LCOEs in most provinces in China are higher than the on-grid tariff, indicating that industries without autonomous profitability can’t survive in the highly competitive electricity market. Although the peaking units have made a tremendous contribution to peak shaving, the subsidy of more than 100 million yuan a year for a single unit has become the government’s financial burden. In the distributed scenario, LCOE has different sensitivities to the influencing factors, of which the natural gas price, energy consumption and on-grid power volume are the three major ones. Besides, according to the national economic map, CCHP system will have a certain economic efficiency when having a better planning in the economically developed areas in the southeast of China. Because the LCOE of CCHP system is affected by the hot and cold energy output a lot, the profit is low or even negative in areas which are less developed with moderate climate and low commercial electricity prices.
According to the analysis of this article, the fundamental reasons for the scanty profit of NGPG industry are the high production cost of natural gas and the unreasonable on-grid tariff mechanism. Specifically, the fuel cost directly determines the market competitiveness of NGPG industry. As suggested by LCOE results and sensitivity analysis, the proportion of fuel costs in the total cost too high, resulting in low profit rates in NGPG projects. What’s more, gas pricing reform has had a huge impact on the downstream market, especially on NGPG industry. After the reform, which is generally intended to narrow the price gap between domestic and imported gas, China’s natural gas prices were on the rise, causing the upstream gas suppliers gained huge benefits while the downstream industries suffered a great loss.
China is keen to complete the transformation of energy structure as soon as possible. Natural gas, as a type of clean energy, can help China to accomplish this task. The development of NGPG is the key to the prosperity and development of NGI. At present, China’s gas policies and resource supply provide more favorable protection for the advance of NGPG industry. The next gas pricing reform of China not only determines the future development of NGPG in China but also determines the success or failure of China’s energy restructuring. If China’s future natural gas supply structure can be transformed toward that of the USA, China’s NGPG industry will usher in a new period of rapid development.
6.2. Policy Implement
To improve the profitability of the NGPG industry in China, it must work in both upstream and downstream markets from the aspects of infrastructure, gas price reform, improving the electricity pricing system and deepen the natural gas market at the same time, not simply find a solution from the downstream market.
(1) From the equipment perspective, the long distance natural gas pipeline network and its ancillary facilities should achieve lead-forward development, which can promote the rapid transfer of natural gas resources from the western resource-rich areas to the coastal markets and ensure the development and expansion of China’s NGI. Although China has initially formed a national gas pipeline network framework, the gas distribution network is still far from mature and some city level administrative areas have not yet been connected to natural gas pipelines. As of 2014, the total length of natural gas pipelines in China is 435,000 km, of which the length of gas transmission pipelines is about 65,000 km, equivalent to that of USA in the 1950s. In the future, China’s natural gas pipeline construction will focus on import channels, export routes, regional liaison lines and the “last mile” pipeline. Firstly, depending on the situations of resources for implementation and market development, further build and improve the import channels. Relying on the natural gas resources in eastern Russia and Central Asian countries, continue to enhance the gas supply capacity in the Bohai Sea and Yangtze River Delta, the interconnection and interoperability among LNG receiving stations, and the mutual gas supply capability of coastal areas. Secondly, speed up the progress of shale gas research and development in China and the progress of the construction of coal gas projects in Xinjiang and Inner Mongolia, and construct auxiliary transmission lines to increase gas supply capacity. Thirdly, raise the national and regional natural gas pipeline network level, improve the utilization rate of the pipeline network and enhance the flexibility of transportation, ensuring the reliability of supply and promoting the regional coordinated development.
(2) For gas pricing in the upstream market, prices in competitive aspects like gas source price, city gate price and terminal sales price should be fully liberalized, according to the principle of “regulated in the middle, open at both ends”. Specifically, 1) the gas measurement pricing method should be revised from measurement or valuation based on flow or quality to measurement and valuation based on energy (calorific value); 2) establish and improve the implementation measures involving seasonal gas prices, peak gas prices and stored gas prices; 3) straighten out residential gas prices and eliminate cross-subsidies for municipal and non-civil gas prices, determining gas prices for residents according to the actual cost of gas supply. It is noted that the gas prices for residents with special needs and difficulties should retain appropriate subsidies or relief. Totally, the purpose is to create a natural gas pricing mechanism that is suitable for China’s natural gas resource endowment and NGI development stage, reflecting the gas supply cost, market supply and demand situation and gas product diversification.
Besides, it is necessary to strengthen the government’s pricing regulation in the transmission and distribution sectors to standardize the gas price in upstream market. Specifically, (1) in accordance with the principle of “allowable costs plus reasonable benefits”, the government should formulate specific management measures and corresponding adjustment mechanisms on inter-provincial and provincial pipe transportation prices as well as urban gas prices hierarchically and in classification; (2) the government should strengthen the supervision and examination on network investment, operation and maintenance costs, improving the level of information disclosure, and all localities need to supervise and control the natural gas pipeline transportation and distribution fees in the province to reduce the excessive price; (3) reduce unnecessary intermediate links to encourage large users to use piped natural gas directly; (4) regulate various fees and charges of natural gas distribution and distribution enterprises, striving to reduce the terminal gas cost and helping the NGPG industry to enhance profitability. Previous gas pricing reforms have enable the upstream gas companies to earn lot. The next policy adjustment should give more consideration to the interests of downstream enterprises. In the future, the greatest challenge for China’s natural gas development will may be the government’s decision-making in balancing the interests of upstream and downstream enterprises.
For industries in the downstream market, NGPG is not only an important component of the power supply structure, but also the most important driving force for the development of natural gas market and an important factor driving the transformation of China’s energy structure. At present, China’s NGPG installed capacity and generating capacity volume are both low, reminding us to pay attention to the following three priorities in the future development of China’s NGPG: Firstly, orderly develop natural gas peaking power plants to enhance the level of energy integration. Promote the integration of NGPG and renewable energy power generation and guarantee the power security of medical power load center. Secondly, develop natural gas co-generation according to local conditions to improve environmental quality. Encouragement to develop co-generation projects with stable heat load in key areas preventing air pollution like the economic and technological development zones and high-tech industrial park and to moderately develop co-generation projects with heating in heating areas. Thirdly, vigorously promote distributed natural gas, improving energy quality. In major metropolitan areas, such as large-scale commercial integrated service areas, universities and high-tech industrial parks, speed up the development of distributed natural gas resources and increase the comprehensive utilization of natural gas.
For both centralized and distributed NGPG, the development must rely heavily on government supports and policies in China’s current market environment. In view of the numerous problems encountered in the development of the NGPG industry, it is necessary for policymakers to play a key leading role in formulating guiding policies and regulations to ensure development of the industry orderly and efficiently. The introduction of some transformation policies and measures about NGPG development is focusing on supporting policies and implementation details, is important. In this way, the advantages of NGPG industry can be reflected and recognized by the market and the general public, improving the competitiveness of NGPG in the power industry and the energy market.
At present, the core technology of China’s NGPG is not mastered, requiring expensive imported equipment which raises the overall price of NGPG. Although domestic manufacturing enterprises can produce and assemble gas-fired generator sets, substantial breakthroughs in key technologies like complete machine design, manufacture of hot component materials, and cooling and thermal insulation coatings production have not yet been made, resulting that the thermal components such as gas turbine combustors and turbine blades still completely dependent on imports. Besides, high maintenance costs also make NGPG enterprises unsustainable. For instance, the maintenance costs of a matrimonial F-class unit are generally more than 30 million yuan/year. In response to these problems, it is suggested that proactive financial and research policies should be put in place to speed up the core technology research of NGPG equipment to realize the localization of core equipment and form an industrial system with independent intellectual property rights, which helps to reduce the initial project construction costs and routine maintenance costs. What’s more, government should encourage banks to invest in NGPG projects to reduce the investor’s initial funding pressure.
It can be anticipated that the prosperity of China’s NGI will bring many positive results. The first is to encourage the development of China’s natural gas upstream industries, avoiding the phenomenon of selling natural gas at a low price. Meanwhile, development of China’s NGI can effectively absorb the imported natural gas as well as promote the domestic conventional and unconventional natural gas exploitation. Furthermore, efficient low-carbon power generation techniques represented by NGPG can be well combined with renewable energy. Not only can it effectively reduce carbon emissions and improve environmental quality, but also can help China to optimize the energy consumption structure to achieve a green and low-carbon economic growth path, which is precisely the ideal development model for China.
Author Contributions
Feng Yun Li and Yuanxin Liu designed the research ideas and methods for articles, Xinhua Yu collected the data needed and Feng Yun Li completed the empirical analysis and wrote the paper.
Acknowledgments
Thanks to Li Bingkang and Zhang Haonan for proofreading the language of this paper, and this paper is supported by the 2017 Special Project of Cultivation and Development of Innovation Base (No. Z171100002217024).
Conflicts of Interest
The authors declare no conflict of interest.
References
- National Energy Administration. Energy Development Strategy Action Plan (2014–2020); National Energy Administration: Beijing, China, 2014. (In Chinese)
- Polaris Power Network. Natural Gas Is Not a Transitional Energy but the Main Clean Energy. Available online: http://news.bjx.com.cn/html/20160630/746993.shtml (accessed on 30 June 2016).
- Chai, Q.; Zhang, X. Technologies and policies for the transition to a sustainable energy system in China. Energy 2010, 35, 3995–4002. [Google Scholar] [CrossRef]
- NBS Online Database. China Energy Status Statistics. 2014. Available online: http://data.stats.gov.cn/english/easyquery. htm?cn=C01 (accessed on 17 February 2018).
- Polaris Power Network, Prospects of China’s Natural Gas Power Generation Market in the 13th Five-Year Plan. Available online: http://news.bjx.com.cn/html/20160510/731708.shtml (accessed on 10 May 2016).
- Flushing Finance. The Present Situation and Prospect of Natural Gas Power Generation in China. Available online: http://stock.10jqka.com.cn/20161116/c595041249.shtml (accessed on 16 November 2016).
- Polaris Power Network. Grid-Connected Solar Capacity Operated by State Grid Corporation of China Reaches 32.8GW. Available online: http://guangfu.bjx.com.cn/news/20151124/684447.shtml (accessed on 24 November 2015).
- Xinhua Network. China Will Vigorously Increase the Scale and Proportion of Natural Gas Consumption. Available online: http://www.xinhuanet.com/2016-06/29/c_1119136489.htm (accessed on 29 June 2016).
- Fuliang, L.; Xunyun, H.; Jinyun, W.; Guozhong, S.; Genhai, W. Deepwater Oil and Gas Exploration Status and Trends in the World and Implications for China. China Pet. Explor. 2007, 6, 28–31, 76. [Google Scholar]
- Gao, S. Enlightenment from the development of foreign natural gas market. Int. Pet. Econ. 1999, 4, 1–6. [Google Scholar]
- Zhang, H.; Zhang, W. Experiences and Enlightenment of the Development of Natural Gas Industry in the United States. Int. Pet. Econ. 2009, 6, 22–25. [Google Scholar]
- Li, H.; Pan, C. Regulation of Natural Gas Industry in the United Kingdom and the United States and Its Reference. Chin. Energy 2011, 33, 22–25. [Google Scholar]
- Wang, Z.; Han, W.; Zhang, N.; Liu, M.; Jin, H. Proposal and assessment of a new CCHP system integrating gas turbine and heat-driven cooling/power cogeneration. Energy Convers. Manag. 2017, 144, 1–9. [Google Scholar] [CrossRef]
- Yu, H. Large increase in natural gas demand: The main promoter is coal to gas. New Energy Econ. Trade Rev. 2017, 11, 46–47. [Google Scholar]
- BP Group. BP Energy Outlook. 2017. Available online: http://www.bp.com/content/dam/bp/pdf/energy-economics/energy-outlook-2017/bp- energy-outlook-2017.pdf (accessed on 16 March 2018).
- BP Group. BP statistical review of world energy June 2014. In BP World Energy Review; BP Group: London, UK, 2014. [Google Scholar]
- National Development and Reform Commission. Guidance on the Development of Distributed Natural Gas Resources Opinions; National Development and Reform Commission: Beijing, China, 9 November 2011. (In Chinese)
- Farmer, R. Gas Turbine World 2012 GTW Handbook. Gas Turbine World 2012, 29, 42–44. [Google Scholar]
- China Securities Network. Shanghai Electric Acquires 40% of Italian Gas Turbine Enterprises for 400 Million Euros[EB/OL]. Available online: http://stock.caijing.com.cn/2014-05-11/114171737.html (accessed on 11 May 2014).
- BP Group. BP Statistical Review of World Energy June 2017. In BP World Energy Review; BP Group: London, UK, 2017. [Google Scholar]
- Xinhua Network. The National Oil and Gas Resources Dynamic Evaluation Results Announced. Available online: http://www.xinhuanet.com/politics/2016-06/14/c_129059473.htm (accessed on 14 June 2016).
- Ministry of Land and Resources of the People’s Republic of China. National Oil and Gas Resources Dynamic Evaluation 2010; Ministry of Land and Resources of the People’s Republic of China: Beijing, China, 25 November 2011. (In Chinese)
- National Energy Administration. CBM Exploration and Development Action Plan; National Energy Administration: Beijing, China, 16 February 2015. (In Chinese)
- Ministry of Land and Resources of the People’s Republic of China. The Results of Investigation and Evaluation of the National Shale Gas Resource Potential and Optimization of the Favorable Areas Announced. Available online: http://www.mlr.gov.cn/wszb/2012/yyqzy/ (accessed on 1 March 2012).
- Ministry of Finance, National Energy Administration. Notice on Issuing Shale Gas Development and Utilization Subsidy Policy; Ministry of Finance, National Energy Administration: Beijing, China, 2012. (In Chinese)
- Ministry of Finance, National Energy Administration. Notice on Shale Gas Development and Utilization Financial Subsidy Policy; Ministry of Finance, National Energy Administration: Beijing, China, 2015. (In Chinese)
- Lu, Z. Shale gas industry in China. Int. Pet. Econ. 2016, 24, 48–54, 90. [Google Scholar]
- Baidu Library. Is There Any Prospect for China’s Coal Gas Production? Available online: https://wenku.baidu.com/view /3b41ff0a168884868762d6c9.html (accessed on 29 January 2015).
- Intellectual Research Group. China Coal Gas Market Depth Evaluation and Future Development Trend Report (2015–2022); Intellectual Research Group: Beijing, China, 2015; pp. 1–3. [Google Scholar]
- National Development and Reform Commission. Notice on Printing and Exporting the “13th Five-Year Plan” of Petroleum and Natural Gas Development; National Development and Reform Commission: Beijing, China, 2016. (In Chinese)
- Li, C. Large increase in demand and reserves are lagging behind in parallel Natural gas prices have skyrocketed as a result of downstream plant shutdowns. Securities Daily, 30 November 2017; p. C02. [Google Scholar]
- Lin, B. Where is the space for natural gas demand growth? China Securities Journal, 9 August 2017; p. A04. [Google Scholar]
- Baidu Library. The Development of Coalbed Methane Needs to Eliminate the “Stumbling Block”. Available online: https://wenku.baidu.com /view/410cab3aa8956bec0875e36b.html (accessed on 19 March 2015).
- Baidu Library. China’s Shale Gas and Its Downstream Industry Prospects. Available online: https://wenku.baidu.com/view/ f1a497b4f705cc17552709c5.html (accessed on 11 May 2014).
- Zhao, A. Optimistic outlook for the global LNG carrier market: The Chinese market is worth the wait. China Ocean Shipp. 2018, 2, 64–66. [Google Scholar]
- Dongmei, L. Promoting Sino-U.S. Trade Cooperation and Improving LNG Supply Capacity. China Electric Power, 9 December 2017; p. 006. [Google Scholar]
- Huang, Z.; Zhang, X. Characteristics of Take-or-Pay Contract in International Energy Transactions and New Trends. Sino-Glob. Energy 2011, 16, 1–6. [Google Scholar]
- Netease News. Russia’s Supply of Natural Gas to China May Be Postponed to 2021. Available online: http://news.163.com/15/ 0827/13/B21FS23R00014AEE.html (accessed on 27 August 2015).
- Zhou, D. Prospects for China’s natural gas supply. China Foreign Energy 2017, 22, 89. [Google Scholar]
- China Social Science Network. The Domestic and Overseas Oil and Gas Industry Development Report 2013 Released. Available online: http://www.cssn.cn/jjx/jjx_dt/201401/t20140117_946173.shtml (accessed on 17 January 2014).
- Cao, Y. Seven years later natural gas may replace coal to take energy as “second place”. Sinopec, 2 March 2018; p. 005. [Google Scholar]
- China National Petroleum Corporation. Domestic and Overseas Petroleum and Natural Gas Industry Development Report 2013; China National Petroleum Corporation, Economics & Technology Research Institute: Beijing, China, 2014. [Google Scholar]
- National Development and Reform Commission. Notice on Printing and Exporting the “12th Five-Year Plan” of Natural Gas Development; National Development and Reform Commission: Beijing, China, 22 October 2012. (In Chinese)
- National Development and Reform Commission. Natural Gas Utilization Policy; National Development and Reform Commission: Beijing, China, 14 October 2012. (In Chinese)
- Xiao, B.; Niu, D.; Guo, X. Can natural gas-fired power generation break through the dilemma in China? A system dynamics analysis. J. Clean. Prod. 2016, 137, 1191–1204. [Google Scholar] [CrossRef]
- Ma, Z.; Xiao, H. Research on the path of doubling natural gas consumption in the 13th Five-Year Plan. Macro Econ. Manag. 2017, 7, 38–44. [Google Scholar]
- Polaris Power Network. “13th Five-Year” Natural Gas Power Demand Forecast and Policy Research. Available online: http://news.bjx.com.cn/html/20140404/501905.shtml (accessed on 4 April 2014).
- Zhao, L. China’s natural gas pricing dilemma-reflections on China’s natural gas reform. Int. Pet. Econ. 2011, 1, 98–106. [Google Scholar]
- Corbeau, A.S.; Volk, D.; Sinton, J.; Jiang, J.; Ping, J.; Teng, T.; Boshu, L.; Fen, Y. Gas Pricing and Regulation. China’s Challenges and IEA Experience; International Energy Agency: Paris, France, 2012. [Google Scholar]
- Yijun, L. Evolution and trend of natural gas pricing mechanism in China. Nat. Gas Ind. 2015, 35, 107–116. [Google Scholar]
- Paltsev, S.; Zhang, D. Natural gas pricing reform in China: Getting closer to a market system? Energy Policy 2015, 86, 43–56. [Google Scholar] [CrossRef]
- National Development and Reform Commission. Notice on Adjusting the Natural Gas Prices 2013; National Development and Reform Commission: Beijing, China, 28 June 2013. (In Chinese)
- National Development and Reform Commission. Notice on Straightening Out Natural Gas Prices for Non-Residents; National Development and Reform Commission: Beijing, China, 26 February 2015. (In Chinese)
- Hu, A.; Dong, Q. On natural gas pricing reform in China. Nat. Gas Ind. B 2015, 2, 374–382. [Google Scholar] [CrossRef]
- Baidu Library. China National Petroleum Corporation Annual Report 2014. Available online: https://wenku.baidu.com/view/ 091c841826fff705cd170a02.html (accessed on 30 December 2015).
- National Development and Reform Commission. Notice on Regulating Issues Concerning the Management of On-Grid Tariff of Natural Gas Power Generation; National Development and Reform Commission: Beijing, China, 31 December 2014. (In Chinese)
- National Development and Reform Commission. Notice on Reducing the Price of Non-Residential Natural Gas Reference Gate Stations; National Development and Reform Commission: Beijing, China, 29 August 2017. (In Chinese)
- Ueckerdt, F.; Hirth, L.; Luderer, G.; Edenhofer, O. System LCOE: What are the costs of variable renewables? Energy 2013, 63, 61–75. [Google Scholar] [CrossRef]
- Ouyang, X.; Lin, B. Levelized cost of electricity (LCOE) of renewable energies and required subsidies in China. Energy Policy 2014, 70, 64–73. [Google Scholar] [CrossRef]
- Miller, L.; Carriveau, R.; Harper, S.; Singh, S. Evaluating the link between LCOE and PPA elements and structure for wind energy. Energy Strategy Rev. 2017, 16, 33–42. [Google Scholar] [CrossRef]
- Limmanee, A.; Songtrai, S.; Udomdachanut, N.; Kaewniyompanit, S.; Sato, Y.; Nakaishi, M.; Kittisontirak, S.; Sriprapha, K.; Sakamoto, Y. Degradation analysis of photovoltaic modules under tropical climatic conditions and its impacts on LCOE. Renew. Energy 2017, 102, 199–204. [Google Scholar] [CrossRef]
- Reichenberg, L.; Hedenus, F.; Odenberger, M.; Johnsson, F. The marginal system LCOE of variable renewables—Evaluating high penetration levels of wind and solar in Europe. Energy 2018, 152, 914–924. [Google Scholar] [CrossRef]
- Abdelhady, S.; Borello, D.; Shaban, A. Techno-economic assessment of biomass power plant fed with rice straw: Sensitivity and parametric analysis of the performance and the LCOE. Renew. Energy 2018, 115, 1026–1034. [Google Scholar] [CrossRef]
Figure 1.
Natural gas consumption structure in the US.

Figure 2.
Four major driving forces for the growth of natural gas consumption.

Figure 3.
Domestic natural gas supply capacity and structure in 2020 and 2030.

Figure 4.
Imported LNG contract amounts of CNPC CNOOC and Sinopec. Notes: (a) presents the contract amount of CNOOC’s import LNG by 2030, (b) presents that of CNPC’s and (c) presents that of Sinopec’s. TRP means Total Resources Portfolio, BPRC is BP resource combination, Shell RM is Shell Resource Mix, MA is Mobil Australia and PNG is Papua New Guinea.


Figure 5.
The major natural gas importers in China in 2013.

Figure 6.
Per capita natural gas consumption and proportion in major countries in the world in 2014.
Figure 6.
Per capita natural gas consumption and proportion in major countries in the world in 2014.

Figure 7.
Comparison of energy structure between China and the world.

Figure 8.
China’s energy supply structure.

Figure 9.
China’s natural gas consumption structure.

Figure 10.
Sub-industry natural gas demand in China.

Figure 11.
China’s natural gas supply and demand by 2020 and 2030.

Figure 12.
China’s natural gas production, consumption and foreign dependence.

Figure 13.
China’s domestic natural gas suppliers in 2013.

Figure 14.
Income, expenditure and profits of PetroChina’s gas and pipeline business in 2012 and 2013. Data source Sinopec (2014).
Figure 14.
Income, expenditure and profits of PetroChina’s gas and pipeline business in 2012 and 2013. Data source Sinopec (2014).

Figure 15.
Border price vs. ex-plant price in 2012 and 2013. Data Source: import LNG & pipeline gas prices (CNPC, 2014), ex-plant prices at Xinjiang (authors’ estimates based on NDRC, 2013; NDRC, 2014).
Figure 15.
Border price vs. ex-plant price in 2012 and 2013. Data Source: import LNG & pipeline gas prices (CNPC, 2014), ex-plant prices at Xinjiang (authors’ estimates based on NDRC, 2013; NDRC, 2014).

Figure 16.
The natural gas supply prices in 20 provinces.

Figure 17.
End user gas prices in Beijing, Shanghai and Zhejiang in the first adjustment period. Data Source: CNPC (2014), NDRC (2013).
Figure 17.
End user gas prices in Beijing, Shanghai and Zhejiang in the first adjustment period. Data Source: CNPC (2014), NDRC (2013).

Figure 18.
Combined cooling heating and power (CCHP) system thermal ladder to use (not representative of the specific ratio).
Figure 18.
Combined cooling heating and power (CCHP) system thermal ladder to use (not representative of the specific ratio).

Figure 19.
The LCOE of centralized NGPG in base load in China.

Figure 20.
The LCOE and on-grid electricity prices in six typical provinces and cities.

Figure 21.
The LCOE components of NGPG units with different installed capacities.

Figure 22.
The difference between commercial electricity price and LCOE in China.

Figure 23.
LCOE under different gas prices in centralized scenario.

Figure 24.
LCOE under different gas prices in CCHP scenario.


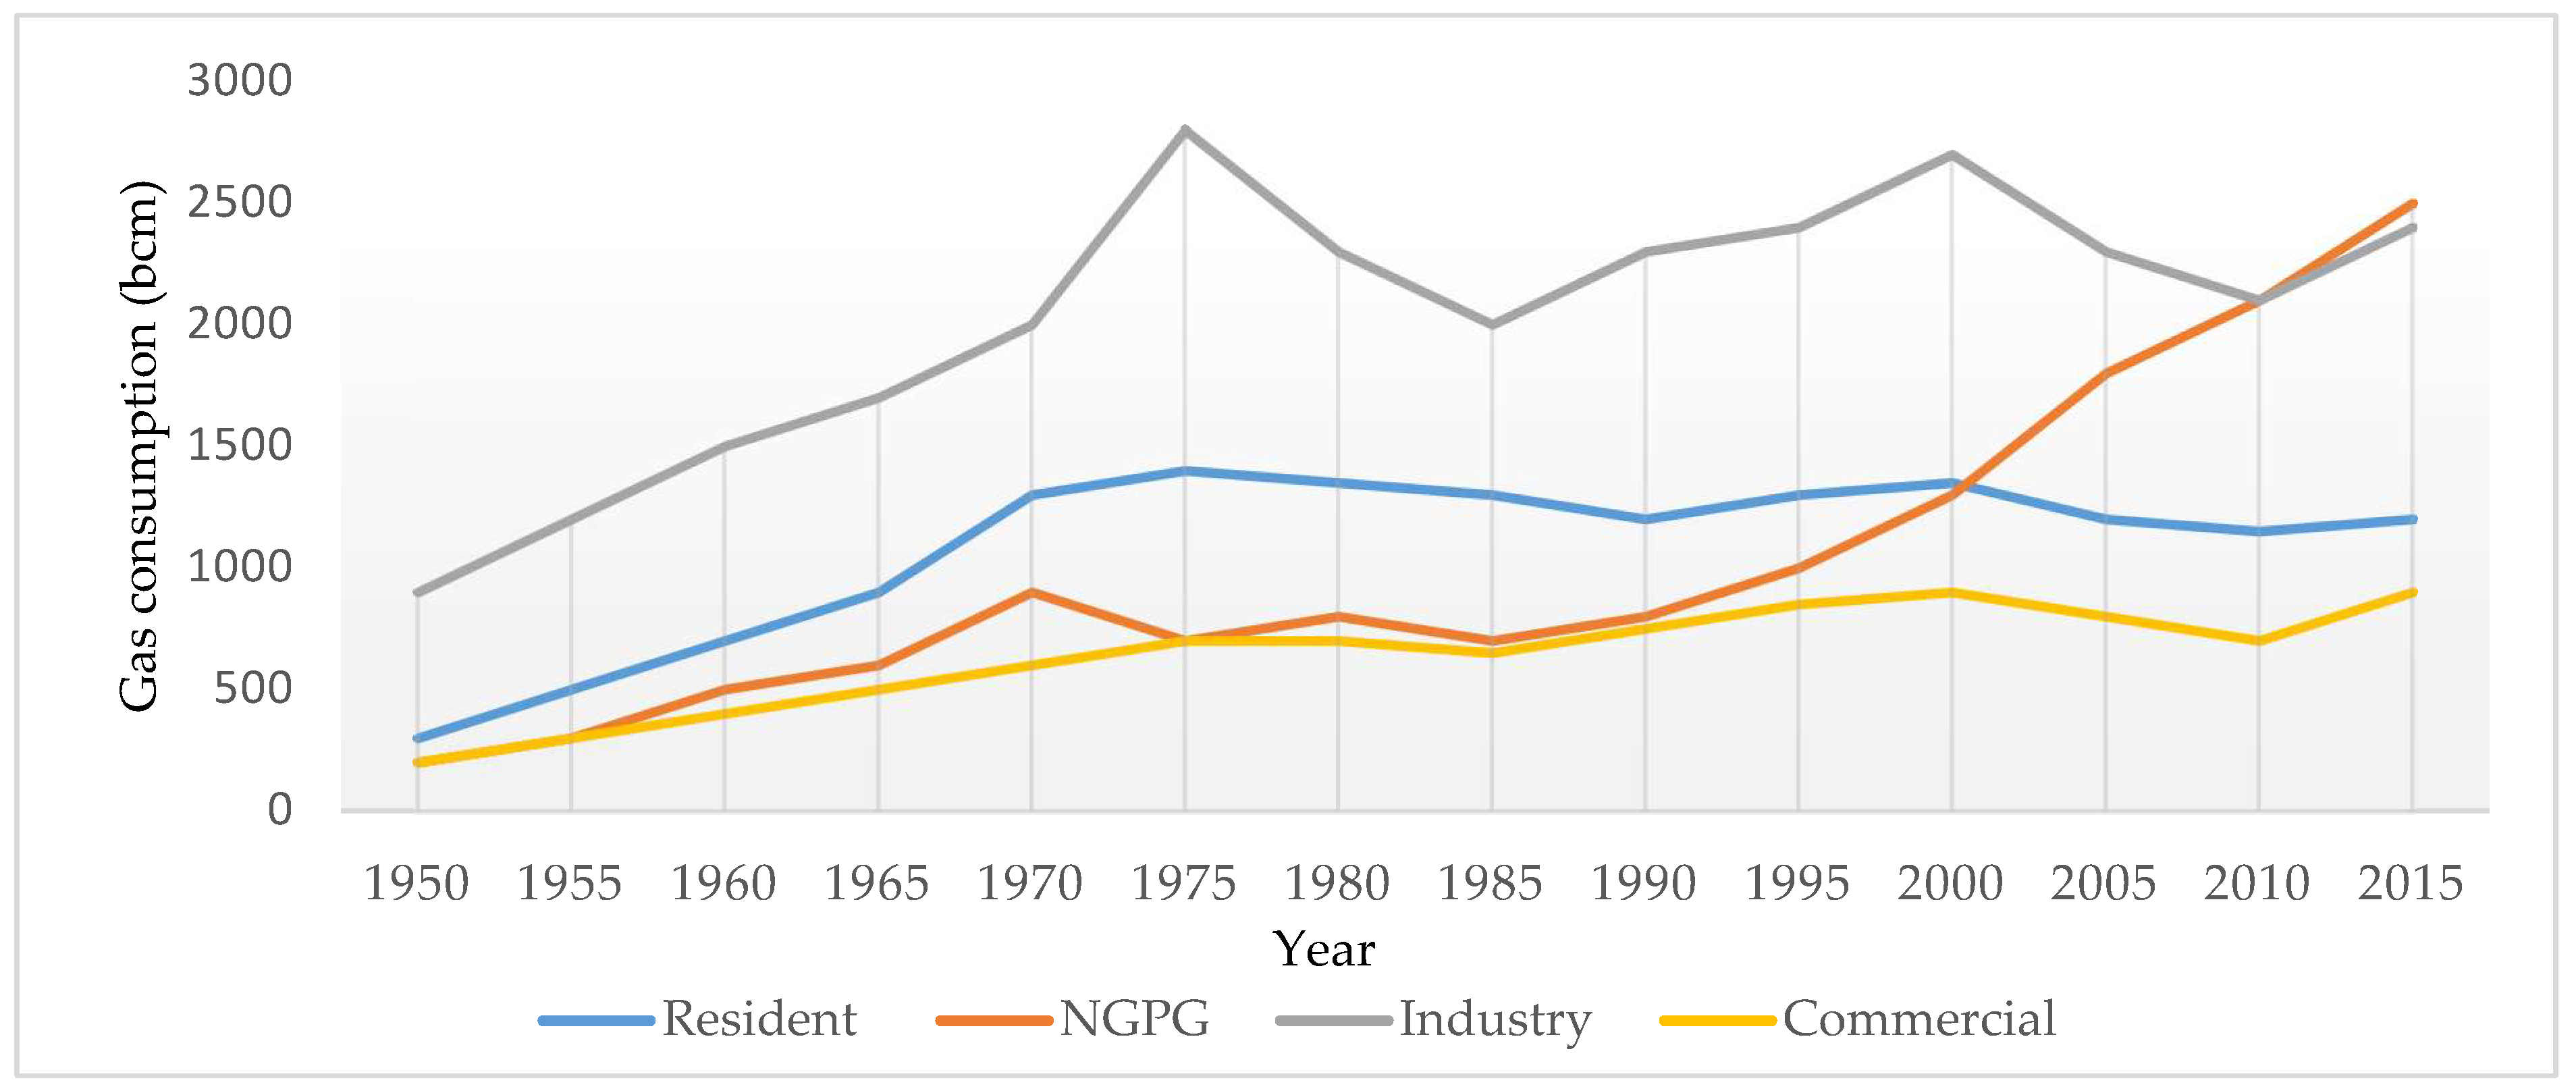
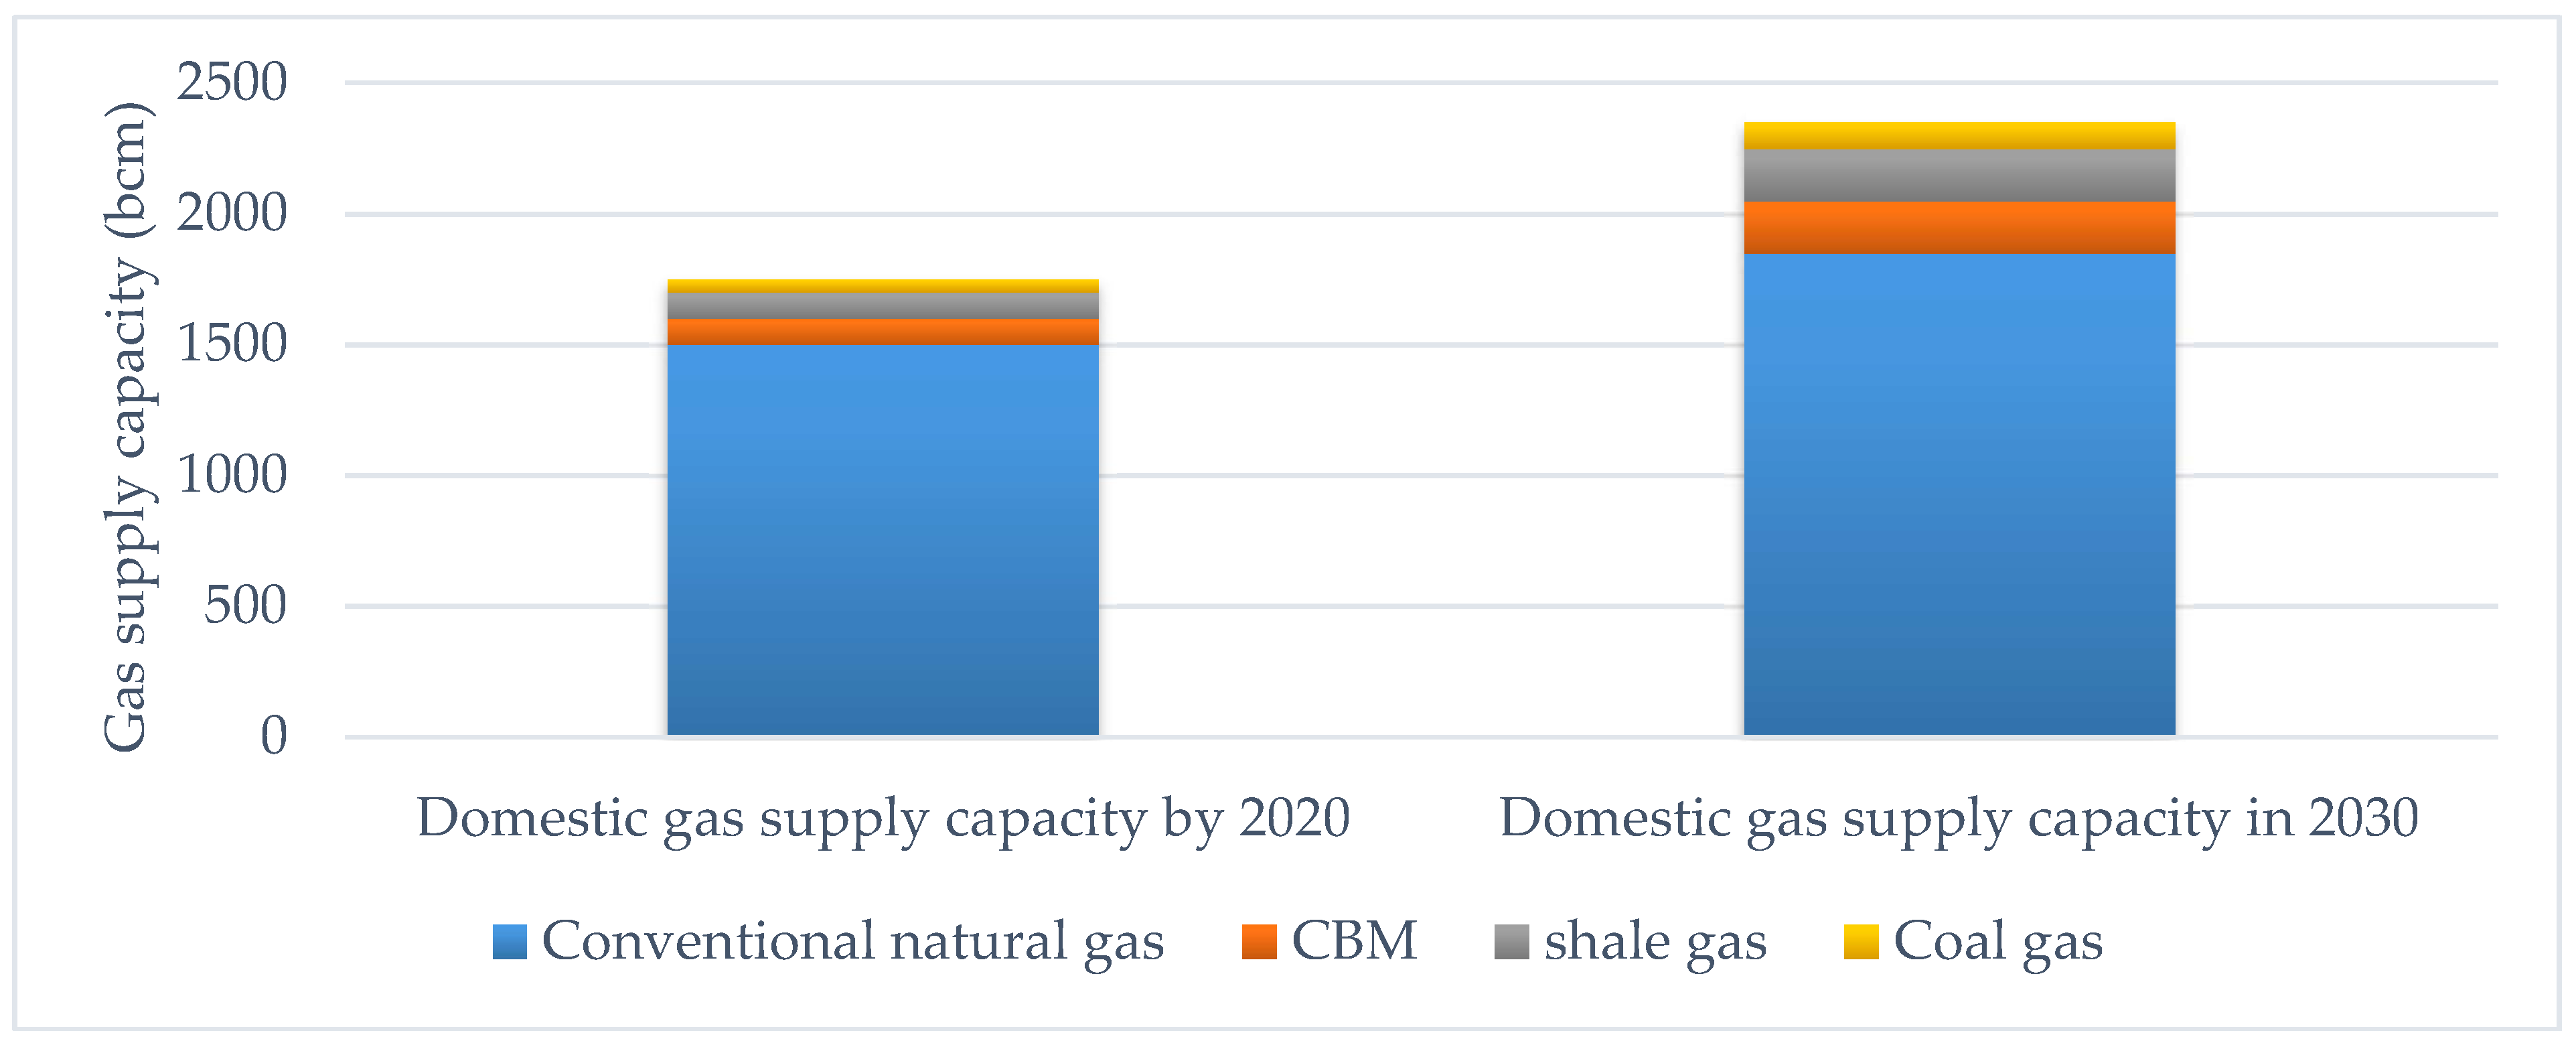
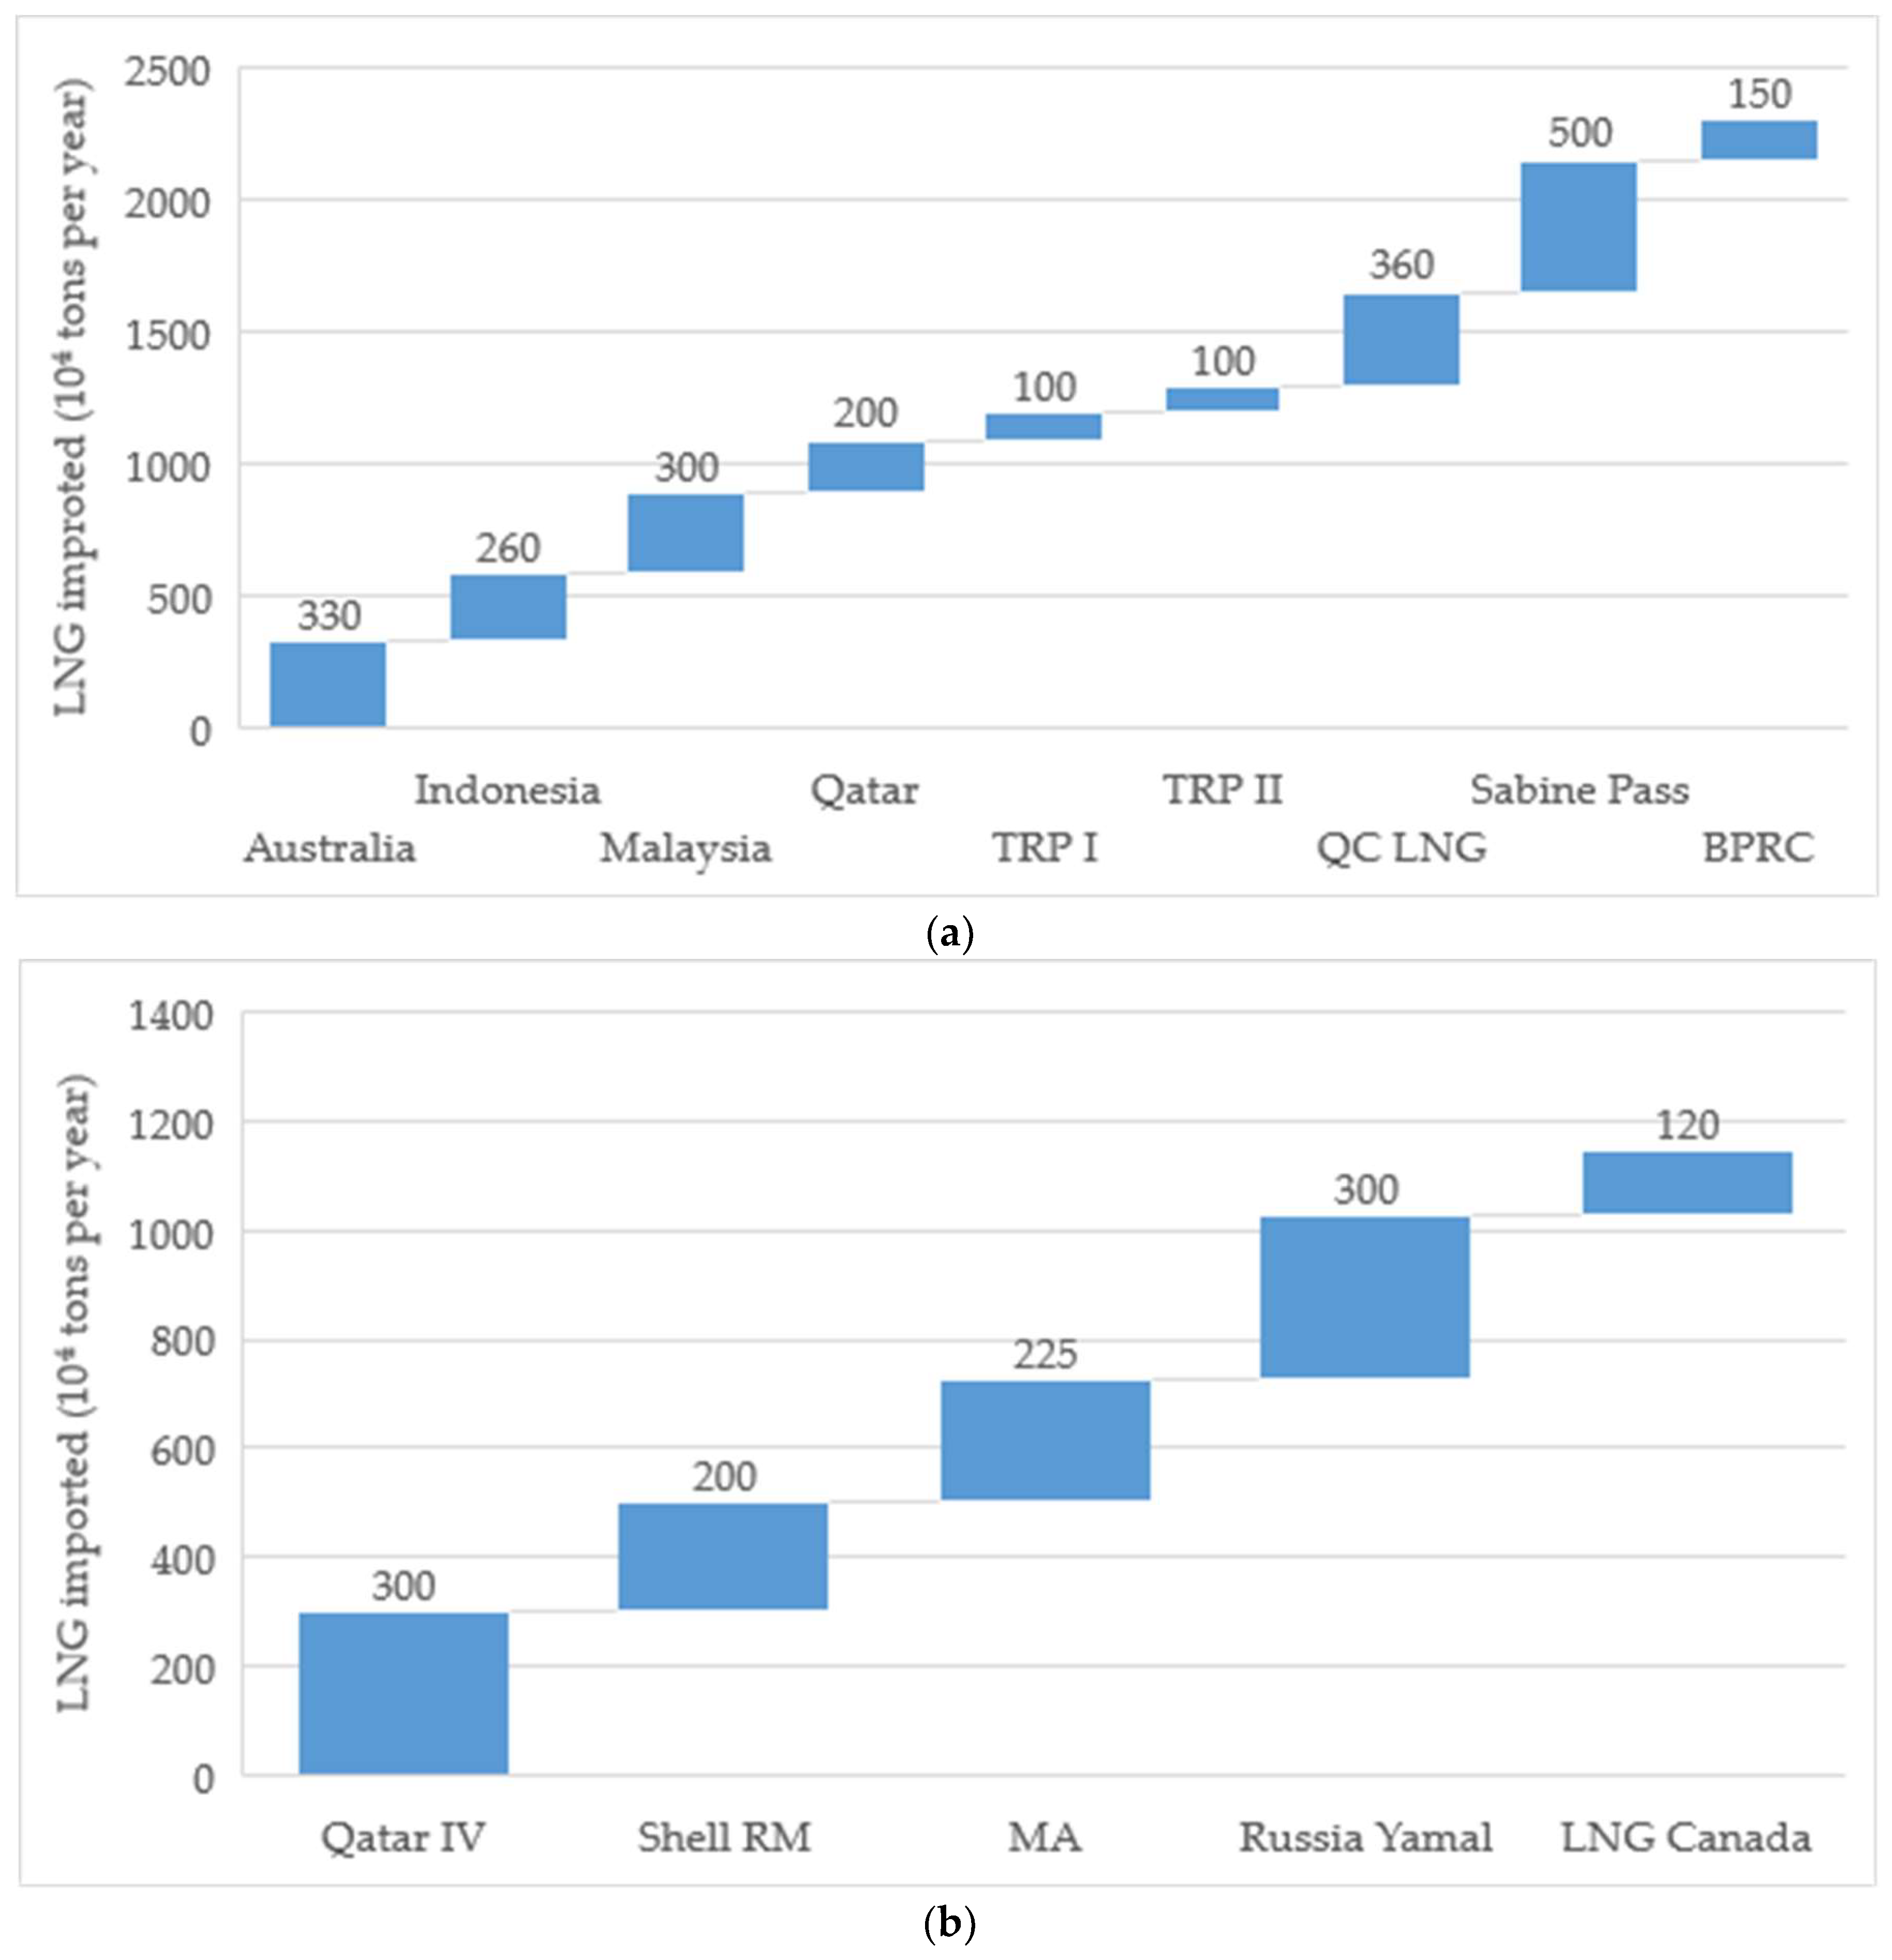
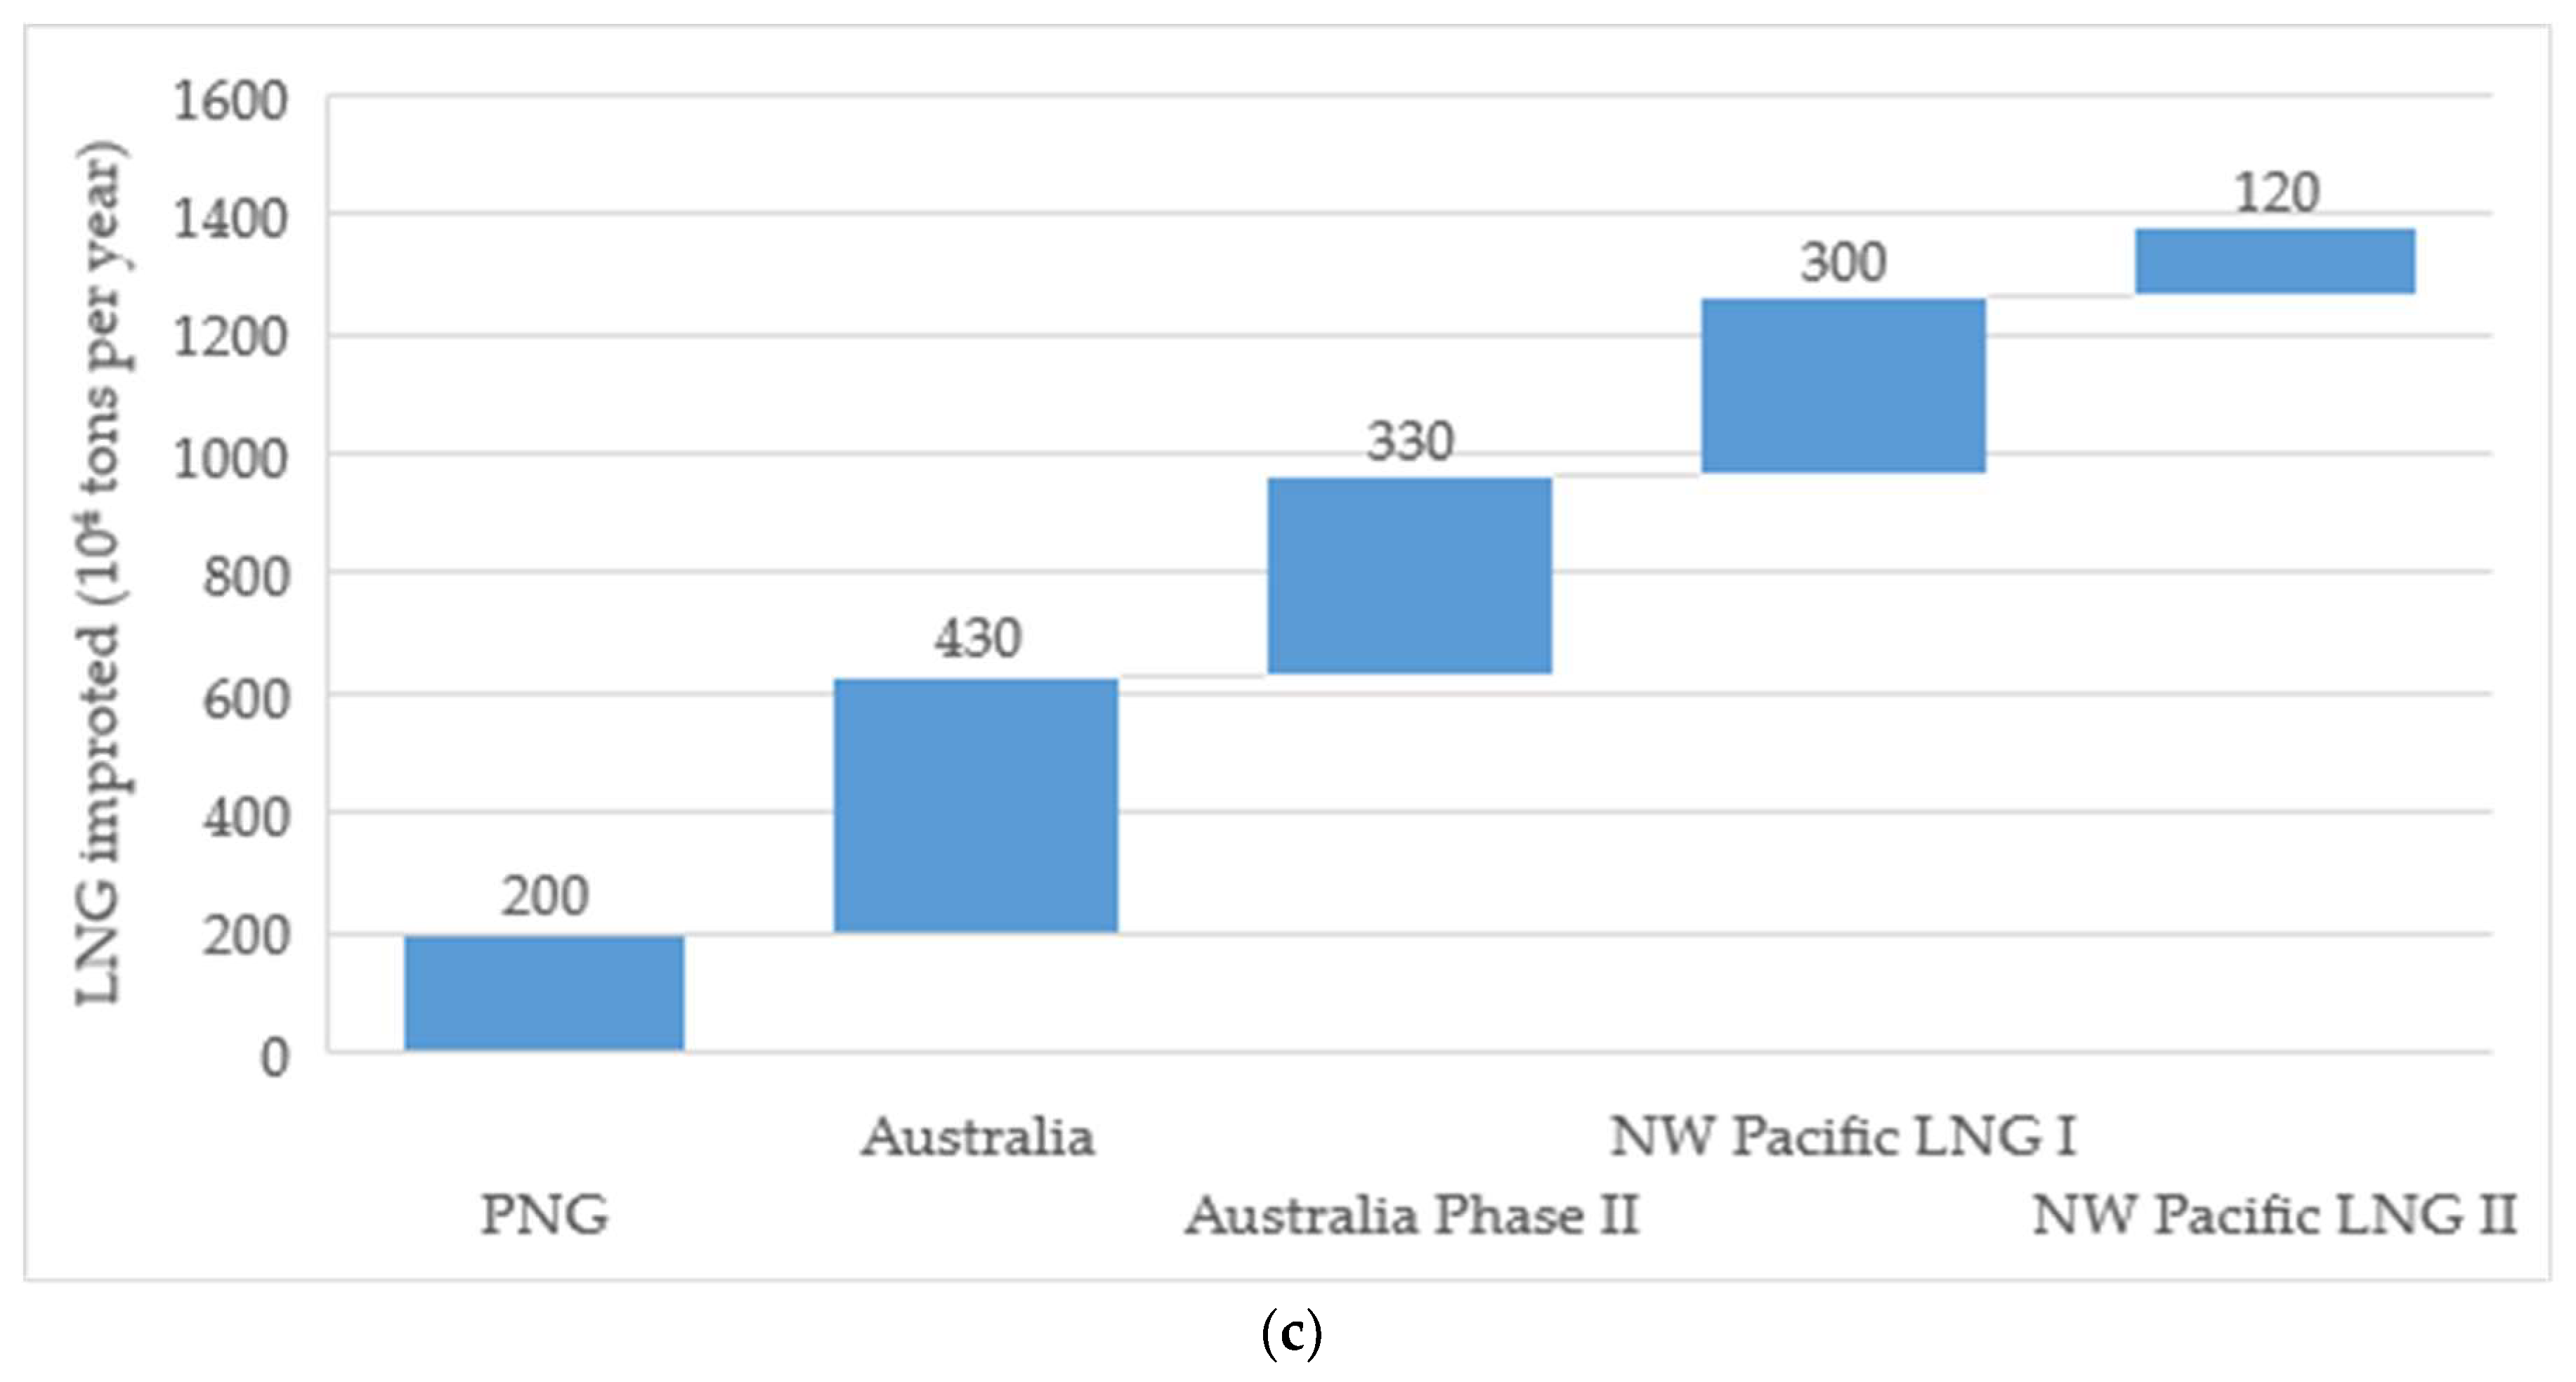
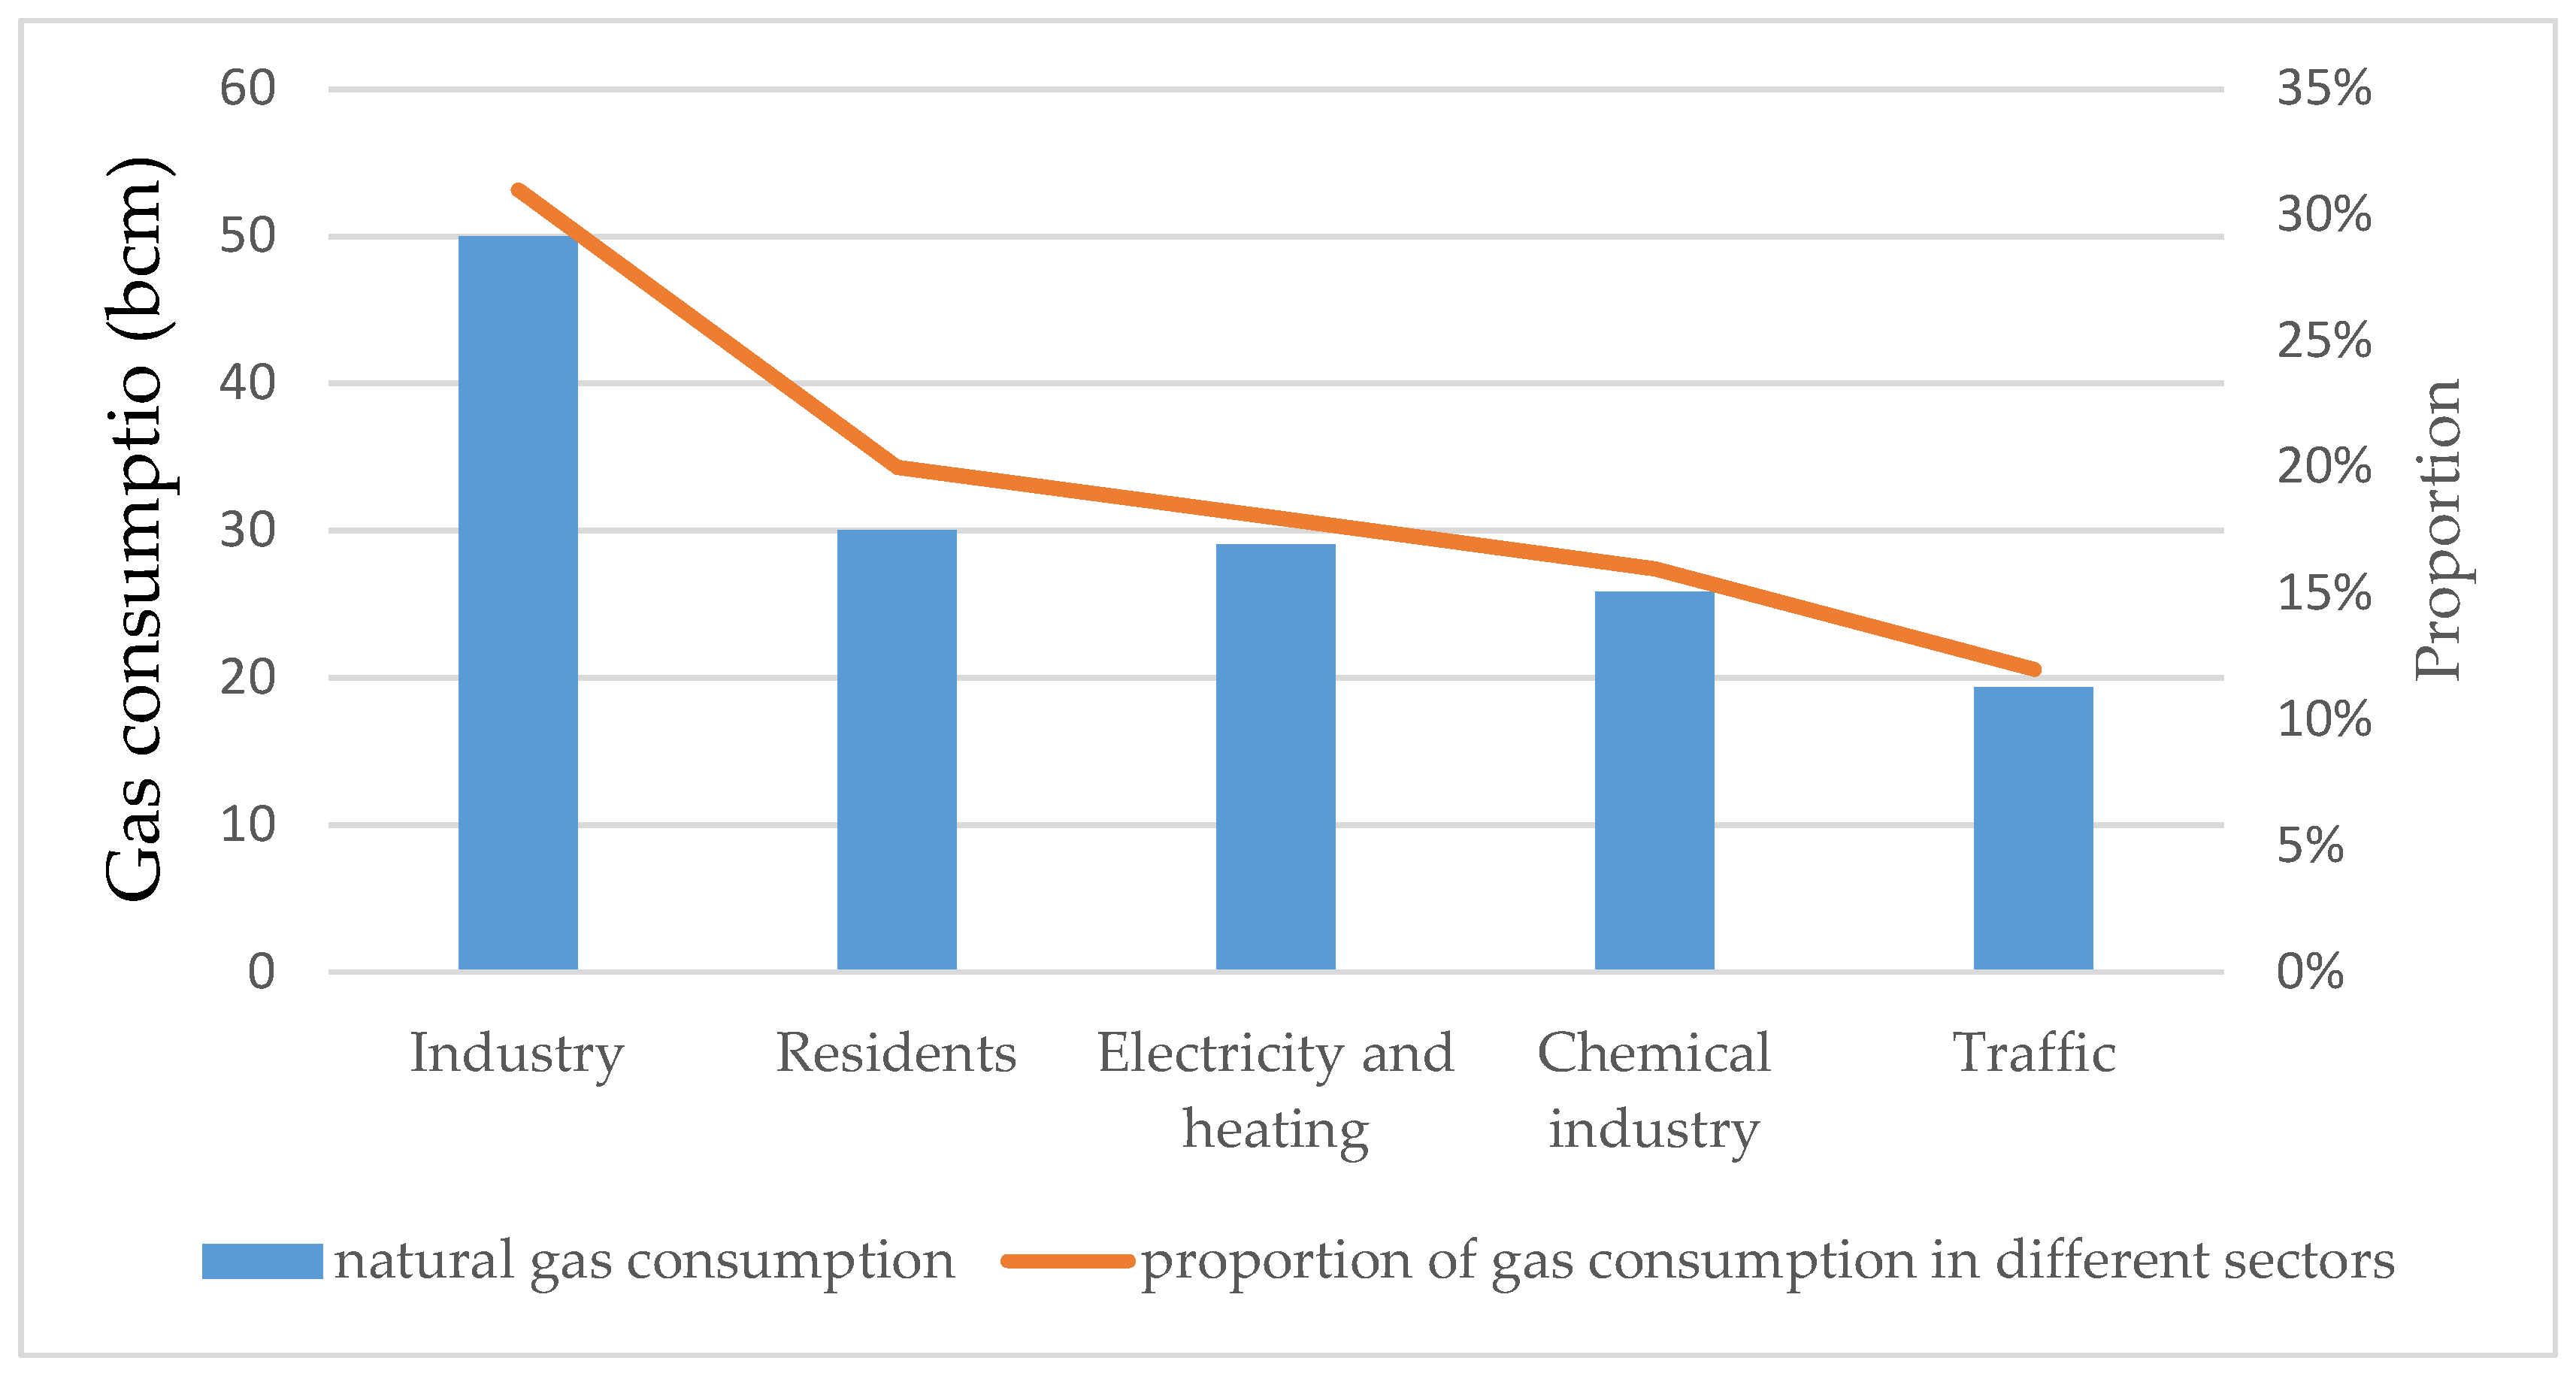
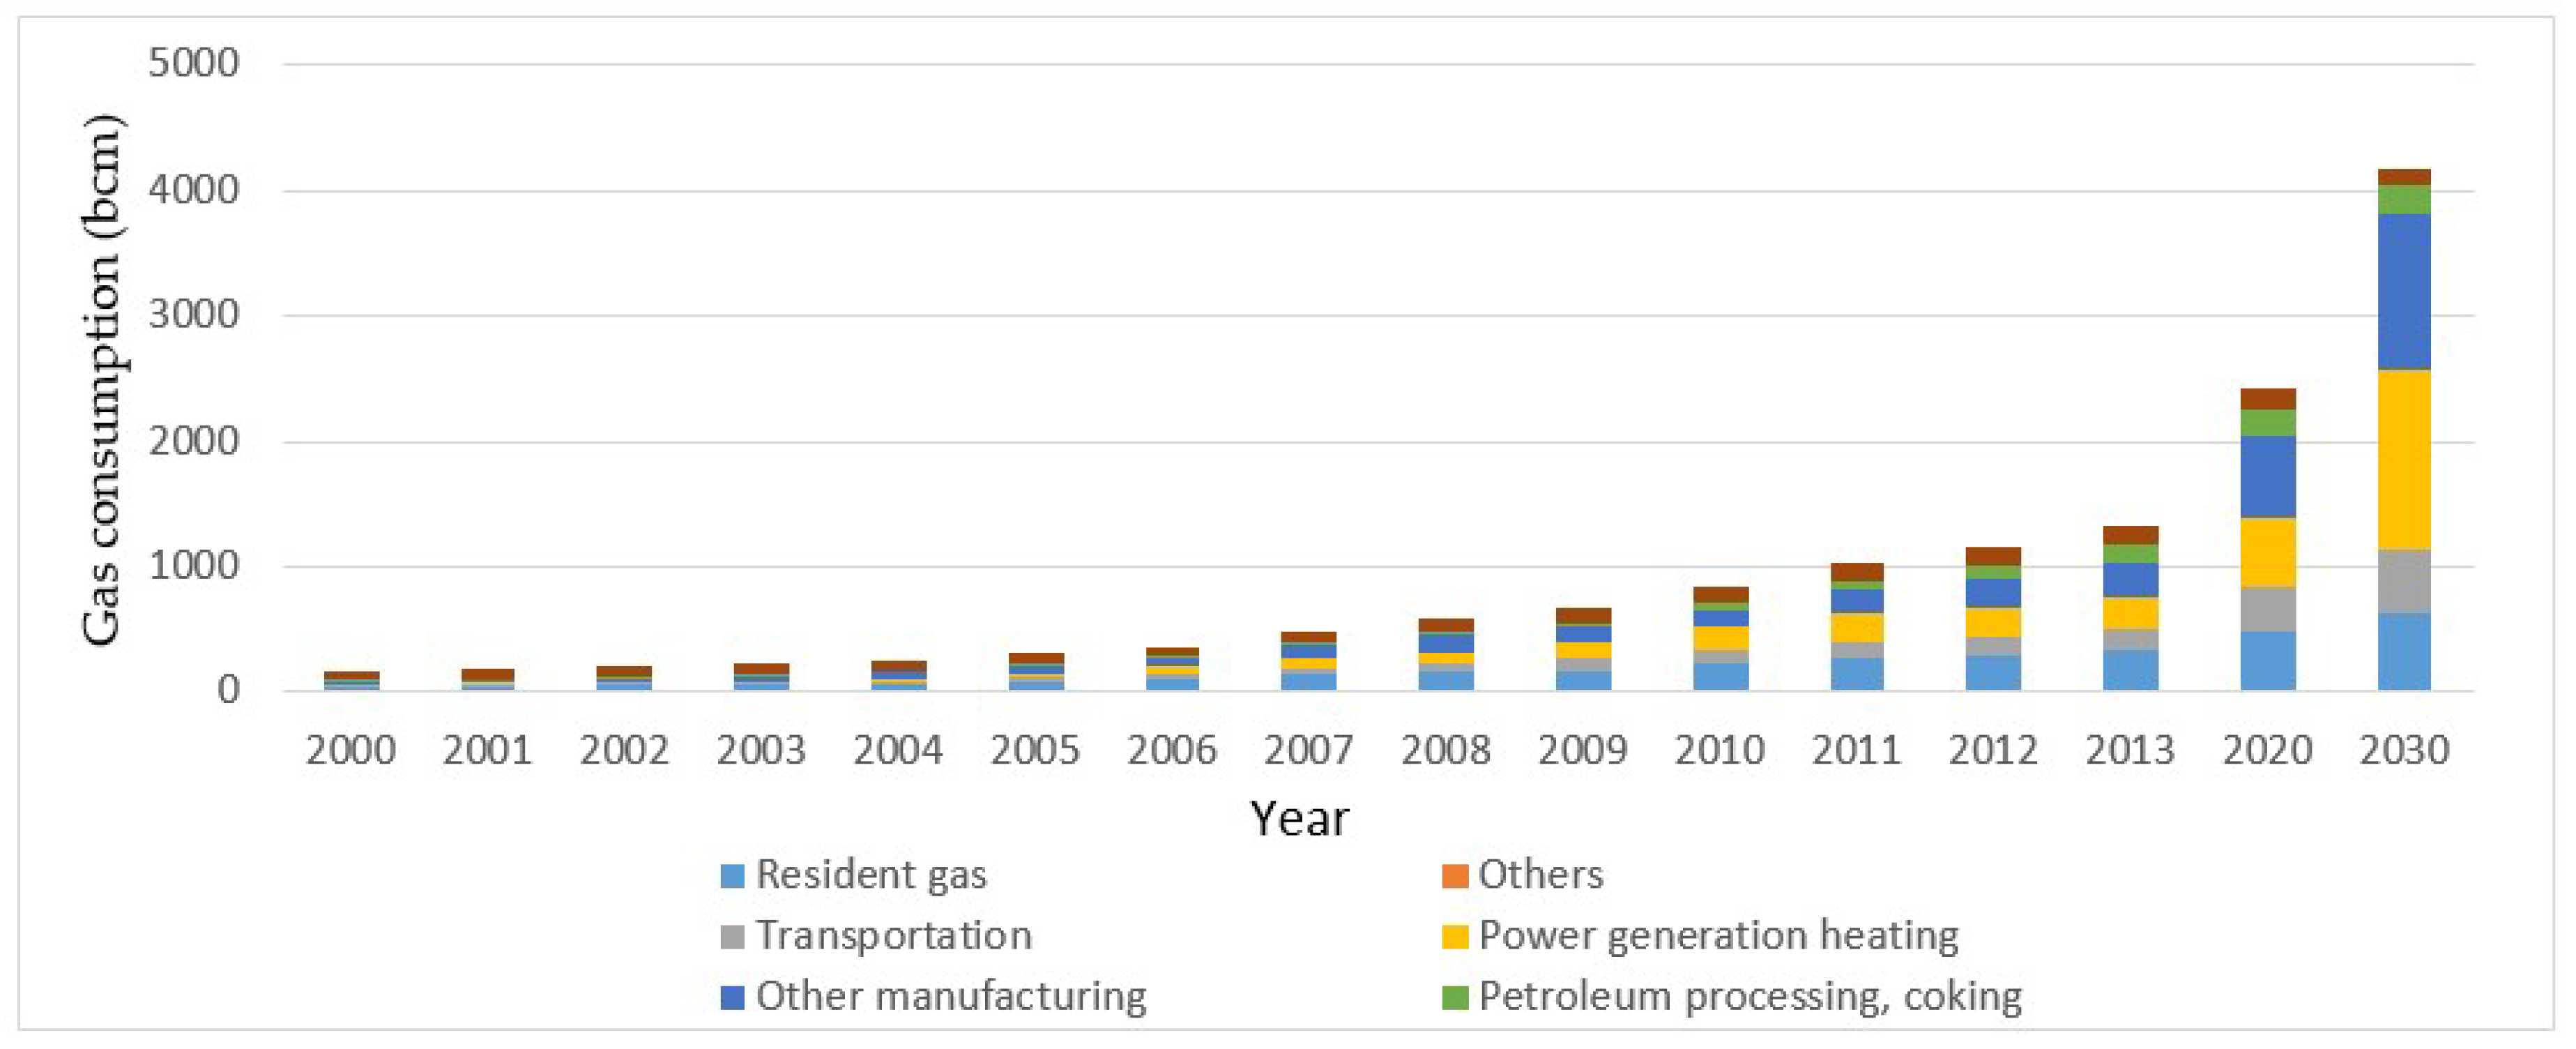
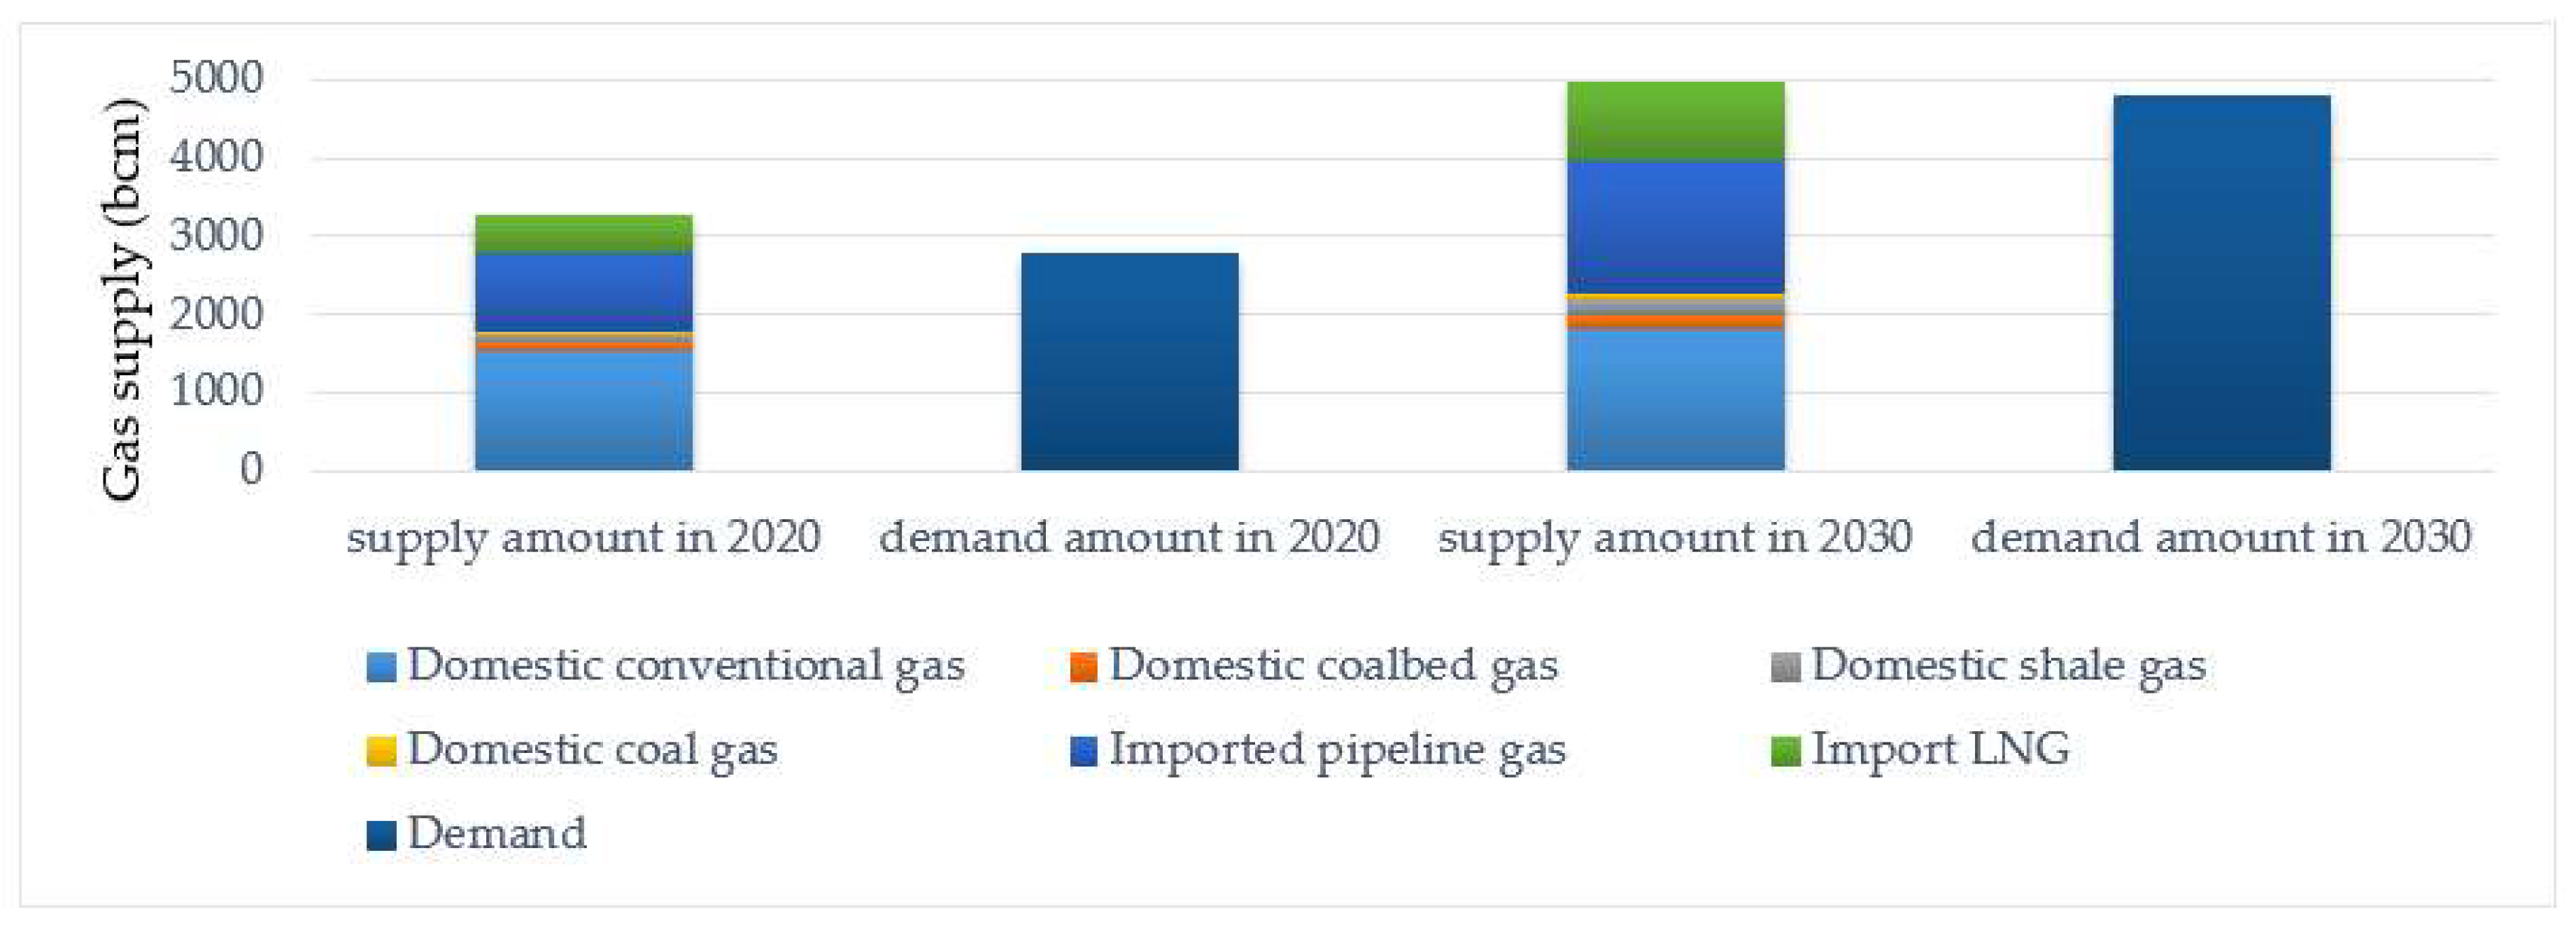
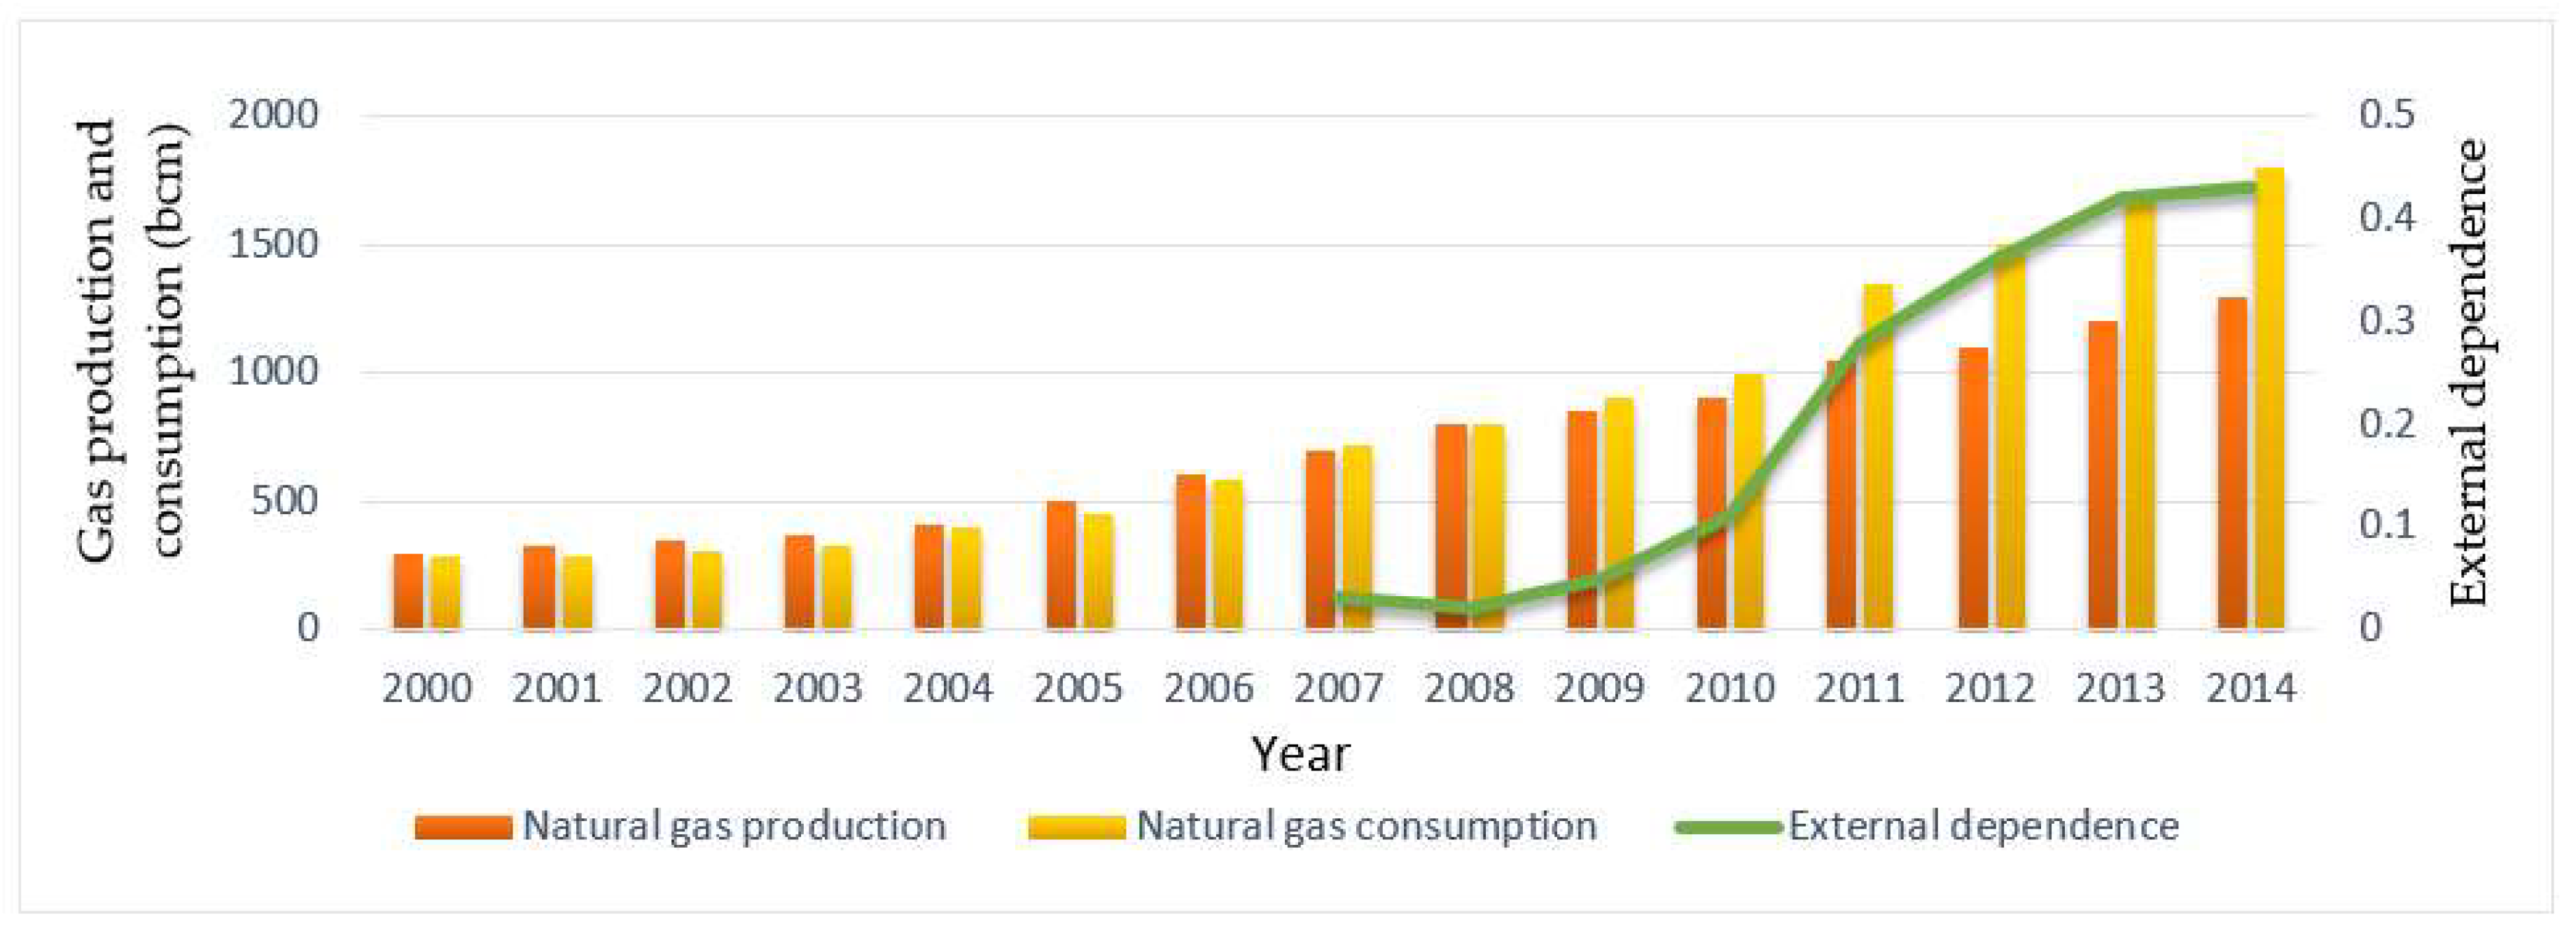
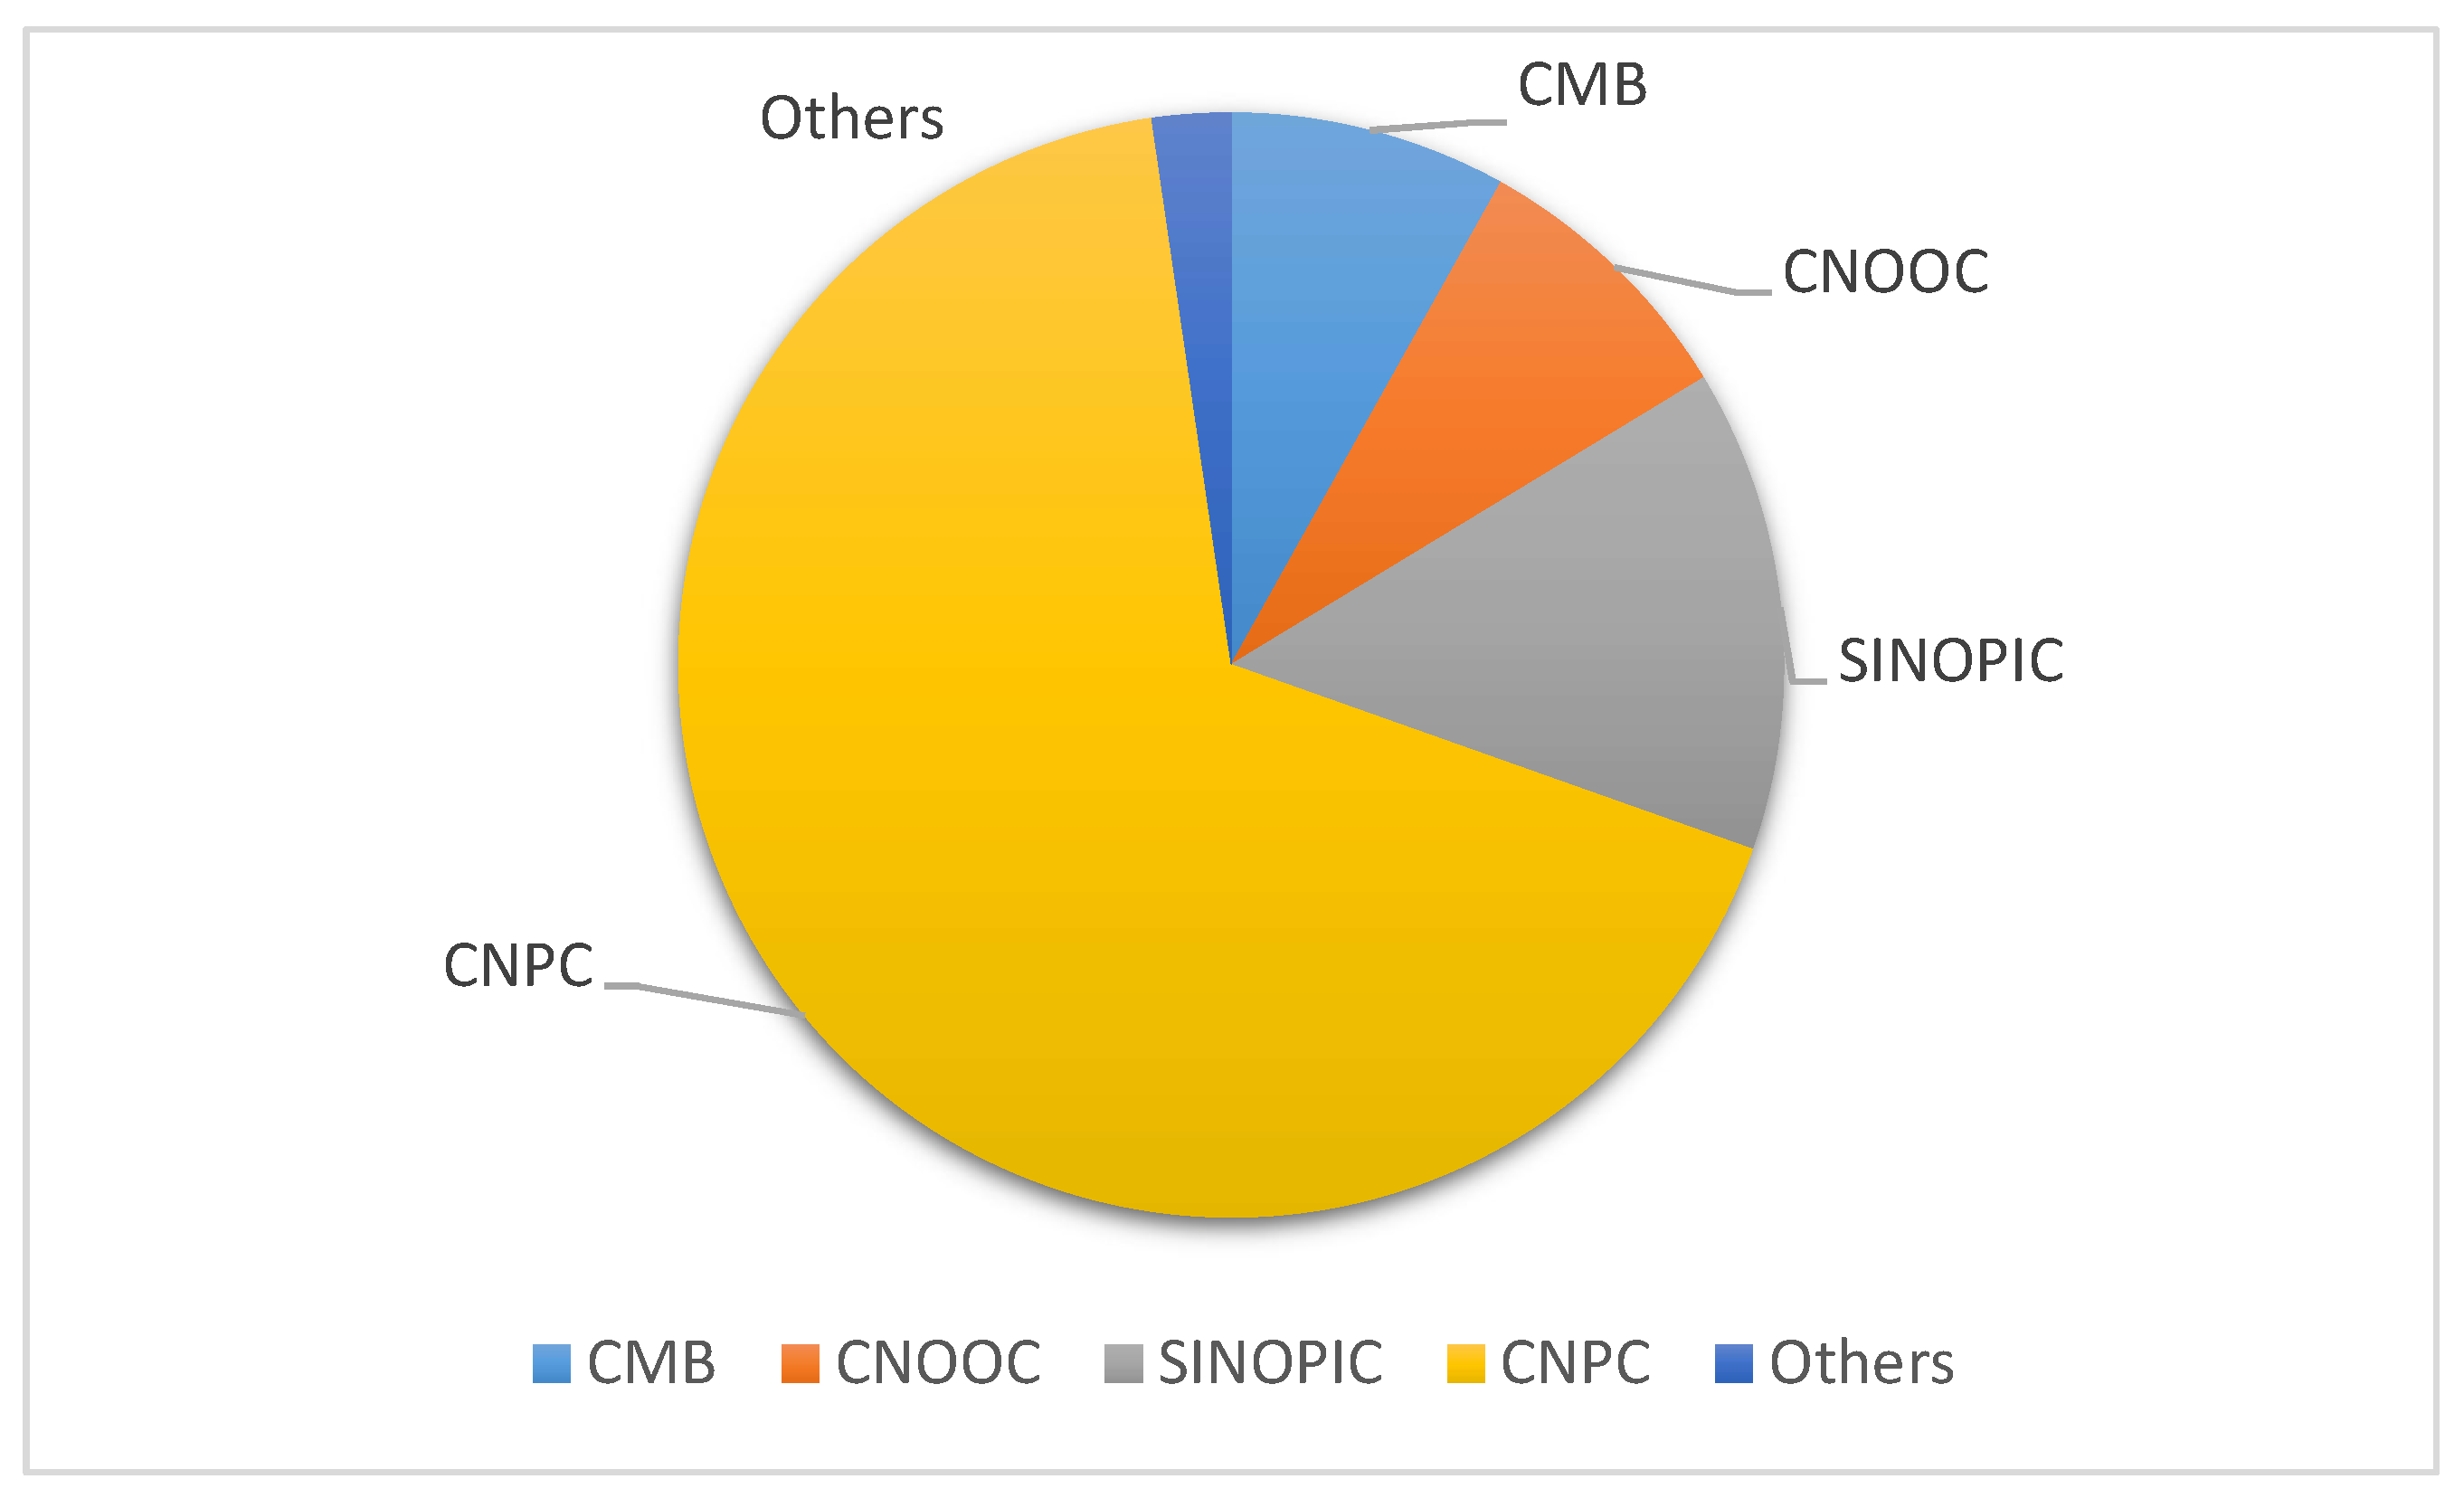
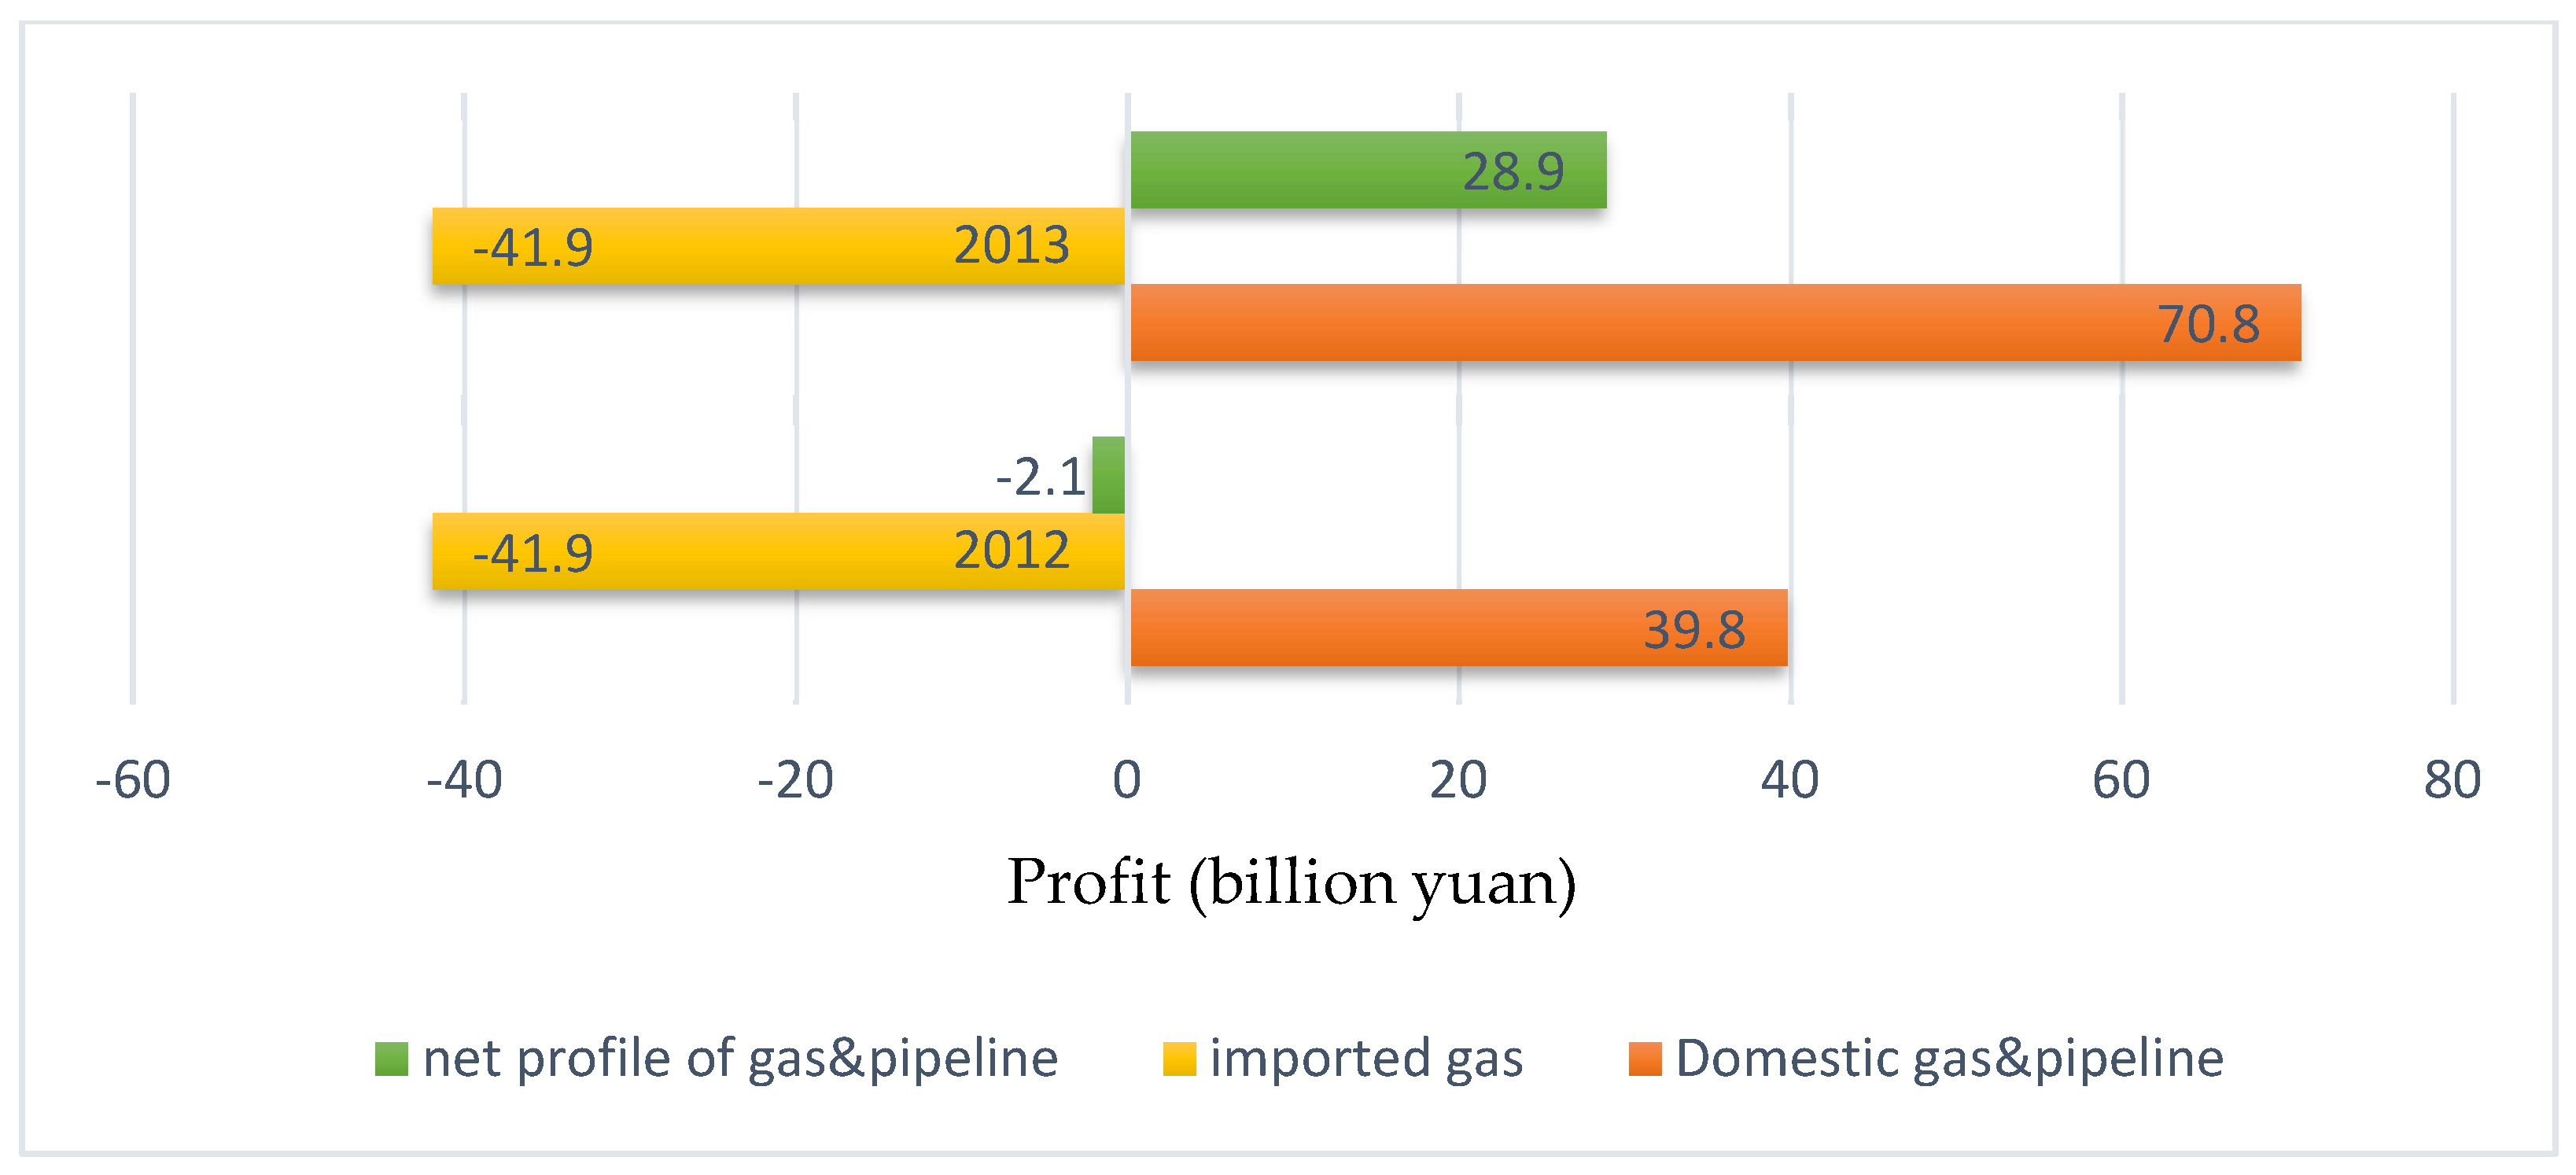
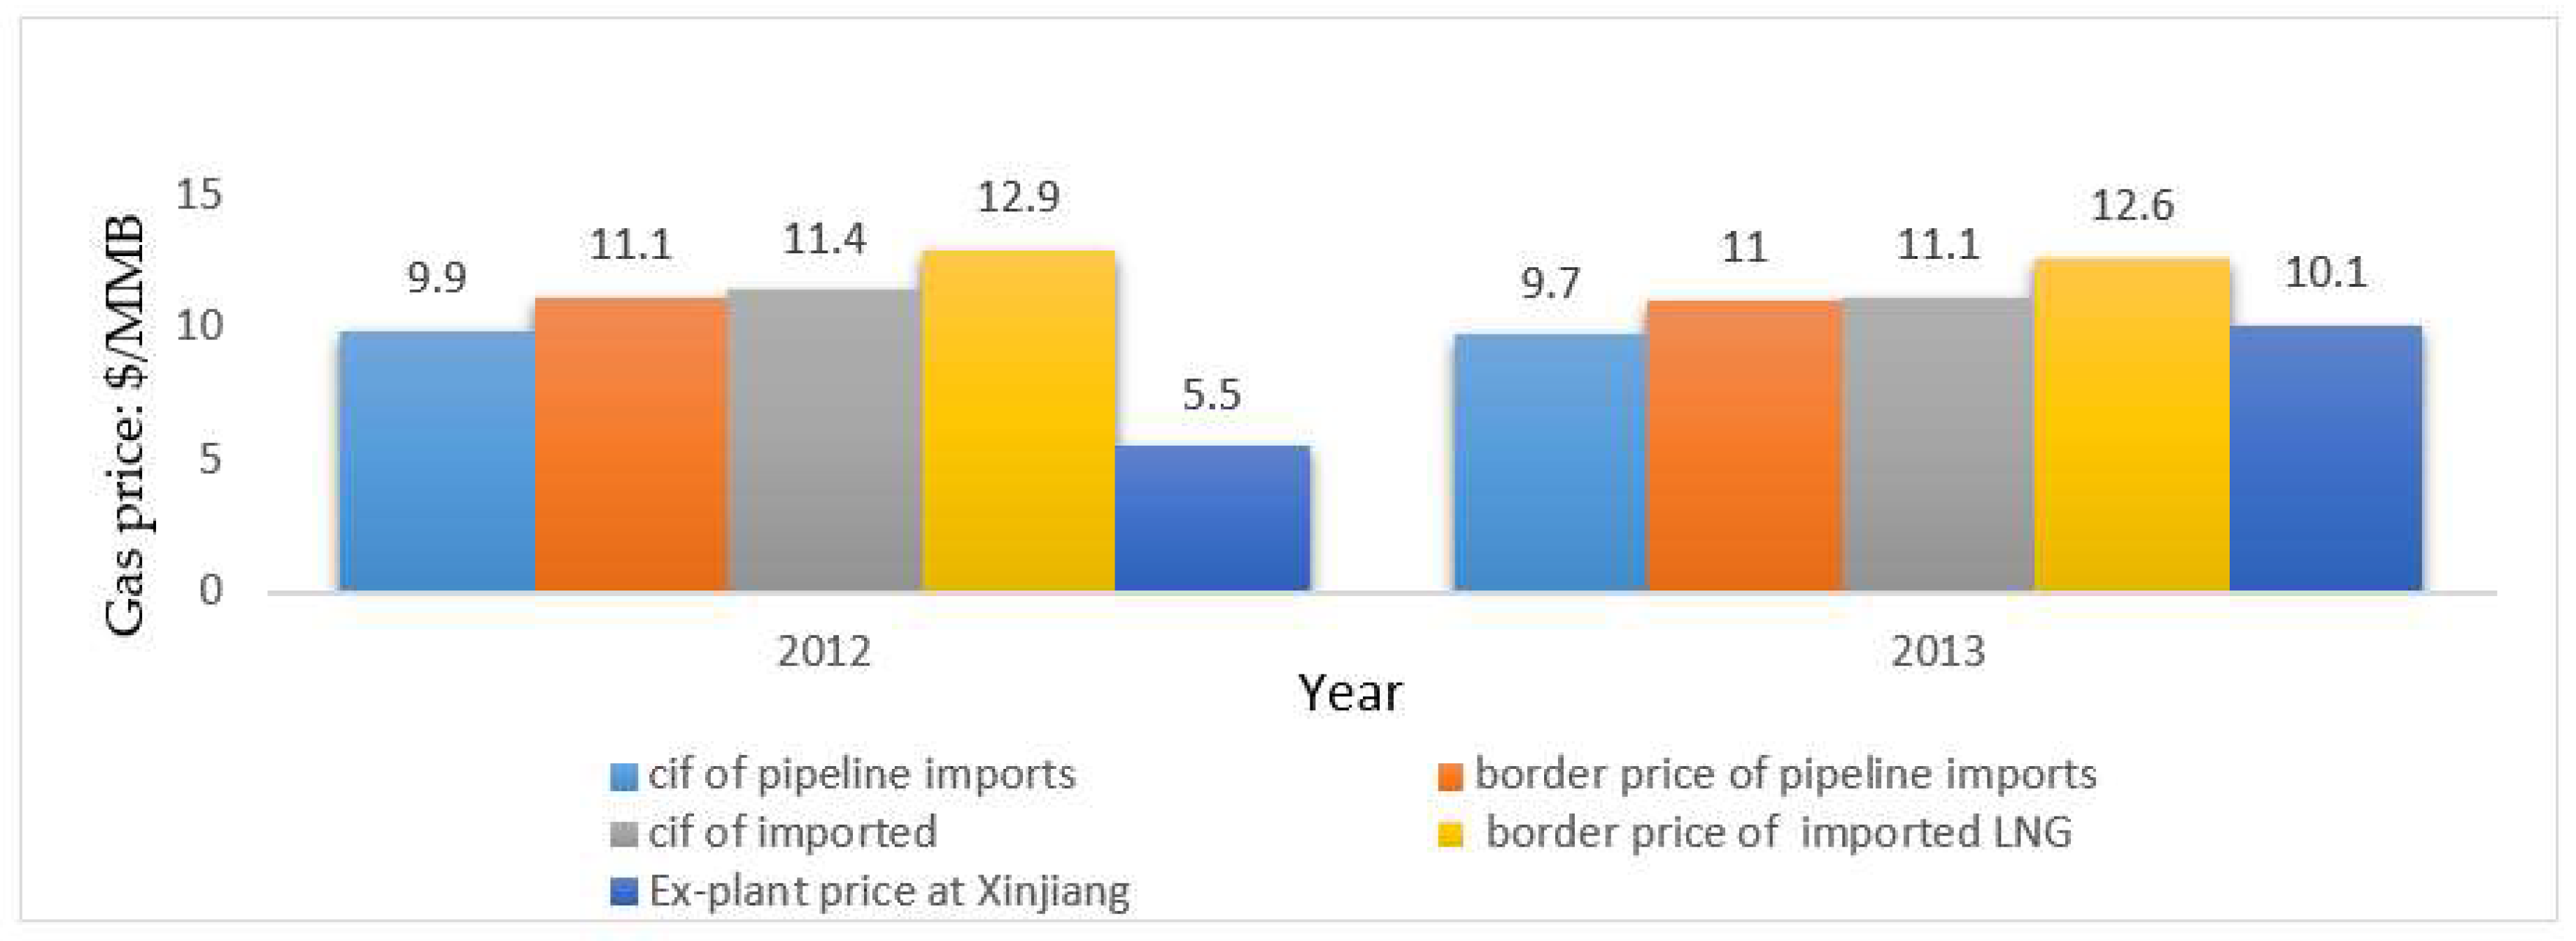
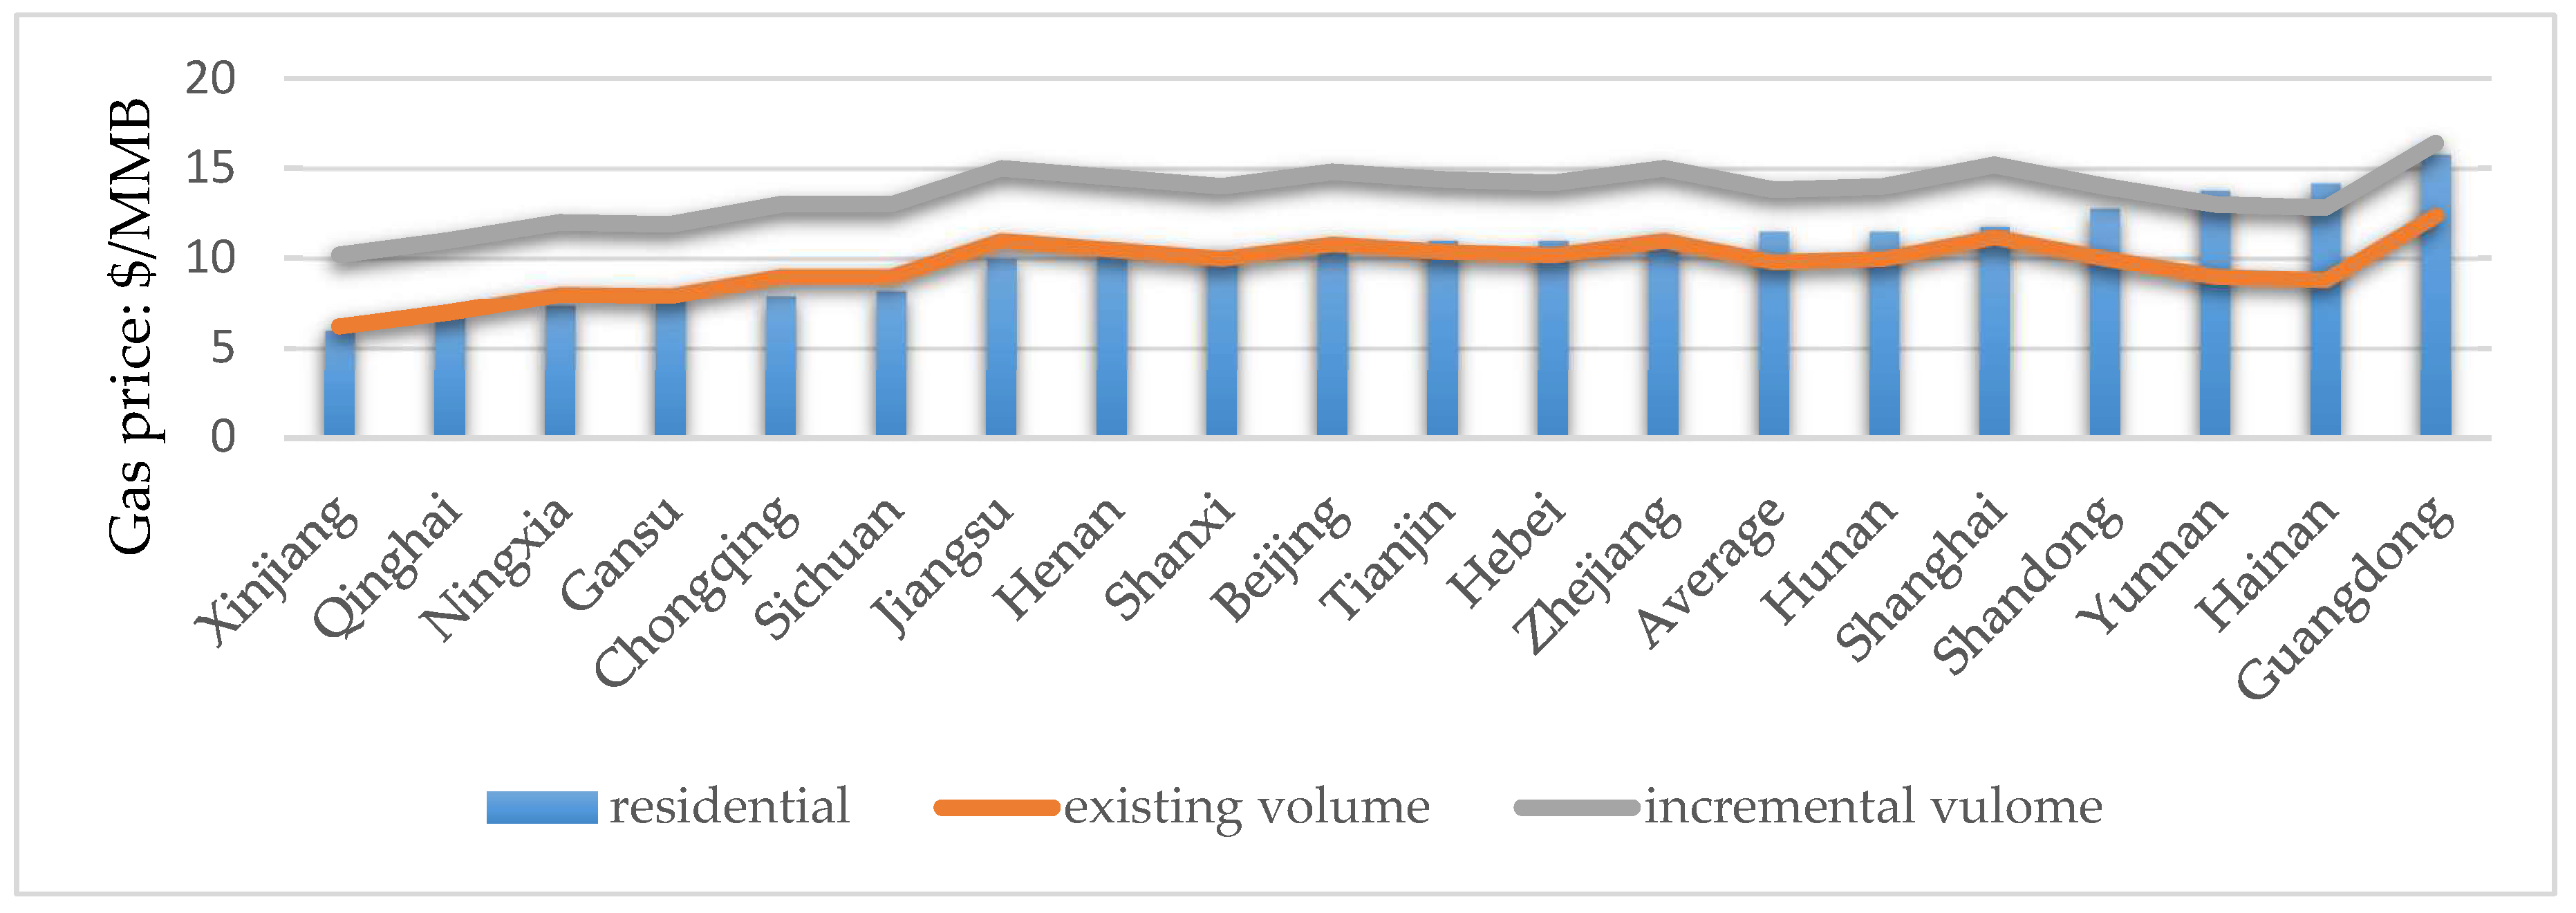
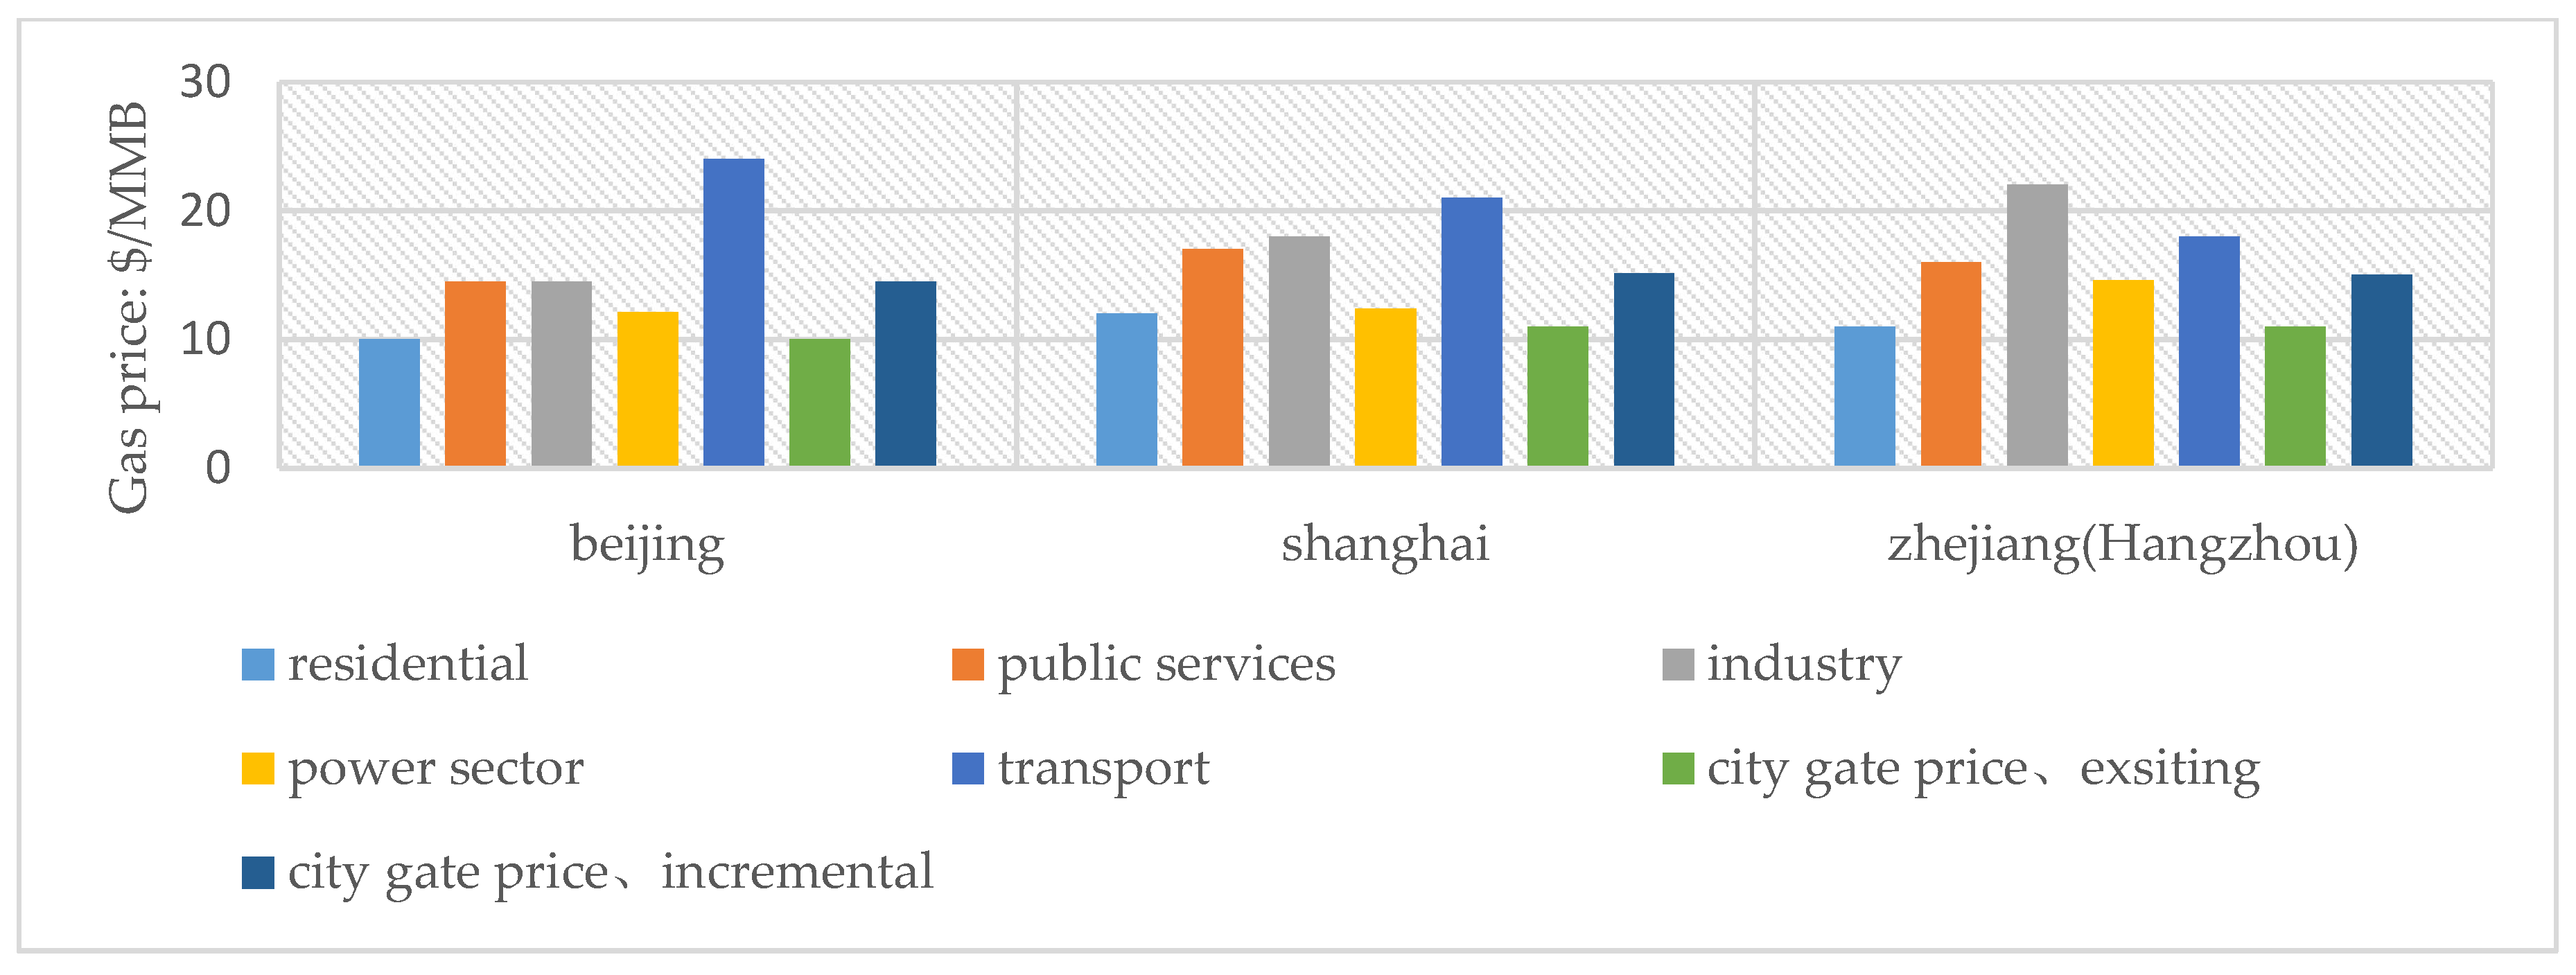
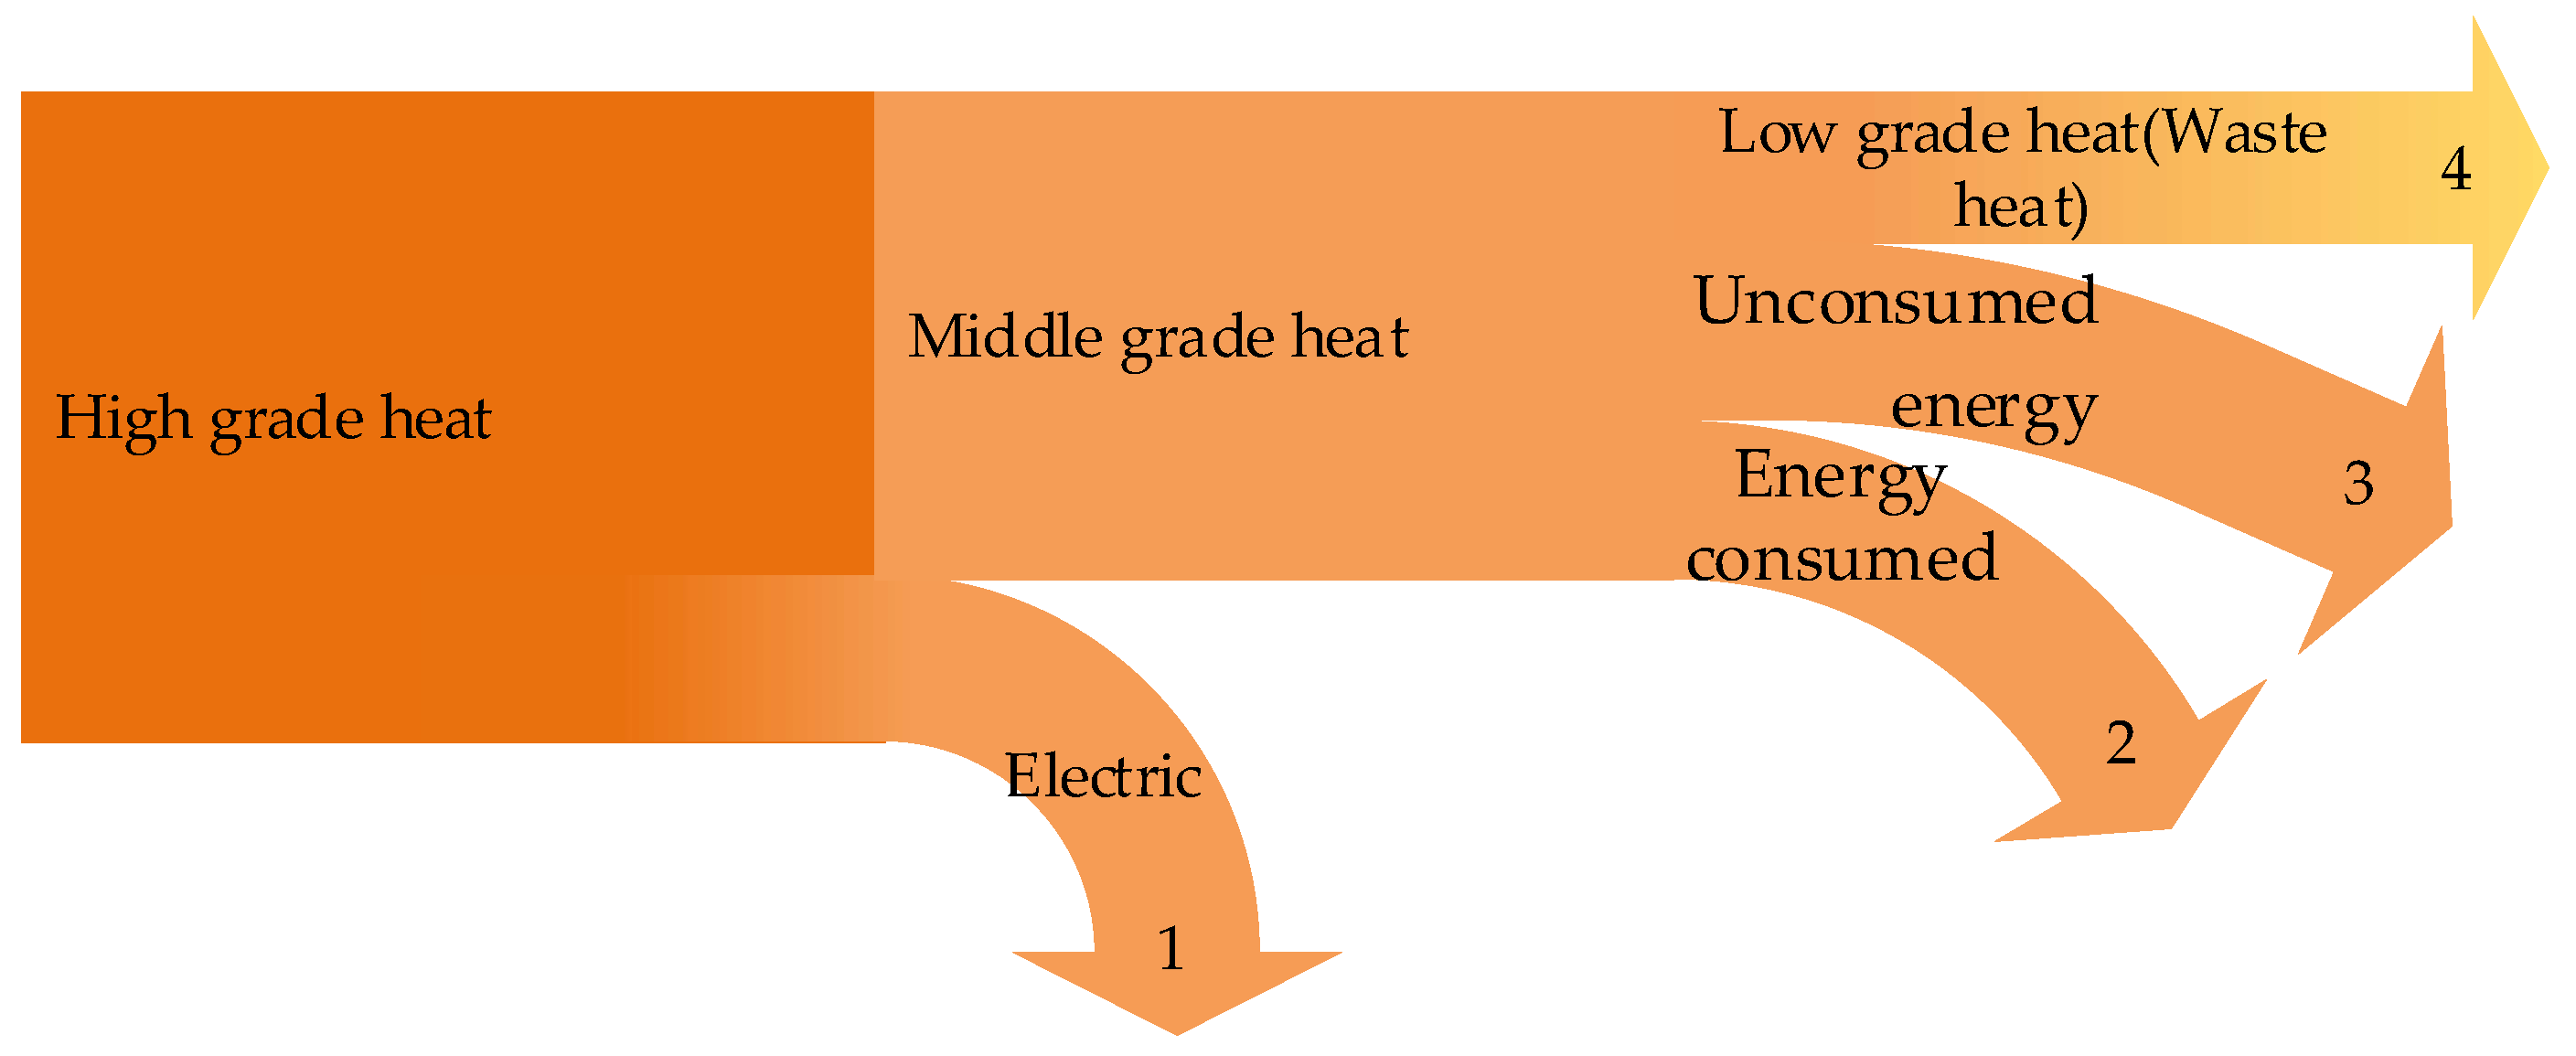
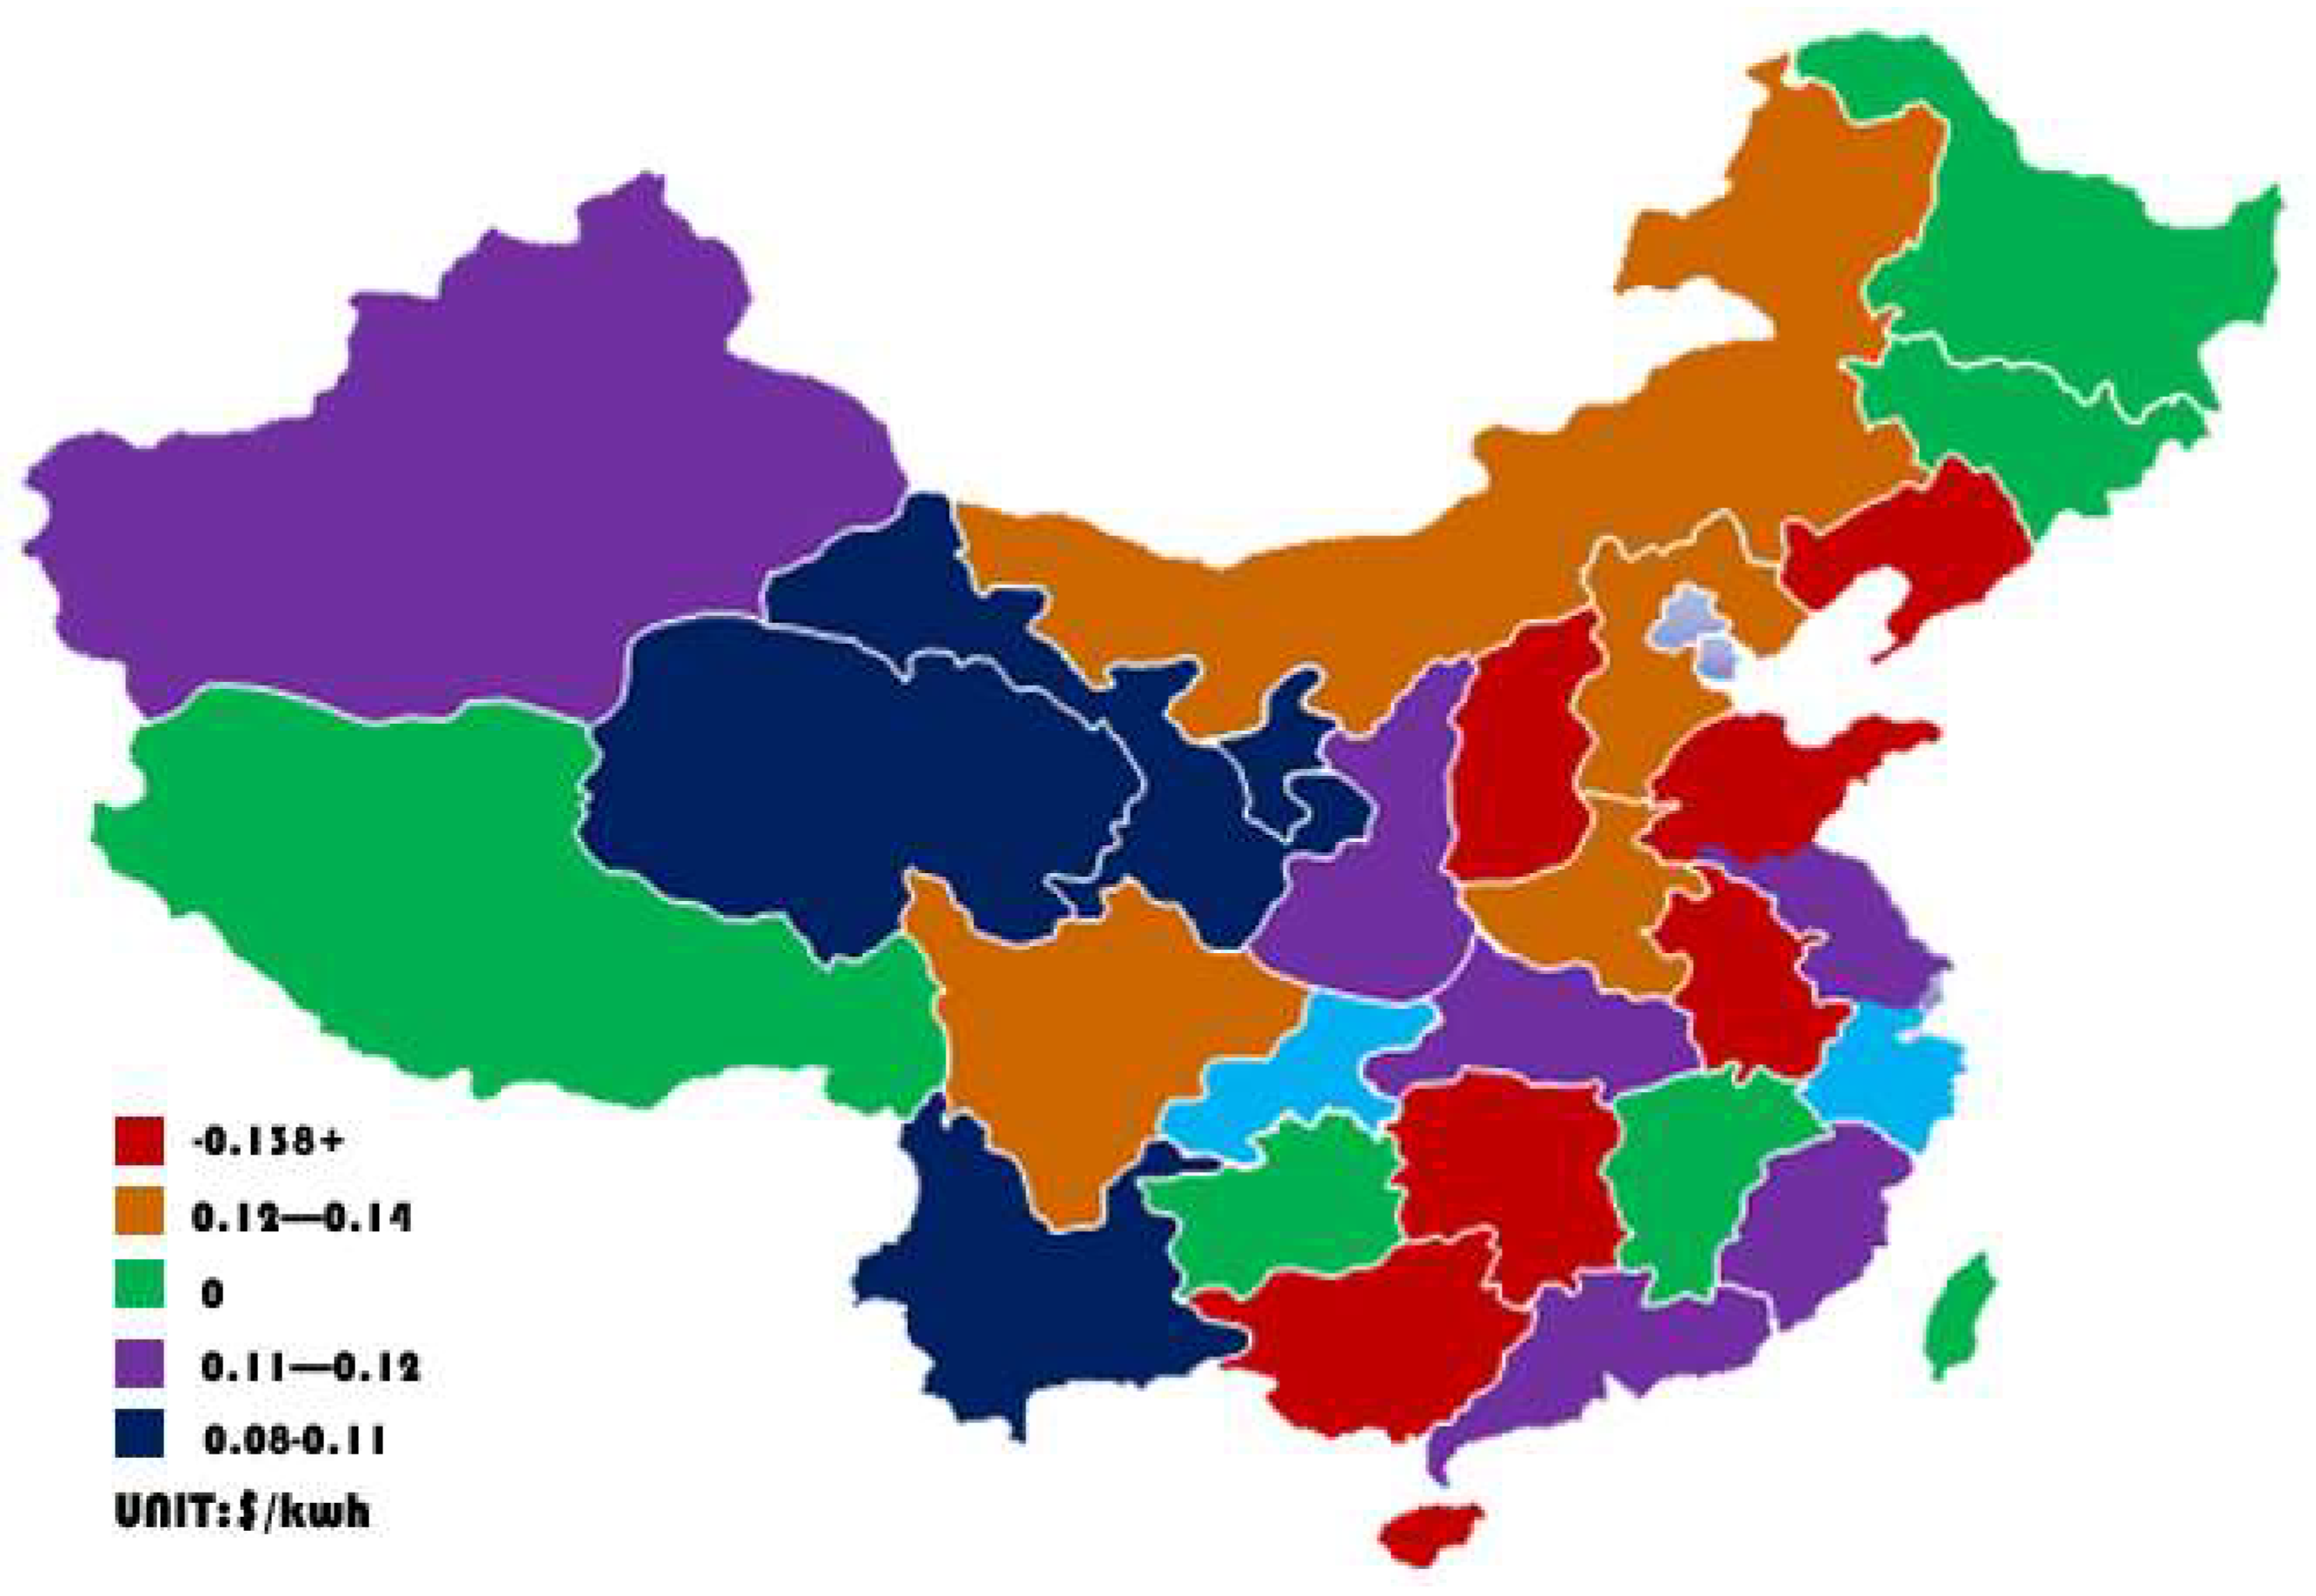
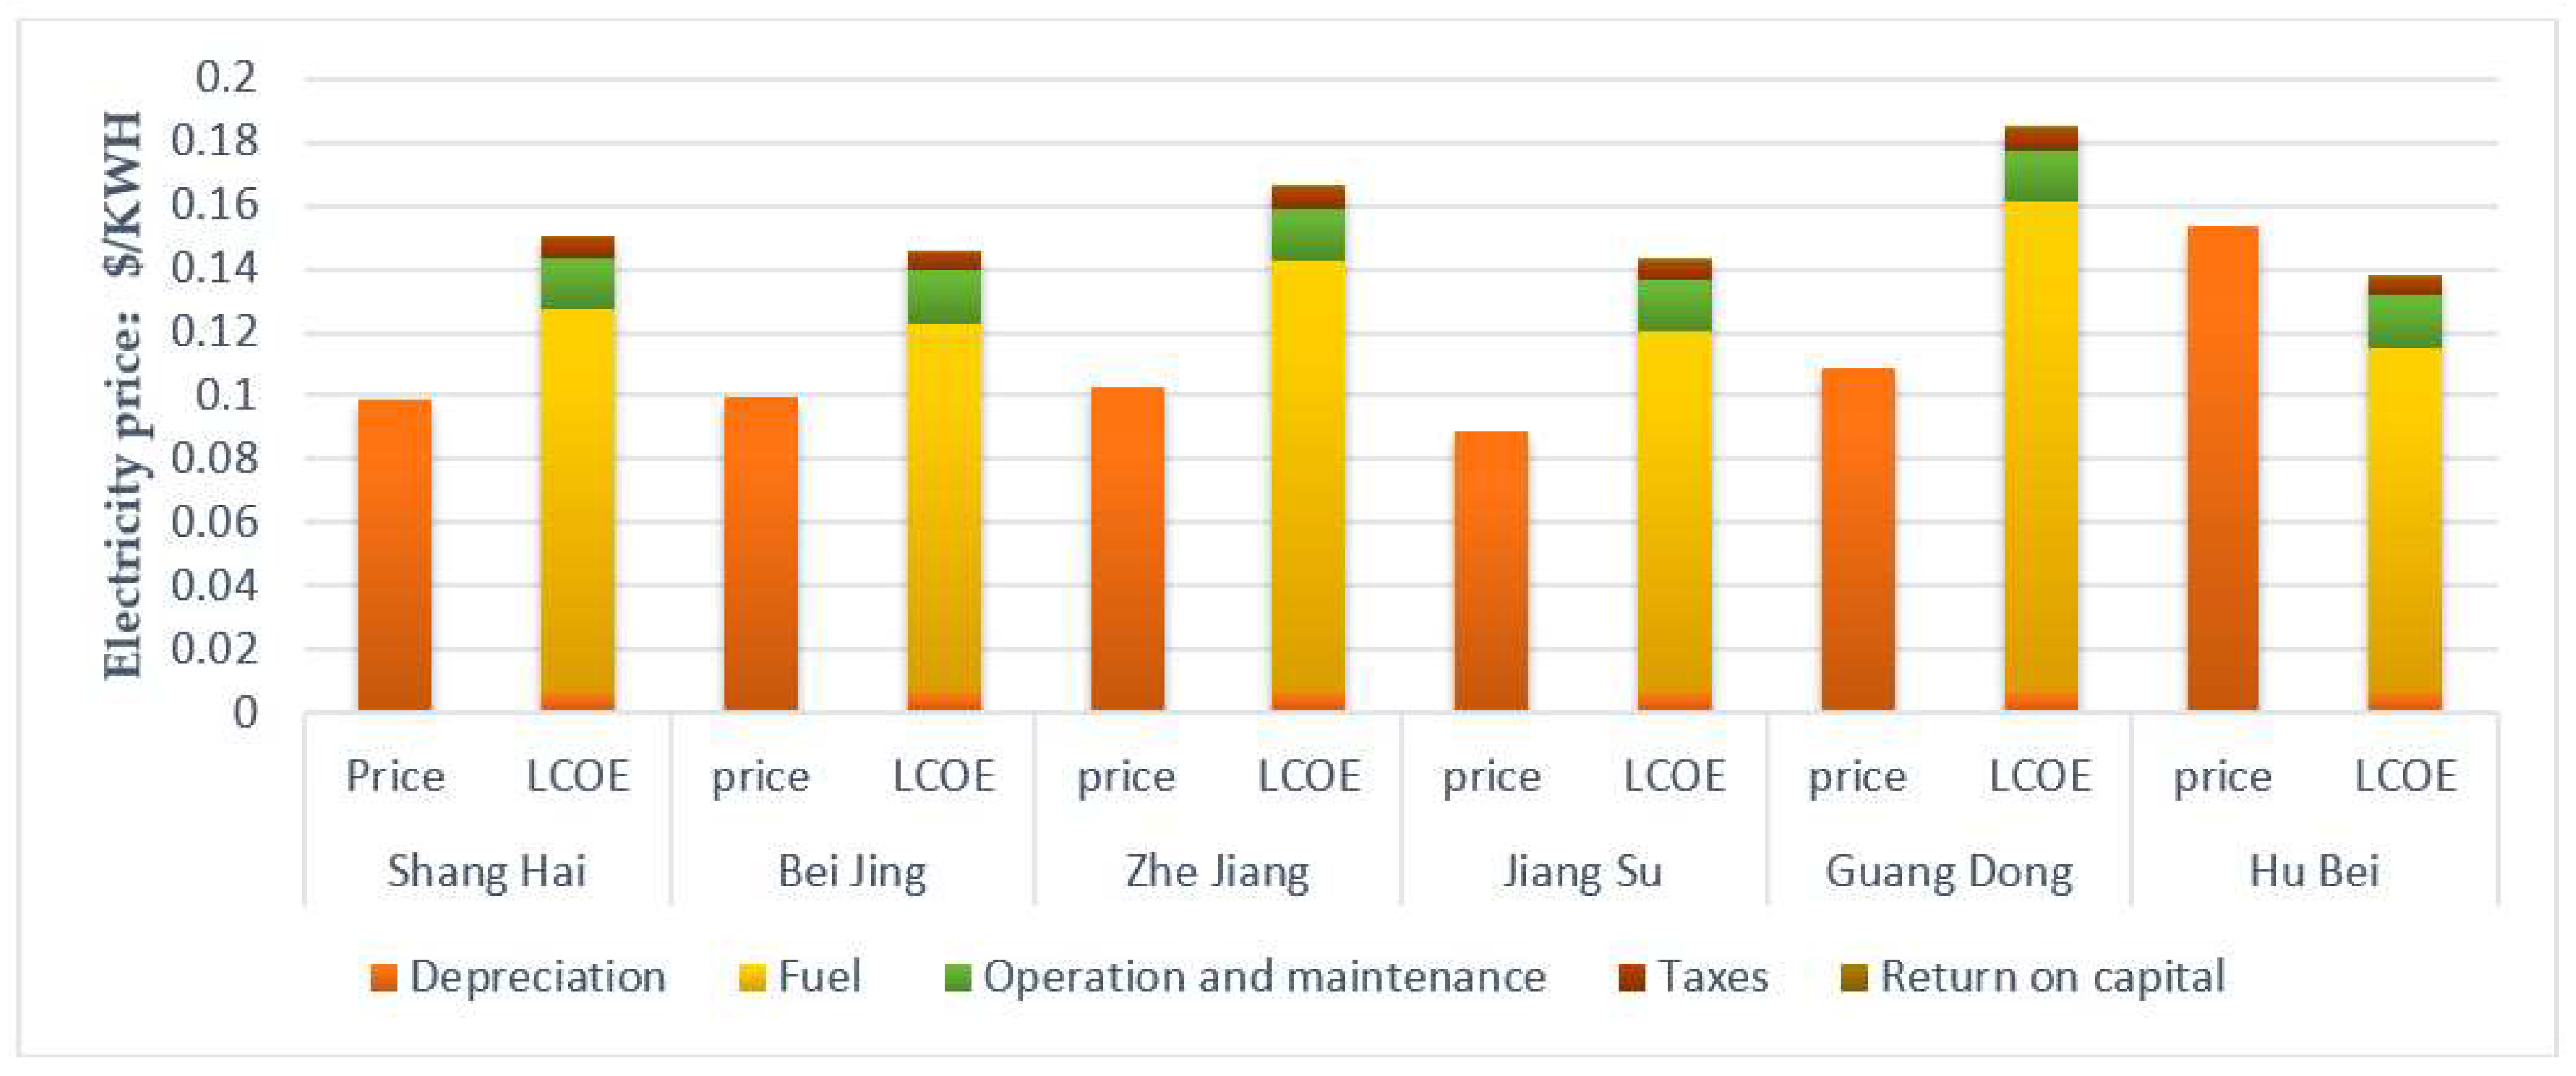
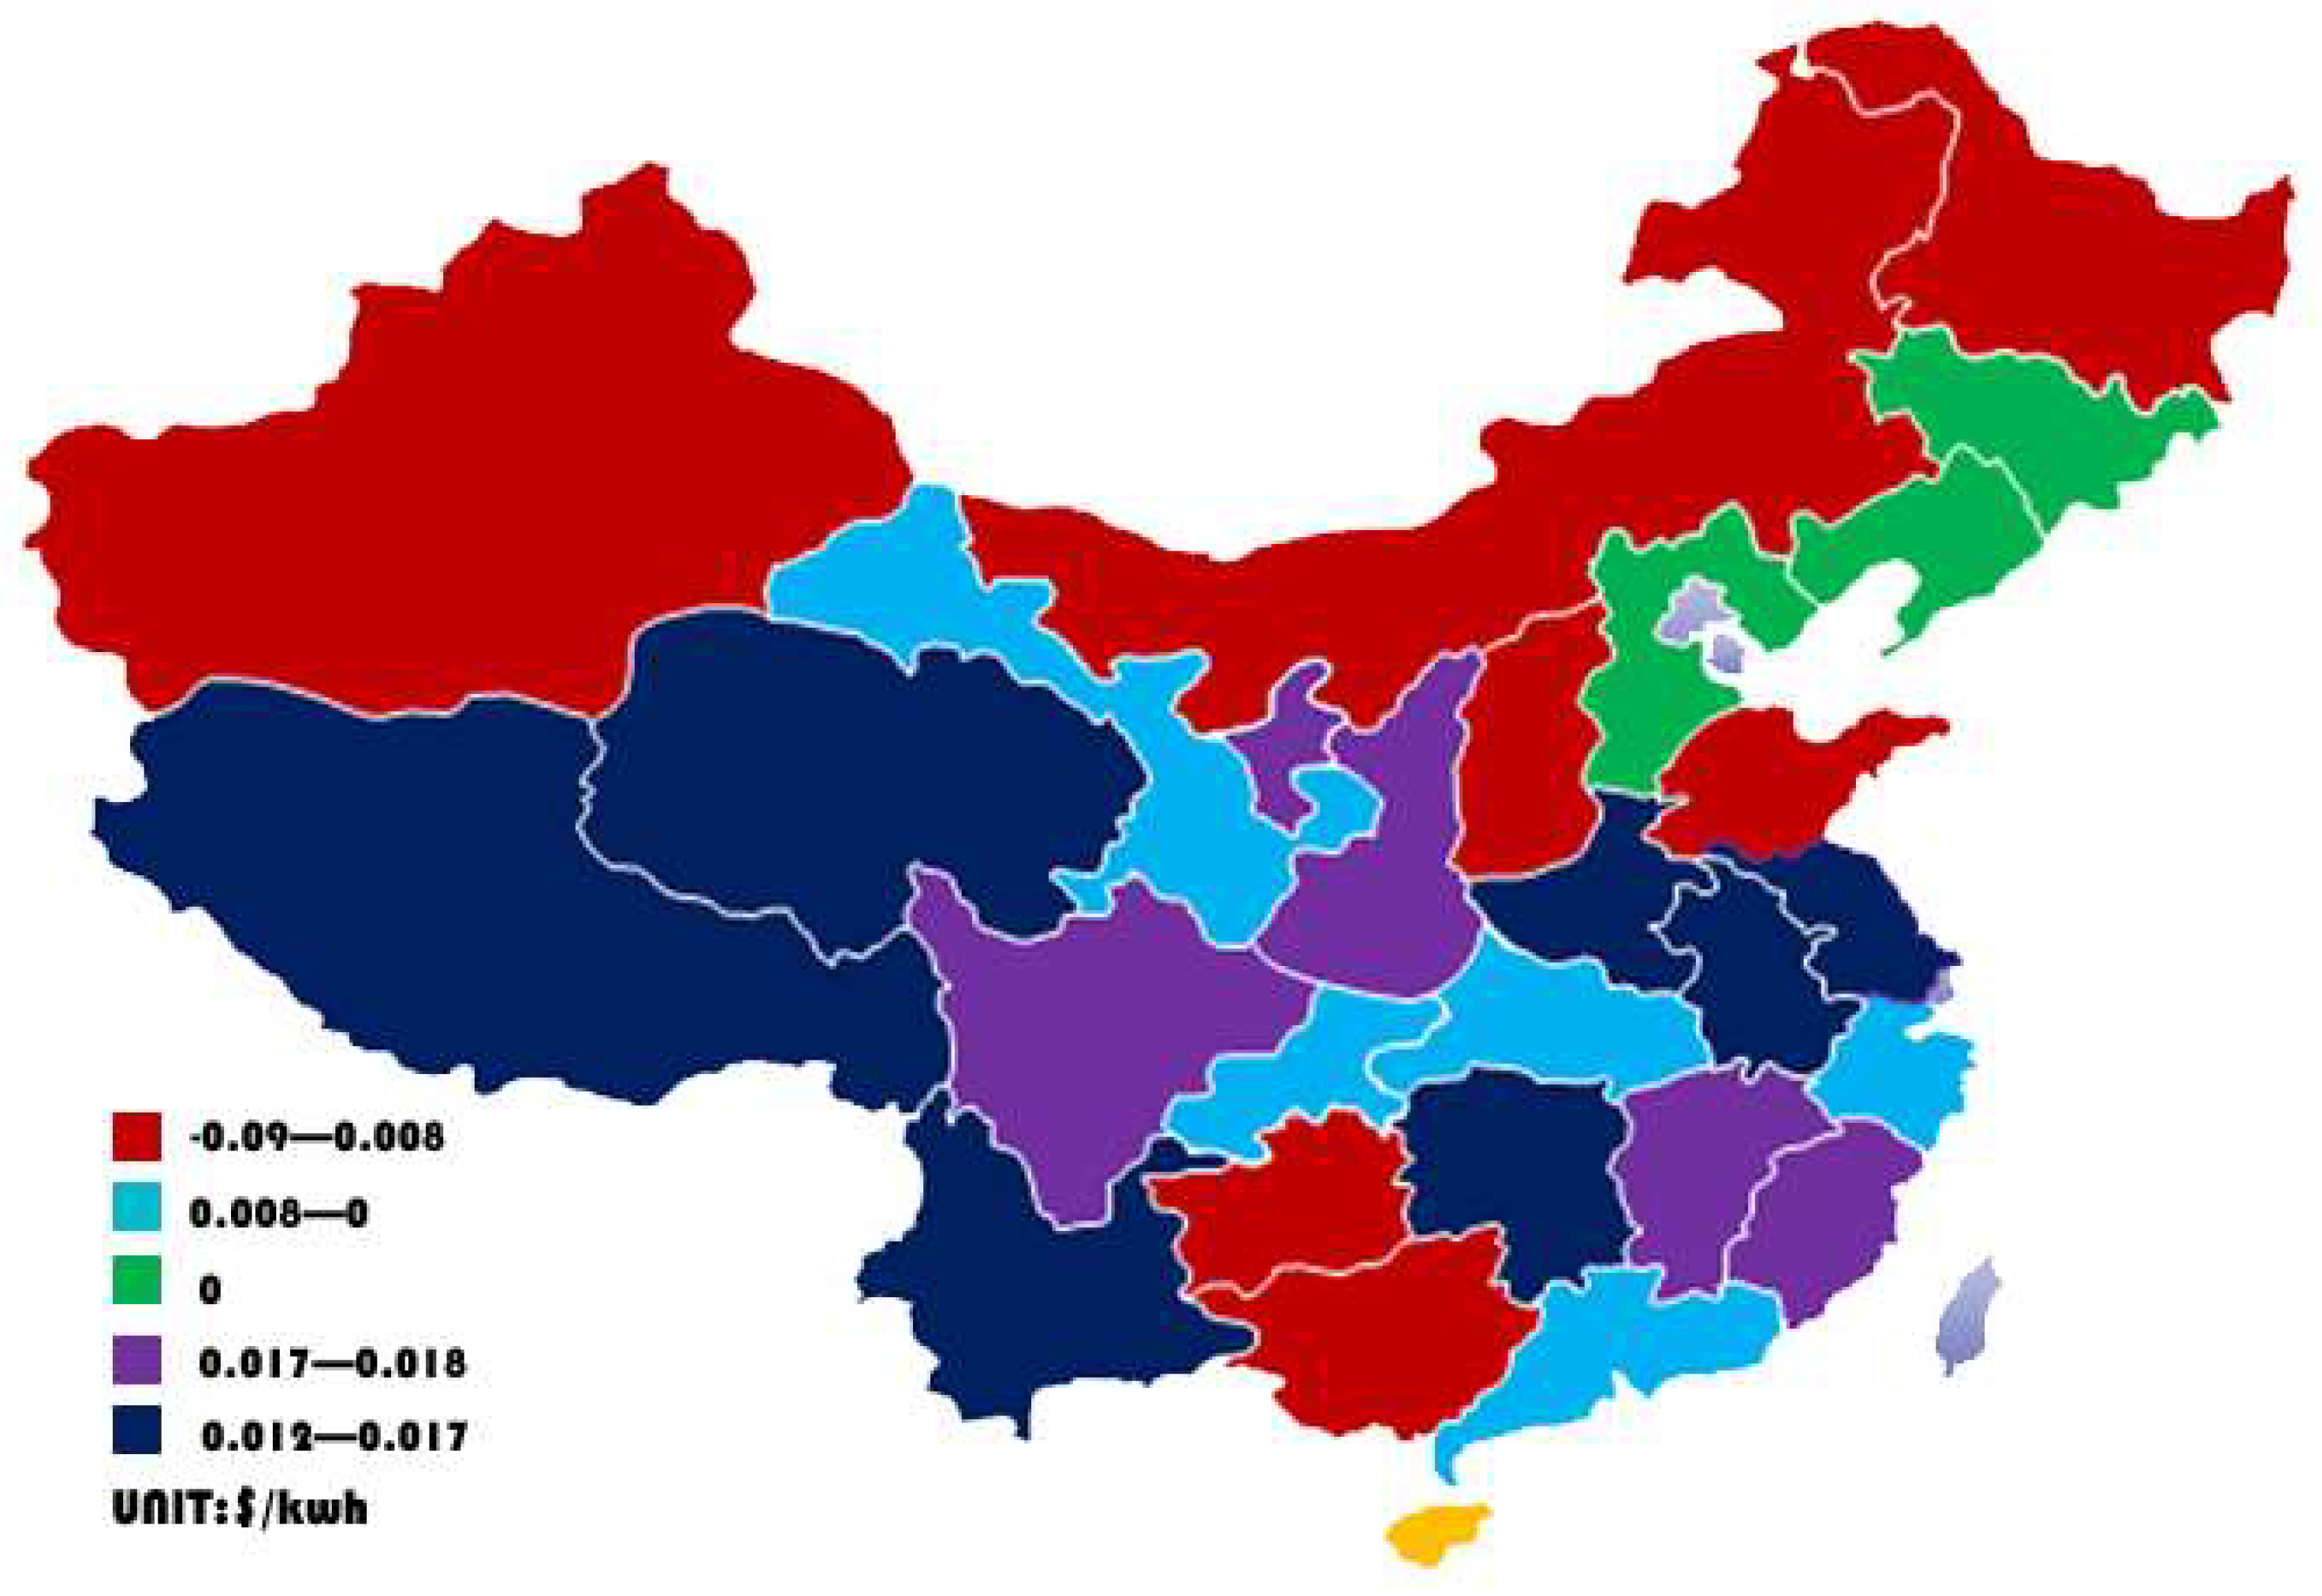
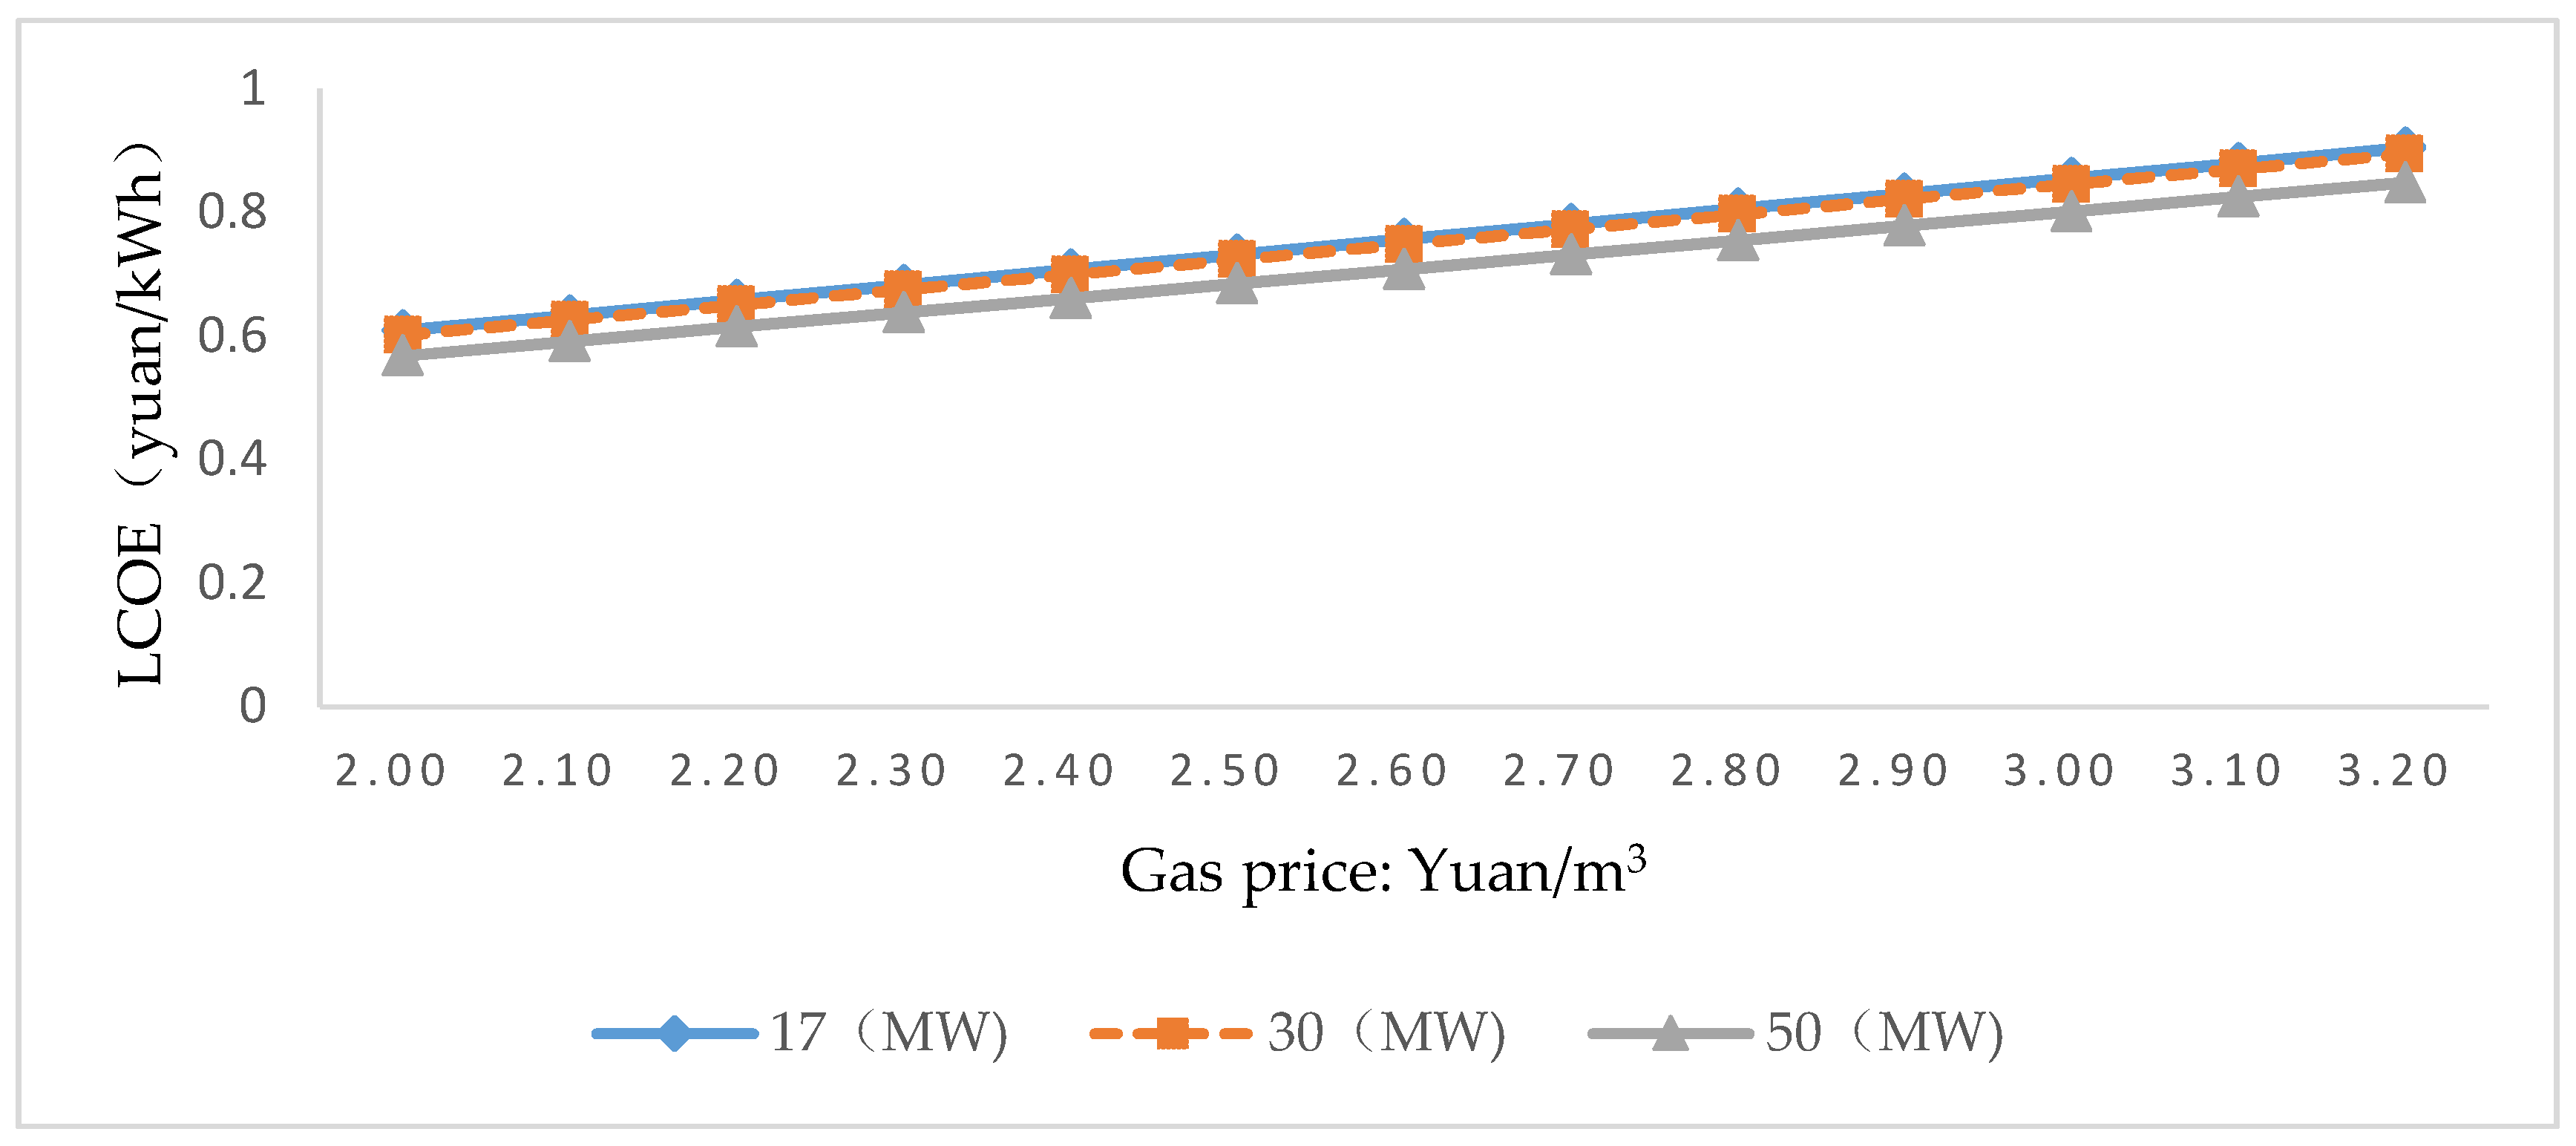
Table 1.
Coalbed methane extraction and utilization in China in 2010–2014.
| Years | Pumping Volume | Utilization Volume | ||||
|---|---|---|---|---|---|---|
| Total | Downhole Extraction | Ground Production | Total | Downhole Extraction | Ground Production | |
| 2010 | 88 | 73.5 | 14.5 | 36 | 25 | 11 |
| 2011 | 115 | 92 | 23 | 53 | 35 | 18 |
| 2012 | 141 | 114 | 27 | 58 | 38 | 20 |
| 2013 | 156 | 126 | 30 | 66 | 43 | 23 |
| 2014 | 170 | 133 | 37 | 77 | 45 | 32 |
Table 2.
Shale gas’s exploration and investment in China in 2014.
| Company | 2D Seismic | 3D Seismic | Drilling | Pipeline | Production | Input |
|---|---|---|---|---|---|---|
| MLR | 210 | - | 66 | - | - | 6.6 |
| Local government | 739.82 | - | 45 | - | - | 4.6 |
| Sinopec | 4793.61 | 999.5 | 184 | 141.3 | 11.4 | 126 |
| CNPC | 6076 | 757 | 358 | 93.7 | 1.6 | 68 |
| others | 0 | 105.35 | 65 | - | - | 7.2 |
| CNOOC | 316.18 | - | 5 | - | - | 1 |
| others | 2178.65 | 272 | 14 | - | - | 1.4 |
| Bid company | 7503.9 | - | 43 | - | - | 15.2 |
| Total | 21,818.16 | 2133.85 | 780 | 235 | 13 | 230 |
Table 3.
Imports of long-distance natural gas pipeline.
| Project Name | Designing Ability | Status | Production Time | Length (Overseas) |
|---|---|---|---|---|
| A line of CAP | 300 bcm/year | in production | December 2009 | 1830 km |
| B line of CAP | in production | October 2010 | ||
| C line of CAP | 250 bcm/year | in production | May 2014 | |
| D line of CAP | 300 bcm/year | under construction | - | 840 km |
| BP gas pipeline | 120 bcm/year | in production | July 2013 | 793 km |
| East line of China-Russia | 380 bcm/year | under construction | - | 4000 km |
| West line of China-Russia | 300 bcm/year | in production | - | 2600 km |
Notes: CAP is Central Asia Pipeline and BP is Burma Pipeline.
Table 4.
Parameters and symbols in the formulas and their meanings.
| Symbol | Meaning | Symbol | Meaning |
|---|---|---|---|
| OPE | The annual operating expenses, including insurance costs, repair costs, labor costs | H | Annual utilization hours |
| TA | Taxes paid during the year, including business tax, value added tax, land tax and so on | S | Installed capacity |
| CAPEX | The annual value of initial investment costs, including own funds, loans and depreciation | d | Annual decay rate of steam turbine power generation efficiency |
| NG | The amount of natural gas used that yea | Q | The amount of heat released per cubic g of natural gas |
| NGP | Current natural gas prices | D | Cold and hot consumption accounted for the total system of cold, the percentage of calories |
| HC | Current year’s labor costs | M | The heat contained per kWh of electricity |
| CI | Current year loan interest | η | The overall efficiency of a CCHP system |
| EG | Gas turbine power generation | λ | Gas turbine power generation efficiency |
| EH | Cooling or heating provided by the conversion of calories | V | Gas consumption per hour at full load of gas turbine |
| N | System operation period | r | discount rate |
| E | The energy supplied by the system | I | insurance rate |
| Ou | Power plant electricity rate | C | Installed capacity |
Table 5.
Related parameters of centralized natural gas power generation (NGPG) projects (base load).
Table 5.
Related parameters of centralized natural gas power generation (NGPG) projects (base load).
| Parameter | Setting Value | Parameter | Setting Value |
|---|---|---|---|
| Unit investment (yuan/kW) | 3000 | Gas price (yuan/m3) | 2.6~3.27 |
| Own funds rate (%) | 20 | VAT (%) | 17 |
| Loan period (year) | 10 | Income tax (%) | 25 |
| Annual interest rate (%) | 6 | Property tax (%) | 1.2 |
| Internal rate of return on capital (%) | 8 | Urban maintenance and construction tax (%) | 5 |
| Residual value of assets (%) | 5 | Education surcharge (%) | 0.5 |
| Discount Rate (%) | 8 | Water, fuel VAT (%) | 13 |
| Depreciation rate (%) | 5 | Material VAT (%) | 17 |
| Operating life (year) | 20 | Repair rate (%) | 2 |
| Power consumption (m3/kWh) | 0.18~0.2 | Insurance rate (%) | 0.25 |
| Plant electricity rate (%) | 4 | Labor costs (Yuan/year) | 80,000 |
| Pollution control costs (yuan/kWh) | 0.006 | Materials and other fees (yuan/kWh) | 0.02 |
| Wage rate of workers (%) | 6 | Materials and other fee increases (%) | 2 |
Table 6.
Related parameters of centralized NGPG projects (peak load).
| Parameter | Setting Value | Parameter | Setting Value |
|---|---|---|---|
| Unit investment (yuan/kW) | 3000 | Gas price (yuan/m3) | 2.6~3.27 |
| Own funds rate (%) | 20 | VAT (%) | 17 |
| Loan period (year) | 10 | Income tax (%) | 25 |
| Annual interest rate (%) | 6 | Property tax (%) | 1.2 |
| Operating life (year) | 20 | Heating time (hours) | 2880 |
| Residual value of assets (%) | 5 | Education surcharge (%) | 0.5 |
| Discount Rate (%) | 8 | Water, fuel VAT (%) | 13 |
| Depreciation rate (%) | 5 | Material VAT (%) | 17 |
| Internal rate of return on capital (%) | 8 | Repair rate (%) | 2 |
| Power consumption (m3/kWh) | 0.18~0.2 | Insurance rate (%) | 0.25 |
| Plant electricity rate (%) | 4 | Labor costs (yuan/year) | 80,000 |
| Pollution control costs (yuan/kWh) | 0.006 | Materials and other fees (yuan/kWh) | 0.02 |
| Wage rate of workers (%) | 6 | Materials and other fees increases (%) | 2 |
| Heat generated per kilowatt (kJ) | 3600 | Annual heat supply (kJ) | 4,681,950 |
| Urban maintenance and construction tax (%) | 5 | Electric compression coefficient | 3 |
Table 7.
Distributed NGPG project related parameters.
| Parameter | Setting Value | Parameter | Setting Value |
|---|---|---|---|
| Gas turbine power generation equipment (million/unit) | 5213.4–11,354 | Gas value per cubic meter of natural gas (kJ/m3) | 35,000 |
| Cooling facilities costs (yuan/kW) | 104 | Produce cold, hot consumption ratio | 40–100% |
| Heating facilities costs (yuan/kW) | 850 | For hot and cold time ratio | 0.66 |
| Distributed natural gas utilization hours | 5000 | The overall efficiency of a CCHP system | 80% |
| Property tax (%) | 1% | Electricity contains the heat | 3600 kJ |
| Property tax deduction ratio (%) | 30% | Design and installation rates | 10% |
Table 8.
Values and floating ranges of parameter in basic scenario.
| Parameter | Setting Value | Floating Range (Gradient of Variation) |
|---|---|---|
| CCHP system total efficiency (%) | 80 | Constant |
| Operating hours | 5000 | 200 |
| Natural gas price (yuan/m3) | 2.5 | 0.1 |
| Consumed electricity (%) | 90 | 2 |
| For hot and cold time ratio (%) | 66 | 2 |
| Cold, heat consumption ratio (%) | 70 | 5 |
| Bank loan ratio (%) | 0 | 10 |
Table 9.
The levelized cost of electricity (LCOE) of centralized NGPG in base and peak scenarios (Unit: $/kWh).
Table 9.
The levelized cost of electricity (LCOE) of centralized NGPG in base and peak scenarios (Unit: $/kWh).
| LCOE Structure | Base Load Scenario (CHP) | Peak Scenario |
|---|---|---|
| Fuel costs | 0.10941 | 0.0949 |
| Other variable costs | 0.00039 | 0.0035 |
| Own capital return | 0.00111 | 0.0033 |
| Loan repayments | 0.00527 | 0.0111 |
| Depreciation | 0.00621 | 0.0148 |
| Other fixed costs | 0.0039 | 0.0196 |
| Income tax | 0.00043 | 0.0011 |
| VAT | 0.00206 | 0.0051 |
| Urban maintenance and construction Tax | 0.00010 | 0.0021 |
| Education surcharge | 0.00001 | 0.0006 |
| Total cost | 0.1324 | 0.1539 |
Table 10.
Gas turbine peak compensation.
| Area | Compensation Standards | 350 MW Unit Compensation |
|---|---|---|
| North China | Compensate 260 yuan/MW for each start-stop | 91,000 yuan |
| East China | Compensate 260 yuan/MW for each start-stop | 91,000 yuan |
| Central China | Compensate 500 yuan/MW for each start-stop | 130,000 yuan |
| South China | Compensate 0.1 × R3 yuan/kW for each start-stop, of which, R3 values are: Guangdong 1.04, Guangxi 0.71, Yunnan 0.93, Guizhou 0.56, Hainan 0.79 | |
Table 11.
NGPG subsidies and feedforward price forecast.
| Regional Power Grid | Total Subsidy (billion yuan) | Price Adjustment (yuan/MWh) | ||
|---|---|---|---|---|
| 2015 | 2020 | 2015 | 2020 | |
| North China Power Grid | 103.2 | 155.5~183.1 | 7.52 | 8.34~9.83 |
| China Southern Power Grid | 216.6 | 252.1~289.1 | 22.1 | 18.6~21.34 |
| East China Power Grid | 305.7 | 353.8~408.0 | 22.0 | 19.1~22.06 |
© 2018 by the authors. Licensee MDPI, Basel, Switzerland. This article is an open access article distributed under the terms and conditions of the Creative Commons Attribution (CC BY) license (http://creativecommons.org/licenses/by/4.0/).
Share and Cite
MDPI and ACS Style
Liu, Y.; Li, F.Y.; Yu, X. Gas Supply, Pricing Mechanism and the Economics of Power Generation in China. Energies 2018, 11, 1058. https://doi.org/10.3390/en11051058
AMA Style
Liu Y, Li FY, Yu X. Gas Supply, Pricing Mechanism and the Economics of Power Generation in China. Energies. 2018; 11(5):1058. https://doi.org/10.3390/en11051058
Chicago/Turabian StyleLiu, Yuanxin, Feng Yun Li, and Xinhua Yu. 2018. "Gas Supply, Pricing Mechanism and the Economics of Power Generation in China" Energies 11, no. 5: 1058. https://doi.org/10.3390/en11051058
Note that from the first issue of 2016, this journal uses article numbers instead of page numbers. See further details here.