The Effect of Temperature on the Methanogenic Activity in Relation to Micronutrient Availability

1
The Petroleum and Petrochemical College, Chulalongkorn University, Soi Chula 12, Phayathai Road, Pathumwan, Bangkok 10330, Thailand
2
Energy Policy and Planning Office, Ministry of Energy, 121/1-2 Phetchaburi Road, Ratchathewi, Bangkok 10400, Thailand
3
Center of Excellence on Petrochemical and Materials Technology, Chulalongkorn University, Soi Chula 12, Phyathai Road, Pathumwan, Bangkok 10330, Thailand
*
Author to whom correspondence should be addressed.
Energies 2018, 11(5), 1057; https://doi.org/10.3390/en11051057
Submission received: 6 April 2018
/
Revised: 23 April 2018
/
Accepted: 23 April 2018
/
Published: 25 April 2018
(This article belongs to the Special Issue BioEnergy and BioChemicals Production from Biomass and Residual Resources)
Abstract
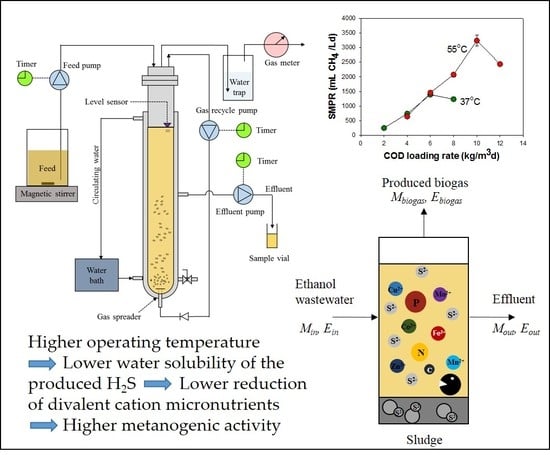
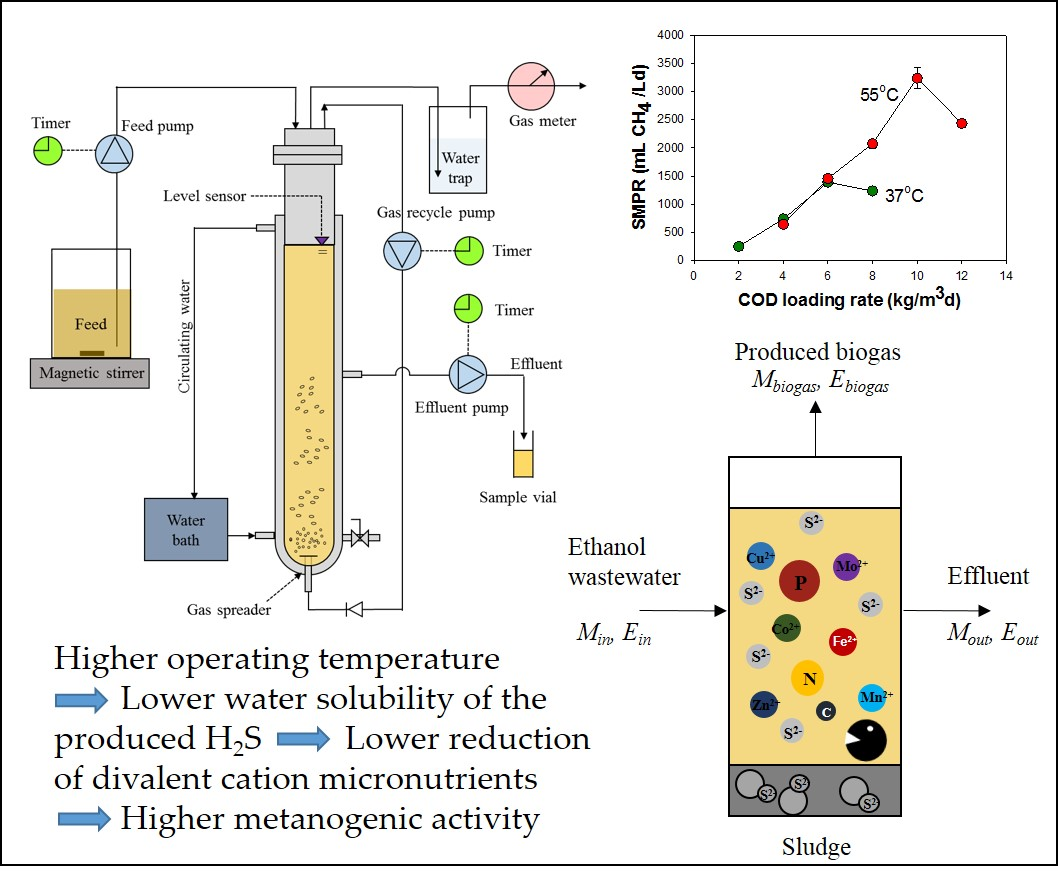
:In the view of microbial community, thermophilic microorganisms were reported to have faster biochemical reaction rates, which are reflected by a higher methane production rate. However, there has no research to discuss the effect of temperature on methanogenic activity in relation to micronutrient transport and availability. The objective of this study was to investigate the effect of temperature on methanogenic activity in relation to nutrient uptakes, micronutrient transports, and mass balance using anaerobic sequencing batch reactors (ASBR) with recycled biogas for treating ethanol wastewater at mesophilic (37 °C) and thermophilic (55 °C) temperatures. The increase in temperature from 37 to 55 °C increased in both of the optimum chemical oxygen demand (COD) loading rate and methanogenic activity, corresponding to the results of N and P uptakes, energy balance, and mass balance. The higher temperature of the thermophilic operation as compared to the mesophilic one caused a lower water solubility of the produced H2S, leading to lowering the reduction of divalent cation micronutrients. The thermophilic operation could prevent the deficit of micronutrients, thus causing a higher methanogenic activity, while the mesophilic operation still had the deficit of most micronutrients, leading to the lower activity.
1. Introduction
Sustainable and renewable energy resources are of great interest in research and development in order to replace the limited and essentially non-renewable fossil fuels. Biogas is one potential renewable resource that is produced via anaerobic digestion (AD) of a variety of waste materials under ambient temperature and pressure, and is typically composed of 60–70% methane (CH4), 30–40% carbon dioxide (CO2), and a trace amount of hydrogen sulfide (H2S) [1,2,3,4]. An AD is economically applied for industrial wastewaters, because it provides the dual benefits of the energy gain from the produced biogas and the reduction in wastewater treatment cost [5,6,7].
Anaerobic sequencing batch reactors (ASBRs), which are classified as high rate anaerobic systems, have been known to be able to handle wastewater containing a high level of suspended solids because they can maintain a high microbial concentration in the system [8,9]. A conventional ASBR system for CH4 production from wastewater uses a mechanical stirrer for mixing, which causes high power consumption for operation. As reported previously, the use of the produced biogas for mixing can enhance the CH4 transport from the aqueous to gaseous phases by entraining CH4, mostly adhered to the biomass and bacterial cell membranes, to exit the aqueous phase more easily, and so it results in a higher CH4 yield [10]. The recirculation of the produced biogas was reported to enhance the CH4 production level under a mesophilic temperature by approximately 12–26% [11,12].
The biogas production from organic compounds via an anaerobic degradation process consists of the four sequential stages of hydrolysis, acidogenesis, acetogenesis, and methanogenesis, as summarized in Table 1 [2,13,14,15,16,17]. Basically, the methanogenesis is the most vulnerable step of AD, since its reaction rate is much slower than those of the first three steps. The overall process performance depends on several environmental factors, including temperature, solution pH, the presence of toxic compounds, and nutrient levels [1,18].
Trace metals, which are exerted as micronutrients, such as iron (Fe2+), copper (Cu2+), zinc (Zn2+), nickel (Ni2+), cobalt (Co2+), manganese (Mn2+), and molybdenum (Mo2+) play important role on the process performance and the stability of AD. Their deficiency is usually a primary reason of poor process efficiency of AD, in spite of proper management and operational control [19]. The major reason of micronutrient deficiency in AD results from the chemical precipitation of all the divalent cations (micronutrients) with sulfide ions (S2−) being produced from the reduction of sulfate and the decomposition of sulfur-containing organic compounds [20].
Mesophilic (37 °C) and thermophilic (55 °C) AD systems are the most commonly used AD processes. Several studies reported the temperature effect on the process performance of AD [21,22,23,24]. The thermophilic AD has been claimed advantages over mesophilic AD. Firstly, the capability to produce pathogen free streams with no restrictions on crop type, harvesting, or site access for land application [24]. Secondly, thermophiles give a faster biochemical reaction rate, as compared with mesophiles [22]. Concurrently, the thermophilic AD was reported to be more sensitive to operational conditions than mesophilic AD, while some studies claim that it is no any problem with the long time adaptation of biomass in the thermophilic AD [23]. In the view of the microbial community, thermophilic microorganisms were reported to have higher metabolic activity and substrate conversion rates reflected by a higher methane production rate than mesophilic microorganisms [25]. Up to now, there has no research to discuss why thermophiles have higher methanogenic activity than mesophiles, and the effect of temperature on methanogenic activity in relation to micronutrient transport and availability. In this investigation, it was, for the first time, hypothesized that the thermophilic AD had a lower precipitation of the metal sulfides, leading to a higher availability of most micronutrients for methanogenic activity in thermophilic AD, as compared with the mesophilic AD. This hypothesis is based on the fundamental knowledge that the solubility of H2S in water decreases with an increasing temperature, and so the produced H2S in AD is present in the gaseous phase at the thermophilic temperature higher than that in the mesophilic AD [26].
The aim of this study was, for the first time of its kind, to investigate the effect of temperatures (37 and 55 °C) on methanogenic activity in relation to micronutrient availability using anaerobic sequencing batch reactor (ASBR) with recycled biogas. The COD loading rates were firstly varied to determine the optimum values under the different two temperatures. In addition, the macro- and micro- nutrient transport and the overall mass and energy balances were taken to explain why AD operated at 55 °C has a higher methanogenic activity than that at 37 °C.
2. Materials and Methods
2.1. Ethanol Wastewater
The ethanol wastewater used in this study was obtained from a cassava root fermentation plant, and was kindly supplied by Sapthip Co., Ltd., Lopburi, Thailand. The wastewater was collected from a centrifuge, where a large quantity of unfermented cassava roots in the discharge from the bottom of the distillation columns was removed. The wastewater still contained a small quantity of solid particles of a small particle size (<425 µm). The collected wastewater was kept at 4 °C until use, and was used as received.
2.2. Seed Sludge Preparation
A seed sludge sample, collected from the upflow anaerobic sludge blanket reactor (UASB) unit of a biogas production plant at the same factory that provided the ethanol wastewater (Section 2.1), was firstly concentrated by sedimentation. The concentrated sludge was then added to each ASBR to obtain an initial mixed liquid volatile suspended solids (MLVSS) value of approximately 20,000 mg/L.
2.3. ASBR Operation
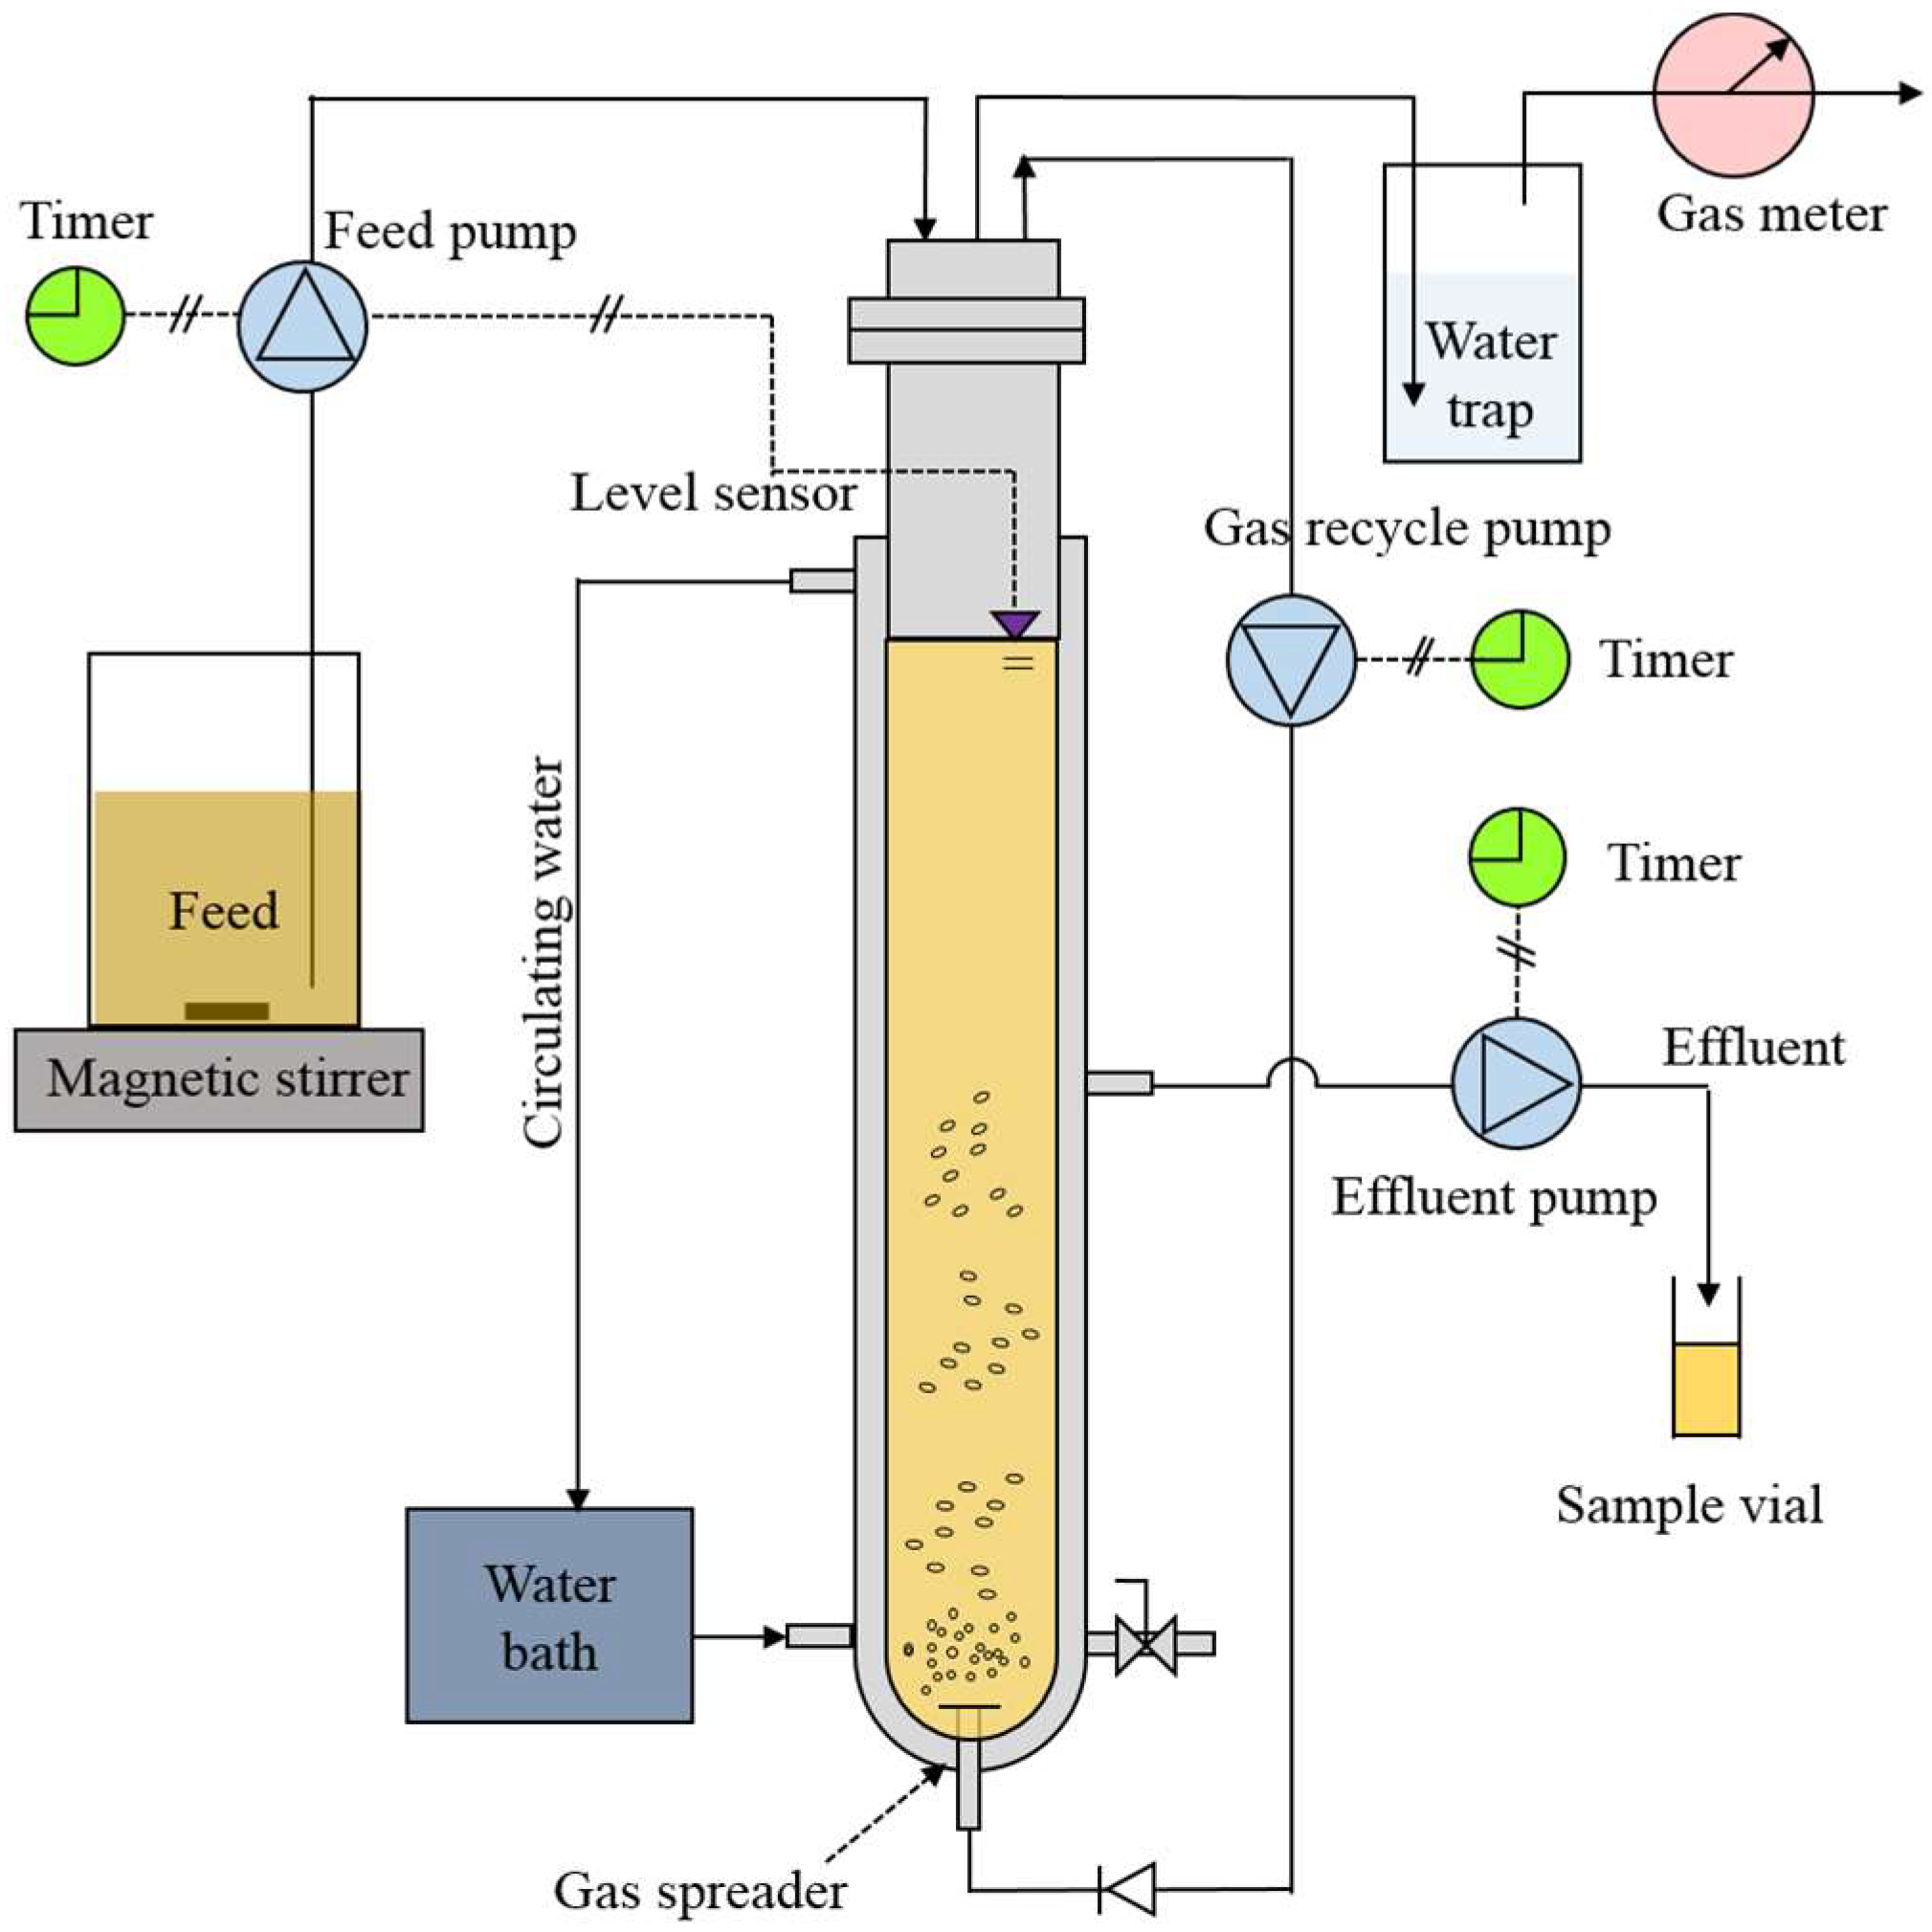
Each ASBR unit was made from a glass column with an inner diameter of 8 cm and a height of 70 cm (Figure 1). The bioreactors, with a total volume of 3.5 L, were operated at a working liquid volume of 2 L. Each reactor was entirely covered with a black foam sheet in order to prevent the photosynthetic activities from both algae and bacteria. The temperature in the ASBR unit was controlled by a water circulating bath via a water jacket on each bioreactor. The ASBR operation consisted of the four sequential steps of feed, react, settle, and decant, all of which were controlled by a set of digital timers. For the feed step (2 min), the ethanol wastewater was pumped into the top of the bioreactor using a peristaltic pump with a level probe. For the react step (116 min), the feed pump was turned off and another peristaltic pump was turned on to recycle the produced biogas at the top of the ASBR to the bottom of the ASBR column to achieve a homogeneous mixing of the bioreactor’s liquor, using a biogas flow rate of 0.25 L/min. For the settle step (120 min), the biogas recirculation was stopped so as to allow for the microbial cells to settle in the bioreactor. For the final decant step (2 min), the clarified effluent was drained out of the bioreactor by a peristaltic pump that was equipped with a level probe. The ASBR was operated at 6 cycles/d, as previously reported [27]. Each ASBR unit was operated at the given COD loading rate at either 37 or 55 °C until reaching a steady state, which was around four weeks. The steady state was determined as the onset of relatively constant values (standard deviation < 5%) of both the gas production rate and the effluent COD value over time. Then, the biogas and effluent samples were collected for analysis and measurement.
2.4. Measurements and Analytical Methods
The produced gas from the ASBR unit was passed through a water trap flask and measured by a wet gas meter to determine the biogas production rate. The gas composition was analyzed by gas chromatography (GC; Perkin-Elmer (Waltham, MA, USA), AutoSystem), equipped with a thermal conductivity detector (TCD) and a series of two packed columns (HayeSep D 100/120 mesh and Molecular sieve, Altech (Flemington, NJ, USA)). The injector, column, and detector temperatures were kept at 150, 60, and 200 °C, respectively. Argon was used as the carrier gas. The concentration of H2S in the produced gas was analyzed by another GC (Shimudsu (Kyoto, Japan), GC-2014), equipped with a flame photometric detector (FPD) and a capillary column (Agilent (Santa Clara, CA, USA), DB-1). The temperatures of injector, column and detector were kept at 100, 80, and 250 °C, respectively.
All volatile fatty acids (VFAs) in the influent and effluent samples were determined qualitatively and quantitatively by high performance liquid chromatography (HPLC, Shimudzu, LC-20A), equipped with a refractive index detector (RID, Shimudzu, RID-20A) and an Aminex HPX-87H column (Bio-Rad Laboratories, Hercules, CA, USA). The mobile phase (5 mM sulfuric acid) was kept at a flow rate of 0.6 mL/min and the column temperature was controlled at 60 °C.
The samples that were taken from the ASBR unit during the react step for any COD loading rate under the steady state condition were analyzed for the MLVSS content, which was used to represent the microbial concentration in the system. The effluent samples during the decant step were analyzed for the VSS to represent the microbial washout from the system. Both the MLVSS and VSS were determined according to the standard methods [28].
The organic contents in the ethanol wastewater and the effluent samples, in terms of the COD, were determined by the dichromate oxidation method using a COD digester (HACH, DRB 200) and measurement of the absorbance by a spectrophotometer (HACH, DR3800). The N concentration, as total-N, NH4+-N, NO3-N, and NO2−-N, in the influent and effluent samples were measured using the persulfate digestion, salicylate, cadmium reduction, and diazolization methods, respectively. The organic nitrogen (org-N) concentration was calculated by subtracting the sum of the NH4+-N, NO3−-N, and NO2−-N from the total-N [29]. The total P concentrations of the influent and effluent samples were determined by the molybdovanadate/acid persulfate digestion method (Hach Company, Loveland, CO, USA) [30]. The sulfur (S) concentrations, as sulfate and soluble sulfide, in the influent and effluent samples were measured by the SulfaVer 4 method and methylene blue method, respectively, (Hach Company) [30]. The effluent samples from all of the ASBR units were also measured for pH and total alkalinity. The total alkalinity was measured by the titration method with a standard acid solution (0.020 N H2SO4), following the method 8221 (HACH Company). The concentrations of some micronutrients (Fe2+, Co2+, Ni2+, Cu2+, Zn2+, Mn2+, and Mo2+) in the influent and effluent samples were measured using atomic absorption spectrophotometry (AAS; Varian (Palo Alto, CA, USA), SpectrAA 300).
The samples of influent and effluent were dried in an oven overnight at 105 °C before being analyzed for their calorific value and elemental content. The calorific value of each dried sample was determined using a bomb calorimeter (Leco (St Joseph, MI, USA), AC-500). The elemental composition of the dried sample was determined by an elemental analyzer (Leco, TruSpec-CHN). Oxygen, helium, and air were used as carrier gases with a combustion and burner temperatures of 950 and 850 °C, respectively.
3. Results and Discussion
3.1. Characteristics of the As-Used Ethanol Wastewater
The characteristics of the ethanol wastewater used in the present work are summarized in Table 2. The chemical oxygen demand (COD) values were in the range of 63,000 ± 900 mg/L, with a COD:Nitrogen (N):Phosphorous (P) ratio of 100:1:0.4. When compared to the theoretically required COD:N:P ratio of 100:0.5:0.1 for AD for biogas production [30], the studied ethanol wastewater likely contained sufficient amounts of both N and P, and so they were not supplemented in this study. The N in the ethanol wastewater was mostly in the form of organic nitrogen (org-N) with a significant amount of ammonium nitrogen (NH4+-N), but only a very small amount of nitrate nitrogen (NO3−-N) and no detectable nitrite nitrogen (NO2−-N). The high concentration of volatile fatty acids (VFAs, 11,100 ± 90 mg/L as HAc), with a very high concentration of HLa, resulted in the low pH value (3.5 ± 0.2) of the ethanol wastewater [31]. The self-degradation of wastewater under an anaerobic condition was the main reason for the high content of VFAs in the ethanol wastewater [30].
3.2. Process Performance Results
3.2.1. Organic Removal
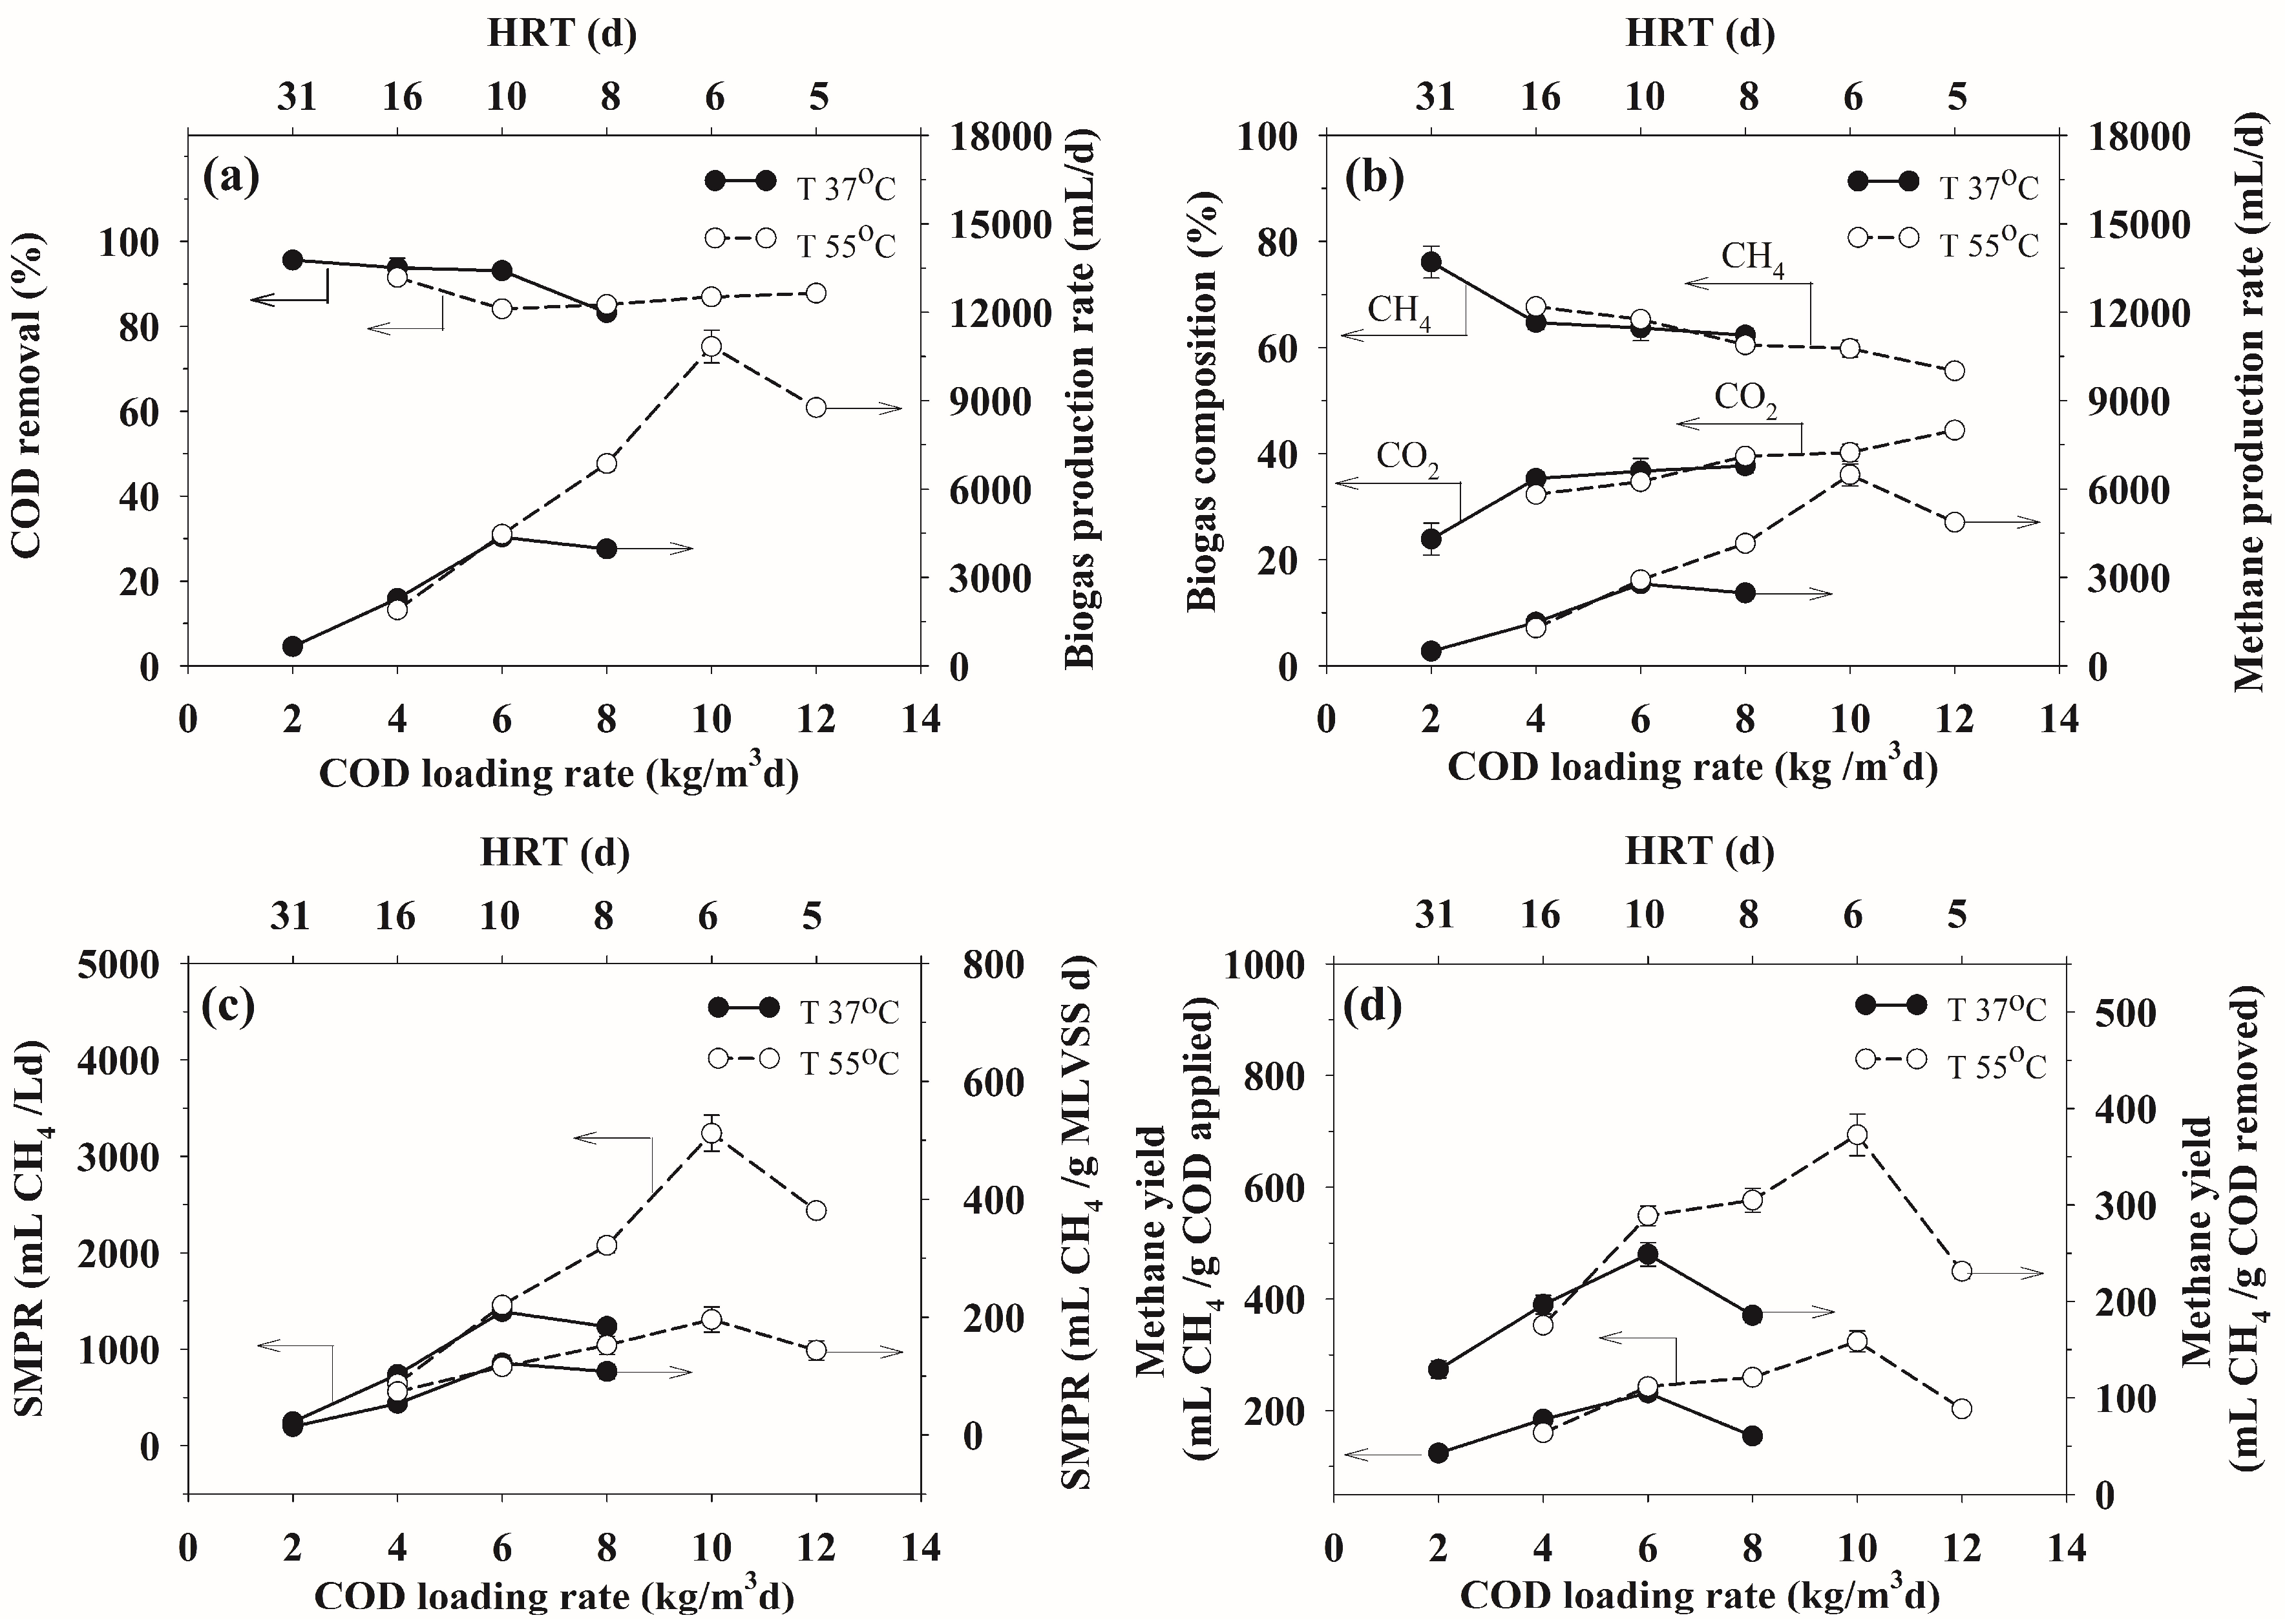
For the mesophilic operation (37 °C) of the ASBR, the COD removal efficiency was slightly decreased from 96 to 93% while increasing the COD loading rate from 2 to 6 kg/m3d, and then more strongly decreased to 83% when increasing the COD loading rate to 8 kg/m3d (Figure 2a). The slightly decrease in the COD removal level with an increased COD loading rate to 6 kg/m3d resulted from the increased level of organic compounds that are available to support the growth of the anaerobes. The COD removal efficiency then significantly decreased at COD loading rates above 6 kg/m3d was potentially because the VFA production rate then exceeded the VFA consumption rate, causing the VFA accumulation in the system to exceed the toxic level to the methanogens (Section 3.3).
For the thermophilic operation (55 °C) of the ASBR, the COD removal level decreased from 92 to 84% when the COD loading rate was increased from 4 to 6 kg/m3d, and it then remained almost unchanged at higher COD loading rates from 6 to 12 kg/m3d. The highest COD removal efficiency (92%) was found at the lowest COD loading rate of 4 kg/m3d. The COD removal profiles of the mesophilic and thermophilic ASBR systems were not very different, with COD removal efficiencies in the range of 83–96%. These results suggest that the cassava-based ethanol wastewater contained a high content of easily biodegradable organic compounds. The COD removal efficiency that was obtained in this study was superior to those of other studies of AD of different wastewaters, such as 58% from cassava stillage [32] and 64% for potato waste in a two-stage CSTR [33], 78% for ethanol stillage in a mesophilic continuous stirred tank reactor (CSTR) [34], 65 and 72% COD removal for cassava wastewater in mesophilic and thermophilic UASB units, respectively [15,35], and 80% for petrochemical wastewater in a mesophilic CSTR with recirculated biogas [12]. These comparisons could lead to the conclusion that this ASBR with recycled biogas is the most efficient bioreactor in terms of COD removal because it can provide a better settleability for both the bacterial sludge and suspended solids that are present in the wastewater during the settle step of the process [36].
3.2.2. Biogas and CH4 Production Rates
As shown in Figure 2a,b, the biogas and the CH4 production rates increased with increasing COD loading rates up to a maximum at a COD loading rate of 6 or 10 kg/m3d for the mesophilic or thermophilic temperature, respectively. Beyond these optimum COD loading rates, the biogas and CH4 production rates decreased markedly with increasing COD loading rates. Interestingly, when the ASBR system was operated at a COD loading rate that was lower than 6 kg/m3d, the process performance, in terms of both the COD removal efficiency and biogas production rates, were more or less the same at both of the temperatures, because the systems were under a low range of organic loads. The increased COD loading rate caused an increased level of organic substrates that are available for conversion to biogas, resulting in increased biogas and CH4 production rates. However, for either operational temperature, increasing the COD loading rate above the respective optimum value led to a reduction in both the biogas and CH4 production rates because of the increased toxicity of the accumulating VFAs (Section 3.3), as mentioned before. The thermophilic operation provided a higher optimum organic loading rate with a much higher biogas and CH4 production rates than the mesophilic operation, which is in good agreement with a previous investigation [23].
The biogas produced under the studied conditions consisted mainly of CH4 and CO2 without any H2, due to high self-retained pH (7–8), resulting in all of the produced H2 being completely converted anaerobically to CH4 by hydrogenotrophic methanogens. At both of the temperatures, the CH4 concentration gradually decreased and the CO2 concentration conversely increased with increasing COD loading rates. The increased COD loading rate increased the amount of organic compounds available for both hydrolytic and acidogenetic microbes, which grow some 10-fold faster than the methanogens [2], and so led to the higher production of CO2 (Table 1). In addition, H2 production was limited by unfavorable pH values for acetogens (Equations (8)–(13) in Table 1, resulting in a low reduction rate of CO2 for CH4 production (Equation (14)).
3.2.3. SMPRs and CH4 Yields
As shown in Figure 2c,d, both SMPRs (mL CH4/L d and mL CH4/g mixed liquor volatile suspended solids (MLVSS) d) and CH4 yields (mL CH4/g COD applied and mL CH4/g COD removed) showed similar trends, where they increased to maximum values, and then decreased with COD loading rates that were above their optimum COD loading rates. The optimum COD loading rates, 6 and 10 kg/m3d at 37 and 55 °C, respectively, provided the maximum values of both the SMPRs and CH4 yields for the ASBR systems. For the ASBR system that was operated at the mesophilic temperature, the highest SMPR values (1390 mL CH4/L d or 122 mL CH4/g MLVSS d) were much higher than those obtained from previous works (910 mL CH4/L d for the digestion of cassava wastewater in a two-stage UASB [15], 682 mL CH4/L d from digestion of potato waste in a two-stage CSTR [33], and 673 mL CH4/L d from the digestion of biodiesel wastewater with added glycerin in a two-stage ASBR [37]). Similarly, the highest SMPR value of 3240 mL CH4/L d or 196 mL CH4/g MLVSS d in the thermophilic ASBR system was much higher than that of previous work, which was 650 mL CH4/l d for the second tank of a two-stage UASB for cassava wastewater at a higher COD loading rate of 15 kg/m3d [35]. However, the maximum SMPR value, which was based on the microbial concentration of the present study, was lower than those of the previous studies, indicating that the mesophilic ASBR of this study could maintain a high concentration of microbial cells with a high methanogenic activity. In comparison, the thermophilic operation of the ASBR greatly outperformed the mesophilic operation, permitting a higher optimum COD loading rate and a higher CH4 production rate and yield.
3.3. VFA Concentration and Composition
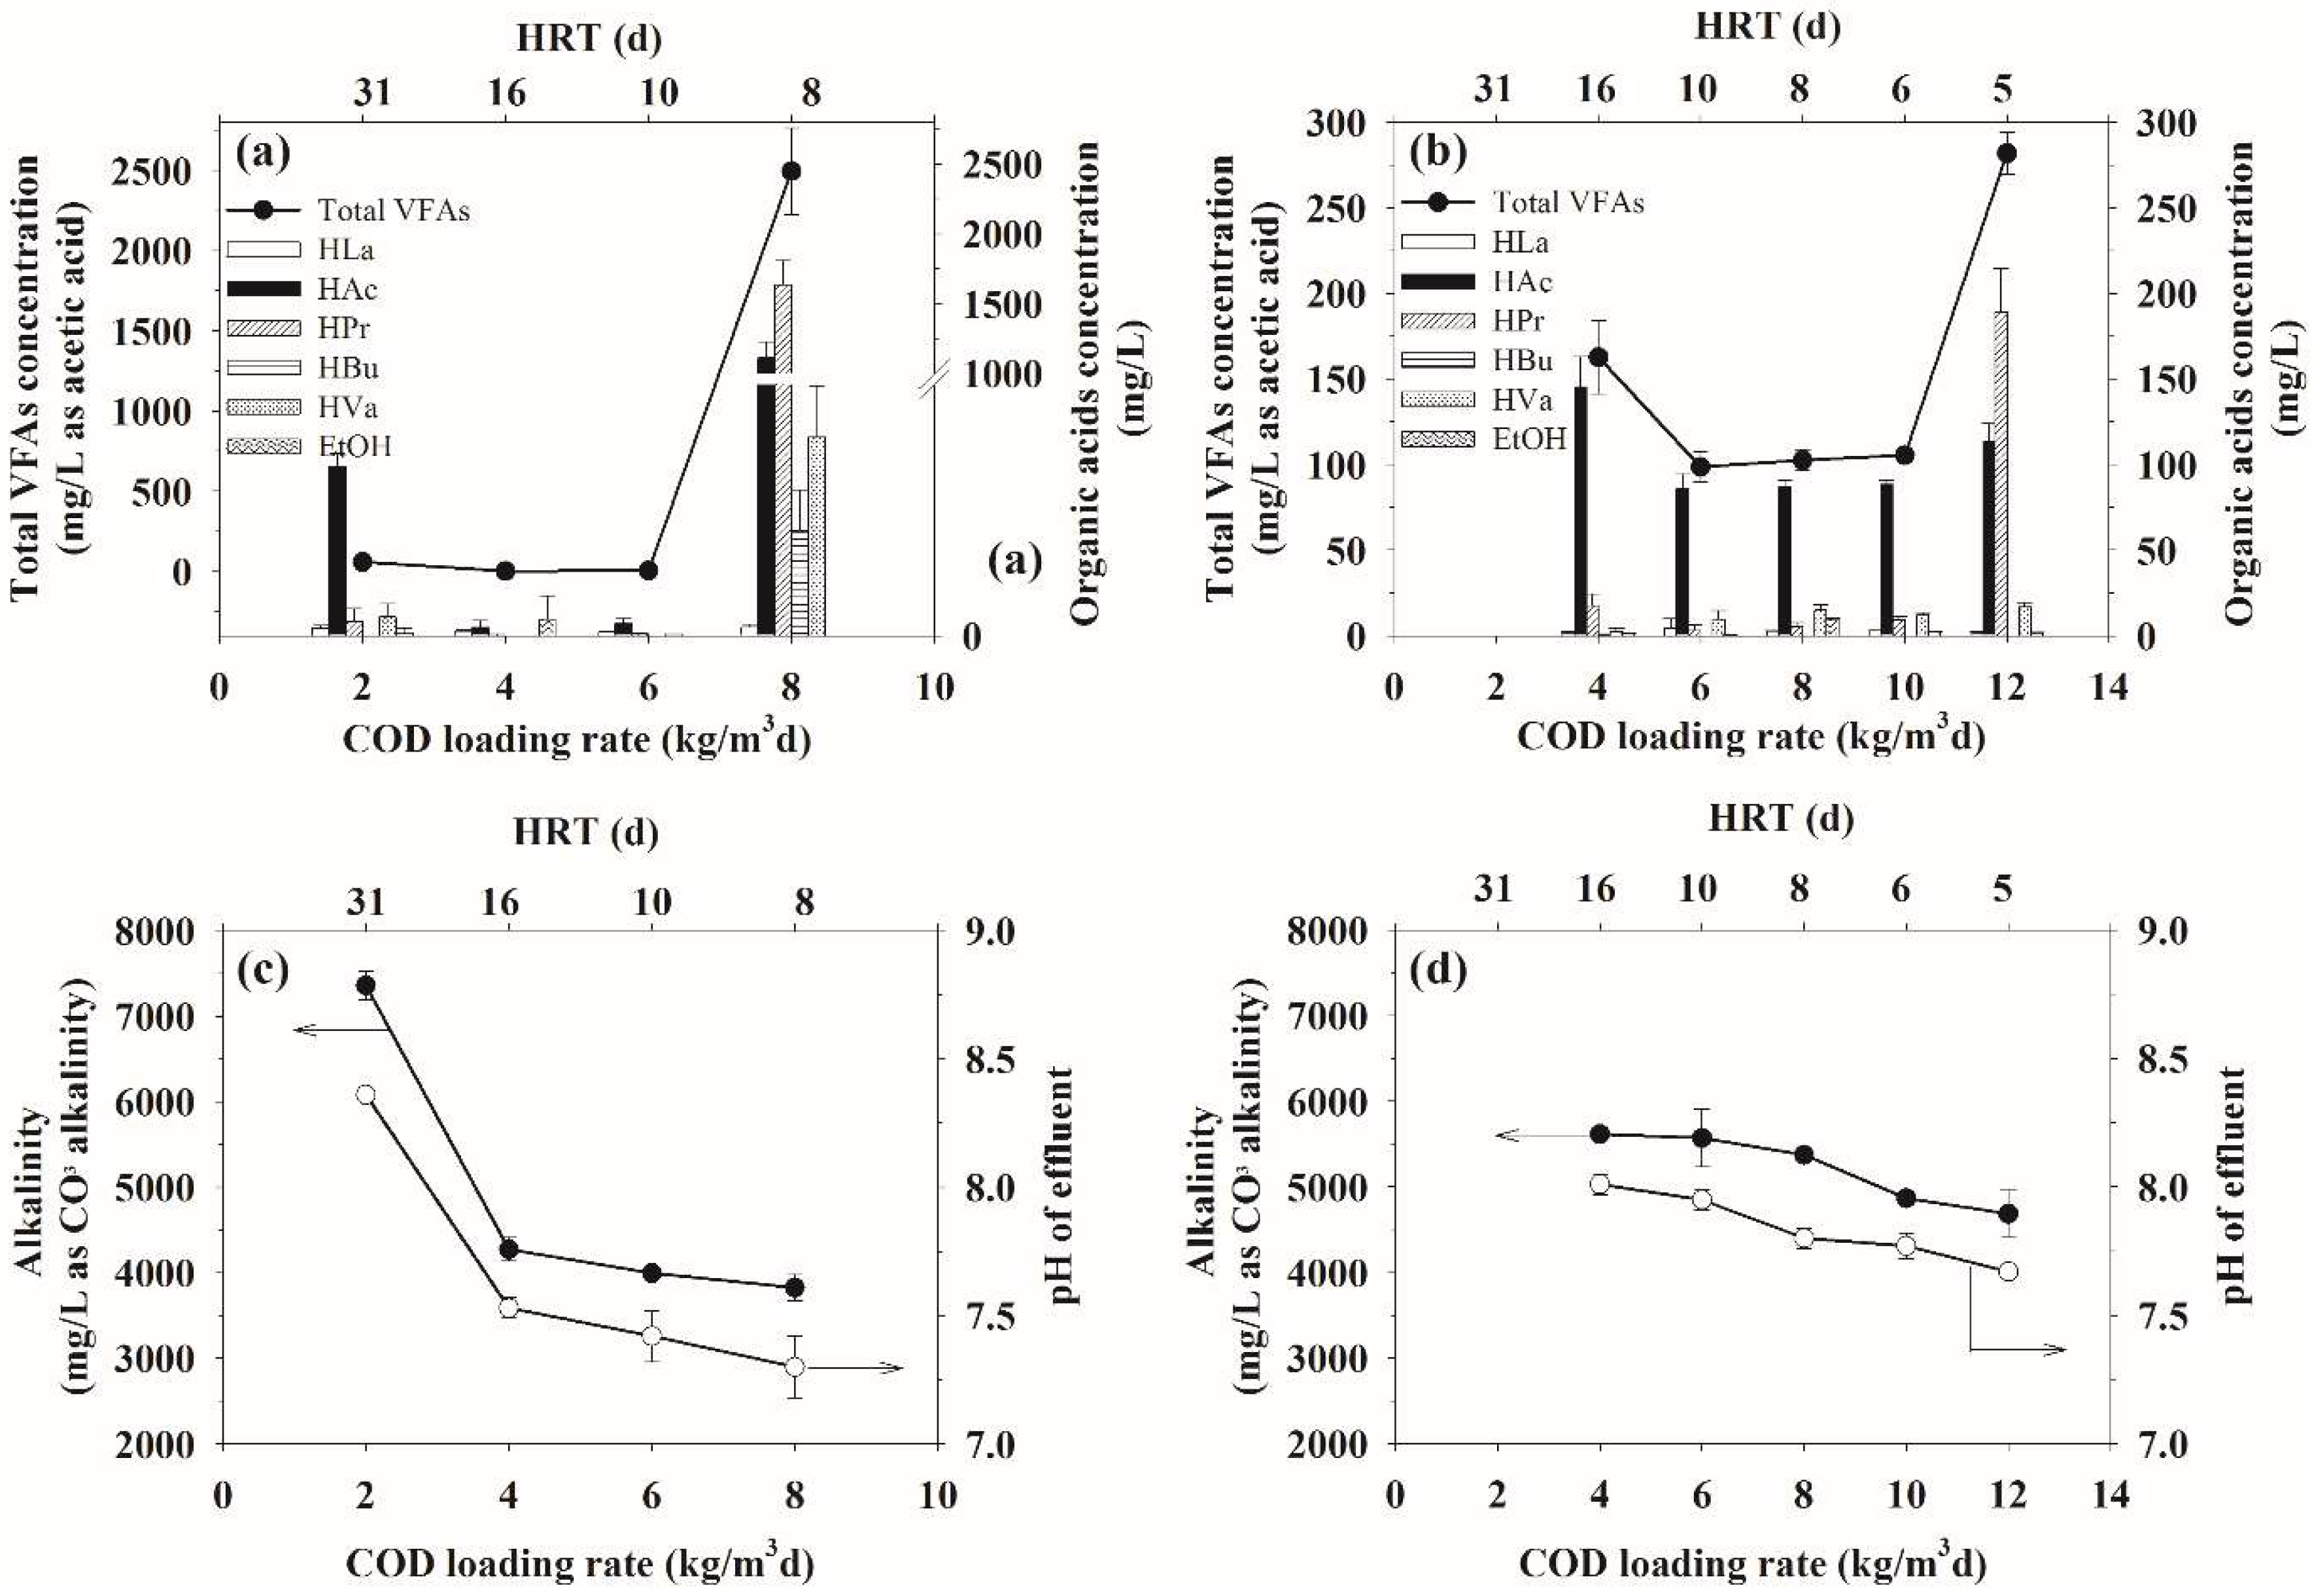
Although VFAs are precursors for both steps of the acetogenesis and the acetotrophic methanogenesis to finally produce CH4 and CO2, the high concentration of VFAs that resulted from the higher rates of acidogenesis and acetogenesis than that of methanogenesis that is directly inhibited the methanogens [38]. The VFA concentration and composition profiles in the mesophilic and thermophilic ASBRs as a function of the COD loading rate are shown in Figure 3. For the mesophilic operation, the total VFA concentration was very low (around 5 mg/L as HAc), and then decreased slightly with an increasing COD loading rate that is up to the optimum value of 6 kg/m3d. Above the optimum COD loading rate, the total VFA concentration sharply increased up to about 2500 mg/L as HAc at a COD loading rate of 8 kg/m3d. The total VFA concentration profile showed the opposite trend to the SMPRs and CH4 yields (Figure 2), supporting that the reduction in CH4 productivity resulted from the VFA accumulation, which exceeded the inhibiting level (about 400–800 mg/L as HAc) to microbes, especially methanogens [35,37].
For the thermophilic operation, the ASBR system had a low total VFA concentration (100 mg/L as HAc) in the COD loading rate range of 6–10 kg/m3d, but it then increased to about 280 mg/L as HAc at a COD loading rate of 12 kg/m3d, corresponding to the reduction in CH4 productivity (Figure 2). From the result, the latter VFA concentration did not meet the inhibition level, suggesting that the reduction in CH4 productivity might be influenced by micronutrient availability, as discussed later.
At both operational temperatures, the produced VFAs contained mainly HAc with small amounts of HLa, HPr, HBu, HVa, and ethanol at any COD loading rate that was lower than the respective optimum COD loading rate (6 kg/m3d for the mesophilic temperature or 10 kg/m3d for the thermophilic temperature). At a COD loading rate that is greater than the optimum COD loading rate, the produced biogas contained significant amounts of the organic acids, ranked in the order: HPr > HAc > HVa > HBu >> HLa for the mesophilic temperature and HPr > HAc >> HVa >> HLa >> HBu for the thermophilic temperature. The results suggested that under a low COD loading rate at 37 °C, all of the produced organic acids were completely converted to HAc and the produced HAc was mostly consumed by the methanogens. When the COD loading rate exceeded its optimum value, the methanogenic rate was lower than the acetogenic and acidogenic rates, as indicated by the high total VFA concentrations.
It is worthwhile to point out that the COD loading rates of 2 and 4 kg/m3d for the mesophilic and thermophilic operations, respectively, had total VFA concentrations that were much higher than those of the higher COD loading rates of 4–6 and 6–10 kg/m3d, respectively. This is because the methanogenic bacterial growth rate was much lower (10-fold) than the acidogenic bacterial growth rate [2], and so at the early start-up period with a low COD loading rate, the microorganisms contained a lower quantity of methanogens, resulting in the higher VFA concentration, as compared to those with a higher COD loading rate.
3.4. Alkalinity and pH
Alkalinity in an AD unit is the capability of the solution to resist the pH drop that is caused by the production of organic acids in the system, and it is referred to as the system buffer capacity [38]. The higher the alkalinity value (buffer capacity), the higher the ability of the methanogens to withstand a higher VFA concentration. Thus, the alkalinity and pH are basically used as process stability indicators for a CH4 production process [37]. Figure 3c,d show the alkalinity and the pH profiles at various COD loading rates under the mesophilic and thermophilic operation of the ASBR. At both temperatures, they tended to decrease with increasing COD loading rate due to the increased total VFA concentration. In addition, the decreased pH values were consistent with the increased CO2 levels in the biogas produced at increased COD loading rates. Interestingly, the level of reduction in both the alkalinity and pH in the ASBR at 55 °C were much lower than those at 37 °C, which is because the thermophiles had a much higher activity to convert the VFAs to CH4 than the mesophiles.
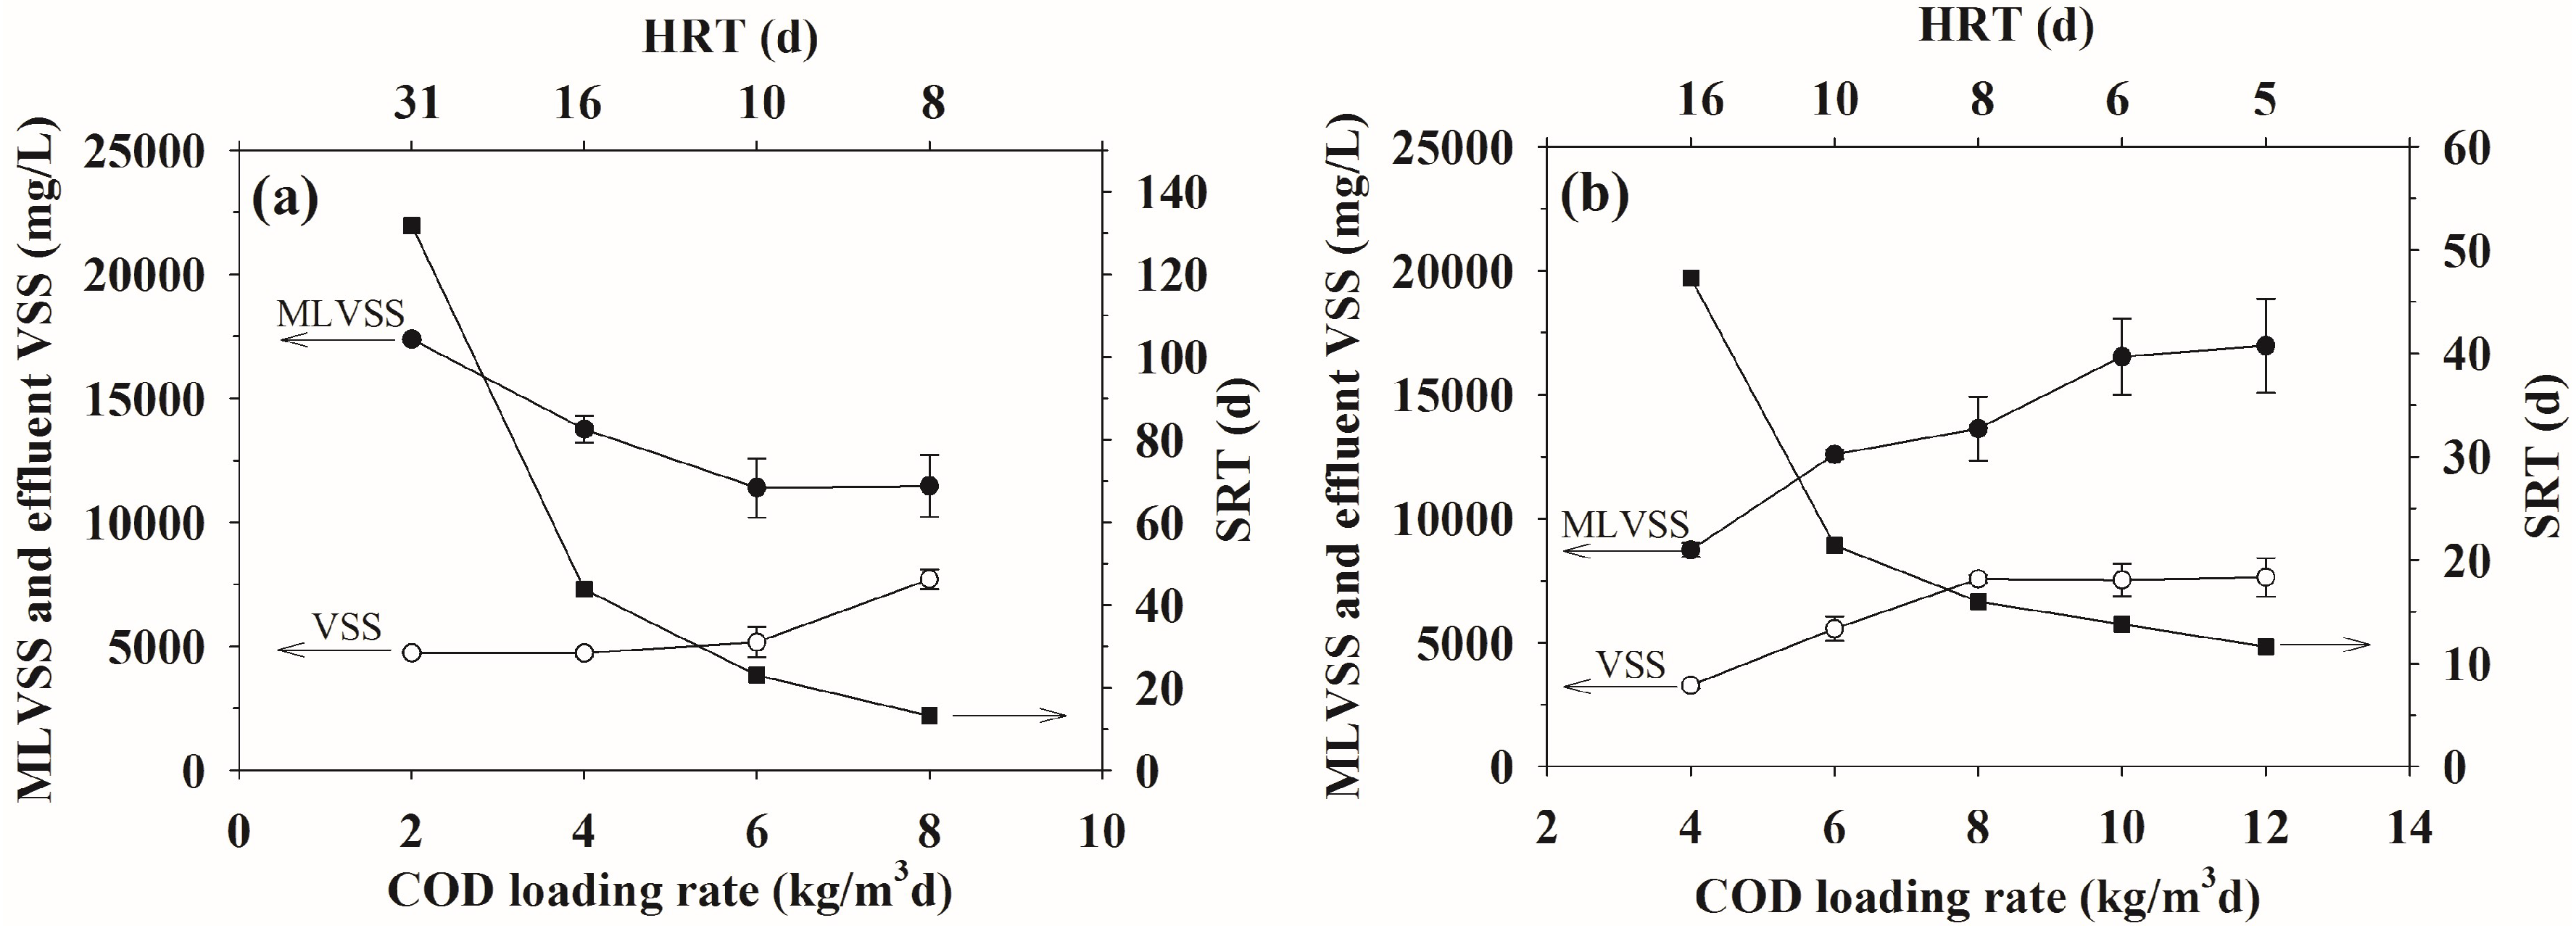
3.5. Microbial Concentration and Washout
Figure 4 shows the profiles of the mixed liquor volatile suspended solids (MLVSS), representing the microbial community concentrations and the volatile suspended solids (VSS), representing the amount of microbial washout, from both ASBR units at different COD loading rates. Fundamentally, the solids retention time (SRT) has to be longer than the HRT for a successful operation of an AD system. All of the studied conditions showed much higher SRT than HRT values, indicating that the ASBR operation under the studied conditions did not have a hydraulic washout problem [9]. At both temperatures, the microbial washout, in terms of the VSS, increased with increasing COD loading rates, as is consistent with the decreased sludge settleability, resulting from the increased toxicity to the microbes from the increasing VFA concentrations. The microbial concentration in the mesophilic ASBR system gradually decreased with increasing COD loading rates, but the thermophilic ASBR system showed the opposite trend. Thus, the thermophiles, with a higher methanogenic activity, could withstand a higher COD loading rate due to the lower VFA concentration, leading to a better sludge settleability, as compared with the mesophiles. Hence, the microbial concentration (MLVSS) of the thermophilic ASBR system increased with increasing COD loading rates.
3.6. Macronutrient Transport
The macronutrients (N and P) are essential for microbial growth in the process of biogas production [39]. They have also been considered as a major factor in eutrophication, and so the removal of both N and P has become an additional objective in wastewater treatment [40]. Hence, a study of N and P transport is of great interest for obtaining a better understanding about the process performance.
Nitrogen is basically found in both organic and inorganic forms, including NH4+-N, NO3−-N, and NO2−-N, which can be taken up by the bacteria during AD [39]. As shown in Table 2, most N in the ethanol wastewater was in the form of org-N (80–90%), with a N:P ratio of about 4:1. As shown in Figure 5a, the uptakes of both N and P in the mesophilic ASBR system increased with increasing COD loading rates to maximum values (44% for N uptake and 75% for P uptake) at the optimum COD loading rate (6 kg/m3d). Above this optimum COD loading rate, the N, and especially the P uptake level, decreased markedly. The N and P uptake profiles corresponded well to those of methanogenic activity in terms of the CH4 production rate, SMPRs, and CH4 yields. As shown in Figure 5b, for the thermophilic ASBR system, the N uptake remained very low (27%) at a COD loading rate of 4–8 kg/m3d and rose abruptly to 55% at the optimum COD loading rate of 10 kg/m3d, while the P uptake did not vary significantly and it was relatively high (about 95%) throughout the studied range of COD loading rates. Above the optimum COD loading rate, both the N and P uptake levels remained almost constant. At each respective optimal COD loading rate, the N and P uptake levels of the thermophilic ASBR were significantly higher than those of the mesophilic ASBR, which corresponded well to the methanogenic activity results. Interestingly, the uptake ratios of N to P at the optimum COD loading rates for the mesophilic and thermophilic operation were not significantly different.
Figure 5c,d show the transformation of N compounds as a function of the COD loading rate in the mesophilic and thermophilic ASBR systems, respectively. Both NH4+-N and org-N can be directly utilized by anaerobes. The org-N in the ethanol wastewater was mostly metabolized to release NH4+-N as byproducts [41], resulting in a higher NH4+-N in the effluent, when compared to the influent (Figure 5c). For any COD loading rate, the levels of NH4+-N in the mesophilic and thermophilic ASBR units (190–270 and 260–360 mg NH4+-N/L, respectively) were much lower than the inhibition level to methanogens (1100–6000 mg NH4+-N/L), suggesting that NH4+-N inhibition could be ruled out in this study [42]. Under the studied conditions, the NO3−-N and NO2−-N levels were close to zero because of the anaerobic environment. The org-N was the main nitrogen source for the anaerobes, since the N present in the ethanol wastewater was mainly in organic forms.
3.7. Micronutrient Transport
In this study, the concentrations of Fe2+, Zn2+, Cu2+, Ni2+, Co2+, Mn2+, and Mo2+ in the feed and the effluent samples at various COD loading rates in both the mesophilic and thermophilic ASBR units were compared with the required concentrations for anaerobic decomposition [43,44,45,46,47] in order to reveal any micronutrient deficit. The measured concentrations of all studied micronutrients in the ethanol wastewater were found to be higher than the minimum stimulatory concentrations for AD (Table 3), but they tended to decrease with increasing COD loading rates at both of the temperatures. This reduction in the micronutrients in both ASBR systems likely resulted from the precipitation of the divalent cations (Fe2+, Ni2+, Co2+, Zn2+, Cu2+, Mn2+, and Mo2+) with the sulfide ions (S2−), which are the dissociated form of H2S produced anaerobically from the sulfate and sulfur-containing organic compounds that are present in the ethanol wastewater. Under the studied conditions, the mesophilic ASBR system had a deficit of some micronutrients, especially Fe2+, Zn2+, Mo2+, Co2+, and Ni2+ at a COD loading rate of 8 kg/m3d, corresponding to the decrease in the gas production rate of mesophilic ASBR. For the thermophilic ASBR system operated at the highest COD loading rate of 12 kg/m3d showed no micronutrient deficit except Mo2+. The addition to Fe2+, Co2+, and Ni2+, and potentially Mo2+, to the ASBR systems to improve the biogas productivity will be further investigated. Interestingly, the reduction of most micronutrients of the thermophilic ASBR system was lower, causing higher quantities of micronutrients available for methanogenic activity, as compared to that of the mesophilic ASBR system, as discussed later.
3.8. The Mass Balance
The mass balance results for both the mesophilic and thermophilic ASBR systems are shown in Table 4. The mass balance results, calculated from on the COD and carbon (C) content, were quite similar, while those that are based on the total solid (TS) were significantly lower. This was because the TS values included inorganic matter as well as organic compounds. The carbon content in the ethanol wastewater was mostly organic carbon, while the COD analysis is derived from chemical oxidation, and so the mass balance results based on either COD or C did not differ much. The mass balance results suggest that the ASBR could uptake more than 85% of the organic fraction of the ethanol wastewater and most of it was converted to biogas. In comparison between the two operational temperatures, the thermophiles showed a higher organic removal efficiency and higher biogas productivity (methanogenic activity) than the mesophiles at their respective optimal COD loading rates.
For the sulfur (S) mass balance results, all of the S-containing compounds that were present in the ethanol wastewater were completely removed by the ASBR system when being operated at either temperature. As shown in Table 4, a significant portion of S was formed and was found in the sludge (73% w/w) for the mesophilic ASBR system, but found in the biogas 74% for the thermophilic ASBR system. The results are consistent with the higher micronutrient depletion in the mesophilic ASBR than in the thermophilic ASBR, implying that the higher precipitation level following the formation of sulfide ions to form metal sulfides occurred in the mesophilic ASBR systems.
3.9. The Energy Balance
The energy balance was evaluated for the two ASBR systems at their respective optimum COD loading rates using the calorific values of the ethanol wastewater, and the effluents and the energy gain from the produced biogas, calculated from the heating value of CH4 of 35.8 kJ/L [48]. It should be mentioned here that the energy consumption for the ASBR operation, including the feeding, mixing, and maintaining the bioreactor temperature, was not considered in the energy balance. The energy content of the ethanol wastewater was found in the range of 13.8–14.1 kJ/g COD, as consistent with the reported energy values of most wastewaters (13–15 kJ/g COD) [49]. The energy extraction efficiencies for the biogas production of the mesophilic and thermophilic ASBR systems were 85 and 92%, respectively, (Table 5), which corresponded well to the mass balance results based on both the COD and C content. These values were superior to the reported 47% of energy extraction efficiency of the anaerobic digester treating the excess sludge from municipal wastewater [50]. The energy loses of 15 and 8% of the mesophilic and thermophilic ASBR systems, respectively, were assumed to contribute to bacterial metabolism. The specific energy values that were produced by the mesophilic and thermophilic ASBR systems were 8.6 and 10.9 kJ/g COD applied (3.6 and 5.2 kJ/g MLVSS d), respectively, which were comparable to the reported energy yield values (10.1–10.6 kJ/g COD applied) of a single digester [51]. Thus, the thermophilic ASBR system potentially had higher extraction efficiency with a lower energy requirement for bacterial metabolic activities, when compared to the mesophilic ASBR system. This can be explained by the fact that the thermophiles had a higher methanogenic activity with a higher optimum organic loading rate. Additionally, the energy recovery from the studied ethanol wastewater was in the range of 9.9–12.3 kJ/g TS, which was significantly higher than those of other wastes of cow and pig manure (6.2–7 kJ/kg TS), slaughterhouse waste (9.4 kJ/kg TS), and straw waste (7.17 kJ/kg TS) [52].
3.10. New Explanation of the Methanogenic Activity of Mesophiles and Thermophiles
Up to now, the explanation for the higher methanogenic activity of thermophiles than that of mesophiles lies on the difference in microbial activity, and no concrete scientific evidences are given. In this study, new evidences of micronutrient transport and sulfur mass balance were used to explain why thermophiles have a higher methanogenic activity than mesophiles. The solubility of produced H2S in pure water as mole fraction is 1.4469 × 10⁻³ and 1.0609 × 10⁻³ at 37 and 55 °C, respectively [26], suggesting that the produced H2S in the ASBR was likely present in the biogas phase at 55 °C higher than that at 37 °C, as confirmed experimentally by the sulfur mass balance results (Table 4). As a consequence, the lower dissolved H2S in the thermophilic ASBR caused lower precipitation of micronutrients in the form of metal sulfides, as compared with the mesophilic ASBR, as described before (Table 3). The present results can lead to a conclusion that the lower water solubility of produced H2S in thermophilic AD, as compared with the mesophilic one, plays a crucial role to make thermophiles having higher methanogenic activity because the micronutrient deficit condition that was generally occurring under the mesophilic temperature can be eliminated under the thermophilic temperature.
4. Conclusions
Methane production from ethanol wastewater using an ASBR with recycled biogas under mesophilic and thermophilic operation without controlled pH was investigated to relate the process performance to macro- and micro-nutrient transport, and overall mass and energy balance. The thermophilic ASBR was superior to the mesophilic ASBR in terms of a higher optimum COD loading rate, (10 to 6 kg/m3d) and a higher CH4 yield (324 to 232 mL CH4/g COD applied). The CH4 production in this study demonstrated that the thermophiles had higher macronutrient uptakes and lower tolerance levels to VFAs than the mesophiles. A deficiency of most micronutrients was found in the mesophilic ASBR system, while the themophilic ASBR system still had sufficient amounts of all micronutrients except for Mo2+. The energy and mass balance results indicated that the studied ASBR systems could effectively extract energy from the ethanol wastewater to biogas (85% and 92% for mesophilic and thermophilic temperatures, respectively). Additionally, the mass balance that was based on COD and C showed good agreement with the energy balance. The higher methanogenic activity of thermophiles, for the first time of its kind, was found to result from lower precipitation of all micronutrients, which was caused by lower water solubility of produced H2S (36%), as compared to that of mesophiles.
Author Contributions
Conceptualization, K.S., T.S. and S.C.; Methodology, K.S.; Software, K.S.; Validation, K.S., T.S. and S.C.; Formal Analysis, K.S.; Investigation, K.S.; Resources, T.S. and S.C.; Data Curation, K.S.; Writing-Original Draft Preparation, K.S.; Writing-Review & Editing, K.S. and S.C.; Visualization, K.S.; Supervision, S.C.; Project Administration, S.C.; Funding Acquisition, T.S. and S.C.
Funding
This research was funded by the Thailand Research Fund (TRF) through the Royal Golden Jubilee Ph.D. Program Grant (No. PHD/0244/2552) to the first author. TRF Senior Scholar Research Grant (No. RTA5780008) and Industrial Research Grant (No. RDG6050068) to the corresponding author, and the Thai Oil Group Company are acknowledged and greatly appreciated. The National Science and Technological Development Agency (NSTDA) and The Ministry of Energy also provided research grants (FDA-CO-2559-2569-TH and 459042-AE1) to support this study.
Acknowledgments
The authors thank the Center of Excellence on Petrochemical and Materials Technology, Chulalongkorn University, for providing some of the equipment for this research. Bangchak Bioethanol (Chachoensao) Co. Ltd. (Chachoengsao, Thailand) also provided a partial support for this project. Additionally, the authors thank Sapthip Lopburi Co., Ltd., Lopburi, Thailand, for kindly providing the sludge and ethanol wastewater used in this study.
Conflicts of Interest
The authors declare no conflict of interest.
References
- Khan, M.A.; Ngo, H.H.; Guo, W.S.; Liu, Y.; Nghiem, L.D.; Hai, F.I.; Deng, L.J.; Wang, J.; Wu, Y. Optimization of process parameters for production of volatile fatty acid, biohydrogen and methane from anaerobic digestion. Bioresour. Technol. 2016, 219, 738–748. [Google Scholar] [CrossRef] [PubMed]
- Christy, P.M.; Gopinath, L.; Divya, D. A review on anaerobic decomposition and enhancement of biogas production through enzymes and microorganisms. Renew. Sustain. Energy Rev. 2014, 34, 167–173. [Google Scholar] [CrossRef]
- Weiland, P. Biogas production: Current state and perspectives. Appl. Microbiol. Biotechnol. 2010, 85, 849–860. [Google Scholar] [CrossRef] [PubMed]
- Karve, A.D.; Karve, P.; Kulkarni, G. A new compact biogas system based on sugary/starchy feedstock. Energy Sustain. Dev. 2005, 9, 63–65. [Google Scholar] [CrossRef]
- Searmsirimongkol, P.; Rangsunvigit, P.; Leethochawalit, M.; Chavadej, S. Hydrogen production from alcohol distillery wastewater containing high potassium and sulfate using an anaerobic sequencing batch reactor. Int. J. Hydrogen Energy 2011, 36, 12810–12821. [Google Scholar] [CrossRef]
- Grimsby, L.K.; Fjørtoft, K.; Aune, J.B. Nitrogen mineralization and energy from anaerobic digestion of jatropha press cake. Energy Sustain. Dev. 2013, 17, 35–39. [Google Scholar] [CrossRef]
- Reungsang, A.; Pattra, S.; Sittijunda, S. Optimization of key factors affecting methane production from acidic effluent coming from the sugarcane juice hydrogen fermentation process. Energies 2012, 5, 4746–4757. [Google Scholar] [CrossRef]
- Ziganshin, A.M.; Schmidt, T.; Lv, Z.; Liebetrau, J.; Richnow, H.H.; Kleinsteuber, S.; Nikolausz, M. Reduction of the hydraulic retention time at constant high organic loading rate to reach the microbial limits of anaerobic digestion in various reactor systems. Bioresour. Technol. 2016, 217, 62–71. [Google Scholar] [CrossRef] [PubMed]
- Angenent, L.T.; Karim, K.; Al-Dahhan, M.H.; Wrenn, B.A.; Domíguez-Espinosa, R. Production of bioenergy and biochemicals from industrial and agricultural wastewater. TRENDS Biotechnol. 2004, 22, 477–485. [Google Scholar] [CrossRef] [PubMed]
- Gary, R.K. The concentration dependence of the δs term in the gibbs free energy function: Application to reversible reactions in biochemistry. J. Chem. Educ. 2004, 81, 1599. [Google Scholar] [CrossRef]
- Al-mashhadani, M.K.H.; Wilkinson, S.J.; Zimmerman, W.B. Carbon dioxide rich microbubble acceleration of biogas production in anaerobic digestion. Chem. Eng. Sci. 2016, 156, 24–35. [Google Scholar] [CrossRef]
- Siddique, N.I.; Munaim, M.S.A.; Wahid, Z.A. Role of biogas recirculation in enhancing petrochemical wastewater treatment efficiency of continuous stirred tank reactor. J. Clean. Prod. 2015, 91, 229–234. [Google Scholar] [CrossRef]
- Venkata Mohan, S.; Mohanakrishna, G.; Sarma, P.N. Integration of acidogenic and methanogenic processes for simultaneous production of biohydrogen and methane from wastewater treatment. Int. J. Hydrogen Energy 2008, 33, 2156–2166. [Google Scholar] [CrossRef]
- Martinez, F.A.C.; Balciunas, E.M.; Salgado, J.M.; González, J.M.D.; Converti, A.; de Souza Oliveira, R.P. Lactic acid properties, applications and production: A review. Trends Food Sci. Technol. 2013, 30, 70–83. [Google Scholar] [CrossRef]
- Intanoo, P.; Chaimongkol, P.; Chavadej, S. Hydrogen and methane production from cassava wastewater using two-stage upflow anaerobic sludge blanket reactors (UASB) with an emphasis on maximum hydrogen production. Int. J. Hydrogen Energy 2016, 41, 6107–6114. [Google Scholar] [CrossRef]
- Conrad, R. Contribution of hydrogen to methane production and control of hydrogen concentrations in methanogenic soils and sediments. FEMS Microbiol. Ecol. 1999, 28, 193–202. [Google Scholar] [CrossRef]
- Prapinagsorn, W.; Sittijunda, S.; Reungsang, A. Co-digestion of napier grass and its silage with cow dung for methane production. Energies 2017, 10, 1654. [Google Scholar] [CrossRef]
- Mao, C.; Feng, Y.; Wang, X.; Ren, G. Review on research achievements of biogas from anaerobic digestion. Renew. Sustain. Energy Rev. 2015, 45, 540–555. [Google Scholar] [CrossRef]
- Demirel, B.; Scherer, P. Trace element requirements of agricultural biogas digesters during biological conversion of renewable biomass to methane. Biomass Bioenergy 2011, 35, 992–998. [Google Scholar] [CrossRef]
- Dąbrowska, L. Speciation of heavy metals in sewage sludge after mesophilic and thermophilic anaerobic digestion. Chem. Pap. 2012, 66, 598–606. [Google Scholar] [CrossRef]
- Gao, Y.; Kong, X.; Xing, T.; Sun, Y.; Zhang, Y.; Luo, X.; Sun, Y. Digestion performance and microbial metabolic mechanism in thermophilic and mesophilic anaerobic digesters exposed to elevated loadings of organic fraction of municipal solid waste. Energies 2018, 11, 952. [Google Scholar] [CrossRef]
- Labatut, R.A.; Angenent, L.T.; Scott, N.R. Conventional mesophilic vs. Thermophilic anaerobic digestion: A trade-off between performance and stability? Water Res. 2014, 53, 249–258. [Google Scholar] [CrossRef] [PubMed]
- Gebreeyessus, G.D.; Jenicek, P. Thermophilic versus mesophilic anaerobic digestion of sewage sludge: A comparative review. Bioengineering 2016, 3, 15. [Google Scholar] [CrossRef] [PubMed]
- Kim, M.; Ahn, Y.-H.; Speece, R.E. Comparative process stability and efficiency of anaerobic digestion; mesophilic vs. Thermophilic. Water Res. 2002, 36, 4369–4385. [Google Scholar] [CrossRef]
- Lu, J.; Gavala, H.N.; Skiadas, I.V.; Mladenovska, Z.; Ahring, B.K. Improving anaerobic sewage sludge digestion by implementation of a hyper-thermophilic prehydrolysis step. J. Environ. Manag. 2008, 88, 881–889. [Google Scholar] [CrossRef] [PubMed]
- Gevantman, L.H. The Solubility of Selected Gases in Water. In CRC Handbook of Chemistry and Physics, 72nd ed.; Lide, D.R., Ed.; CRC Press: Boca Raton, FL, USA, 1992; pp. 82–83. [Google Scholar]
- Sreethawong, T.; Chatsiriwatana, S.; Rangsunvigit, P.; Chavadej, S. Hydrogen production from cassava wastewater using an anaerobic sequencing batch reactor: Effects of operational parameters, COD: N ratio, and organic acid composition. Int. J. Hydrogen Energy 2010, 35, 4092–4102. [Google Scholar] [CrossRef]
- Eaton, A.; Clesceri, L.; Rice, E.; Greenberg, A. Standard Methods for the Examination of Water and Wastewater, 23rd ed.; American Public Health Association (APHA); American Water Works Association (AWWA); Water Enviroment Federation: Washington, DC, USA, 2017. [Google Scholar]
- Pehlivanoglu, E.; Sedlak, D.L. Bioavailability of wastewater-derived organic nitrogen to the alga Selenastrum capricornutum. Water Res. 2004, 38, 3189–3196. [Google Scholar] [CrossRef] [PubMed]
- Intanoo, P.; Rangsunvigit, P.; Namprohm, W.; Thamprajamchit, B.; Chavadej, J.; Chavadej, S. Hydrogen production from alcohol wastewater by an anaerobic sequencing batch reactor under thermophilic operation: Nitrogen and phosphorous uptakes and transformation. Int. J. Hydrogen Energy 2012, 37, 11104–11112. [Google Scholar] [CrossRef]
- Lin, Y.; Tanaka, S. Ethanol fermentation from biomass resources: Current state and prospects. Appl. Microbiol. Biotechnol. 2006, 69, 627–642. [Google Scholar] [CrossRef] [PubMed]
- Luo, G.; Xie, L.; Zou, Z.; Wang, W.; Zhou, Q.; Shim, H. Anaerobic treatment of cassava stillage for hydrogen and methane production in continuously stirred tank reactor (CSTR) under high organic loading rate (OLR). Int. J. Hydrogen Energy 2010, 35, 11733–11737. [Google Scholar] [CrossRef]
- Zhu, H.; Stadnyk, A.; Béland, M.; Seto, P. Co-production of hydrogen and methane from potato waste using a two-stage anaerobic digestion process. Bioresour. Technol. 2008, 99, 5078–5084. [Google Scholar] [CrossRef] [PubMed]
- Luo, G.; Xie, L.; Zhou, Q.; Angelidaki, I. Enhancement of bioenergy production from organic wastes by two-stage anaerobic hydrogen and methane production process. Bioresour. Technol. 2011, 102, 8700–8706. [Google Scholar] [CrossRef] [PubMed] [Green Version]
- Intanoo, P.; Rangsanvigit, P.; Malakul, P.; Chavadej, S. Optimization of separate hydrogen and methane production from cassava wastewater using two-stage upflow anaerobic sludge blanket reactor (UASB) system under thermophilic operation. Bioresour. Technol. 2014, 173, 256–265. [Google Scholar] [CrossRef] [PubMed]
- Shao, X.; Peng, D.; Teng, Z.; Ju, X. Treatment of brewery wastewater using anaerobic sequencing batch reactor (ASBR). Bioresour. Technol. 2008, 99, 3182–3186. [Google Scholar] [CrossRef] [PubMed]
- Tangkathitipong, P.; Intanoo, P.; Butpan, J.; Chavadej, S. Separate production of hydrogen and methane from biodiesel wastewater with added glycerin by two-stage anaerobic sequencing batch reactors (ASBR). Renew. Energy 2017, 113, 1077–1085. [Google Scholar] [CrossRef]
- Sakar, S.; Yetilmezsoy, K.; Kocak, E. Anaerobic digestion technology in poultry and livestock waste treatment—A literature review. Waste Manag. Res. 2009, 27, 3–18. [Google Scholar] [CrossRef] [PubMed]
- McCarty, P.L.; Rittmann, B.E. Environmental Biotechnology: Principles and Applications; McGraw-Hill: New York, NY, USA, 2001; pp. 19–55. [Google Scholar]
- Li, B.; Wu, G. Effects of sludge retention times on nutrient removal and nitrous oxide emission in biological nutrient removal processes. Int. J. Environ. Res. Public Health 2014, 11, 3553–3569. [Google Scholar] [CrossRef] [PubMed]
- Schimel, J.P.; Bennett, J. Nitrogen mineralization: Challenges of a changing paradigm. Ecology 2004, 85, 591–602. [Google Scholar] [CrossRef]
- Kinyua, M.N. Effect of Solids Retention Time on the Denitrification Potential of Anaerobically Digested Swine Waste. Master’s Thesis, University of South Florida, Tampa, FL, USA, 22 March 2013. [Google Scholar]
- Schattauer, A.; Abdoun, E.; Weiland, P.; Plöchl, M.; Heiermann, M. Abundance of trace elements in demonstration biogas plants. Biosyst. Eng. 2011, 108, 57–65. [Google Scholar] [CrossRef]
- Weiland, P. Anforderungen an pflanzen seitens des biogasanlagenbetreibers, tll-jena, eigenverlag, 12. Thüringer Bioenergietag 2006, 26–32. [Google Scholar]
- Bożym, M.; Florczak, I.; Zdanowska, P.; Wojdalski, J.; Klimkiewicz, M. An analysis of metal concentrations in food wastes for biogas production. Renew. Energy 2015, 77, 467–472. [Google Scholar] [CrossRef]
- Sahm, H. Biologie der methan-bildung. Chemie Ingenieur Technik 1981, 53, 854–863. [Google Scholar] [CrossRef]
- Pobeheim, H.; Munk, B.; Lindorfer, H.; Guebitz, G.M. Impact of nickel and cobalt on biogas production and process stability during semi-continuous anaerobic fermentation of a model substrate for maize silage. Water Res. 2011, 45, 781–787. [Google Scholar] [CrossRef] [PubMed]
- Liu, X.; Li, R.; Ji, M.; Han, L. Hydrogen and methane production by co-digestion of waste activated sludge and food waste in the two-stage fermentation process: Substrate conversion and energy yield. Bioresour. Technol. 2013, 146, 317–323. [Google Scholar] [CrossRef] [PubMed]
- Olsson, G. Water and Energy: Threats and Opportunities; IWA Publishing: London, UK, 2015. [Google Scholar] [CrossRef]
- Shizas, I.; Bagley, D.M. Experimental determination of energy content of unknown organics in municipal wastewater streams. J. Energy Eng. 2004, 130, 45–53. [Google Scholar] [CrossRef]
- DiStefano, T.D.; Palomar, A. Effect of anaerobic reactor process configuration on useful energy production. Water Res. 2010, 44, 2583–2591. [Google Scholar] [CrossRef] [PubMed]
- Berglund, M.; Börjesson, P. Assessment of energy performance in the life-cycle of biogas production. Biomass Bioenergy 2006, 30, 254–266. [Google Scholar] [CrossRef]
Figure 1.
Schematic diagram of the anaerobic sequencing batch reactors (ASBR) used in this study with recycled biogas.
Figure 1.
Schematic diagram of the anaerobic sequencing batch reactors (ASBR) used in this study with recycled biogas.

Figure 2.
The effects of the chemical oxygen demand (COD) loading rate and hydraulic retention time (HRT) on the steady-state parameters; (a) COD removal and gas production rate; (b) gas composition and CH4 production rate; (c) specific methane production rates (SMPRs); and, (d) CH4 yields in the ASBR operated under a mesophilic (37 °C) or thermophilic (55 °C) temperature. Data are shown as the mean ± 1SD, derived from five independent repeats.

Figure 3.
The (a,b) total volatile fatty acids (VFA), VFA composition and ethanol concentration and the (c,d) alkalinity and effluent pH in the ASBR operated at different COD loading rates under a (a,c) mesophilic and (b,d) thermophilic temperature. Data are shown as the mean ± 1SD, derived from five independent repeats.

Figure 4.
The microbial concentration (MLVSS), effluent volatile suspended solids (VSS) and solids retention time (SRT) at different COD loading rates and HRT in the ASBR operated under a (a) mesophilic (37 °C) or (b) thermophilic (55 °C) temperature. Data are shown as the mean ± 1SD, derived from 5 independent repeats.

Figure 5.
The (a,b) macronutrient (N and P) uptake and (c,d) total-N, org-N and inorganic-N levels in the ASBR operated at different COD loading rates under a (a,b) mesophilic (37 °C) and (c,d) thermophilic (55 °C) temperature. Data are shown as the mean ± 1SD, derived from 5 independent repeats.
Figure 5.
The (a,b) macronutrient (N and P) uptake and (c,d) total-N, org-N and inorganic-N levels in the ASBR operated at different COD loading rates under a (a,b) mesophilic (37 °C) and (c,d) thermophilic (55 °C) temperature. Data are shown as the mean ± 1SD, derived from 5 independent repeats.


Table 1.
Biochemical pathways of the anaerobic digestion of polysaccharides for methane (CH4) production by different groups of microorganisms [2,13,14,15,16,17].
| Chemical Reaction | Equation |
|---|---|
| Hydrolysis: | |
| (1) | |
| Acidogenesis (favorable pH of ~4.5–5.5): | |
| (2) | |
| (3) | |
| (4) | |
| (5) | |
| (6) | |
| (7) | |
| Acetogenesis (favorable pH of ~6): | |
| (8) | |
| (9) | |
| (10) | |
| (11) | |
| (12) | |
| (13) | |
| Methanogenesis (favorable pH of ~7–8): | |
| Hydrogenotrophic methanogenesis: | |
| (14) | |
| Acetotrophic methanogenesis: | |
| (15) | |
| (16) | |
Table 2.
Characteristics of the cassava-based ferment alcohol wastewater used in this study.
| Parameter | Unit | Value |
|---|---|---|
| pH | - | 3.5 ± 0.2 |
| COD | mg/L | 63,000 ± 900 |
| Total VFA: | mg/L as HAc | 11,100 ± 90 |
| Lactic acid (HLa) | mg/L | 10,500 ± 50 |
| Acetic acid (HAc) | mg/L | 3660 ± 2 |
| Propionic acid (HPr) | mg/L | 300 ± 1 |
| Butylric acid (HBu) | mg/L | 30 ± 1 |
| Valeric acid (HVa) | mg/L | 10 ± 2 |
| Ethanol | mg/L | 540 ± 5 |
| Total solid (TS) | mg/L | 38,200 ± 1800 |
| Total volatile solid (TVS) | mg/L | 34,400 ± 1600 |
| Total carbon (C) | mg/L | 19,000 ± 300 |
| Total nitrogen (N) | mg/L | 640 ± 7 |
| NH4+-N | mg/L | 100 ± 1 |
| NO3−-N | mg/L | 2.0 ± 0.1 |
| NO2−-N | mg/L | 0 |
| Org-N | mg/L | 538 |
| Total P | mg/L | 230 ± 28 |
| Total SO42− | mg/L | 27 ± 1.4 |
| Total S | mg/L | 0.11 |
| COD:N:P:S | - | 100:1:0.4:0.002 |
Table 3.
Concentration of micronutrients in the ASBR system operated at a mesophilic or thermophilic temperature at different COD loading rates, as compared with the recommended values for AD (with S.D. less than 10%).
Table 3.
Concentration of micronutrients in the ASBR system operated at a mesophilic or thermophilic temperature at different COD loading rates, as compared with the recommended values for AD (with S.D. less than 10%).
| Parameters | Micronutrients (ppb) | |||||||||||||
|---|---|---|---|---|---|---|---|---|---|---|---|---|---|---|
| Fe2+ | Mn2+ | Zn2+ | Cu2+ | Ni2+ | Mo2+ | Co2+ | ||||||||
| Recommended concentration | 1000–10,000 a 100–400 e | 5–50,000 c 10–50 e | 1000–3000 b 100–1000 e | 60–64,000 c 10–50 e | 5–500 d 50–300 e | 3–50 a | 3–60 a | |||||||
| Feed | 17,500 | 2900 | 1260 | 870 | 150 | 250 | 80 | |||||||
| Effluent at different COD loading rate (kg/m3d) | 37 °C | 55 °C | 37 °C | 55 °C | 37 °C | 55 °C | 37 °C | 55 °C | 37 °C | 55 °C | 37 °C | 55 °C | 37 °C | 55 °C |
| 4 | 1400 | 1000 | 180 | 20 | 12 | 30 | 70 | 30 | 20 | 20 | 0 | 100 | 20 | 20 |
| 6 | 280 | 2250 | 123 | 140 | 15 | 70 | 70 | 150 | 20 | 120 | 40 | 40 | 20 | 80 |
| 8 | 150 | 2300 | 120 | 170 | 10 | 60 | 25 | 120 | 6 | 90 | 0 | 40 | 20 | 40 |
| 10 | - | 350 | - | 25 | - | 30 | - | 110 | - | 30 | - | 40 | - | 20 |
| 12 | - | 270 | - | 10 | - | 30 | - | 70 | - | 40 | - | 0 | - | 20 |
Table 4.
The mass balance for the ASBR operated under a mesophilic or thermophilic temperature under steady state conditions at the optimum COD loading rates of 6 and 10 kg/m3d, respectively (with S.D. less than 5%).
Table 4.
The mass balance for the ASBR operated under a mesophilic or thermophilic temperature under steady state conditions at the optimum COD loading rates of 6 and 10 kg/m3d, respectively (with S.D. less than 5%).
| Sample | Mass Balance (% (w/w) of Feed) | |||
|---|---|---|---|---|
| TS | COD | C | S | |
| Mesophilic ASBR system: | ||||
| Effluent | 35 | 15 | 29 | 0 |
| Biogas | 50 (77%) * | 69 (81%) * | 62 (87%) * | 27 |
| Sludge | 15 (23%) * | 16 (19%) * | 10 (14%) * | 73 |
| Thermophilic ASBR system: | ||||
| Effluent | 13 | 11 | 10 | 0 |
| Biogas | 72 (83%) * | 79 (89%) * | 82 (91%) * | 74 |
| Sludge | 15 (17%) * | 10 (11%) * | 8 (9%) * | 26 |
* Percentage mass balance (shown in parenthesis) is calculated based on the mass removed.
Table 5.
The energy balance of the ABR system operated at a mesophilic or thermophilic temperature under steady state conditions at the optimum COD loading rates of 6 and 10 kg/m3d, respectively (with S.D. less than 5%).
Table 5.
The energy balance of the ABR system operated at a mesophilic or thermophilic temperature under steady state conditions at the optimum COD loading rates of 6 and 10 kg/m3d, respectively (with S.D. less than 5%).
| Value | Mesophilic ASBR | Thermophilic ASBR |
|---|---|---|
| Energy extraction efficiency (%) | 85 | 92 |
| Energy for bacterial metabolism (%) | 15 | 8 |
| Specific energy production rate (kJ/L d) | 51.6 | 108.7 |
| Specific energy production rate (kJ/gMLVSS d) | 3.6 | 5.2 |
| Energy yield (kJ/g COD applied) | 8.6 | 10.9 |
| Energy yield (kJ/g COD removed) | 9.2 | 12.5 |
| Energy yield (kJ/g TS applied) | 9.9 | 12.3 |
© 2018 by the authors. Licensee MDPI, Basel, Switzerland. This article is an open access article distributed under the terms and conditions of the Creative Commons Attribution (CC BY) license (http://creativecommons.org/licenses/by/4.0/).
Share and Cite
MDPI and ACS Style
Seneesrisakul, K.; Sutabutr, T.; Chavadej, S. The Effect of Temperature on the Methanogenic Activity in Relation to Micronutrient Availability. Energies 2018, 11, 1057. https://doi.org/10.3390/en11051057
AMA Style
Seneesrisakul K, Sutabutr T, Chavadej S. The Effect of Temperature on the Methanogenic Activity in Relation to Micronutrient Availability. Energies. 2018; 11(5):1057. https://doi.org/10.3390/en11051057
Chicago/Turabian StyleSeneesrisakul, Kessara, Twarath Sutabutr, and Sumaeth Chavadej. 2018. "The Effect of Temperature on the Methanogenic Activity in Relation to Micronutrient Availability" Energies 11, no. 5: 1057. https://doi.org/10.3390/en11051057
Note that from the first issue of 2016, this journal uses article numbers instead of page numbers. See further details here.