Methodologies for the Exploitation of Existing Energy Corridors. GIS Analysis and DTR Applications
by
 , ,
, ,
Fabio Massaro
1,* ,
,
Mariano Giuseppe Ippolito
1,
Gaetano Zizzo
1 ,
,
Giovanni Filippone
2 and
Andrea Puccio
2 1
Department of Energy, Information Engineering and Mathematical Models, DEIM, University of Palermo, Viale delle Scienze, Building n.9, 90128 Palermo, Italy
2
Terna Rete Italia S.p.A., Direzione Territoriale Centro Sud, Via Castellana, 195, 90135 Palermo, Italy
*
Author to whom correspondence should be addressed.
Energies 2018, 11(4), 979; https://doi.org/10.3390/en11040979
Submission received: 21 March 2018
/
Revised: 15 April 2018
/
Accepted: 16 April 2018
/
Published: 18 April 2018
(This article belongs to the Section F: Electrical Engineering)
Abstract
:The exploitation of power lines currently in operation has now become a common practice among electric system operators. The construction of new power lines requires taking economic, political and social problems into consideration. This paper considers two methodologies adopted by the Italian Transmission System Operator (TSO), Terna S.p.A.: Dynamic Thermal Rating (DTR) and Laser Imaging Detection and Ranging-Geographic Information System (L-GIS). DTR systems dynamically calculate the real transport capacity of a power line. The L-GIS system allows, after the geo-referencing of the power line, the management of any interference between the line and the nearby obstacles, permitting the optimization of the high voltage line operation. In this paper, after a brief illustration of the two methods, the authors report the results of some applications in the Sicilian electrical power High Voltage (HV) system.
1. Introduction
Stringent environmental constraints and an increase in the generation of electricity from renewable energy sources (RES) are causing increasing problems for the Transmission System Operators (TSOs) [1,2,3,4]; Terna S.p.A. (Italian TSO), for some years, has been forced to exploit existing energy corridors [5,6,7,8,9,10]. The use of Dynamic Thermal Rating (DTR) or Laser Imaging Detection and Ranging-Geographic Information System (L-GIS) systems represents two of the solutions adoptable for solving the problem.
The use of DTR systems along the electric line is very useful in order to dynamically evaluate the ambient conditions and the temperature of the conductors: the knowledge of these parameters allows the operators to optimize the capability of overhead lines when environmental conditions permit it while avoiding overload situations [8]. In the literature the use of DTR or Dynamic Line Rating (DLR) has spread in the last years.
In [11] the dynamic line ratings (DLRs) of overhead lines was evaluated based on changes in the line current owing to the high penetration of intermittent RES when large forecasting errors occur. In [12] an optimal real time transmission congestion management algorithm is proposed considering not static and fix thermal rates, but quasi-dynamic thermal rates of transmission lines. In [13] the wide range of real-time line monitoring devices which can be used to determine the DTR of an overhead transmission line in normal or contingency operation is discussed. In [14], considering the growth in RES installation, DTR is investigated as a way to connect the new intermittent generation, expanding the possibility to increase the rating of non-thermally limited lines (long lines). Regarding the L-GIS method, the geographic component together with the availability of information on a detailed geographical scale up to the urban level is undoubtedly an important element for the TSOs. The L-GIS systems therefore represent the innovative component, both from a technological and a methodological point of view, of collection, organization and also the use of that type of data.
Thanks to the GIS technology, today it is possible to collect cartographic data that can be used to optimize the operation of the overhead lines; this technology therefore provides Terna with a very important tool for the maintenance and management of the electricity system. This paper, after a brief description of the two methods, shows the applications and the results.
In fact, for the L-GIS method, through the use of software in the GIS environment, the maximum allowable temperature for a conductor has been calculated so that it reaches the maximum allowed sag, and subsequently, using the mathematical model of Schurig and Frick [15], the new capability of the lines under investigation (see Equation (7)). This model considers an ideal conductor with the following features:
- solid and homogeneous isotropic;
- cylindrical shape with horizontal axis;
- no skin effect;
- infinite thermal conductivity.
The max admissible temperature for the lines must guarantee compliance with the constraints on the distances of the power lines imposed by the legislator. Each simulation can give rise to two possible outcomes: (1) no interference recorded: the software repeats the calculation increasing the maximum temperature of the conductor by a small increase; the (iterative) calculation is interrupted when the first interference occurs. The maximum admissible temperature is therefore that of the previous iteration, i.e., the one that does not generate interference; (2) there are interferences: the software repeats the calculation decreasing the maximum temperature of a small decrease; the calculation is interrupted when there is no interference detected. The maximum allowable temperature of the conductor is that which does not register any interference. Finally, the maximum permissible temperature for the conductors is identified, which may allow compliance with the maximum sag for the test condition in question.
The software that allows such simulations in the GIS environment was produced for Visimind by Terna. Also results from the use of DTR systems in an important 220 kV connection has been presented. The purpose of this article is not to improve or do research on DTR or G-LIS technology, but only to implement it on power lines in order to optimize the transport capacity of existing energy corridors.
2. DTR System
Today the use of DTR systems is one of the most interesting methods to increase the transport capacity of existing power lines [16,17].
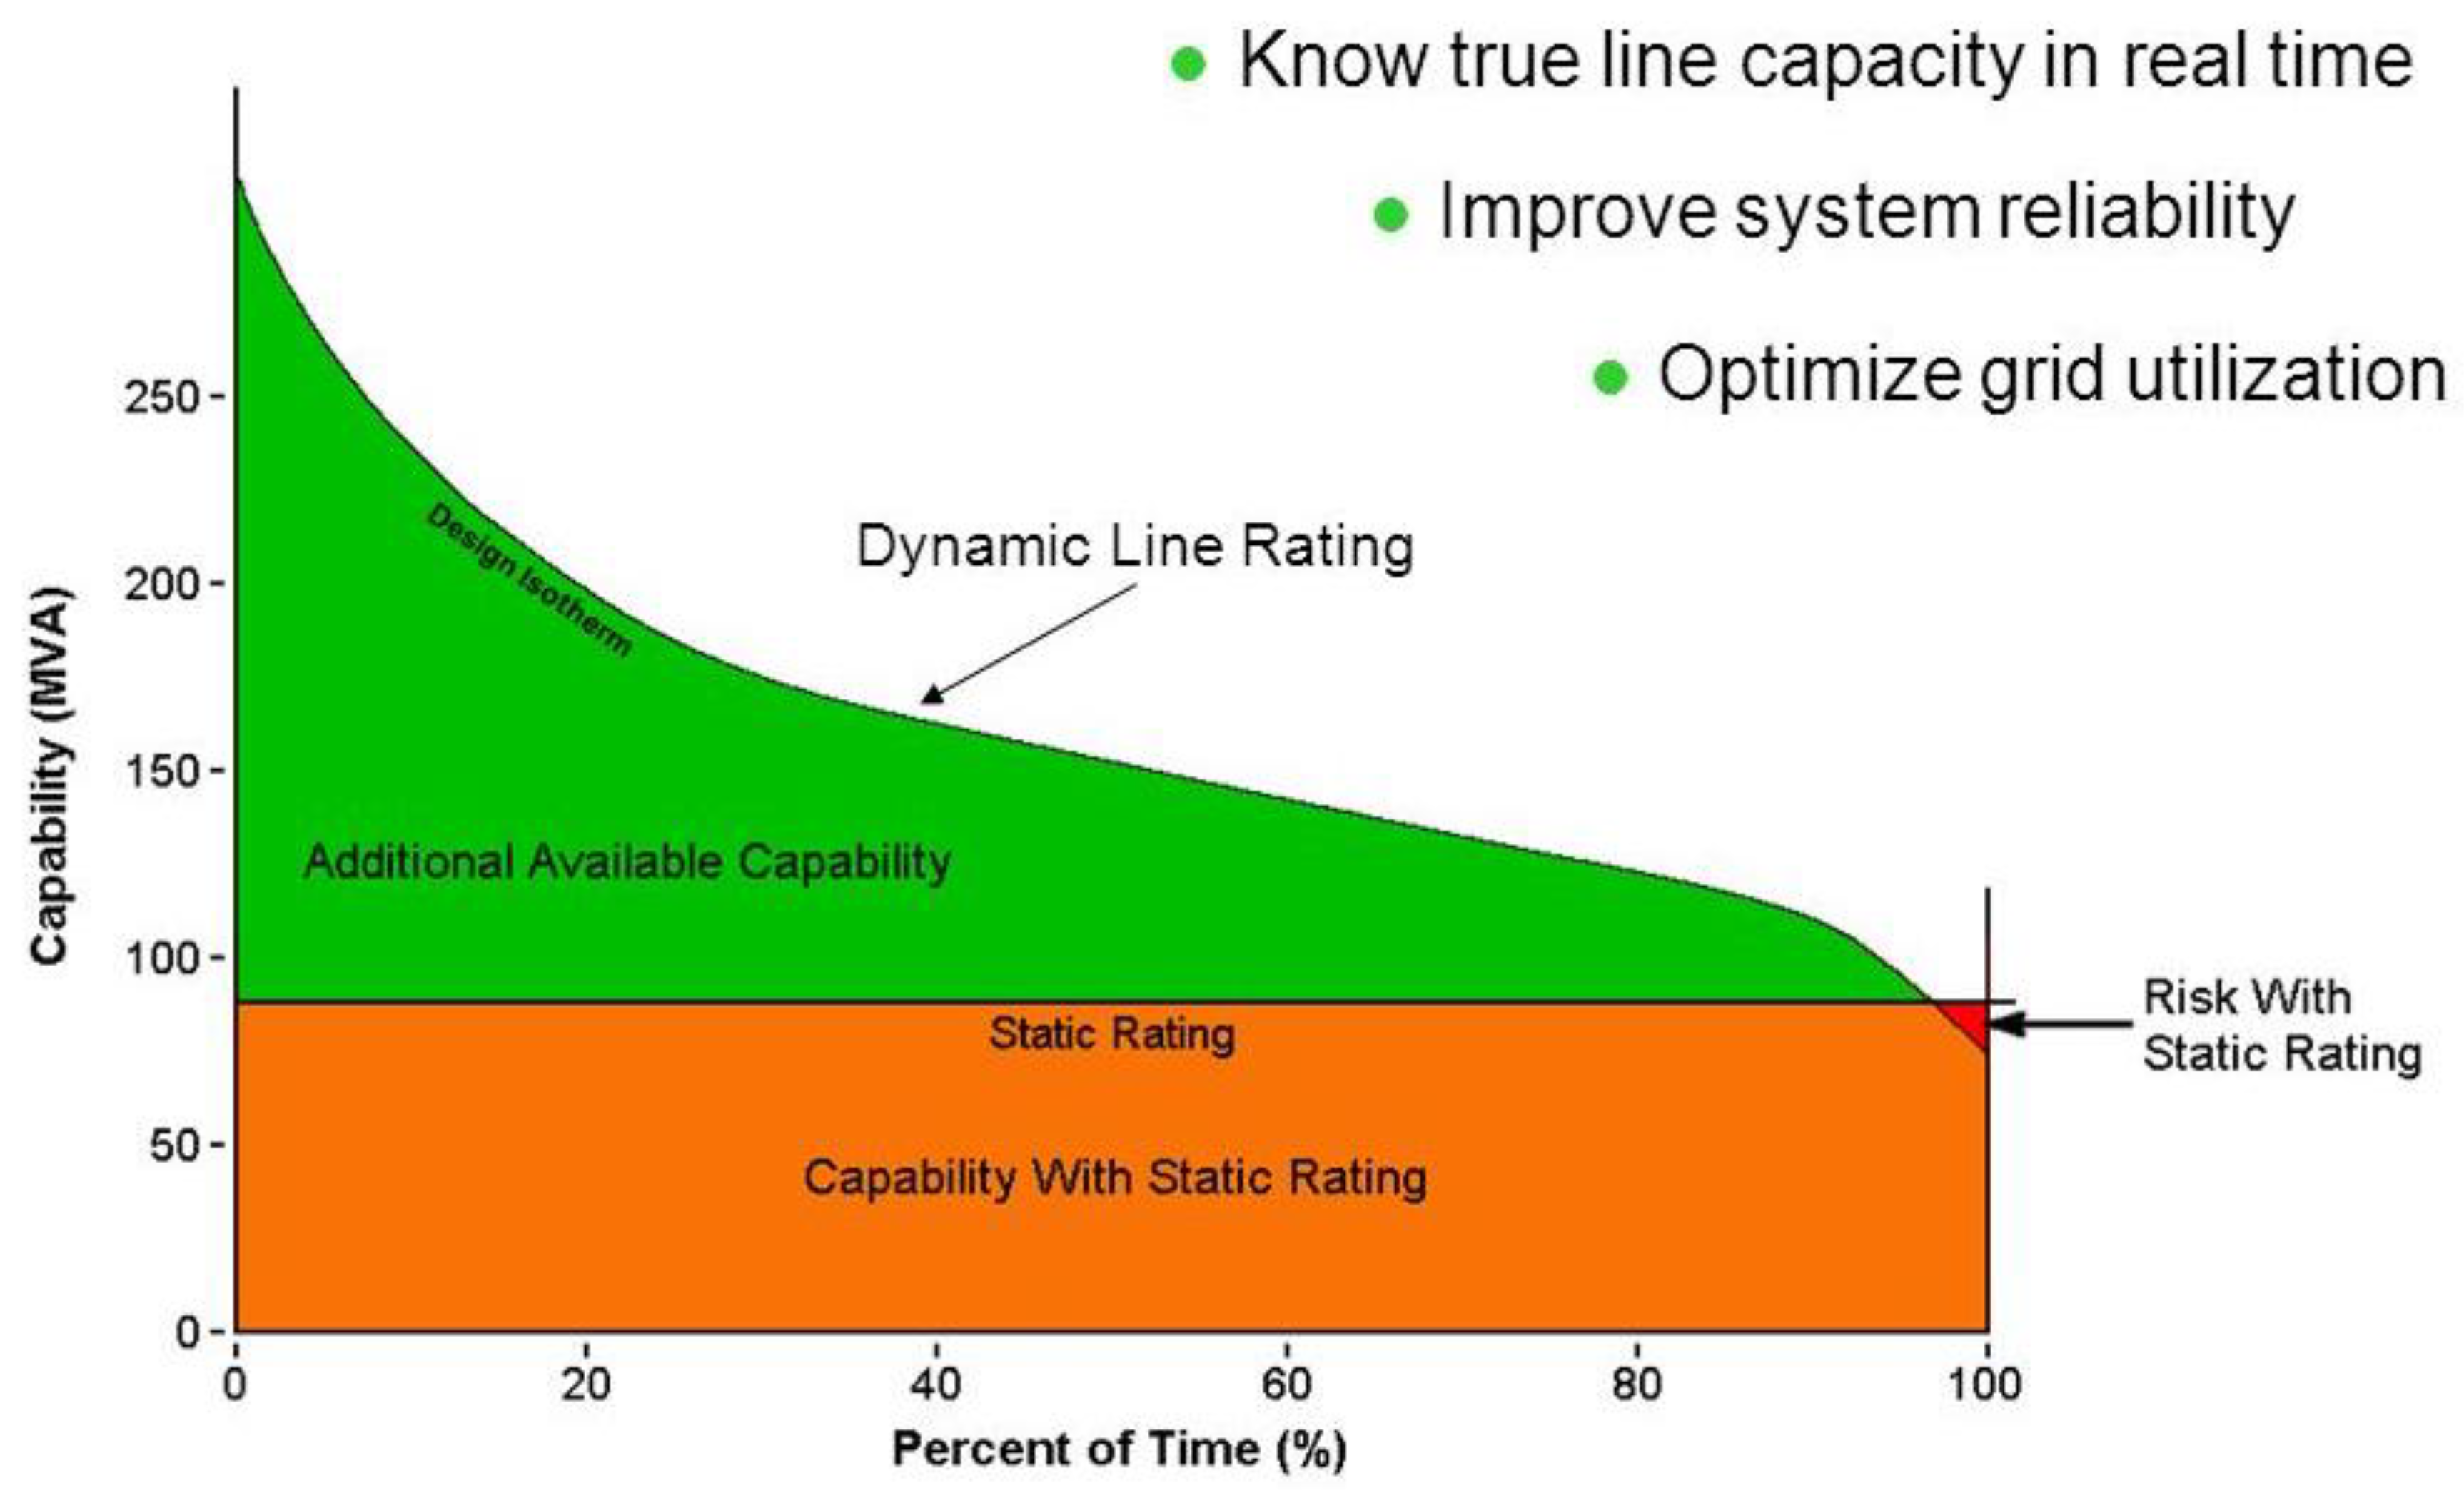
The possibility to know in real time and dynamically the environmental conditions and the temperature of the conductor, allows in many cases to increase the transmissible power by an overhead line, as shown in Figure 1 (green area), and at the same time to avoid situations of overload for the system when the conditions are not favorable (red area).
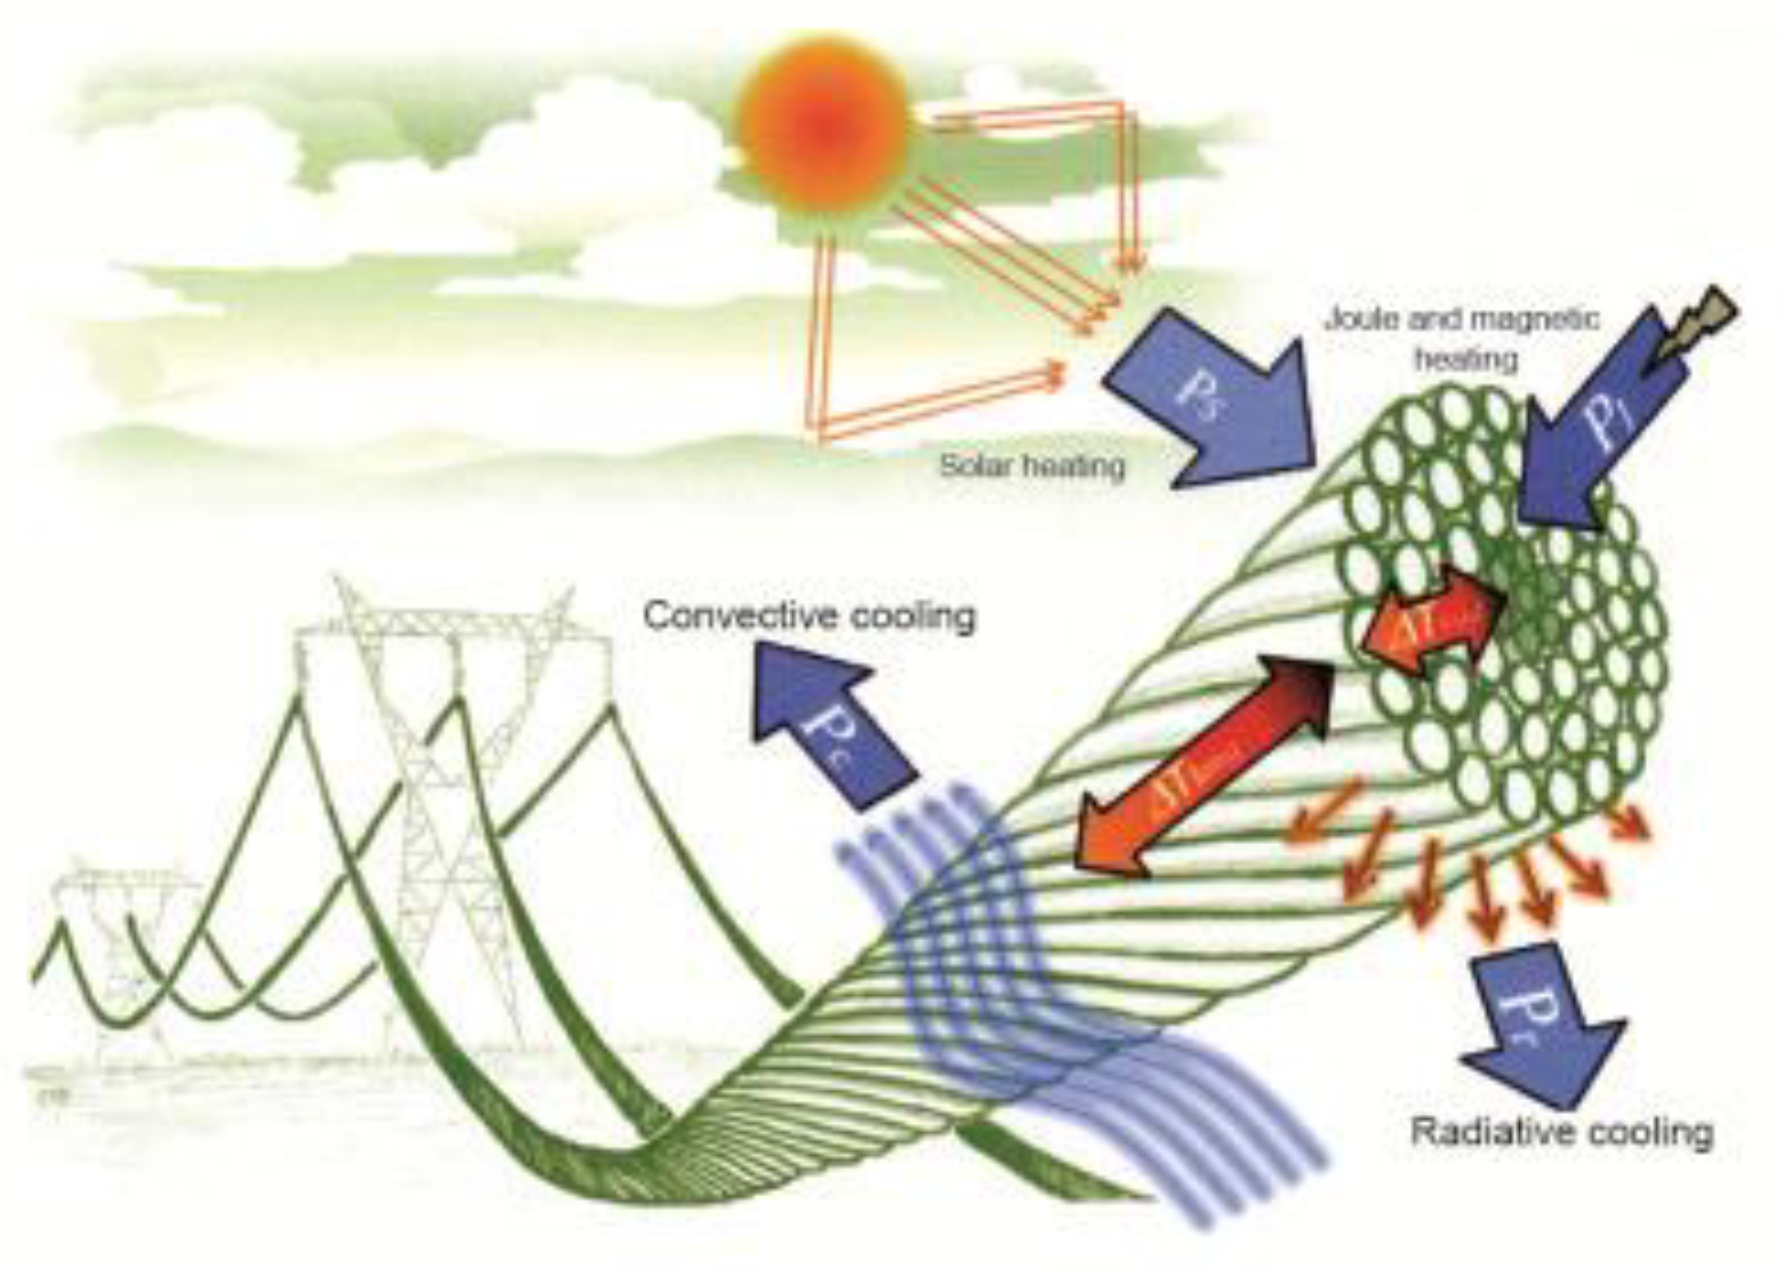
The dynamic evaluations related to the transmissible power from the line are carried out through the real-time detection of thermal parameters of some electrical and mechanical data of the conductor; recently the following methods have been studied in detail: weather model, sag-tension model, PMU (Phasor Measurement Unit) called “electrical model”. The weather model allows the calculation of the temperature of the electric line through the knowledge of the current value and some ambient parameters. The method used is that of the stationary thermal balance based on the heat equality produced and transferred to the environment [18] (Figure 2):
where:
- -
- qc convection heat loss;
- -
- qr radiation heat loss;
- -
- qs is the heat input by solar radiation;
- -
- I2·R is the ohmic losses.
By imposing the max allowed temperature for the electric line, the solution is given by the following equation:
This method is certainly the simplest one for the dynamic thermal evaluation of the power line; it is an indirect method of calculating the conductor temperature. It is very precise only if numerous weather stations are installed along the route of the overhead line. Otherwise the literature teaches that the weather conditions can vary significantly from one area to another.
To overcome the constraints of the environmental data it is possible to control the sag and the tension of the conductor. In fact, the sag-tension model provides important information along an entire line section rather than in a single point. Therefore, knowing the catenary equation it is possible to go back to the value of the conductor temperature.
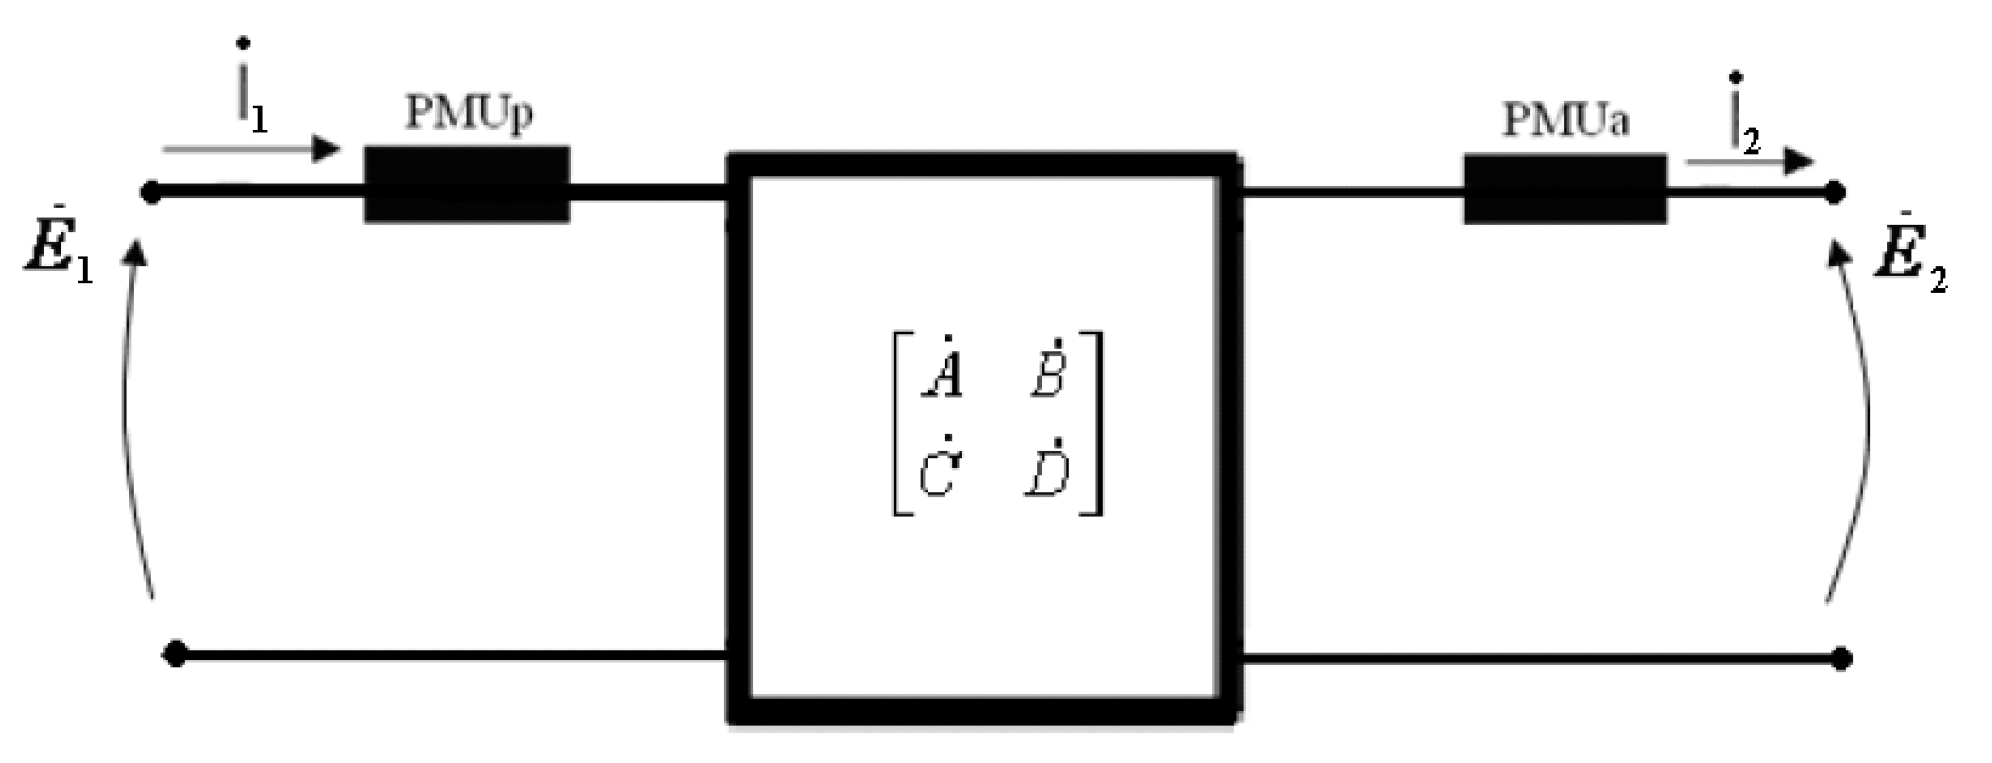
Another method to dynamically evaluate the flow rate at the thermal limit of the line is the electrical model. Phasor measurement units (PMU), located on the extreme substations, detects the phasor of voltage and current synchronized by GPS. The line model is represented in Figure 3 [16].
PMU operation is described by the following equations:
being E1 and I1 voltage and current starting phasors, E2 and I2 voltage and current ending phasors, θ complex angle (given by the product between the propagation constant and the length of the line) and Zc is line (characteristic) impedance. In compact form:
where:
After evaluating the impedance of line Z, the resistance and knowing the properties of the conductive material, the average conductor temperature can be obtained. Recently some systems have been developed that implement the model just described. Some of these are already operational in some electrical systems in the world and are very useful for TSOs in the management of their power lines. Below a brief description of Power Donut (PD) and PMU is reported [16].
2.1. Power DonutTM
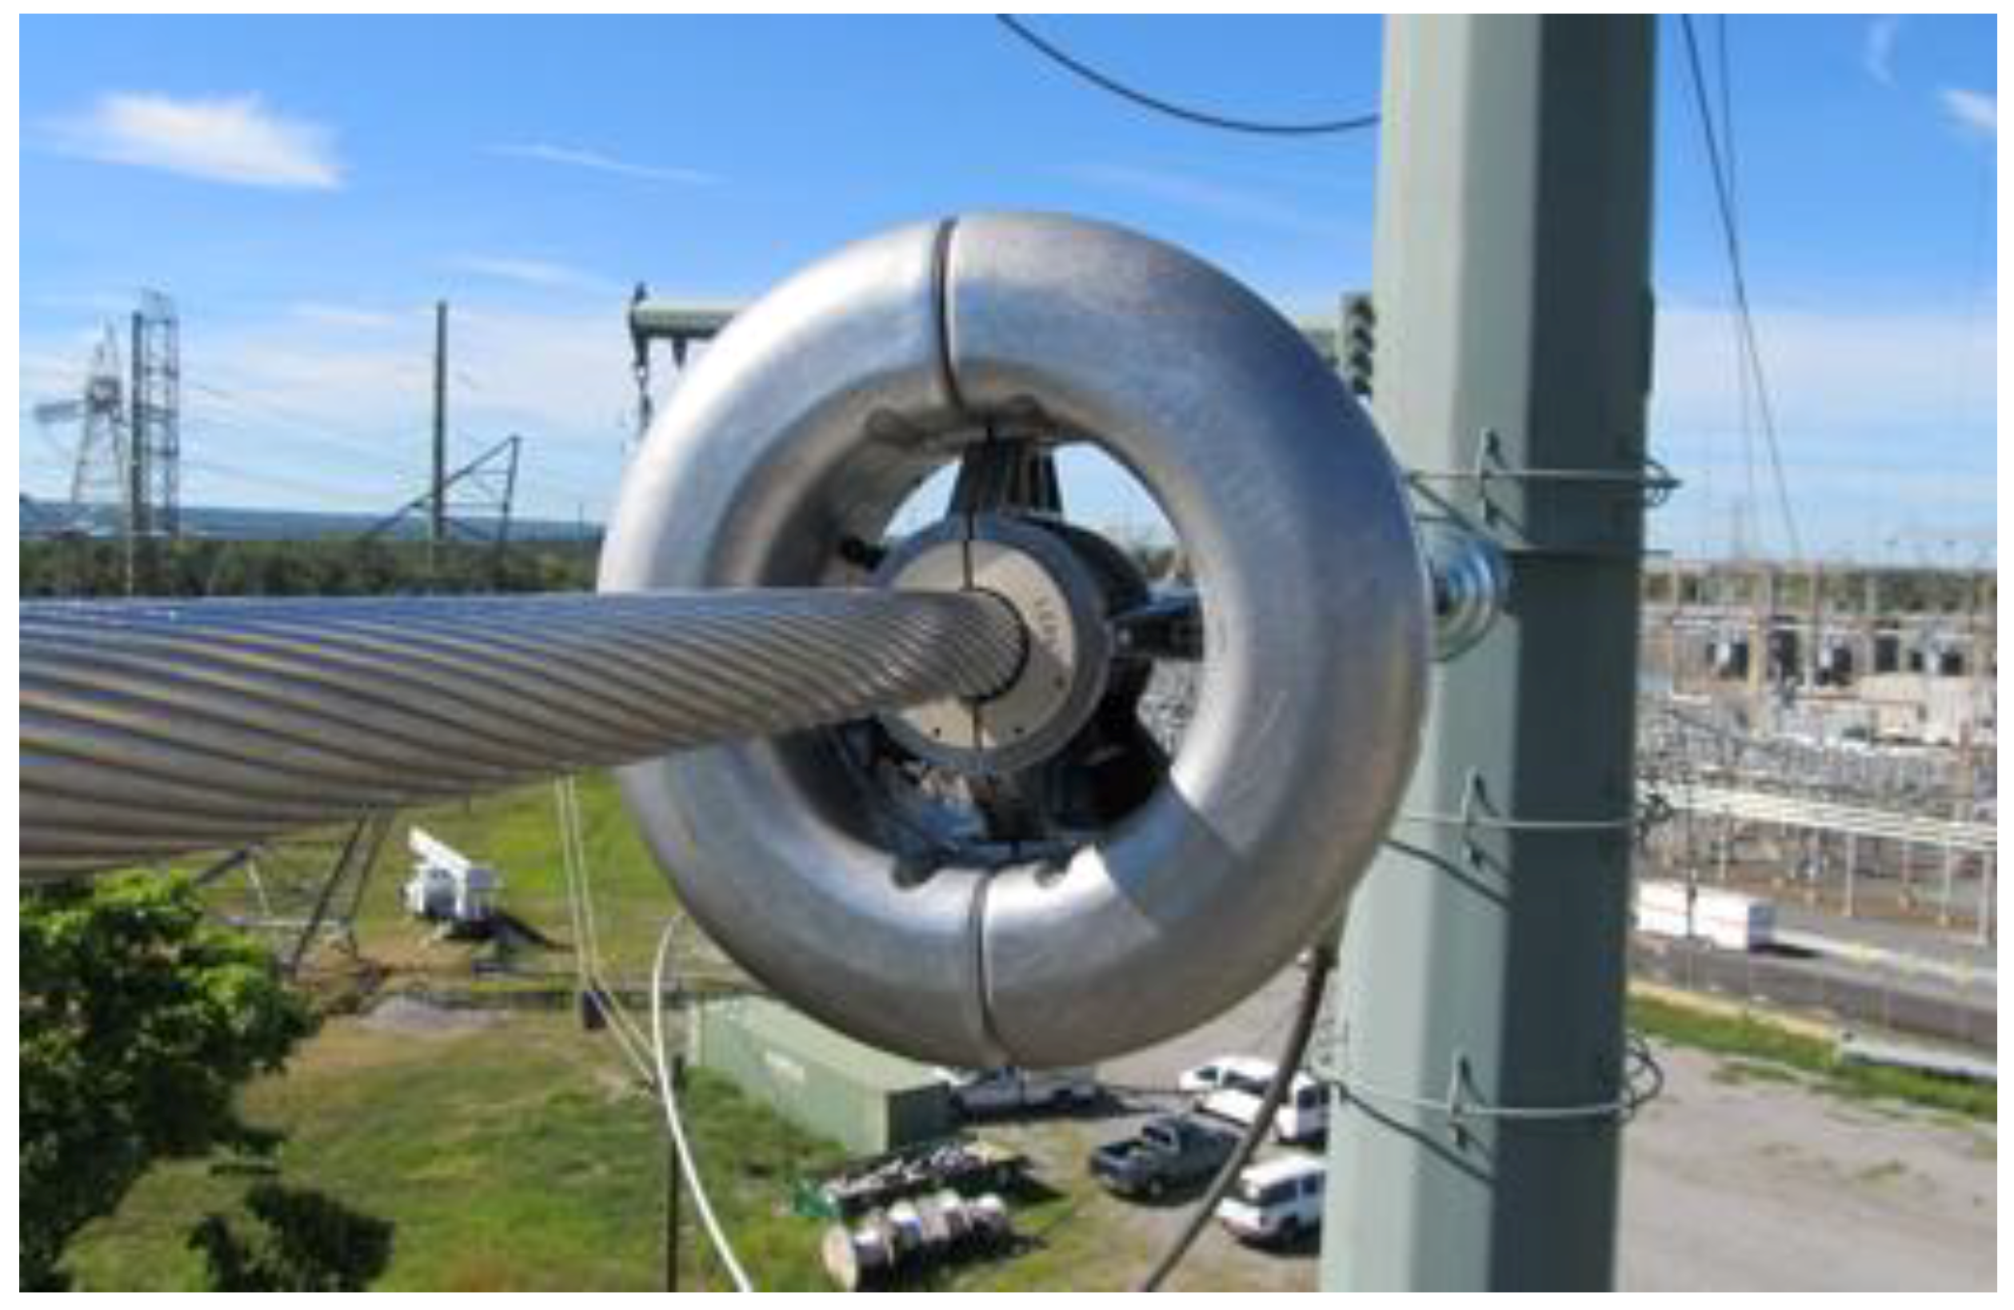
Power Donut [19] is a platform of sensors used to monitor the electrical, thermal and mechanical parameters of the conductors of HV overhead power lines. In particular, the measured quantities are: current, voltage, temperature of the conductor and environmental temperature, inclination of the conductor, active and reactive power. The device described in this paper is called Power Donut (Figure 4); more versions have been produced in recent years.
This is a model application based on temperature. Power Dunut also has a sensor for detecting ambient temperature. It transmits data through: GSM/GPRS/EDGE radio, 2.4 GHz ZigBee. The first system does not require local RTU. The receiving station can be anywhere broadband access is available. The GSM (Global System for Mobile Communication) Power Donut (with a built-in SIM (Subscriber Identity Module) card) transmits the protected TCP (Transmission Control Protocol)/IP (Internet Protocol) data to a fixed and unique IP address using a GSM/GPRS/EDGE wireless data service.
The Power Donut with 2.4 GHz ZigBee radio transmits data to a ground station receiver. Meteorological station’s measures are transmitted by BlueToothTM wireless connection. Power Donut is able to determine dynamic rating of the line and monitors conductor temperature, span and tension [8].
2.2. PMU for Dynamic Rating Application
The dynamic calculation of the transport capacity of the power line can be made by determining the average temperature of the entire line thanks to the Phasor Measurement Units (PMUs) installed at the two ends of the overhead line. This method is an application of the electric model. The voltage and current phasors measured at the two ends of a line (collected by GPS synchronized PMUs) allow to calculate the electrical parameters of interest of the power line. Knowing the resistance of the conductor, based on the properties of the material that constitutes it, the actual average temperature of the line is determined. The algorithm provides calculations every second [8].
The main disadvantage of the use of PMUs is due to the fact that the calculated conductor temperature is in fact an average value along the entire line and it is difficult to determine the maximum value because various sections of the power line could have very different temperatures.
3. GIS–LIDAR System
Transmission system operators need to know the position and conditions of their resources (stations, substations, lines, etc.). Therefore it is desirable that these data are first collected and then used by the designers and responsible for the maintenance of the electrical system.
LIDAR does not only confirm data known by TSO. Often important information including thermal temperature constraints, minimum ground clearance, structural loads and conductor sag and tension is not accurately recorded on existing plan and profile drawings. In general, the plan and profile drawing is a record of how the line was designed, not necessarily how the line was built. The possibility that no information whatsoever is available on a particular line also exists (in particular for old lines). LIDAR technology is not used only for knowing the line layout (e.g., Transmission line modelling), but it’s also important to thermal rating verification and to study upgrade solutions for the System. Referring to transmission line modelling, often at the end of the mapping, TSO can discover some installations (buildings, sheds, obstacles in general) that were not present in the project or when the line was built. These (additional) informations are very important.
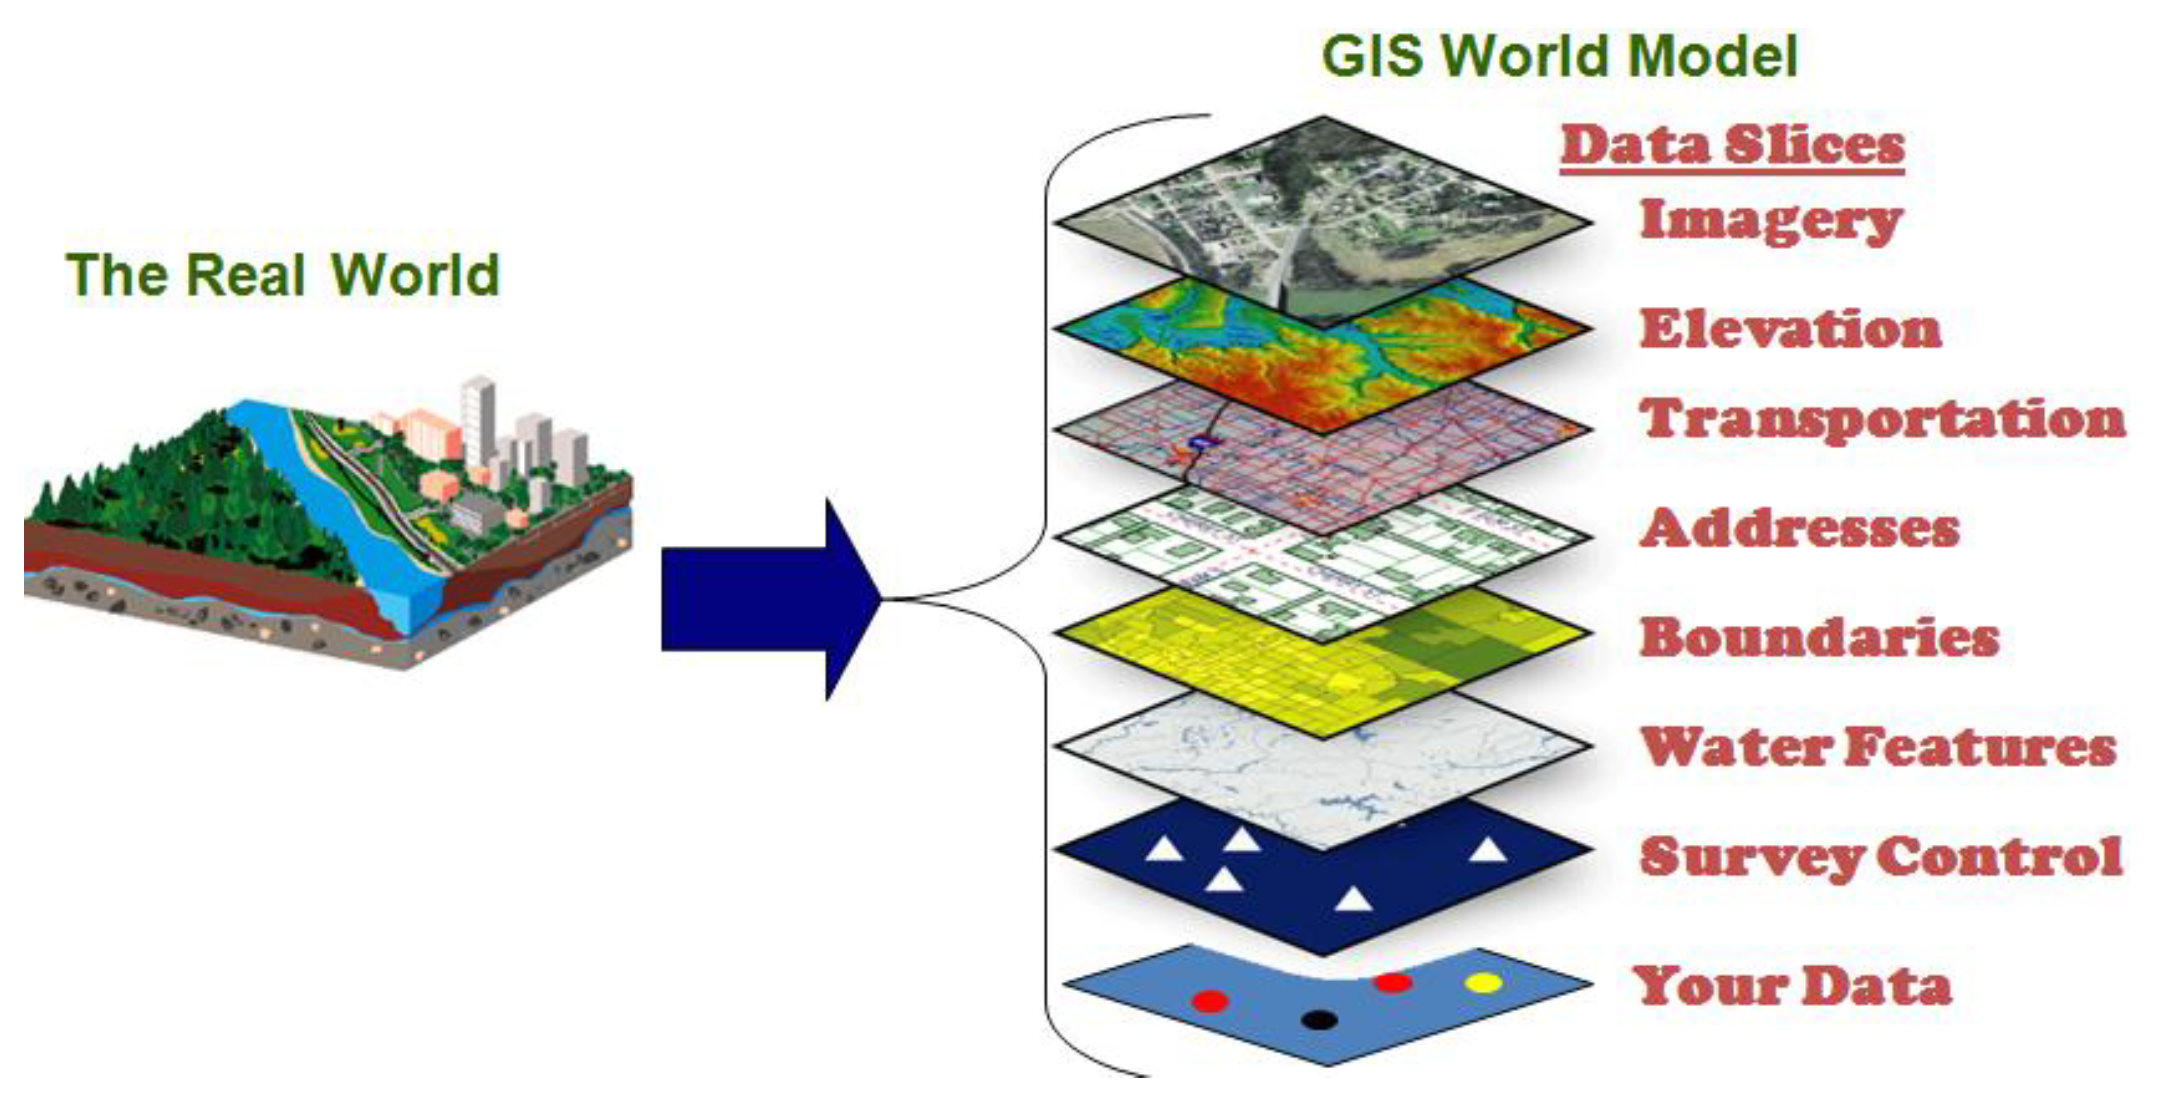
Figure 5 shows an example of a GIS system.
The GIS application in use at Terna allows the analysis of the behavior of overhead lines and at the same time the calculation of the transport capacity at the thermal limit for the verification of the maximum sag and distance from other interfering obstacles; therefore allows the verification of the electric and magnetic field at industrial frequency considering the limits established in Italy.
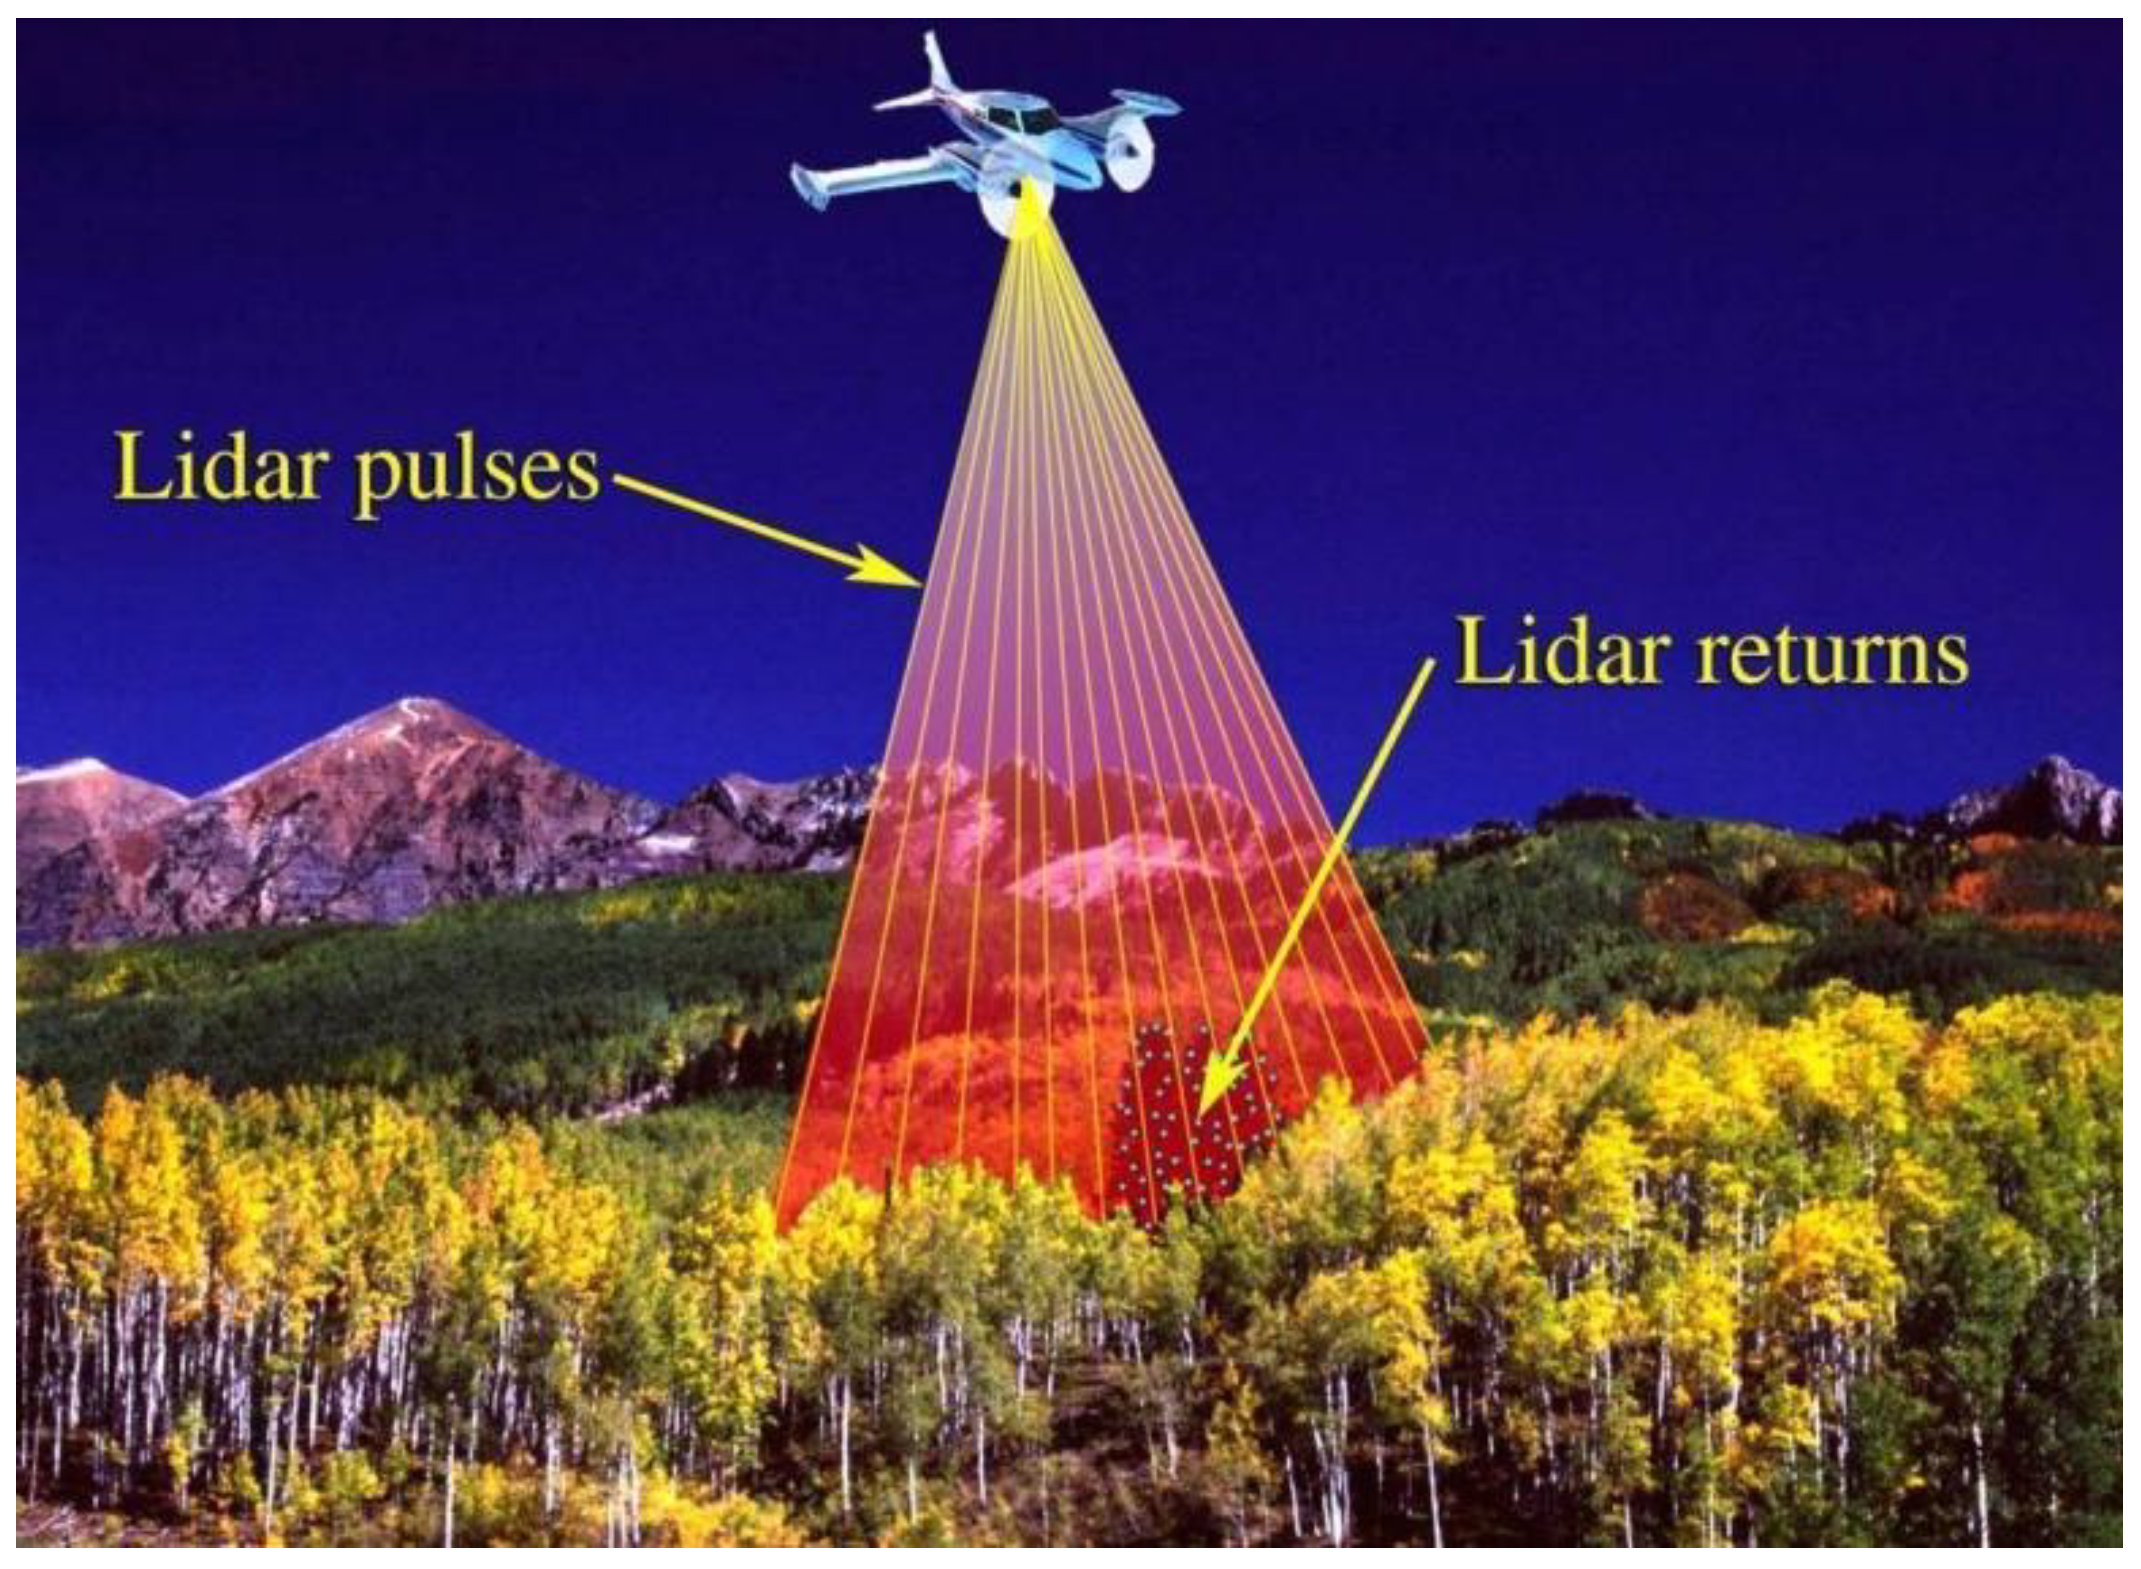
GIS-LIDAR scans the territory, overflown by an airplane, thanks to the use of a laser range finder that calculates the distance between the point where the laser is emitted, i.e., the rangefinder, and the point at which this is reflected, corresponding to a general point of the measured surface that was hit by the laser (Figure 6) [4].
An electric pulse generator creates a beam of light at the infrared frequency; the reflected signal is subsequently detected by a photodiode receiver which produces an electrical signal. The telemeter measures the time Δt, called flight time, used by the laser pulse to travel the return journey through the use of a quartz clock. The distance D is a function of the flight time Δt according to the following equation:
where c is the propagation speed of the signal (3 × 10⁸ m/s). The survey therefore allows to know the three spatial coordinates for each measurement performed. It is also essential to know the position and balance of the aircraft at any time to accurately calculate the coordinates of the object points of remote sensing [4].
D = (Δt × c)/2
Some instruments measure, in addition to the flight time, the intensity of the return signal. The knowledge of this second magnitude is important to know the physical characteristics of the surfaces affected. A very important feature of LIDAR technology is the variable size of the laser beam impression.
The size of the laser beam footprint varies from 0.1 m to 2 m and is proportional to the altitude and angular aperture of the sensor and allows to generate more echoes: for example, if a beam meets a tree, a part is reflected, while the remaining part continues until it reaches the ground to be reflected later. The multiple reflections considerably increase the possibility that, in the presence of trees, some rays reach the ground determining the height of the point towards the ground.
These pulses are recorded by the receiver at different times: the first return echo will be the one reflected by the first hit object (tree), while the second will be the one of the underlying ground. Through an appropriate algorithm that filters the cloud of points measured in origin, containing reflections of buildings, vegetation, etc., it is possible to detect the height of the points of land [20].
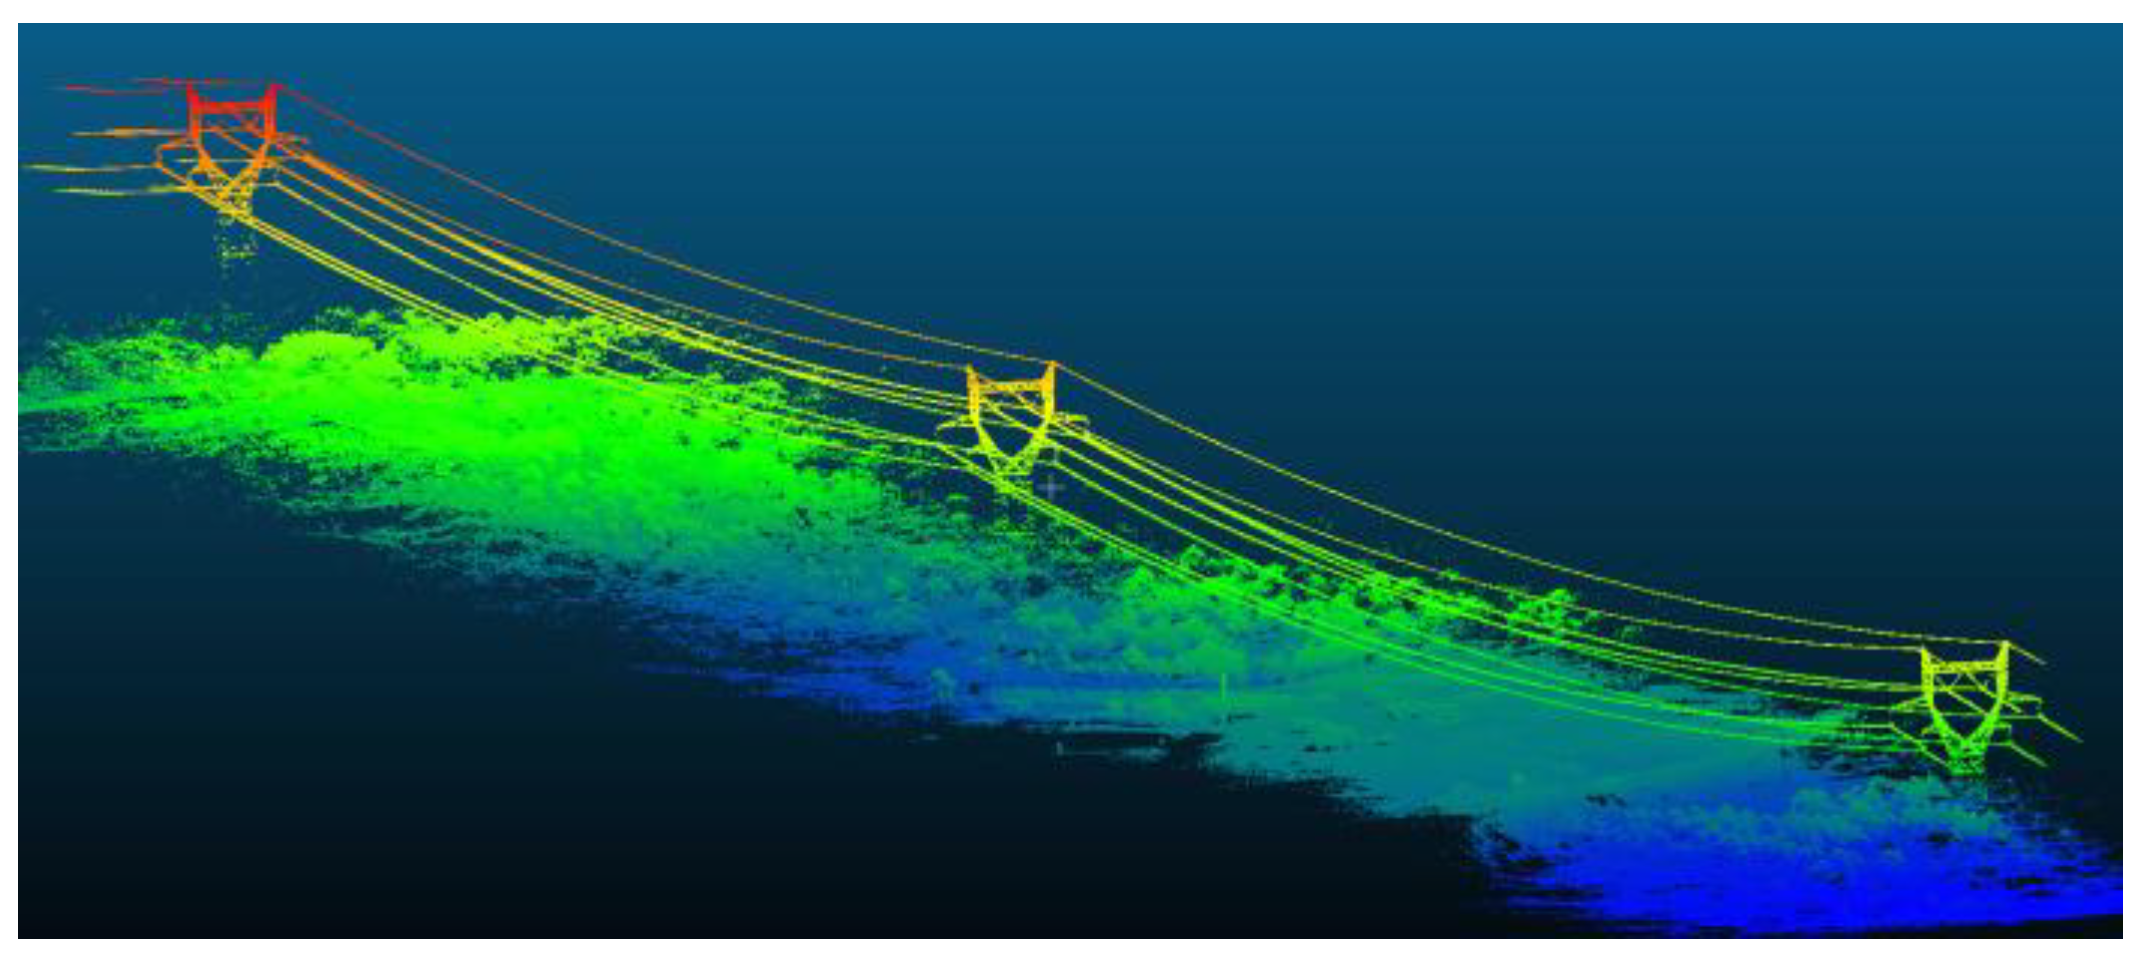
The millions of points identified on objects affected by the impulse are processed to create a 3D model. The position of the power line, intended as a metallic conductor, can be modeled by the LIDAR points detected by the sensors (Figure 7) [4].
This tool allows to obtain many useful elements for the Transmission System Operator: it allows the knowledge of the layout of the detected line, the dimensions of the conductors, the length of the line, the number, type and position of the supports, etc. All these data are very important for planning and for subsequent analyzes.
After the implementation of the LIDAR system in Terna in 2010, an activity that defined the creation of a map data base for all Terna’s power lines, subsequent developments have led, in recent years, to a consolidation of the knowledge of the territory crossed by the power lines and a constant updating regarding urban and vegetative development.
In fact, the control of the territory is one of the indispensable activities that Terna have constantly to carry out in order to maintain and safely operate the power lines under its responsibility, all in compliance with the current technical and legislative standards.
From the point of view of the development of the underlying vegetation, the power lines, as known by Italian Ministerial Decree 21 March 1988, establish the minimum safety distances that must be maintained between conductors and vegetation to avoid electric arc strikes and fire risk.
Similarly, the same Ministerial Decree establishes the minimum distances to be maintained compared to other works crossed, such as buildings, roads, land in general, etc. while the DPCM (Decree of the President of the Council of Ministers) 8.7.2003, that regards the exposure to electric and magnetic fields, establishes the minimum distance that must be maintained between the conductors and areas for various reasons used for prolonged stay of people.
It is natural that both the vegetative growth and the urban and infrastructural development have a constant evolution over time, therefore the need to keep the map data base prepared by Terna constantly updated through the LIDAR system is clear.
In the last few years the number and extension of power lines managed by Terna has increased both for the construction of new plants but, above all, for the acquisition, in December 2016, of the part of the Italian Railway Network Company that manages all the 60 kV and 150 kV power lines served by the electric railway traction, hence the need to integrate the map data base with the surveys conducted on these new power lines.
After the flight carried out in 2010, flights were conducted almost annually for monitoring the tree vegetation, such flights take as construction data of the power line (height of the supports and progress of the catenary that are provided as input) the original one of 2010, while they create a new 3D modeling of the only underlying tree vegetation.
A separate flight was instead made in April 2017 for the implementation of all the power lines acquired by Railway Network Company.
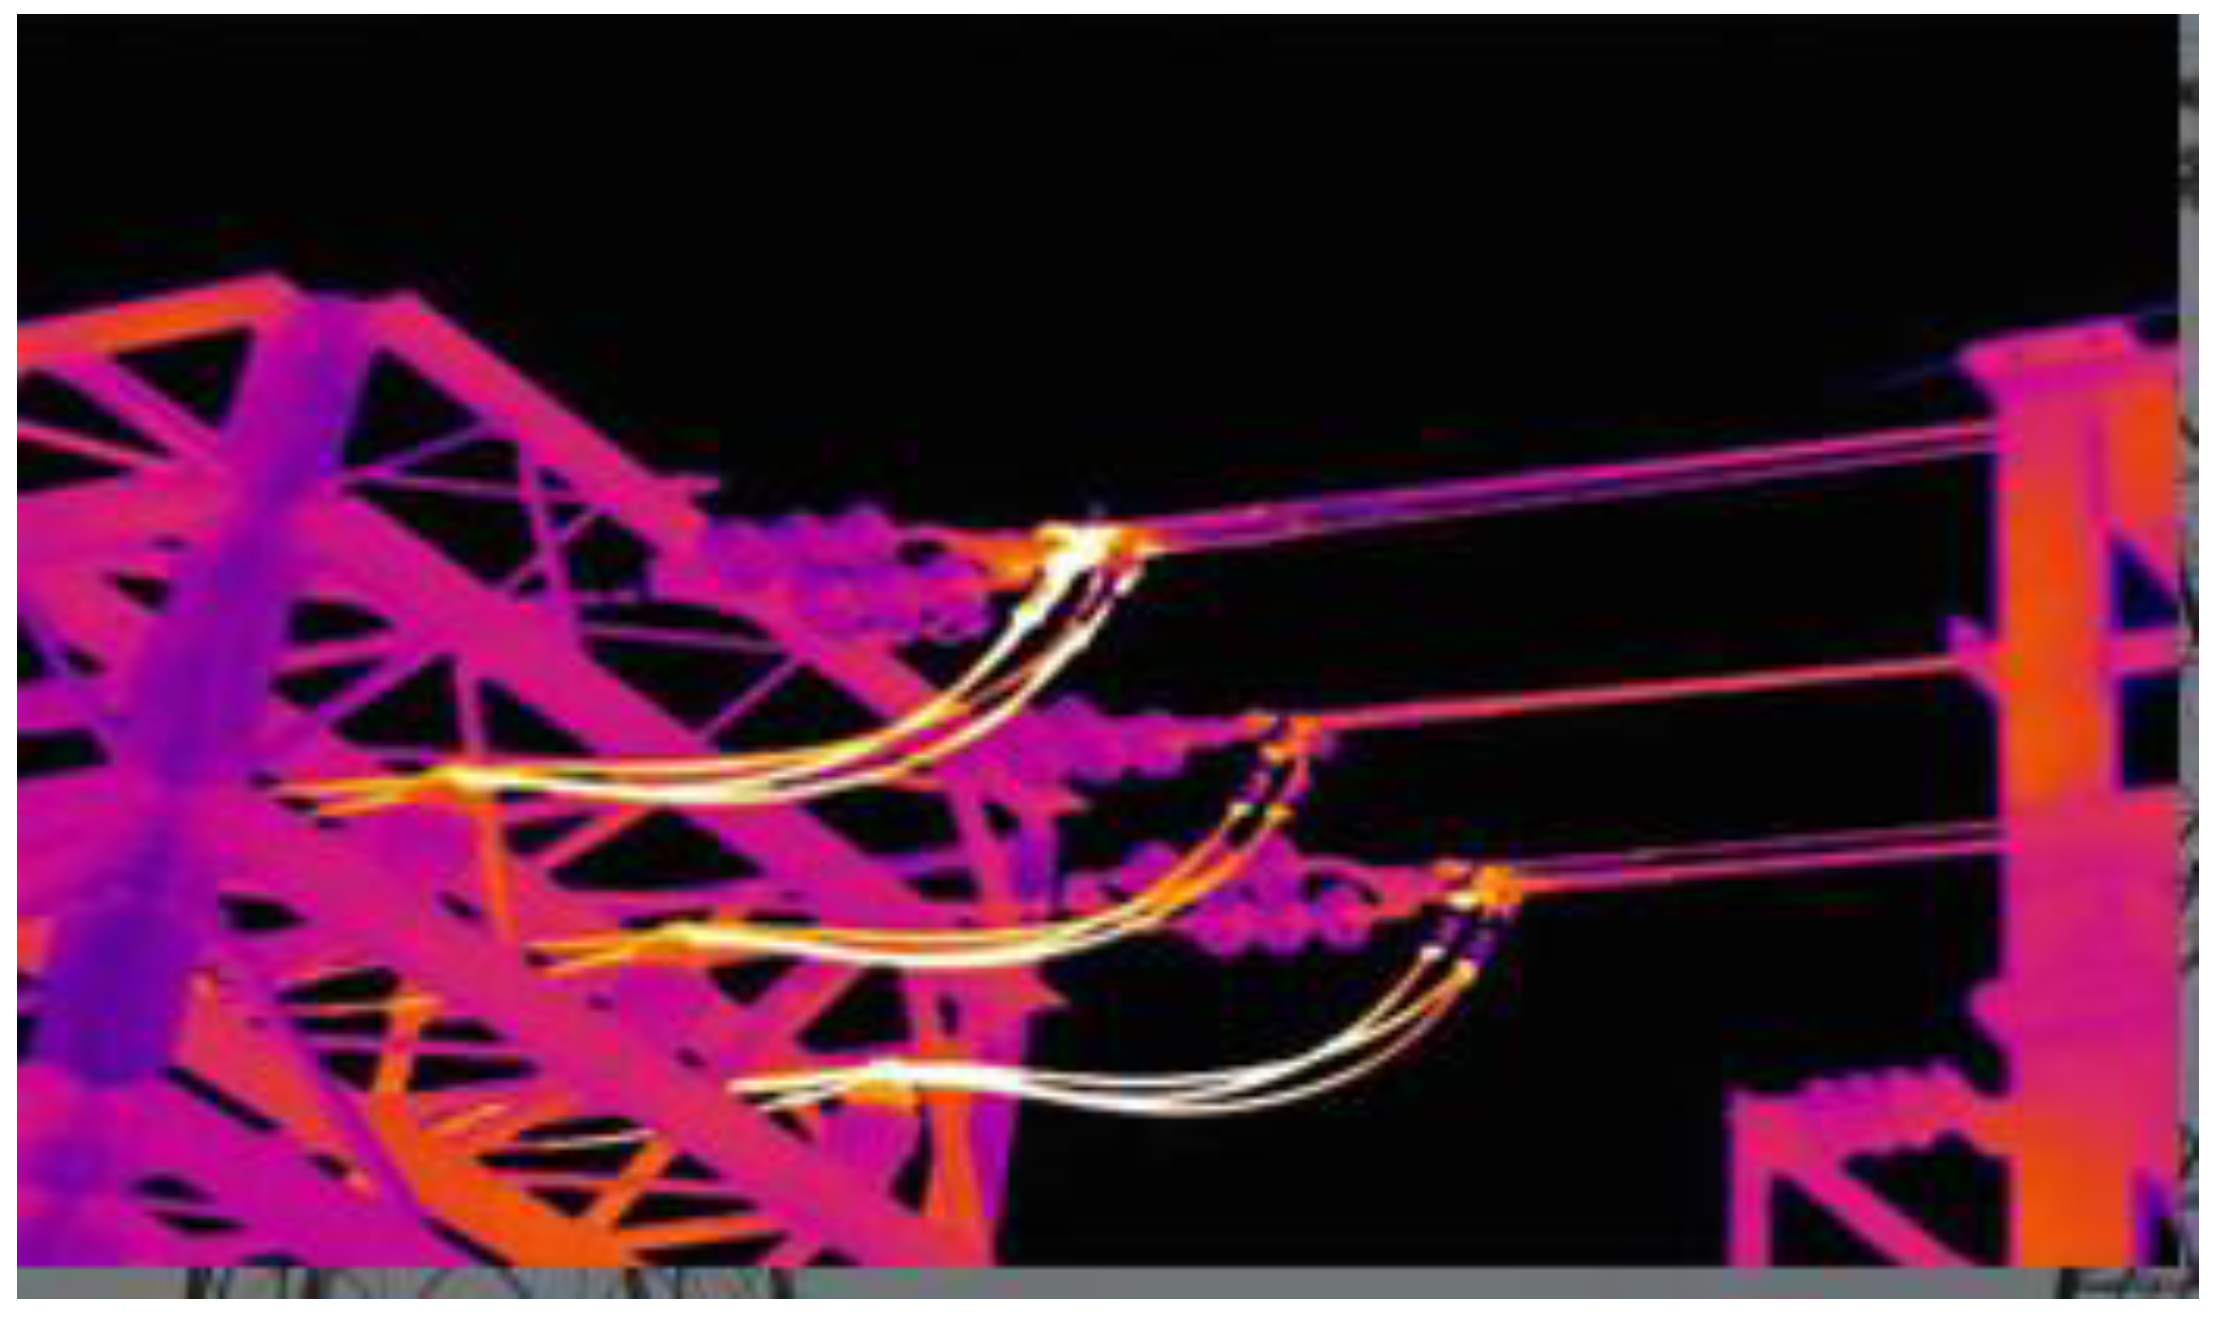
Terna, for some years now, has utilized two helicopters equipped with infrared thermovision systems (Figure 8) for monitoring its plants for maintenance purposes. On an annual basis, flights are carried out on a suitable portion of the electricity network to detect hot spots on the system. The hotspots are not related to the dynamic thermal rating, but the authors have mentioned the infrared thermovision systems only for monitoring its plants and for maintenance purposes.
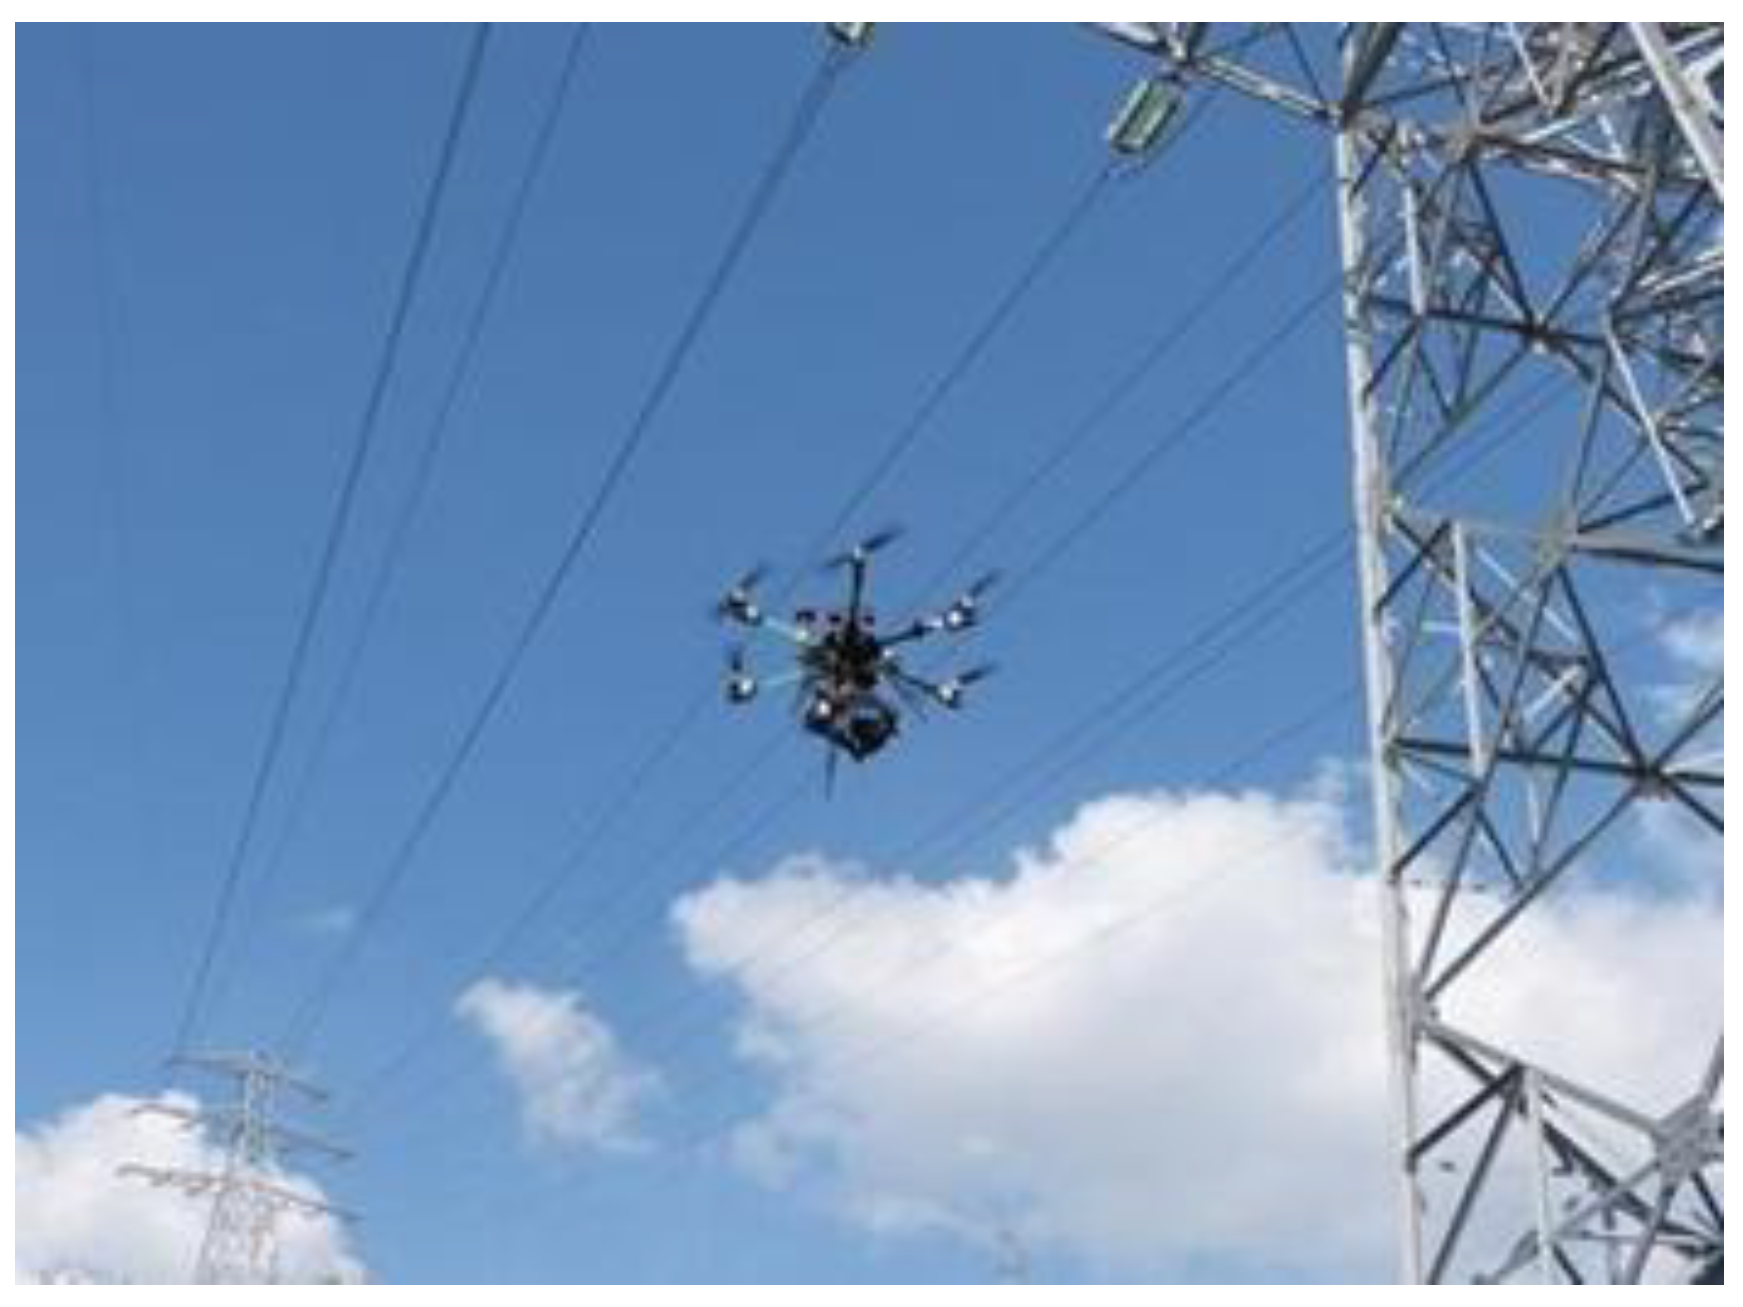
Finally, still being tested, is the possibility of equipping a drone (Figure 9) with the same monitoring systems currently installed on helicopters (infrared camera and high resolution), taking advantage of the extraordinary maneuverability and versatility of drone systems, in addition to the significantly low costs.
4. L-GIS System Application
This paper reports the results of the analysis conducted on the Sicilian electrical system for three 150 kV power lines [21,22]. The study followed the following steps:
- -
- Selection of the lines under investigation;
- -
- Calculation of the maximum allowable temperature of the conductors to respect the distances of the power lines imposed by the legislator (DM 449 of 1988) through the 3D DPM software (DPM 3D Inspection, Visimind AB, Södra långgatan, Solna, SWEDEN);
- -
- Calculation of the maximum permissible current on the line, based on the temperature referred to point above, through the mathematical model Schurig and Frick.
4.1. Line Under Investigation
The selected lines are, here in after, called:
- -
- Line A: 11 km long, located in the east Sicily; Aluminum Conductor Steel Reinforced (ACSR) conductor with a diameter of 22.8 mm.
- -
- Line B: 32 km long, located in west Sicily; ACSR conductor with a diameter of 31.5 mm.
- -
- Line C: 6.5 km long, located in west Sicily; ACSR conductor with a diameter of 31.5 mm.
4.2. Maximum Allowable Conductor Temperature
The max admissible temperature for the lines must guarantee compliance with the constraints on the distances of the power lines imposed by the legislator. Each simulation can give rise to two possible outcomes (interference is to be understood with proximity to other objects from which it must be maintained security distances):
- -
- No interference recorded: the software repeats the calculation increasing the maximum temperature of the conductor by a small increase; the (iterative) calculation is interrupted when the first interference occurs. The maximum admissible temperature is therefore that of the previous iteration, i.e., the one that does not generate interference.
- -
- There are interferences: the software repeats the calculation decreasing the maximum temperature of a small decrease; the calculation is interrupted when there is no interference detected. The maximum allowable temperature of the conductor is that which does not register any interference.
4.3. Ampacity Calculation
In general, for a bare stranded conductor, if the conductor’s surface temperature and the steady state weather parameters are known, the heat losses due to convection and radiation, the solar heat gain, and the conductor resistance can be calculated. The corresponding conductor current that produced this conductor temperature under these weather conditions can be found from the steady-state heat balance. While this calculation can be done for any conductor temperature and any weather conditions for which the heat transfer models are adequate, a maximum allowable conductor temperature and “conservative” weather conditions are often used to calculate a steady-state thermal rating for the conductor.
In this case, once the max admissible temperature on the analyzed power line has been calculated, the transport capacity can be calculated at the thermal limit, using the Schurig and Frick model, according to the following equation [18]:
where:
Pj = Pr + Pc − Ps
- -
- Pj = Joule losses
- -
- Pr = Radiative losses. Dependent on ambient temperature, conductor diameter and emissivity.
- -
- Pc = Power dissipated by convection. It depends on ambient temperature, diameter of the conductor, wind speed and direction.
- -
- Ps = power absorbed by solar radiation. It depends on solar radiation.
The current is calculated as follow [15]:
4.4. Results of L-GIS Application
4.4.1. Line A
The maximum admissible temperature of the conductors is 55 °C (design temperature); thus it is therefore possible to calculate the maximum permissible current for the power line. This calculation is repeated in two periods of the year, winter and summer, with different weather conditions. The calculation is performed both with the method just proposed and with that described by CEI (Comitato Elettrotecnico Italiano) 11-60 [24]. The CEI 11-60 is an Italian Standard useful to calculate the carrying capacity at thermic limit of overhead lines exceeding 100 kV. This standard divides Italy into two homogeneous climatic zones (Zone A and Zone B) and for each level of voltage and for each zone indicates the current value that can circulate in the reference conductor in reasonably worse environmental conditions. The standard also provides a formula for calculating the current in the case in which the analyzed conductor has a different diameter from the reference one. Lastly it also takes into account the flow in emergency conditions, allowing an increase of this for a limited period of time. The environmental parameters, reported in Table 1 [4], have been taken into consideration. In this case, since the lines under investigation are short, the parameters are considered constant along the line. In the case of a long line it is necessary to identify the critical span under the profile of the heat exchange and to refer to it. In order to overcome weather data constrains, it’s possible to monitor line sag and tension. In fact Sag/Tension-based model responds to the weather conditions along the line section rather than to weather conditions at a single point along the line. Therefore, ratings based on a single sag-tension monitor are equivalent to several weather stations along the line.
The ambient temperature and wind speed have been identified through the analysis of the series of the last years at the weather station located near the power line [4]. The values used in Equation (3), are, cautiously, the worst of the series, i.e., those that provide lower current values. The results (ampacity) are reported in the conclusions section”. The same for line B (4.4.2) and for line C (4.4.3).
4.4.2. Line B
In this case the max admissible temperature that can be reached by the conductor, for the respect of the constraints imposed by the legislator, is equal to 76 °C. The environmental parameters, reported in Table 2, have been taken into consideration:
The results (ampacity) are reported in Table 3.
4.4.3. Line C
In this case the max admissible temperature of the lines is that which creates problems of annealing the aluminum cladding and the junctions; the annealing phenomena can create a decrease in the mechanical performances of the power line.
For these reasons, for the line C, a maximum over temperature of 40 °C is accepted with respect to a maximum ambient temperature of 40 °C; and therefore the line can reach a maximum of 80 °C. Given the geographical proximity with the line of case B, the environmental conditions assumed are the same as previously considered. The results (ampacity) are reported in Table 3.
The authors considered two lines (B and C) in the same climatic zone because, in addition to the difference in terms of length (32 km and 6.5 km), one of the two lines is often congested on windy days due to high energy production from wind farms.
5. DTR Application
The line under investigation (called Line D) is an 220 kV important connection because, in some operating conditions, it tends to overload due to the high density of production plants located in that area both traditional and renewable energy sources (RES). As known in literature, the N-1 Criterion is a criterion where the system, following a credible contingency event, is required to be capable to operate within certain minimum performance, so this criterion ensures the normal operation of the grid even when element grid goes out of working. This criteria expresses the ability of the transmission system working in security conditions in circuit outage situation, in order to avoid overload failure in other lines.
The abovementioned operational condition is N and not N-1. If an out-of-service connection of the close 400 kV connection occurs, the monitored object line would suffer an unacceptable overload, exceeding the static current limit, asking for a re-dispatch of the power flows on the remaining lines in service.
Results of DTR Application
The implementation of these Dynamic Thermal Rating (DTR) systems in this power line allows N-1 safety conditions to be maintained on the electrical system by dynamically calculating the conductor temperatures according to real environmental conditions, thus avoiding problems in the operation of the system electric (e.g., re-dispatching flows on the system to avoid congestion).
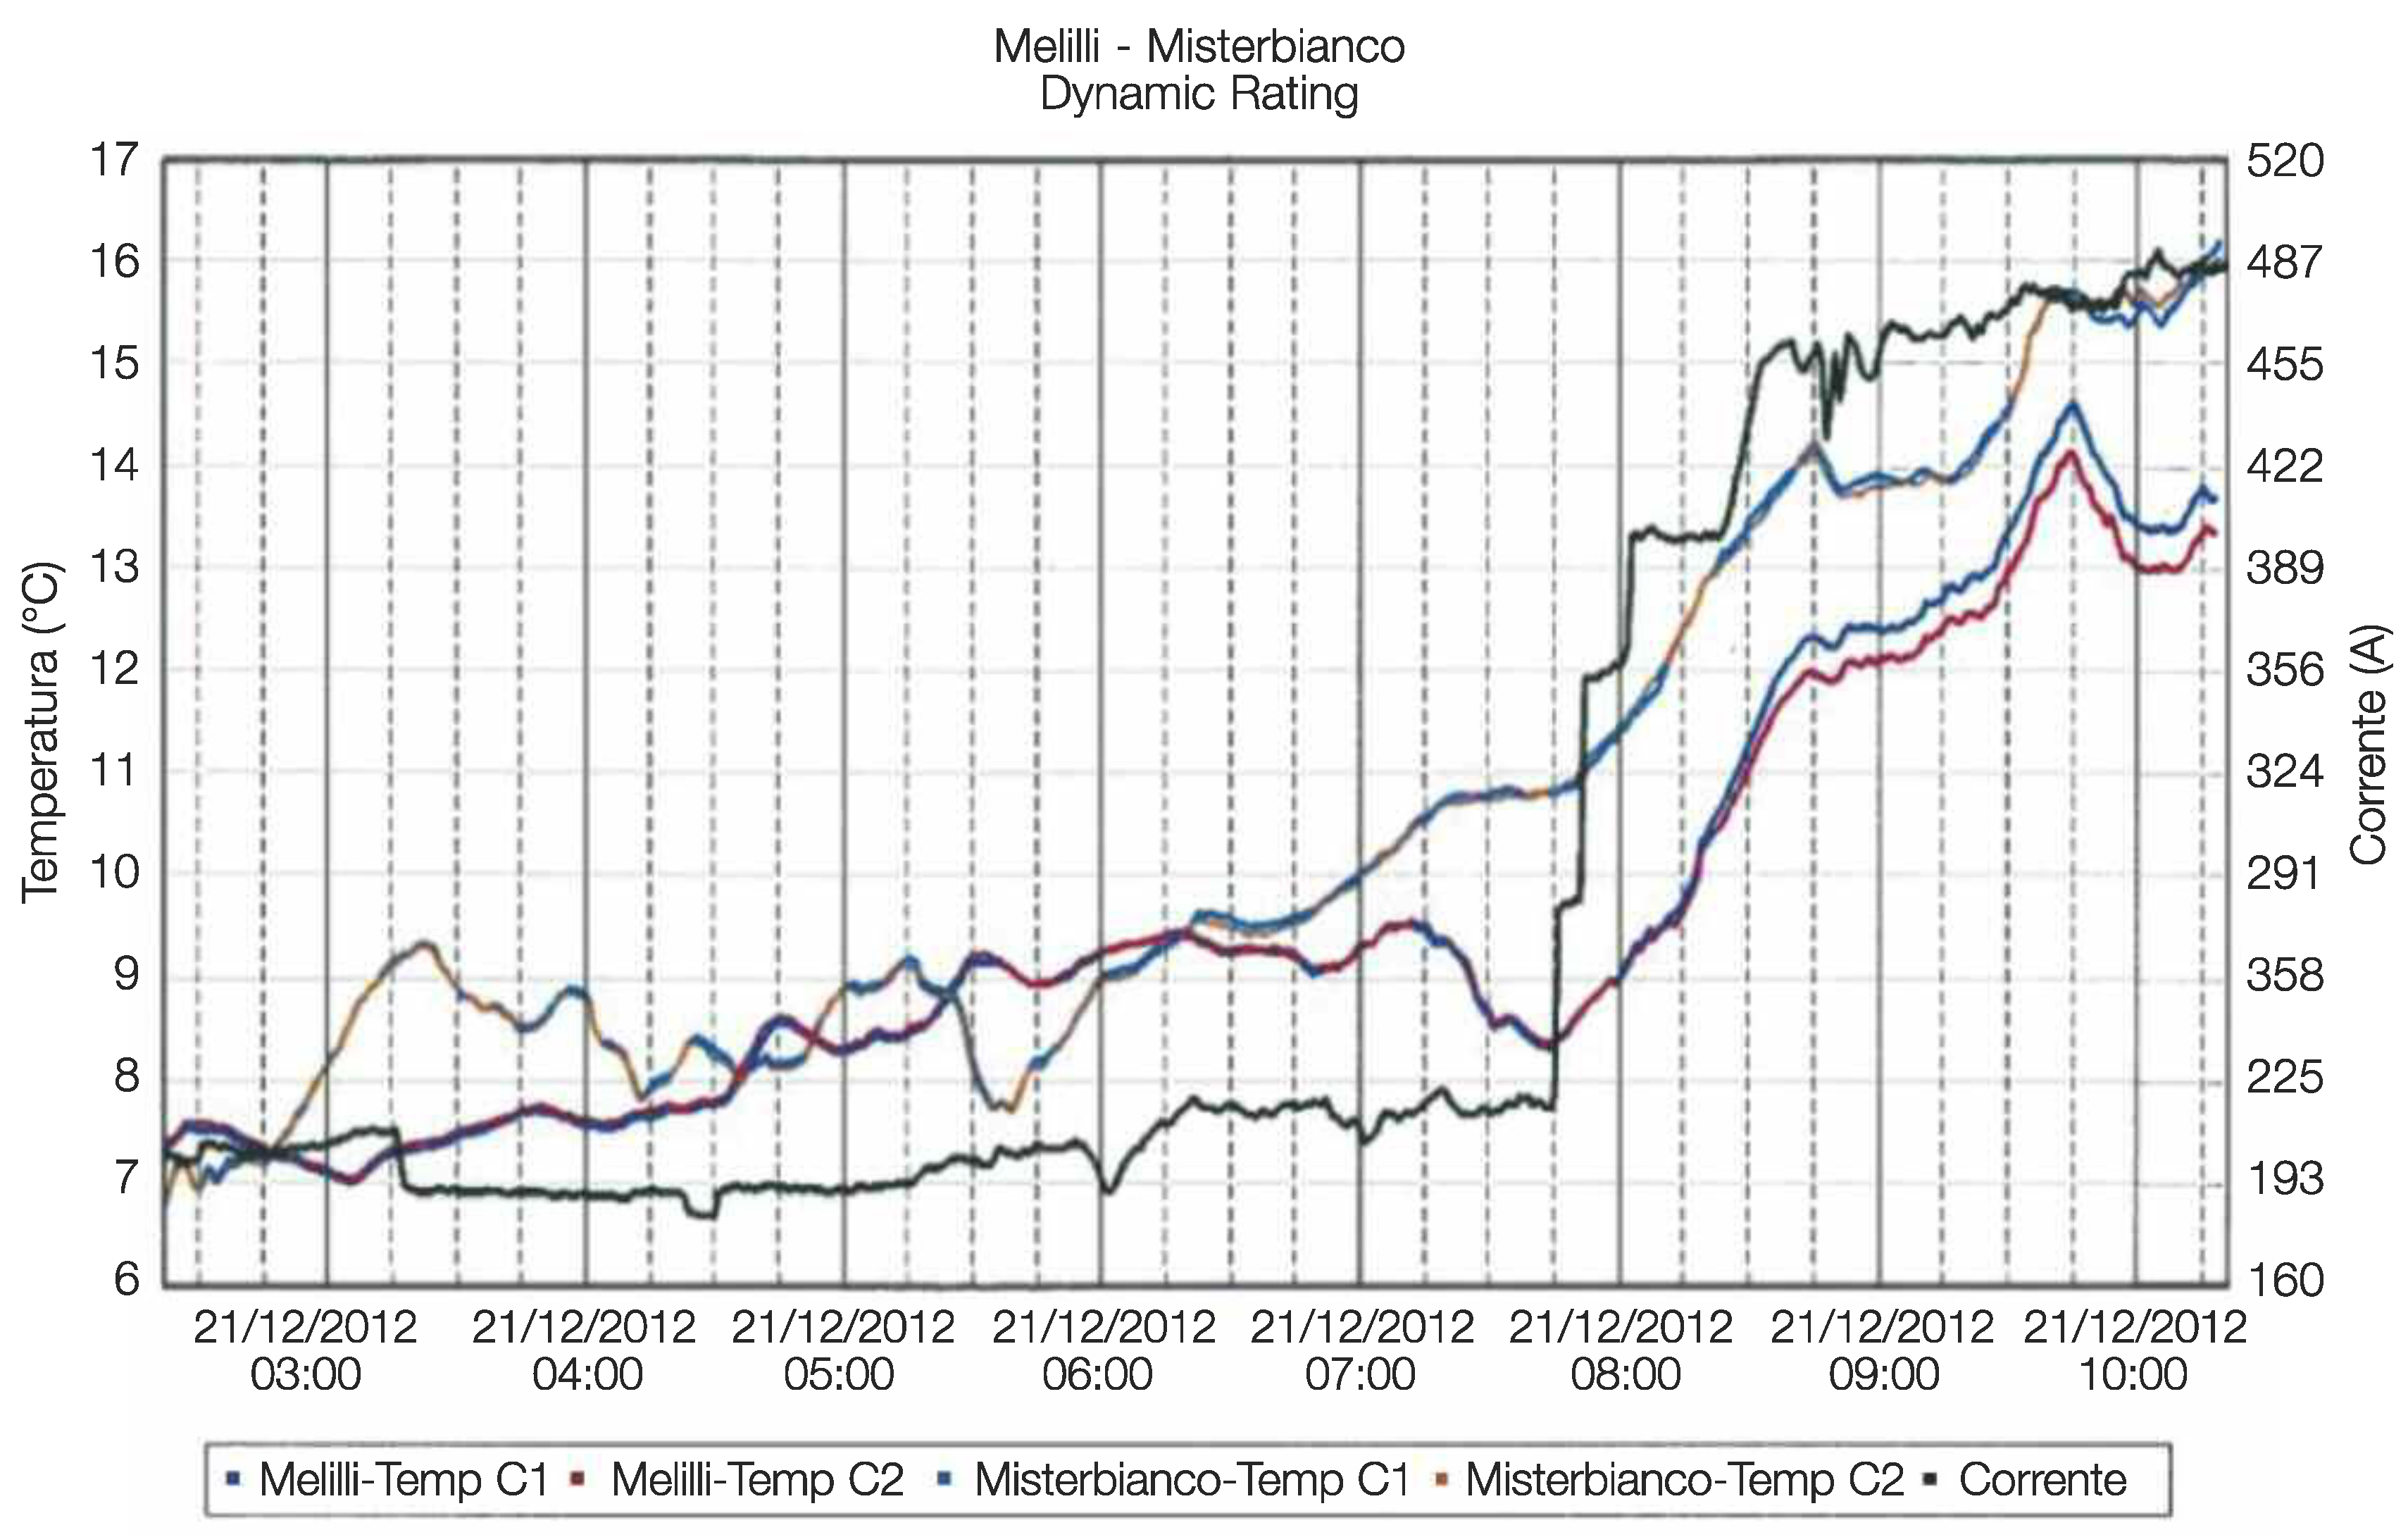
In fact, when the environmental conditions are favorable for the conductors (winter season), even if the current value exceeds the static rating assigned to the power line, the temperatures actually reached by the conductor are acceptable to ensure the safety of the system, obviously avoiding annealing phenomena of the materials constituting the line (with particular reference to the aluminum mantle). Figure 10 shows an explanatory example [17,18,19,20,21,22,23,24,25]. On a day of December high current values were recorded on the conductor (about 500 A), but the conductor temperature, measured by the two power donuts, was approximately equal to 16 °C, a value far from the annealing temperature of the mantle conductor aluminum.
The figure shows the trend of the current (black line), the variation of the conductor temperature near one of the ending stations (blue and red) and the conductor temperature near the other ending station (blue and orange lines). Having simulated, through a load-flow software, the out of service of the aforementioned 400 kV connection, the current value on the line D would be 914 A. This current value is certainly higher than the winter static rating of the link that it is set at 837 A (H1), a value very close to the limit in emergency conditions equal to 930 A. The low temperature of the conductor detected in this operating condition (16 °C), allows to state that the conductor temperature would remain below the allowed thermal limit even under N-1 operating condition. Therefore the line, considered to be overloaded according to the logic of the static rating, in the case of a dynamic rating would not require the system operator to make a costly re-dispatch of the power flows.
6. Conclusions
In Italy, in recent years, electric system operators (TSO and DSO) have been investing in new technologies in order to optimize the existing energy corridors. These investments include the replacement of traditional conductors with heat-resistant conductors (HTLS), the Dynamic Thermal Rating systems and the georeferencing of the electrical system through the use of GIS-LIDAR.
These solutions represent an important evolution of the high voltage network towards an intelligent system. The possibility to continuously check some fundamental parameters of the system, such as the temperature and the tension of the conductors, allows a more flexible operation of the rating of the overhead power lines.
The DTR systems are installed for various reasons: to favor the integration of renewable sources (especially wind and hydroelectric power), to guarantee the N-1 safety of the system, etc., without the need to re-dispatch and therefore containing the operational costs.
The application of LIDAR technology together with the GIS systems allows to make some important evaluations on the power lines. The cartographic georeferencing of the overhead lines allows the evaluation of any interference, so that it is possible to calculate the maximum allowable temperature for the conductor to respect the constraints imposed by the legislator.
Table 3 summarizes the results obtained for L-GIS application in the three lines under investigation.
Here Tx represents the maximum allowable temperature for the conductor, and 1, 2, 3, indicate the calculation methods used for the determination of the maximum permissible currents in different seasons (winter and summer):
- 1:
- Schurig and Frick Method;
- 2:
- Method provided by the Standard CEI 11-60;
- 3:
- Method provided by the Standard CEI 11-60 increased.
The values obtained are higher than those proposed by the CEI 11-60 standard, potentially providing the possibility for the Transmission system operator to make better use of the power lines. It is important to know the possibility of a greater exploitation of power lines, always respecting the constraints imposed by the legislator, to meet the difficulty in the construction of new power lines due to stringent environmental constraints. These margins on transmissible powers also allow a much more elastic operation of the electricity system with particular reference to the dispatchability of generation from renewable energy sources (RES), which is often limited due to problems related to local congestion.
The use of DTR systems shows how it is possible to operate energy flows in unfavorable congestion situations of some electrical connections as the temperature of the conductors remains below the limits imposed, so these systems are important tools for the control room operator as they allow to better operate the energy flows in the electricity grid. The low cost/benefit ratio of these devices has led the Italian TSO to invest significantly on some critical power lines in order to reduce congestion, increase the reliability and safety of the electricity system and make the grid smarter.
First results from the use of DTR systems in an important 220 kV connection has been presented: in the example reported, the line D, considered to be overloaded according to the logic of the static rating, in the case of a dynamic rating would not require the system operator to make a costly re-dispatch of the power flows. These applications demonstrate how the Sicilian (zonal) electricity market would also improve.
Terna, in recent years, is trying to optimize the existing transmission power lines through the use of heat-resistant and low-sag conductors (HTLS). The authors, at the moment, are engaged in the study and analysis of some applications carried out by Terna on some high-voltage lines of strategic importance. The first results will be available in the coming months and a scientific contribution will be presented.
Author Contributions
Mariano Giuseppe Ippolito, Fabio Massaro and Gaetano Zizzo proposed the core idea, analyzed the results, and wrote the document, Giovanni Filippone and Andrea Puccio give the contribution of data and information from the Italian TSO.
Conflicts of Interest
The authors declare no conflict of interest.
References
- Favuzza, S.; Graditi, G.; Ippolito, M.G.; Massaro, F.; Musca, R.; Sanseverino, E.R.; Zizzo, G. Transition of a distribution system towards an active network. Part I: Preliminary design and scenario perspectives. In Proceedings of the International Conference on Clean Electrical Power (ICCEP’11), Ischia, Italy, 14–16 June 2011; pp. 9–14. [Google Scholar]
- Cosentino, V.; Favuzza, S.; Graditi, G.; Ippolito, M.G.; Massaro, F.; Sanseverino, E.R.; Zizzo, G. Transition of a distribution system towards an active network. Part II: Economical analysis of selected scenario. In Proceedings of the International Conference on Clean Electrical Power (ICCEP’11), Ischia, Italy, 14–16 June 2011; pp. 15–20. [Google Scholar]
- Cosentino, V.; Favuzza, S.; Graditi, G.; Ippolito, M.G.; Massaro, F.; Sanseverino, E.R.; Zizzo, G. Smart renewable generation for an islanded system. Technical and economic issues of future scenarios. Energy 2012, 39, 196–204. [Google Scholar] [CrossRef]
- Filippone, G.; Ippolito, M.G.; Massaro, F.; Puccio, A. On the roadmap to Supergrid in Sicily: LIDAR technology and HTLS conductors for uprating the 150 kV lines. In Proceedings of the 2014 IEEE PES Innovative Smart Grid Technologies Conference Europe (ISGT-Europe 2014), Istanbul, Turkey, 12–15 October 2014; pp. 1–5. [Google Scholar] [CrossRef]
- Massaro, F. Conductors for the uprating of overhead lines. Electra 2004, 213, 30–39. [Google Scholar]
- Monteiro, C.; Ramirez-Rosado, I.J.; Miranda, V.; Zorzano-Santamaria, P.J.; Garcia-Garrido, E.; Fernandez-Jimenez, L.A. GIS spatial analysis applied to electric line routing optimization. IEEE Trans. Power Deliv. 2005, 20, 934–942. [Google Scholar] [CrossRef]
- El Houssaini, S.; Badri, A. A web-based spatial decision support system for effective monitoring and routing problem. In Proceedings of the 2012 International Conference on Multimedia Computing and Systems (ICMCS), Tangier, Morocco, 10–12 May 2012; pp. 669–674. [Google Scholar]
- Carlini, E.M.; Favuzza, S.; Giangreco, S.E.; Massaro, F.; Quaciari, C. Uprating an Overhead Line. In Proceedings of the Italian TSO Applications for Integration of RES (ICCEP 2013), Alghero, Italy, 11–13 June 2013; ISBN 978-1-4673-4430-2. [Google Scholar]
- Jewell, W.; Grossardt, T.; Bailey, K.; Gill, R.S. A New Method for Public Involvement in Electric Transmission-Line Routing. IEEE Trans. Power Deliv. 2009, 24, 2240–2247. [Google Scholar] [CrossRef]
- Luo, F.; Wei, W.; Wang, C.; Huang, J.; Yin, Q.; Bai, Y. Research and application of GIS-based medium-voltage distribution network comprehensive technical evaluation system. Int. Trans. Electr. Energy Syst. 2015, 25, 2674–2684. [Google Scholar] [CrossRef]
- Sugihara, H.; Funaki, T.; Yamaguchi, N. Evaluation Method for Real-Time Dynamic Line Ratings Based on Line Current Variation Model for Representing Forecast Error of Intermittent Renewable Generation. Energies 2017, 10, 503. [Google Scholar] [CrossRef]
- Esfahani, M.M.; Yousefi, G.R. Real Time Congestion Management in Power Systems Considering Quasi-Dynamic Thermal Rating and Congestion Clearing Time. IEEE Trans. Ind. Inform. 2016, 12, 745–754. [Google Scholar] [CrossRef]
- Douglass, D.; Chisholm, W.; Davidson, G.; Grant, I.; Lindsey, K.; Lancaster, M.; Lawry, D.; McCarthy, T.; Nascimento, C.; Pasha, M.; et al. Real-Time Overhead Transmission-Line Monitoring for Dynamic Rating. IEEE Trans. Power Deliv. 2016, 31, 921–927. [Google Scholar] [CrossRef]
- Dawson, L.; Knight, A.M. Applicability of Dynamic Thermal Line Rating for Long Lines. IEEE Trans. Power Deliv. 2018, 33, 719–727. [Google Scholar] [CrossRef]
- Schurig, O.R.; Frick, C.W. Heating and Current-Carrying Capacity of Bare Conductors for Outdoor Service. Gen. Electr. Rev. 1930, 33, 141–157. [Google Scholar]
- Carlini, E.M.; Massaro, F.; Quaciari, C. Methodologies to uprate an overhead line. Italian TSO case study. J. Electr. Syst. 2013, 9, 422–439. [Google Scholar]
- Carlini, E.M.; Favuzza, S.; Massaro, F.; Quaciari, C. Dynamic thermal rating degli elettrodotti in Alta Tensione. Un caso studio nella rete siciliana. L’energia Elettr. 2013, 90, 53–60. [Google Scholar]
- IEEE Power Engineering Society. IEEE Standard for Calculating the Current-Temperature of Bare Overhead Conductors; IEEE Power Engineering Society: New York, NY, USA, 2012; pp. 1–59. [Google Scholar]
- USIPOWER DonutTM. Power Donut3TM System for Overhead Transmission Line Monitoring. Available online: http://www.usi-power.com/power-donut-line-monitor/ (accessed on 24 January 2018).
- Cavalli, M.; Tarolli, P. Application of LiDAR technology for rivers analysis. Ital. J. Eng. Geol. Environ. 2010, 11, 5–8. [Google Scholar]
- Filippone, G.; Ippolito, M.G.; Massaro, F.; Puccio, A. I Sistemi GIS e la tecnologia LIDAR nella gestione degli elettrodotti AT. Applicazioni nella rete elettrica siciliana. L’energia Elettr. 2013, 90, 53–59. [Google Scholar]
- Filippone, G.; Ippolito, M.G.; Massaro, F.; Puccio, A. GIS Systems and LIDAR technology for the operation of HV lines. Sicilian Transmission network applications. In Proceedings of the 2nd International Conference on Renewable Energy Research and Applications (ICRERA 2013), Madrid, Spain, 20–23 October 2013. [Google Scholar]
- Italiano, C.E. CEI 11–4—Technical Standards for the Erection of Overhead Power Lines Outside; CEI: Milan, Italy, 2011. [Google Scholar]
- Italiano, C.E. CEI 11-60—Carrying Capacity at Thermic Limit of Overhead Lines Exceeding 100 kV; CEI: Milan, Italy, 2002. [Google Scholar]
- Carlini, E.M.; Favuzza, S.; Giangreco, S.E.; Massaro, F.; Quaciari, C. Uprating an Overhead Line. Italian TSO Applications to Increase System N-1 Security. In Proceedings of the 2nd International Conference on Renewable Energy Research and Applications (ICRERA 2013), Madrid, Spain, 20–23 October 2013. [Google Scholar]
Figure 1.
Rating capability.

Figure 2.
Heat balance for an overhead line.

Figure 3.
Line equivalent scheme.

Figure 4.
Power Donut.

Figure 5.
GIS system.

Figure 6.
How LIDAR works.

Figure 7.
Example of 3D representation of the line.

Figure 8.
Example of thermovision image.

Figure 9.
Example of drone detection of OHL (OverHead Line).

Figure 10.
Current vs conductor temperature on line D.


Table 1.
Climatic characteristic of line A.
| Condition | Winter | Summer |
|---|---|---|
| Ambient temperature [°C] | 20 | 33 |
| Conductor temperature [°C] | 55 | 55 |
| Wind speed [km/h] | 6 | 6 |
| Coefficient of solar radiation [W/m] | 1029.49 | 1029.49 |
| Coefficient ε emissivity of the conductor | 0.5 | 0.5 |
| Sky conditions | Clean | Clean |
| Irradiation | Yes | Yes |
Table 2.
Climatic characteristic of line B.
| Condition | Winter | Summer |
|---|---|---|
| Ambient temperature [°C] | 19 | 30 |
| Conductor temperature [°C] | 76 | 76 |
| Wind speed [km/h] | 9 | 8 |
| Coefficient of solar radiation [W/m] | 1029.49 | 1029.49 |
| Coefficient ε emissivity of the conductor | 0.5 | 0.5 |
| Sky conditions | Clean | Clean |
| Irradiation | Yes | Yes |
Table 3.
Summary of the results (L-GIS).
| Ampacity [A] | |||||||
|---|---|---|---|---|---|---|---|
| WINTER | SUMMER | ||||||
| TX [°C] | 1 | 2 | 3 | 1 | 2 | 3 | |
| Line A | 55 | 695 | 568 | 739 | 520 | 405 | 526 |
| Line B | 76 | 1498 | 869 | 1130 | 1294 | 619 | 805 |
| Line C | 80 | 1546 | 869 | 1130 | 1349 | 619 | 805 |
© 2018 by the authors. Licensee MDPI, Basel, Switzerland. This article is an open access article distributed under the terms and conditions of the Creative Commons Attribution (CC BY) license (http://creativecommons.org/licenses/by/4.0/).
Share and Cite
MDPI and ACS Style
Massaro, F.; Ippolito, M.G.; Zizzo, G.; Filippone, G.; Puccio, A. Methodologies for the Exploitation of Existing Energy Corridors. GIS Analysis and DTR Applications. Energies 2018, 11, 979. https://doi.org/10.3390/en11040979
AMA Style
Massaro F, Ippolito MG, Zizzo G, Filippone G, Puccio A. Methodologies for the Exploitation of Existing Energy Corridors. GIS Analysis and DTR Applications. Energies. 2018; 11(4):979. https://doi.org/10.3390/en11040979
Chicago/Turabian StyleMassaro, Fabio, Mariano Giuseppe Ippolito, Gaetano Zizzo, Giovanni Filippone, and Andrea Puccio. 2018. "Methodologies for the Exploitation of Existing Energy Corridors. GIS Analysis and DTR Applications" Energies 11, no. 4: 979. https://doi.org/10.3390/en11040979
Note that from the first issue of 2016, this journal uses article numbers instead of page numbers. See further details here.