Energy Management for Smart Multi-Energy Complementary Micro-Grid in the Presence of Demand Response


School of Economics and Management, North China Electric Power University, Changping District, Beijing 102206, China
*
Author to whom correspondence should be addressed.
Energies 2018, 11(4), 974; https://doi.org/10.3390/en11040974
Submission received: 25 March 2018
/
Revised: 1 April 2018
/
Accepted: 11 April 2018
/
Published: 18 April 2018
(This article belongs to the Special Issue Power Electronics in Renewable Energy Systems)
Abstract
:With the application and the rapid advancement of smart grid technology, the practical application and operation status of multi-energy complementary microgrids have been widely investigated. In the paper presented, the optimal operation of a solar unit, a storage battery and combined cooling, heating and power is studied via an economic optimization model implemented in General Algebraic Modeling Systems (GAMS). The model represents an optimization strategy for the economic operation of a microgrid considering demand response programs in different scenarios, and it is intended for the targets of minimizing the operating cost of the microgrid and maximizing the efficiency of renewable energy utilization. In addition, a multi-time electricity price response model based on user behavior and satisfaction is established, and the core value of the model is to describe the mechanism and effect of participation in electricity price demand response. In order to verify the accuracy of the model proposed, we design the dispatch strategy of a microgrid under different states considering demand response, and use genetic algorithm to solve the optimization problems. On the other hand, the application of methodology to a real case study in Suzhou demonstrates the effectiveness of this model to solve the economic dispatch of the microgrid’s renewable energy park.
1. Introduction
Energy is the basis of human existence and development. Human beings are facing increasingly serious energy shortage and environmental damage, and the development of clean energy is an inevitable trend of social progress. At present, most of the renewable energy is generated by distributed generation (DG), with the widespread application of distributed generation technology, the grid-connected generation of distributed generation and other issues are gradually prominent. As microgrid technology provides a new technical approach for the large-scale application of renewable energy grid-connected power generation, the optimal operation of a microgrid with demand response (DR) has attracted more and more attention [1].
In recent years, many institutions have studied the microgrid, these studies include the access and control technology of distributed power supply, energy efficiency management and economic optimization operation of microgrid and so on. Guo et al. built a model to supply electricity for residents living in the remote and less developed areas, which includes a power grid extension mode and a microgrid mode [2]. Niu et al. proposed a multi-objective optimal energy management framework for the integrated electrical and natural gas network (IEGN) with combined cooling, heat, and power (CCHP) plants [3]. Hossain E et al. introduce the concept and progress of microgrid technology, and used a storage-based load side compensation technique to enhance stability of microgrids [4,5]. Emmanuel et al. identified various ways national green computing campaigns can be carried out in Africa’s sociocultural context, and applied a metaheuristic algorithm to the stochastic optimization problem to search for the best-known green computing awareness creation solution [6]. Zhang et al. proposed the composition, tasks and flow of the energy efficiency management system, and described the mathematical modeling method of economic dispatch and optimal operation [7]. Zhao et al. introduced the general structure of a home network energy management system based on smart grid, and proposes an effective home power dispatching method [8]. Jin et al. establishes a multi-objective optimization with principal constraints through a large-scale MG model with flexible loading, which leads to the derivation of a strategy containing uncertainty, and takes a real project to evaluate the uncertainty and demand response potential [9]. Brearley et al. attempt to reexamine the basic concepts of a microgrid and to study the issues and various protection strategies a microgrid faces in protecting the environment [10]. Meghwani et al. presented a noncell protection scheme that uses a locally measured DC microgrid (DCMG) and discusses a threshold calculation method for protection schemes, and it is validated on ring DCMG architectures with different conditions [11].
The optimal dispatching model for a stand-alone microgrid is of great importance to its operation reliability and economy. Wang et al. aimed at addressing the difficulties in improving the operational economy and maintaining the power balance under uncertain load demand and renewable generation, and propose a new two-time scale multi-objective optimization model to optimize the operational cost of the microgrid based on an efficient microgrid energy market [12]. Okoye C O et al. have carried on the thorough research in the microgrid modeling aspect, and established the operation model of microgrid, which has been widely used [13,14,15]. Saffari M et al. focus on the study of microgrid operation optimization strategy, established the operation optimization model and different constraints; their research results have a significant role in promoting the research in this field [16,17].
The development of smart grid provides powerful technical support for demand response, it is an important technical means of demand side management (DSM). Under the demand response mechanism, users can respond to the price or incentive signal, and change the normal power consumption mode to optimize power consumption and Increase the efficiency of the use of system resources. As studied by Xiao L et al., an improved method of wind energy utilization based on demand response is proposed, and an opportunity constraint decision model of wind power utilization is established to obtain the optimal solution of demand response resource scheduling [18,19]. The results show that demand response can promote photovoltaic power generation (PV) consumption and realize the economic operation of microgrid. Yu et al. propose a two-stage, robust optimization-based model for coordinated investment of DG and DRF, aiming at accommodating the uncertainties of renewables and load demand [20]. Pan et al. propose an electric vehicle (EV) operation strategy based on electricity price incentive policy and establishes the economic dispatch model to realize stable operation of EV when joining in the power grid [21]. Li Yuan et al. present a method of setting gear based on demand response time-sharing ladder price, and obtains the optimal gear of right price to analyze the response effect and energy-saving benefit [22]. Fan et al. propose an optimized operation model for the microgrid on the user side, which includes the zoning strategy of real-time electricity price and the control strategy of controllable load, and the results show that the feasibility and effectiveness of the optimization model to provide theoretical support for low-cost operation on the user side [23]. Gao et al. analysis the benefits, drivers, and barriers of DR, and the status of international DRS was discussed through a broad review of existing projects in different regions [24]. Lu Xiaonan et al. proposes an energy sharing model based on demand response price for the microgrids of PV manufacturers [25]. Abdelaziz et al. conduct a comprehensive assessment of DR barriers and “sociotechnical-economic” in the context of smart grid, and discusses the contributing factors and the complexity of the energy system as well as the features [26]. Besides, a model of residential energy system operation optimization based on price response is proposed, and a new load clustering method is adopted to disperse the response capacity of residential areas [27].
In summary, a demand response program is one of the key technologies in demand side management; it can promote the development of renewable energy power generation technology, and it is also conducive to the economic operation of a microgrid. In the process of a microgrid operation, the operational cost and the better electricity services have always been important issues of concern to users, and electricity price policies and incentive policies also have received extensive attention. Therefore, a demand response program and grid operation characteristics need to be considered together in the process of microgrid operation optimization research. Compared with the existing research on demand response and microgrid operation optimization, the existing research has made some contributions in these two aspects, however, few articles combine these two aspects for operation optimization research, and existing articles have not studied the overall system operation and the system internal load response characteristics under the premise of considering the demand response mechanism and user response behavior. To fill this gap, this paper presents a multi-energy complementary operation model of a microgrid with PV, electric energy storage (EES) and CCHP considering the multi-period electricity price response strategy. In the work presented, a demand response mechanism of price is considered to establish the optimal operating model of a microgrid, the optimization model can achieve the goal of minimizing the operating cost of a microgrid, and the optimal coordination among various loads, renewable energy power generation, electric energy storage system and user comfort are considered in the modeling process. In addition, a microgrid demonstration project in Suzhou is used to verify the role of the coordinated optimization model in responding to grid scheduling and controlling user power costs in this paper.
In the result of this paper, firstly the structure and composition of a microgrid and a multi-period electricity price DR model are analyzed. Secondly, the modeling process of microgrid operation optimization is described in detail, and the operation strategy of a microgrid under different scenarios is introduced in Section 3. After these, simulation process and a result analysis of the model are described in Section 4. Lastly, Section 5 summarizes the important conclusions drawn in this study.
2. Smart Microgrid DR Model
Microgrid is a small regional power generation, which contains clean energy power, electric energy storage device, electronic device, load and automatic demand response system [28]. Microgrid system can realize self-control, protection and management, and it can run not only in the grid-connected operation grid, but also under the stand-alone operation. Microgrid is a concept of the traditional large power grid, which is a network composed of multiple distributed power sources and loads, and it is connected to the conventional power grid through static switches. With the development of intelligent power technology, the development of a microgrid can promote the large-scale access of DG and renewable energy, and realize high-reliability supply of various energy forms of load. In addition, it is an effective means to realize the popularization of smart grid, and lead the transition from traditional power grid to smart grid.
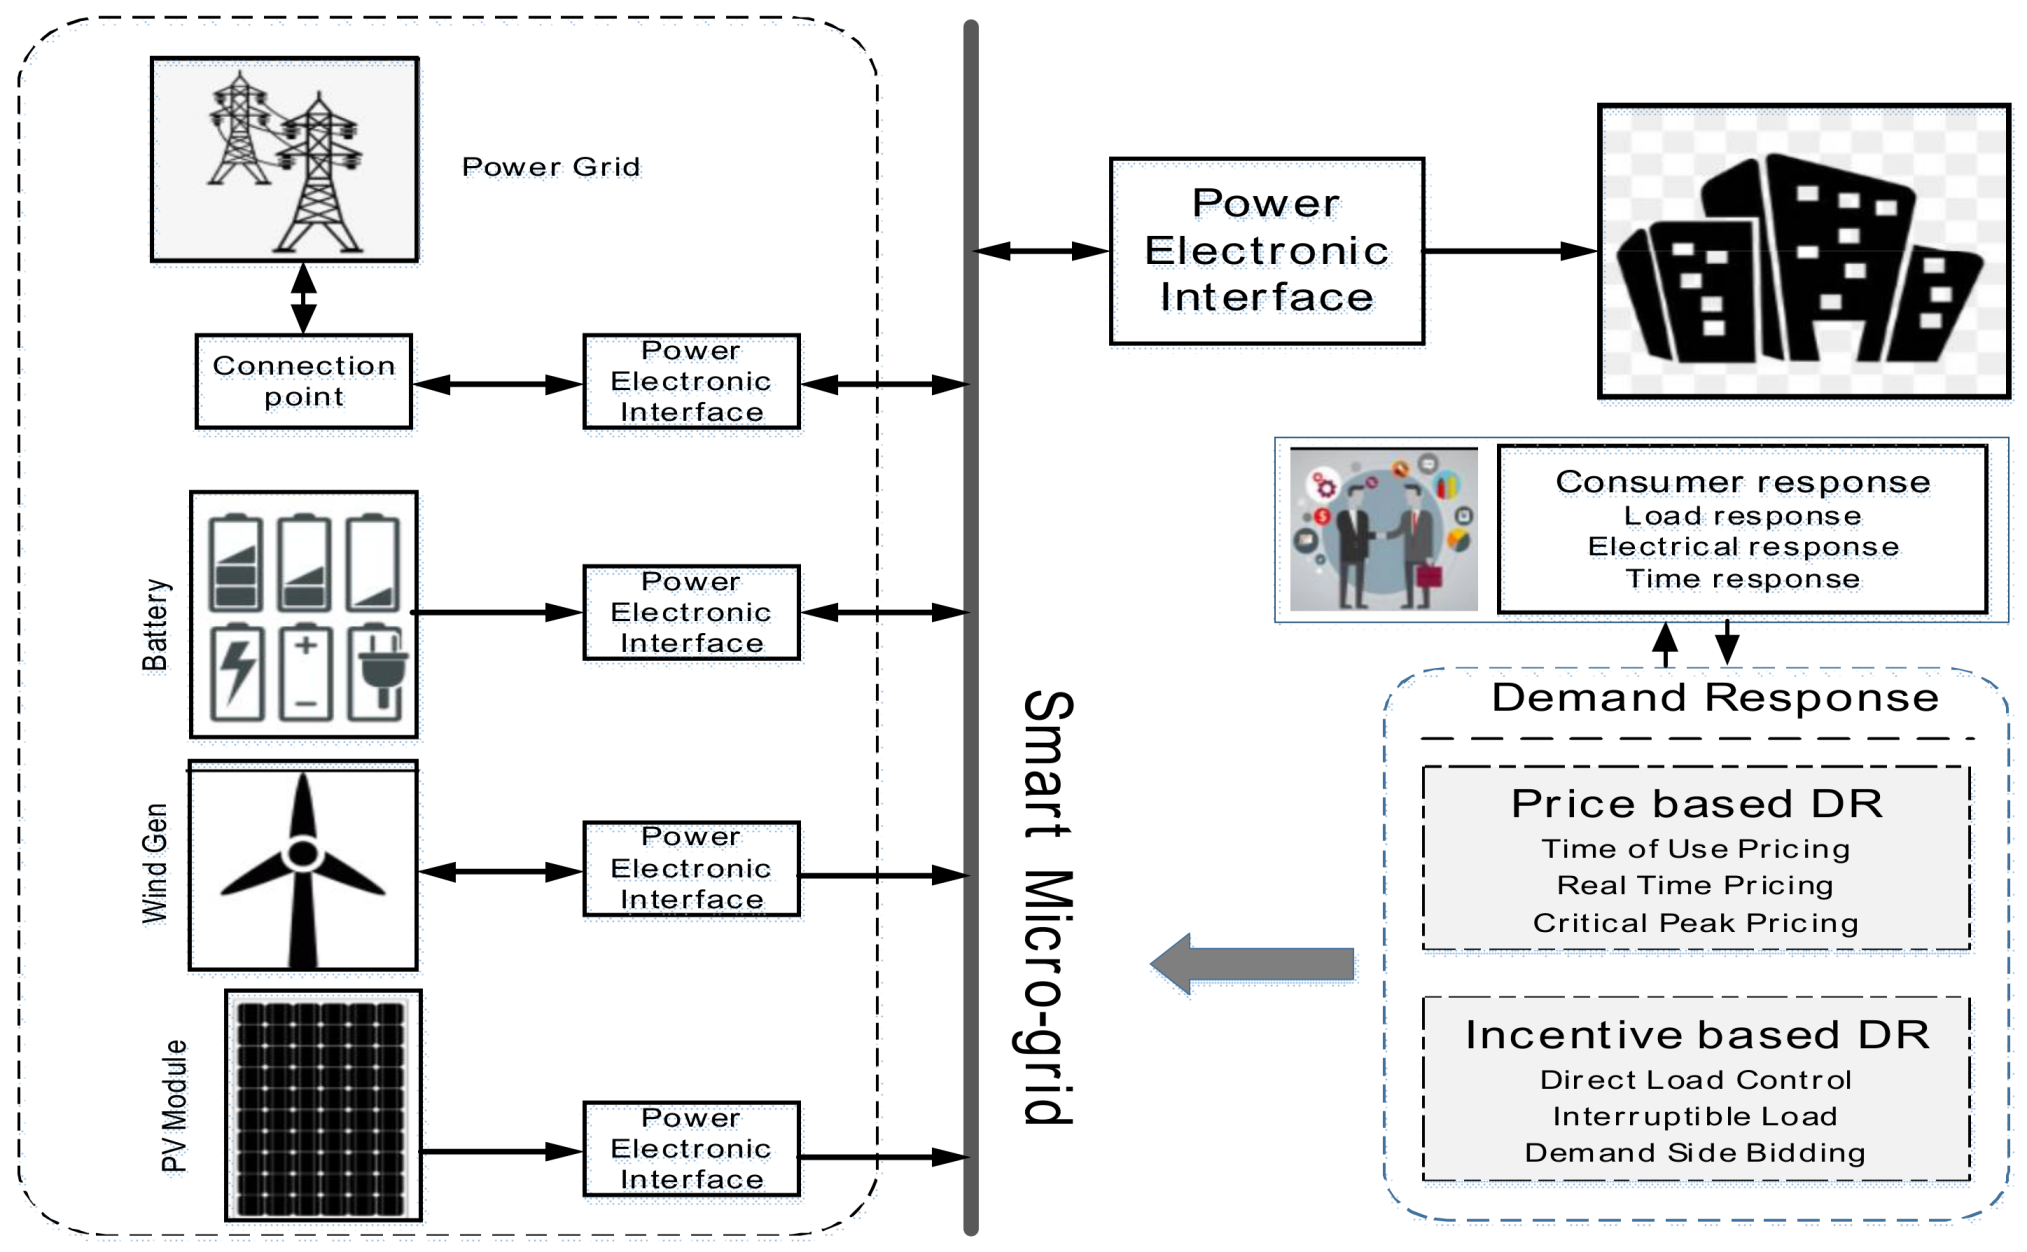
In this paper, a microgrid including distributed photovoltaic power generation (PV), combined cooling heating and power (CCHP) and electric energy storage (EES) is constructed. And the demand response mechanism is fully considered in the modeling process of the microgrid, which is embodied in Figure 1. In a microgrid system, power generation unit and user unit are two important modules, and the user’s demand directly determines the operating condition of microgrid system. When users receive the stimulation of information such as electricity price, policy and the like of the outside world, they can change the power consumption behavior reasonably. At the same time, the operating conditions of each power generation unit and energy storage in a microgrid will change accordingly, which will ultimately lead to the change of system operating costs.
As analyzed above, the implementation of time-of-use (TOU) price has become an effective demand response method in China. Through the response of DR prices, it can not only achieve peak load shifting, but also improve the benefits of a microgrid and the stability of the system [29]. Customers are one of the key elements in demand response. Response behavior and satisfaction of customers directly affect the implementation effect of demand response. Therefore, this paper establishes a demand response model based on multi-period electricity price, considering both response behavior and satisfaction of users.
2.1. Customer Response Behavior Model
In the price-based demand response mechanism, the price factor is sensitive to user behavior. Users respond to changes of prices by adjusting their own electricity consumption behavior, which is embodied in the reduction of electricity consumption. As a special commodity, the change of the price of electric energy will affect the purchase behavior of consumers. At the equilibrium point of the electric power market curve, the electric price k and the electric quantity E are approximately linearly related [30], and the expression is:
where are the coefficients of the relationship between electricity and electricity prices respectively.
Under the time-of-use price (TOU) of demand response, users respond to change of price by adjusting the electricity structure. Changes in electricity price not only affect the load of its own period, but also affect other periods of load, and it is a multi-period response [31]. This effect can be described by the elasticity of electricity price elasticity:
where is the elastic coefficient of the electricity price; are the amount of electricity and the amount of electricity; are electricity price and its variation. According to (2), the change value of the electric quantity after the users responds to the change of the electric price can be obtained. The equation is as follows:
The customer response behavior is the real embodiment of the demand response effect, which can be described comprehensively by establishing the electricity price demand balance relationship and the elasticity matrix of multi-period electricity price.
where is the elasticity coefficient matrix; are TOU price elastic coefficient of peak section, flat section and valley section; the rest is the coefficient of cross period.
By combining Equations (1)–(4), we can get a mathematical model of the response price. The demand response model based on electricity price established in this paper is as follows:
where is the amount of power before the Demand Responds; is the amount of power after the Demand Responds; are peak section, flat section, valley section of the demand response price and fixed price respectively, and .
2.2. Customer Satisfaction Model
Customer satisfaction is an important factor to measure the effect of demand response, and it is also a prerequisite for customers to participate in intelligent power program. In the demand response scheduling of a microgrid system, if the satisfaction of customers is not considered, the optimization result may have a bad effect on the attitude of the customers, and it is difficult to achieve the purpose of coordinating the power consumption of customers to achieve the purpose of economic operation of smart grid [32]. Therefore, this paper takes the electricity consumption mode and the change of the electricity expenditure as the evaluation index of customer satisfaction. At the same time, it is used as a constraint in the optimal scheduling model. Customer satisfaction modeling is shown below:
(1) Electricity Satisfaction
where is the sum of unsigned values of the amount of power change during the optimization period before and after optimization; is the total power consumption before optimization.
(2) Electricity expenditure satisfaction
where is the sum of the unsigned values of the amount of change in electricity cost before and after the optimization. is the total electricity cost before optimization.
3. Microgrid Operation Optimization Model
3.1. Objective Function Optimization
The operation cost of a microgrid is mainly composed of generation cost and environmental cost. The power generation cost is mainly the fuel cost and maintenance cost of the generator set. And the environmental cost mainly includes the emission cost and punishment cost of pollutants in the power generation process. During the operation of a microgrid, due to the stimulation of electricity price and other factors, the output of a nonclean power supply, such as CCHP, in the system will increase and the increase of output will bring electricity sales revenue to the system. At the same time, it will produce certain pollutant emissions. Considering the problems of economic operation and environmental protection, a multi-objective function is established this paper. The target of the objective function is to minimize the cost of power generation and achieve the goal of minimizing the environmental cost. On the basis of the above analysis, an optimization model for the operation of a microgrid is established in this section. The model is mainly oriented to commercial building microgrid with CCHP, PV and EES. In this study, the electrical load of the T period is predicted at each T-1 period, because the turbine engine response time is very fast than the steam turbine, the optimization period is set to 5 min, and the output of each unit for the next 5 min is adjusted during the T-1 period. The model mentioned can achieve the target of minimizing the cost of a microgrid system under the common constraints of operating conditions and environmental factors, and the objective function is as follows:
Objective function I:
where is the operation cost of microgrid system, yuan; is the power generation cost of the PV system, yuan/kW; is the price of natural gas in the system, yuan/m3; V is the volume of natural gas consumed, Nm3/h; is the operation cost of energy storage, yuan/kWh; is the purchase price, yuan/kWh; is the selling price of microgrid in scheduling time, determined by the tariff policy, yuan/kWh; is the energy exchange power, kW. If > 0, purchase power from the grid; If < 0, sell power to the grid.
Objective function II:
where is the environmental costs; is cost of per kilogram pollutant j, yuan/kg; is the emissions of pollutants, kg; is the emission tax on pollutants.
3.2. Constraints
3.2.1. PV Output Constraint
The output power of the photovoltaic power generation system is constrained by the safety of the system, and the PV power constraint ranges are as follows [13]:
where is the output power of PV system at time t, kW; and are the maximum and minimum values of PV power, kW.
3.2.2. CCHP Output Constraint
Safety and stability are important factors during the operation of CCHP system. In order to ensure that CCHP operates in a safe and stable environment, the output power must remain within the maximum output power, and the power constraints are as follows [14]:
where is the output power of CCHP at time t, kW; and are are the maximum and minimum values of CCHP, kW.
3.2.3. Power Balance
In the process of microgrid operation, power is the key factor of system operation. In a microgrid system, power demand mainly comes from the core load and electric equipment, and power supply mainly includes the DG and power. The energy supply and demand in that system should be balanced. The system power balance constraints are as follows [15].
where is the power of the adjustable load in the microgrid, kW; is the core load power in the system, kW; is the total load involved in demand response scheduling in the system, kW; is the load lost in the distribution network, kW; is the total load power value bought by the microgrid system from the grid, kW; is the power of EES at time t, kW.
3.2.4. EES Constraints
EES must ensure its safe and economic operation, and it also stores as much clean power as possible. During the operation of the energy storage system, the state of charge (SOC) and battery life are the key factors that affect the operation of the energy storage system [16].
where is maximum value of discharge power at time t, kW; is the maximum value of charging power at time t, kW; and are the upper and lower limits of the remaining capacity.
3.2.5. Power Purchase Cost Constraint
Energy cost is one of the important factors that different users must consider when participating in demand response program. Demand response encourages users to participate in load reduction and load transfer plan, under the premise of meeting the user comfort requirements. At the same time, it is necessary to ensure that the system can use distributed power generation as much as possible to reduce the operation cost of microgrid system [17].
where is the total power load of the system; is the time period corresponding to the fixed electricity price and the peak-to-valley electricity price; are peak section, flat section, valley section of the demand response price and fixed price respectively.
3.2.6. Customer Satisfaction Constraints
Customer satisfaction mainly includes two aspects: user satisfaction with electricity consumption and electricity expenditure after participating in the demand response.
where is the minimum value of satisfaction with electricity mode and the minimum value of satisfaction with electricity expenditure.
3.3. Model Solution Method and Operating Strategy
3.3.1. Operating Strategy
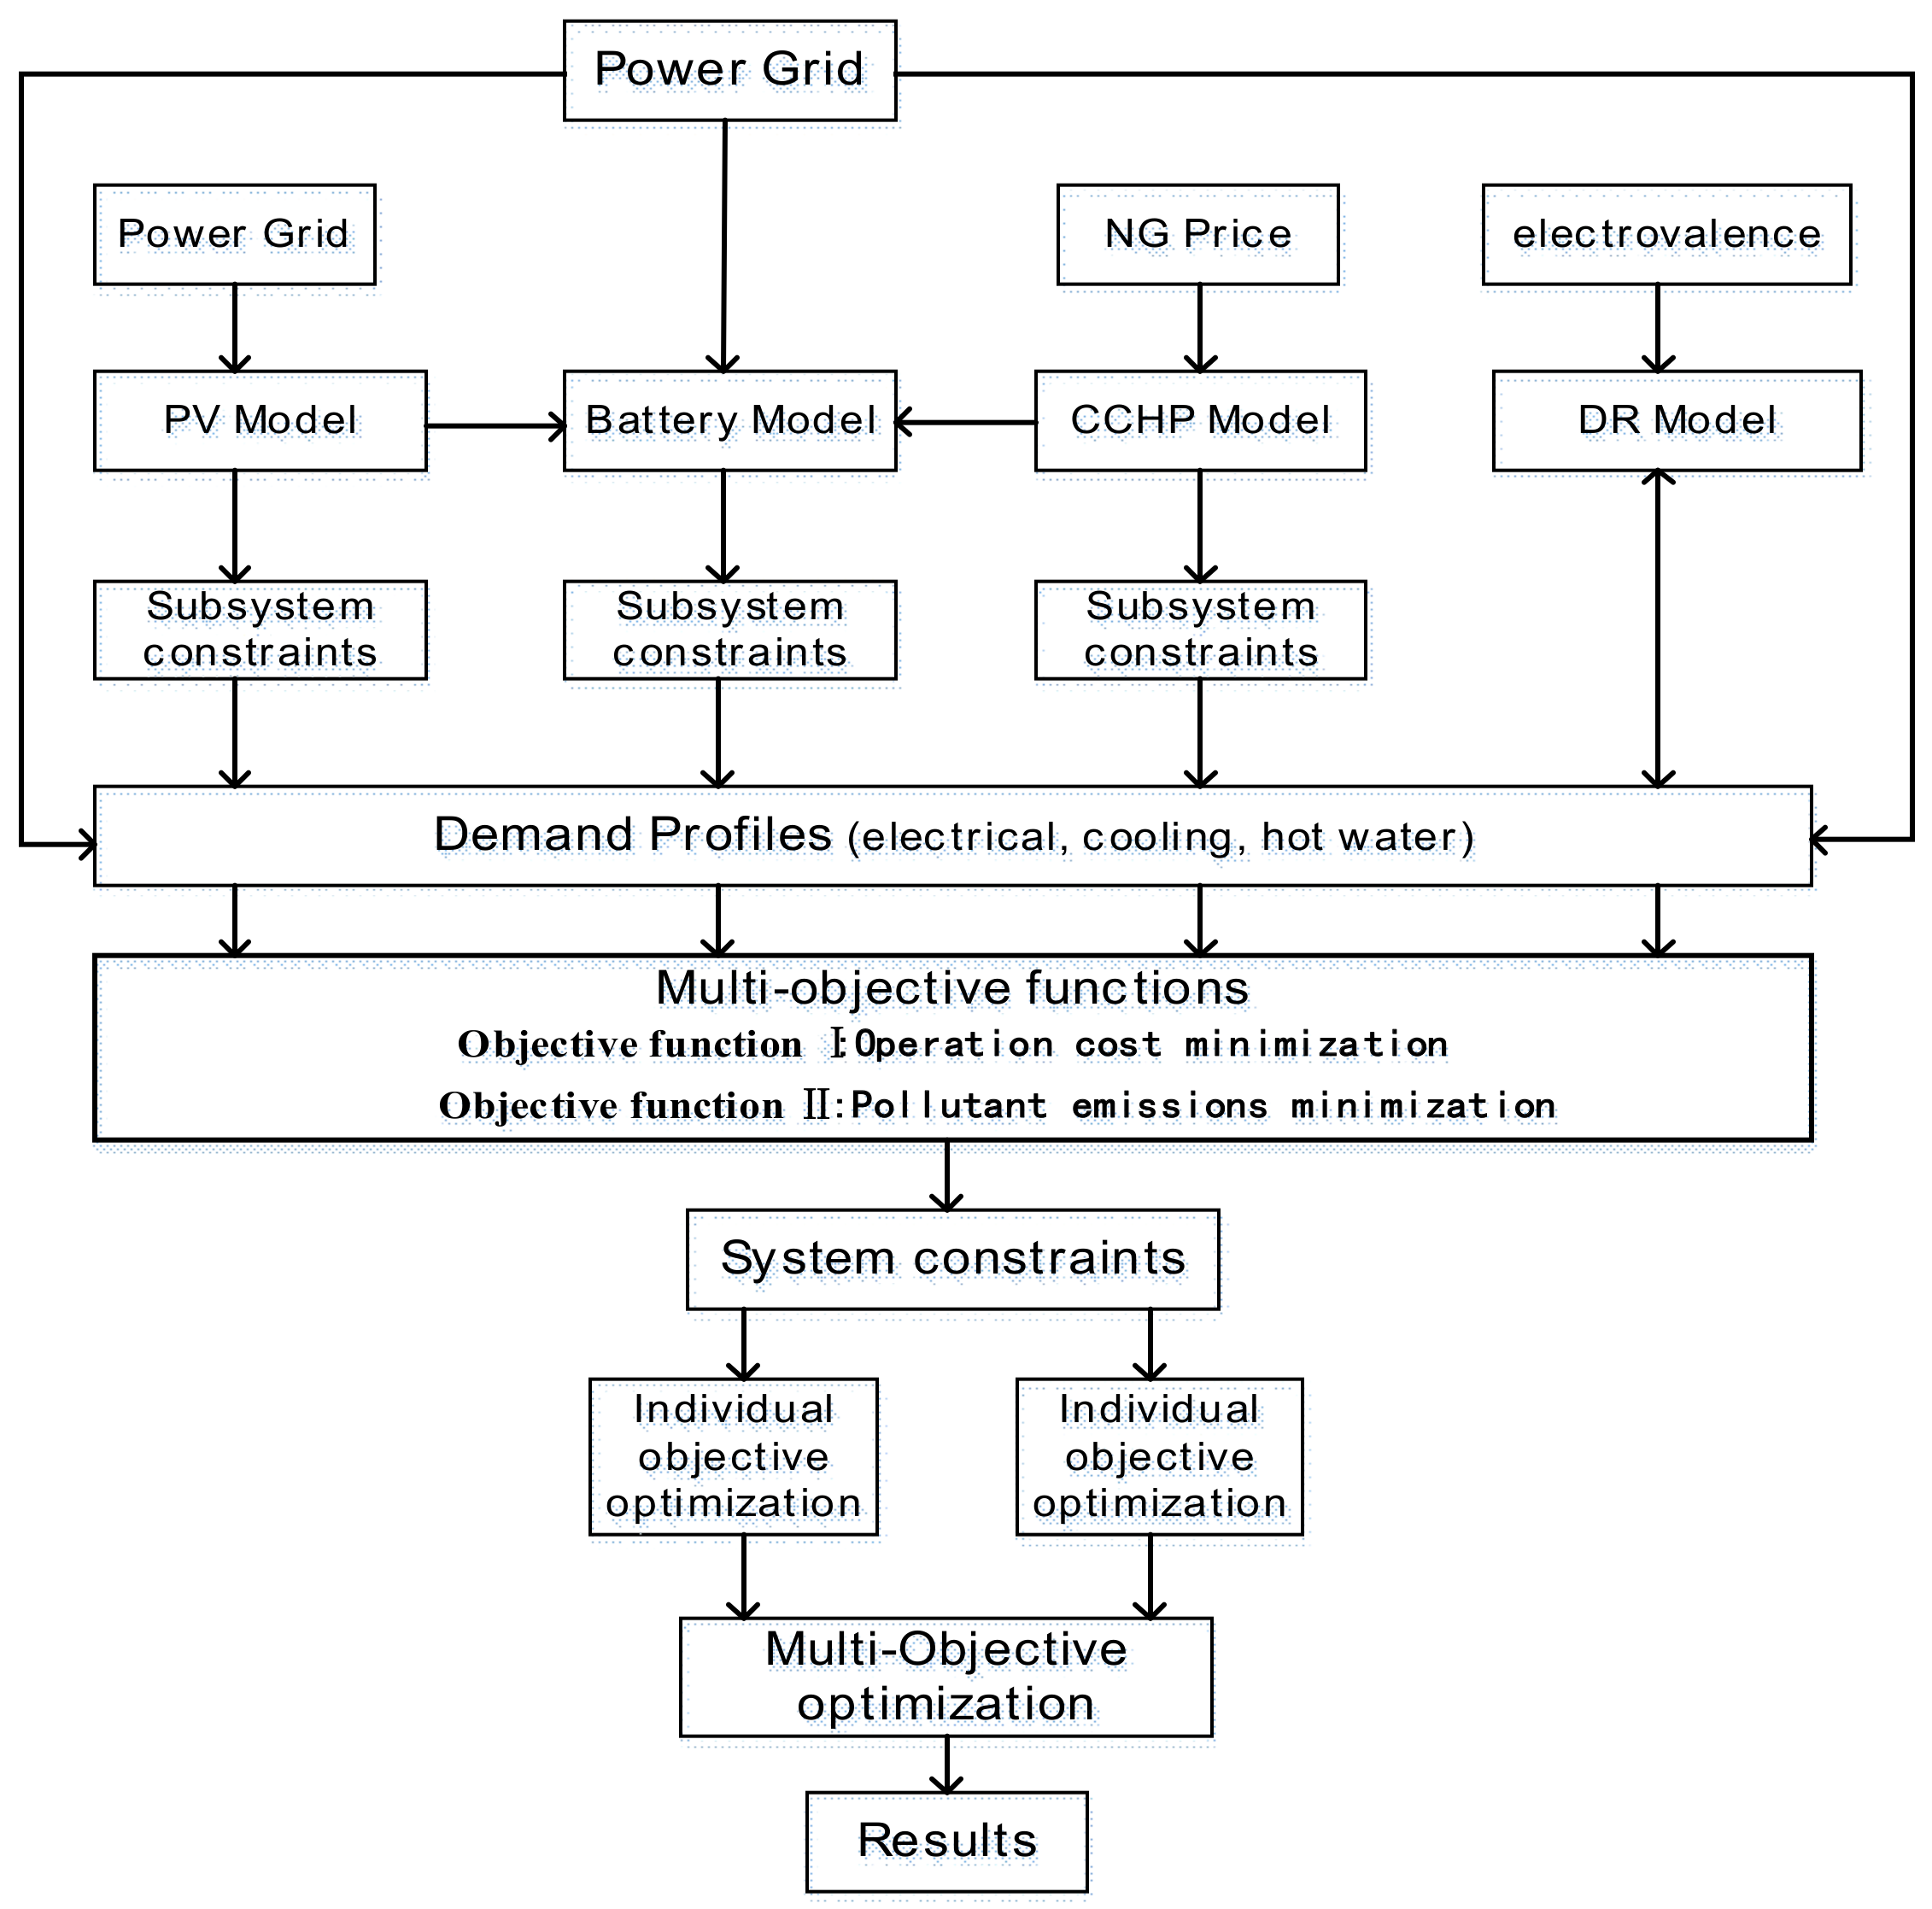
The power sources for the load are DG, grid power supply and energy storage. In order to achieve the purpose of cost savings, DG is taken as the first priority of power supply energy, followed by energy storage batteries, and the last is the power grid power supply. Based on the above three types of microgrid resources, this paper considers the demand response mechanism to coordinate and optimize the distributed, energy storage and response load. A flow chart of the proposed microgrid optimization model is shown in Figure 2.
The main considerations are the power cost of the microgrid (the amount of power supplied by the grid) and the charging and discharging capacity of the energy storage, and the management between the three energy sources is carried out according to the basic strategy as described below:
If DG and EES capacity is much smaller than the load demand of system, the system must purchase some power from the grid to achieve its energy balance. In this situation, the SOC of the energy storage system is considered by the dispatching center firstly. If the remaining power is less than the total load of the system, then the output state of distributed power supply should be included in the scope of scheduling. According to the operating state of the system and market conditions and other factors, the quantity and price of electricity purchased are determined, and the dispatching center issues dispatching instructions to each energy unit in the system.
Load state: The amount of electricity generated by DG and the amount of electricity in the Energy Storage is greater than the load demand.
Operating Strategy: The system first inputs excess power into the energy storage, then sell electricity to the grid.
If , DG and EES capacity is much larger than the total load, the system can Sell excess clean power to the grid or other microgrid systems. In view of the above situation, the operation state of energy storage system is first scheduled by the system. Then, the SOC of EES and the charging requirement are judged. Finally, the amount of power that the system sells to the grid is determined and dispatch instructions are issued to the system.
Load state: The amount of electricity generated by the DG and the amount of electricity in the Energy Storage are not enough to meet the load demand.
Operating Strategy: Consumers buy electricity from the grid.
3.3.2. Model Solution Method
In general, there is a mutual restriction between the objective functions in the multi-objective constraint problem. In the process of multi-objective optimization, the realization of one objective may have a bad effect on other objectives. Therefore, it is difficult to evaluate the advantages and disadvantages of the multi-objective problem solution. Compared with a general optimization problem, the solving method of multi-objective optimization problem is not unique, but exists in the optimal solution set composed of multiple solutions. The set mentioned above is called Pareto, and the element in the set are called Pareto optimal or noninferior optimal [33].
The multi-objective optimization questions can be described as follows:
where is the optimization variable; is the optimization target; is a collection of all possible solutions; and are the set of constraints of inequality and equality.
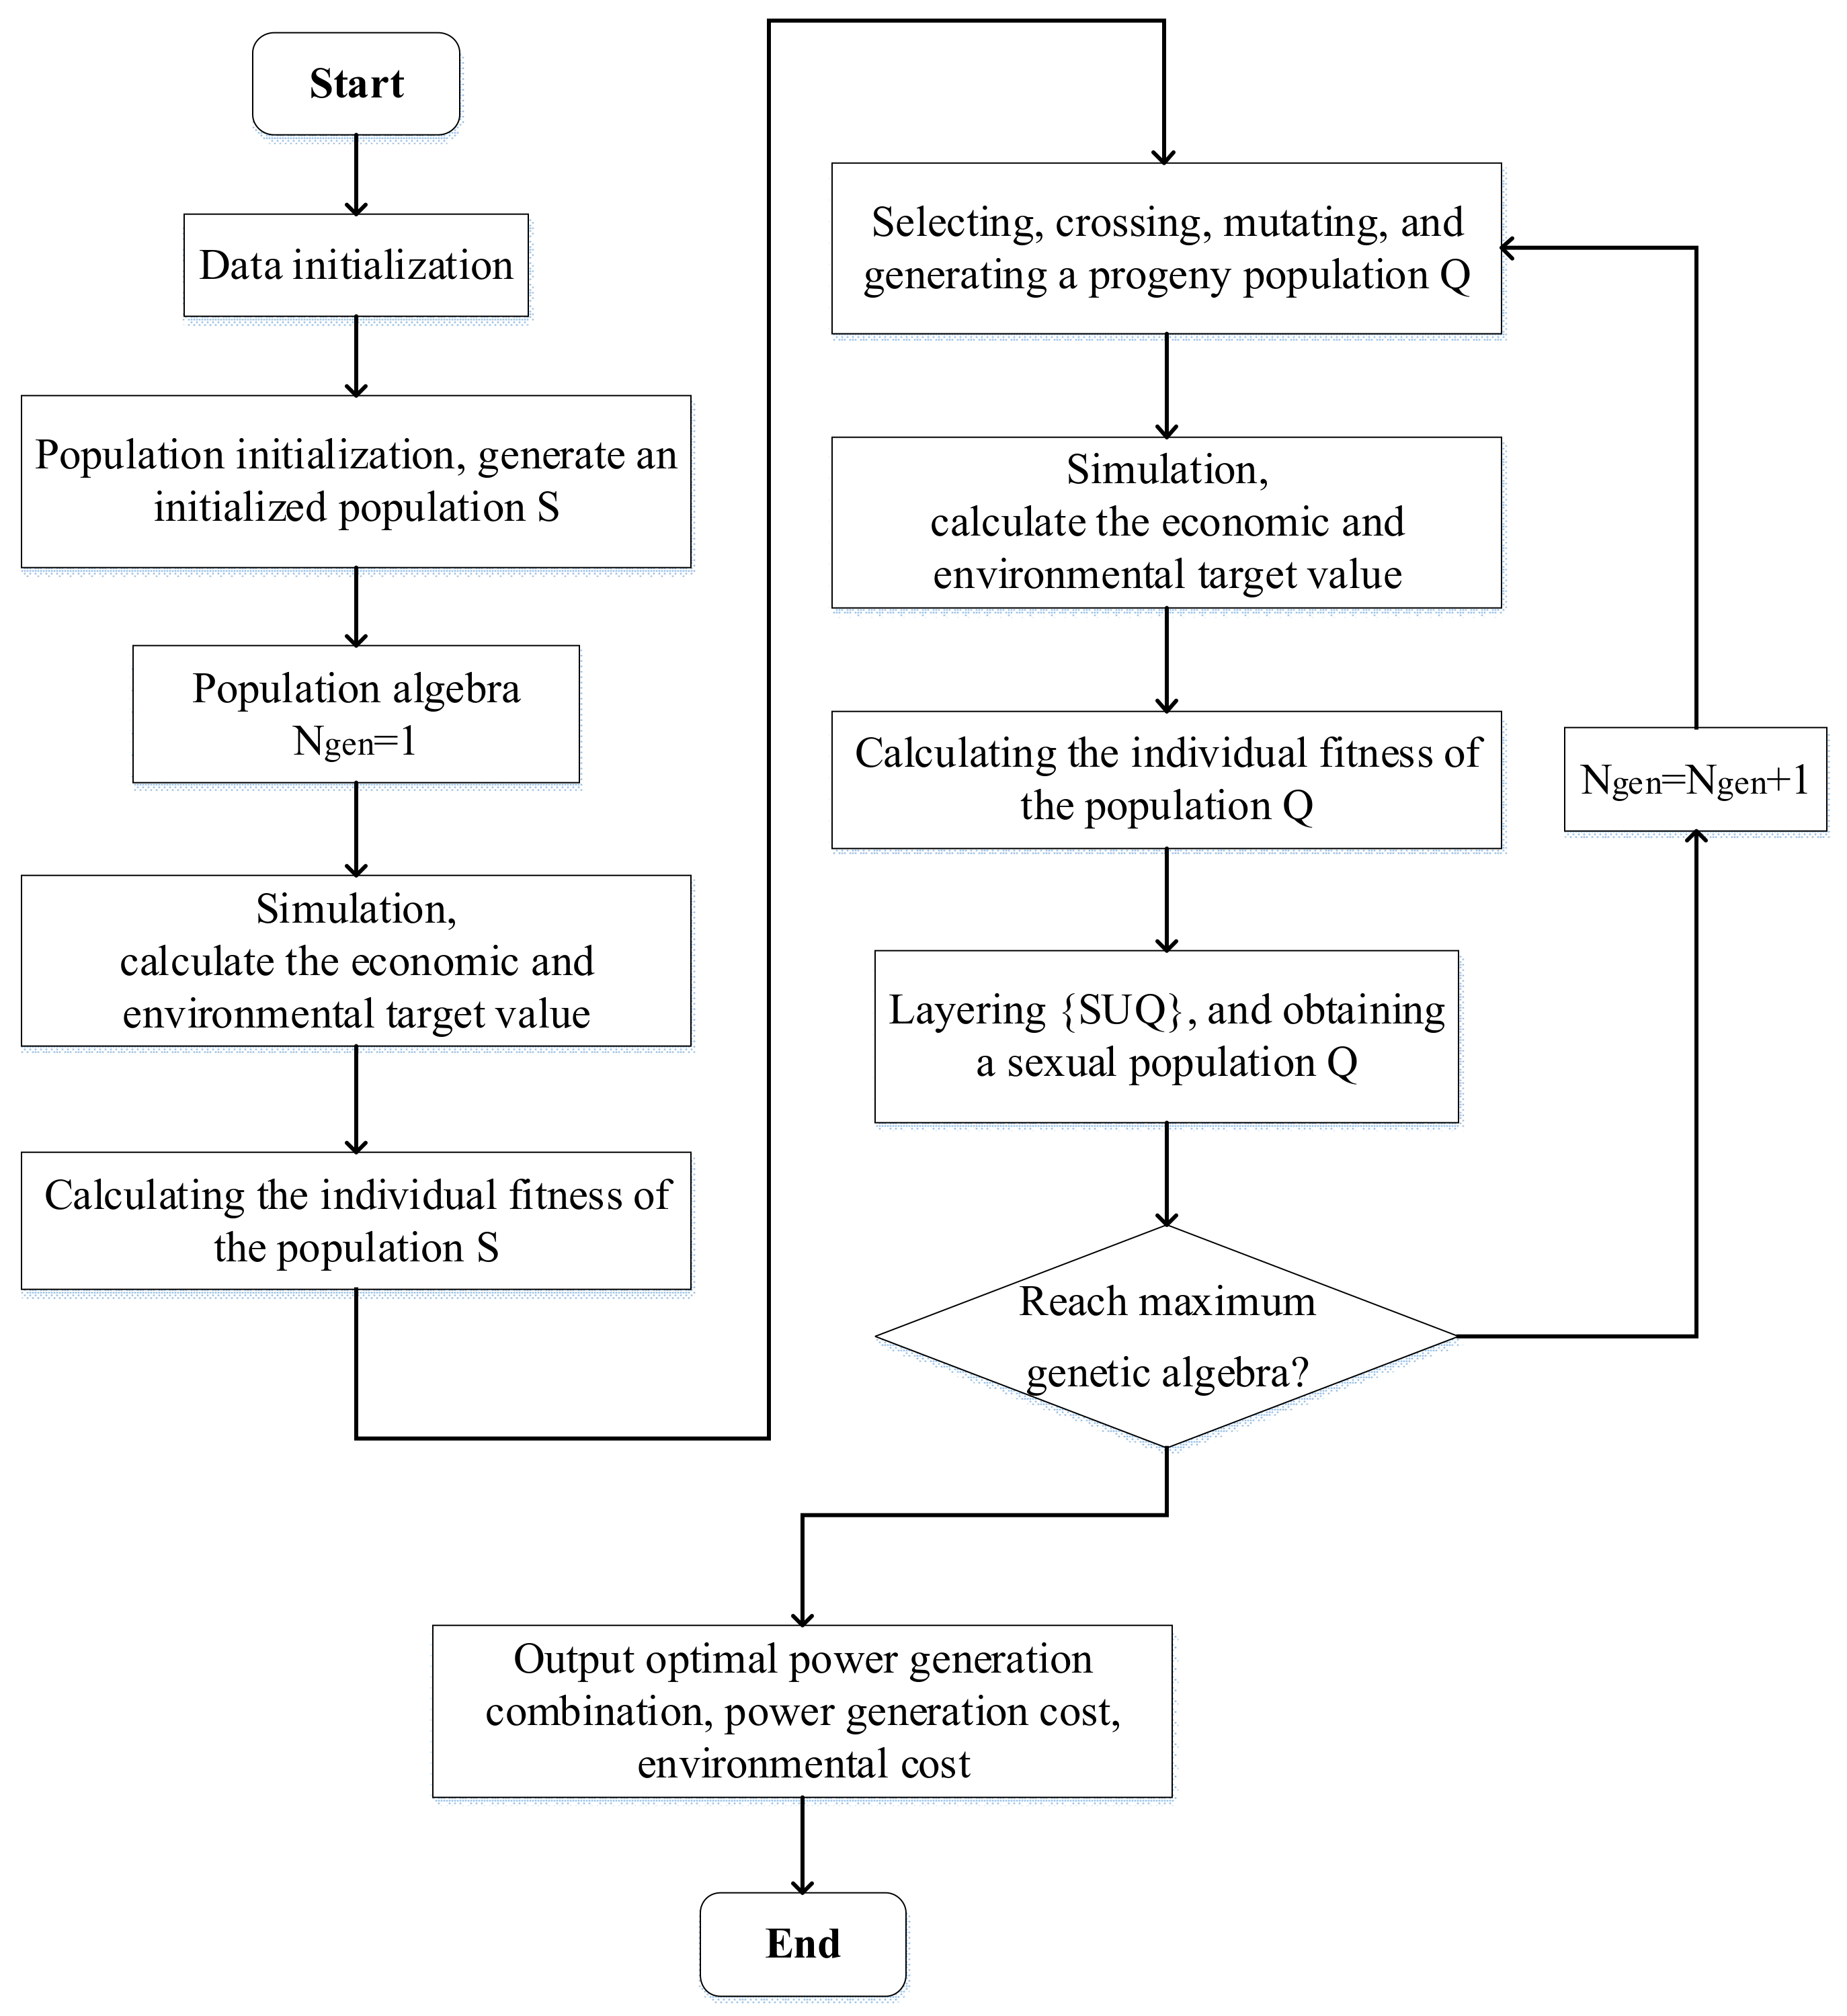
Considering the output of distributed generation and load level, the constraint value for each variable is set. Based on the scheduling strategy of demand response mechanism, the model presented is solved by Non-domimated Sorting Genetic Algorithm II (NSGA-II). In order to verify the performance of NSGA-II, this paper applied it to different scenarios of microgrid scheduling. The population size (NP) is set to 500, and the value of the maximum variation generations is 100, and the constraint processing method Ref. [34]. The flow chart of the NSGA-II proposed is shown in Figure 3.
4. Case Study
4.1. Parameters
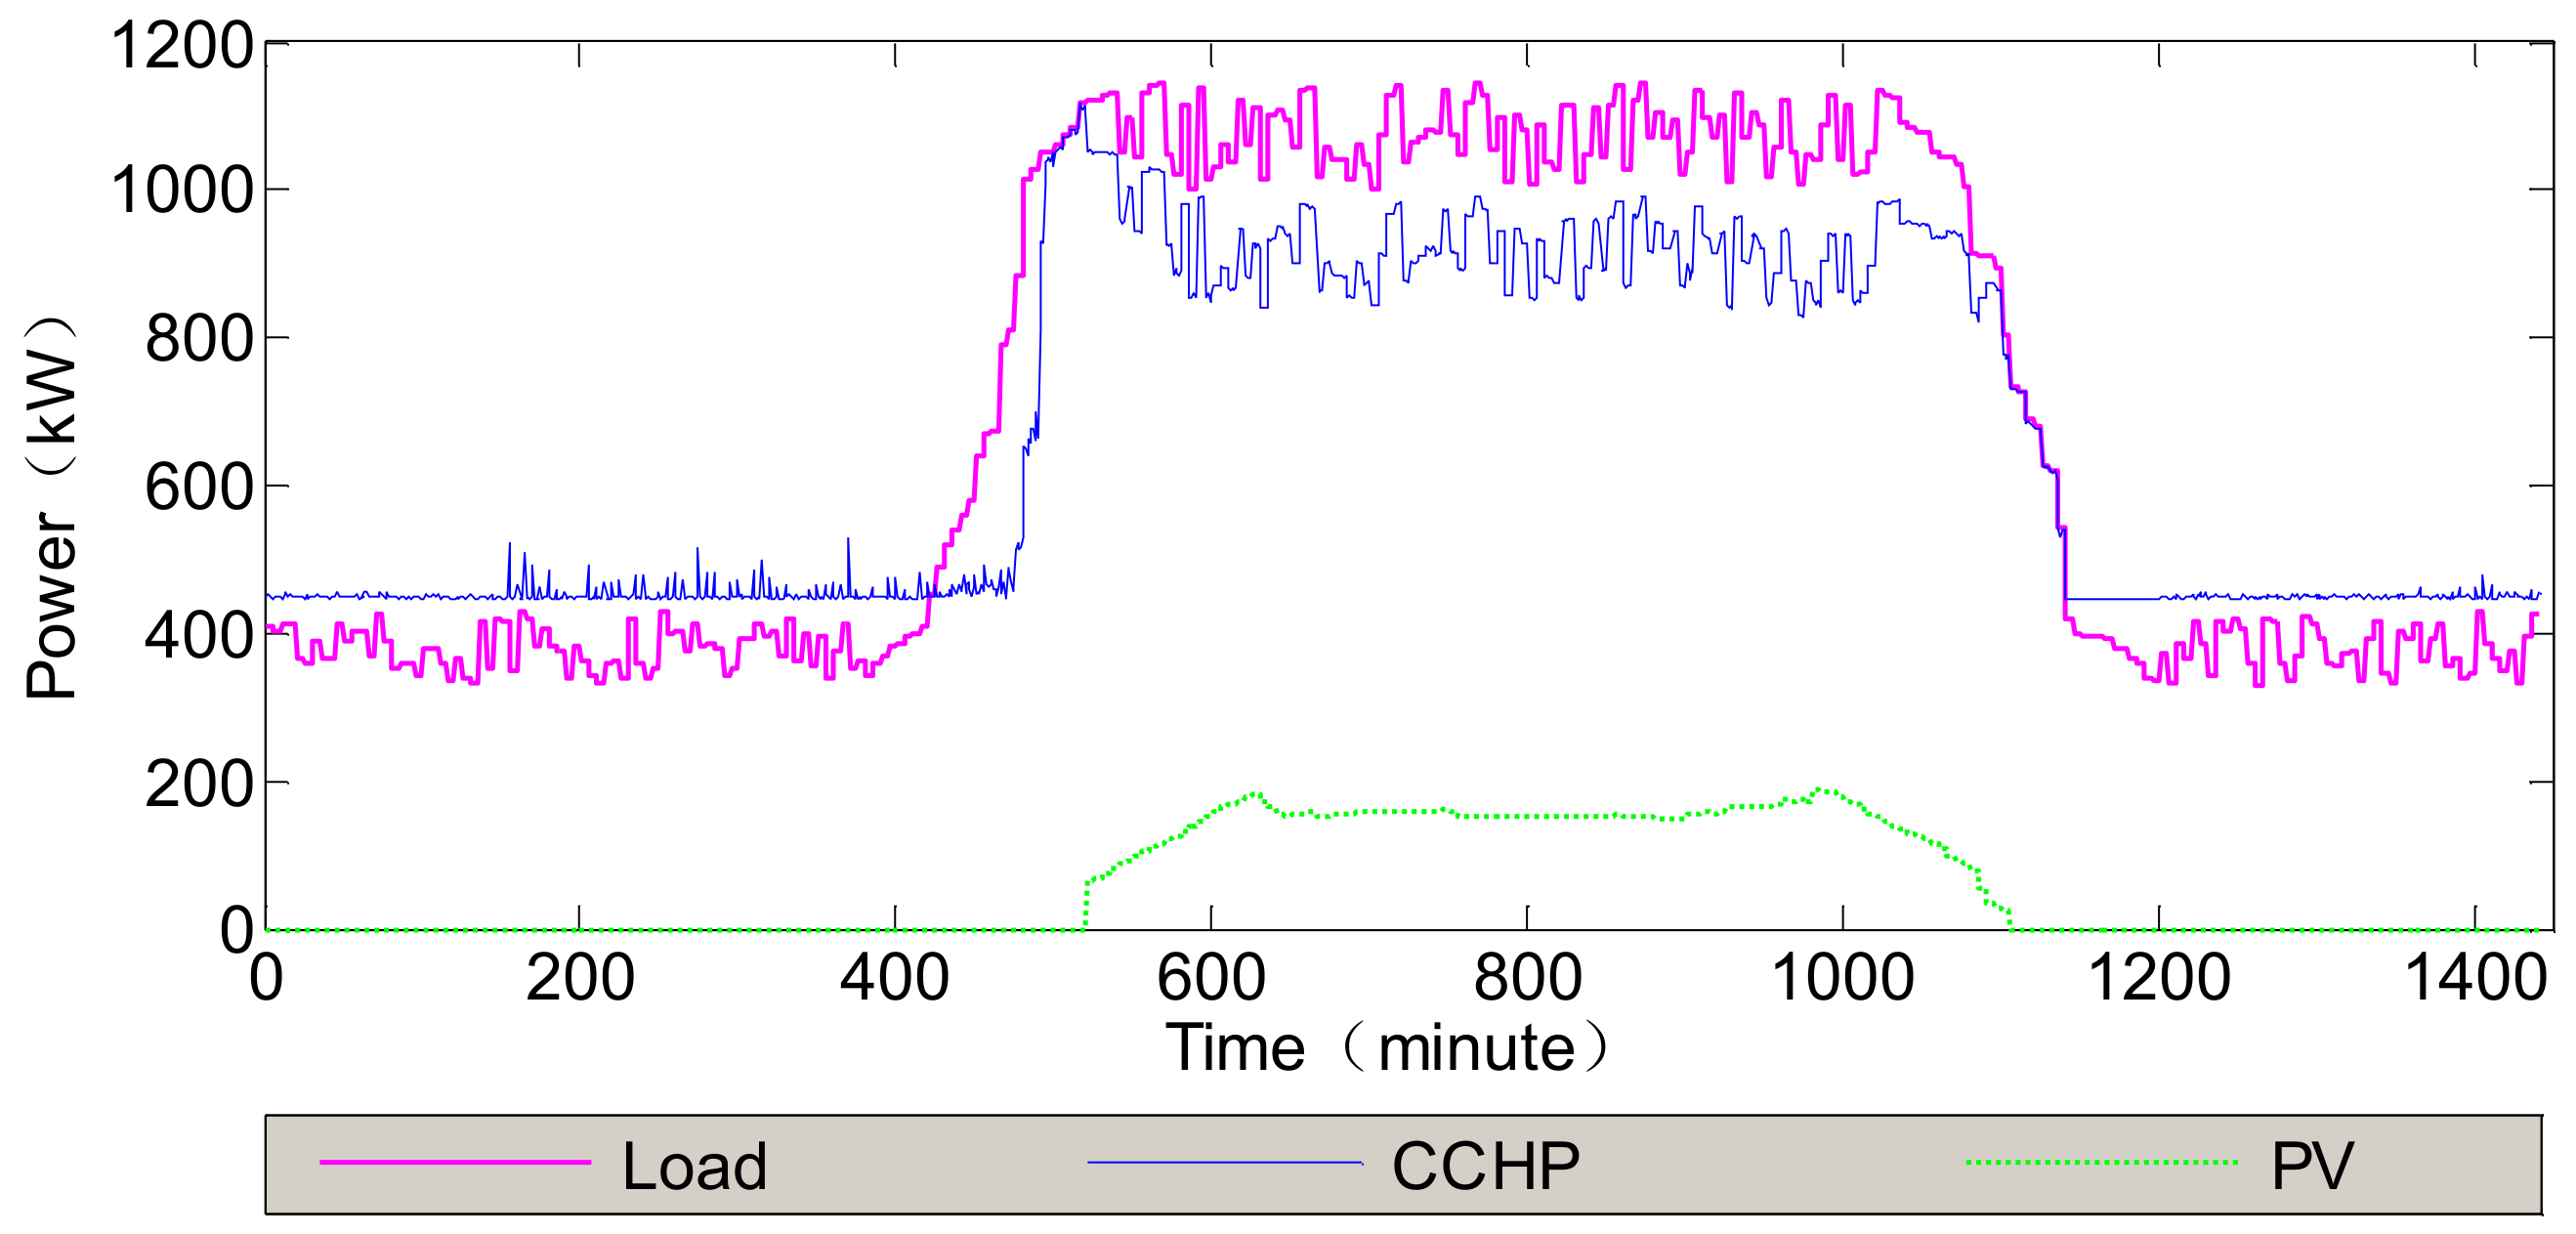
In order to verify the accuracy of the optimization model established in this paper, a typical microgrid including CCHP, PV and EES system is optimized and analyzed in this study. Typical load data for 1440 min of the day is selected for analysis, and the power predicted of CCHP, PV, and loads is shown in the Figure 4. In this microgrid, the capacity of CCHP is 1.5 MW, PV is 400 kW, electric load is 667 kW. And the EES capacity is 300 kWh, charge and discharge efficiency of battery is 90%, the actual cumulative throughput is . The TOU price is shown in the Table 1.
4.2. DR Study Results
According to the electricity price of the DR policy, the fixed electricity price is 0.9 yuan/kWh, the purchase price and the sale price are TOU price, as shown in Table 1 above. This section sets the parameters of the electricity and electricity price curve based on the elasticity coefficient of electricity and electricity price in Ref. [35]. The parameter is shown in Table 2.
According to Equations (4) and (5), an electricity and electricity price elasticity matrix M is obtain.
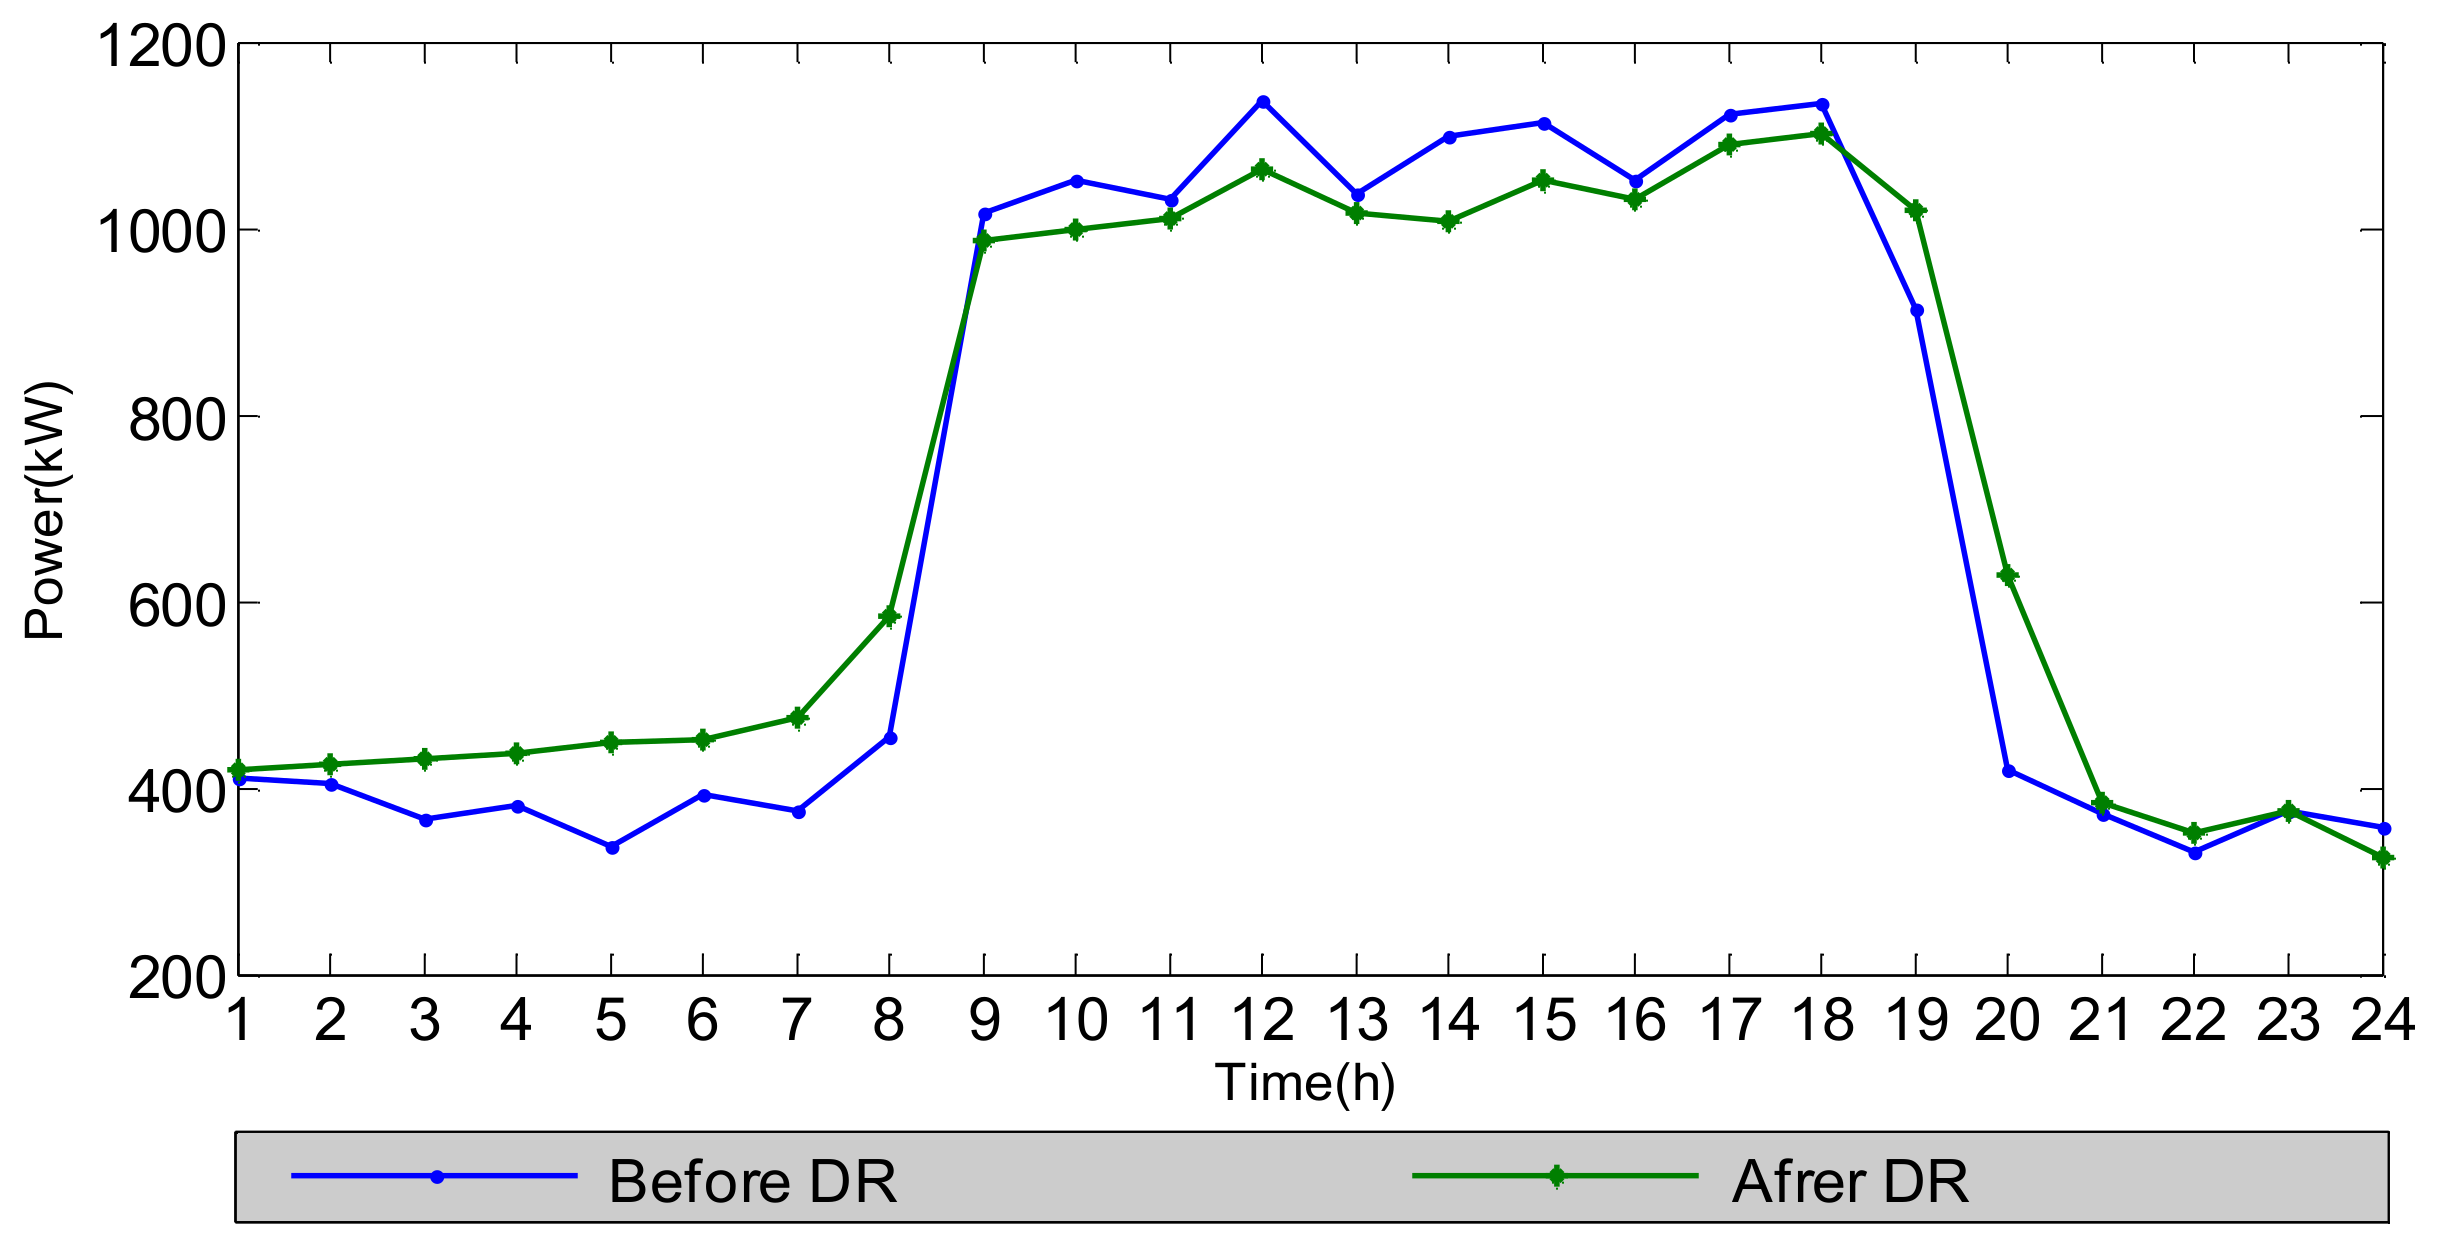
According to the demand response model, the load characteristics before and after demand response are obtained (shown in Table 3), and the system load curve is also obtained (shown in Figure 4). Peak valley difference of the system decrease after the demand response is shown in Figure 5.
According to the calculation results in Table 3, the peak valley difference of the system before the demand response is 806.62 kW, and after the demand response, it is 774.04 kW, the effect of Peak Shaving has been achieved. In addition, after DR, the satisfaction degree of electricity consumption satisfaction is 0.97, and the satisfaction degree of electricity expenditure is 0.75.
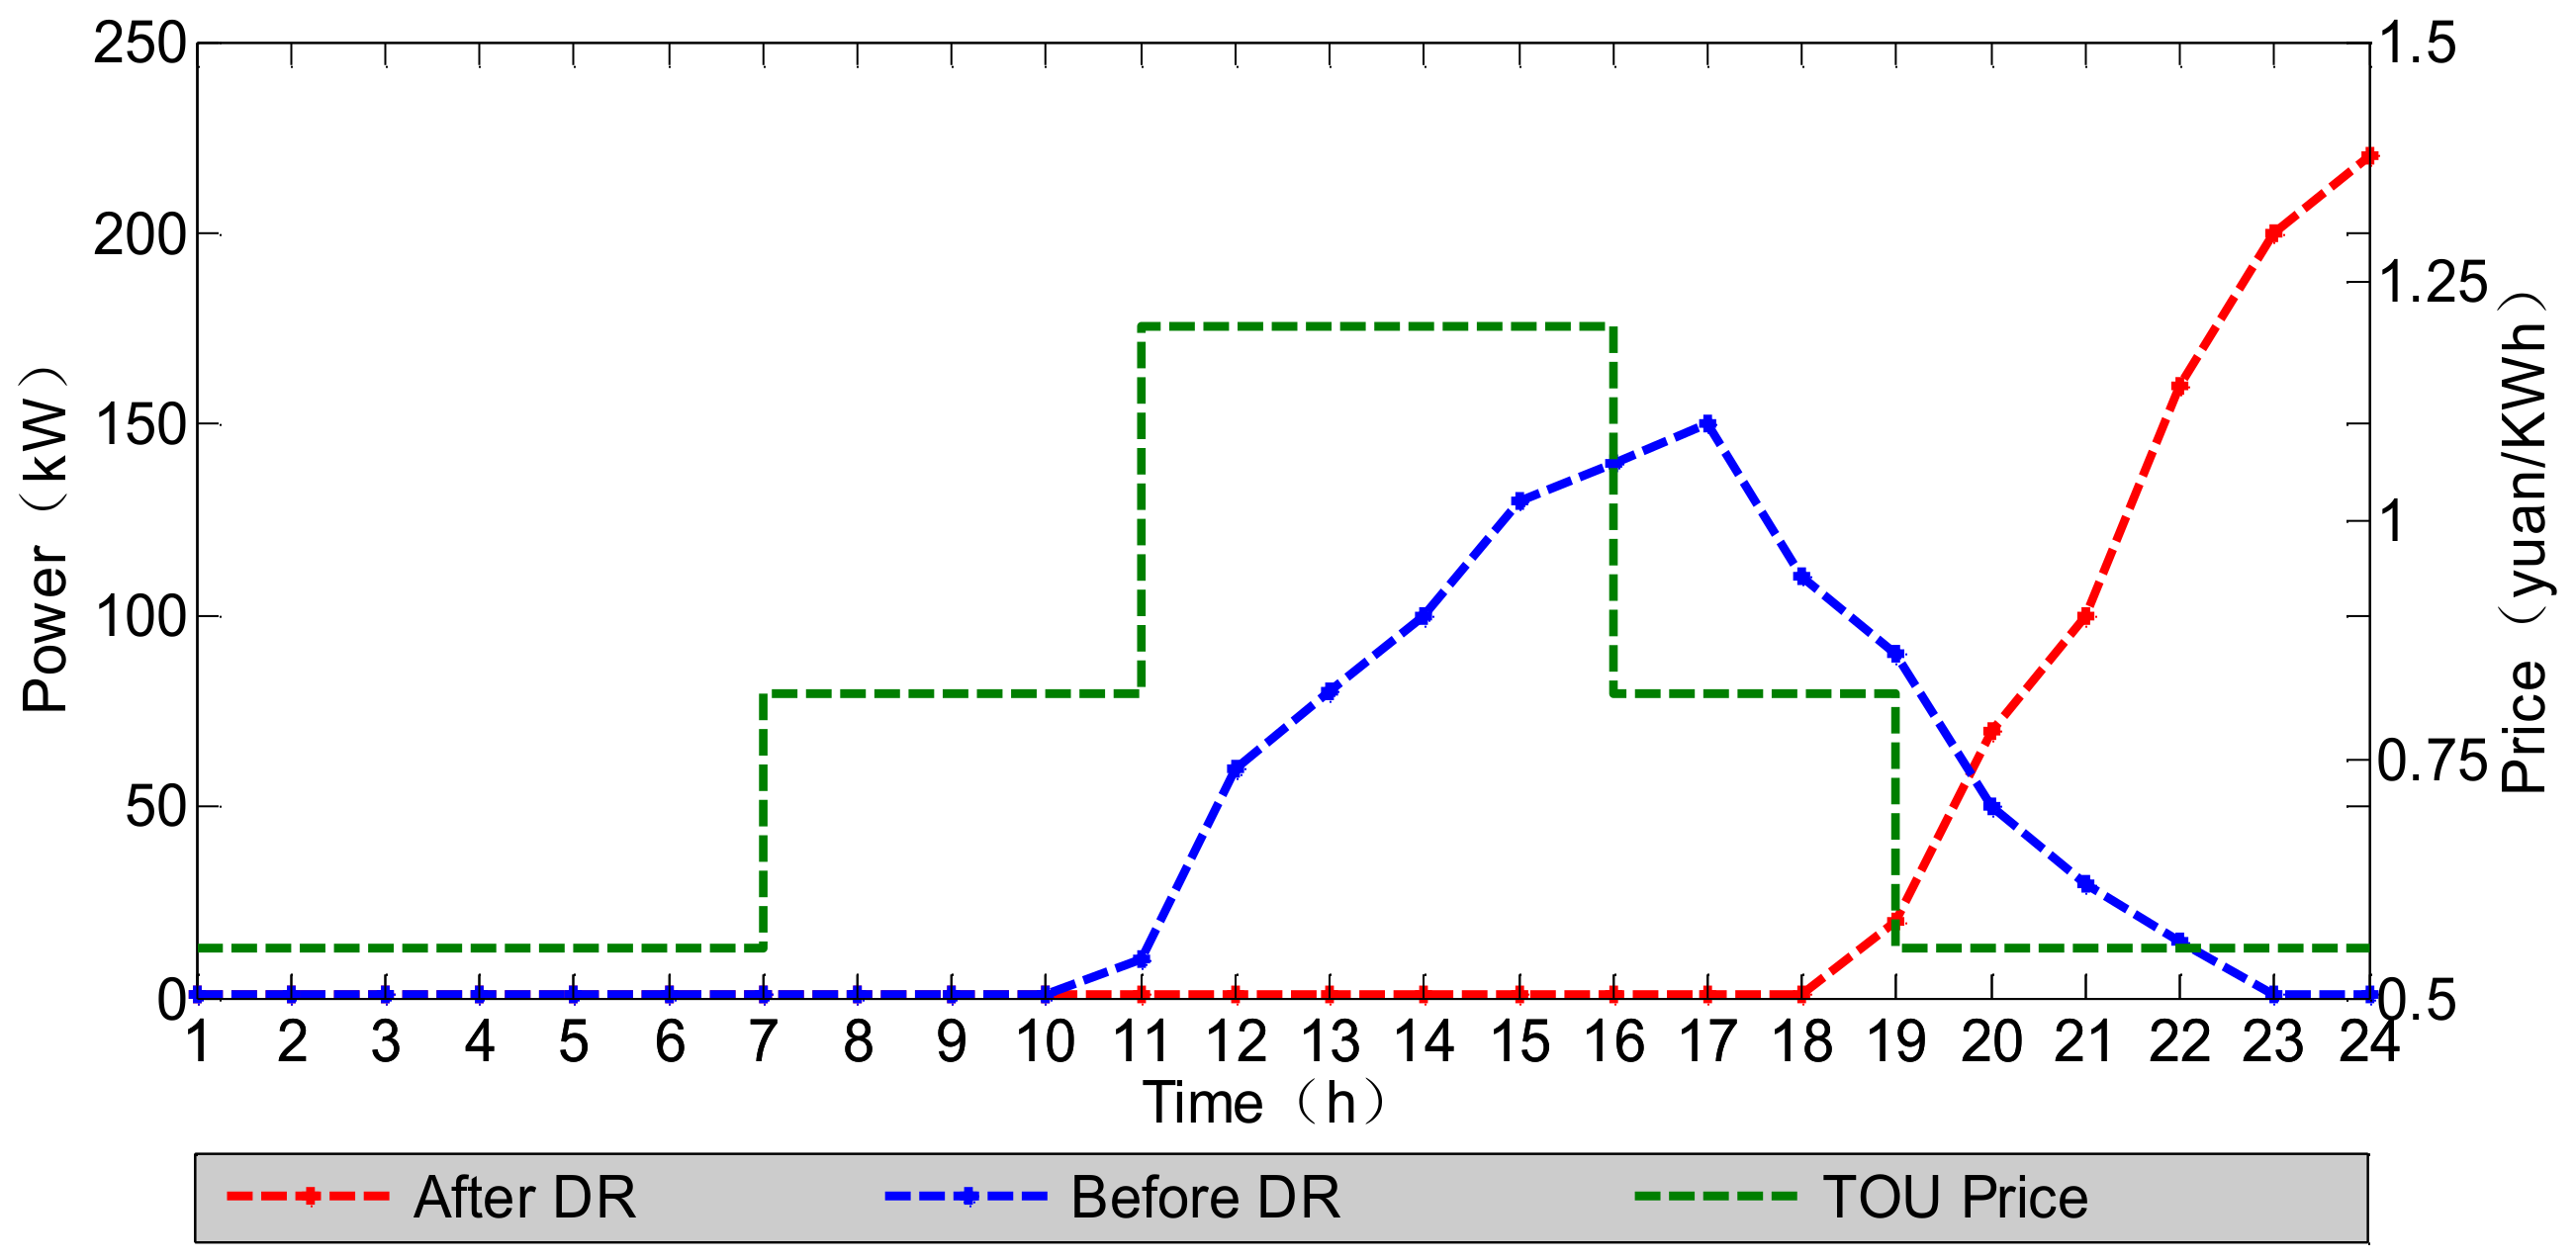
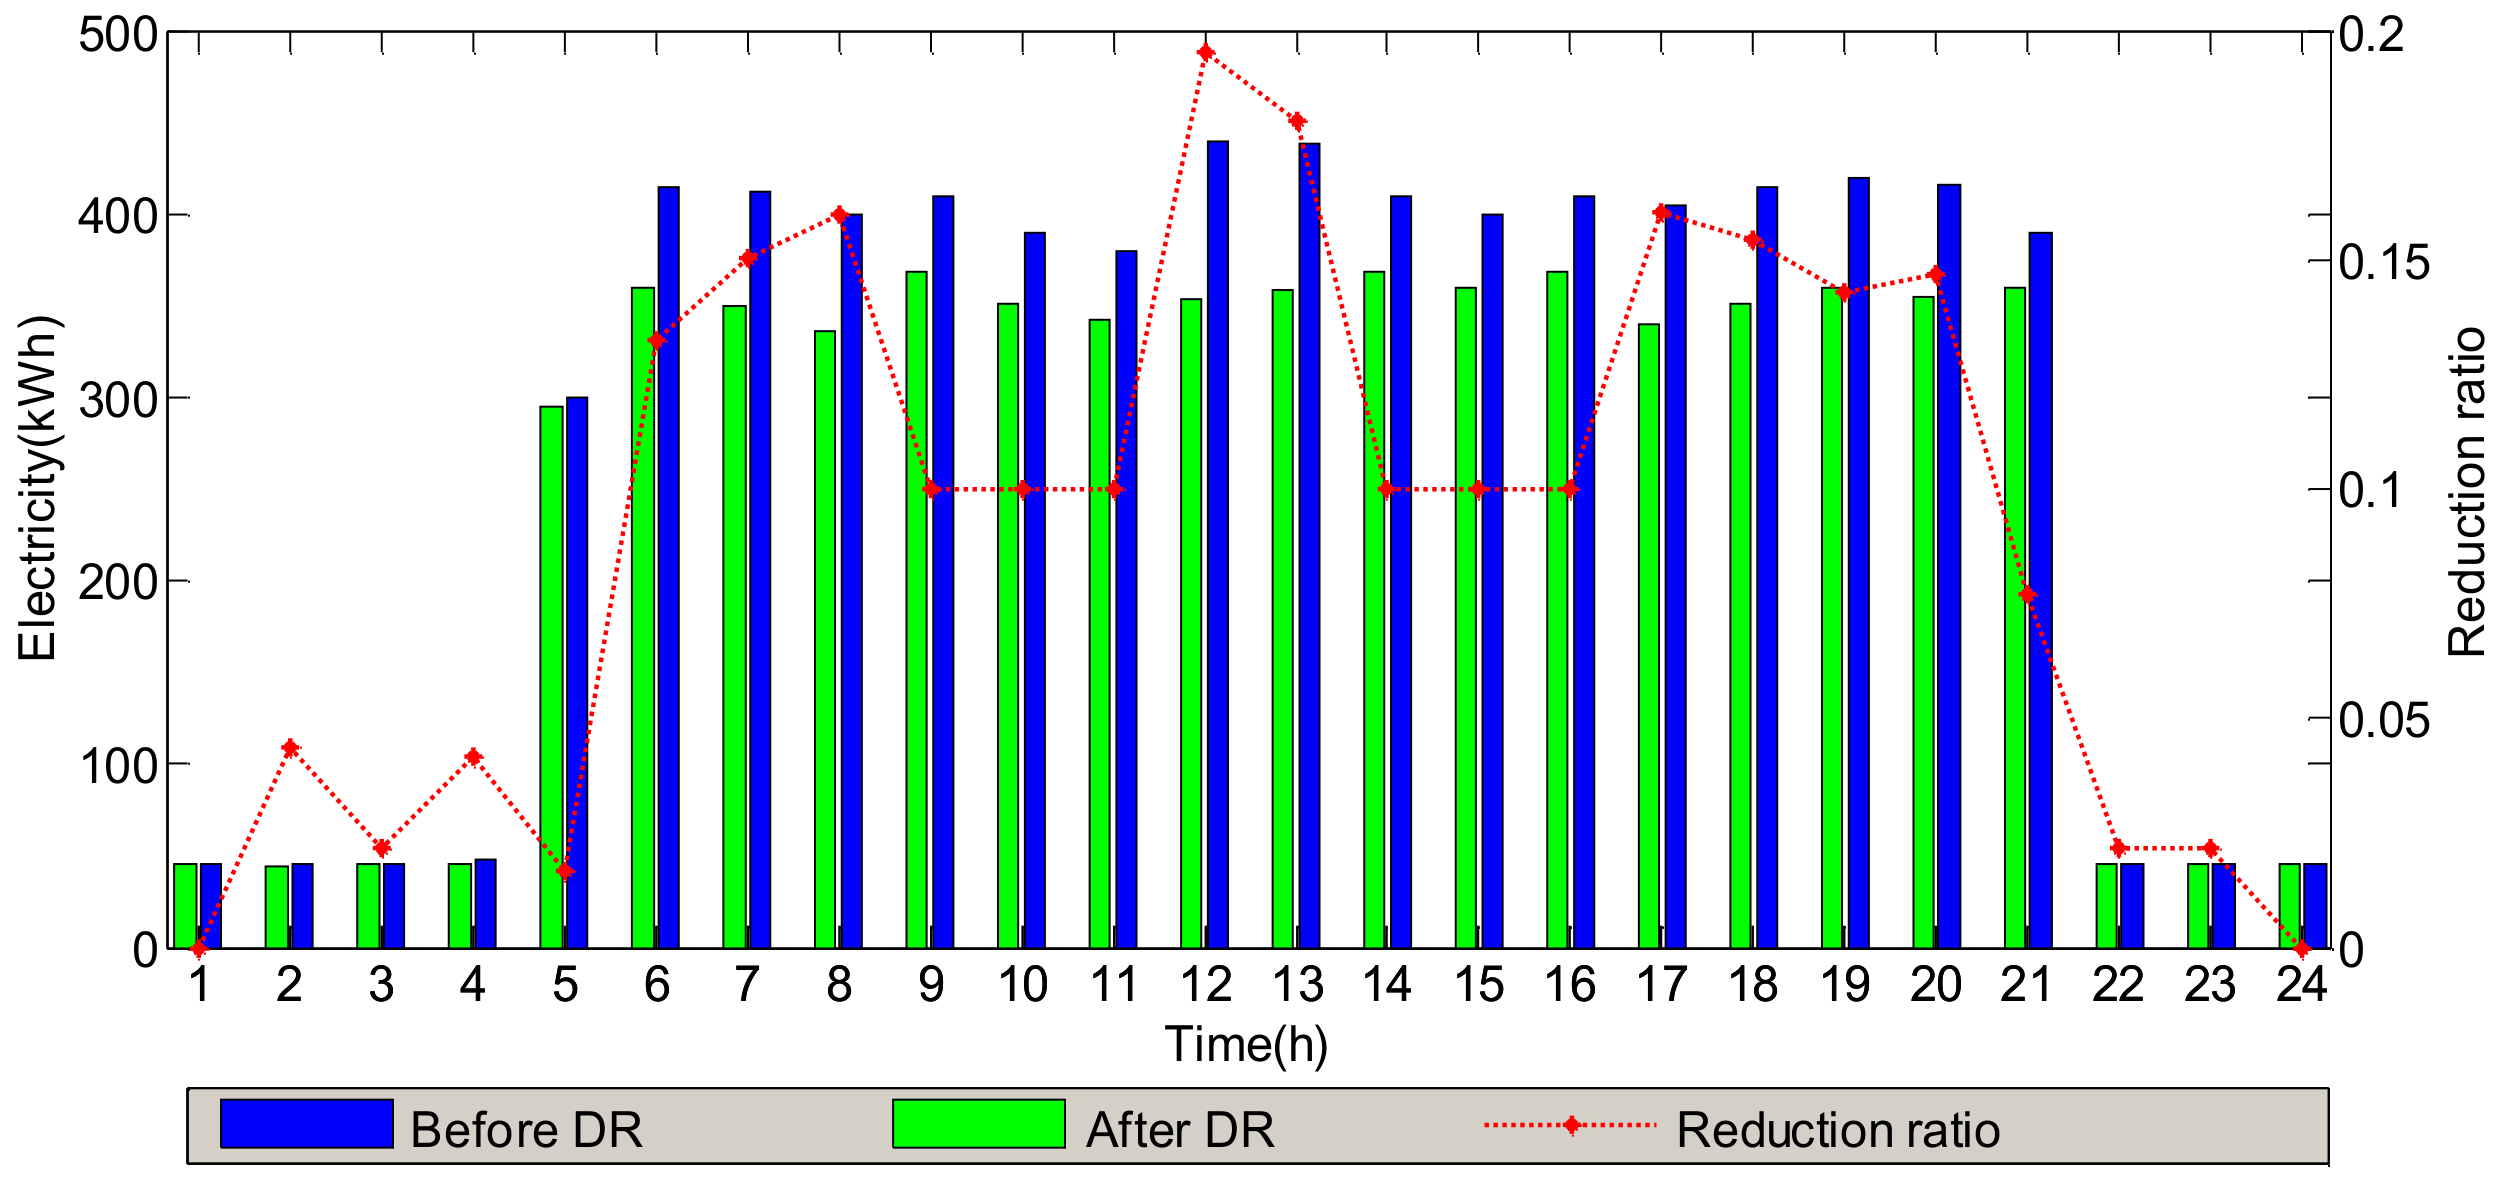
Under the demand response mechanism, electricity consumers can respond to the market price signal based on their load demand and preference, and change the power consumption mode and load demand independently. The load mainly conditions of the electric vehicle and the lighting before and after demand response is shown in Figure 6 and Figure 7 respectively.
In Figure 6, the charging time of the electric vehicle is mainly concentrated at 10:00 to 18:00 and 20:00 to 24:00. According to TOU price, users are willing to charge in the low night electricity price period, which can not only meet the needs of vehicles, but also save charging costs [36].
In Figure 7, the load of lighting system is not adjusted before 6:00 and after 21:00 due to the user’s habits. Between 6:00 and 21:00, the load reduction of the lighting system reached more than 30%. In addition, the maximum load reduction ratio can reach 10~20% after the implementation of the demand response program during the peak power consumption period.
4.3. Operation Optimization
4.3.1. Scene Analysis
In this section, three scenarios are set up to study the mechanism of demand response project on microgrid economic operation.
Scene 1: The system operates in off-grid microgrid. The power in the system comes from PV, CCHP and EES system, and the DG of the system can meet the power demand of consumers.
Scene 2: The system operates in grid-connected microgrid. Without the introduction of demand response, the major power suppliers in the system are distributed PV system, CCHP system, EES system and grid, and the electricity price is fixed. It is assume that the user preferentially use the power from DG.
Scene 3: The system operates in grid-connected microgrid. With the introduction of demand response, the major power suppliers in the system are distributed PV system, CCHP system, EES system and grid, and the electricity price is TOU price. It is assume that the user preferentially use the power from DG.
4.3.2. Optimization Results
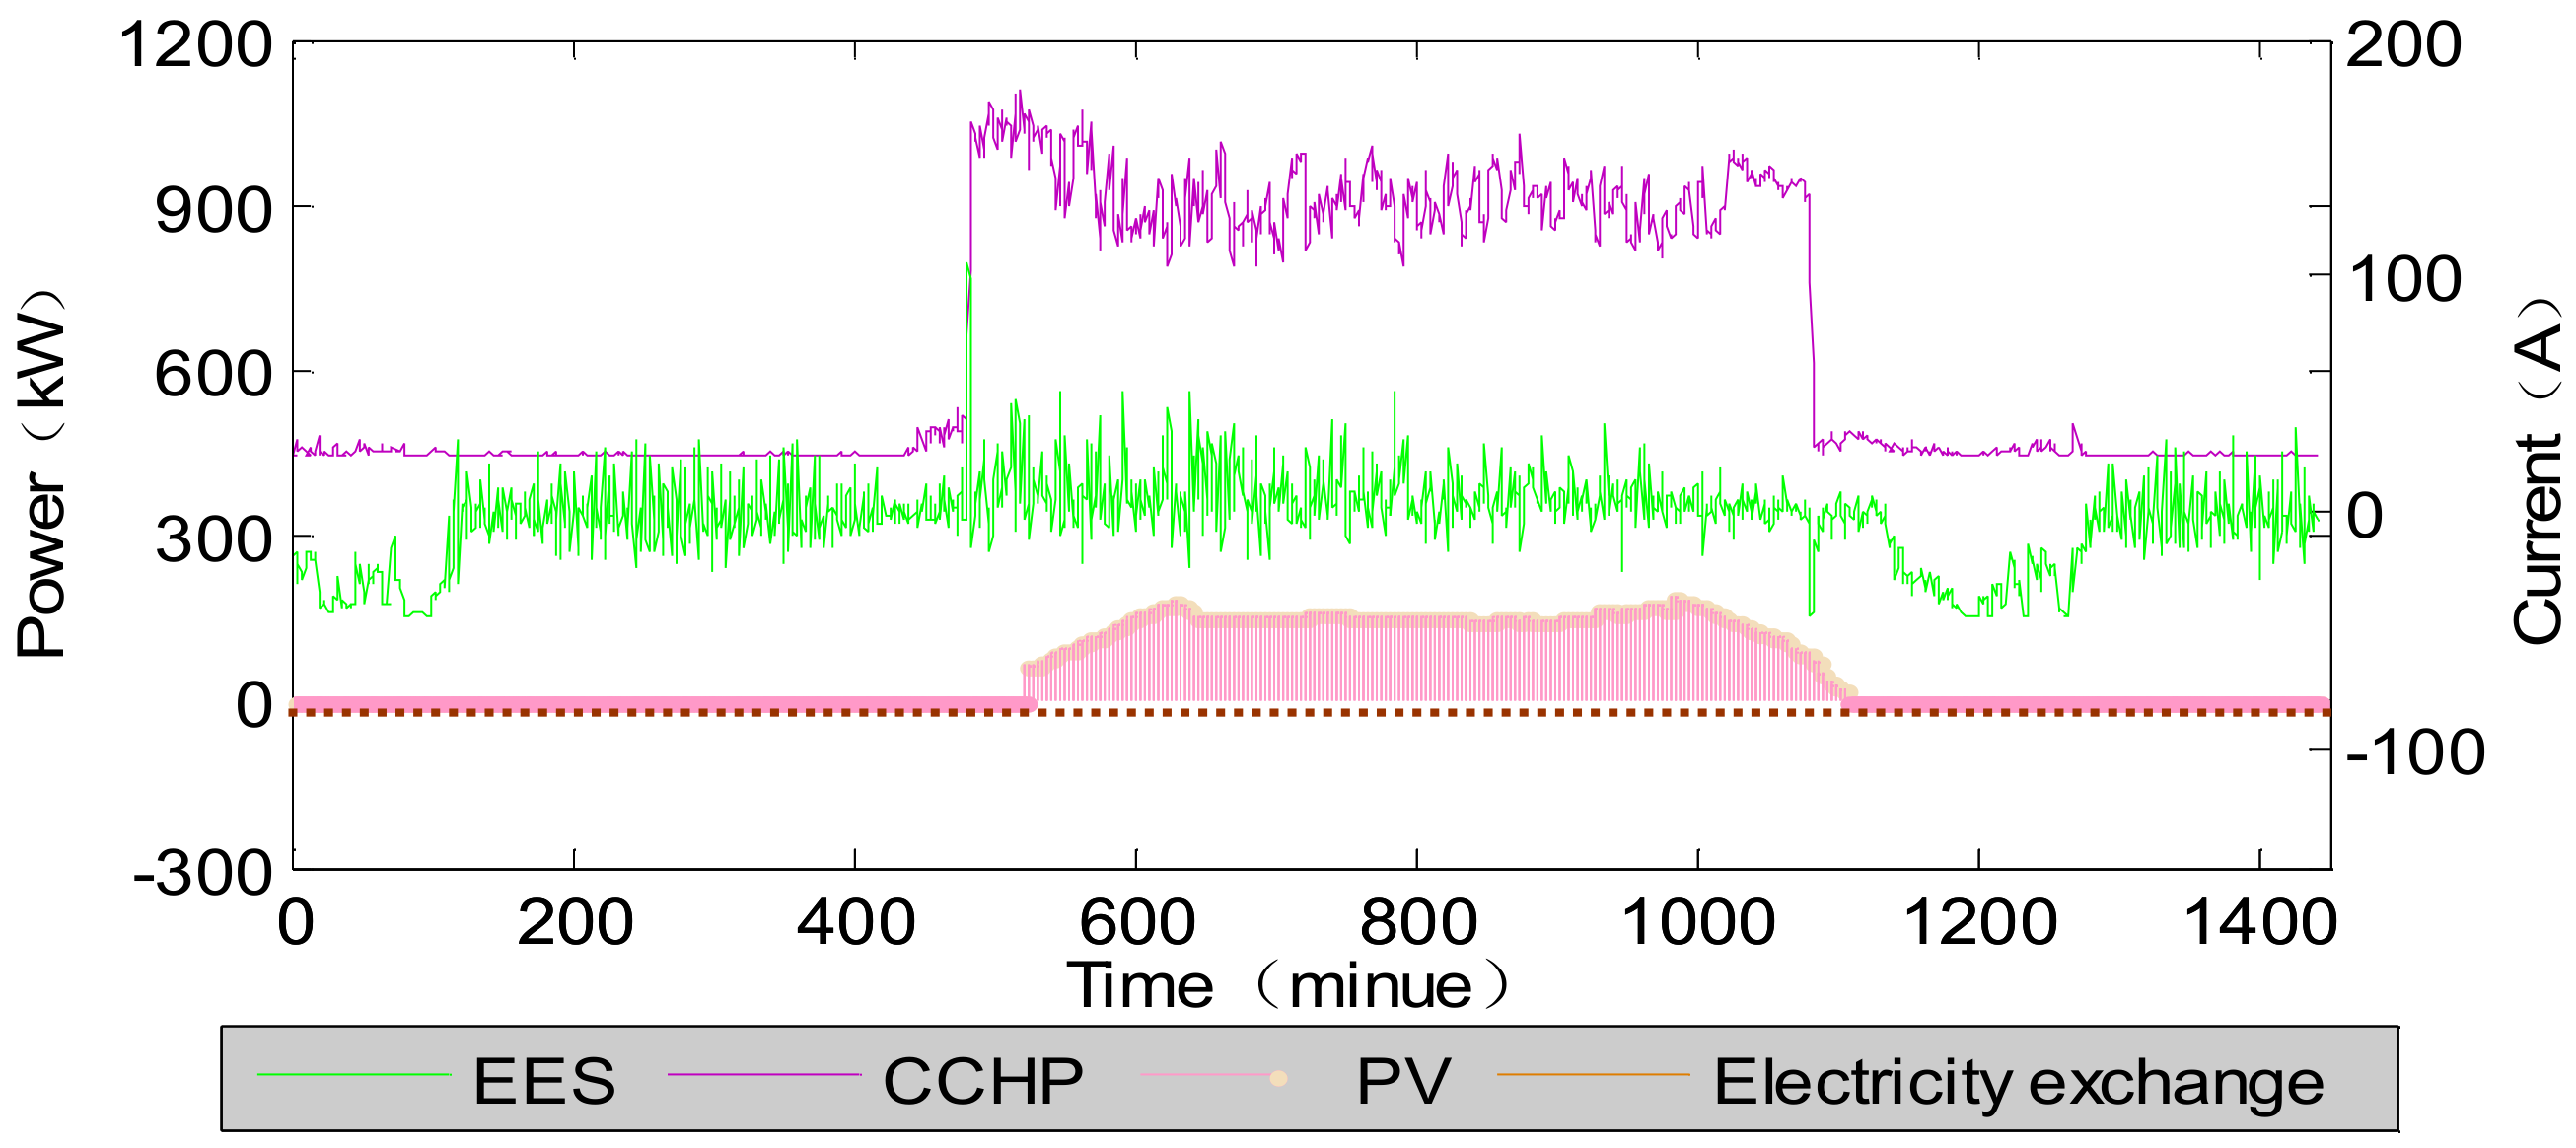
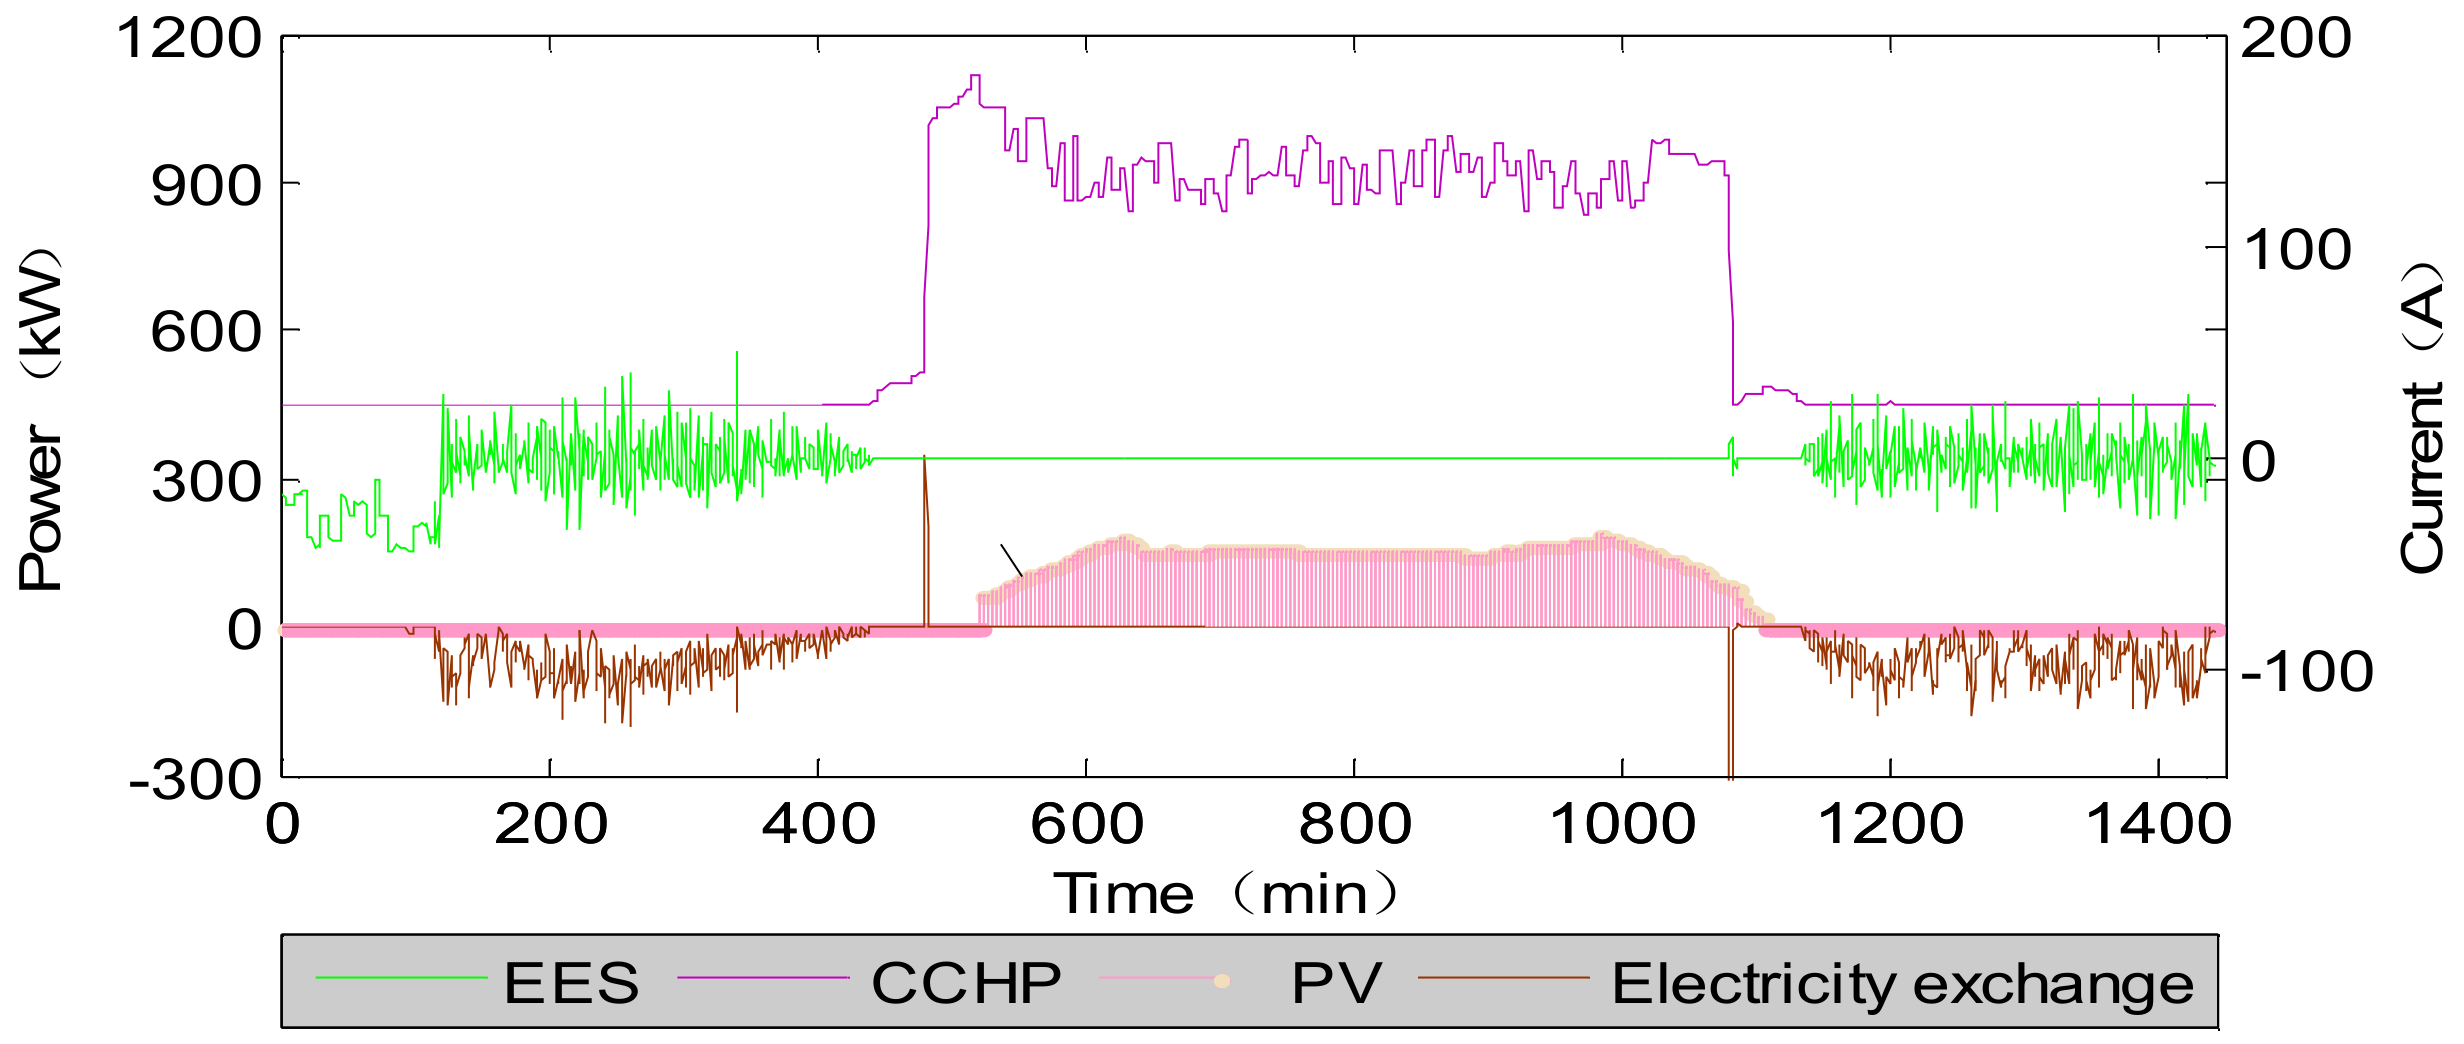
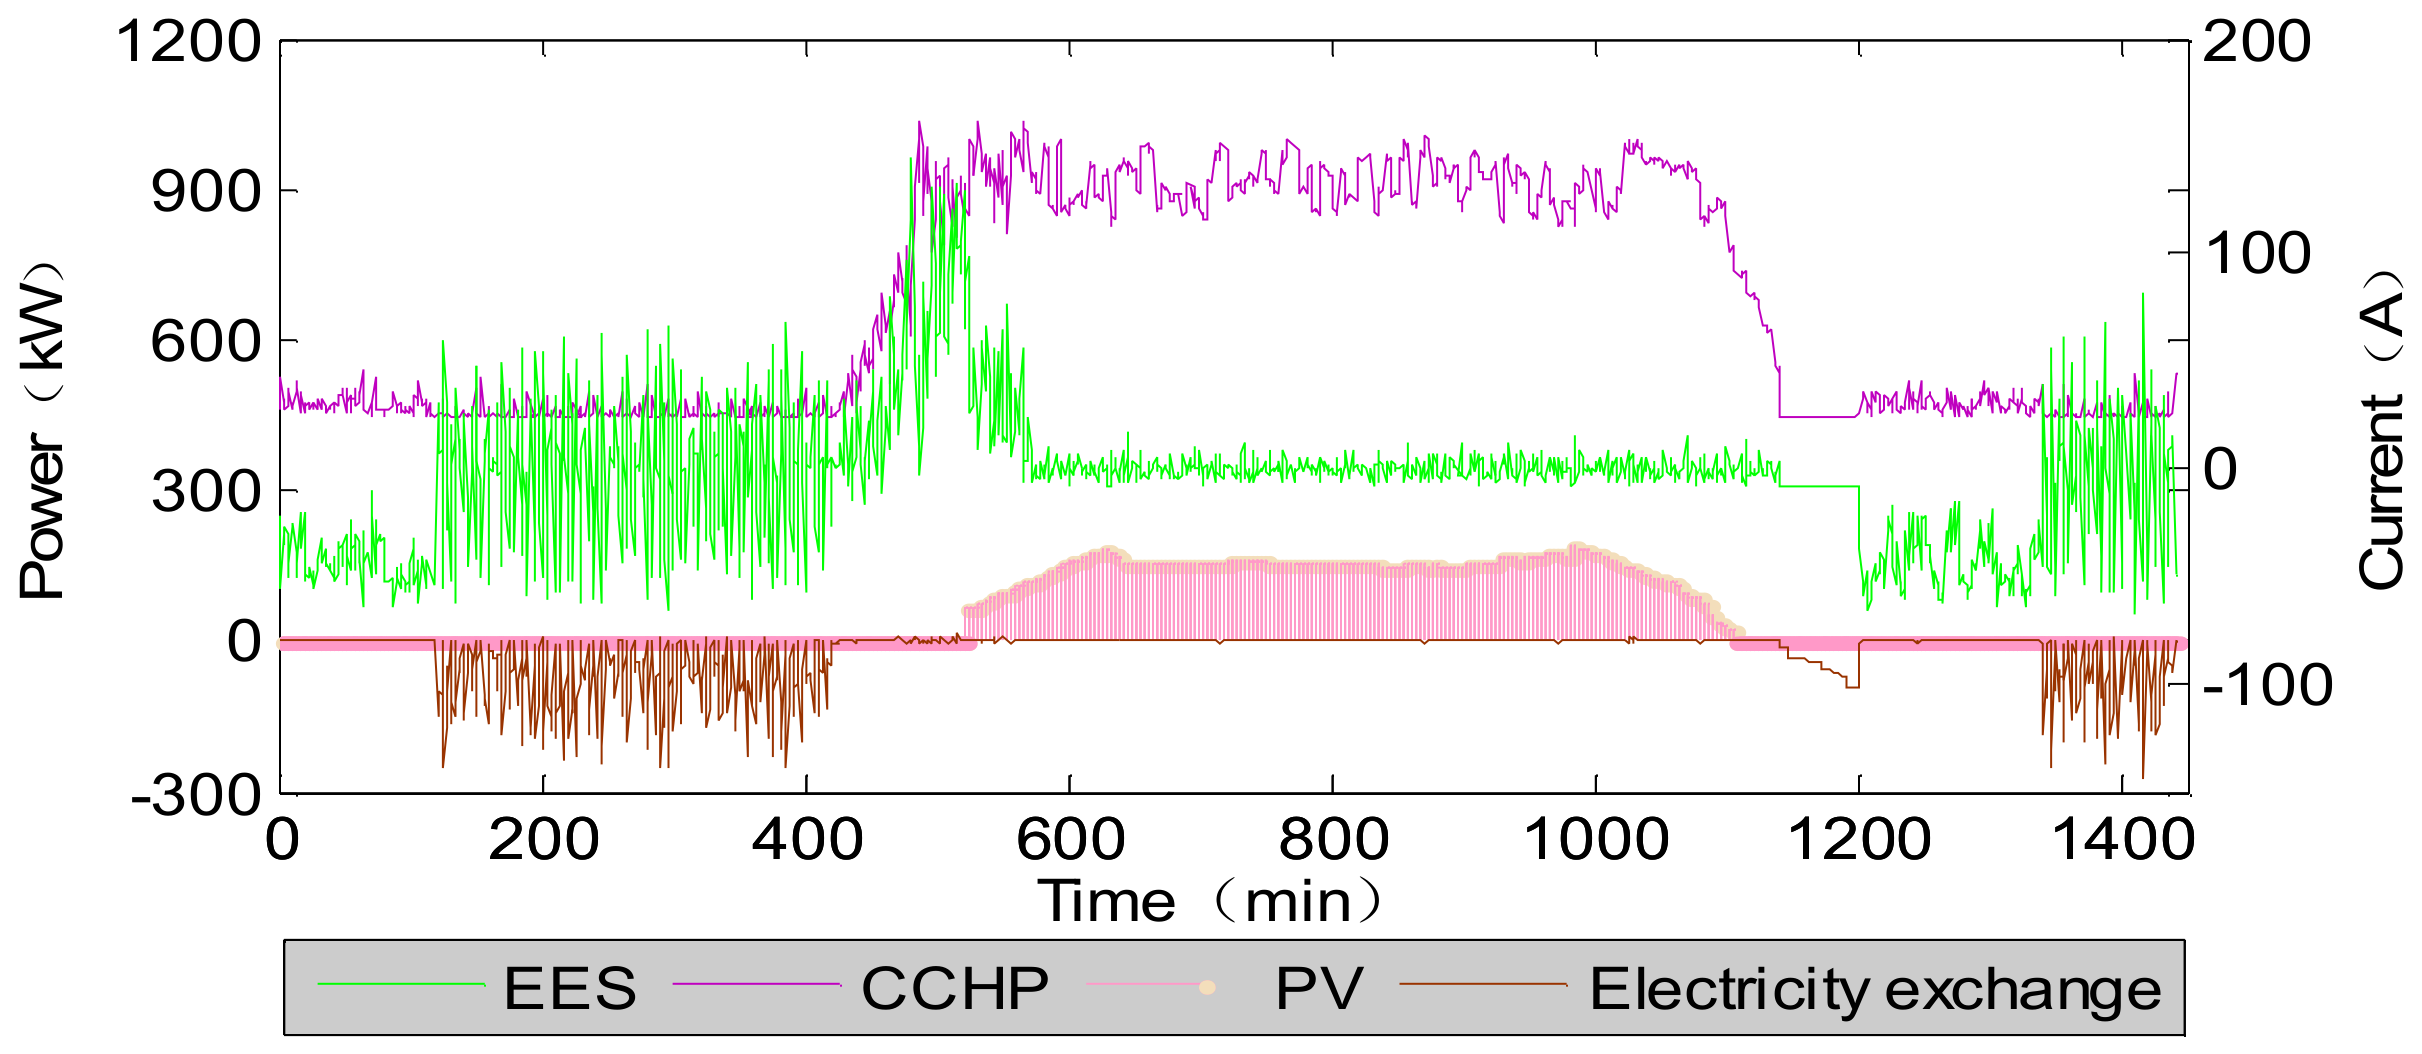
According to the three cases presented above, this section randomly selected typical-day load in the microgrid for operation optimization, the operation results are shown in Figure 8, Figure 9 and Figure 10.
Figure 8 shows the output of the different unit in Scene1.In this scene, the system does not exchange energy with the grid, and the power demand of the system is provided by combined energy supply system composed of PV, CCHP and EES. The operation cost of the system is mainly DG cost and charging and discharging cost of EES.
Figure 9 shows the output of the units in Scene 2. In this state, the consumers first use DG power and energy storage. The surplus electricity is delivered to grid, the insufficient electricity is purchased from grid, and the electricity purchase price is the fixed price.
Figure 10 shows the output of different unit in Scene 3. In this state, because of the interval distribution of electrovalence, the daytime price is higher, the power of CCHP and the output of ES and discharge in the system are improved compared with scenario 2 in order to reduce the cost of electricity. And the output of each unit of the system is more sensitive to electricity prices, and the output of each power supply and the change of electric quantity exchange are more obvious.
4.3.3. Optimization Process Analysis
In the microgrid system, the PV power is a clean power. However, the CCHP system drives the gas turbine to turn through the consumption of gas to generate electricity and heat, which produces a large amount of pollutants during the combustion process. In addition, electricity is mainly derived from thermal power generation in China. In the context of environmental issues, the operation of microgrid should not only consider the economy, but also consider whether it is environmentally friendly. Therefore, there is Pareto with both economic and environmental protection.
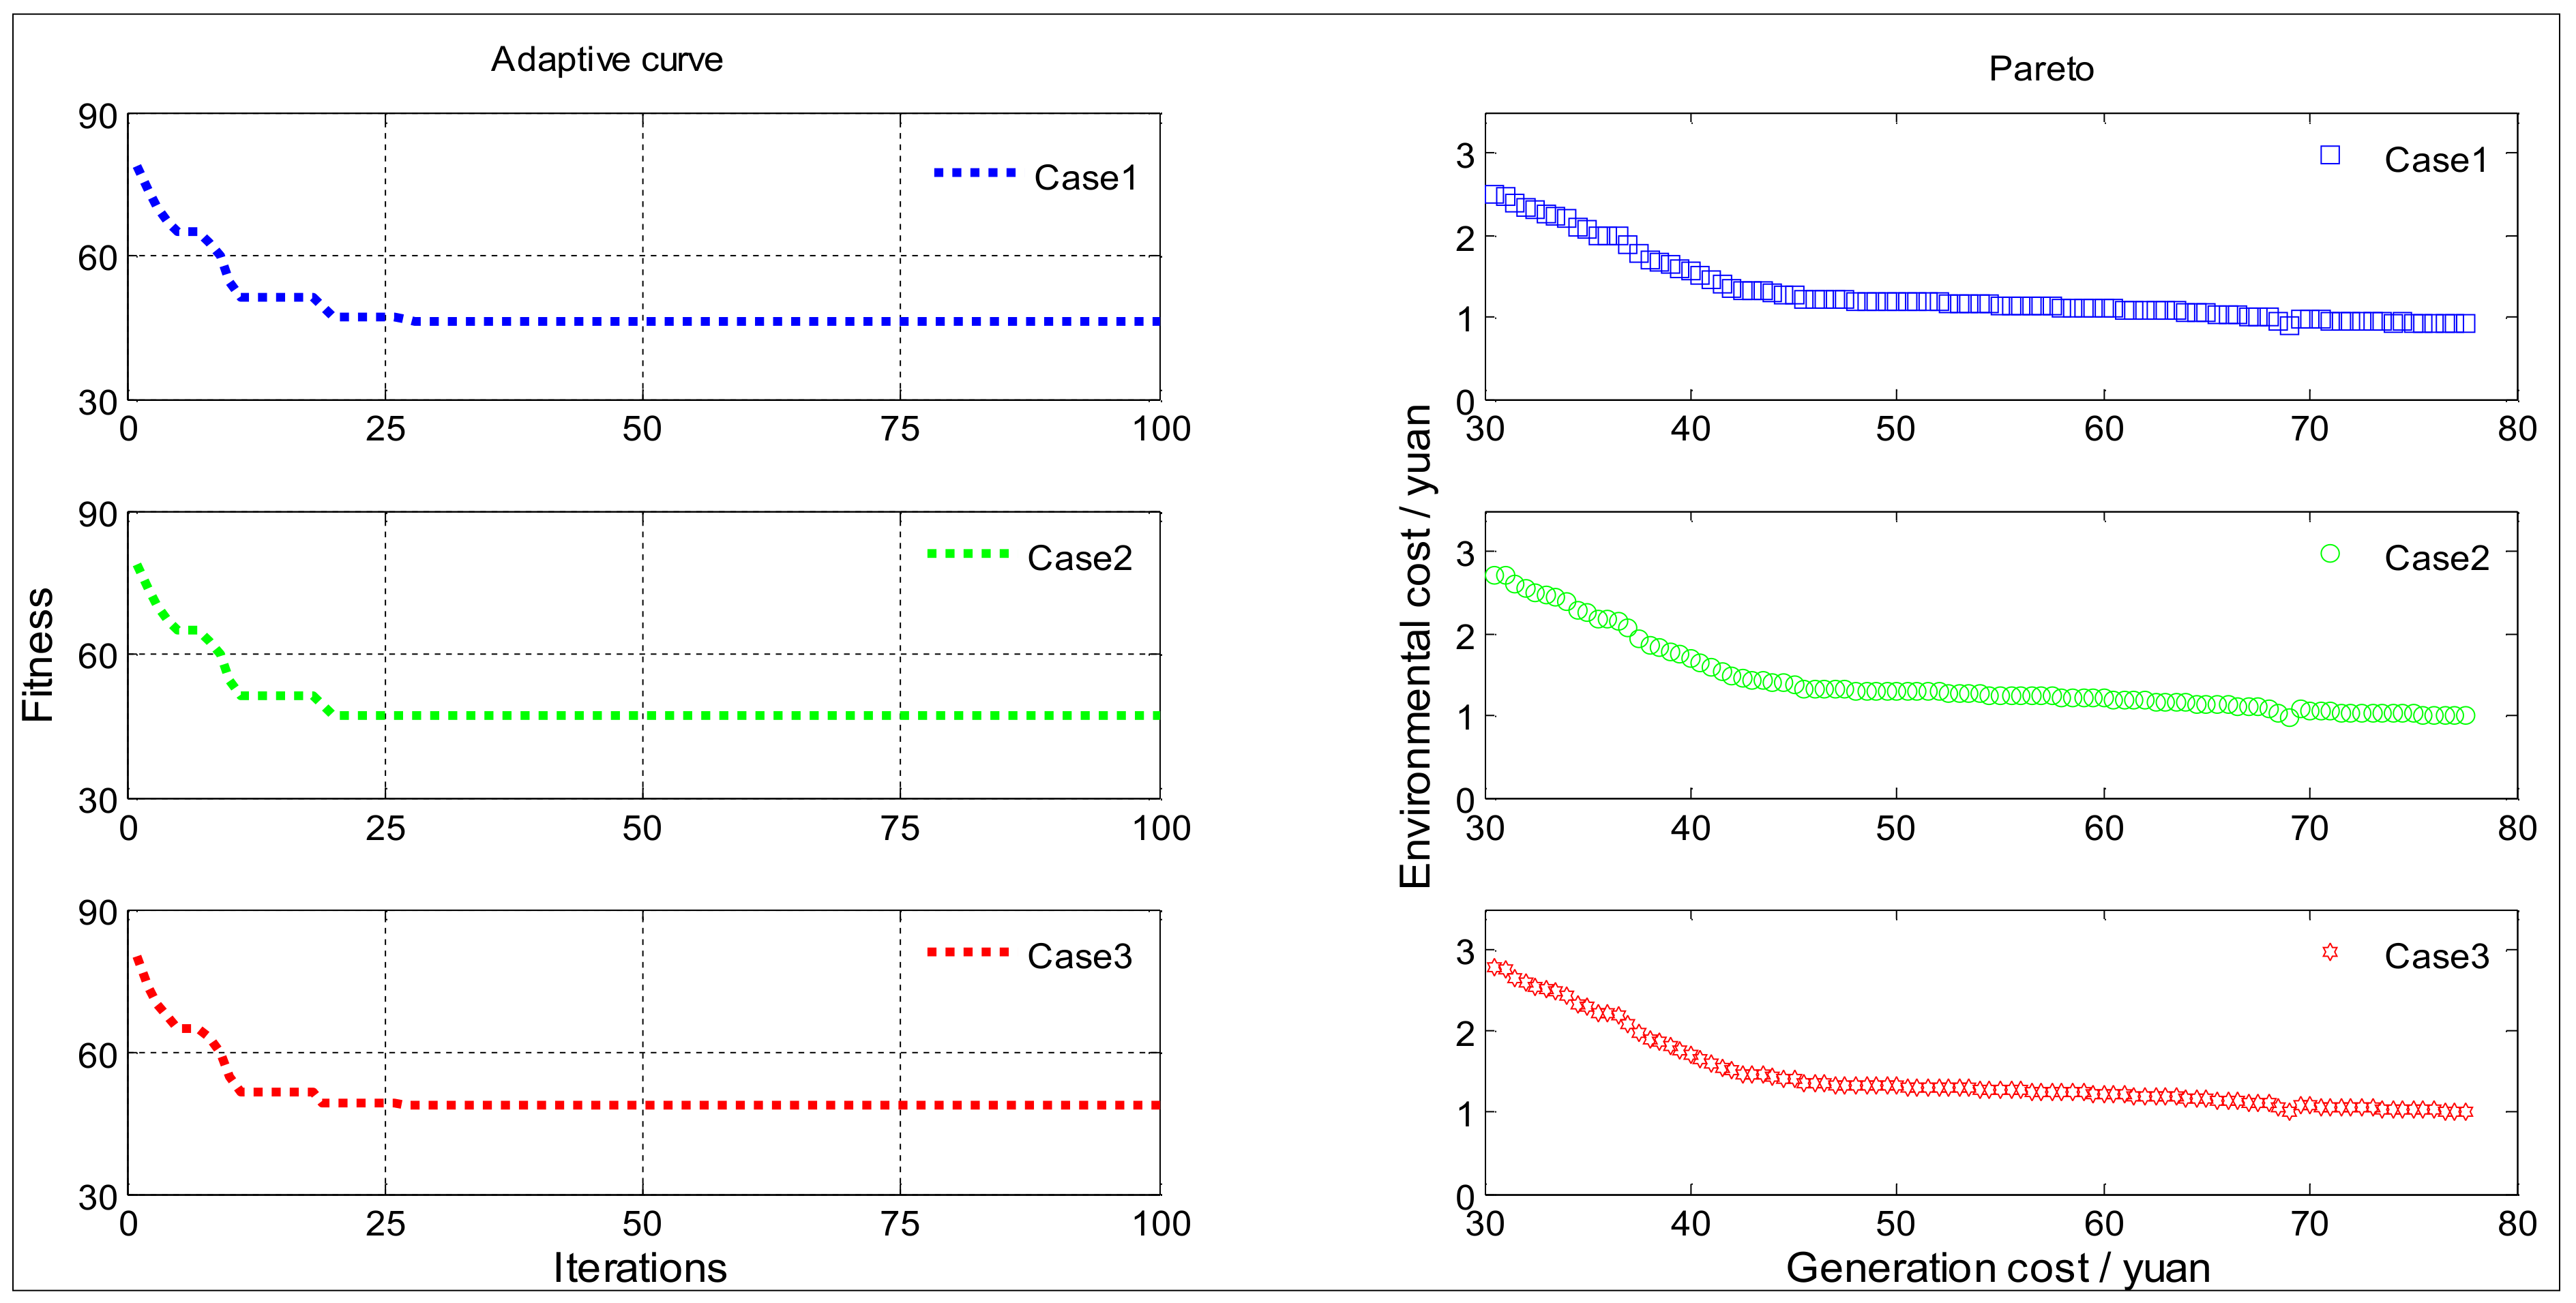
In addition to the above discussion, microgrid economic/environmental multi-objective scheduling problem is often faced with complex situations such as operation mode switching, electricity price change and so on, so the algorithm should have better adaptability to the problem. In this section, three scenarios are simulated respectively: TOU price mode, fixed price mode and isolated grid mode. And the extreme solution optimal target value, average target value and algorithm operation time in Pareto solution set are compared. The optimization results of three schemes in wardrobe optimization period (5 min) are shown in Table 4 and Figure 11.
With initial data and parameters, the proposed NSGA-II algorithm is used to solve the operation optimization problem with considering a variety of constrains. For proving the effectiveness of the improvement of NSGA-II algorithm, the algorithm is used in the operation optimization of three different microgrid operating states, and the fitness value and Pareto solvable set are also recorded in detail. It is clear that when the algorithm is run in scenario 1, the energy cost decreases until the algorithm converges after about 34 iterations, and the total running time of the program is about 18.957 s within the interval T. Similar trends can be revealed in the other two scenarios. The minimum value of each population variation generation is recorded, and the fitness curve in different situation is generated iteratively, as shown in Figure 11.
The points in Figure 11 represent the solutions distributed within the target space as the algorithm evolves to the last generation. As can be seen from Table 4 and Figure 11, the optimization of NSGA-II under different operation modes is ideal and can better reflect the preferences of decision makers. At the same time, the sub-solution set corresponding to each weight has certain diversity.
4.3.4. Optimization Result Analysis
According to the objective function presented in this paper and the three scenarios set by the work presented, we can get the cost composition of the system under different operating conditions. For the multi-energy complementary microgrid system established in this paper, the operating cost of the system is mainly composed of power generation cost and environmental cost. The cost of power generation mainly includes the operation and maintenance cost of the generating unit and the cost of fuel. The environmental cost is mainly the environmental cost due to the discharge of the pollutants. Table 5 shows system cost structure under different operating conditions.
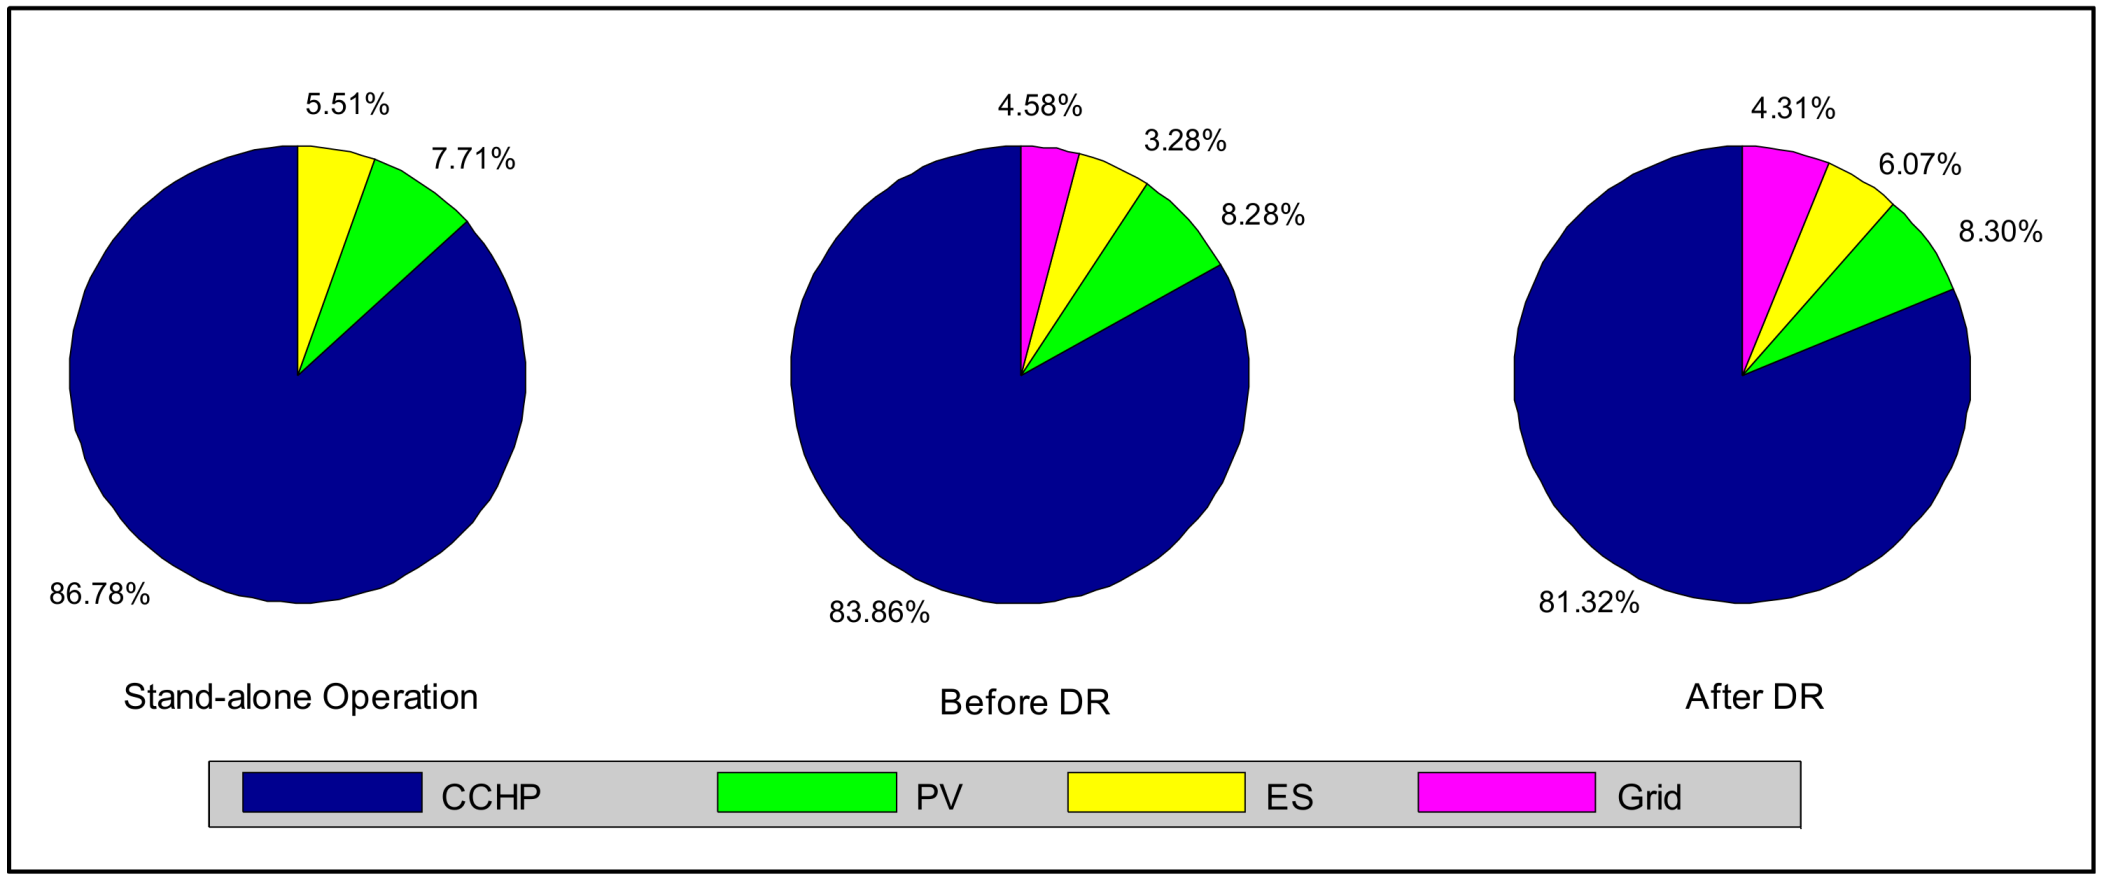
According to Table 4 and optimization results, when the system operates in off-grid, the output of PV system can’t meet the requirements of the system, and the CCHP and the EES are required to supply power to the system, so that the operation cost is high. When the system operates in grid-connected, the system sells excess power in response to changes in electricity prices and to obtain economic benefits, so that the operation cost is lower than that in the off-grid operation. After the DR program, the power from the grid has little change, but the power delivered to grid increases obviously. The amount of electricity sold per day is up to 583.051~803.302 kWh. In the microgrid with PV, ES and CCHP, the operation cost mainly comes from the operation and maintenance cost and fuel cost of the system. The composition of the system cost in different scenarios is shown in Figure 12.
The cost components of the system show significant differences under three operating conditions. As far as the overall trend is concerned, the operating cost of the CCHP system accounts for more than 80% of the total cost of the system, which directly determines the operating effect of the system. And the direct reason for this result is that the price of natural gas fluctuates greatly with the market and the price of industrial gas is higher in China. In addition, the proportion of system cost has also changed significantly with the implementation of demand response strategy.
5. Conclusions
In the work presented, the operation optimization of a multi-energy complementary microgrid containing DG and EES is conducted. Besides these, a demand response model and the optimization model of a microgrid based on TOU price are established, and some research results are obtained. On the one hand, the coordinated optimization strategy of a multi-energy complementary microgrid is designed in this paper, which realizes the optimization of load distribution and system cost minimization in space domain. On the other hand, this paper establishes an integral optimization objective function considering the demand response and user satisfaction constraints, which has a great promotion effect on the economical and efficient operation of the system with the demand response strategy. In addition, on the basis of the operation optimization model presented, this paper makes a more reasonable scheduling for microgrid operation, the building of a microgrid operation, and the optimization results that the optimization strategy can reduce the power consumption of building.
Acknowledgments
This work was supported by “the Fundamental Research Funds for the Central Universities” (2018ZD13).
Author Contributions
All the authors gave equal contributions in writing the paper.
Conflicts of Interest
The authors declare no conflict of interest.
Nomenclature
The parameters in this article are described below.
| the operation cost of system | |
| System gas price, yuan/m3 | |
| I | PV current |
| the equivalent parallel impedance | |
| curve fitting parameter | |
| the current generated by the light and the reflected missing current | |
| the actual depth of discharge | |
| actual capacity | |
| the coefficients of the relationship between electricity and electricity prices | |
| the amount of power and its change | |
| Electricity satisfaction | |
| the output power of the CCHP, kW | |
| the electricity cost of the microgrid during the Scheduling period, yuan/kWh | |
| the power generation efficiency of the CCHP | |
| the heat loss coefficient of the CCHP | |
| the energy exchange power, kW | |
| the core load power in the system/kW | |
| the load lost in the distribution network/kW | |
| the upper limit of the remaining capacity/kW | |
| the maximum value of charging power at time t, kW | |
| maximum value of discharge power at time t, kW | |
| the minimum value of satisfaction with electricity expenditure | |
| the maximum power of DG | |
| the Generation cost, yuan/kW | |
| the equivalent series impedance | |
| the electronic charge | |
| boltzmann constant | |
| the cycle number of stored energy under rated discharge depth and rated discharge current | |
| the actual discharge current ampere hours in the unit of time | |
| the initial investment cost of energy storage | |
| the elastic coefficient of the electricity price | |
| the price and its variation | |
| Electricity expenses satisfaction | |
| the output of DG during the Scheduling period, kw | |
| the operation cost of energy storage, yuan/kWh | |
| the purchase price, yuan/kWh | |
| is the selling price of microgrid in scheduling time, yuan/kWh | |
| the output power of PV system/kW | |
| the power of the adjustable load in the microgrid/kW | |
| the total load involved in demand response scheduling in the system/kW | |
| the power of EES at time t/kW | |
| the total power load of the system | |
| the time period corresponding to the fixed electricity price and the peak-to-valley electricity price | |
| the minimum value of satisfaction with electricity mode |
References
- Zhu, X. Research and Application of Key Technology Based on PCS Intelligent Micro-Grid System; Anhui University: Hefei, China, 2015. [Google Scholar]
- Guo, S.; Zhao, H.; Zhao, H. The Most Economical Mode of Power Supply for Remote and Less Developed Areas in China: Power Grid Extension or Micro-Grid? Sustainability 2017, 9, 910. [Google Scholar] [CrossRef]
- Ming, N.; Wei, H.; Guo, J.; Su, L. Research on Economic Operation of Grid-Connected Micro-grid. Power Syst. Technol. 2010, 34, 38–42. [Google Scholar]
- Hossain, E.; Perez, R.; Padmanaban, S.; Mihet-Popa, L.; Blaabjerg, F.; Ramachandaramurthy, V.K. Sliding Mode Controller and Lyapunov Redesign Controller to Improve Microgrid Stability: A Comparative Analysis with CPL Power Variation. Energies 2017, 10, 1959. [Google Scholar] [CrossRef]
- Yuan, Y.; Li, Z.; Feng, Y.; Zuo, W. Development purposes, orientations and prospects of Micro-grid in China. Auto. Electr. Power Syst. 2010, 34, 59–63. (In Chinese) [Google Scholar]
- Okewu, E.; Misra, S.; Maskeliūnas, R.; Damaševičius, R.; Fernandez-Sanz, L. Optimizing Green Computing Awareness for Environmental Sustainability and Economic Security as a Stochastic Optimization Problem. Sustainability 2017, 9, 1857. [Google Scholar] [CrossRef]
- Zhang, J.; Su, L.; Chen, Y.; Jing, S.U.; Wang, L. Energ management of Micro-grid and its control strategy. Power Syst. Technol. 2011, 35, 24–28. (In Chinese) [Google Scholar]
- Zhao, Z.; Lee, W.C.; Shin, Y.; Song, K.B. An Optimal Power Scheduling Method Applied in Home Energy Management System Based on Demand Response. ETRI J. 2013, 4, 1391–1400. [Google Scholar] [CrossRef]
- Jin, M.; Feng, W.; Liu, P.; Marnay, C.; Spanos, C. MOD-DR: Micro-grid optimal dispatch with demand response. Appl. Energy 2017, 187, 758–776. [Google Scholar] [CrossRef]
- Brearley, B.J.; Prabu, R.R. A review on issues and approaches for Micro-grid protection. Renew. Sustain. Energy Rev. 2017, 67, 988–997. [Google Scholar] [CrossRef]
- Meghwani, A.; Srivastava, S.; Chakrabarti, S. A Non-Unit Protection Scheme for DC Micro-grid Based on Local Measurements. IEEE Trans. Power Deliv. 2017, 32, 172–181. [Google Scholar] [CrossRef]
- Wang, F.; Zhou, L.; Ren, H.; Liu, X. Search Improvement Process-Chaotic Optimization-Particle Swarm Optimization-Elite Retention Strategy and Improved Combined Cooling-Heating-Power Strategy Based Two-Time Scale Multi-Objective Optimization Model for Stand-Alone Microgrid Operation. Energies 2017, 10, 1936. [Google Scholar] [CrossRef]
- Okoye, C.O.; Oranekwu-Okoye, B.C. Economic feasibility of solar PV system for rural electrification in Sub-Sahara Africa. Renew. Sustain. Energy Rev. 2018, 82, 2537–2547. [Google Scholar] [CrossRef]
- Igualada, L.; Corchero, C.; Cruz-Zambrano, M.; Heredia, F.J. Optimal Energy Management for a Residential Microgrid Including a Vehicle-to-Grid System. Available online: https://upcommons.upc.edu/handle/2117/20642 (accessed on 25 March 2018).
- Li, W.T.; Yuen, C.; Hassan, N.U.; Tushar, W.; Wen, C.K.; Wood, K.L.; Hu, K.; Liu, X. Demand Response Management for Residential Smart Grid: From Theory to Practice. Available online: http://xueshu.baidu.com/s?wd=paperuri%3A%28c31a841b8e868b2ef596e1524f3b5937%29&filter=sc_long_sign&tn=SE_xueshusource_2kduw22v&sc_vurl=http%3A%2F%2Fieeexplore.ieee.org%2Fdocument%2F7336481%2F&ie=utf-8&sc_us=15685181391879326455 (accessed on 25 March 2018).
- Saffari, M.; Gracia, A.D.; Fernández, C.; Belusko, M.; Boer, D.; Cabeza, L.F. Optimized demand side management (DSM) of peak electricity demand by coupling low temperature thermal energy storage (TES) and solar PV. Appl. Energy 2018, 211, 604–616. [Google Scholar] [CrossRef]
- Wang, P.; Wang, W.; Meng, N.; Liu, H.; Feng, H.; Xu, D. Optimal sizing of DC micro-grids based on comprehensive evaluation of operating modes and operating targets. Power Syst. Technol. 2016, 40, 741–748. [Google Scholar]
- Xin, A.I.; Xiao, L. Chance constrained model for wind power usage based on demand response. J. North China Electr. Power Univ. 2011, 3, 4. [Google Scholar]
- Zhang, D.; Tong, Y.; Jin, X.; Liang, J. Optimal energy storage configuration of Micro-grid considering demand response. Power Electr. 2016, 50, 107–109. [Google Scholar]
- Yu, Y.; Wen, X.; Zhao, J.; Xu, Z.; Li, J. Co-Planning of Demand Response and Distributed Generators in an Active Distribution Network. Energies 2018, 11, 354. [Google Scholar] [CrossRef]
- Pan, Z.; Gao, C. Economic dispatch of electric vehicles based on demand response. Electr. Power Constr. 2015, 36, 139–145. (In Chinese) [Google Scholar]
- Li, Y.; Luo, Q.; Song, Y.Q.; Xu, J.; Cai, L.; Gu, J. Study on tiered level determination of TOU & tiered pricing for residential electricity based on demand response. Power Syst. Prot. Control 2012, 40, 65–74. (In Chinese) [Google Scholar]
- Fan, W.; Zhou, N.; Liu, N.; Lin, X.; Zhang, J.; Lei, J. Multi-objective optimization operation method of user -side Micro-grid based on demand response. Power Syst. Clean Energy 2016, 32, 17–23. [Google Scholar] [CrossRef]
- Gao, C.; Li, Q.; Li, H.; Zhai, H.; Zhang, L. Integration method and operation mechanism of demand response resources based on load aggregator business. Auto. Electr. Power Syst. 2013, 37, 78–86. [Google Scholar]
- Lu, X.; Sun, K.; Huang, L.; Xiao, X.; Guerrero, J.M. The improved droop control method of distributed energy storage system in islanding AC Micro-grid. Electr. Power Syst. Auto. 2013, 37, 80–185. [Google Scholar] [CrossRef]
- Abdelaziz, M.M.A.; Farag, H.E.; El-Saadany, E.F. Optimum Reconfiguration of Droop-Controlled Islanded Micro-grids. IEEE Trans. Power Syst. 2016, 31, 2144–2153. [Google Scholar] [CrossRef]
- Paterakis, N.G.; Erdinç, O.; Catalão, J.P.S. An overview of Demand Response: Key-elements and international experience. Renew. Sustain. Energy Rev. 2017, 69, 871–891. [Google Scholar] [CrossRef]
- Mengelkamp, E.; Gärttner, J.; Rock, K.; Kessler, S.; Orsini, L.; Weinhardt, C. Designing micro-grid energy markets. Appl. Energy 2018, 210, 870–880. [Google Scholar] [CrossRef]
- Zhou, N.; Fan, W.; Liu, N.; Zhang, J.; Lei, J. Battery storage multi-objective optimization for capacity configuration of PV-based Micro-grid considering demand response. Power Syst. Technol. 2016, 40, 1709–1716. [Google Scholar]
- Alamaniotis, M.; Tsoukalas, L.H. Integration of Price Anticipation and Self-Elasticity for Purchase Decisions and Planning in Price Directed Electricity Markets; IET: Stevenage, UK, 2016. [Google Scholar]
- Chen, C.; Hu, B.; Xie, K.; Wan, L.; Xiang, B. A peak-valley TOU price model considering power system reliability and power purchase risk. Power Syst. Technol. 2014, 38, 2141–2148. [Google Scholar]
- Bie, Z.; Hu, G.; Xie, H.; Gengfeng, L. Optimal dispatch for wind power integrated systems considering demand response. Autom. Electr. Power Syst. 2014, 38, 115–120. [Google Scholar] [CrossRef]
- Khierkhah, A.S.; Nobari, A.; Hajipour, V. A Pareto-based approach to optimise aggregate production planning problem considering reliable supplier selection. Int. J. Serv. Oper. Manag. 2018, 29, 59. [Google Scholar] [CrossRef]
- Sun, Y.; Lin, F.; Xu, H. Multi-objective Optimization of Resource Scheduling in Fog Computing Using an Improved NSGA-II. Wirel. Pers. Commun. 2018, 1, 1–17. [Google Scholar] [CrossRef]
- Liu, W.; Niu, S.; Xu, H. Optimal Planning of Battery Energy Storage Considering Reliability Benefit and Operation Strategy in Active Distribution System. Available online: https://www.researchgate.net/publication/301664508_Optimal_planning_of_battery_energy_storage_considering_reliability_benefit_and_operation_strategy_in_active_distribution_system (accessed on 25 March 2018).
- Chen, X.; Yin, J.; Wang, W.; Wu, L.; Tang, F. Approaches to diminish large unsprung mass negative effects of wheel side drive electric vehicles. J. Adv. Mech. Des. Syst. Manuf. 2016, 10, JAMDSM0064. [Google Scholar] [CrossRef]
Figure 1.
Typical structure of a multi-energy microgrid.

Figure 2.
Flow chart of microgrid optimization model.

Figure 3.
The flow chart of the NSGA-II based on demand response.

Figure 4.
Daily variation curves of micropower and load.

Figure 5.
Load curve before and after DR.

Figure 6.
Electric vehicles load before and after DR.

Figure 7.
Lighting Load before and after DR.

Figure 8.
The output of micropower in Scene 1.

Figure 9.
The output of micropower in Scene 2.

Figure 10.
The output of micropower in Scene 3.

Figure 11.
Adaptive curve and Pareto optimization frontier of NASG-II.

Figure 12.
Composition of the system cost in different scenarios.


Table 1.
Sectional electricity price of demand response.
| Time Windows | Price (Yuan/kWh) | ||
|---|---|---|---|
| Low Price | Medium Price | High Price | |
| 0:00~6:00 18:00~24:00 | 6:00~10:00 15:00~18:00 | 10:00~15:00 | |
| Purchase | 0.5522 | 0.8185 | 1.2035 |
| Sell | 0.65 | 0.65 | 0.65 |
Table 2.
Parameters of relation curve between electricity and electricity price.
| Time | Low Price | Medium Price | High Price |
|---|---|---|---|
| (6.5,65) | (5.0,60) | (4.0,58) |
Table 3.
Load characteristics before and after DR.
| Situations | Peak of Load/kW | Valley of Load/kW | Peak-Valley Difference of Load/kW | ||
|---|---|---|---|---|---|
| Before DR | 1136.93 | 330.31 | 806.62 | 1 | 0 |
| After DR | 1100.19 | 326.15 | 774.04 | 0.97 | 0.75 |
Table 4.
Extreme solutions and the average operation time under different operation modes of the microgrid.
Table 4.
Extreme solutions and the average operation time under different operation modes of the microgrid.
| Scenarios | Optimization Result/Yuan | NSGA-II | |
|---|---|---|---|
| Scene 1: TOU price | Generation cost | optimal value | 46.980 |
| Average value | 47.206 | ||
| Environmental cost | optimal value | 1.246 | |
| Average value | 1.255 | ||
| Scene 2: fixed price | Generation cost | optimal value | 45.450 |
| Average value | 47.268 | ||
| Environmental cost | optimal value | 1.538 | |
| Average value | 1.541 | ||
| Scene 3: isolated grid mode | Generation cost | optimal value | 50.4 |
| Average value | 51.685 | ||
| Environmental cost | optimal value | 1.325 | |
| Average value | 1.336 | ||
| Optimized time records/s | Average value | 19.675 | |
Table 5.
System cost structure under different operating conditions.
| Cost/Yuan | Generation Cost/Yuan | Environmental Cost/Yuan | Operation Cost/Yuan | ||||
|---|---|---|---|---|---|---|---|
| CCHP | PV | EES | Electricity Exchange | ||||
| Purchase | Sell | ||||||
| Scene 1 | 12,600 | 1120 | 800 | 0 | 0 | 381.3 | 14,901.3 |
| Scene 2 | 12,260 | 1120 | 770 | 250 | −870 | 359.9 | 13,889.9 |
| Scene 3 | 12,510 | 1120 | 820 | 240 | −1600 | 443.7 | 13,533.7 |
© 2018 by the authors. Licensee MDPI, Basel, Switzerland. This article is an open access article distributed under the terms and conditions of the Creative Commons Attribution (CC BY) license (http://creativecommons.org/licenses/by/4.0/).
Share and Cite
MDPI and ACS Style
Wang, Y.; Huang, Y.; Wang, Y.; Yu, H.; Li, R.; Song, S. Energy Management for Smart Multi-Energy Complementary Micro-Grid in the Presence of Demand Response. Energies 2018, 11, 974. https://doi.org/10.3390/en11040974
AMA Style
Wang Y, Huang Y, Wang Y, Yu H, Li R, Song S. Energy Management for Smart Multi-Energy Complementary Micro-Grid in the Presence of Demand Response. Energies. 2018; 11(4):974. https://doi.org/10.3390/en11040974
Chicago/Turabian StyleWang, Yongli, Yujing Huang, Yudong Wang, Haiyang Yu, Ruiwen Li, and Shanshan Song. 2018. "Energy Management for Smart Multi-Energy Complementary Micro-Grid in the Presence of Demand Response" Energies 11, no. 4: 974. https://doi.org/10.3390/en11040974
Note that from the first issue of 2016, this journal uses article numbers instead of page numbers. See further details here.