Investigation of In-Cylinder Steam Injection in a Turbocharged Diesel Engine for Waste Heat Recovery and NOx Emission Control


School of Mechanical and Automotive Engineering, South China University of Technology, Guangzhou 510641, China
*
Author to whom correspondence should be addressed.
Energies 2018, 11(4), 936; https://doi.org/10.3390/en11040936
Submission received: 17 March 2018
/
Revised: 9 April 2018
/
Accepted: 11 April 2018
/
Published: 14 April 2018
(This article belongs to the Section I: Energy Fundamentals and Conversion)
Abstract
:In this study, an in-cylinder steam injection method is introduced and applied to a turbocharged diesel engine for waste heat recovery and NOx emission reduction. In the method, cool water was first heated into superheated steam by exhaust. Then the superheated steam was directly injected into the cylinder during the compression stroke. The potential for fuel savings and NOx emission reduction obtained by this method was investigated. First, a two-zone combustion model for the baseline engine was established and calibrated with the experimental data. Based on the model, the effects of steam injection mass, temperature, and timing on engine performance and NOx emission were investigated. The results demonstrate that in-cylinder steam injection can improve engine performance and reduce NOx emissions significantly at all engine speeds. Optimal steam injection mass is obtained under full load at engine speed from 1000 rpm to 1900 rpm when the steam injection timing and temperature are −30° and 550 K, respectively. Under those conditions, engine torque is increased by 9.5–10.9%, brake-specific fuel consumption (BSFC) is reduced by 8.6–9.9%, and NOx emission is decreased by 83.4–91.8%. Steam injection mass and injection timing are the main parameters that significantly affect engine performance and NOx emission.
1. Introduction
At present and in the short to medium term, internal combustion engines are major power sources for various mechanical devices. As fuel consumption and emissions regulations are becoming more stringent, energy saving and emissions reduction have become the impetus for development and the goal of modern internal combustion engines [1,2]. Various technologies have been proposed to achieve this goal, such as turbocompounding [3], Miller cycle [4], exhaust gas recirculation (EGR) [5], waste heat recovery [6,7], use of alternative fuel [8], and so on. Water injection, another useful technology to improve engine performance and reduce emissions, has also been widely researched.
Water injection was initially proposed to reduce emissions of nitrogen oxides (NOx). Since the latent heat of water evaporation is large, the maximum in-cylinder temperature will be reduced remarkably with water injection, which is good for reducing NOx emissions. However, with water injection, the combustion in the cylinder will be greatly suppressed. The ignition delay will be prolonged and the maximum in-cylinder pressure will decrease significantly. As a result, the engine’s thermal efficiency will drop remarkably. Tesfa et al. [9] investigated the influence of water injection at the intake manifold on the performance and emission characteristics of a compression ignition engine running with biodiesel. It was shown that up to 50% reduction of NOx emissions was obtained with water injection at a rate of 3 kg/h. However, at low load operations, brake-specific fuel consumption (BSFC) increased by a maximum of 4% and thermal efficiency decreased by a maximum of 3% with water injection. The effects of water injection at the intake manifold on the combustion and emissions of a diesel engine were experimentally studied by Tauzia et al. [10]. NOx emissions were reduced by 50%, with a water injection mass of about 60–65% of the fuel. However, since the combustion was delayed, the engine’s global efficiency decreased.
It seems that water injection combined with other measures can effectively improve the thermal efficiency and reduce the knock tendency of the gasoline engine. Therefore, a higher compression ratio and larger ignition advance angle can be accepted to further improve the engine’s thermal efficiency. To reduce the knock tendency and improve the fuel economy of gasoline engines, Bozza et al. [11] studied the impact of water injection at the intake port of a gasoline engine by a one-dimensional (1-D) approach. It was shown that water injection reduced the knock tendency in the gasoline engine remarkably, which made it possible to advance the combustion phase and avoid overfueling the mixture. BSFC was reduced by 25–30% at low/medium speed operating points with water injection. Kim et al. [12] investigated the effects of direct water injection on the performance of a 1.6 L naturally aspirated gasoline engine. The knock caused by the high compression ratio was mitigated by water injection. The larger spark advance angle allowed BSFC to reduce. At engine speeds of 1500–2000 rpm, BSFC was reduced by 16–17% when water injection mass and ignition timing were both optimal values. The potential of water injection to reduce knock sensitivity and improve efficiency in a direct injection gasoline engine was studied by Hoppe et al. [13]. Engine efficiency improved up to 4.5% in the region of the minimum BSFC when water injection was combined with the Miller cycle and the lean burn operation.
In addition, engine efficiency may be further improved when water injection is combined with waste heat recovery. The oxyfuel internal combustion engine with direct water injection for waste heat recovery was investigated by Wu et al. [14,15]. In that study, the water was heated by the engine coolant and exhaust gas before being injected into the cylinder. In this way, the working fluid and energy in the cylinder increased, resulting in higher thermal efficiency. Thermal efficiency increased from 32.1% to 41.5% under appropriate test conditions when water injection was applied. In Conklin and Szybist’s study [16], a six-stroke engine concept with water injection for in-cylinder exhaust heat recovery was proposed. A portion of exhaust remained in the cylinder after the normal exhaust stroke and was recompressed. Then the water was injected into the cylinder, absorbing heat from the exhaust and expanding to improve the power output. In a conventional gasoline engine, the mean effective pressure obtained by the additional power stroke ranged from 0.75 to 2.5 bars. Arabaci et al. [17] studied the effects of direct water injection on six-stroke engine performance. Brake power increased by 10% and specific fuel consumption decreased by 9% with water injection. In addition, nitric oxide (NO) emissions decreased with water injection as the in-cylinder temperature decreased at the end of a cycle.
However, although water injection combined with larger ignition advance, higher compression ratio, or waste heat recovery can improve engine efficiency, it absorbs a great deal of heat during the evaporation process. As a result, the in-cylinder temperature and pressure will be reduced, which does not provide benefit for further increasing engine efficiency. In addition, a corrosion problem will be caused by water injection.
Compared with water injection, steam injection seems to be a good way to solve the corrosion problem and further increase the engine’s thermal efficiency. In this method, the water is heated into steam by the waste heat of the coolant and exhaust before injection. In the study of Parlak et al. [18], the water was heated to saturated water and then injected into the intake manifold to generate steam. It was shown that NOx emissions reduced by up to 33%, engine power increased by up to 3%, and BSFC decreased by up to 5% at full load operation. With a similar steam injection method, Cesur et al. [19] studied the effects of steam injection on the performance of a spark ignition engine. The water was pressured and heated to saturated water under conditions of 3 bar and 133.5 °C and then injected into the intake manifold. It was shown that engine torque increased by 4.65% at 3200 rpm and BSFC reduced by 6.44% at 2000 rpm. In addition, NO emissions reduced by 40% at 2800 rpm and hydrocarbon (HC) emissions reduced by 31.5% at 2000 rpm. Kokkulunk et al. [20] investigated the impact of the same steam injection method as Parlak et al. [18] on a diesel engine. Engine-specific fuel consumption reduced by up to 6.1% at 2400 rpm and NO emissions reduced by up to 22.4% at 1200 rpm. Kokkulunk et al. [21] studied the effects of intake manifold steam injection combined with exhaust gas recirculation (EGR) on a diesel engine. NOx emissions reduced by 48.3% with the combination of steam injection and EGR, compared with steam injection alone. However, specific fuel consumption increased by 3.5%. With the same steam injection method as Parlak et al. [18], Gonca et al. [22,23,24] investigated the influence of intake manifold steam injection on an engine running with various kinds of alternative fuels. Different degrees of improvement of engine performance were obtained by this method. Gonca et al. [25,26,27,28,29] studied the effects of intake manifold steam injection combined with the Miller cycle and turbocharging on a diesel engine. The studies showed that engine performance and emissions improved significantly when the three technologies were combined. With 10 CA retardation, 20% steam ratio of the fuel mass, and 1.1 bar charging pressure, brake power and brake thermal efficiency increased by 17% and 11%, respectively. In addition, NO, HC, carbon monoxide (CO), and carbon dioxide (CO2) emissions reduced by 48%, 35%, 64%, and 8%, respectively [29].
For the steam injection method [18,19,20,21,22,23,24,25,26,27,28,29], water is injected into the intake manifold as saturated water and then changes into steam. A lot of thermal energy is needed for this process. However, the temperature in the intake manifold is lower than that of the saturated water. Therefore, the saturated water cannot completely evaporate in the intake manifold. The corrosion problem will still occur with this method. In addition, the enthalpy increase of water is relatively small when the water is just heated into saturated water by exhaust. For instance, the specific enthalpy of water is 125.82 kJ/kg at 1 bar and 30 °C, and it is 561.43 kJ/kg at 3 bar and 133.5 °C. However, if water is heated into saturated steam at 3 bar, specific enthalpy goes up to 2724.9 kJ/kg. Therefore, recovery of the exhaust energy is limited by this method. Besides, the saturated water evaporates and expands in the intake manifold and the air intake temperature increases. As a result, the air intake flow rate will decrease with steam injection at the intake manifold, which does not provide benefit for increased engine power.
In addition to steam injection into the engine, steam injection at the inlet of the turbine was also investigated for waste heat recovery. Fu et al. [30,31,32] compared two new types of turbocharging concepts, steam turbocharging and steam-assisted turbocharging, with conventional exhaust turbocharging. In the steam turbocharging method, the exhaust is used to heat up the water and generate steam. Then the steam is used to drive the turbine for turbocharging [31]. In the steam-assisted turbocharging method, the mixture of exhaust and steam goes through the turbine for turbocharging [32]. The studies show that both steam turbocharging and steam-assisted turbocharging obtained better performance at low engine speeds. The effects of pre-turbine steam injection on engine performance were studied by Zhu et al. [33,34]. In their method, the water was heated into superheated steam by engine waste heat and then injected at the pre-turbine to increase the boost pressure of the fresh air. With a steam/exhaust gas mass flow ratio of 0.1, 5.9% improvement in fuel economy was obtained at the middle speed of 1500 rpm. However, fuel economy was reduced by 1.3% at the rated speed of 2100 rpm. Further, combined with the Miller cycle, fuel economy at the rated speed could be improved by 2.8%. Steam injection combined with turbocompounding was investigated by Zhao et al. [35] to recover more heat from the exhaust. A 2.2–6.15% reduction of fuel consumption was obtained by steam injection over all speed conditions compared with the baseline turbocompound engine.
However, since steam does not participate in the combustion process in the cylinder, steam injection at the inlet of the turbine cannot impact the generation of emissions. Besides, pre-turbine steam injection will cause an increase in exhaust back pressure, which will result in increased engine pumping loss.
In order to make effective use of waste heat to further reduce fuel consumption and NOx emissions, an in-cylinder steam injection method is proposed and applied to a turbocharged diesel engine in the present study. First, a zero-dimension (0-D) two-zone combustion model is established and calibrated with the experimental data. Then the influence of steam injection mass, temperature, and timing on engine performance and NOx emissions is discussed. Finally, the potential of in-cylinder steam injection for improving engine performance and NOx reduction is evaluated.
2. Simulation Model
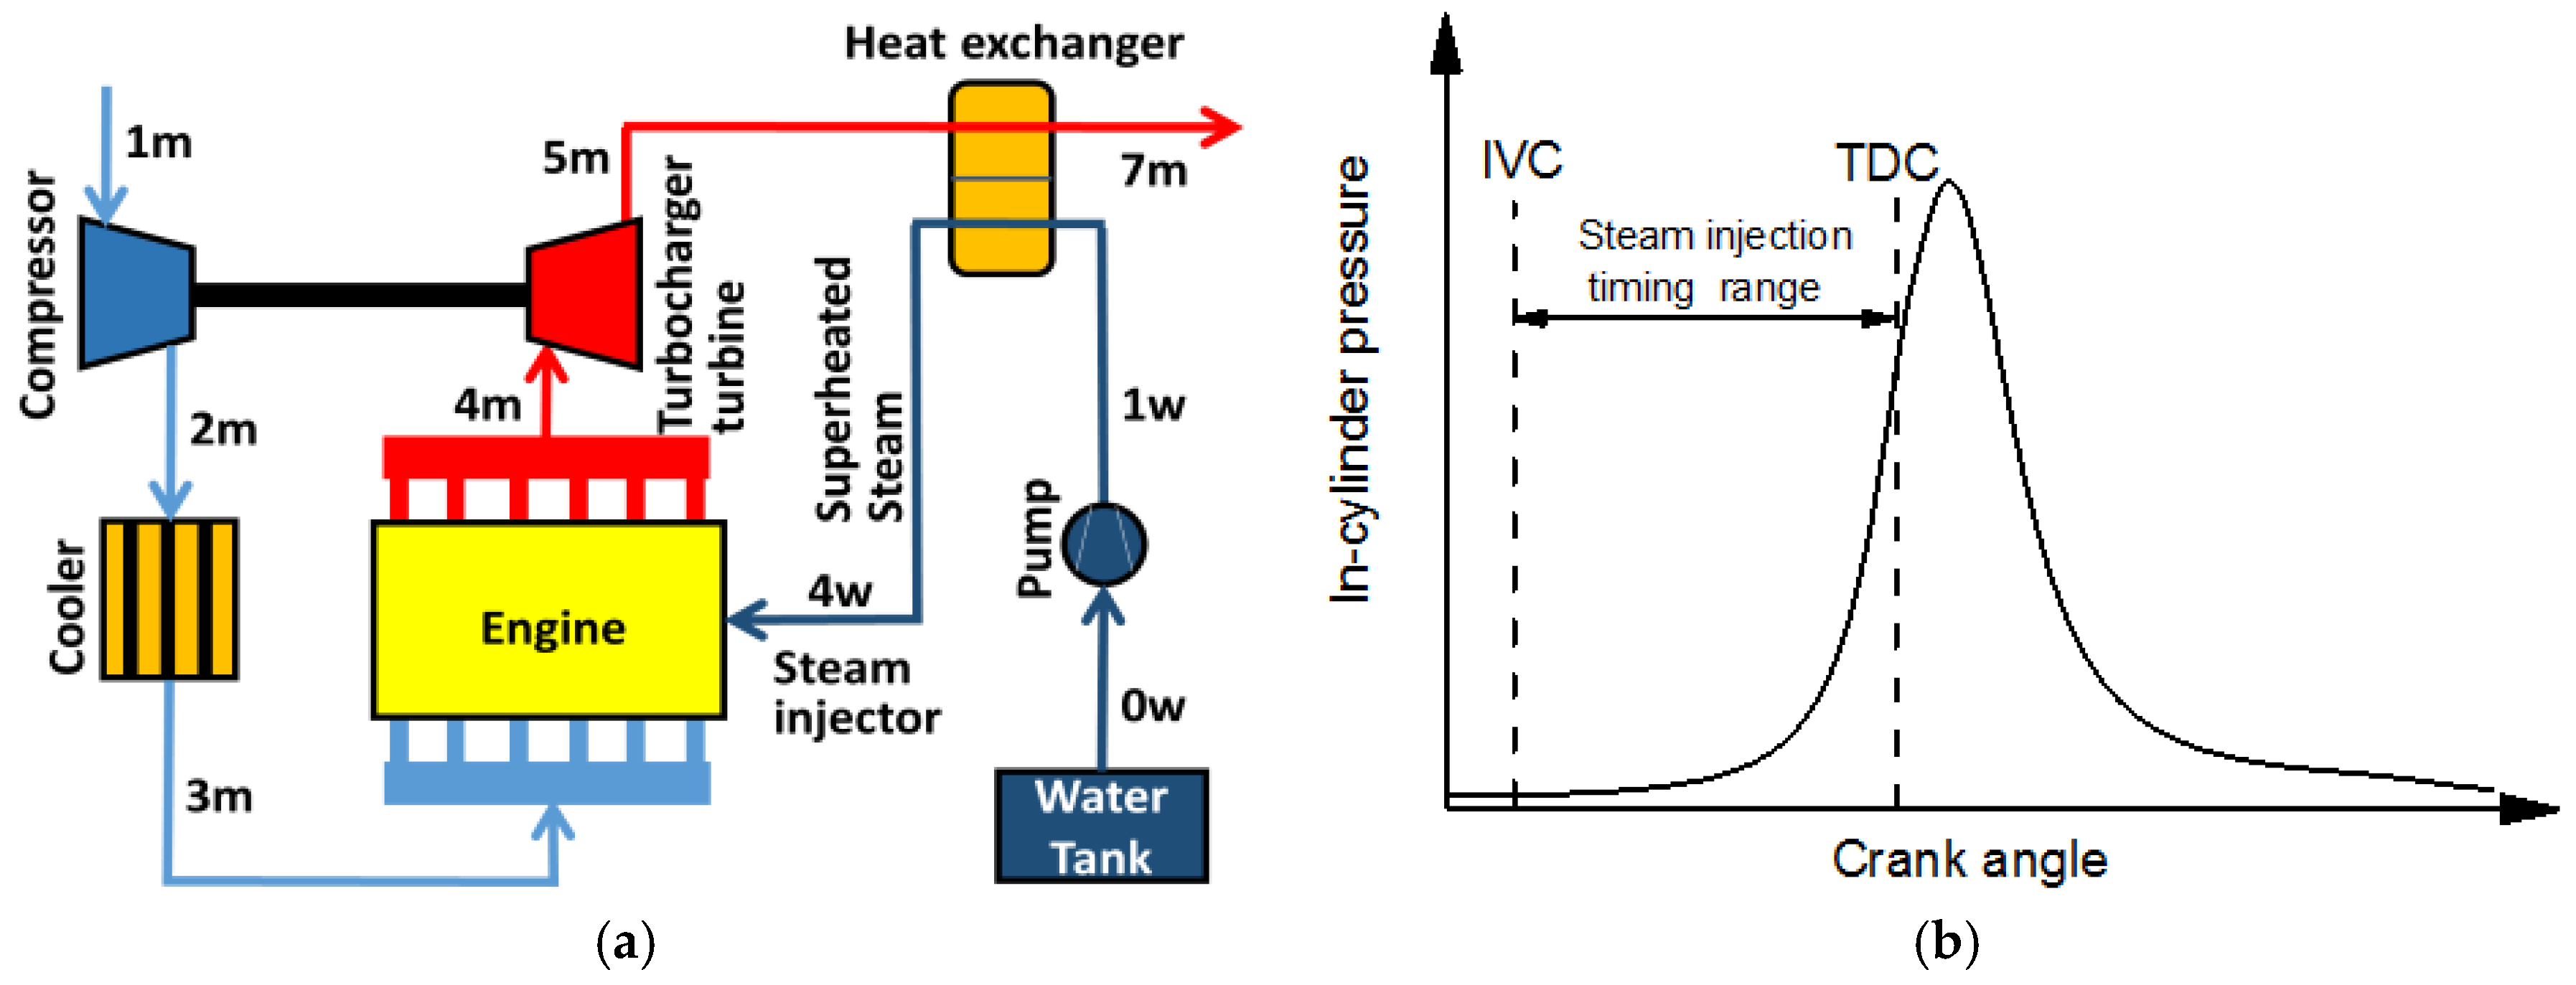
The schematic of the turbocharged diesel engine with in-cylinder steam injection is shown in Figure 1a. First, room-temperature water was pressured by a pump. Then the water was heated into superheated steam in the heat exchanger by the exhaust. In the changing of liquid water into superheated steam, the enthalpy of the water greatly increased by absorbing lots of thermal energy from the exhaust. After that, the superheated steam was directly injected into the cylinder during the compression stroke. The crank angle range that the steam can be injected into the cylinder is shown in Figure 1b. The injection timing ranges from inlet valve closed (IVC) to top dead center (TDC). Since the in-cylinder pressure near TDC is ultra-high, it is not easy to inject steam into the cylinder under these conditions. Therefore, the latest injection timing is set before TDC. With steam injection, the thermodynamics cycle in the cylinder will change. Therefore, the engine performance and NOx emissions will be influenced by the in-cylinder steam injection method. In addition, the corrosion problem will be prevented by this method.
2.1. Engine Model Description
The impact of in-cylinder steam injection on turbocharged diesel engine performance and NOx emissions was evaluated by an engine simulation model. The simulation model was established by using GT-POWER commercial software. In the model, 1-D unsteady flows are used to describe the flows in the intake pipe and exhaust and the 0-D two-zone combustion model is adopted to describe the energy conversion in the cylinder. Based on the first law of thermodynamics, the energy conservation in the cylinder can be expressed as Equation (1):
The internal energy can be expressed as Equation (2) and the constant volume specific heat is calculated using Equation (3):
By substituting Equation (3) and the equation of state as shown in Equation (4) into Equation (2), Equation (5) can be obtained. By taking derivatives of Equation (5) with respect to crank angle, Equation (5) can be expressed in the form of Equation (6):
Combining Equations (1) and (6), Equation (7) is obtained. From Equation (7), the in-cylinder pressure is related to the heat release rate of the fuel, heat transferred to the cylinder wall, stroke volume, and specific heat ratio.
To accurately predict combustion at the premixed stage, main stage, and tail stage, a three-term Wiebe function is adopted to describe the heat release rate in the cylinder. The Wiebe function is presented in Equation (8). The combustion duration and shape factor s are the key factors affecting the shape of the curve of the heat release rate.
An assumption is made in the model that steam injection has no impact on the heat release rate. Since the combustion in the cylinder is complexly impacted by steam injection, it is hard to give the functional relationship between the heat release rate and the steam. Future work should be carried out to study the impact of steam injection on combustion in the cylinder.
Based on Fourier’s law, the heat transferred to the cylinder wall can be calculated by Equation (9), and the coefficient of the heat transfer is estimated based on the Woschni model, as shown in Equation (10):
The stroke volume depending on the crank angle can be expressed as Equation (11):
As for the specific heat ratio, it is influenced by the components of the in-cylinder working fluids. Specific heat ratio will change remarkably after steam injection into the cylinder. The specific heat ratio of the mixture in the cylinder can be expressed as Equation (12), and the mole fraction of the steam can be obtained from Equation (13):
According to Equations (7) and (12), because of the changed specific heat ratio, in-cylinder pressure will be significantly changed by steam injection.
The in-cylinder temperature will also be remarkably influenced by steam injection. Another assumption is made in the model that the steam instantaneously mixes with the air when it is injected into the cylinder. Thus, the in-cylinder temperature after mixing can be expressed by Equation (14):
Therefore, because the in-cylinder pressure and temperature are notably affected, engine performance and NOx emissions will be influenced by in-cylinder steam injection.
2.2. NOx Formation Kinetic Model
NOx emissions produced in the cylinder are mainly thermal NO. The principal source of NO is oxidation of atmospheric nitrogen. As the consideration of chemical equilibrium cannot correctly predict NO concentration, a generally accepted kinetics formation scheme described by an extended Zeldovich model [36] is used in this study. The reactions of the extended Zeldovich model are shown in Reactions (15)–(17):
Therefore, the NO formation rate can be expressed as Equation (18):
where , , , , [] is the concentration of the component, and is the equilibrium concentration of the component.
According to Reactions (15)–(17), in-cylinder temperature and O2 concentration are the major factors that influence the formation of NOx emissions, and both are impacted by steam injection. Apart from these factors, it should be noted that the NOx emission kinetics formation scheme may be changed by steam injection. Even though H2O as a combustion product already exists in the cylinder, the amount is small. However, there is a lot of H2O participating in the reactions of NOx emission formation when the steam injection is introduced. Due to the immaturity of investigations into NOx emission kinetics formation with H2O, it does not consider this impact in the model. It may make predictions of NOx emissions with in-cylinder steam injection drift from the actual results. Future research should be conducted on the influence of lots of H2O on the formation mechanism of NOx emissions.
2.3. In-Cylinder Steam Injection Subsystem
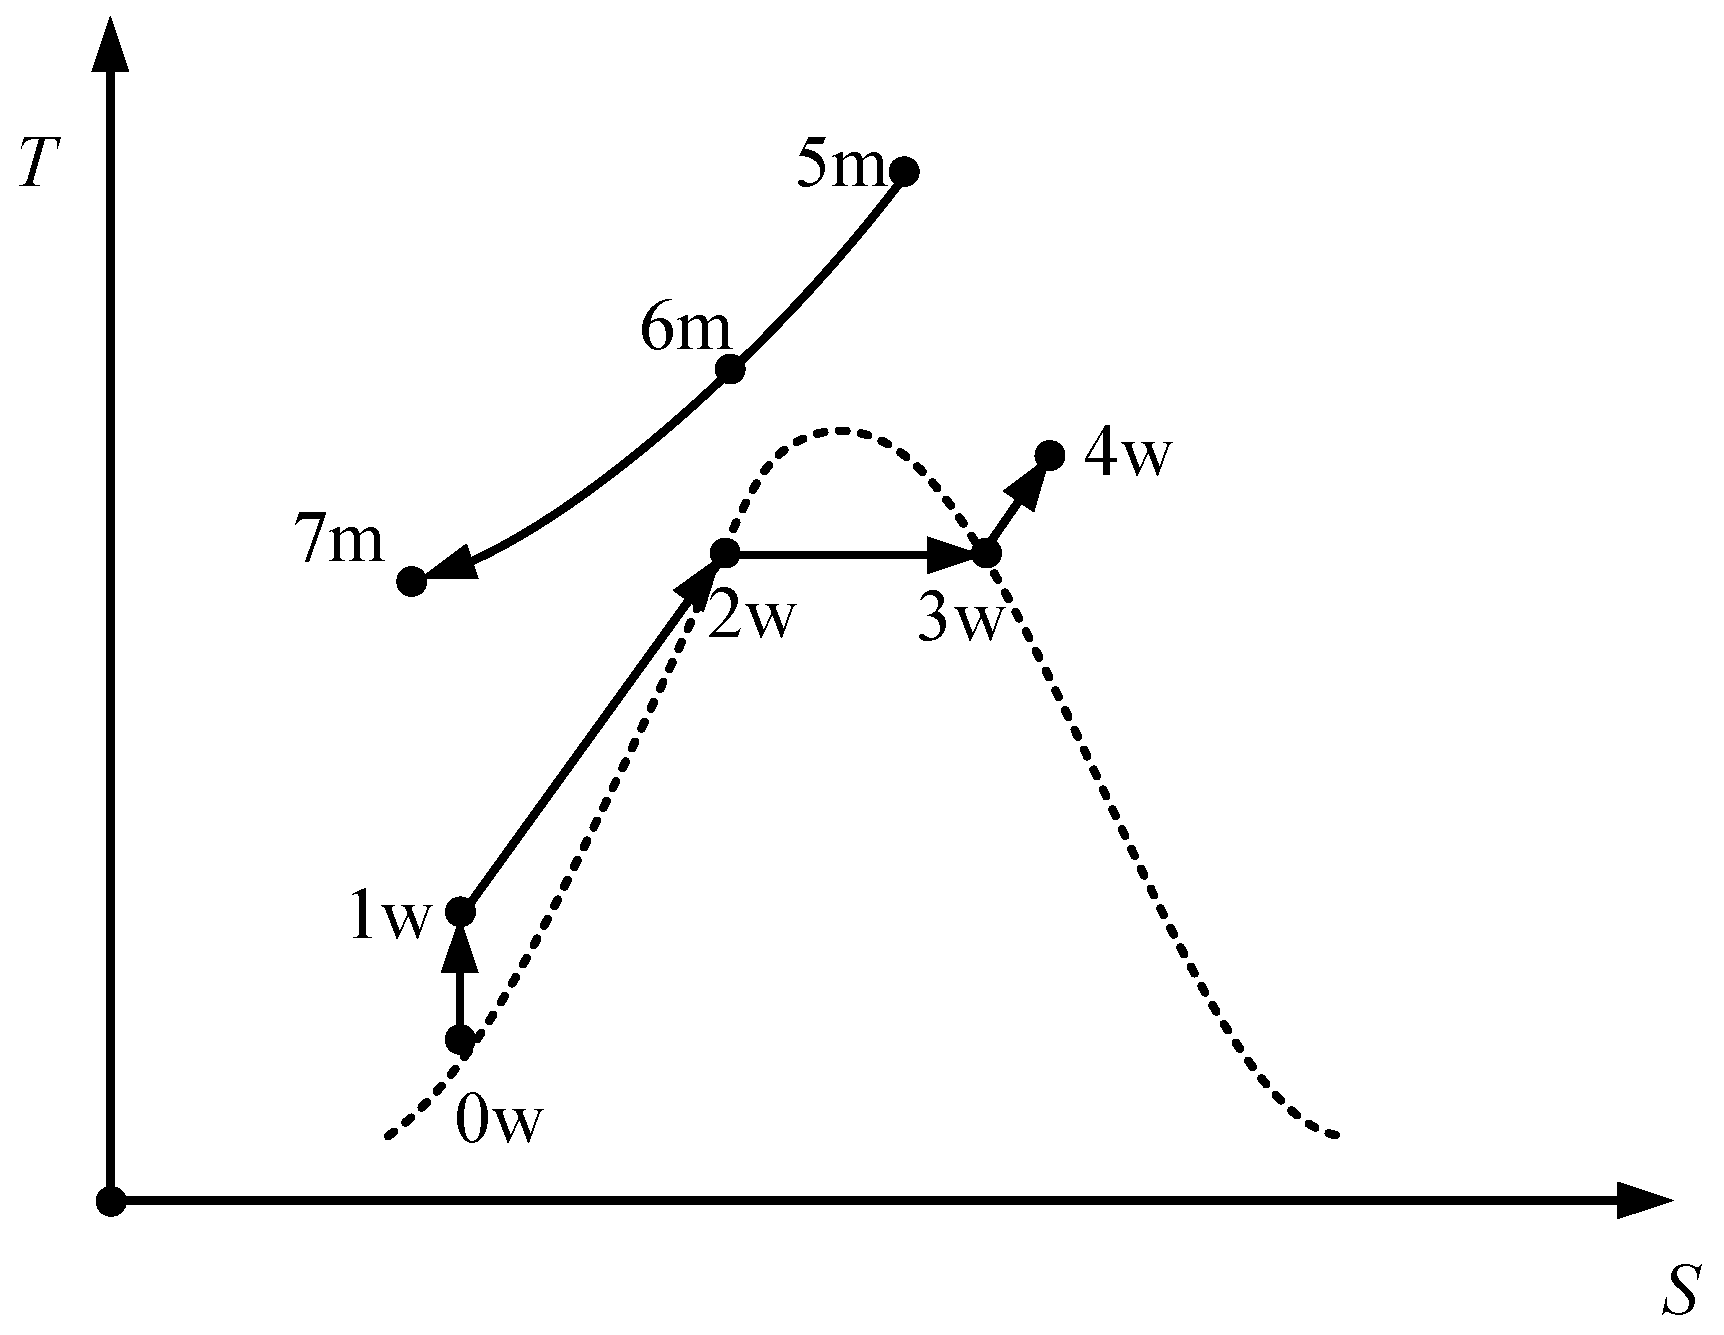
The heat exchange between exhaust and water directly affects the enthalpy of superheated steam. The process of generating superheated steam in the heat exchanger is given in Figure 2, using an enthalpy-entropy (T-S) diagram.
Before the room-temperature water is heated in the heat exchanger, it is first pressured by pump from point 0w to point 1w. In this process, the enthalpy of the water increases, thus more power is consumed by the pump to compress the water. The power consumed by the pump can be calculated by Equation (19):
According to the definition of enthalpy, it can be expressed as Equation (20):
By substituting Equation (20) into Equation (19), Equation (21) is obtained. Since the temperature and volume of the water change only a little after compression, Equation (21) can be simplified as Equation (22):
It can be seen from Equation (22) that as the water pressure increases, the power consumed by the pump also increases. However, in order to inject steam into the cylinder, the steam injection pressure needs to be higher than the in-cylinder pressure at the steam injection timing. Besides, according to the properties of water, the evaporating temperature will increase when the pressure increases. Therefore, the minimum temperature of steam injection will increase as the injection pressure increases. (The properties of water can be obtained by using REFPROP [37], developed by the US National Institute of Standards and Technology.)
After the room-temperature (300 K) water is pressured by pump, it is heated into superheated steam from point 1w to point 4w by exhaust in the heat exchanger, as shown in Figure 1a. In this process, the enthalpy of water rises sharply. Based on the first law of thermodynamics, the heat exchange between water and exhaust can be expressed as Equation (23):
It can be seen from Equation (23) that the heat transfer capacity of the heat exchanger is large when the water is heated into superheated steam. Therefore, to ensure the heat transfer capacity of the heat exchanger, pinch point analysis is adopted. The pinch point is the location where the minimum temperature difference between cooling and heating sides in the heat exchanger exists. For a given heat flux, a larger minimum temperature difference requires a smaller heat transfer area. Thus, the mass and volume of the heat exchanger can be smaller and the cost will be lower. In this study, the minimum temperature difference is set at 20 °C (or 20 K) to ensure the driving force of heat transfer. The pinch point may occur at the point 1w, 2w, or 4w, as shown in Figure 1a. The minimum temperature difference can be expressed as Equation (24):
The exhaust temperature at point 7m can be calculated by Equation (23). Then the temperature difference at point 1w can be obtained. To calculate the temperature difference at point 2w, the exhaust temperature at point 6m needs to be solved, which can be done by using Equation (25):
In addition to the restriction of the minimum temperature difference, the exhaust temperature at the heat exchanger outlet should be higher than the water condensation point, otherwise the corrosion problem will happen in the exhaust pipe system. The lowest exhaust temperature at the heat exchanger outlet is set at 120 °C (or 393.15 K) [35] to keep steam from condensing.
3. Engine Model Validation
The accuracy of the turbocharged diesel engine simulation model was calibrated with the experimental data. The engine performance experimental data were obtained from an 11 L turbocharged diesel engine, which is usually used to power heavy-duty trucks. The basic specifications of the turbocharged diesel engine are shown in Table 1. It is an in-line 6-cylinder Euro IV engine equipped with a common rail injection system. The compression ratio of the engine is 16.4. The engine gets its maximum power and torque at 1900 rpm and 1200 rpm, respectively.
The experiments were carried out using the engine test bench. Engine torque and speed were measured by eddy current dynamometer. Static temperature and pressure at the inlet and outlet of the compressor and turbine (positions 1m and 5m in Figure 1a) were measured. Air intake flow rate was measured at the pipe upstream from the compressor, at position 1m as shown in Figure 1a. The NOx emissions without aftertreatment were measured by an exhaust gas analyzer. During the experiments, the in-cylinder pressure was also monitored and stored. An automatic data acquisition and processing system was developed in the engine test bench to attain steady-state average parameters. The engine operation conditions (speed and load) were controlled by an industrial personal computer, which was connected to electronic control units in the engine.
In order to validate the accuracy of the experiments, an error analysis is necessary. The measurement range and systematic errors of various parameters are given in Table 2. The uncertainty levels of the calculated parameters are with respect to the measured ones. That was performed using the differential method of propagating errors based on Taylor’s theorem [10], giving an overall uncertainty for BSFC (g/kWh) of 0.57%.
To accurately predict engine performance and NOx emissions, the engine model needs to be carefully calibrated. The procedure of engine model validation can be structured in several main steps. First, engine intake pressure and exhaust pressure are calibrated to be close to the experimental data. In such a condition, the engine pumping power will be near the measurement data. In addition, the predictions of boosting level and turbine expansion will also be close to the experimental data. Then, intake air mass flow rate and exhaust temperature are calibrated to ensure that the turbine power is right. Next, the coefficients of the combustion model are adjusted to fit the in-cylinder pressure profile. Under this condition, the indicated power is obtained. After that, the friction power coefficient is adjusted to make sure the total power output is close to the experimental value. Finally, the multipliers in the NOx emission formation kinetic model are calibrated to reduce the errors of NOx emission between experiments and predictions, including NOx calibration multiplier, N2 oxidation rate multiplier, N2 oxidation activation energy multiplier, etc. Among them, the NOx calibration multiplier plays an important role in NOx emission validation. If the prediction of NOx emission is higher than the experimental results, the NOx calibration multiplier needs to be decreased. If the reverse, it should be increased. In fact, the calibration procedure is more complicated than the descriptions above. Repeated calibrations are required to obtain good agreement between the predictions and the experimental results.
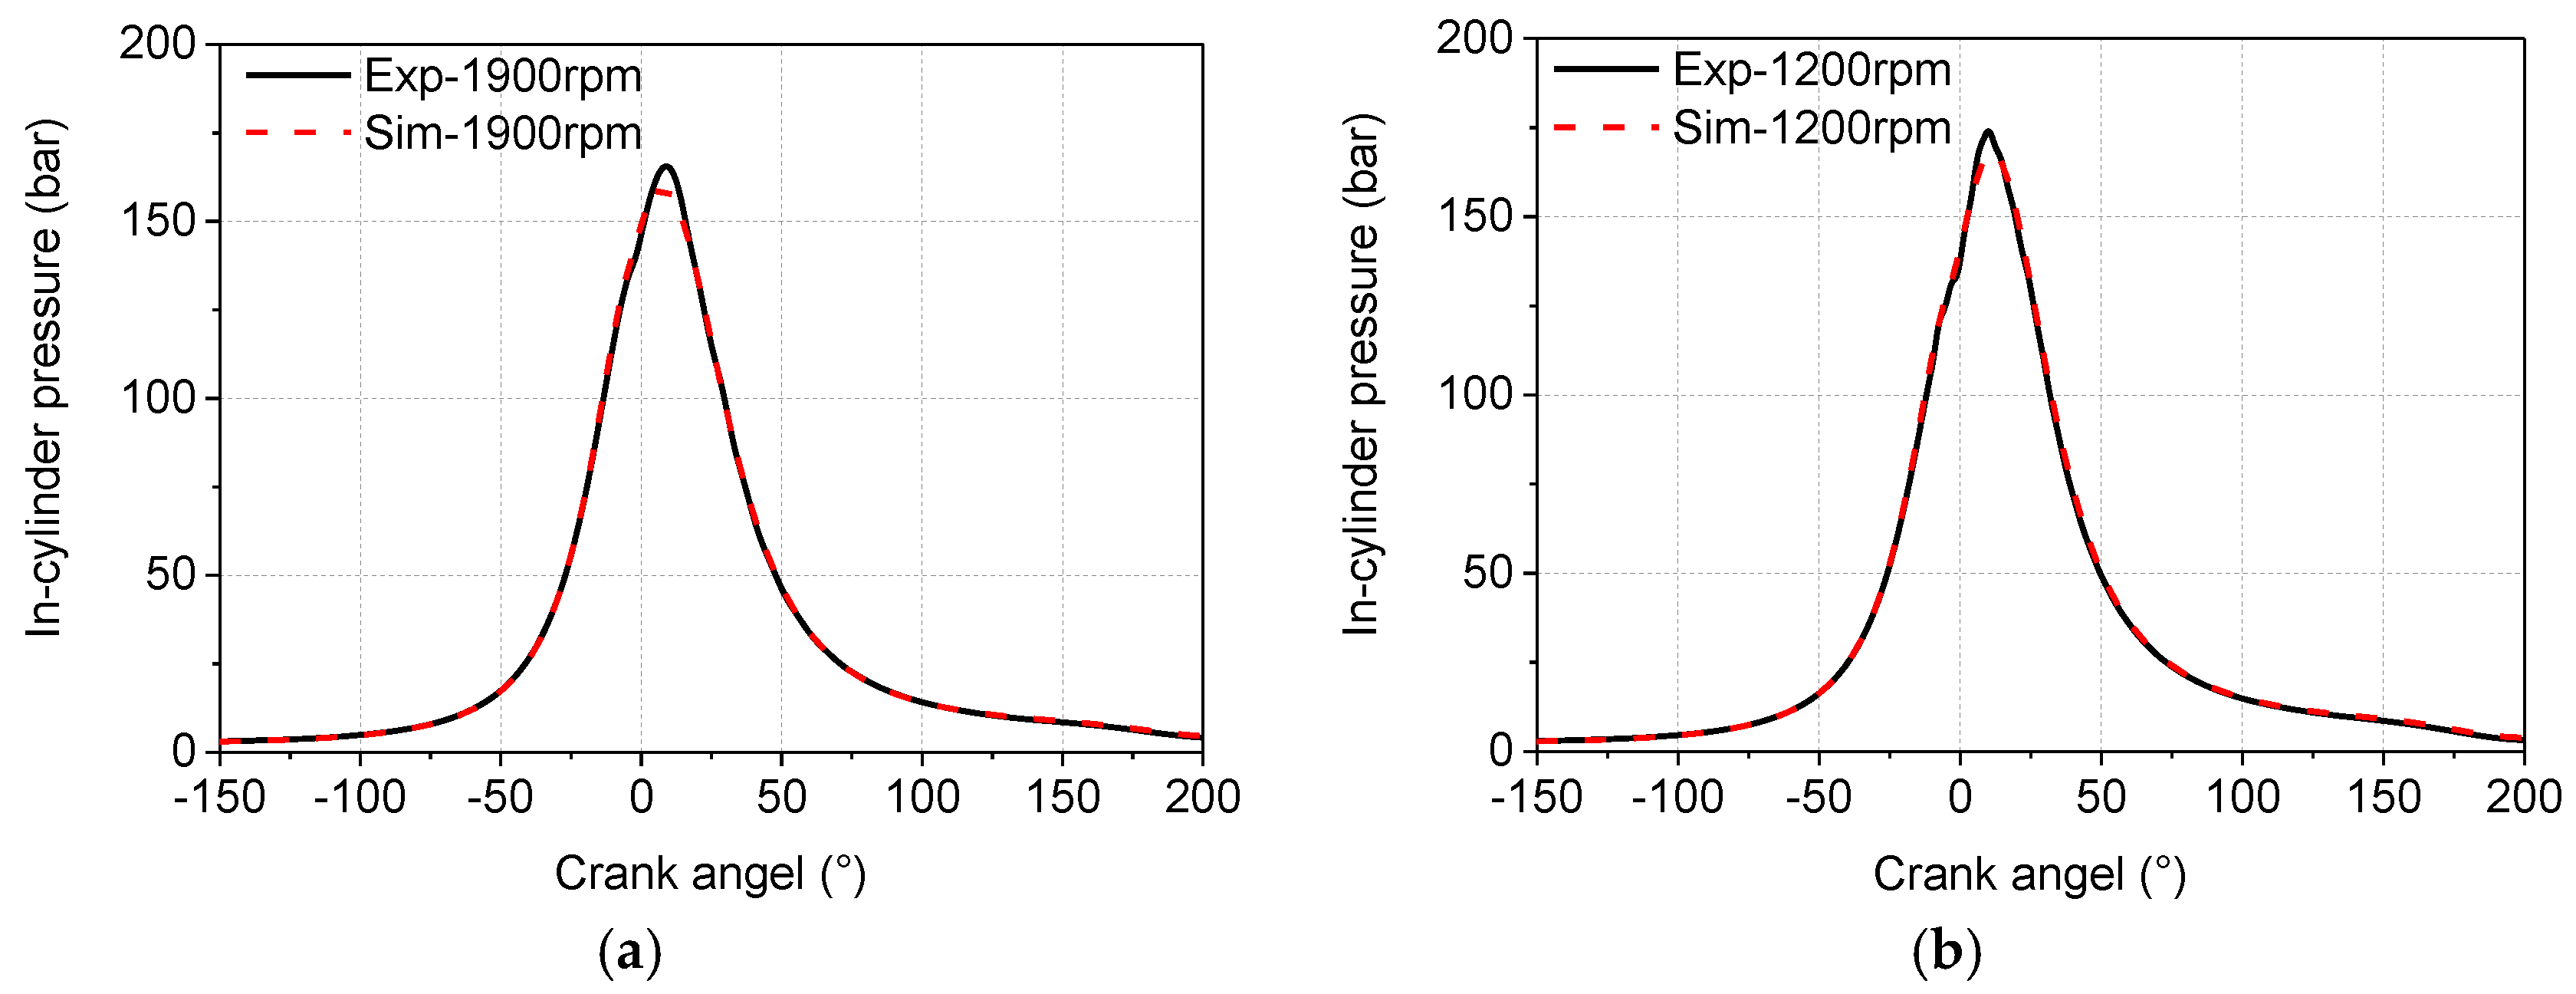
Comparisons of the in-cylinder pressure profile between the experiment and the simulation at 1900 rpm and 1200 rpm operating conditions are shown in Figure 3. It can be seen that the in-cylinder pressure profiles from the simulation are well fitted with the experimental profiles. Therefore, the simulation model can precisely predict in-cylinder pressure.
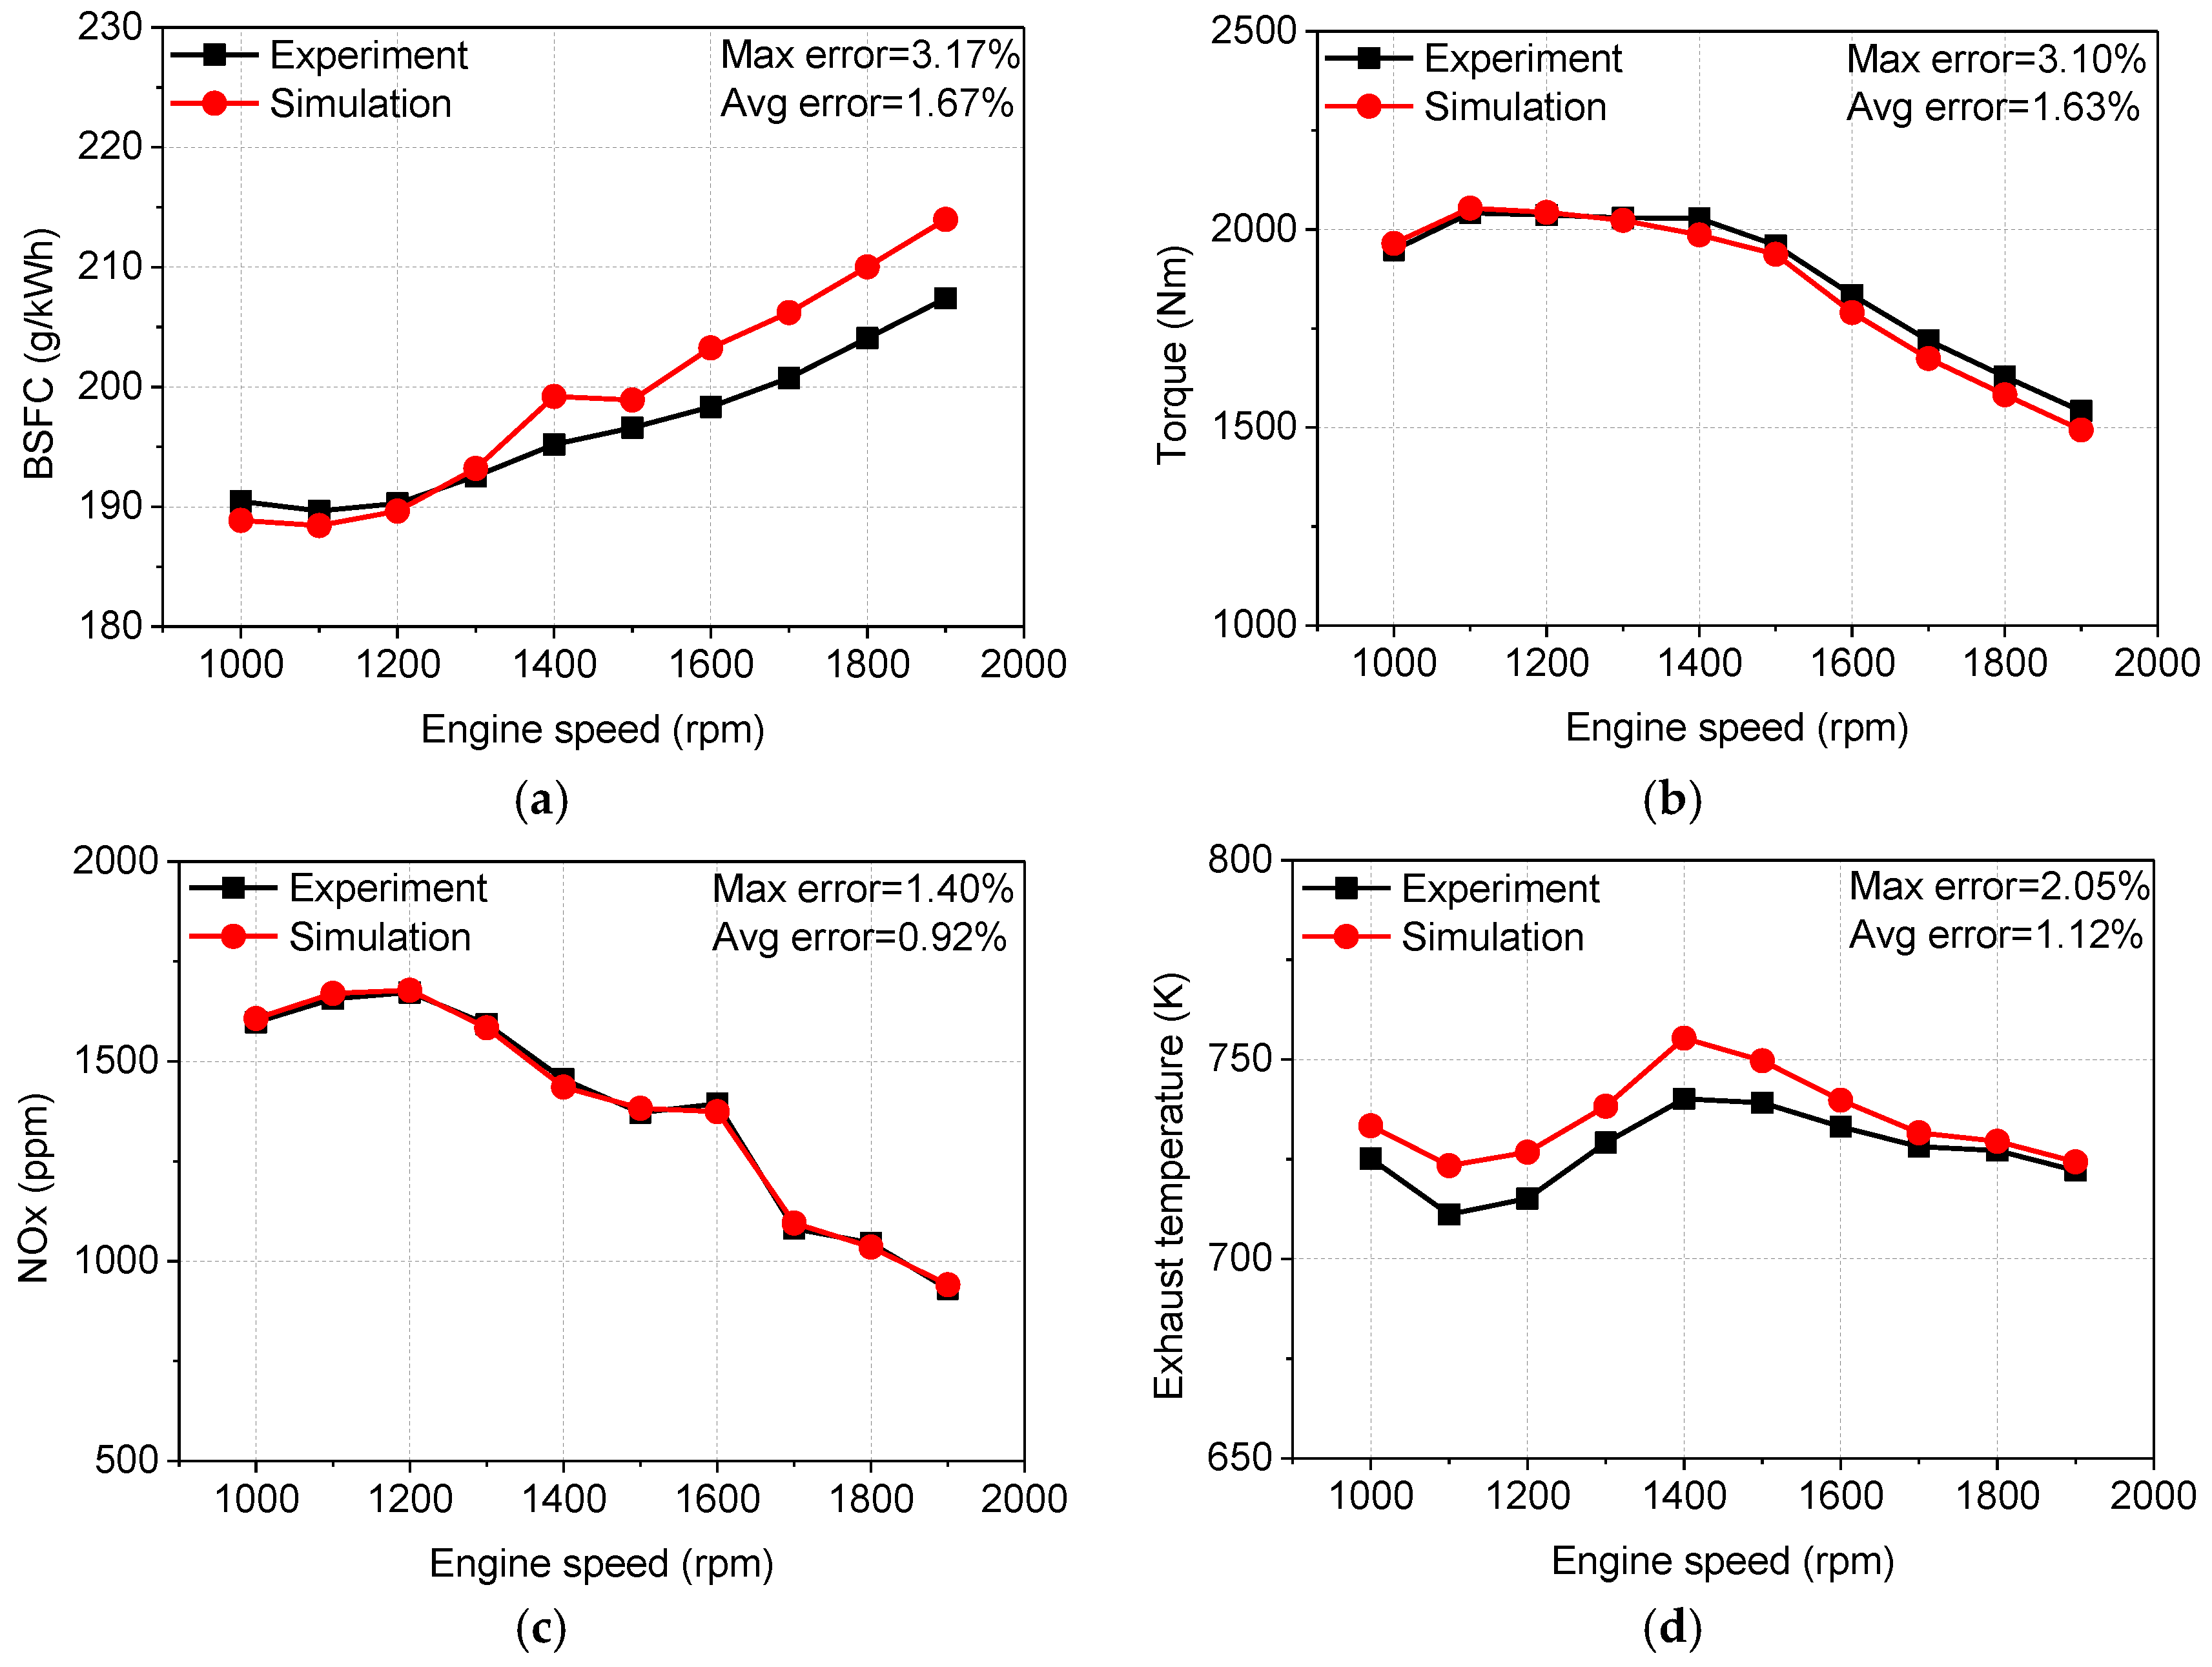
Comparisons of the simulation results and the experimental data under full load at engine speeds from 1000 rpm to 1900 rpm are shown in Figure 4. It can be seen that the average errors of BSFC and engine torque are 1.67% and 1.63%, respectively. The maximum errors of BSFC and engine torque are both within 4%. Thus, the engine simulation model can successfully predict the main performance of the turbocharged diesel engine. NOx emissions are among the major emissions of diesel engines, and must be reduced to satisfy stricter emissions regulations [38]. The maximum and average errors of NOx emission are 1.40% and 0.92%, respectively. Thus, the simulation model can accurately predict NOx emissions of the engine. Exhaust temperature (position 5m in Figure 1a) is an important parameter in the present study. It determines the available thermal energy of exhaust transferred to water. The maximum and average errors of exhaust temperature are 2.05% and 1.12%, respectively. Therefore, the deviations of exhaust temperature between the simulation and the experiment are within a reasonable range.
4. Results and Discussion
In this section, based on the turbocharged diesel engine simulation model, the effects of steam injection mass, temperature, and timing on engine performance and NOx emissions under full load at various engine speeds are evaluated. After that, the potential of in-cylinder steam injection to improve engine performance and reduce NOx emissions is presented.
4.1. The Limits of Maximum Steam Mass and Temperature
From the analysis of the in-cylinder steam injection subsystem in Section 2.3, it can be seen that the minimum temperature difference and the exhaust temperature at the heat exchanger outlet will decrease as steam injection mass and temperature increase. According to the pinch point analysis, the maximum steam injection mass and temperature are restricted by . In addition, temperature should be larger than the condensation temperature, which also limits the maximum steam mass and temperature. In this subsection, the impact of steam injection mass and temperature on and will be analyzed.
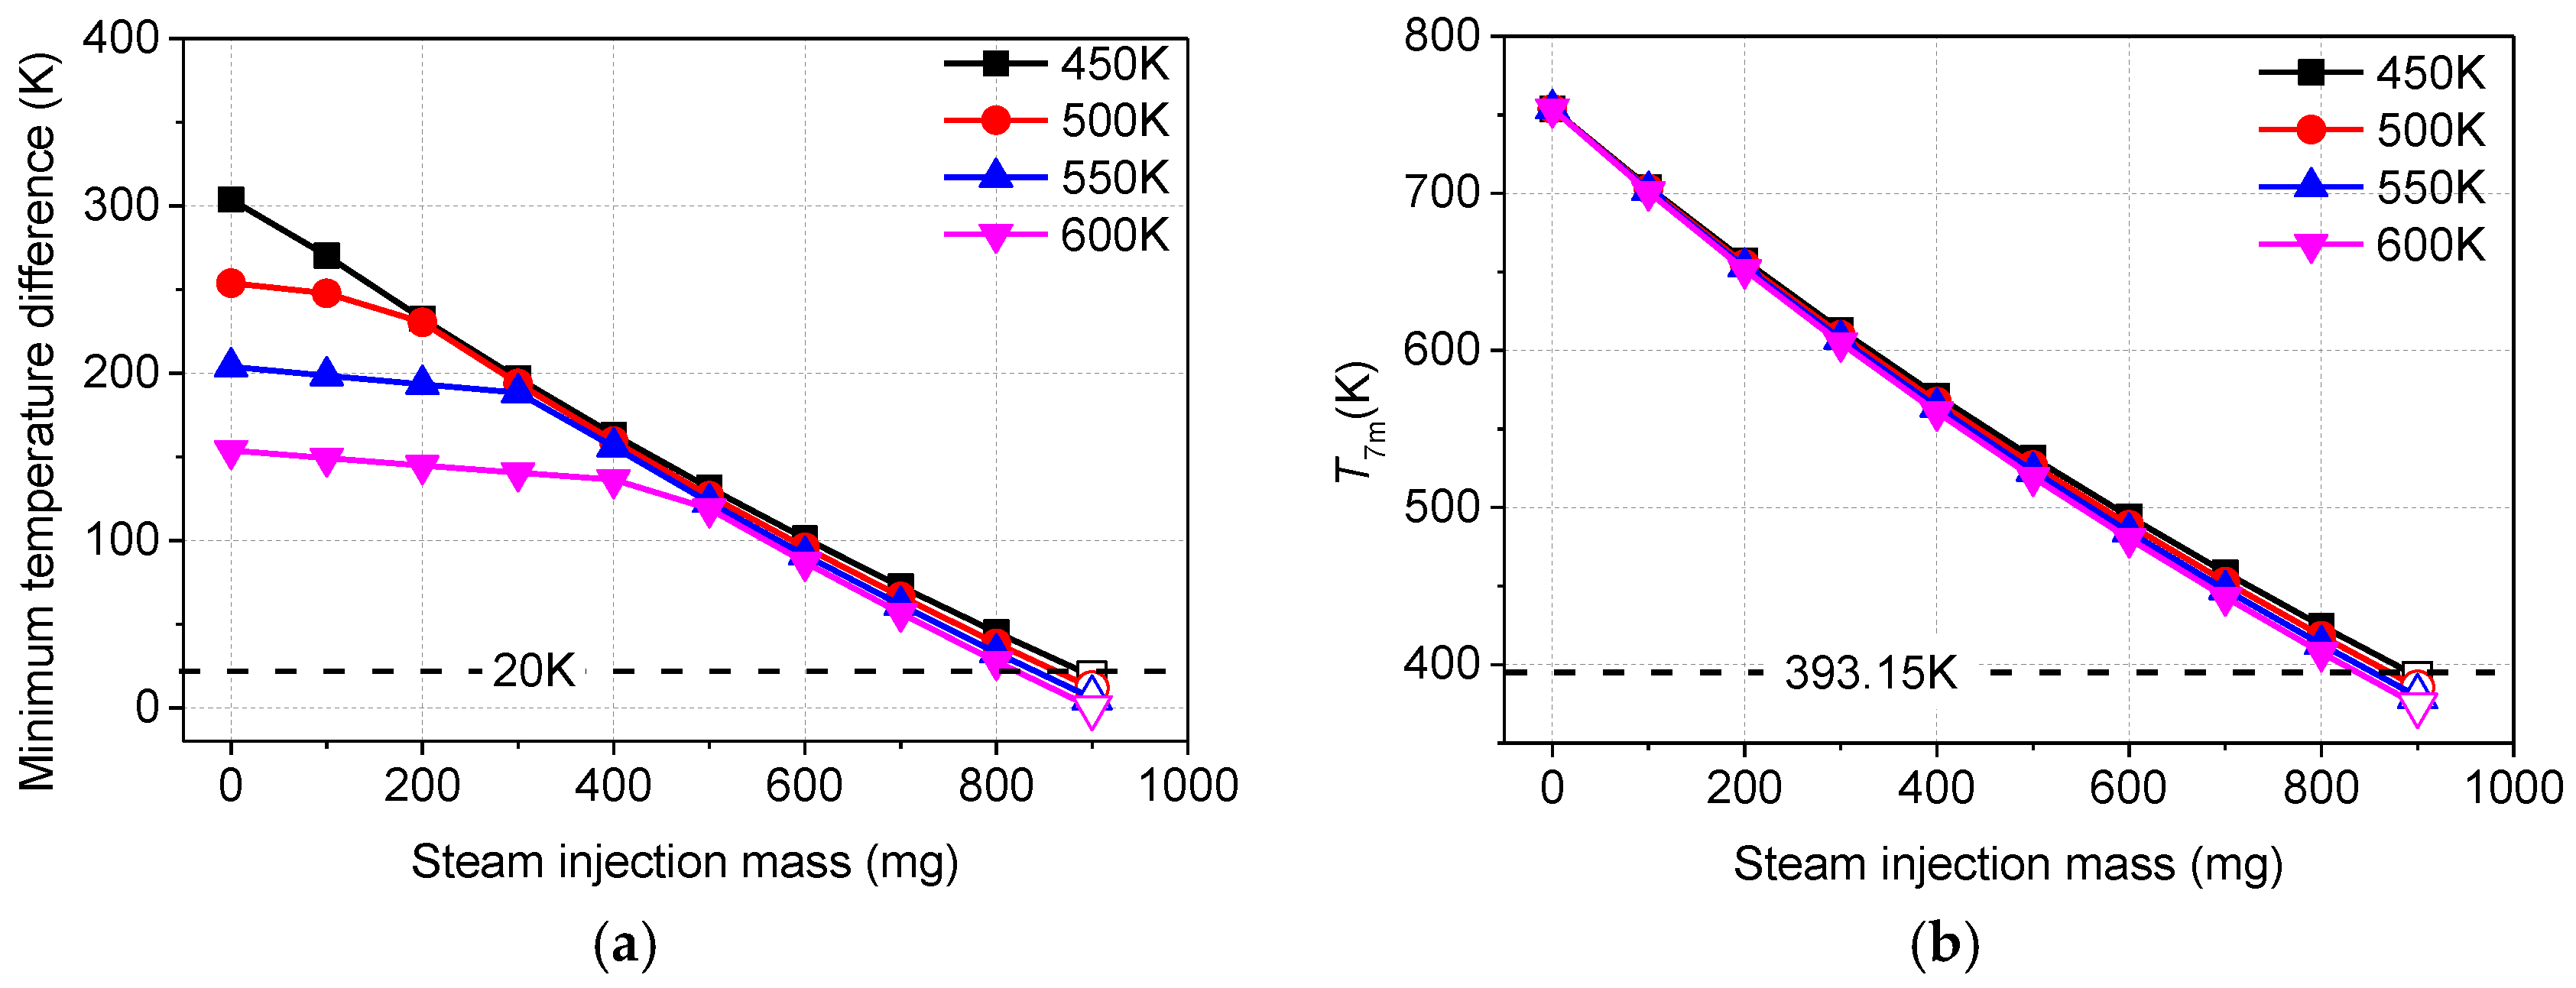
The analysis is carried out under the condition that the steam injection timing is −90° and the injection pressure is 8 bar. The selection of injection pressure is based on the principle that it must be higher than the in-cylinder pressure. In addition, the minimum value of the steam injection temperature range is selected on the principle that it must be larger than the evaporating temperature. Figure 5 shows the influence of steam injection mass and temperature on and under full load at an engine speed of 1900 rpm. It is found that the location of is highly affected by steam injection mass and temperature. As shown in Figure 1a, the location of occurs at point 4w when the steam injection mass is small and its temperature is high. However, occurs at point 2w under the condition that the steam injection mass is large and its temperature is low.
As shown in Figure 5a, decreases sharply as the steam injection mass increases. The value of is lower than 20 °C (or 20 K) when the steam injection mass reaches 900 mg per cylinder per cycle. The impact of steam injection temperature on is remarkable when the steam injection mass is small. However, as steam injection mass increases up to 500 mg per cylinder per cycle, the steam temperature affects only slightly. From Figure 5b, it can be seen that is significantly influenced by the steam injection mass, but it is slightly affected by the steam temperature. The exhaust temperature at the heat exchanger exit will be lower than the limit of 393.15 K when the steam injection mass reaches 900 mg per cylinder per cycle.
4.2. The Impact of Steam Injection Mass
In this subsection, the impact of steam injection mass on BSFC, torque, and NOx emissions of the turbocharged engine are discussed. Figure 6 shows the influence of steam injection mass on in-cylinder pressure and temperature with respect to crank angle under full load at an engine speed of 1900 rpm. The results are obtained under the conditions of −90° steam injection timing, 8 bar steam injection pressure, and 500 K steam injection temperature. Since the working fluids in the cylinder increase after the steam is directly injected, the in-cylinder pressure increases significantly. As shown in Figure 6a, the maximum in-cylinder pressure increases by 24.9 bar (15.6%) compared with the baseline engine when the steam injection mass is 600 mg per cylinder per cycle. Besides, the in-cylinder peak pressure will be larger when the steam injection mass increases. It can be seen in Figure 6b that the in-cylinder temperature is significantly reduced when steam is injected into the cylinder. This is because the specific heat of steam is high. As a result, the specific heat of the mixture in the cylinder increases remarkably after the steam is injected. Compared with the baseline engine, the peak in-cylinder temperature decreases by 153.4 K (9.4%) with a steam injection mass of 600 mg per cylinder per cycle.
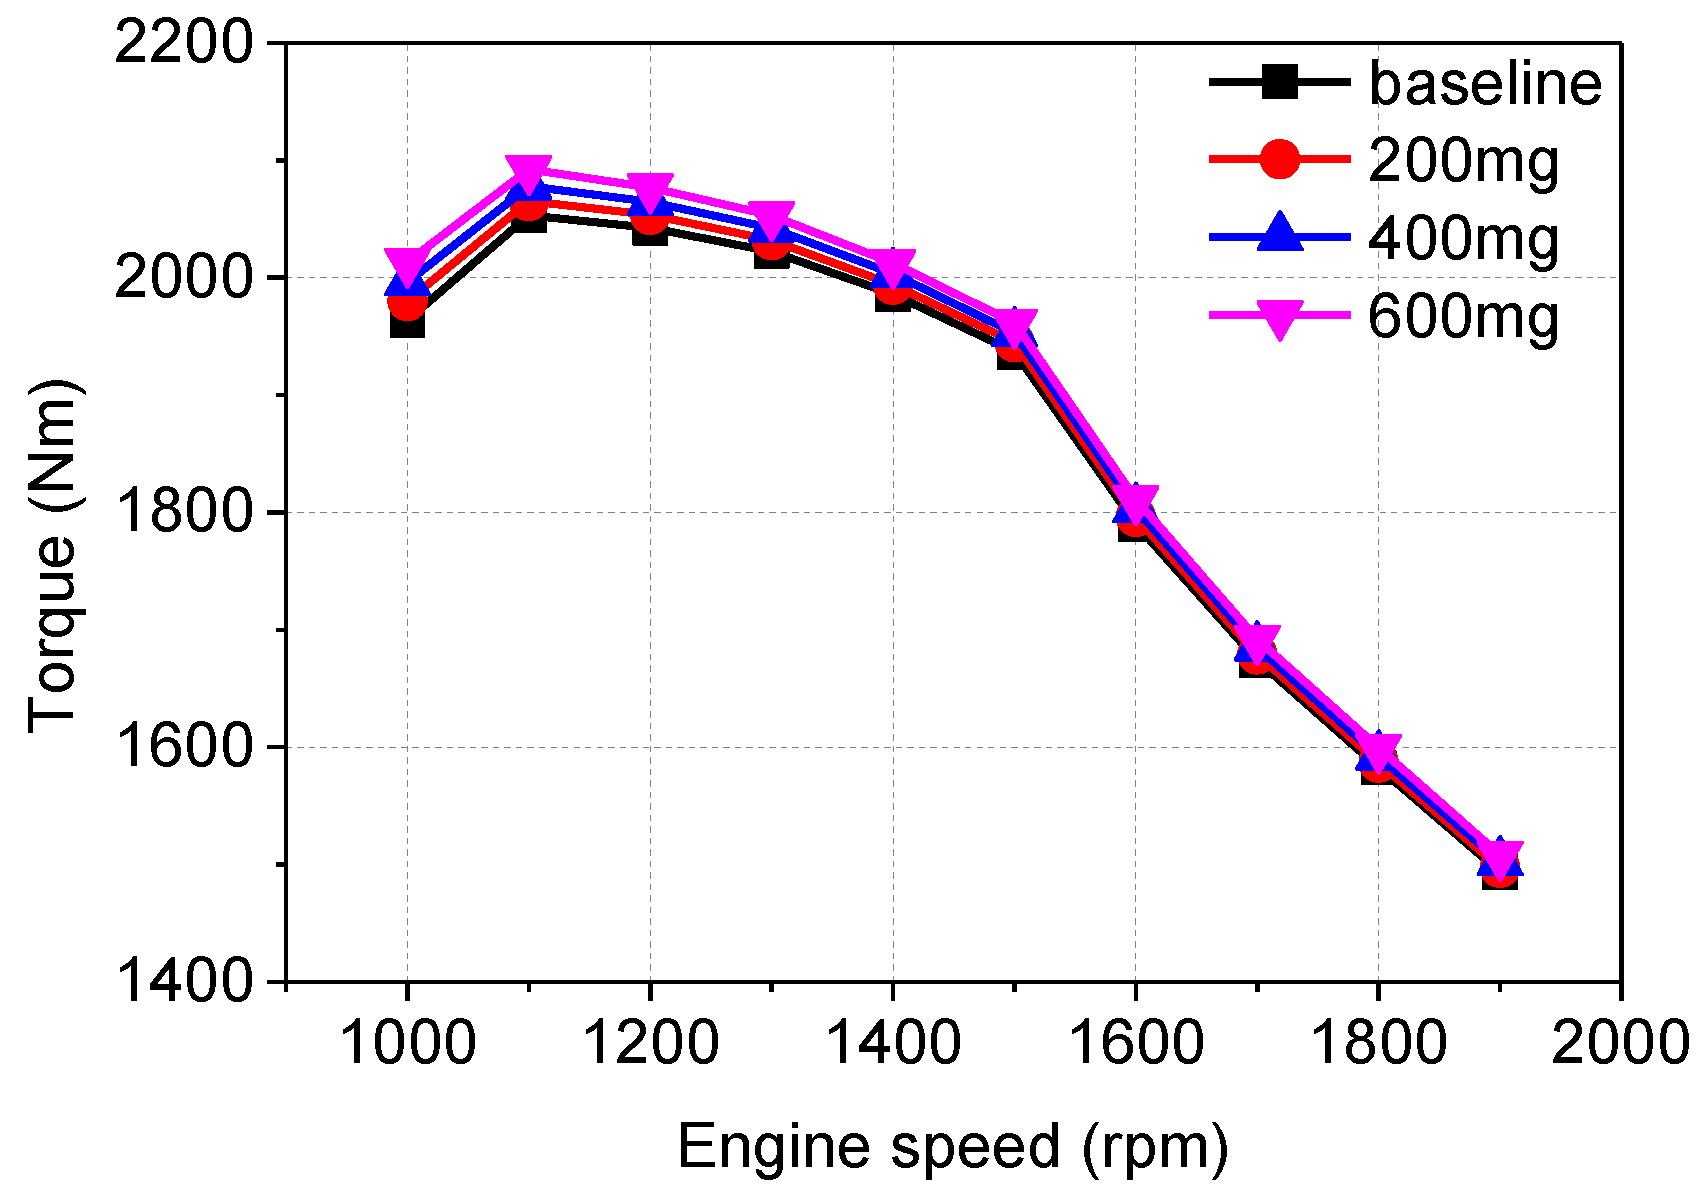
The influence of steam injection mass on engine torque under full load at engine speeds from 1000 rpm to 1900 rpm is shown in Figure 7. Since the peak in-cylinder pressure increases with steam injection, the piston work during the power stroke increases. As a result, engine power improves. Therefore, engine torque also increases. As shown in Figure 7, engine torque increases as the steam injection mass increases. Besides, engine torque improves more significantly at low/medium engine speed. Compared with the baseline engine, engine torque increases by 1.0–2.5% at different engine speeds when the steam injection mass is 600 mg per cylinder per cycle. The largest increase of engine torque is 2.5%, which occurs at 1000 rpm with 600 mg per cylinder per cycle.
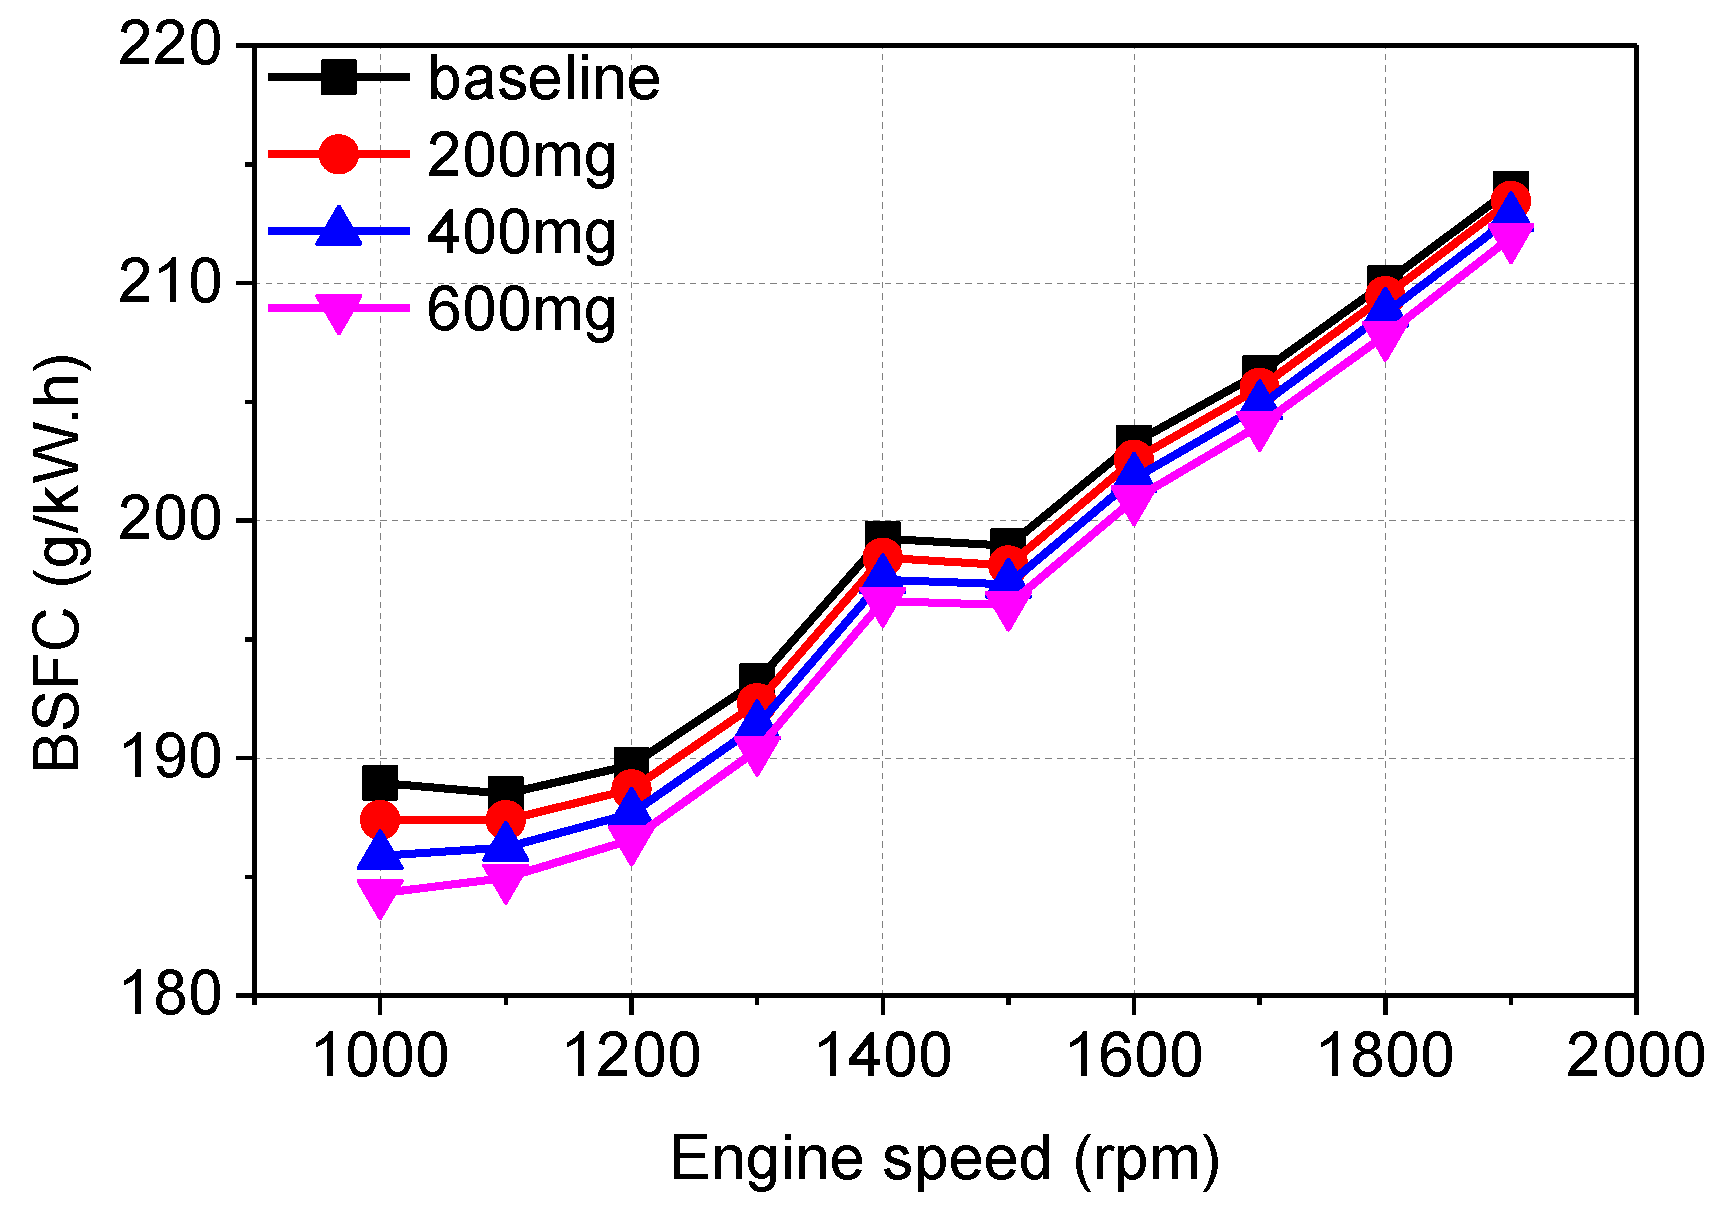
Figure 8 illustrates the effects of steam injection mass on BSFC with respect to engine speed under full load condition. Because of the increased engine power, BSFC decreases with steam injection. It can be seen from Figure 8 that more steam injection mass results in a greater reduction of BSFC. Also, BSFC improves more remarkably at low/medium engine speed. BSFC is reduced by 1.0–2.5% at different engine speeds compared with the baseline when the steam injection mass is 600 mg per cylinder per cycle.
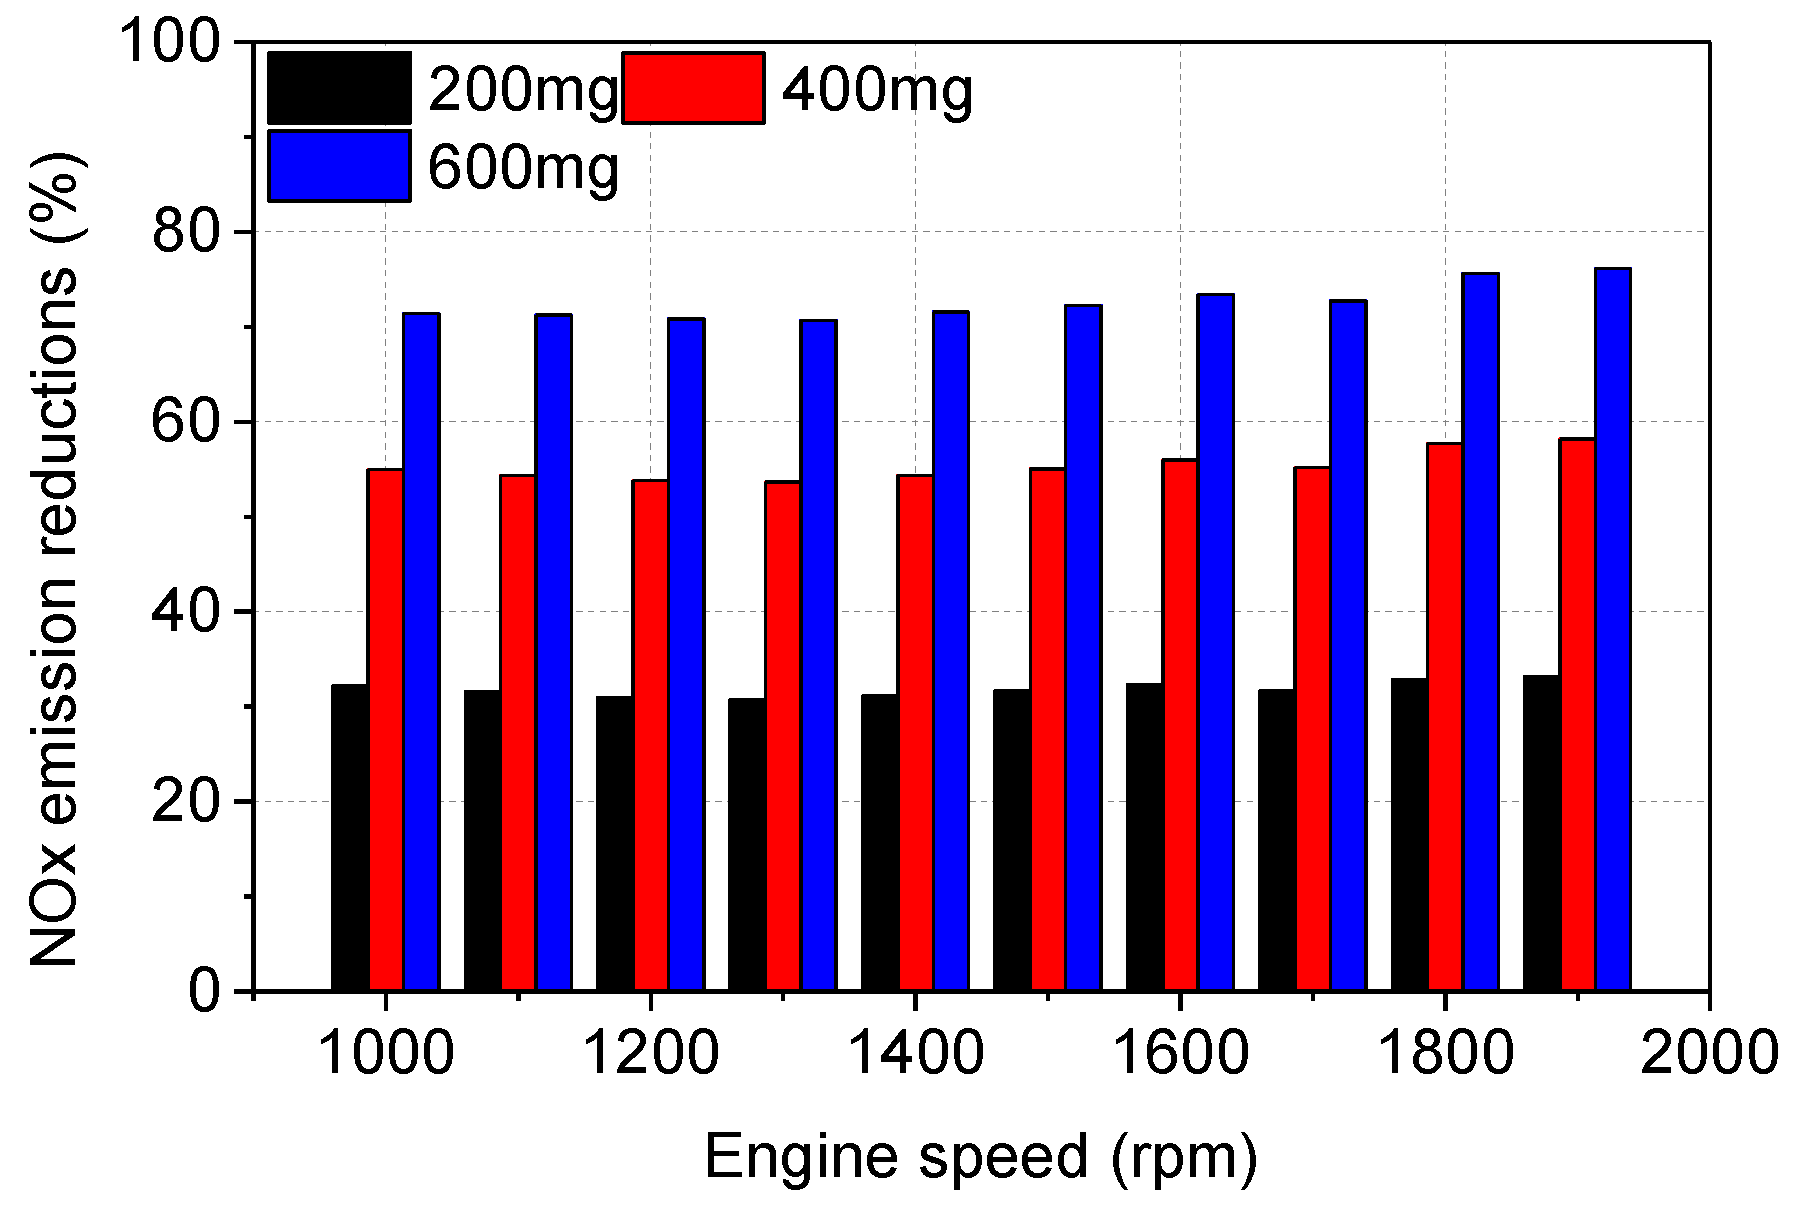
According to the generation mechanism of NOx emission described by the extended Zeldovich model, NOx emission is mainly affected by the peak in-cylinder temperature and the O2 concentration in the cylinder. The impact of steam injection mass on the reduction of NOx emissions under full load at various engine speeds is given in Figure 9. Since the peak in-cylinder temperature and the O2 concentration both decrease, NOx emission is sharply reduced by steam injection. When steam injection mass is 600 mg per cylinder per cycle, NOx emissions are reduced by 70.7–76.2% across all engine speeds. In addition, with larger steam injection mass, the NOx emission is further reduced. When steam injection mass increases from 200 mg per cylinder per cycle to 600 mg per cylinder per cycle, NOx emissions are further reduced by 59.8%.
4.3. The Impact of Steam Injection Temperature
The effects of steam injection temperature on in-cylinder pressure and temperature under full load at 1900 rpm are shown in Figure 10. The results were obtained in the situation of steam injection mass of 400 mg per cylinder per cycle, steam injection timing of −90°, and steam injection pressure of 8 bar. It can be seen that steam injection temperature has relatively little impact on in-cylinder pressure and temperature. This is because the enthalpy of the steam increases only slightly as the steam injection temperature increases from 450 K to 600 K. Therefore, in-cylinder pressure and temperature increase weakly as steam injection temperature increases. The maximum in-cylinder pressure and temperature increase by 3.4% and 1.5%, respectively, when the steam injection temperature increases from 450 K to 600 K.
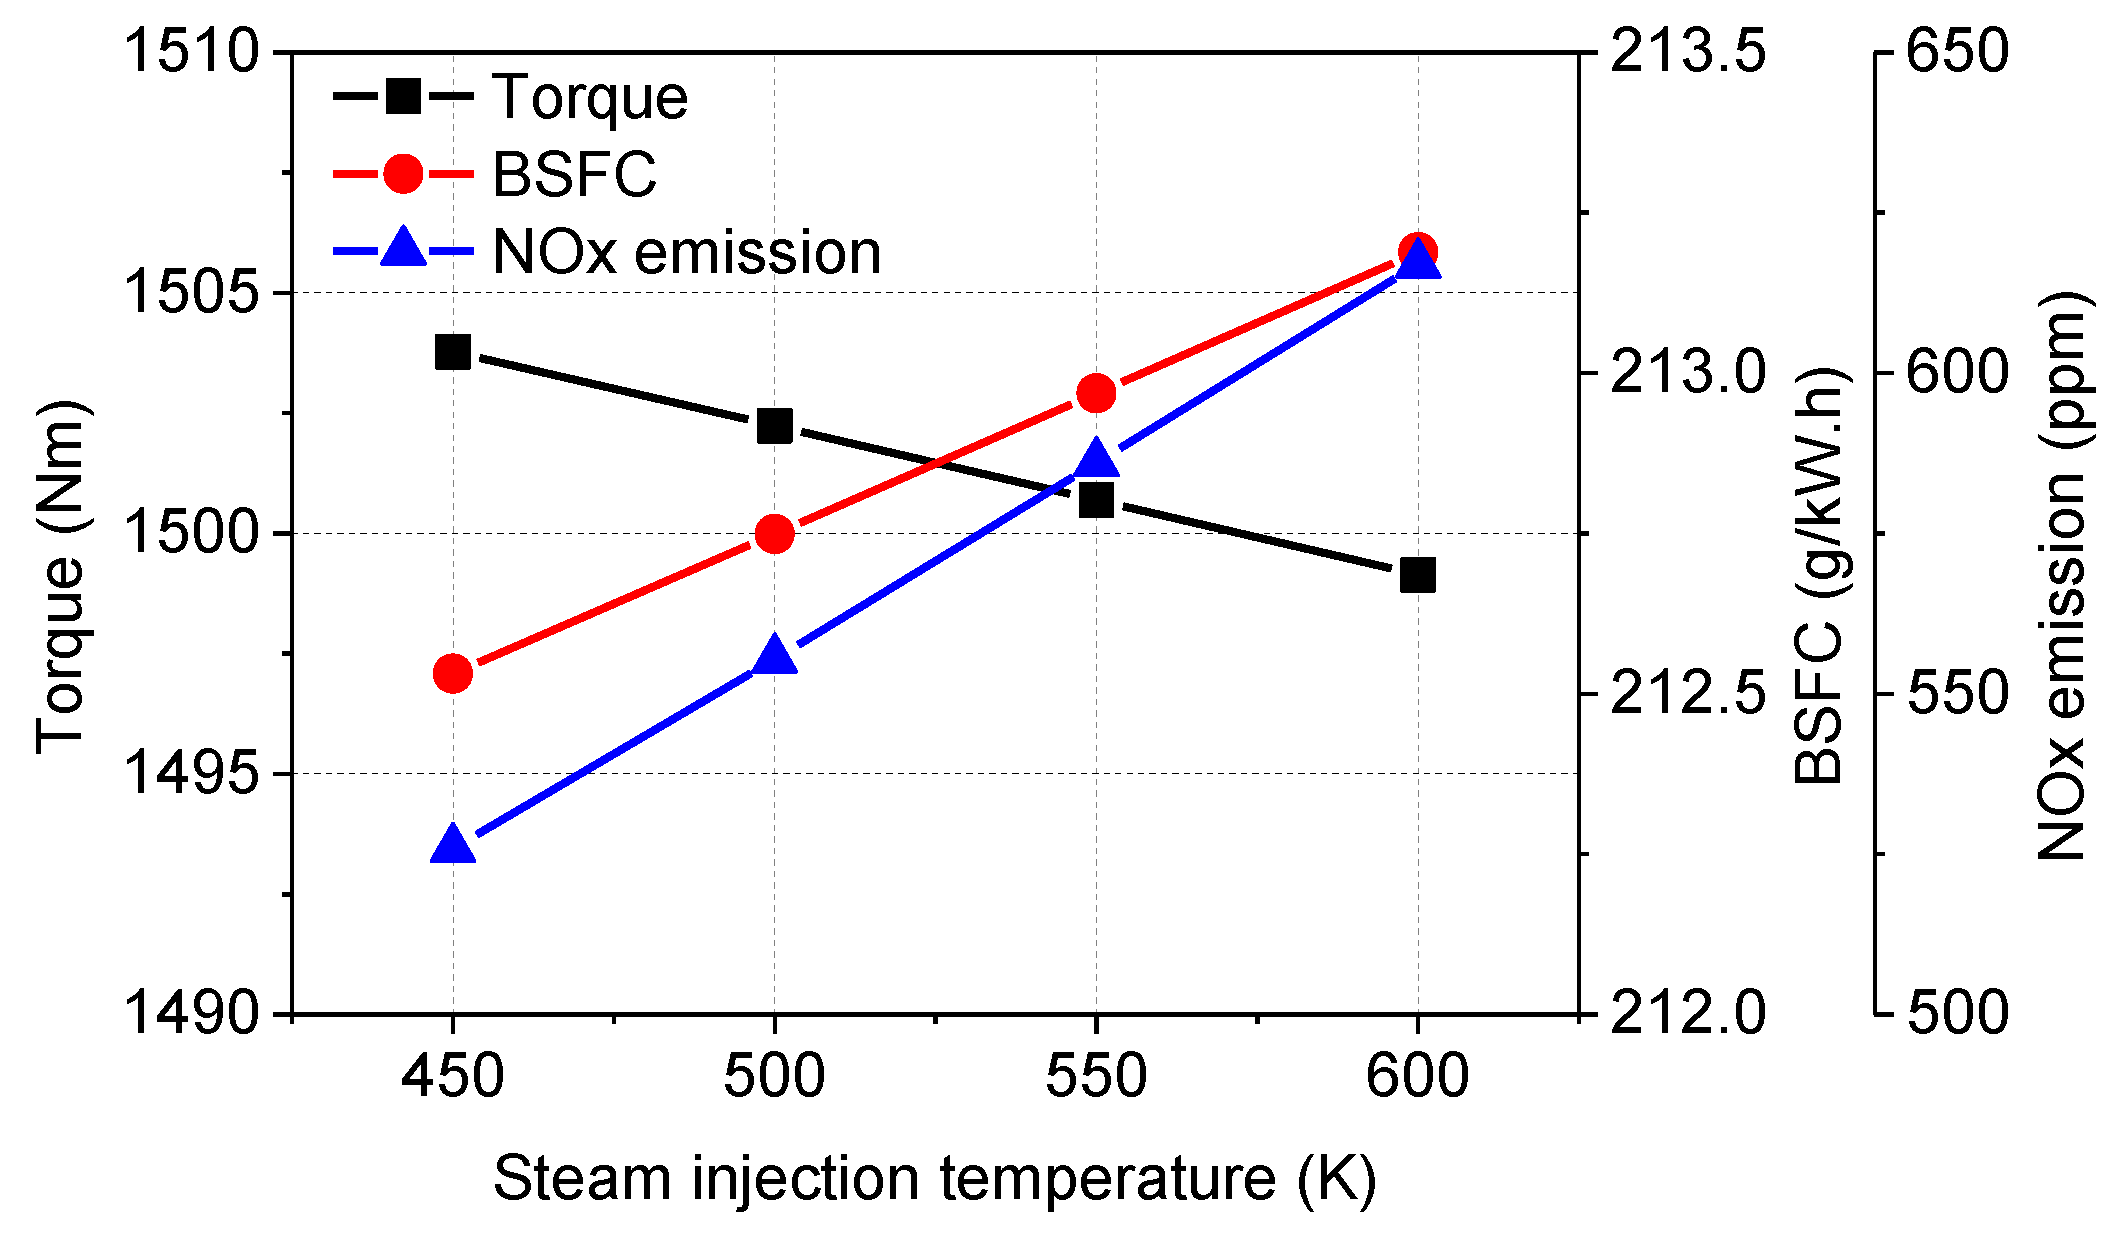
The impact of steam injection temperature on engine torque, BSFC, and NOx emissions under full load at 1900 rpm is shown in Figure 11. It can be seen that engine torque is slightly reduced and BSFC is slightly increased as steam injection temperature increases. This is because the steam injection temperature has only a little impact on in-cylinder pressure. Although the increased maximum in-cylinder pressure benefits the improvement in engine power, the negative compression work is also increased. Therefore, the engine power is slightly reduced as the steam injection temperature increases. The reduction of engine torque and the increase of BSFC are both within 0.4% when the steam injection temperature increases from 450 K to 600 K. As for NOx emission, it is sensitive to the change of in-cylinder temperature. Therefore, the impact of steam injection temperature on NOx emission is remarkable. The in-cylinder temperature increases as steam injection temperature increases, which favors the generation of NOx emissions. When the steam injection temperature increases from 450 K to 600 K, NOx emissions increase by 17.3%.
In summary, although the enthalpy of steam increases slightly as steam injection temperature increases, it does not benefit the improvement of engine performance and reduction of NOx emissions. Besides, for a given steam injection mass, a larger heat transfer area is required to increase the steam injection temperature. Therefore, a small superheated degree should be adopted when the steam is injected into the cylinder.
4.4. The Impact of Steam Injection Timing
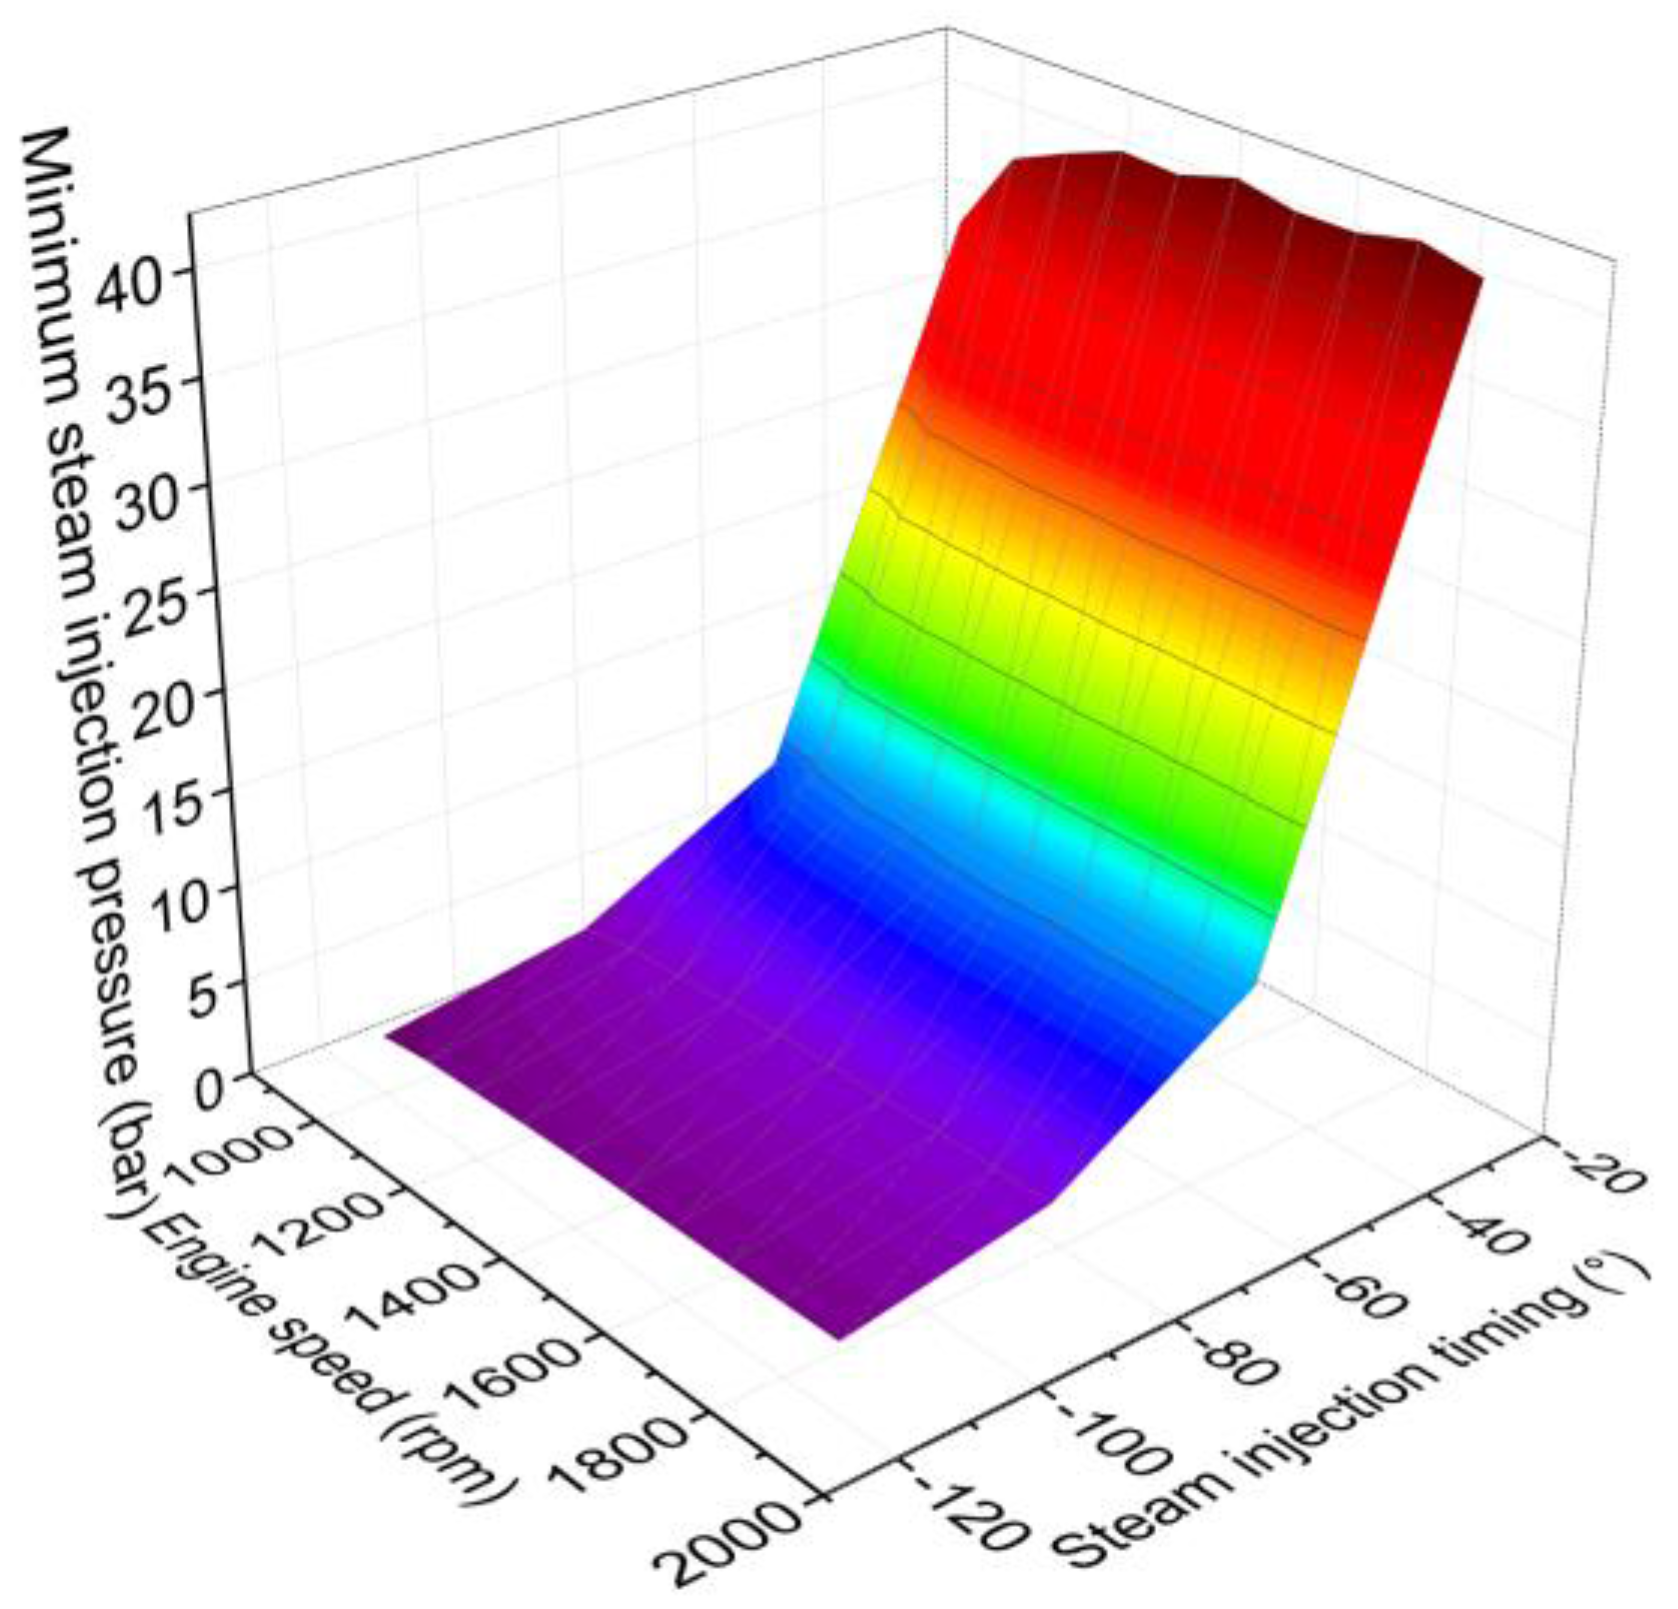
Before discussing the results of the impact of steam injection timing on engine performance and NOx emissions, the minimum steam injection pressure with respect to steam injection timing and engine speed is introduced, as shown in Figure 12. Since the in-cylinder pressure increases as the crank angle increases, the minimum steam injection pressure must also increase to ensure that the steam can be injected into the cylinder. Besides, the engine speed slightly affects the minimum steam injection pressure. To ensure that the steam can be efficiently injected into the cylinder, all the steam injection pressures are set at 50 bar in the following calculations. In addition, the steam injection temperature is set at 550 K, which is slightly higher than the evaporating temperature.
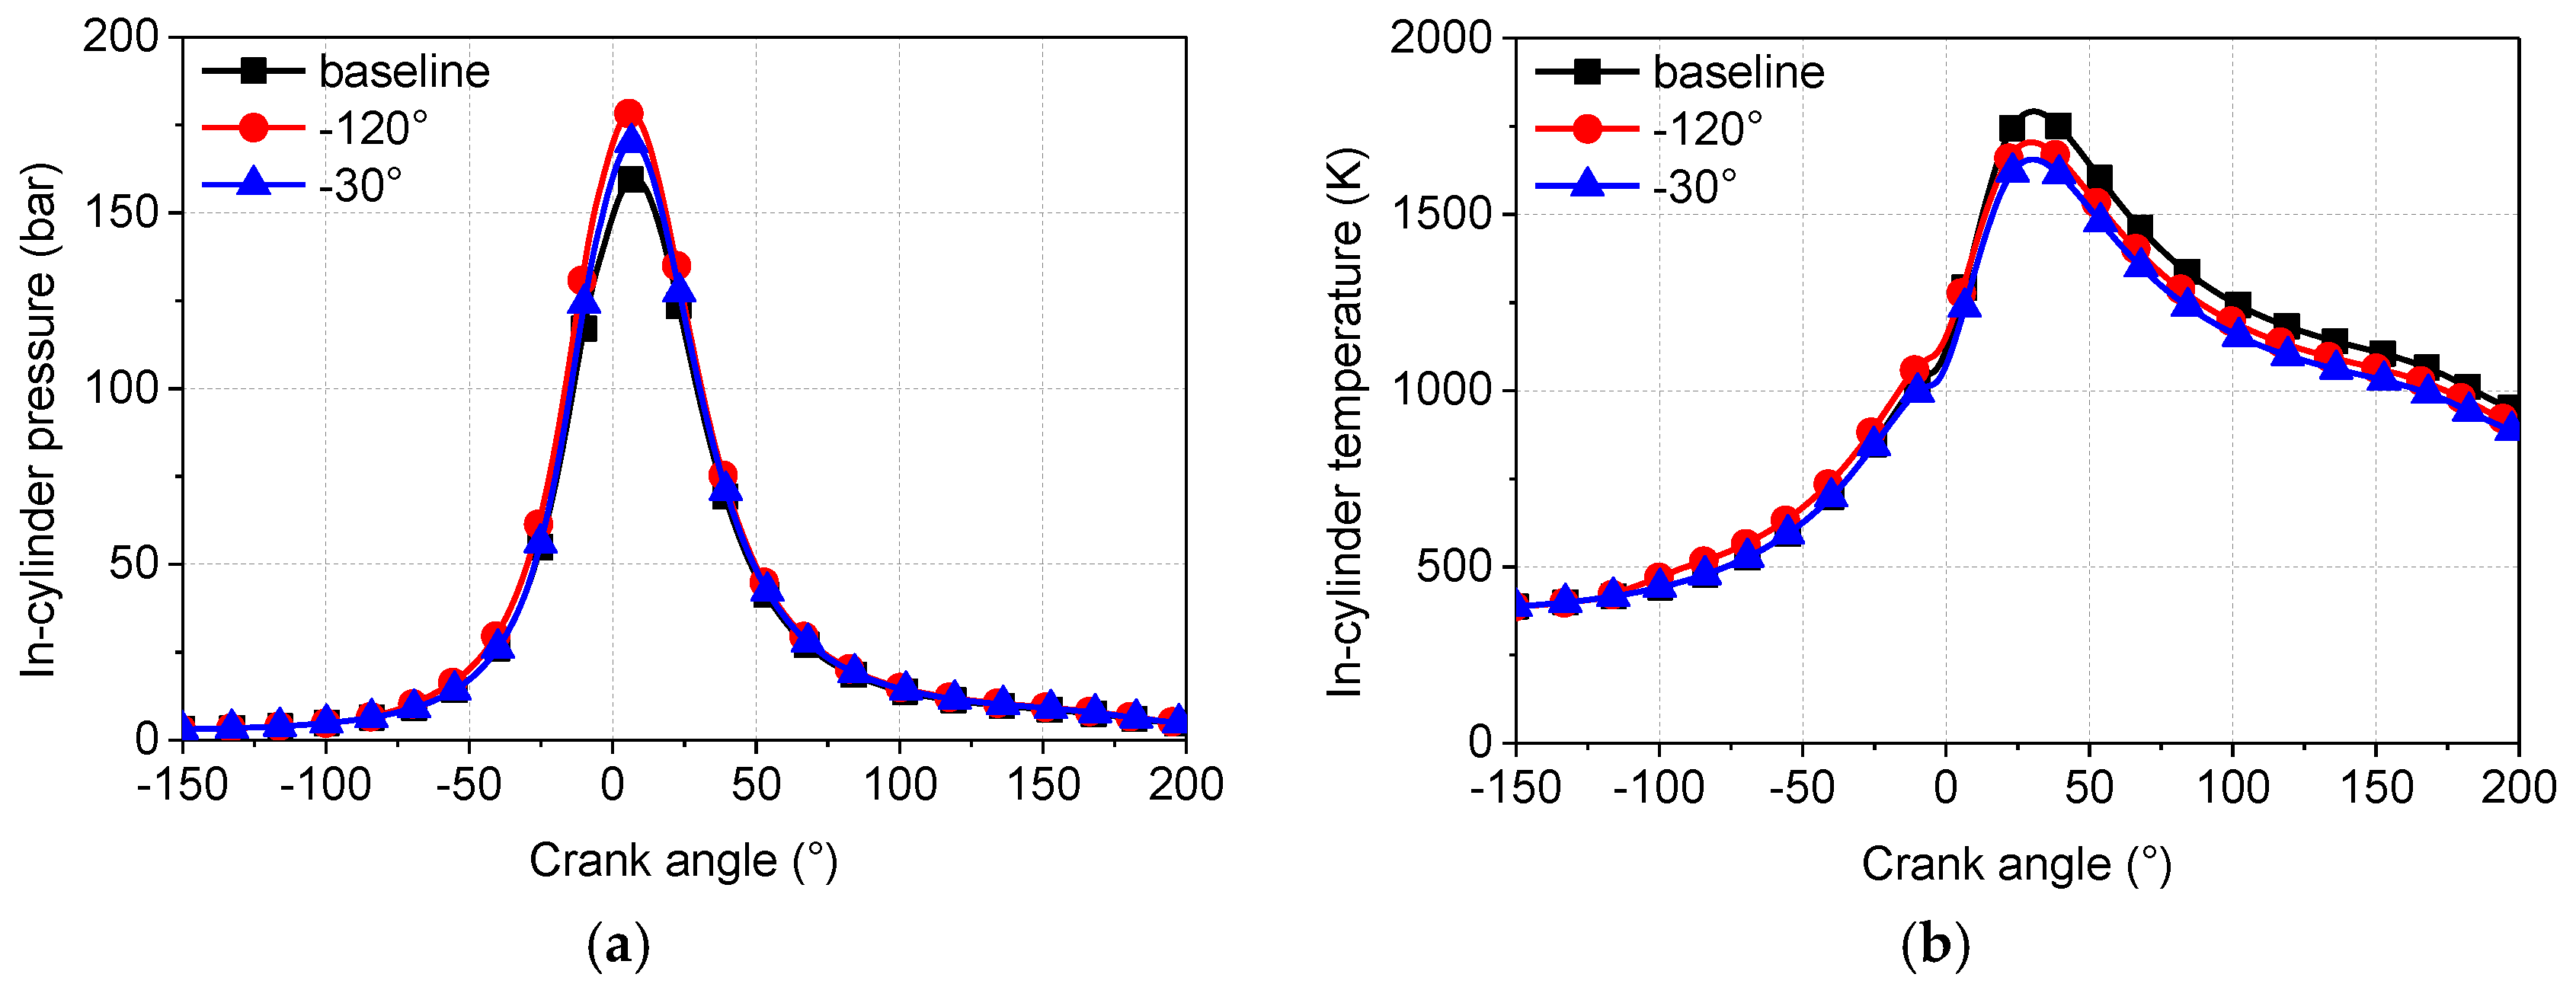
Figure 13 presents the influence of steam injection timing on in-cylinder pressure and temperature under full load at an engine speed of 1900 rpm. From Figure 13, it can be seen that the in-cylinder pressure and temperature both reduce as the steam injection timing slows down. This is because the negative compression work is transferred into the internal energy of the working fluids during the compression stroke. When the steam injection timing slows down, the negative compression work decreases significantly. Therefore, in-cylinder pressure and temperature are both reduced. When the steam injection timing slows down from −120° to −30°, the peak in-cylinder temperature and maximum in-cylinder temperature decrease by 4.8% and 2.9%, respectively.
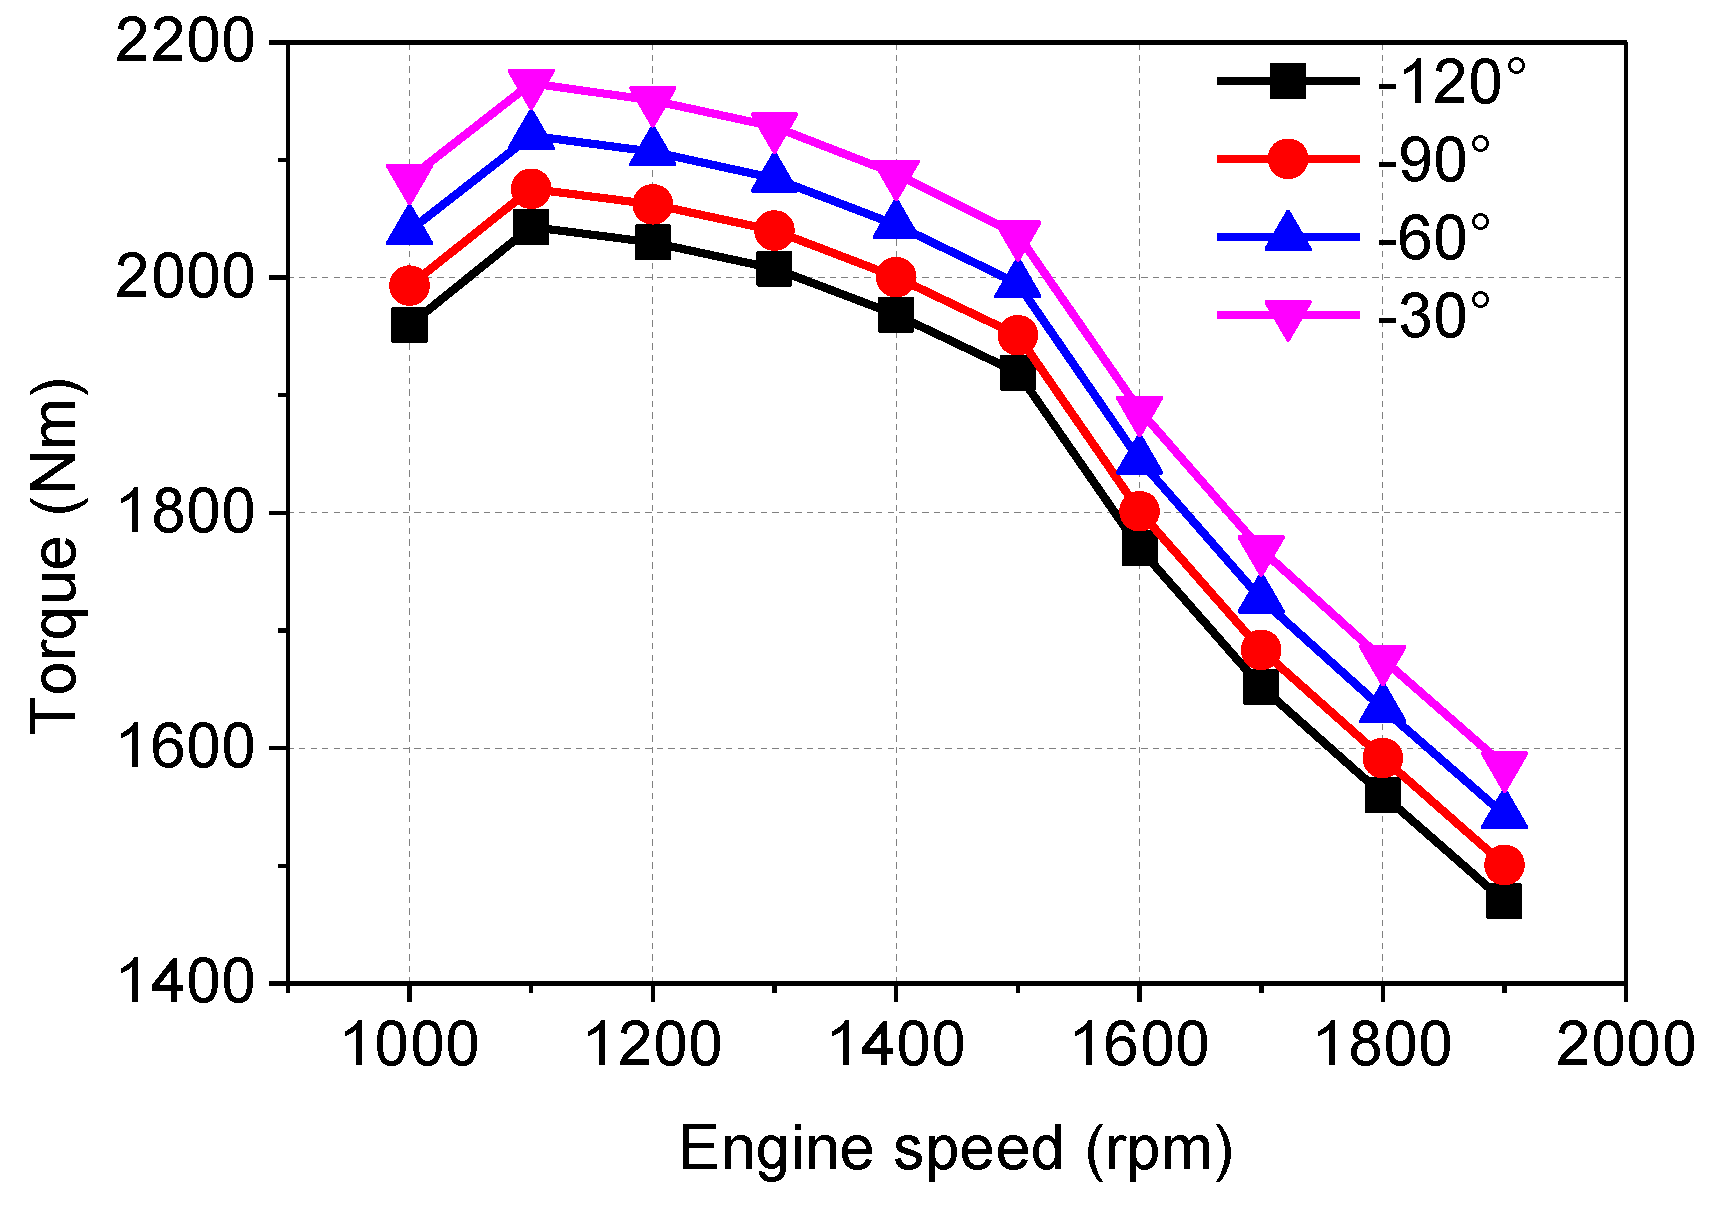
The negative compression work is reduced as the steam injection timing slows down, which benefits the increase of engine power. Figure 14 illustrates the effects of steam injection timing on engine torque under full load at engine speeds from 1000 rpm to 1900 rpm. It can be seen that engine torque increases as the steam injection timing slows down. Engine torque increases by 5.9–7.8% at different engine speeds as the steam injection timing slows down from −120° to −30°.
The impact of steam injection timing on BSFC under full load at various engine speeds is shown in Figure 15. Since engine power increases as steam injection timing slows down, BSFC is reduced. When steam injection timing slows down from −120° to −30°, BSFC decreases by 5.6–7.3% at different engine speeds.
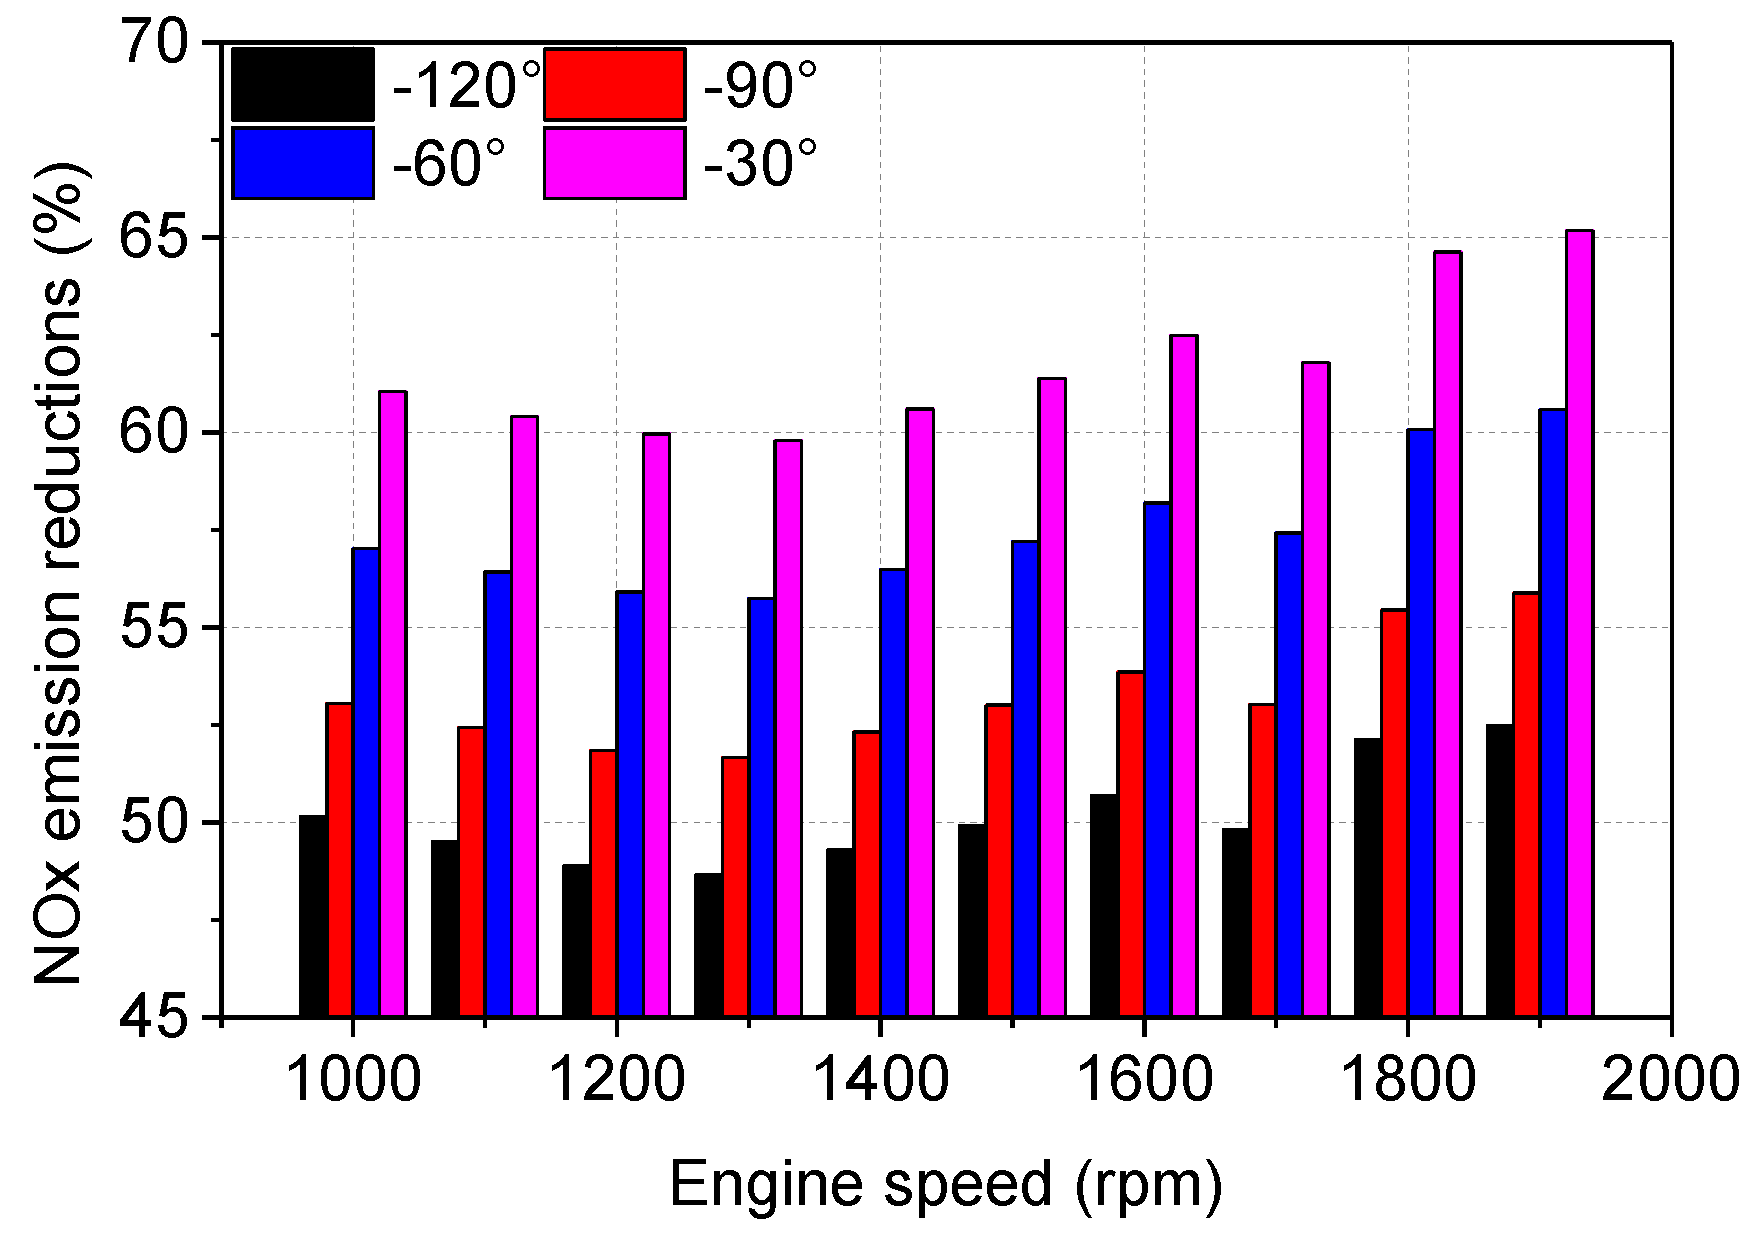
Due to the reduction of peak in-cylinder temperature when the steam is injected at the late stage of the compression stroke, the generation of NOx emissions is suppressed. The influence of steam injection timing on reduction of NOx emissions is shown in Figure 16. It can be seen that at different engine speeds, NOx emission is reduced by 21.6–26.7% as the steam injection timing slows down from −120° to −30°.
4.5. Optimal Steam Injection Mass at Different Engine Speeds
The impact of steam injection mass, temperature, and timing on engine performance and NOx emissions is discussed above. It can be concluded that steam injection mass and timing are the major parameters that affect engine performance and NOx emissions. The engine BSFC and torque performance is improved and NOx emissions are reduced significantly as the steam injection mass increases and injection timing slows down. However, steam injection mass is restricted by and , and injection timing is restricted by the in-cylinder pressure. It is difficult to inject steam near TDC when the in-cylinder pressure is ultra-high.
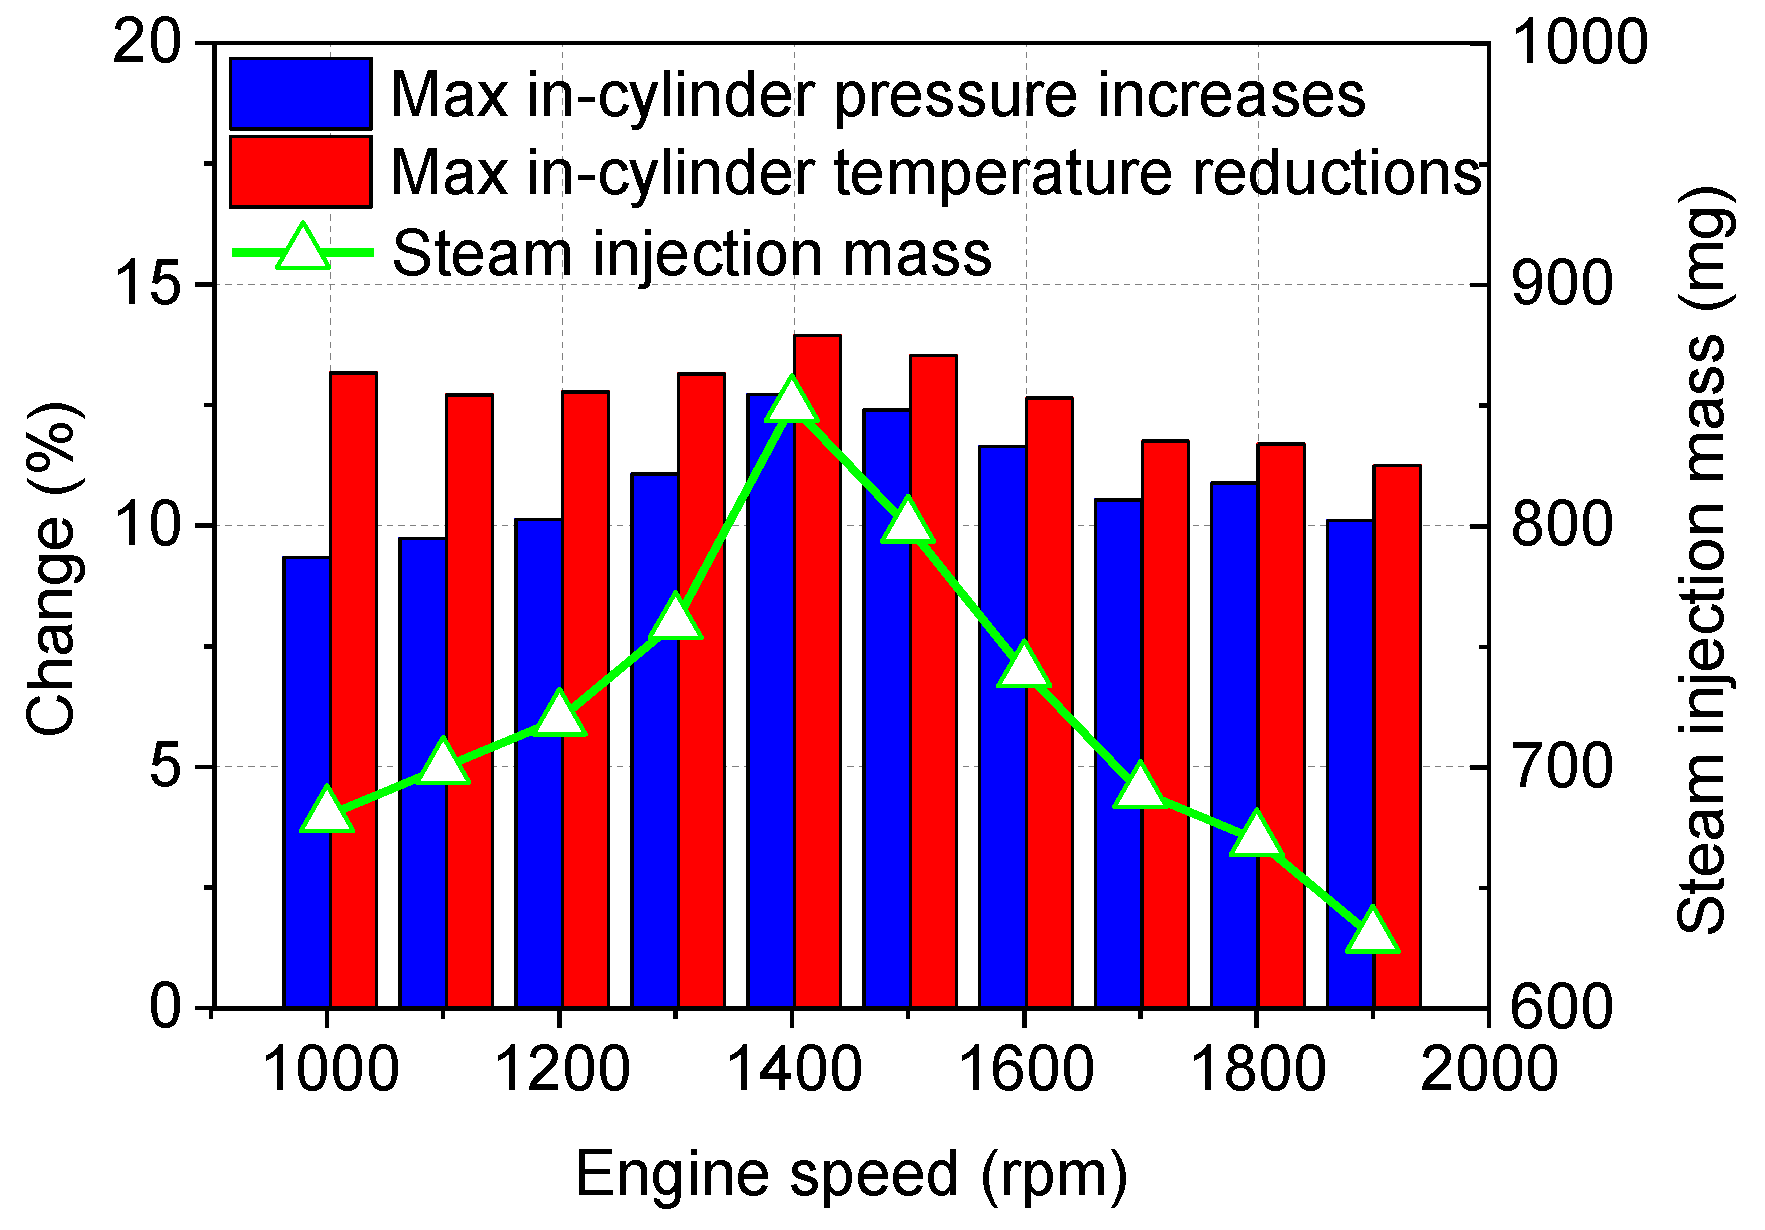
In this subsection, the steam injection timing is set at −30°. The injection temperature and pressure are 550 K and 50 bar, respectively. Under these conditions, the optimal steam injection mass and changes of maximum in-cylinder pressure and temperature are obtained, as shown in Figure 17. It can be seen that the optimal steam injection mass increases and then decreases as engine speed increases. The largest optimal steam injection mass value is 850 mg per cylinder per cycle, which occurs at 1400 rpm. At all engine speeds, the maximum in-cylinder pressure increases by 9.3–12.7% and the maximum in-cylinder temperature reduces by 11.2–13.9% at different engine speeds.
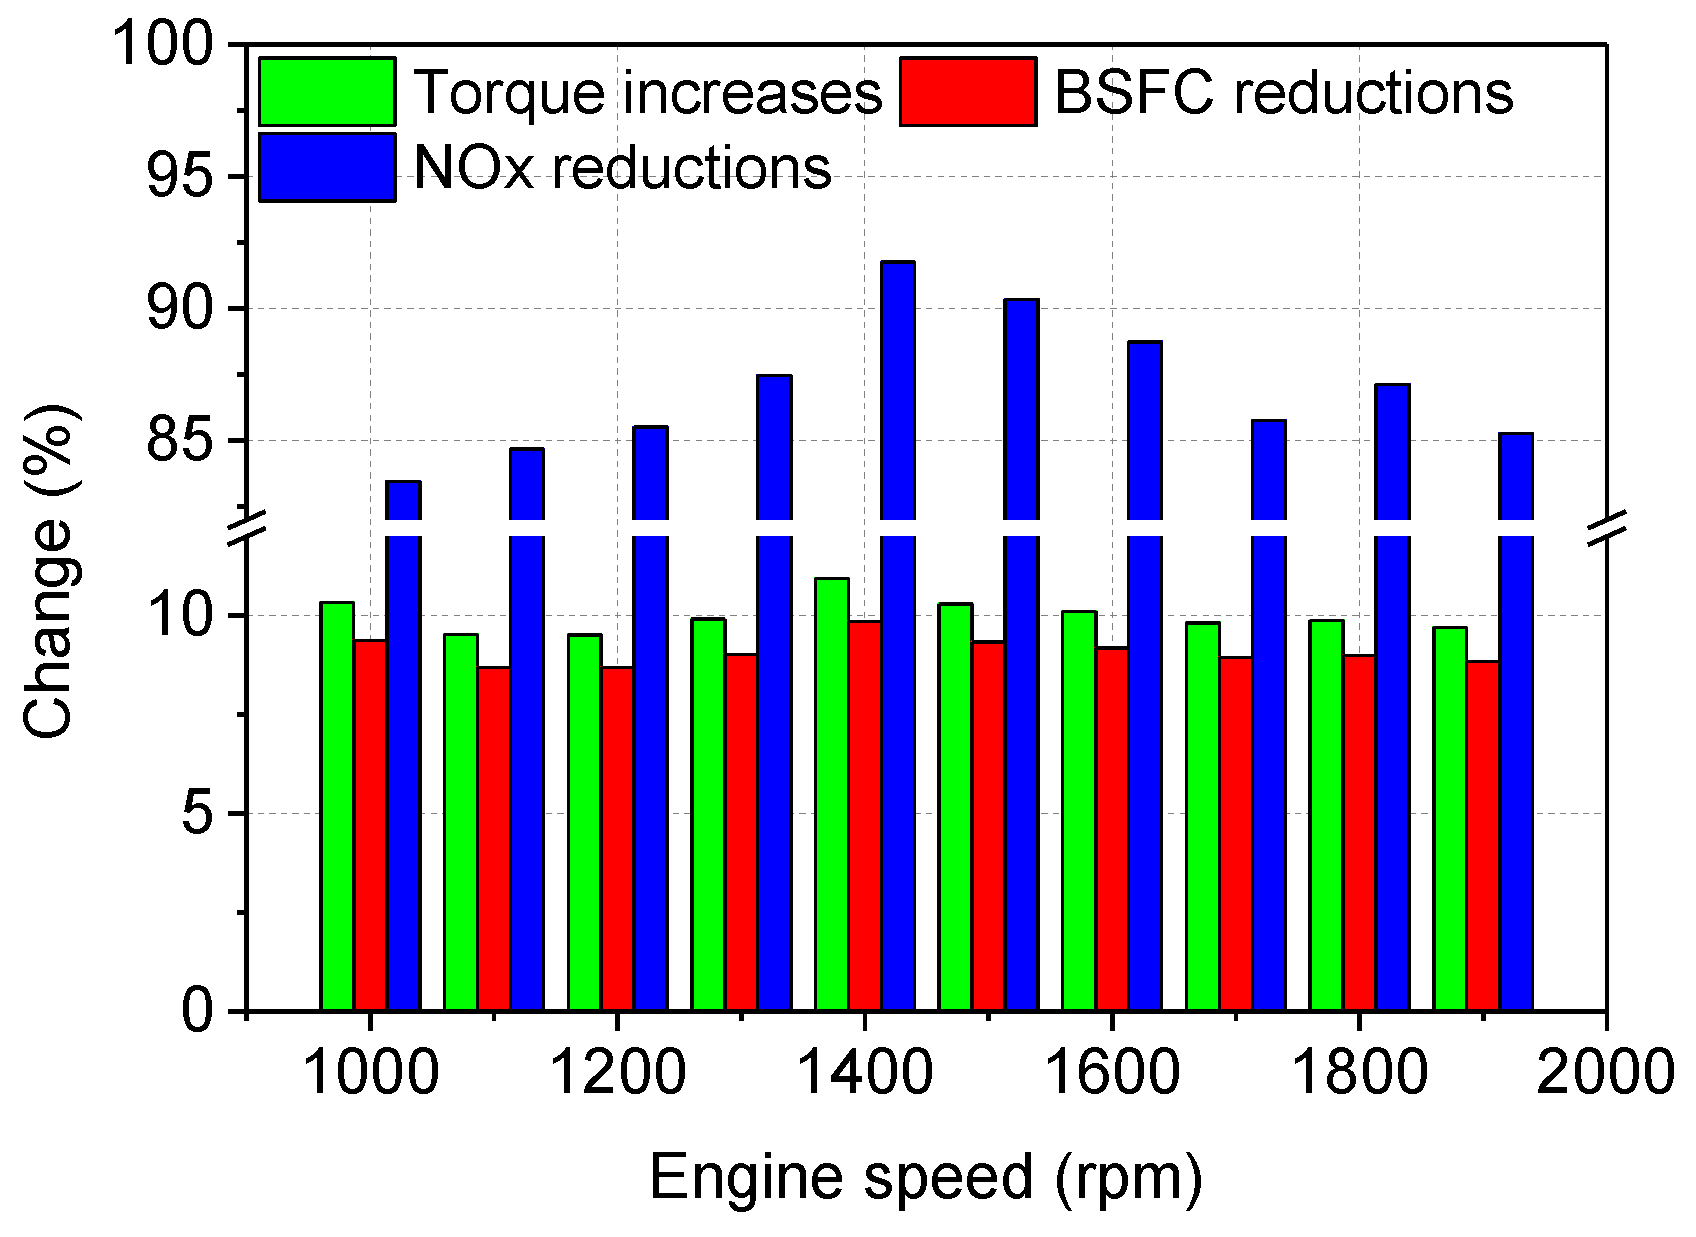
With the optimal steam injection mass, the largest improvement of engine performance and the maximum reduction of NOx emission under full load at different engine speeds conditions are presented in Figure 18. It is found that with the optimal steam injection mass value, over all engine speeds, the engine torque is increased by 9.5–10.9%, BSFC is decreased by 8.7–9.9% and NOx emission are reduced by 83.5–91.8%. In summary, in-cylinder steam injection can remarkably improve the engine performance and reduce NOx emission at all engine speed conditions.
5. Conclusions
An in-cylinder steam injection method for waste heat recovery and NOx emission reduction has been introduced. In the study, 300 K water was heated into superheated steam by exhaust. Then the superheated steam was directly injected into the cylinder during the compression stroke to increase engine power and reduce NOx emissions. The impact of steam injection mass, temperature, and timing on the performance and NOx emissions of a turbocharged diesel engine was investigated using a numerical method. In addition, the optimal steam injection mass, the largest improvement of engine performance, and the maximum reduction of NOx emissions under full load at engine speeds from 1000 rpm to 1900 rpm were obtained. Based on the above analysis, the following conclusions can be drawn.
- (1)
- The in-cylinder steam injection method can improve engine performance significantly at all engine speeds. This is because maximum in-cylinder pressure increases significantly as the working fluids in the cylinder increase after steam injection. Therefore, engine torque increases and BSFC decreases. When the steam injection timing is −30°, steam injection temperature is 550 K and steam injection pressure is 50 bar; with optimal steam injection mass, the maximum in-cylinder pressure increases by 9.3–12.7% across all engine speeds. As a result, engine torque increases by 9.5–10.9% and BSFC decreases by 8.6~9.9%.
- (2)
- With optimal steam injection mass, 83.4–91.8% reductions of NOx emissions are obtained at different engine speeds. The remarkable reduction is due to the fact that steam injection decreases maximum in-cylinder temperature and O2 concentration. The peak in-cylinder temperatures at different engine speeds are reduced by 11.2–13.9%.
- (3)
- Steam injection mass and injection timing are the key parameters that greatly influence engine performance and NOx emissions. As steam injection mass increases and injection timing slows down, engine performance is further improved and NOx emissions are lower. However, the steam injection mass is restricted by the minimum temperature difference and the exhaust temperature at the heat exchanger outlet . Besides, the injection timing is restricted by the in-cylinder pressure.
- (4)
- Steam injection temperature weakly affects engine performance. This is because the enthalpy of steam changes slightly as the steam injection temperature increases. Therefore, in-cylinder pressure and temperature are slightly impacted by the steam injection temperature. The changes of engine torque and BSFC are both within 0.4% when steam injection temperature increases from 450 K to 600 K. However, NOx emission is very sensitive to the change of in-cylinder temperature. NOx emissions increase by 17.3%, when the steam injection temperature increases from 450 K to 600 K.
In general, according to the simulation results, in-cylinder steam injection may be a good solution to both improve engine performance and reduce NOx emissions, but the data must be further confirmed by experimental tests. However, to carry out the experiment successfully, modification of the engine is complex. There are still some difficulties. Unlike water injection, which can use the fuel injector, in-cylinder steam injection is more difficult due to its compressibility. A steam injector with high response and large flux is required for such a study. However, a mature product in the market that can fulfill the requirements cannot be found. Manufacturing such an injector is not easy. Therefore, future work should be carried out to first develop an appropriate steam injector. It may take a long time to successfully apply the technology to the engine.
Acknowledgments
This work was supported by a Guangdong Province Public Welfare Research and Capacity Building Grant (Contract No. 2014B010106004).
Author Contributions
Zhongbo Zhang and Lifu Li worked together to conceive and design this innovative technology. Zhongbo Zhang performed the simulations, analyzed the data, and wrote the paper. Lifu Li contributed the analysis tools and polished the paper.
Conflicts of Interest
The authors declare no conflict of interest.
Nomenclature
| Latin symbols | |
| A | area (m2) |
| Cm | mean velocity (m/s) |
| cp | constant pressure specific heat (J/(kg·K)) |
| cv | constant volume specific heat (J/(kg·K)) |
| D | diameter of cylinder (m) |
| h | enthalpy (J/kg) |
| k | rate constant (cm3/(mol·s)) |
| l | length of connecting rod (m) |
| M | molar mass (kg/mol) |
| mass flow rate (kg/s) | |
| m | mass (kg) |
| p | pressure (Pa) |
| P | power (kW) |
| Q | heat quantity (J) |
| Rg | gas constant (J/(kg·K)) |
| r | radius of crank (m) |
| s | shape factor |
| T | temperature (K) |
| U | internal energy (J) |
| u | specific internal energy (J/kg) |
| V | stroke volume (m3) |
| v | specific volume (m3/kg) |
| Greek symbols | |
| coefficient | |
| specific heat ratio | |
| compression ratio | |
| efficiency | |
| ϕ | crank angle (°) |
| Acronyms | |
| BSFC | brake-specific fuel consumption |
| IVC | intake valve close |
| TDC | top dead center |
| Subscripts and superscripts | |
| 0–7 | locations in the engine systems |
| a | air |
| b | burn |
| e | exhaust |
| min | minimum |
| m | mixture |
| w | water or wall |
References
- Fu, J.; Liu, J.; Ren, C.; Wang, L.; Deng, B.; Xu, Z. An open steam power cycle used for IC engine exhaust gas energy recovery. Energy 2012, 44, 544–554. [Google Scholar] [CrossRef]
- Zhang, L.; Su, T.; Zhang, Y.; Ma, F.; Yin, J.; Feng, Y. Numerical Investigation of the Effects of Split Injection Strategies on Combustion and Emission in an Opposed-Piston, Opposed-Cylinder (OPOC) Two-Stroke Diesel Engine. Energies 2017, 10, 684. [Google Scholar] [CrossRef]
- Andwari, A.M.; Pesiridis, A.; Esfahanian, V.; Salavati-Zadeh, A.; Karvountzis-Kontakiotis, A.; Muralidharan, V. A Comparative Study of the Effect of Turbocompounding and ORC Waste Heat Recovery Systems on the Performance of a Turbocharged Heavy-Duty Diesel Engine. Energies 2017, 10, 1087. [Google Scholar] [CrossRef]
- Feng, L.; Tian, J.; Long, W.; Gong, W.; Du, B.; Li, D.; Chen, L. Decreasing NOx of a Low-Speed Two-Stroke Marine Diesel Engine by Using In-Cylinder Emission Control Measures. Energies 2016, 9, 304. [Google Scholar] [CrossRef]
- Zamboni, G.; Moggia, S.; Capobianco, M. Effects of a Dual-Loop Exhaust Gas Recirculation System and Variable Nozzle Turbine Control on the Operating Parameters of an Automotive Diesel Engine. Energies 2017, 10, 47. [Google Scholar] [CrossRef]
- Latz, G.; Erlandsson, O.; Skare, T.; Contet, A.; Andersson, S.; Munch, K. Performance Analysis of a Reciprocating Piston Expander and a Plate Type Exhaust Gas Recirculation Boiler in a Water-Based Rankine Cycle for Heat Recovery from a Heavy Duty Diesel Engine. Energies 2016, 9, 495. [Google Scholar] [CrossRef]
- Altosole, M.; Benvenuto, G.; Campora, U.; Laviola, M.; Trucco, A. Waste Heat Recovery from Marine Gas Turbines and Diesel Engines. Energies 2017, 10, 718. [Google Scholar] [CrossRef]
- Song, H.; Quinton, K.S.; Peng, Z.; Zhao, H.; Ladommatos, N. Effects of Oxygen Content of Fuels on Combustion and Emissions of Diesel Engines. Energies 2016, 9, 28. [Google Scholar] [CrossRef]
- Tesfa, B.; Mishra, R.; Gu, F.; Ball, A.D. Water injection effects on the performance and emission characteristics of a CI engine operating with biodiesel. Renew. Energy 2012, 37, 333–344. [Google Scholar] [CrossRef]
- Tauzia, X.; Maiboom, A.; Shah, S.R. Experimental study of inlet manifold water injection on combustion and emissions of an automotive direct injection Diesel engine. Energy 2010, 35, 3628–3639. [Google Scholar] [CrossRef]
- Bozza, F.; De Bellis, V.; Teodosio, L. Potentials of cooled EGR and water injection for knock resistance and fuel consumption improvements of gasoline engines. Appl. Energy 2016, 169, 112–125. [Google Scholar] [CrossRef]
- Kim, J.; Park, H.; Bae, C.; Choi, M.; Kwak, Y. Effects of water direct injection on the torque enhancement and fuel consumption reduction of a gasoline engine under high-load conditions. Int. J. Engine Res. 2016, 17, 795–808. [Google Scholar] [CrossRef]
- Hoppe, F.; Thewes, M.; Baumgarten, H.; Dohmen, J. Water injection for gasoline engines: Potentials, challenges, and solutions. Int. J. Engine Res. 2016, 17, 86–96. [Google Scholar] [CrossRef]
- Wu, Z.-J.; Yu, X.; Fu, L.-Z.; Deng, J.; Hu, Z.-J.; Li, L.-G. A high efficiency oxyfuel internal combustion engine cycle with water direct injection for waste heat recovery. Energy 2014, 70, 110–120. [Google Scholar] [CrossRef]
- Wu, Z.-J.; Yu, X.; Fu, L.-Z.; Deng, J.; Li, L.-G. Experimental study of the effect of water injection on the cycle performance of an internal-combustion Rankine cycle engine. Proc. Inst. Mech. Eng. Part D J. Autom. Eng. 2014, 228, 580–588. [Google Scholar] [CrossRef]
- Conklin, J.C.; Szybist, J.P. A highly efficient six-stroke internal combustion engine cycle with water injection for in-cylinder exhaust heat recovery. Energy 2010, 35, 1658–1664. [Google Scholar] [CrossRef]
- Arabaci, E.; Icingur, Y.; Solmaz, H.; Uyumaz, A.; Yilmaz, E. Experimental investigation of the effects of direct water injection parameters on engine performance in a six-stroke engine. Energy Convers. Manag. 2015, 98, 89–97. [Google Scholar] [CrossRef]
- Parlak, A.; Ayhan, V.; Ust, Y.; Sahin, B.; Cesur, I.; Boru, B.; Kokkulunk, G. New method to reduce NOx emissions of diesel engines: Electronically controlled steam injection system. J. Energy Inst. 2012, 85, 135–139. [Google Scholar] [CrossRef]
- Cesur, I.; Parlak, A.; Ayhan, V.; Boru, B.; Gonca, G. The effects of electronic controlled steam injection on spark ignition engine. Appl. Therm. Eng. 2013, 55, 61–68. [Google Scholar] [CrossRef]
- Kokkulunk, G.; Gonca, G.; Ayhan, V.; Cesur, I.; Parlak, A. Theoretical and experimental investigation of diesel engine with steam injection system on performance and emission parameters. Appl. Therm. Eng. 2013, 54, 161–170. [Google Scholar] [CrossRef]
- Kokkulunk, G.; Parlak, A.; Ayhan, V.; Cesur, I.; Gonca, G.; Boru, B. Theoretical and experimental investigation of steam injected diesel engine with EGR. Energy 2014, 74, 331–339. [Google Scholar] [CrossRef]
- Gonca, G. Investigation of the effects of steam injection on performance and NO emissions of a diesel engine running with ethanol-diesel blend. Energy Convers. Manag. 2014, 77, 450–457. [Google Scholar] [CrossRef]
- Gonca, G.; Sahin, B. Simulation of performance and nitrogen oxide formation of a hydrogen-enriched diesel engine with the steam injection method. Therm. Sci. 2015, 19, 1985–1994. [Google Scholar] [CrossRef]
- Gonca, G. Investigation of the influences of steam injection on the equilibrium combustion products and thermodynamic properties of bio fuels (biodiesels and alcohols). Fuel 2015, 144, 244–258. [Google Scholar] [CrossRef]
- Gonca, G.; Sahin, B.; Parlak, A.; Ust, Y.; Ayhan, V.; Cesur, I.; Boru, B. The effects of steam injection on the performance and emission parameters of a Miller cycle diesel engine. Energy 2014, 78, 266–275. [Google Scholar] [CrossRef]
- Gonca, G.; Sahin, B.; Ust, Y.; Parlak, A.; Safa, A. Comparison of steam injected diesel engine and Miller cycled diesel engine by using two zone combustion model. J. Energy Inst. 2015, 88, 43–52. [Google Scholar] [CrossRef]
- Gonca, G.; Sahin, B. The influences of the engine design and operating parameters on the performance of a turbocharged and steam injected diesel engine running with the Miller cycle. Appl. Math. Model. 2016, 40, 3764–3782. [Google Scholar] [CrossRef]
- Gonca, G.; Sahin, B. Effect of turbo charging and steam injection methods on the performance of a Miller cycle diesel engine (MCDE). Appl. Therm. Eng. 2017, 118, 138–146. [Google Scholar] [CrossRef]
- Gonca, G.; Sahin, B.; Parlak, A.; Ayhan, V.; Cesur, I.; Koksal, S. Investigation of the effects of the steam injection method (SIM) on the performance and emission formation of a turbocharged and Miller cycle diesel engine (MCDE). Energy 2017, 119, 926–937. [Google Scholar] [CrossRef]
- Fu, J.; Liu, J.; Wang, Y.; Deng, B.; Yang, Y.; Feng, R.; Yang, J. A comparative study on various turbocharging approaches based on IC engine exhaust gas energy recovery. Appl. Energy 2014, 113, 248–257. [Google Scholar] [CrossRef]
- Fu, J.; Liu, J.; Yang, Y.; Ren, C.; Zhu, G. A new approach for exhaust energy recovery of internal combustion engine: Steam turbocharging. Appl. Therm. Eng. 2013, 52, 150–159. [Google Scholar] [CrossRef]
- Fu, J.; Liu, J.; Deng, B.; Feng, R.; Yang, J.; Zhou, F.; Zhao, X. An approach for exhaust gas energy recovery of internal combustion engine: Steam-assisted turbocharging. Energy Convers. Manag. 2014, 85, 234–244. [Google Scholar] [CrossRef]
- Zhu, S.; Deng, K.; Qu, S. Thermodynamic analysis of an in-cylinder waste heat recovery system for internal combustion engines. Energy 2014, 67, 548–556. [Google Scholar] [CrossRef]
- Zhu, S.; Liu, S.; Qu, S.; Deng, K. Thermodynamic and experimental researches on matching strategies of the pre-turbine steam injection and the Miller cycle applied on a turbocharged diesel engine. Energy 2017, 140, 488–505. [Google Scholar] [CrossRef]
- Zhao, R.; Li, W.; Zhuge, W.; Zhang, Y.; Yin, Y. Numerical study on steam injection in a turbocompound diesel engine for waste heat recovery. Appl. Energy 2017, 185, 506–518. [Google Scholar] [CrossRef]
- Rakopoulos, C.D.; Dimaratos, A.M.; Giakoumis, E.G.; Rakopoulos, D.C. Exhaust emissions estimation during transient turbocharged diesel engine operation using a two-zone combustion model. Int. J. Veh. Des. 2009, 49, 125–149. [Google Scholar] [CrossRef]
- NIST Standard Reference Database 23; REFPROP Version 7.1; The U.S. Secretary of Commerce: Washington, DC, USA, 2003.
- Ghouma, I.; Jeguirim, M.; Sager, U.; Limousy, L.; Bennici, S.; Daeuber, E.; Asbach, C.; Ligotski, R.; Schmidt, F.; Ouederni, A. The Potential of Activated Carbon Made of Agro-Industrial Residues in NOx Immissions Abatement. Energies 2017, 10, 1508. [Google Scholar] [CrossRef]
Figure 1.
(a) Schematic of the turbocharged diesel engine with in-cylinder steam injection; (b) steam injection timing range.
Figure 1.
(a) Schematic of the turbocharged diesel engine with in-cylinder steam injection; (b) steam injection timing range.

Figure 2.
Enthalpy-entropy (T-S) diagram of the process of generating superheated steam.

Figure 3.
Comparison of in-cylinder pressure profiles at 1900 rpm and 1200 rpm under full load conditions: (a) 1900 rpm; (b) 1200 rpm.
Figure 3.
Comparison of in-cylinder pressure profiles at 1900 rpm and 1200 rpm under full load conditions: (a) 1900 rpm; (b) 1200 rpm.

Figure 4.
Validation of the turbocharged diesel engine simulation model: (a) brake-specific fuel consumption (BSFC); (b) torque; (c) NOx emissions; (d) exhaust temperature (at the turbine outlet).
Figure 4.
Validation of the turbocharged diesel engine simulation model: (a) brake-specific fuel consumption (BSFC); (b) torque; (c) NOx emissions; (d) exhaust temperature (at the turbine outlet).

Figure 5.
Impact of steam injection mass and temperature on and at engine speed 1900 rpm (steam injection timing = −90°, steam injection pressure = 8 bar). (a) Minimum temperature difference ; (b) exhaust temperature at heat exchange outlet .
Figure 5.
Impact of steam injection mass and temperature on and at engine speed 1900 rpm (steam injection timing = −90°, steam injection pressure = 8 bar). (a) Minimum temperature difference ; (b) exhaust temperature at heat exchange outlet .

Figure 6.
The influence of steam injection mass on in-cylinder pressure and temperature at engine speed 1900 rpm (steam injection timing = −90°, steam injection pressure = 8 bar, steam injection temperature = 500 K). (a) In-cylinder pressure; (b) in-cylinder temperature.
Figure 6.
The influence of steam injection mass on in-cylinder pressure and temperature at engine speed 1900 rpm (steam injection timing = −90°, steam injection pressure = 8 bar, steam injection temperature = 500 K). (a) In-cylinder pressure; (b) in-cylinder temperature.
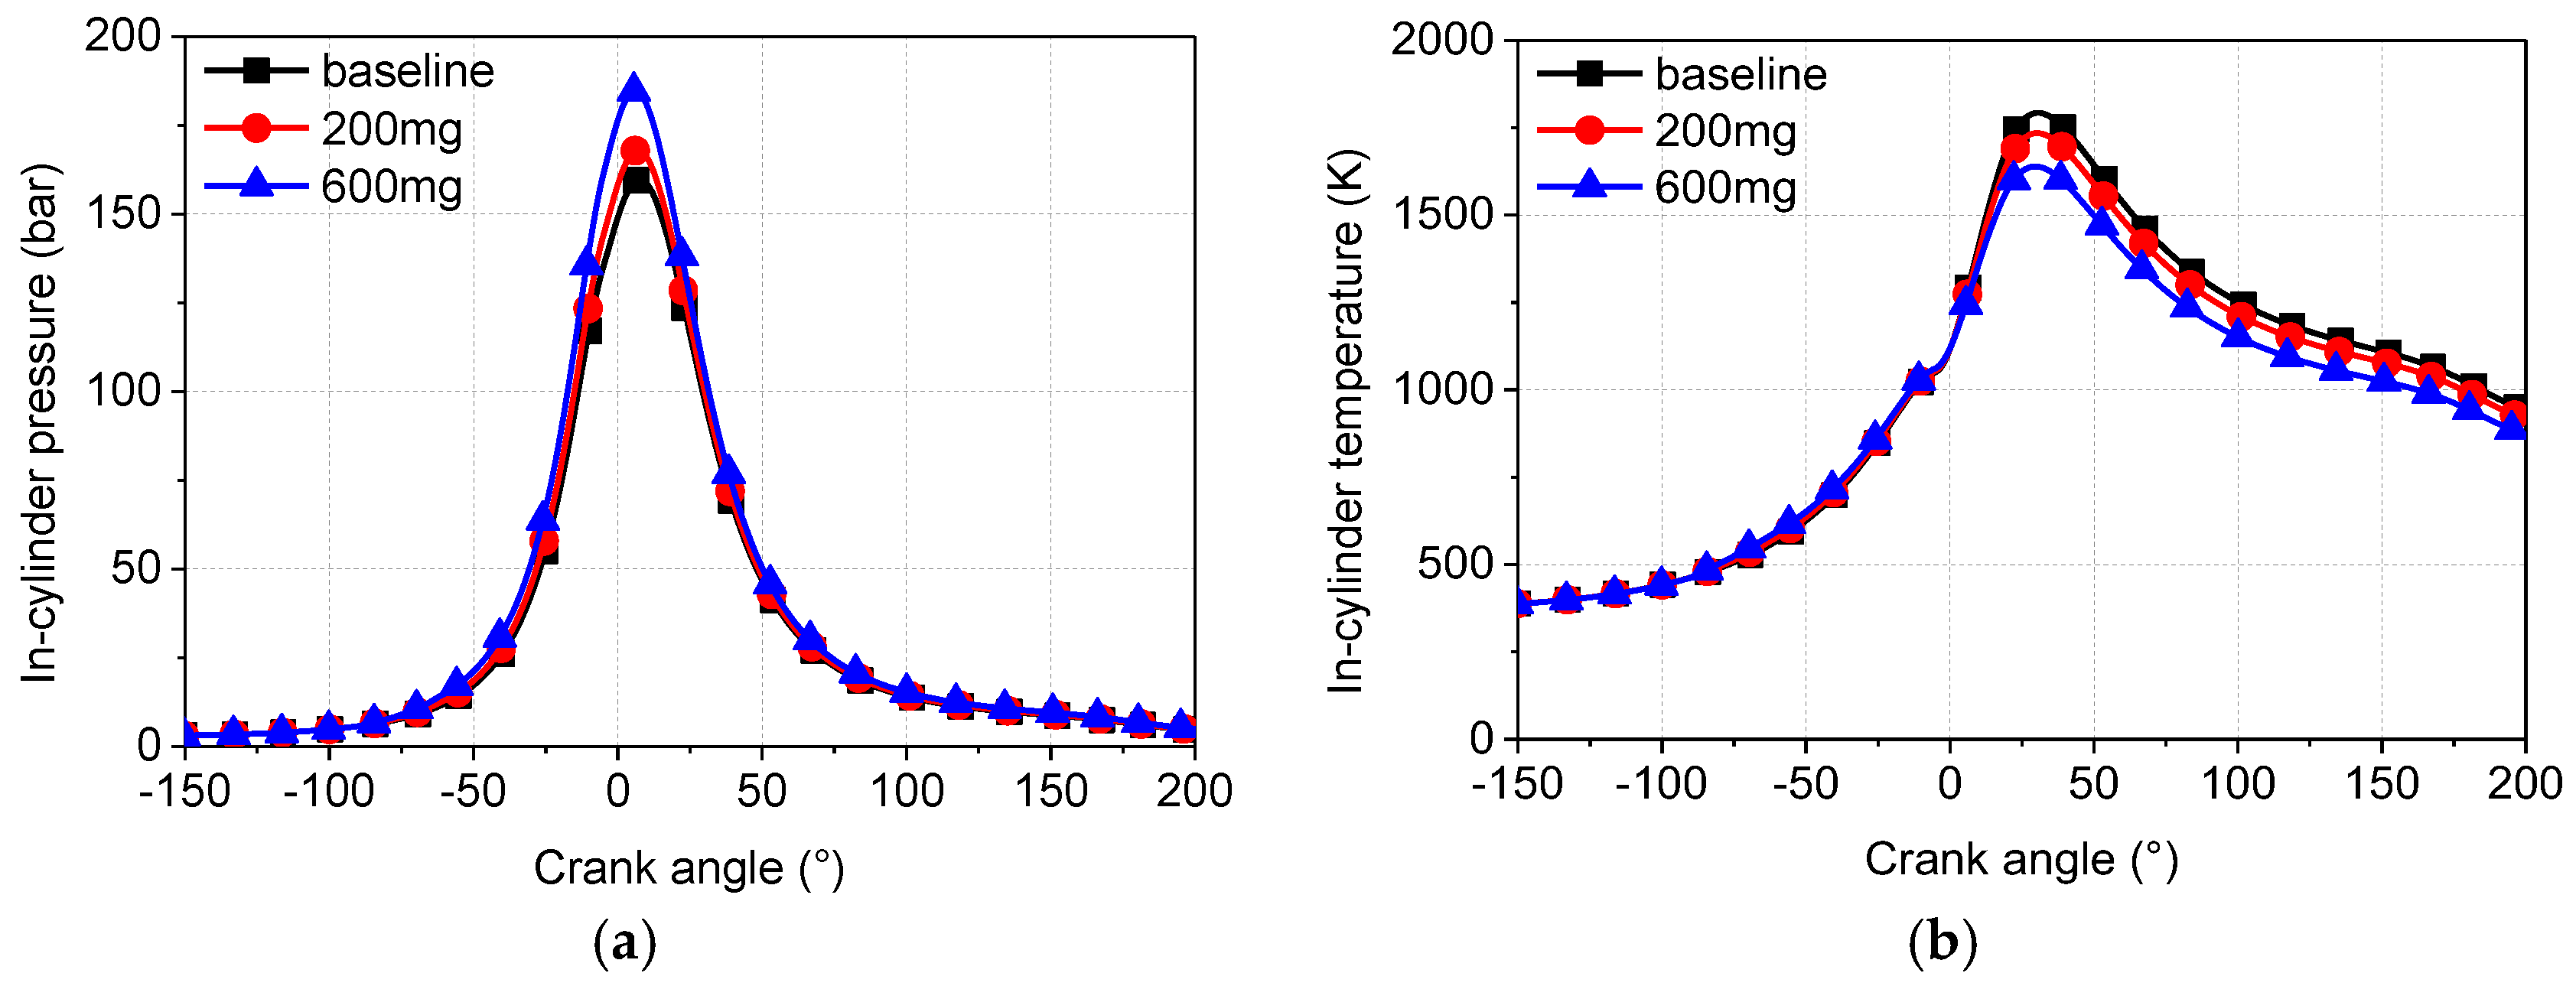
Figure 7.
The influence of steam injection mass on engine torque at different engine speeds (steam injection timing = −90°, steam injection pressure = 8 bar, steam injection temperature = 500 K).
Figure 7.
The influence of steam injection mass on engine torque at different engine speeds (steam injection timing = −90°, steam injection pressure = 8 bar, steam injection temperature = 500 K).

Figure 8.
The influence of steam injection mass on BSFC at different engine speeds (steam injection timing = −90°, steam injection pressure = 8 bar, steam injection temperature = 500 K).
Figure 8.
The influence of steam injection mass on BSFC at different engine speeds (steam injection timing = −90°, steam injection pressure = 8 bar, steam injection temperature = 500 K).

Figure 9.
The influence of steam injection mass on reduction of NOx emissions at different engine speeds (steam injection timing = −90°, steam injection pressure = 8 bar, steam injection temperature = 500 K).
Figure 9.
The influence of steam injection mass on reduction of NOx emissions at different engine speeds (steam injection timing = −90°, steam injection pressure = 8 bar, steam injection temperature = 500 K).

Figure 10.
The influence of steam injection temperature on in-cylinder pressure and temperature at engine speed 1900 rpm (steam injection mass = 400 mg, steam injection timing = −90°, steam injection pressure = 8 bar). (a) In-cylinder pressure; (b) in-cylinder temperature.
Figure 10.
The influence of steam injection temperature on in-cylinder pressure and temperature at engine speed 1900 rpm (steam injection mass = 400 mg, steam injection timing = −90°, steam injection pressure = 8 bar). (a) In-cylinder pressure; (b) in-cylinder temperature.
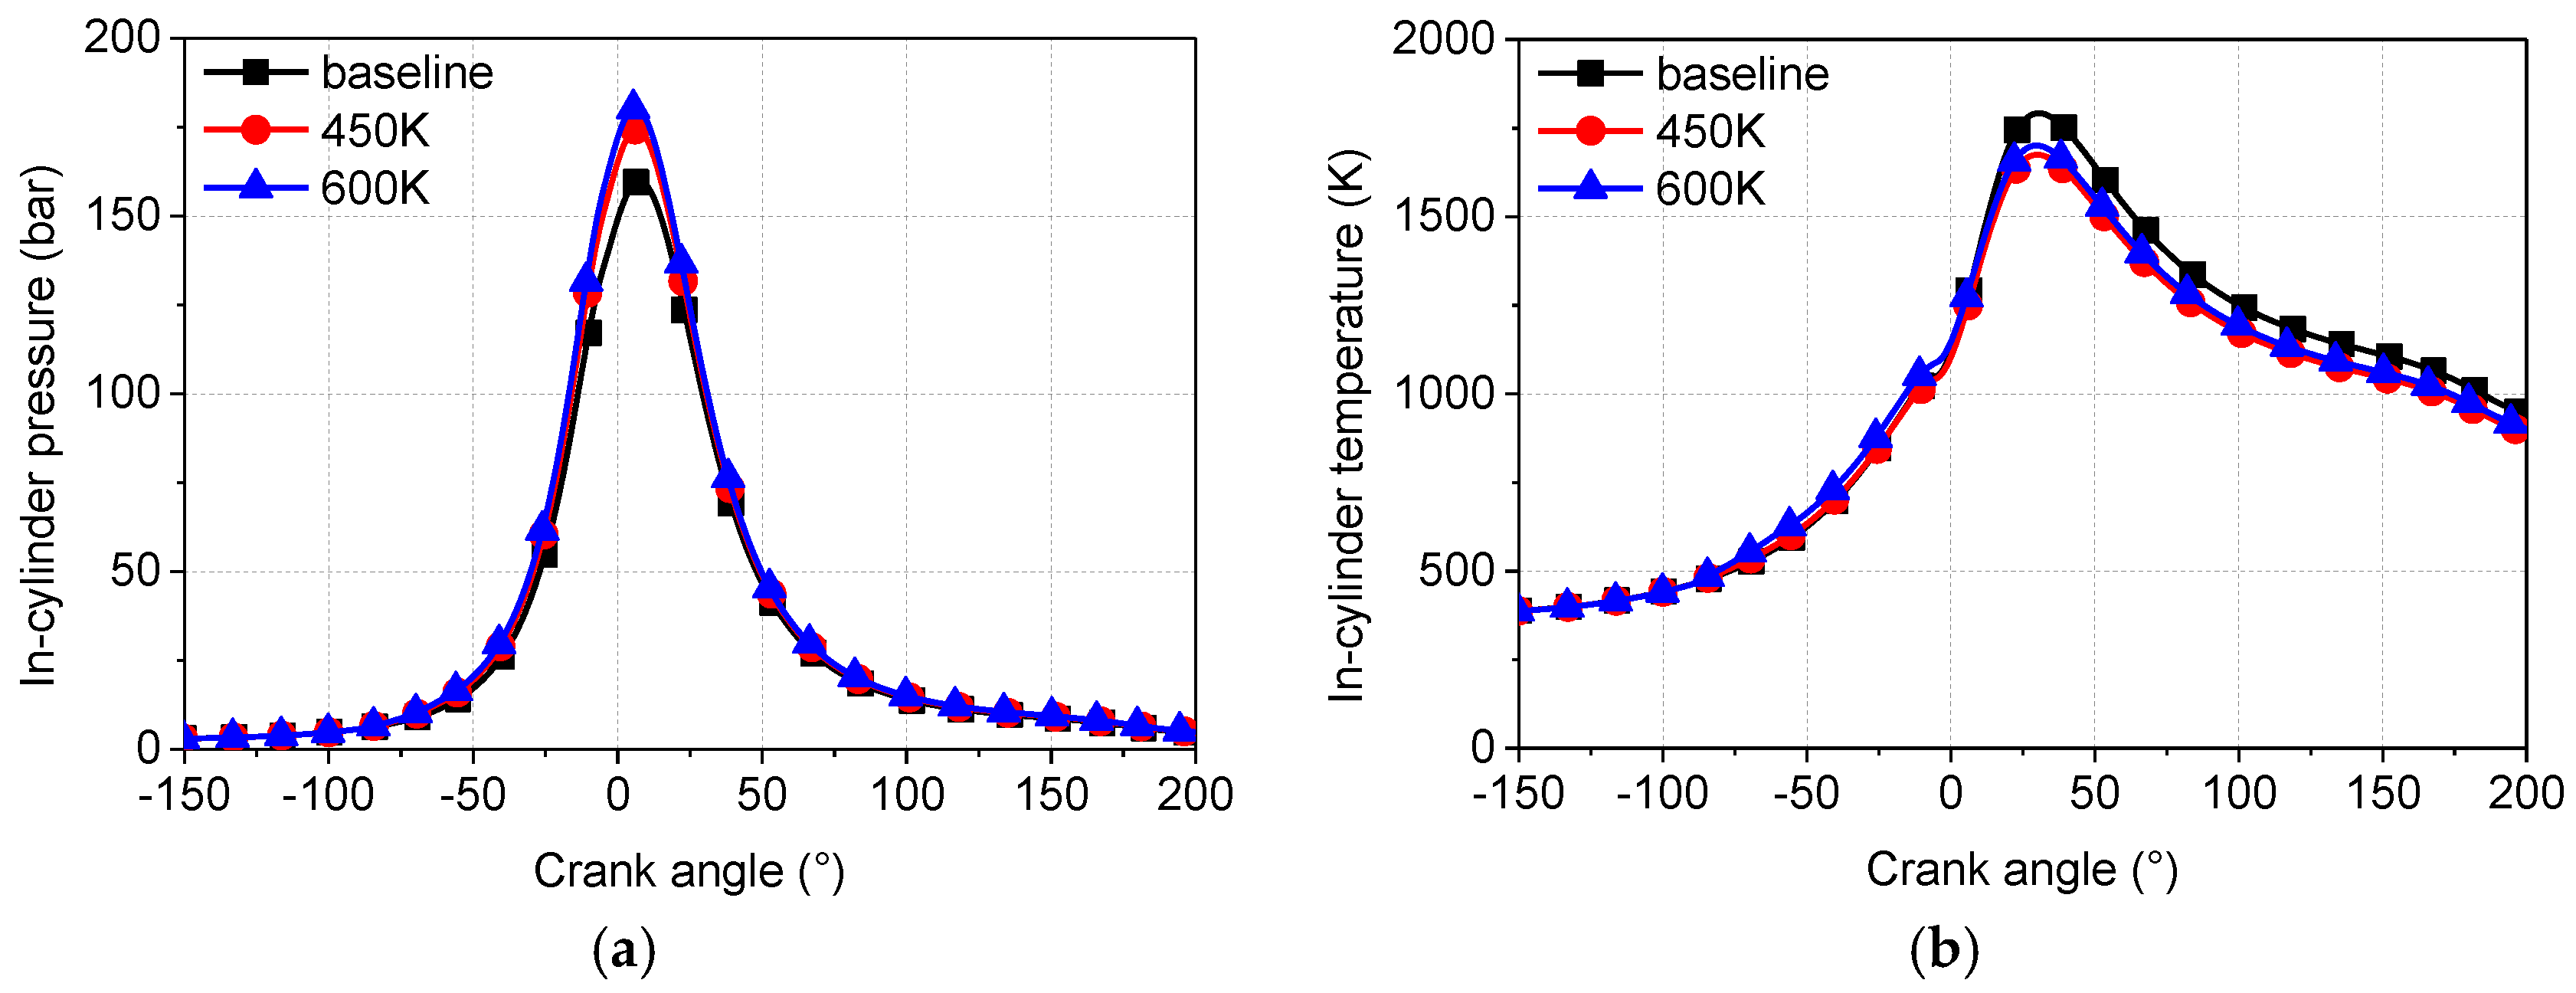
Figure 11.
The influence of steam injection temperature on torque, BSFC, and NOx emissions at engine speed 1900 rpm (steam injection mass = 400 mg, steam injection timing = −90°, steam injection pressure = 8 bar).
Figure 11.
The influence of steam injection temperature on torque, BSFC, and NOx emissions at engine speed 1900 rpm (steam injection mass = 400 mg, steam injection timing = −90°, steam injection pressure = 8 bar).

Figure 12.
Minimum steam injection pressure with different steam injection timings at various engine speeds.
Figure 12.
Minimum steam injection pressure with different steam injection timings at various engine speeds.

Figure 13.
The influence of steam injection timing on in-cylinder pressure and temperature at engine speed 1900 rpm (steam injection mass = 400 mg, steam injection pressure = 50 bar, steam injection temperature = 550 K). (a) In-cylinder pressure; (b) in-cylinder temperature.
Figure 13.
The influence of steam injection timing on in-cylinder pressure and temperature at engine speed 1900 rpm (steam injection mass = 400 mg, steam injection pressure = 50 bar, steam injection temperature = 550 K). (a) In-cylinder pressure; (b) in-cylinder temperature.

Figure 14.
The influence of steam injection timing on engine torque at different engine speeds (steam injection mass = 400 mg, steam injection pressure = 50 bar, steam injection temperature = 550 K).
Figure 14.
The influence of steam injection timing on engine torque at different engine speeds (steam injection mass = 400 mg, steam injection pressure = 50 bar, steam injection temperature = 550 K).

Figure 15.
The influence of steam injection timing on BSFC at different engine speeds (steam injection mass = 400 mg, steam injection pressure = 50 bar, steam injection temperature = 550 K).
Figure 15.
The influence of steam injection timing on BSFC at different engine speeds (steam injection mass = 400 mg, steam injection pressure = 50 bar, steam injection temperature = 550 K).
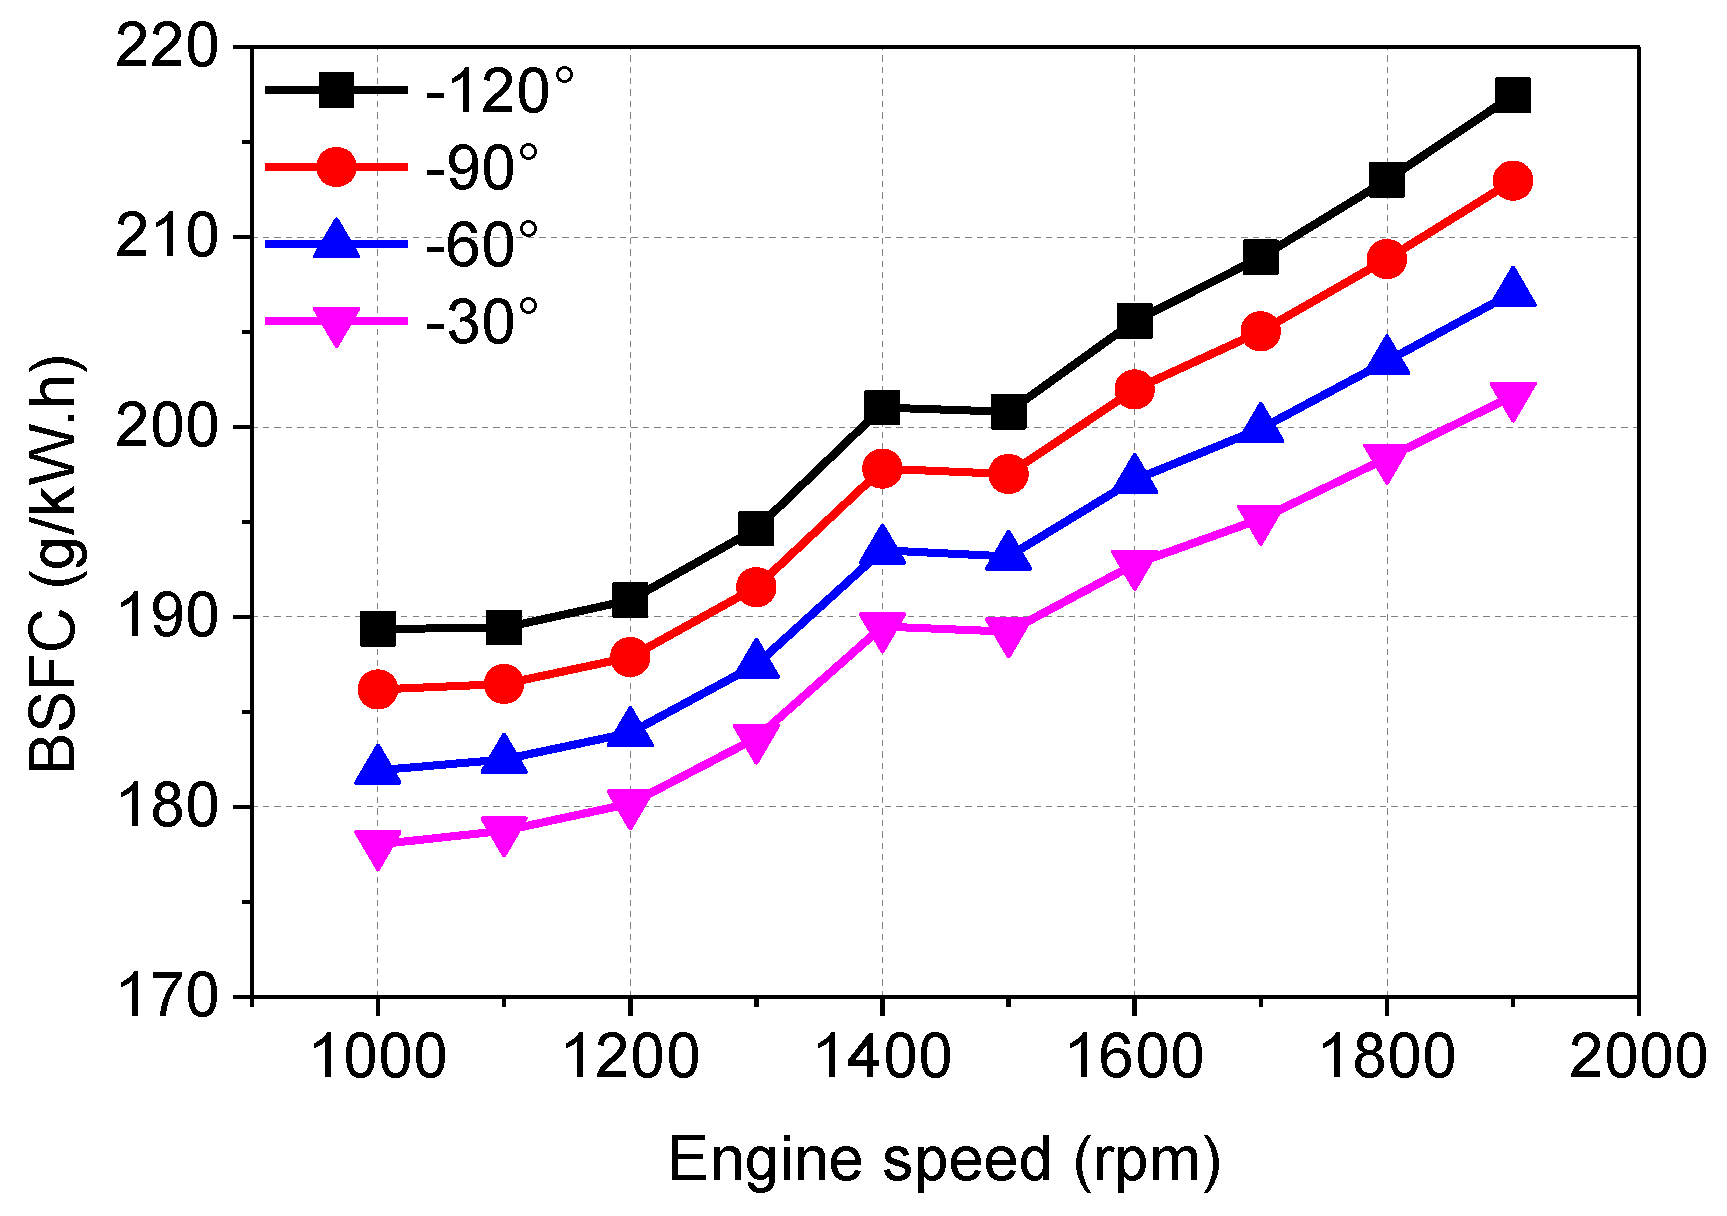
Figure 16.
The influence of steam injection timing on reduction of NOx emissions at different engine speeds (steam injection mass = 400 mg, steam injection pressure = 50 bar, steam injection temperature = 550 K).
Figure 16.
The influence of steam injection timing on reduction of NOx emissions at different engine speeds (steam injection mass = 400 mg, steam injection pressure = 50 bar, steam injection temperature = 550 K).

Figure 17.
The optimal values of steam injection mass and the changings of the maximum in-cylinder pressure and temperature (steam injection timing = −30°, steam injection temperature = 550 K, steam injection pressure = 50 bar).
Figure 17.
The optimal values of steam injection mass and the changings of the maximum in-cylinder pressure and temperature (steam injection timing = −30°, steam injection temperature = 550 K, steam injection pressure = 50 bar).

Figure 18.
The largest improvements of engine torque and BSFC and maximum reductions of NOx emissions with optimal steam injection mass at different engine speeds (steam injection timing = −30°, steam injection temperature = 550 K, steam injection pressure = 50 bar).
Figure 18.
The largest improvements of engine torque and BSFC and maximum reductions of NOx emissions with optimal steam injection mass at different engine speeds (steam injection timing = −30°, steam injection temperature = 550 K, steam injection pressure = 50 bar).


Table 1.
Specifications of the turbocharged diesel engine.
| Parameter | Value |
|---|---|
| Number of cylinders | 6 |
| Displacement | 11 L |
| Compression ratio | 16.4 |
| Bore | 123 mm |
| Stroke | 156 mm |
| Maximum power | 298 kW@1900 rpm |
| Maximum torque | 1825 Nm@1200 rpm |
| Emission standards | Euro IV |
Table 2.
Errors of measured parameters.
| Parameter | Measurement Range | Systematic Error |
|---|---|---|
| Engine torque | 0–2800 Nm | ±5.6 Nm |
| Engine speed | 0–5000 rpm | ±1 rpm |
| NOx emissions | 0–5000 ppm | ±4% of measured value |
| Fuel consumption | 5–150 kg/h | ±0.2% of measured value |
| Exhaust temperature | 0–980 °C | ±2.2 °C |
© 2018 by the authors. Licensee MDPI, Basel, Switzerland. This article is an open access article distributed under the terms and conditions of the Creative Commons Attribution (CC BY) license (http://creativecommons.org/licenses/by/4.0/).
Share and Cite
MDPI and ACS Style
Zhang, Z.; Li, L. Investigation of In-Cylinder Steam Injection in a Turbocharged Diesel Engine for Waste Heat Recovery and NOx Emission Control. Energies 2018, 11, 936. https://doi.org/10.3390/en11040936
AMA Style
Zhang Z, Li L. Investigation of In-Cylinder Steam Injection in a Turbocharged Diesel Engine for Waste Heat Recovery and NOx Emission Control. Energies. 2018; 11(4):936. https://doi.org/10.3390/en11040936
Chicago/Turabian StyleZhang, Zhongbo, and Lifu Li. 2018. "Investigation of In-Cylinder Steam Injection in a Turbocharged Diesel Engine for Waste Heat Recovery and NOx Emission Control" Energies 11, no. 4: 936. https://doi.org/10.3390/en11040936
Note that from the first issue of 2016, this journal uses article numbers instead of page numbers. See further details here.