Anisotropic Damage to Hard Brittle Shale with Stress and Hydration Coupling


1
State Key Laboratory of Oil & Gas Reservoir Geology and Exploitation, Southwest Petroleum University, Chengdu 610500, China
2
State Key Laboratory of Geomechanics and Geotechnical Engineering, Institute of Rock and Soil Mechanics, Chinese Academy of Sciences (CAS), Wuhan 430071, China
3
Maintenance Center of Northwest Sichuan Gas Field, Southwest Oil and Gas Field Branch, Jiangyou 621709, China
*
Authors to whom correspondence should be addressed.
Energies 2018, 11(4), 926; https://doi.org/10.3390/en11040926
Submission received: 7 March 2018
/
Revised: 31 March 2018
/
Accepted: 12 April 2018
/
Published: 13 April 2018
(This article belongs to the Special Issue Unconventional Natural Gas (UNG) Recoveries 2018)
Abstract
:Acoustic-wave velocities of shale rocks with different coring angles were tested by an acoustic-emission experiment under different confining pressures and soaking time of drilling fluid. Effects of stress and hydration coupling on the acoustic-wave velocities, elastic parameters, and anisotropic damage were analyzed and investigated. The following results were obtained: (1) Acoustic-wave velocities of shale rocks are related to the confining pressure, soaking time, and coring angles. (2) Both Young’s modulus and Poisson’s ratios increase with confining pressure under the same soaking time; under the same confining pressure, the changes of Young’s modulus and Poisson’s ratios with time are not as obvious as the confining pressure, but it shows that the Young’s modulus decreases, while the Poisson’s ratios increase. (3) With increasing confining pressure, the Thomsen coefficient ε showed an increasing trend, whereas the Thomsen coefficient γ exhibited the opposite trend; further, the anisotropy coefficient of P-wave (ε) is larger than the anisotropy coefficient of S-wave (γ). (4) Damage parameters parallel to bedding are greater than those perpendicular to bedding; when the confining pressure increases, the fracture pores gradually close, and both vertical and horizontal damage parameters are reduced.
1. Introduction
With the exhaustion of conventional oil and gas resources, some unconventional oil and gas resources—such as tight sandstone oil and gas, shale oil and gas, and coalbed methane and gas hydrate—have received much attention [1,2,3,4]. Shale gas is a very important unconventional energy source. Affected by the revolution of shale gas development in North America, Chinese petroleum companies, such as Petro China, Sinopec, Yanchang Petro, and CNOOC, have also begun to explore and exploit shale gas. In China, the main enrichment areas of shale gas are located in the marine sedimentary basins of South China, and the main productive layers are distributed in the middle and deep strata of the Jurassic, Triassic, Permian, and Carboniferous [5,6]. The major technologies of shale gas development are horizontal drilling and hydraulic fracturing. However, shale rocks are usually characterized by low permeability, being rich in clay minerals, well-developed bedding planes and micro-cracks, and strong hardness-brittleness, which makes it difficult to conduct horizontal drilling and hydraulic fracturing in shale gas formations [6,7,8,9].
In the process of horizontal drilling, wellbore collapse, drilling fluid loss, and other wellbore stability problems are often encountered [10,11,12]. In the process of hydraulic fracturing, the bedding surface with weak cementation often precedes the shale body cracking, causing hydraulic fractures to extend along the bedding plane in the process of extension, thus restraining the formation of the crack network and reducing the hydraulic fracturing effectiveness [13]. Many microcracks exist in the shale formation, and wellbore instability in drilling and fracturing expansion in hydraulic fracturing can be regarded as the process by which the microcracks expand, collate, and form macroscopic cracks under the influence of external factors (mechanical and chemical factors), which then further develop until destruction. Moreover, the interaction of fluids with shale also leads to further expansion of microcracks and leads to deterioration of rock strength [8,9,14,15,16,17]. Therefore, ascertaining the characteristics of wave-velocity response and its reflected mechanical properties, anisotropic characteristics, and damage characteristics is especially important for the study of borehole stability during drilling and the analysis of crack propagation during hydraulic fracturing. Drilling and hydraulic fracturing are always affected by in situ stress, and rock damage is always accompanied by changes in stress. Based on a dispersion damage model, many researchers have studied the anisotropic rock damage under stress-dependent conditions. Mavko [18] argued that the stress anisotropy is caused by discontinuous microcracks in the rock. With a simple model proposed by Schoenberg [19], Sayers and co-workers [20,21] pointed out that the failure of the rock during pressurization is due to the expansion and connectivity of the microcracks with directional distribution in the rock, and the anisotropy caused by the presence of these microcracks can be represented by second-order tensors and fourth-order tensors. By conducting triaxial compression-acoustic-emission experiments of shale rock samples, Sarout et al. [22] obtained acoustic velocities under different confining pressures. Tang and Wu [23] studied the anisotropic crack evolution characteristics of shale and mudstone under stress with laboratory experiments. Ma and co-workers [8,9] investigated the hydration damage of shale rock by using computerized tomographic (CT) scanning and proposed a novel hydration-damage constitutive model. Through the above studies, it can be concluded that the damage is caused by changes of the microcracks in the rock under stress. Combined with the drilling engineering practices, the effect of stress on the rock is one factor. The impact on the rock of drilling fluid, fracturing fluid, and other fluids is another factor.
Currently, there are few reports on the study of rock damage in which these two factors are considered. Therefore, it is necessary to study the anisotropic damage of rock under stress and hydration. In this paper, by measuring the acoustic-wave velocities of shale rock samples under different confining pressures and different soaking times with drilling fluid, the effects of stress and hydration on acoustic velocities, elastic parameters, anisotropy, and damage of shale are studied and analyzed.
2. Experimental Scheme
2.1. Rock Sample Description
In this paper, the mineral composition, porosity, and permeability of rock samples from the Longmaxi formation of the Changning area are tested and discussed. The X-ray diffraction analysis shows that the shale is mainly composed of quartz mineral, clay mineral, and carbonate rock, with mass fractions of 29–36%, 26.67–39%, and 14–26.33%, respectively, and other mineral compositions accounted for 11–18%. Illite accounted for ~74.18%, chlorite accounted for ~21.37%, and illite-montm or an illonite mixed layer accounted for ~4.25% in the clay minerals. The porosity of the samples ranges from 1.7% to 7.80%, and permeability varies from 2.5 × 10⁻¹⁰ to 1.737 × 10⁻⁶ mD. A large number of tiny pores and cracks exist in the shale matrix and organic matter, and the pore size is generally 0.1–0.8 μm, with the largest being 20 μm in the matrix, while in the organic matter, the pore size varies from 10 to 750 nm.
2.2. Measurement Principle of Ultrasonic Wave Velocity
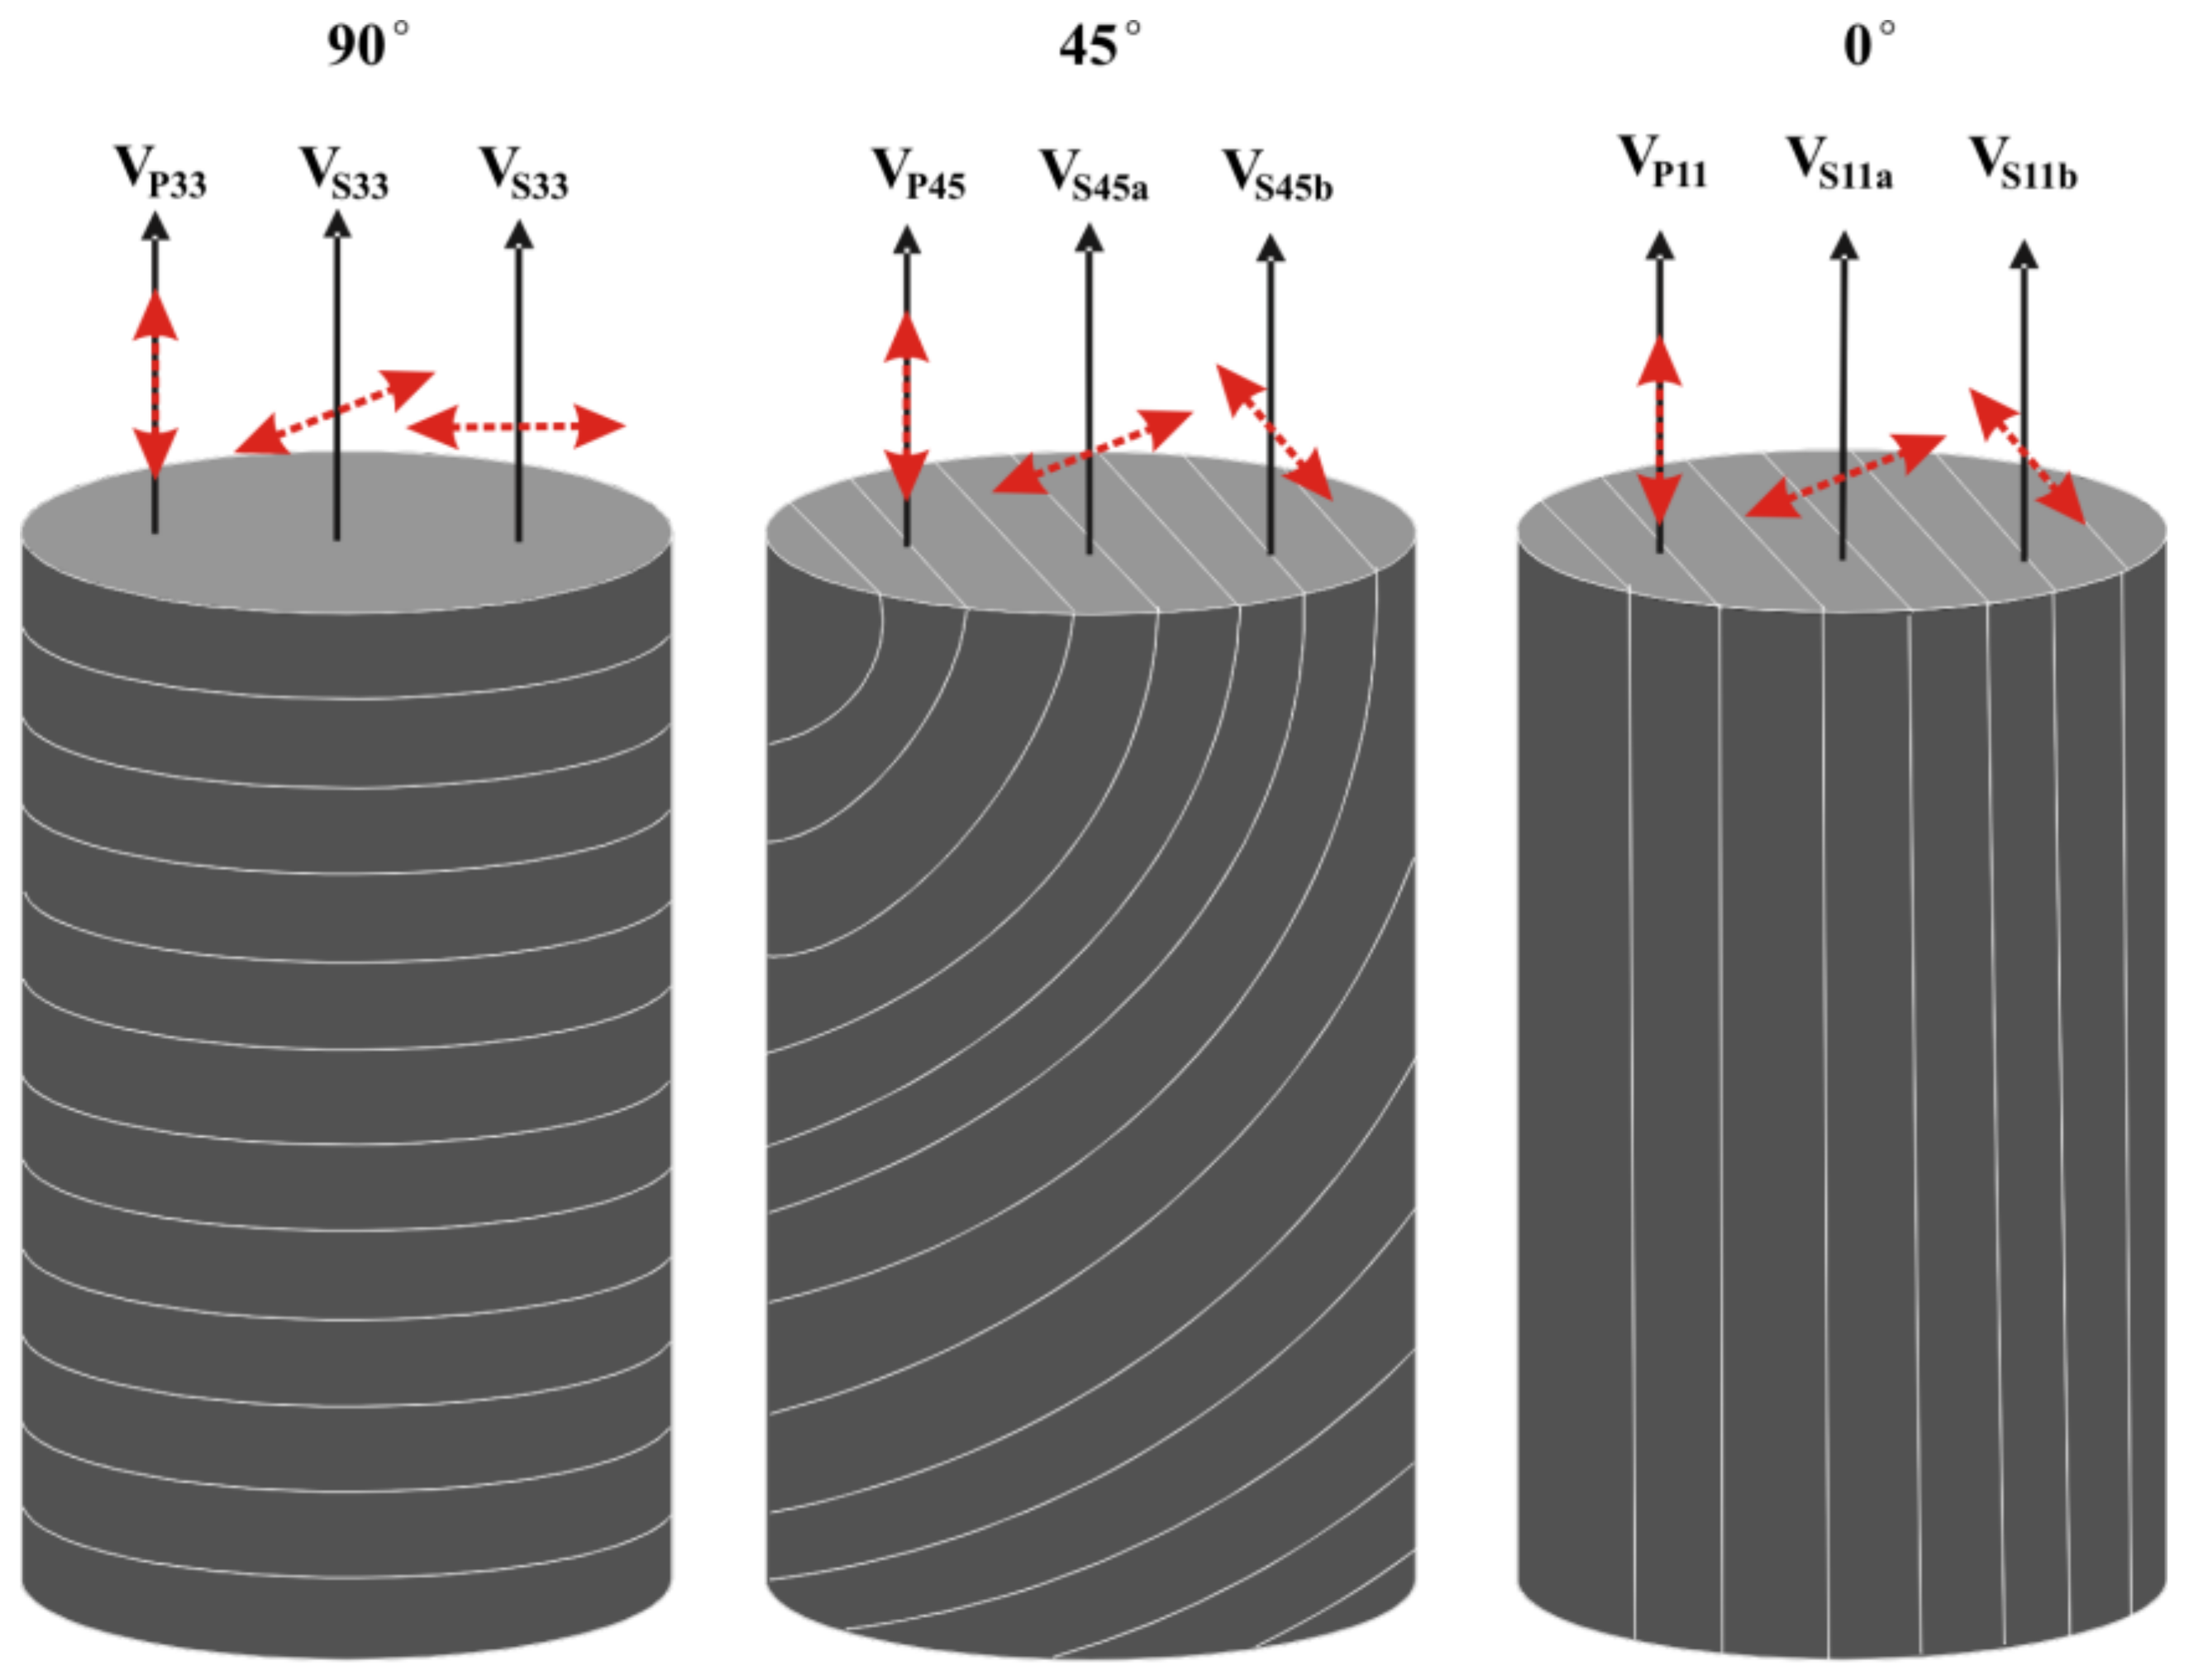
Shale is a medium with strong transversely isotropic (TI) characteristics. Rock with such characteristic possesses different mechanical properties depending on the coring angle. Rock mechanics parameters and in situ stresses in the direction perpendicular to the bedding plane and parallel to the bedding plane are quite different [24]. Those parameters and stresses are the key parameters for wellbore trajectory design, wellbore stability analysis, and hydraulic fracturing.
For a shale formation with TI properties, there are five independent elastic parameters, including: C11, C13, C33, C44, and C66, which are needed to describe its elastic properties. Owing to the symmetrical properties of the TI formation, C11 = C22, C21 = C12, C55 = C44, C31 = C13, C32 = C23, and C12 = C11 − 2C66. Acoustic testing is one way to obtain these key parameters. In acoustic testing, we measured the acoustic-wave velocities of the rock samples in the three angular directions of 0°, 45°, and 90° with respect to the bedding plane of symmetry (as shown in Figure 1). The elastic parameters can then be expressed with the measured wave velocities and bulk density () as follows [25,26]:
2.3. Experimental Steps
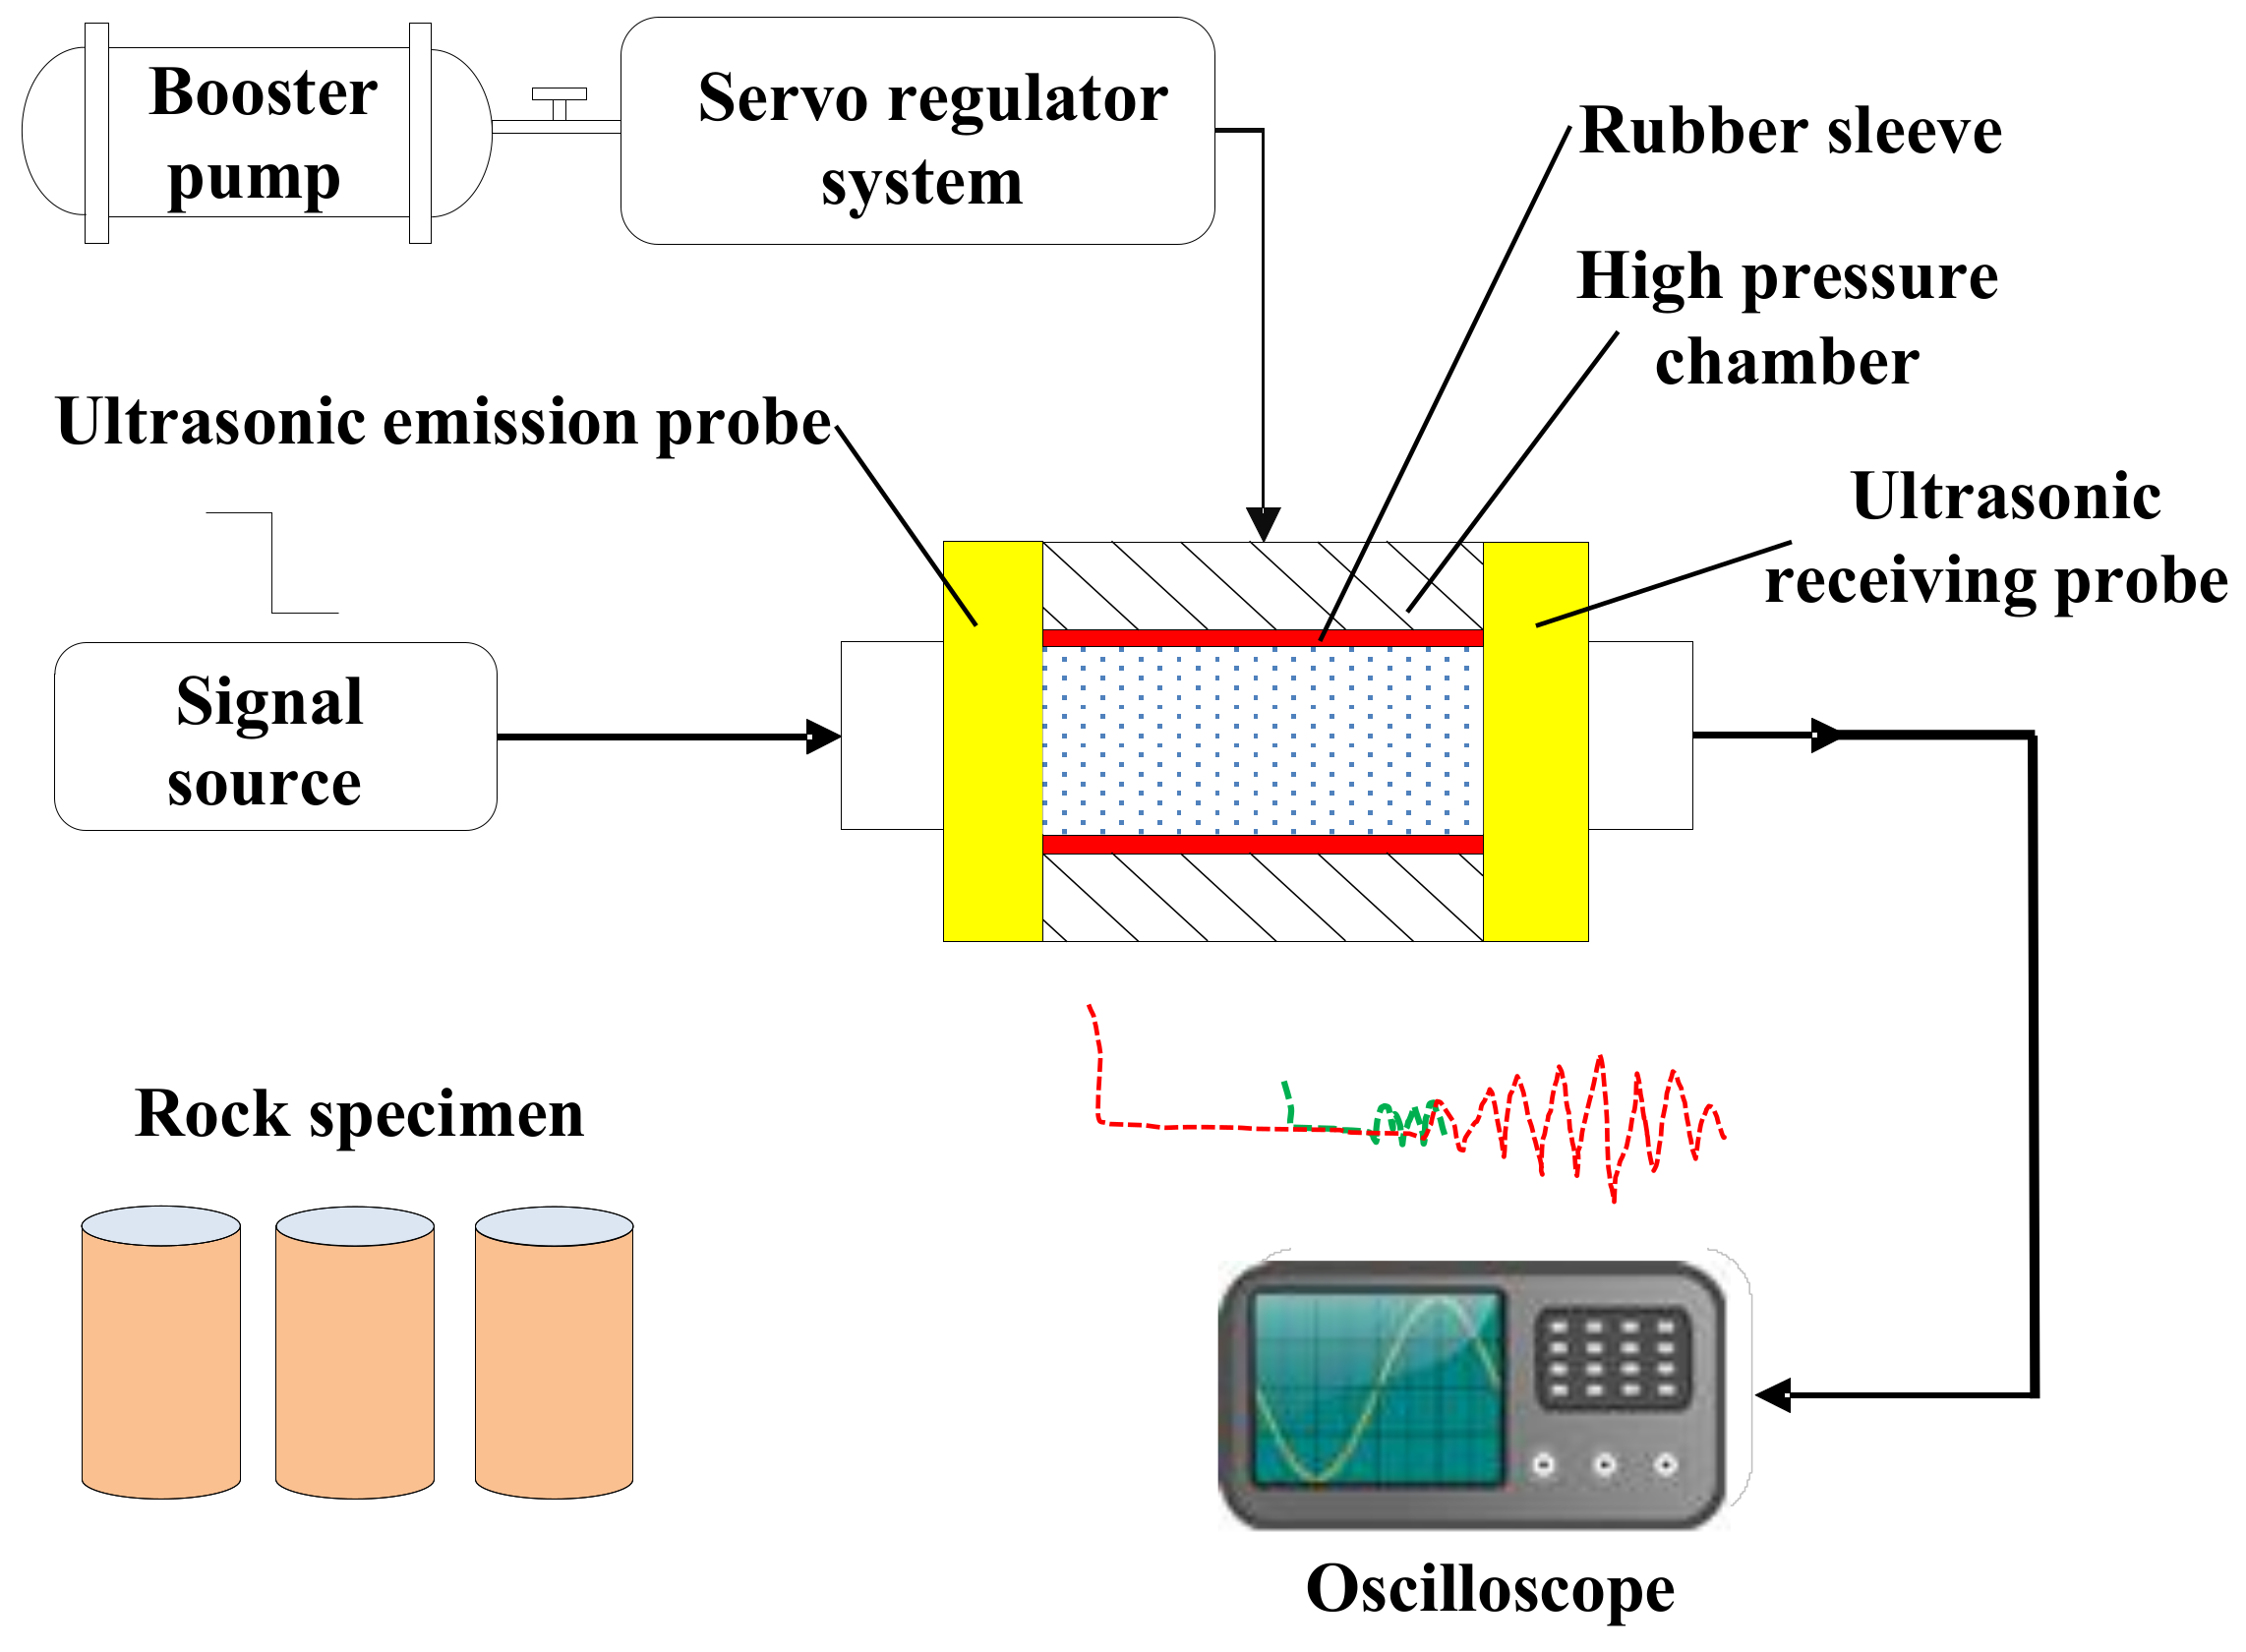
In this article, three-axis rock mechanics acoustic-emission experiments on shale rock samples under different confining pressures and different soaking times with drilling fluid are carried out to study the variation of wave velocities, elastic parameters, and damage parameters before and after the experiment. The experimental steps are as follows: (1) Three groups of φ25 × 50 mm samples with the coring angles of 0°, 45°, and 90° were drilled from the same shale rock, with each group of samples taking three blocks and being numbered. (2) Hydration experiments were conducted with no soaking, soaking for 1 h, and soaking for 3 h for each group. The soaking liquid was a water-based drilling fluid. (3) After the hydration experiment, the samples were placed on a core holder, with both ends contacting directly to the transmitter and receiver. The samples were then placed in a high-pressure chamber to measure the velocities at confining pressures of 0, 20, 40, and 60 MPa. To guarantee accuracy, the same test temperature was maintained throughout the experiment. The experimental apparatus and principle are illustrated in Figure 2.
3. Experimental Results
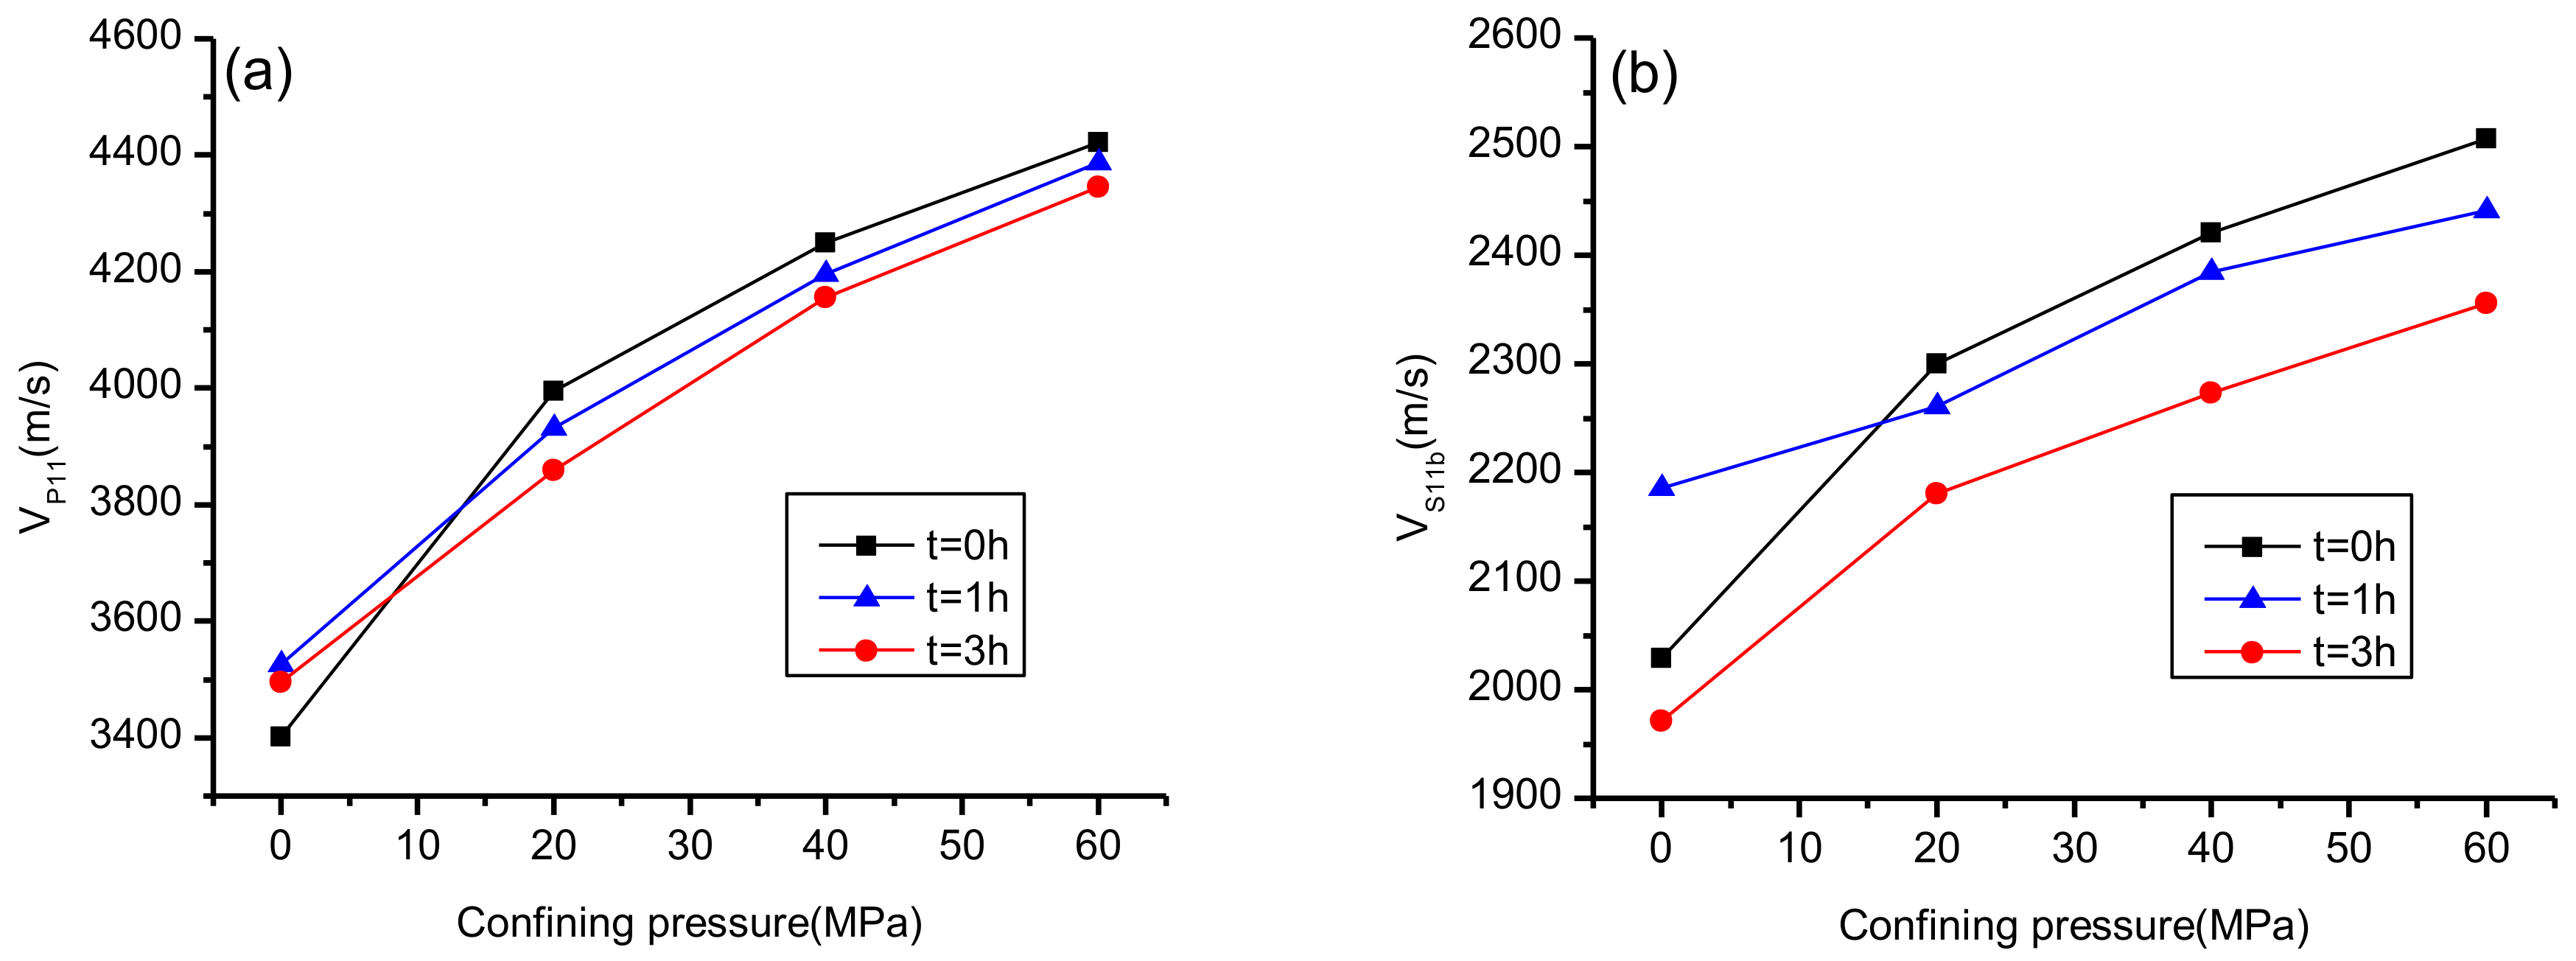
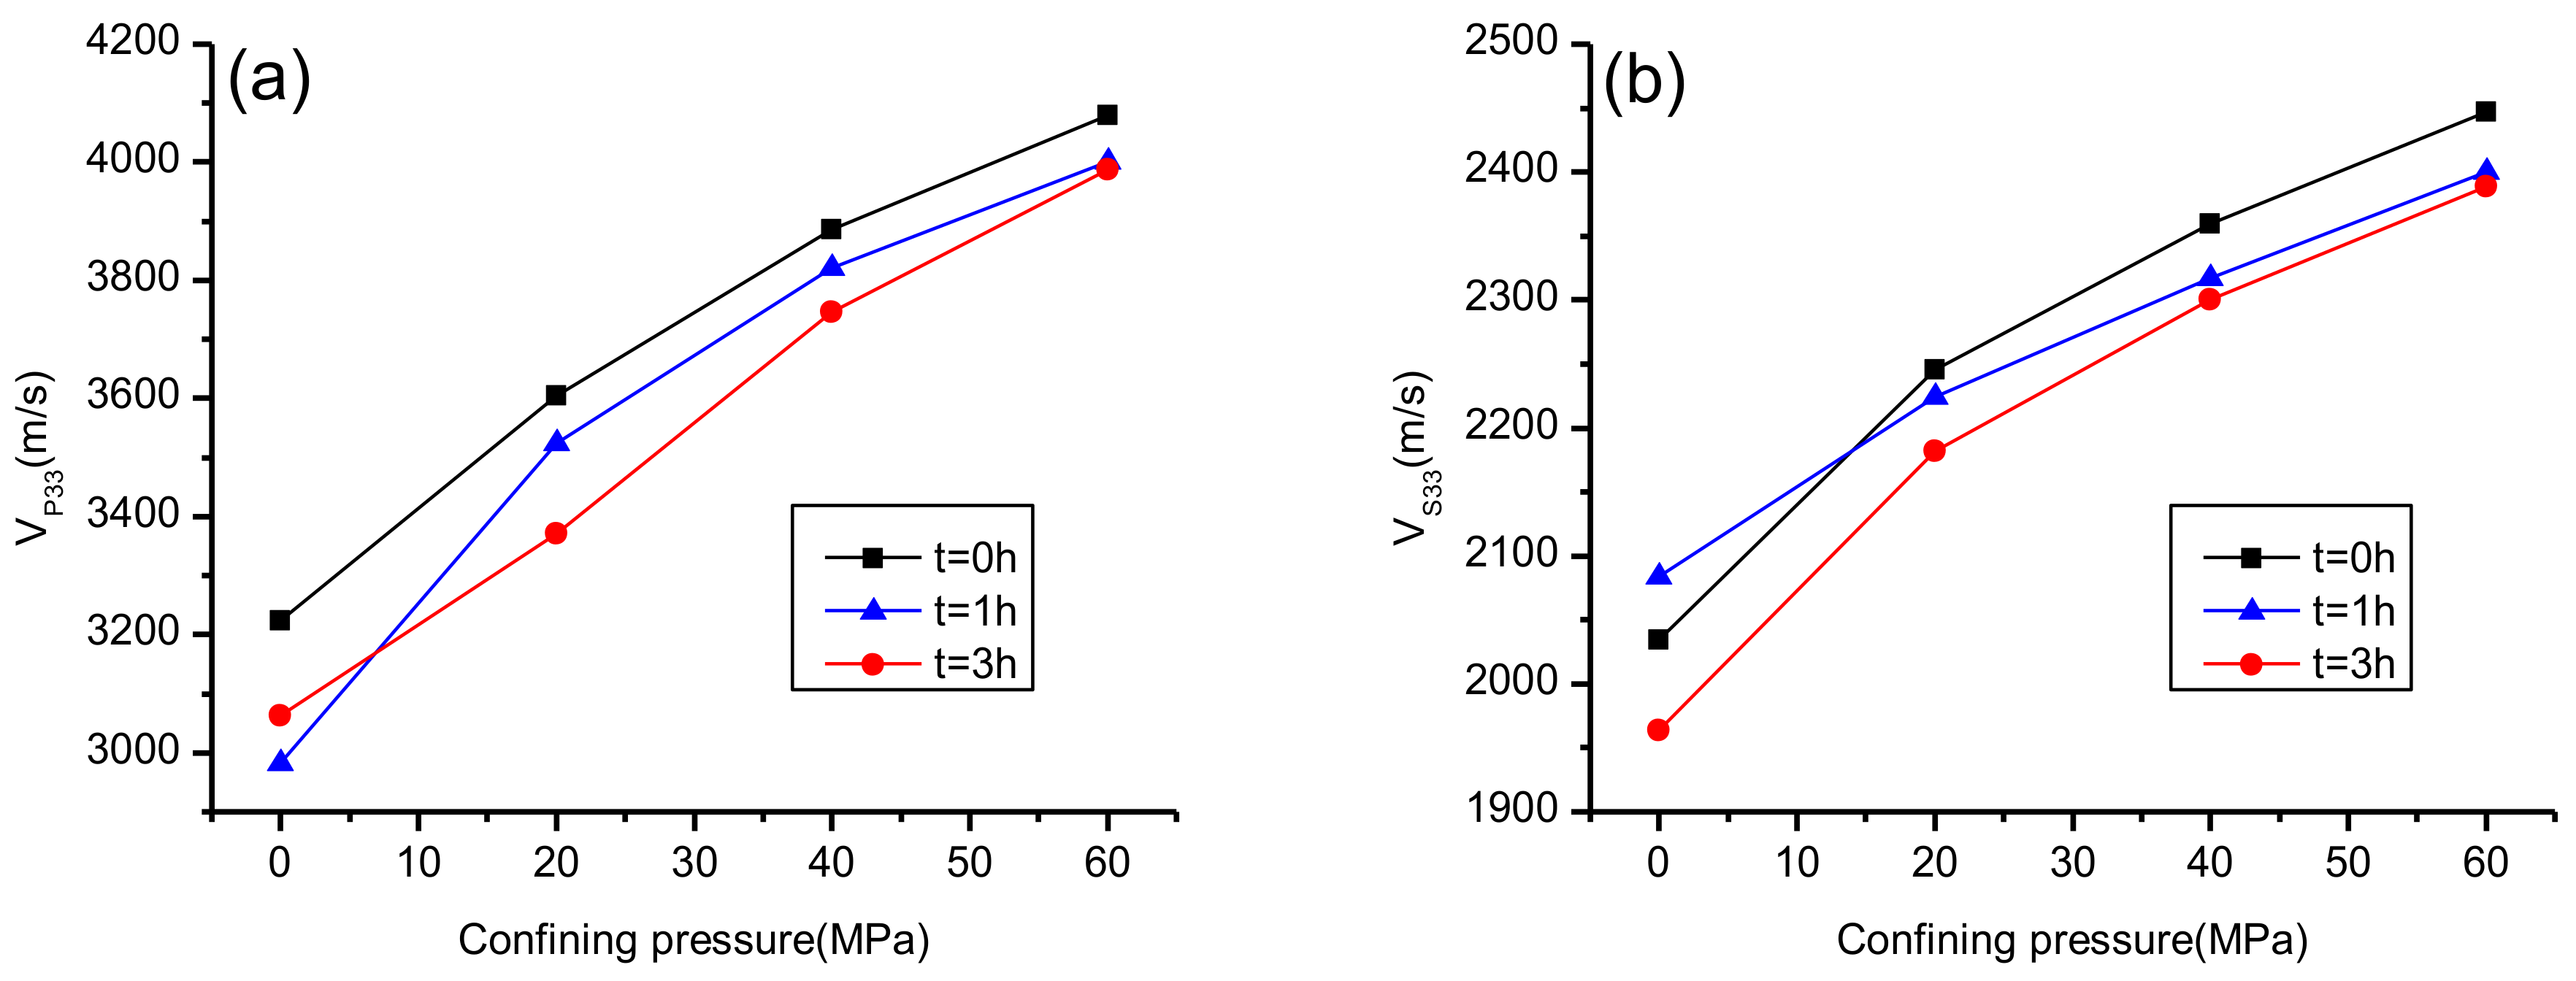
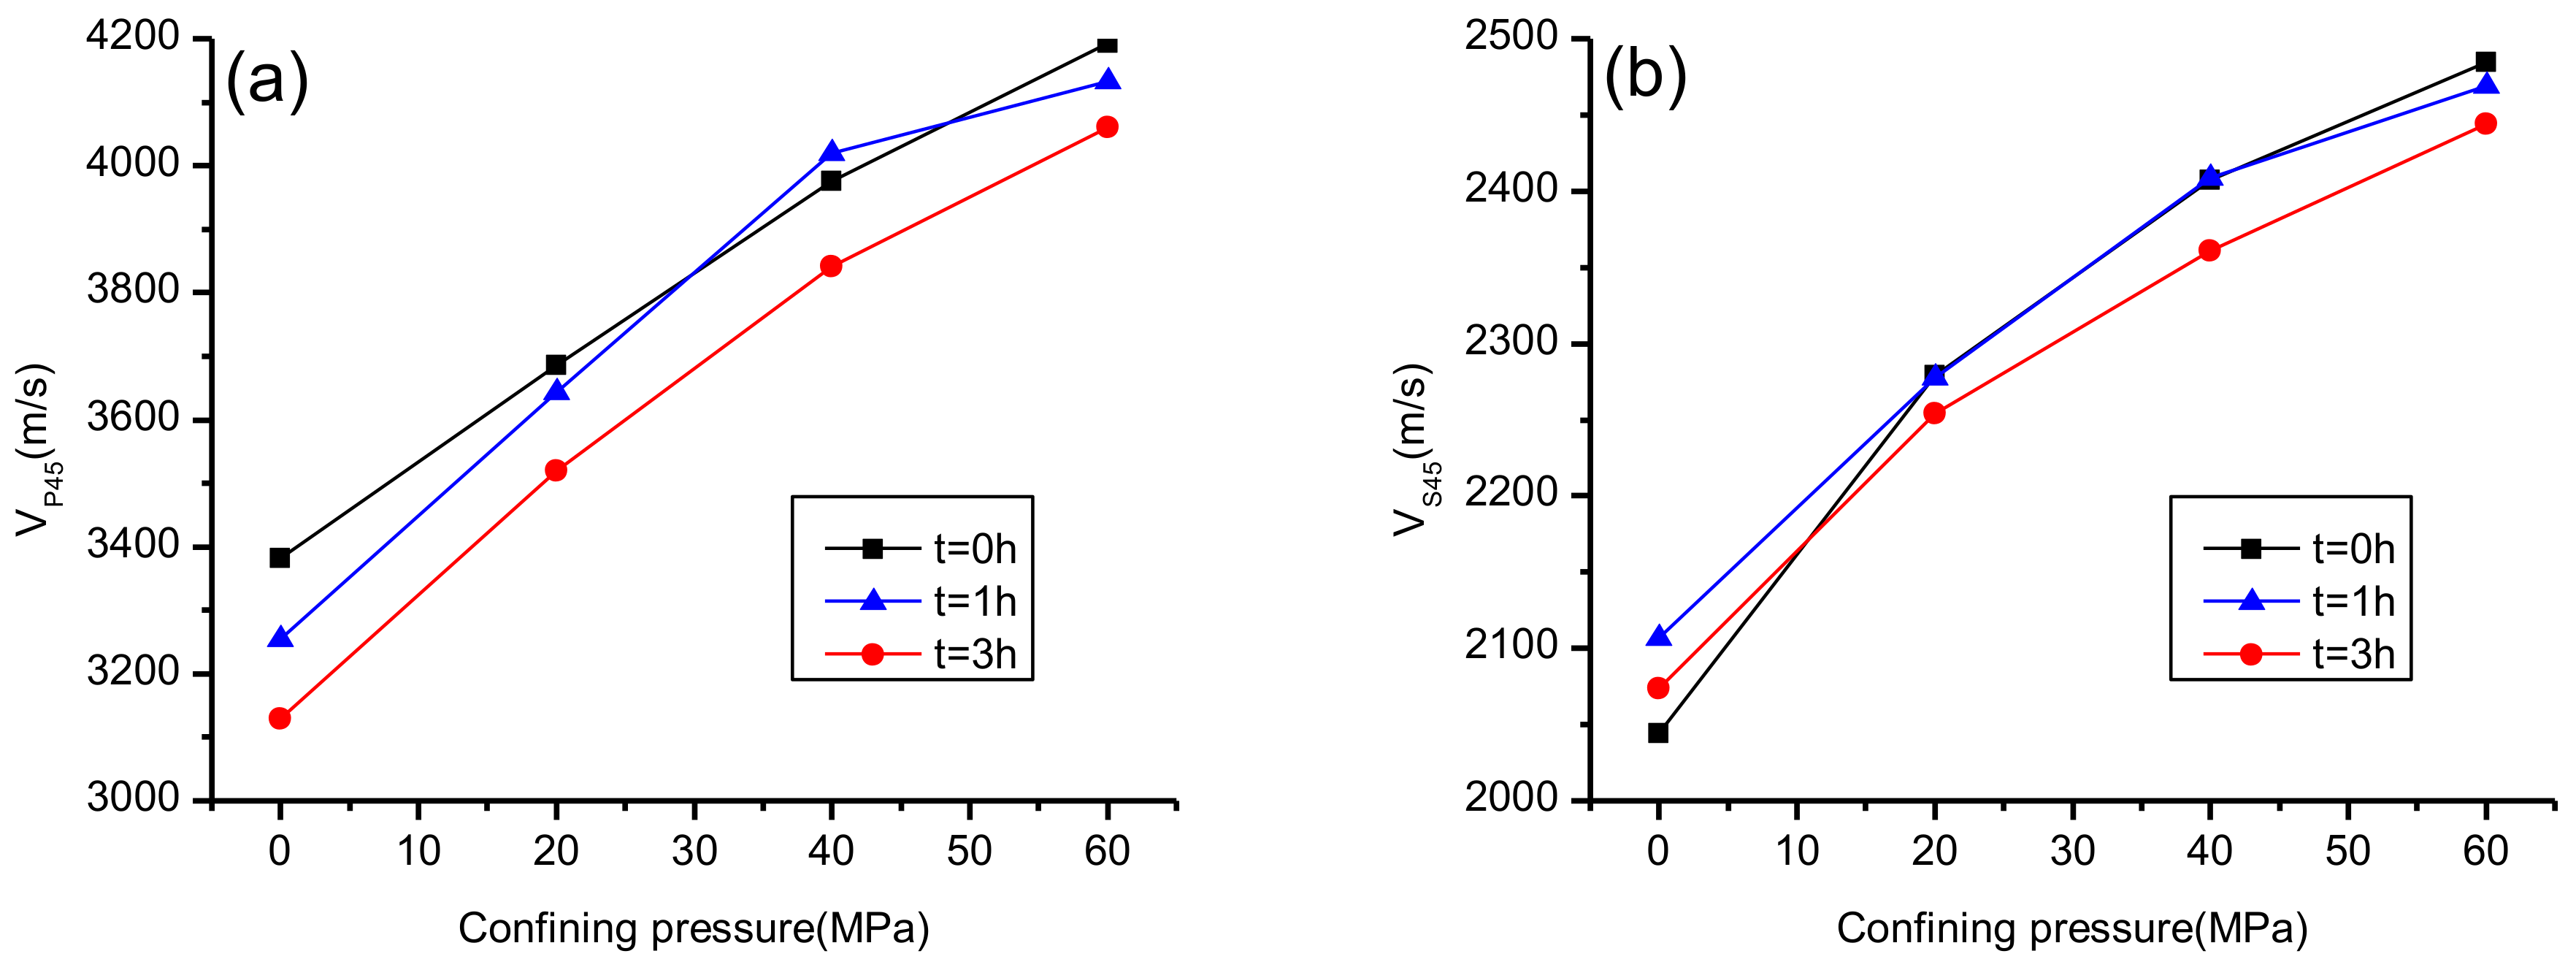
Figure 3, Figure 4 and Figure 5 show the P-wave and S-wave velocities versus confining pressure and time at different coring angles. Under the same test conditions, both P-waves and S-waves possess the fastest velocity in the 0° direction and the lowest velocity in the 90° direction. When the confining pressure is greater than 0, under uniform confining pressure, with the increase of soaking time, the wave velocities decreased. However, under the condition of zero confining pressure, this law is not followed, since the samples under different soaking times are not the same. Despite the cores drilled from the same rock, there are still some differences across the samples. With a constant soaking time, as the confining pressure was increased, the wave velocities increased parabolically. The decrease in shale strength and the development of microcracks after immersion are the main factors that lead to the decrease of both P- and S-wave velocities. In addition, S-waves cannot propagate in a liquid, so this is another factor that causes the decrease in S-wave velocity after soaking.
4. Evolution of Anisotropic Elastic Parameters under Stress and Hydration Coupling
Studying the variation of elastic parameters with confining pressure and soaking time is the precondition for the analysis of the elastic parameters under stress and hydration. Based on the measured wave velocities and rock density, the rock-mechanics parameters and Thomsen coefficients under stress and hydration are analyzed here.
4.1. Evolution of Young’s Modulus and Poisson’s Ratio under Stress and Hydration Coupling
For a shale formation with TI properties, the horizontal and vertical Young’s modulus (E) and Poisson’s ratio (µ) can be expressed with the five independent elastic parameters mentioned above as follows [27,28,29,30,31,32]:
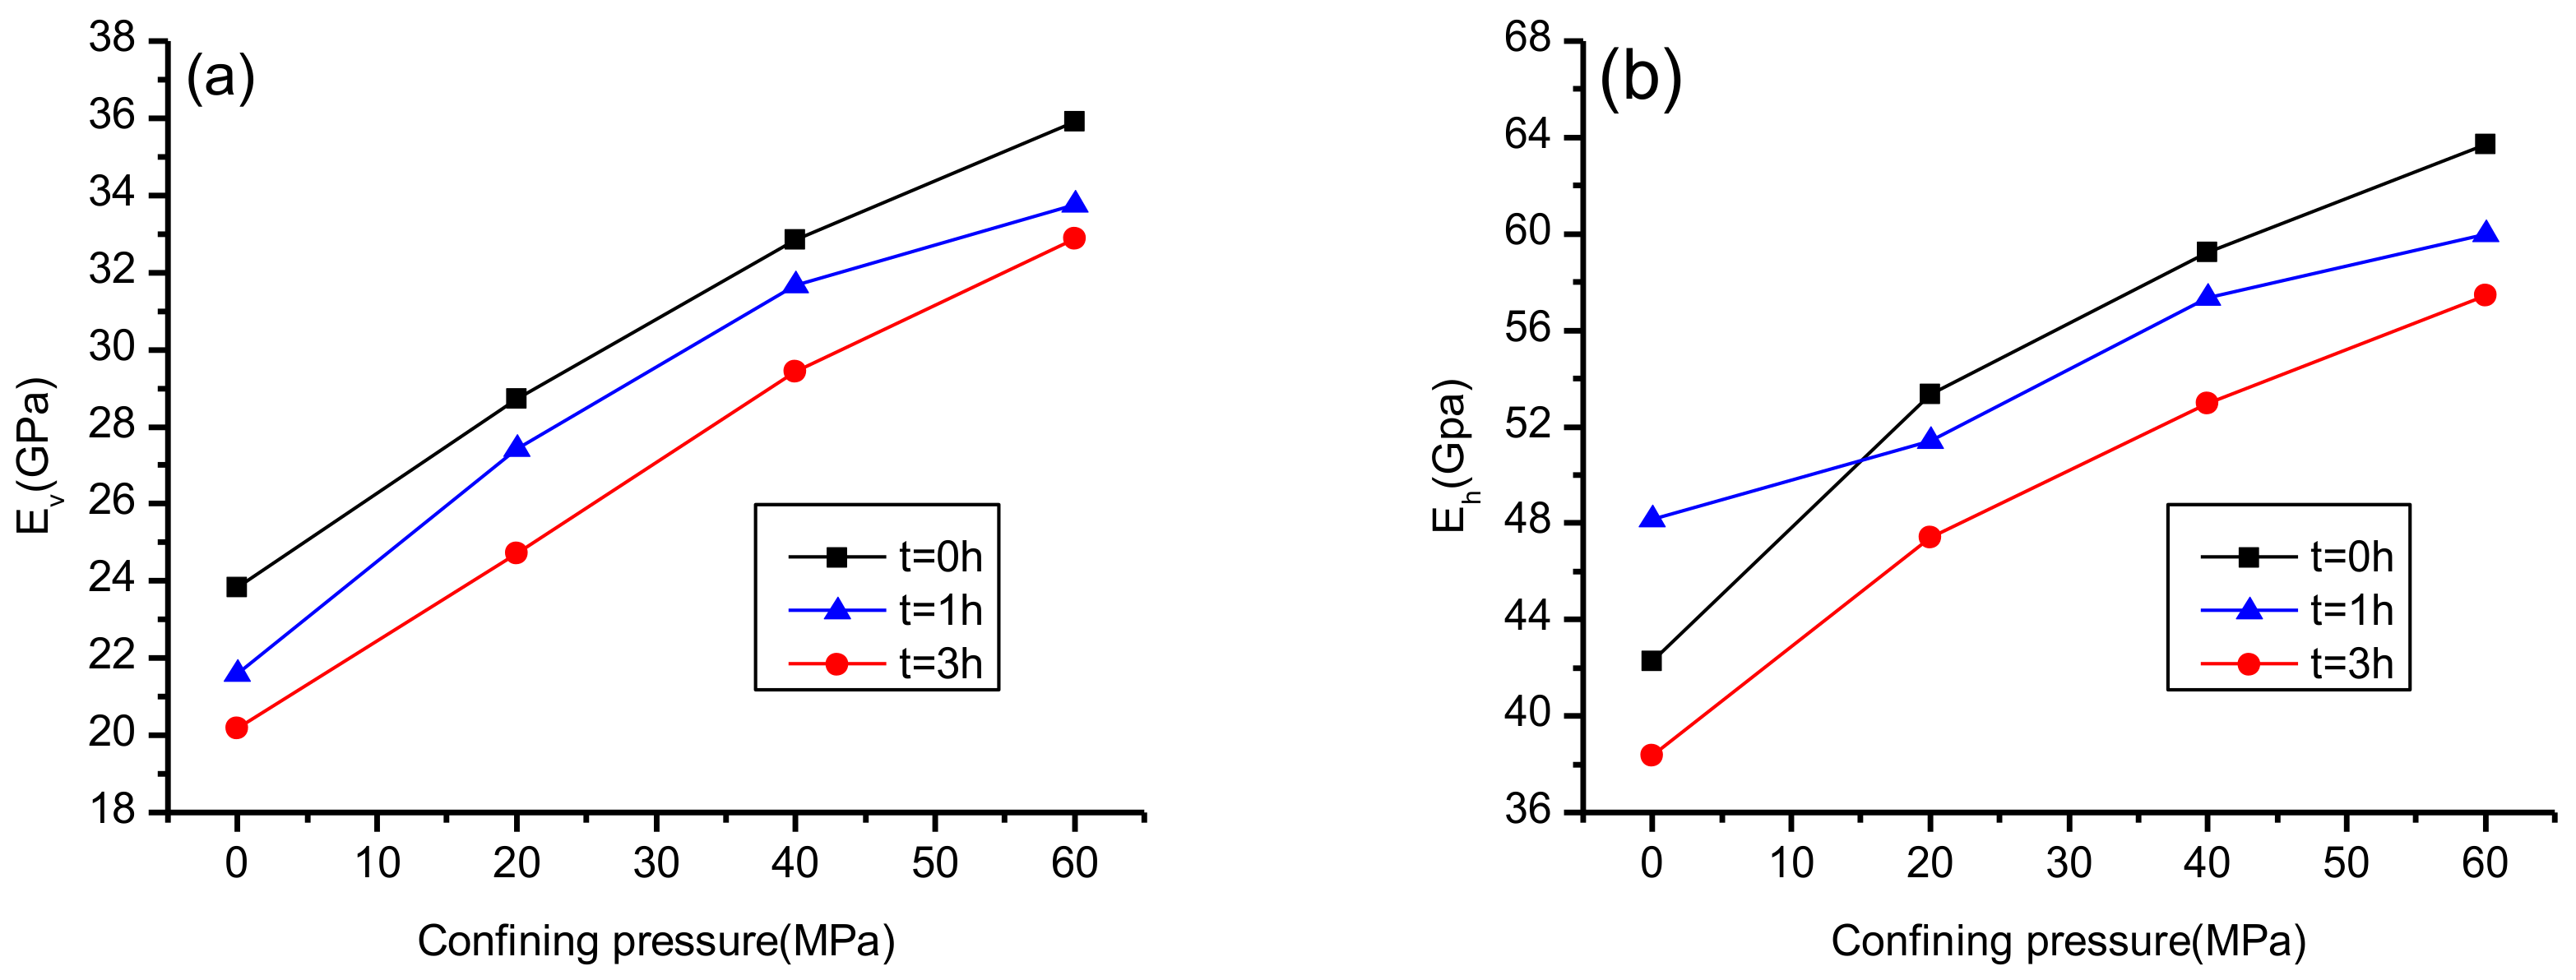
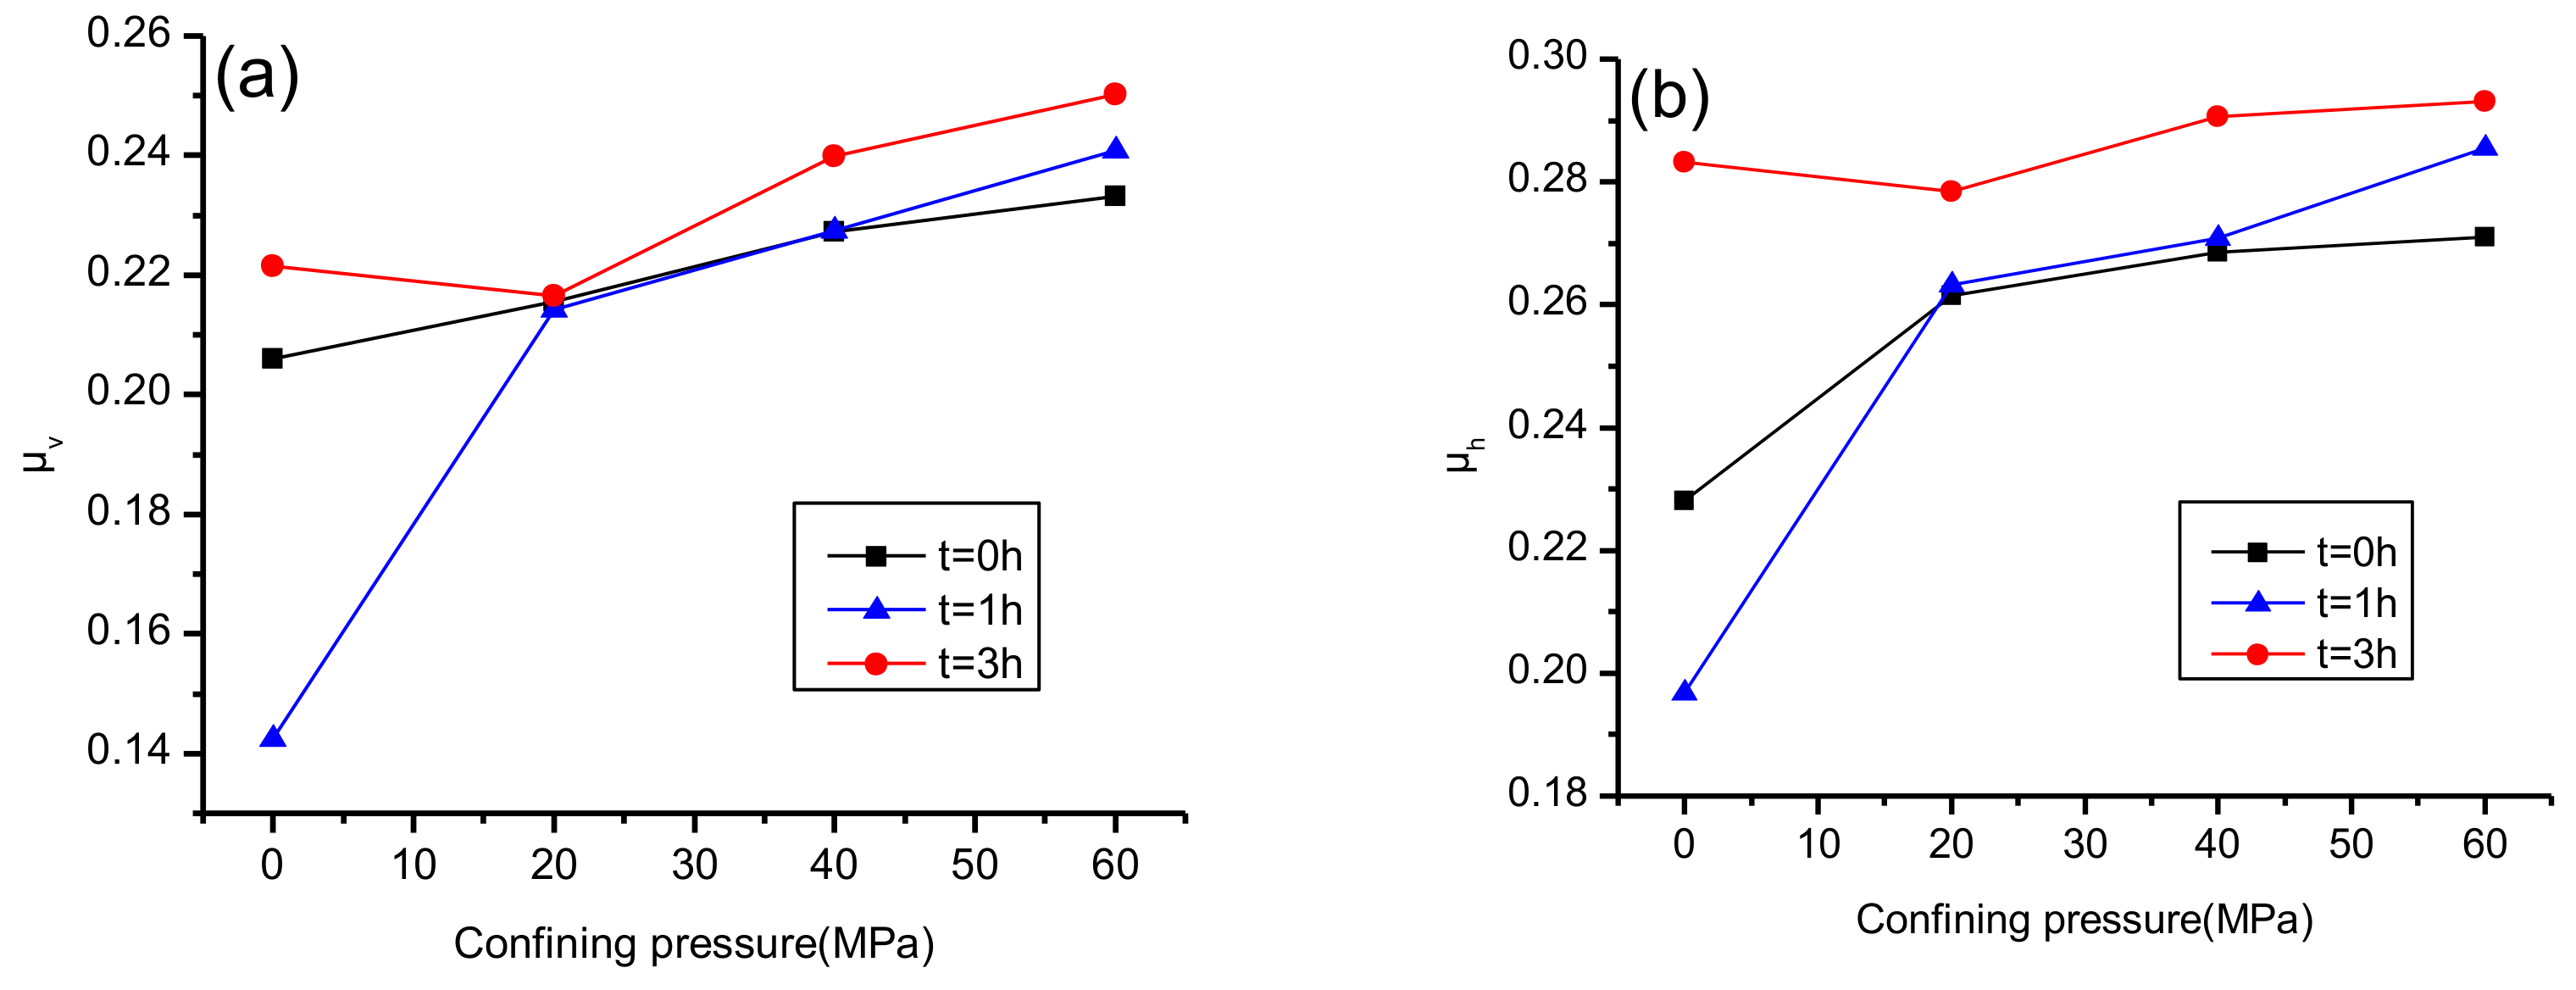
By utilizing the Equations (2) and (3), Young’s modulus and Poisson’s ratio in the direction perpendicular to the bedding plane and parallel to the bedding plane with different soaking times and different confining pressures can be calculated. The results are presented in Figure 6 and Figure 7. It is clearly found that, under the same confining pressure, with the increasing soaking time, Young’s modulus decreased and Poisson’s ratio increased except for zero confining pressure condition. The results corresponding to zero confining pressure do not follow the same trend, which is caused by the cores’ differences. At the same soaking time, with the increase of confining pressure, both Young’s modulus and Poisson’s ratios are increased. For the same test case, the horizontal Young’s modulus and Poisson’s ratio are larger than the vertical Young’s modulus and Poisson’s ratio respectively.
4.2. Evolution of Thomsen Coefficients under Stress and Hydration Coupling
Rock anisotropy includes intrinsic anisotropy and stress anisotropy. The intrinsic anisotropy of the shale is mainly caused by the directional arrangement of rock particles, while the stress anisotropy can be considered as the changes of cracks and pores induced by the stress. With stress loading, the orientation of the mineral components in the rock will be strengthened, which will enhance the anisotropy of the rock. Whereas the microcracks distributed along the bedding surface will close owing to the increase of the pressure, which leads to a decrease of the rock anisotropy. These two opposing effects determine the anisotropy of the rock. From the experimental results, we see that, with increasing confining pressure, the closure of microcracks parallel to the bedding plane is the dominant factor causing a reduction in anisotropy. Here, Thomsen coefficients (ε, γ, δ) were utilized to characterize the magnitude of the anisotropy [33]:
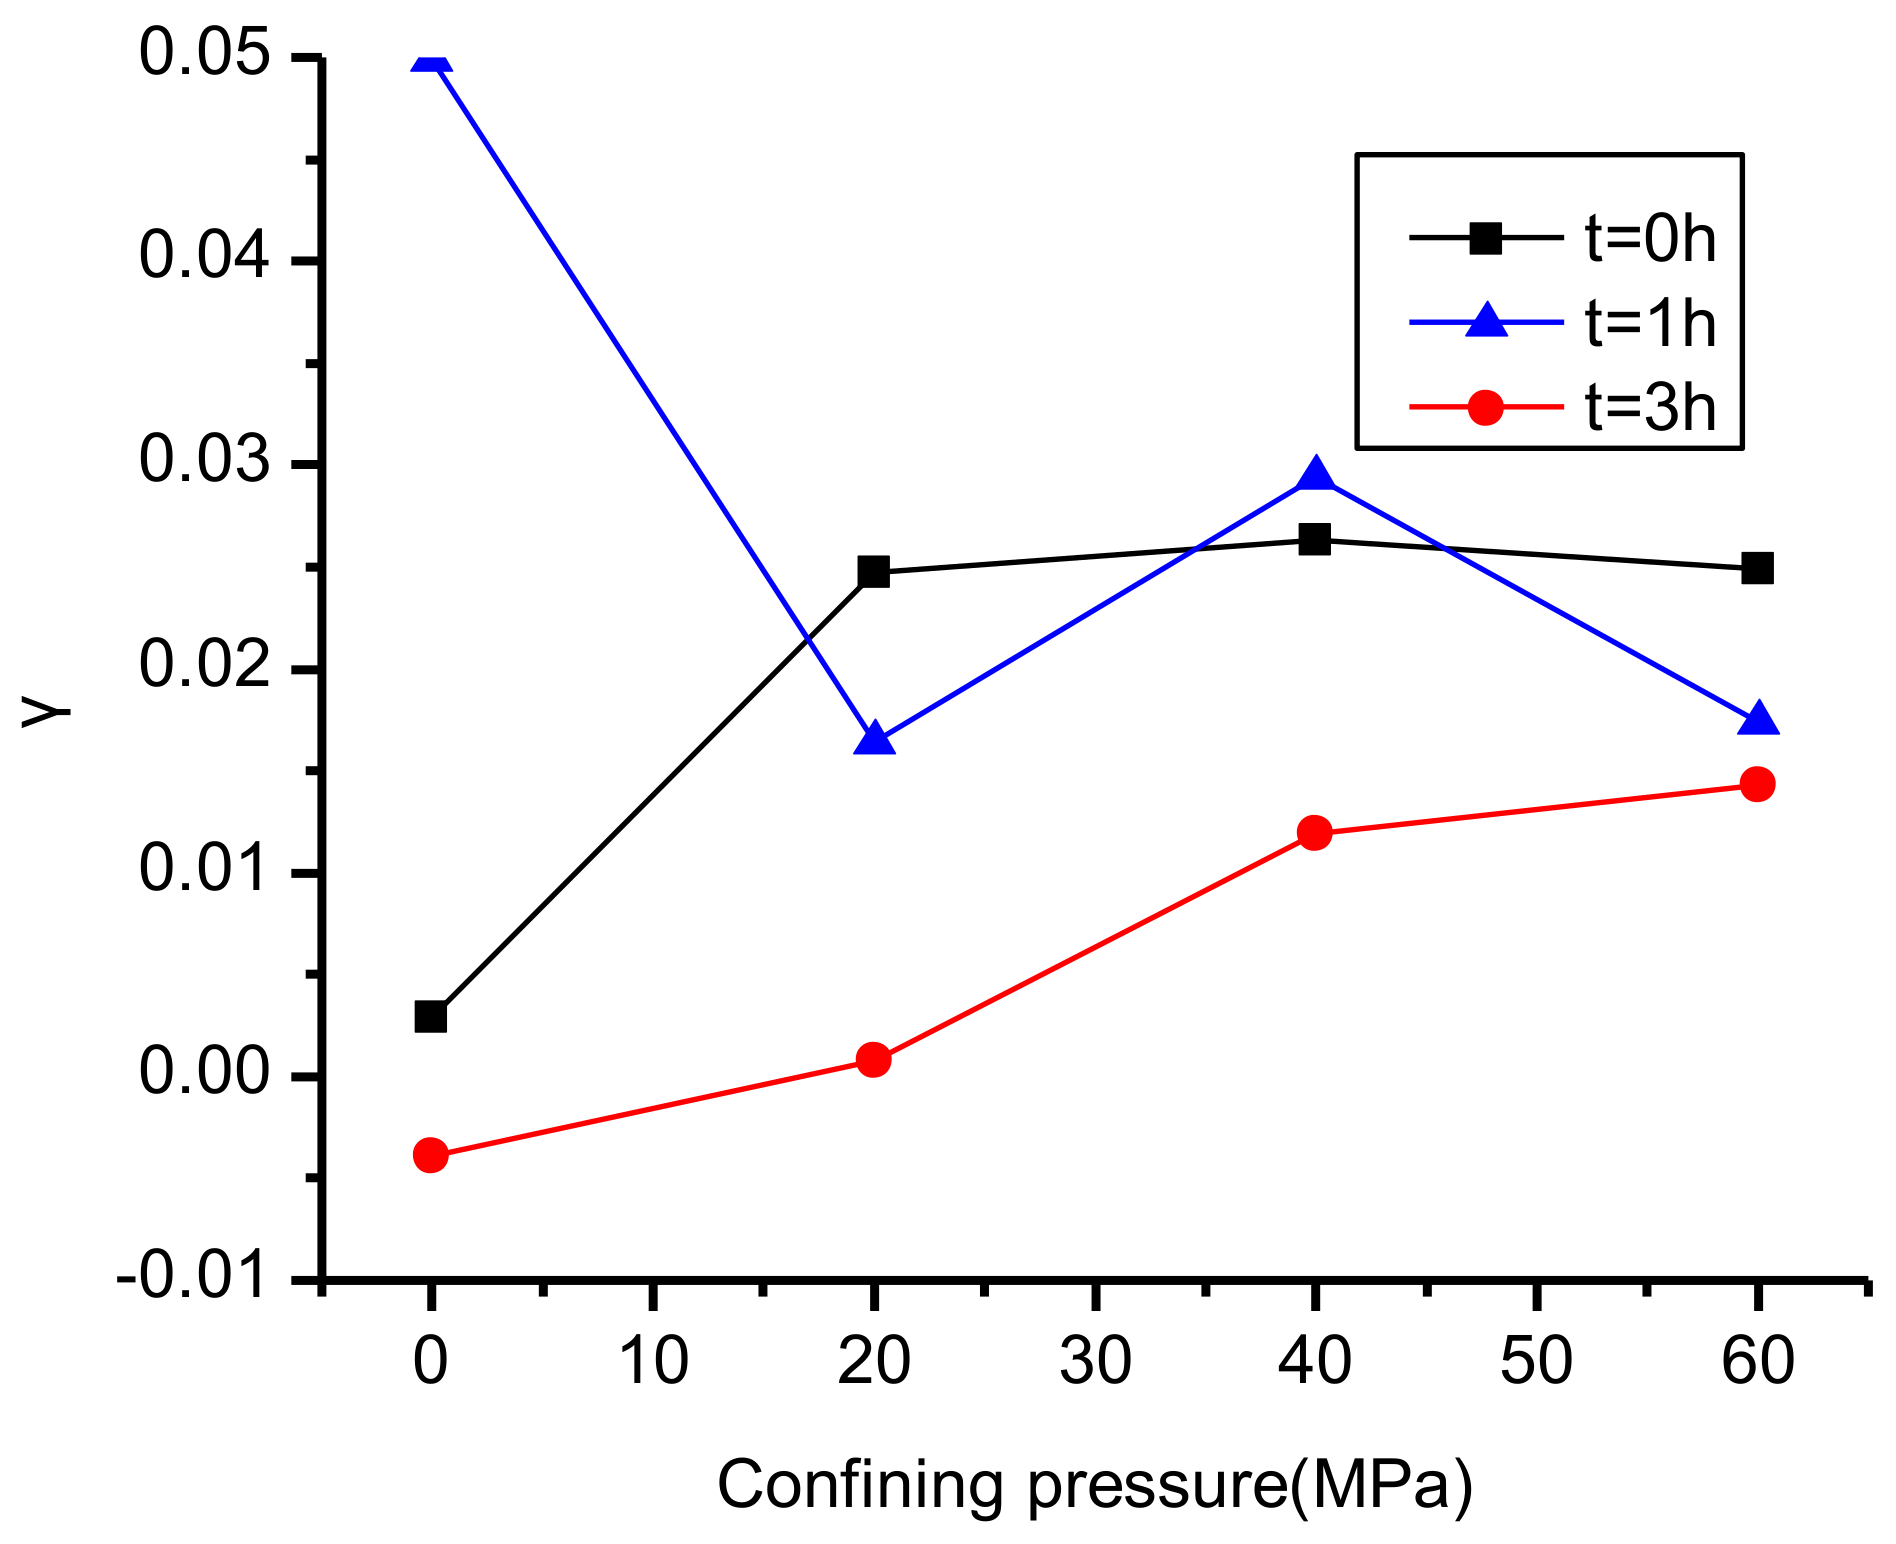
As shown above, ε describes the degree of P-wave anisotropy, and γ reflects the magnitude of the S-wave anisotropy. Figure 8 and Figure 9 show the values of Thomsen coefficients ε and γ under different experimental conditions.
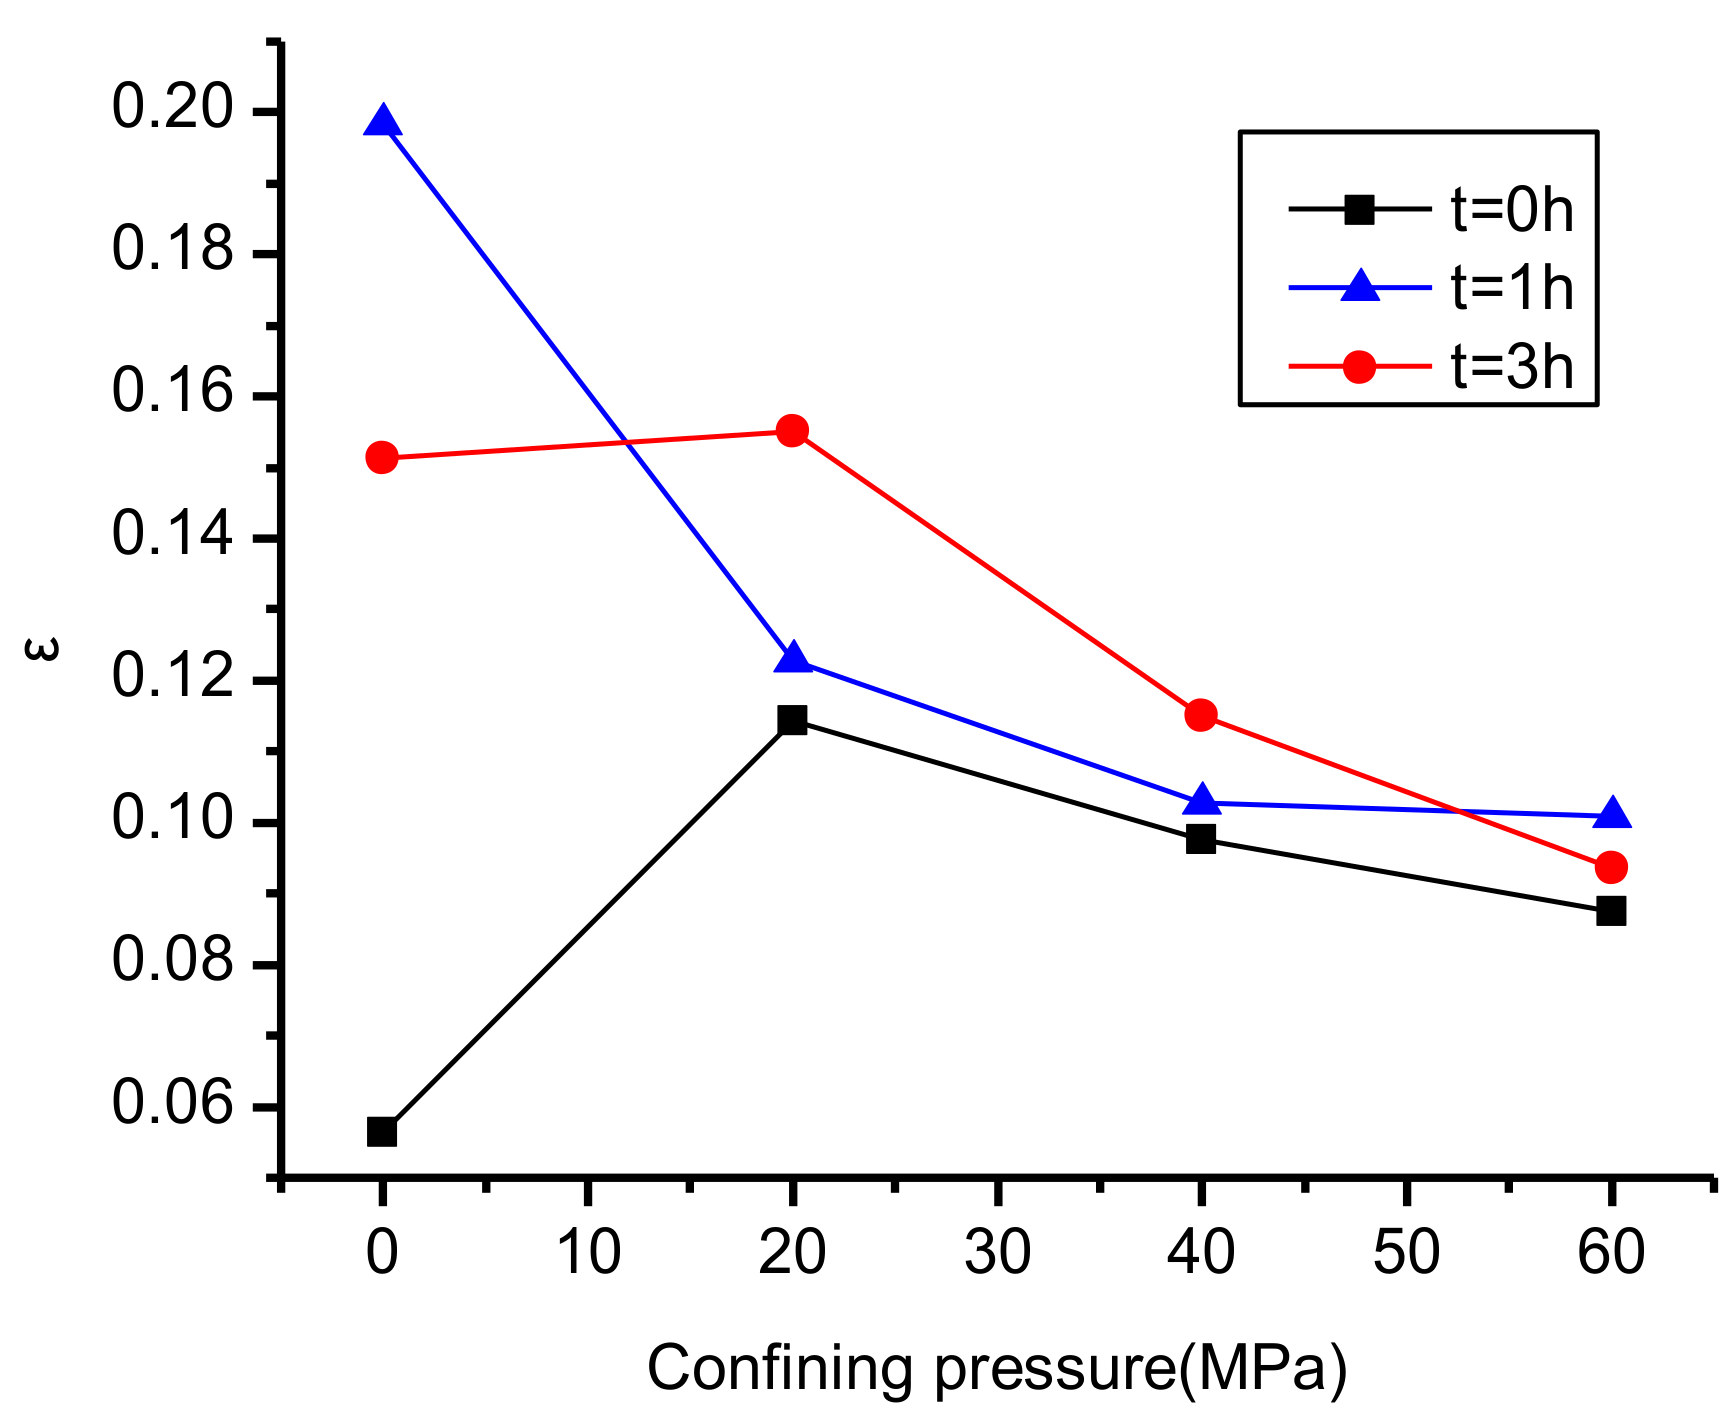
From Figure 8 and Figure 9, we see that, with the increasing confining pressure, the Thomsen coefficient ε showed an increasing trend, whereas the Thomsen coefficient γ exhibited the opposite trend. Under the same confining pressure, the Thomsen coefficient does not have obvious regularity with time, which is caused by the difference between the rock samples; and with the same test environment the anisotropy coefficient of P-wave (ε) is larger than the anisotropy coefficient of S-wave (γ).
Both the rock mechanics and the Thomsen coefficients exhibit a certain degree of change with confining pressure and soaking time. We adopt Becker’s [34] assumption that, under the conditions of high confining pressure (60 MPa) and without soaking (0 h), the cracks in the rock samples are completely closed under confining pressure, so that the shale itself is not subject to hydration by the drilling fluid and thus the anisotropy exhibited by the rock sample can be regarded as the inherent anisotropy. When the experimental conditions deviate from the reference states mentioned above, the measured wave velocities and the calculated rock-mechanics parameters, Thomsen coefficients, etc., that differ from the reference condition can be considered as damage resulting from stress release and drilling-fluid intrusion.
5. Evolution of Anisotropic Damage Characteristics under Stress and Hydration Coupling
Damage refers to the deterioration of the material or structure caused by defects in the mesostructure (such as microcracks, microholes, etc.) under the action of the external load and the environment [35]. For shale, damage can be considered as the microstructures are opened, closed, and dislocated, all of which further lead to deterioration of the rock under the action of the ground stress, temperature, external fluid, etc. The determination of damage variables is a prerequisite for studying shale-damage characteristics. At present, damage variables selecting has a certain degree of randomness, but they should have a clear physical meaning and be as simple as possible so that they can be calculated and analyzed easily. From Section 4, we can note that the trend of Young’s modulus with confining pressure and soaking time is clearer than that of Poisson’s ratios. Therefore, we utilize the damage parameters defined by Young’s modulus and a diffusion model to assess the damage to the shale.
5.1. Evaluation of Damage Characteristics Based on Young’s Modulus
Based on Young’s modulus, the damage parameters DEv and DEh of the shale are defined as follows:
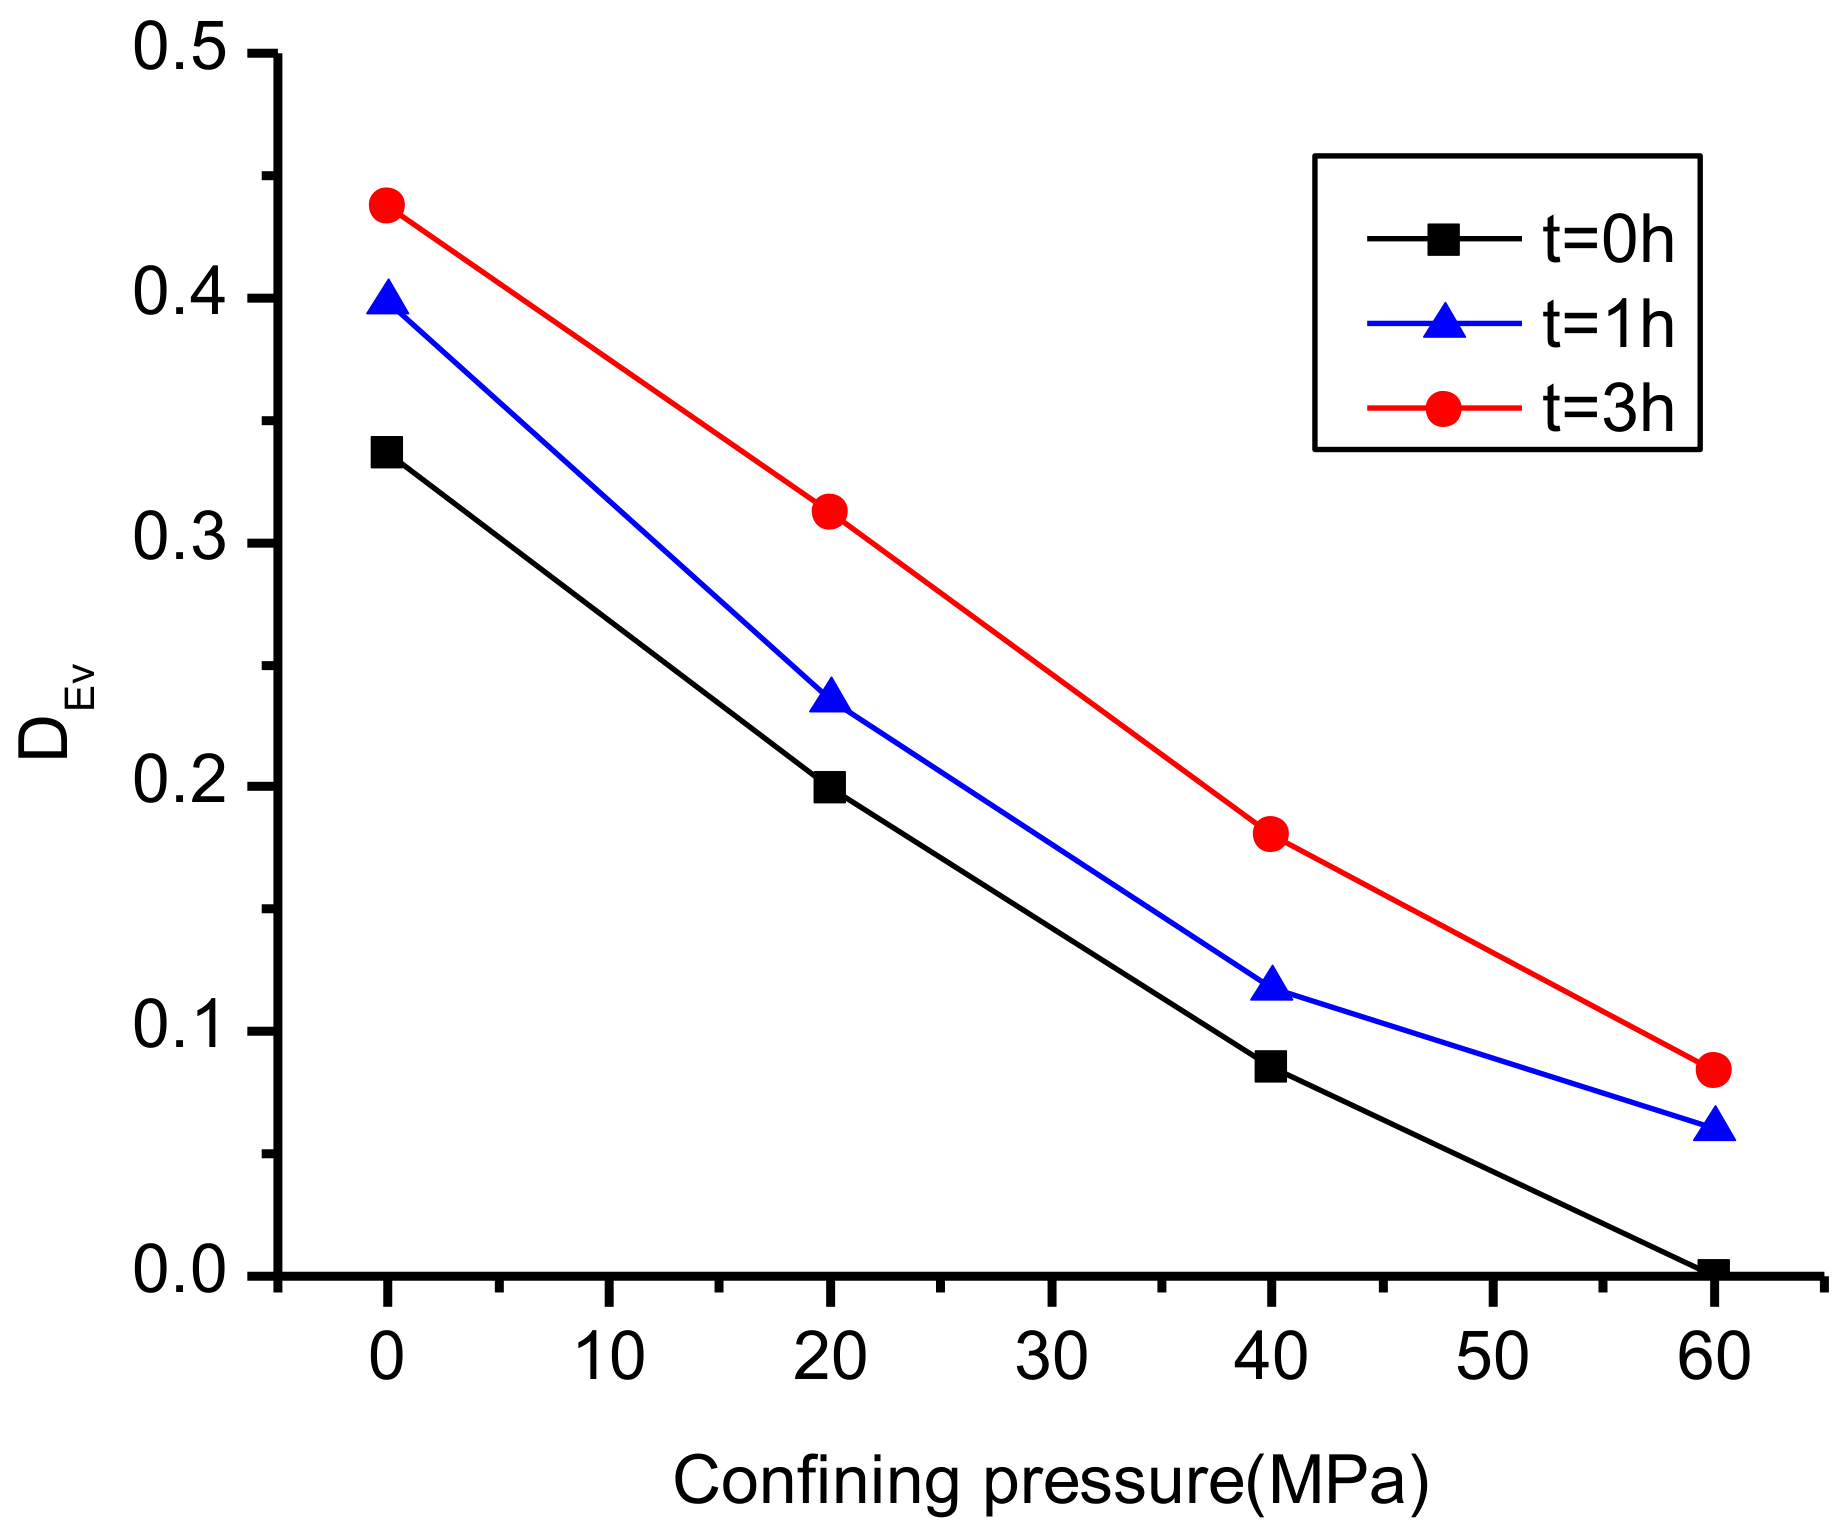
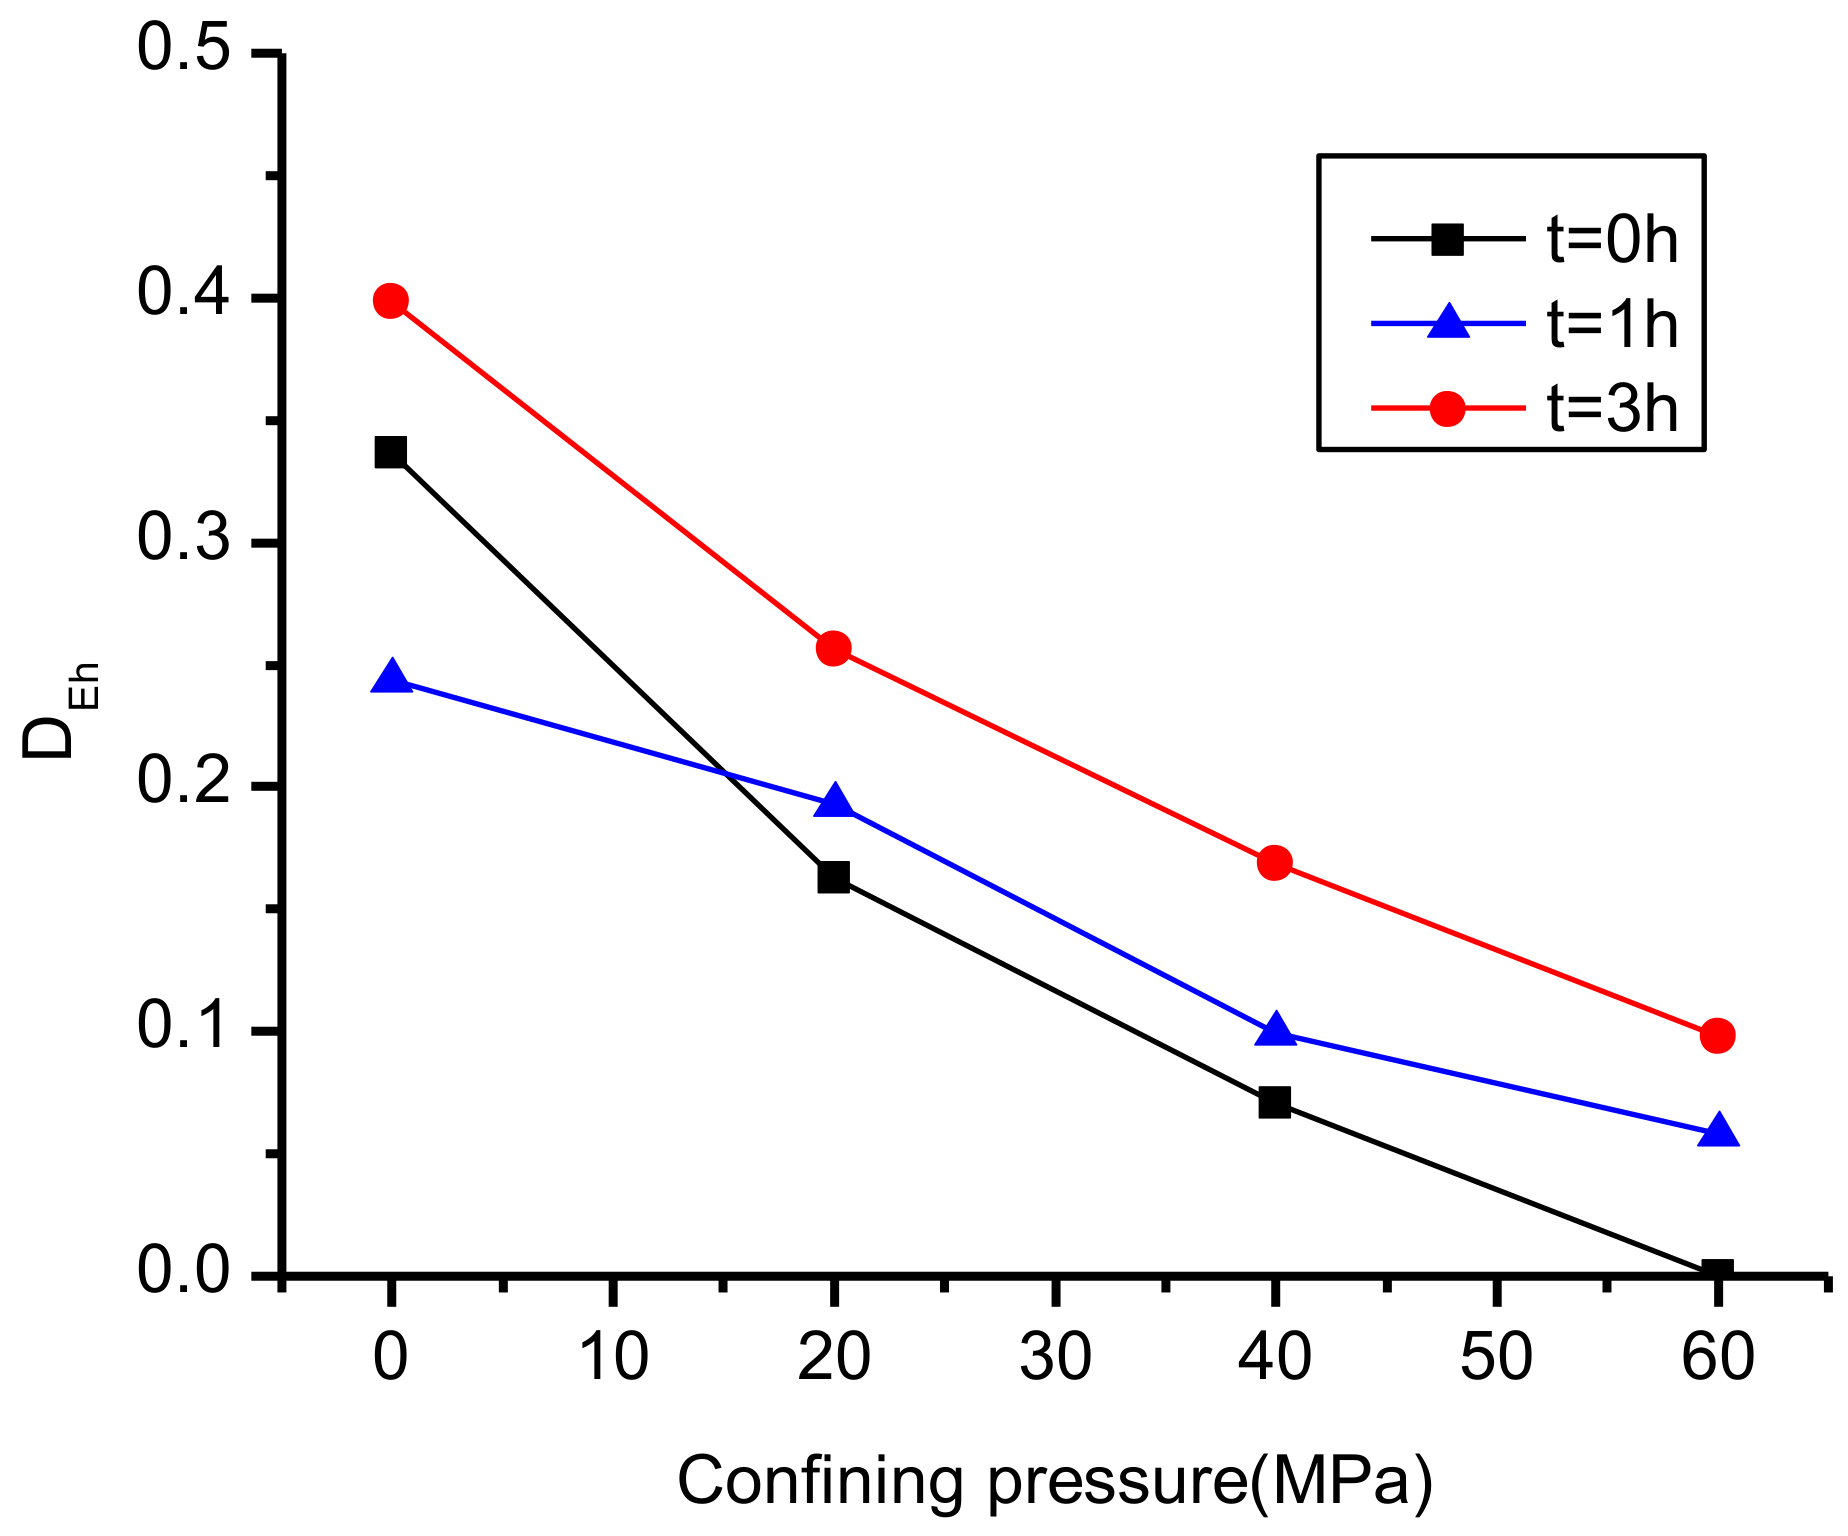
According to the definition, the damage parameters of the rock samples parallel and perpendicular to the bedding plane can be evaluated. As shown in Figure 10 and Figure 11, we can conclude the following results: In the case of 60 MPa confining pressure and without soaking, both DEh and DEv are 0, which means there is no damage at this time. In the case of a confining pressure of 0 MPa and a soaking time of 3 h, the degree of damage is the largest. With the same soaking time, damage parameters decreased with increasing confining pressure. Under the same confining pressure, the damage increased with increasing the soaking time. From the numerical results, we see that DEv > DEh under the same test conditions, which does not mean that the degree of damage in the vertical direction is larger than that in the horizontal direction, mainly because Ehset > Evset. Therefore, this method can only be used to compare the relative damage degree in the same direction and cannot be used to compare the damage degree in different directions under the same test conditions.
5.2. Evaluation of Damage Characteristics Based on the Diffusion Damage Model
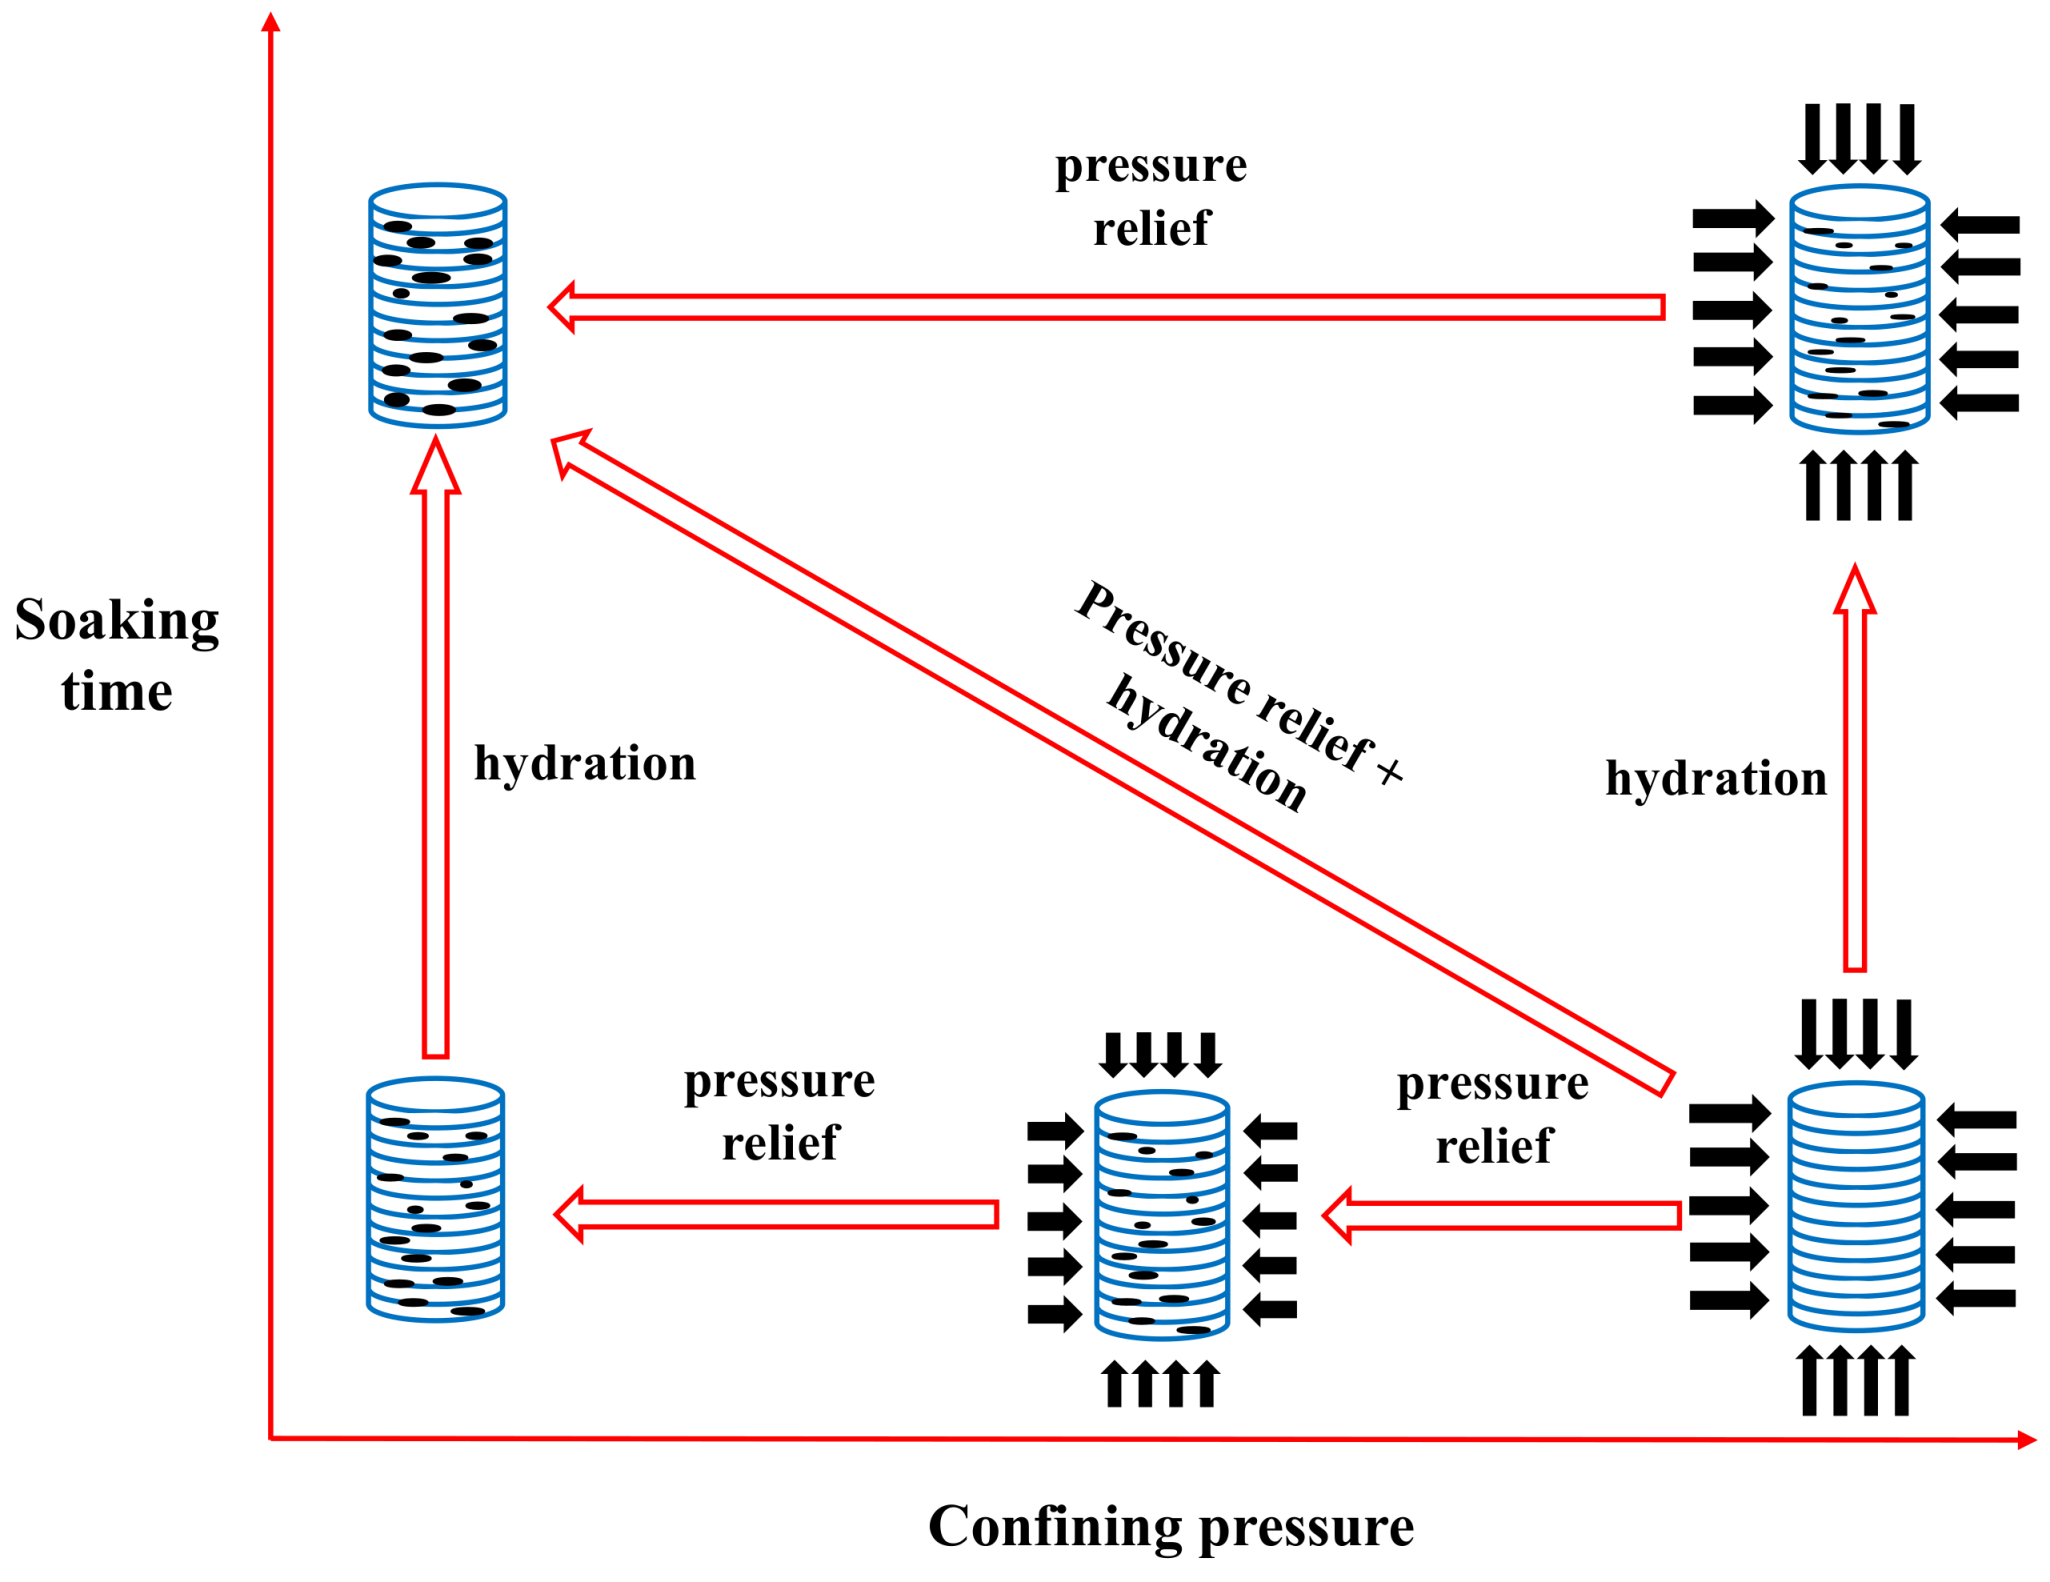
In view of the shortcoming that the above method cannot be used to determine the vertical contrast, a dispersion damage model is introduced to evaluate the damage to shale. Combined with Eshelby’s tensor [36] and Withers’ study [37] on the elliptical porosity in TI media, we treat the pores and the matrix as a whole background and introduce a simple model proposed by Sarout and Guéguen [38]. This model divides the pores into circular pores and fractured pores. The circular pores contribute considerably to the total porosity, but they are not sensitive to the stress, whereas the fractured pores, which are “lying” in the bedding plane of the shale [39], are extremely sensitive to the triaxial stress and can reflect the variation of the elastic wave velocity. The variation of the fractured pores in the rock samples during the experiment is illustrated in Figure 12.
Because the anisotropy includes the inherent anisotropy caused by the bedding plane and the induced anisotropy caused by the presence of cracks, the shale toughness matrix can be expressed as follows [20,21,22,23,40]:
Becker et al. [34] referred to this as the Swiss cheese model, and they considered that the normal toughness and shear toughness of the contact area between the clay particles are zero under high confining pressure, so that the stress interaction between the crack contact surfaces can be neglected [41,42]. Therefore, it is assumed in the case of high confining pressure (60 MPa) and without soaking (0 h), the microcracks in the rock are closed, the shale elastic toughness matrix is the inherent matrix , and the variation of the elastic parameters deviating from reference state are due to the opening of the cracks under stress and hydration. Sayers and co-workers [20,21,43] supposed that each pore possesses the same stress environment under the same test condition, and they express the additional tensor ∆Sijkl caused by stress and hydration with a second-order tensor αij and a fourth-order tensor βijkl. Now, ∆Sijkl can be expressed as follows:
For rocks with TI properties such as shale, the toughness tensor and the hardness tensor are related as follows [23]:
By measuring the rock velocities under diverse experimental conditions, the hardness tensor can be obtained and the toughness tensor of the rock can be calculated.
In TI media, the tensors α and β possess symmetrical characteristics; therefore, α11 = α22, β1111 = β2222, and β1212 = β1122 = β1111/3. According to Equation (6), α and β can be solved with the additional toughness tensor ΔS:
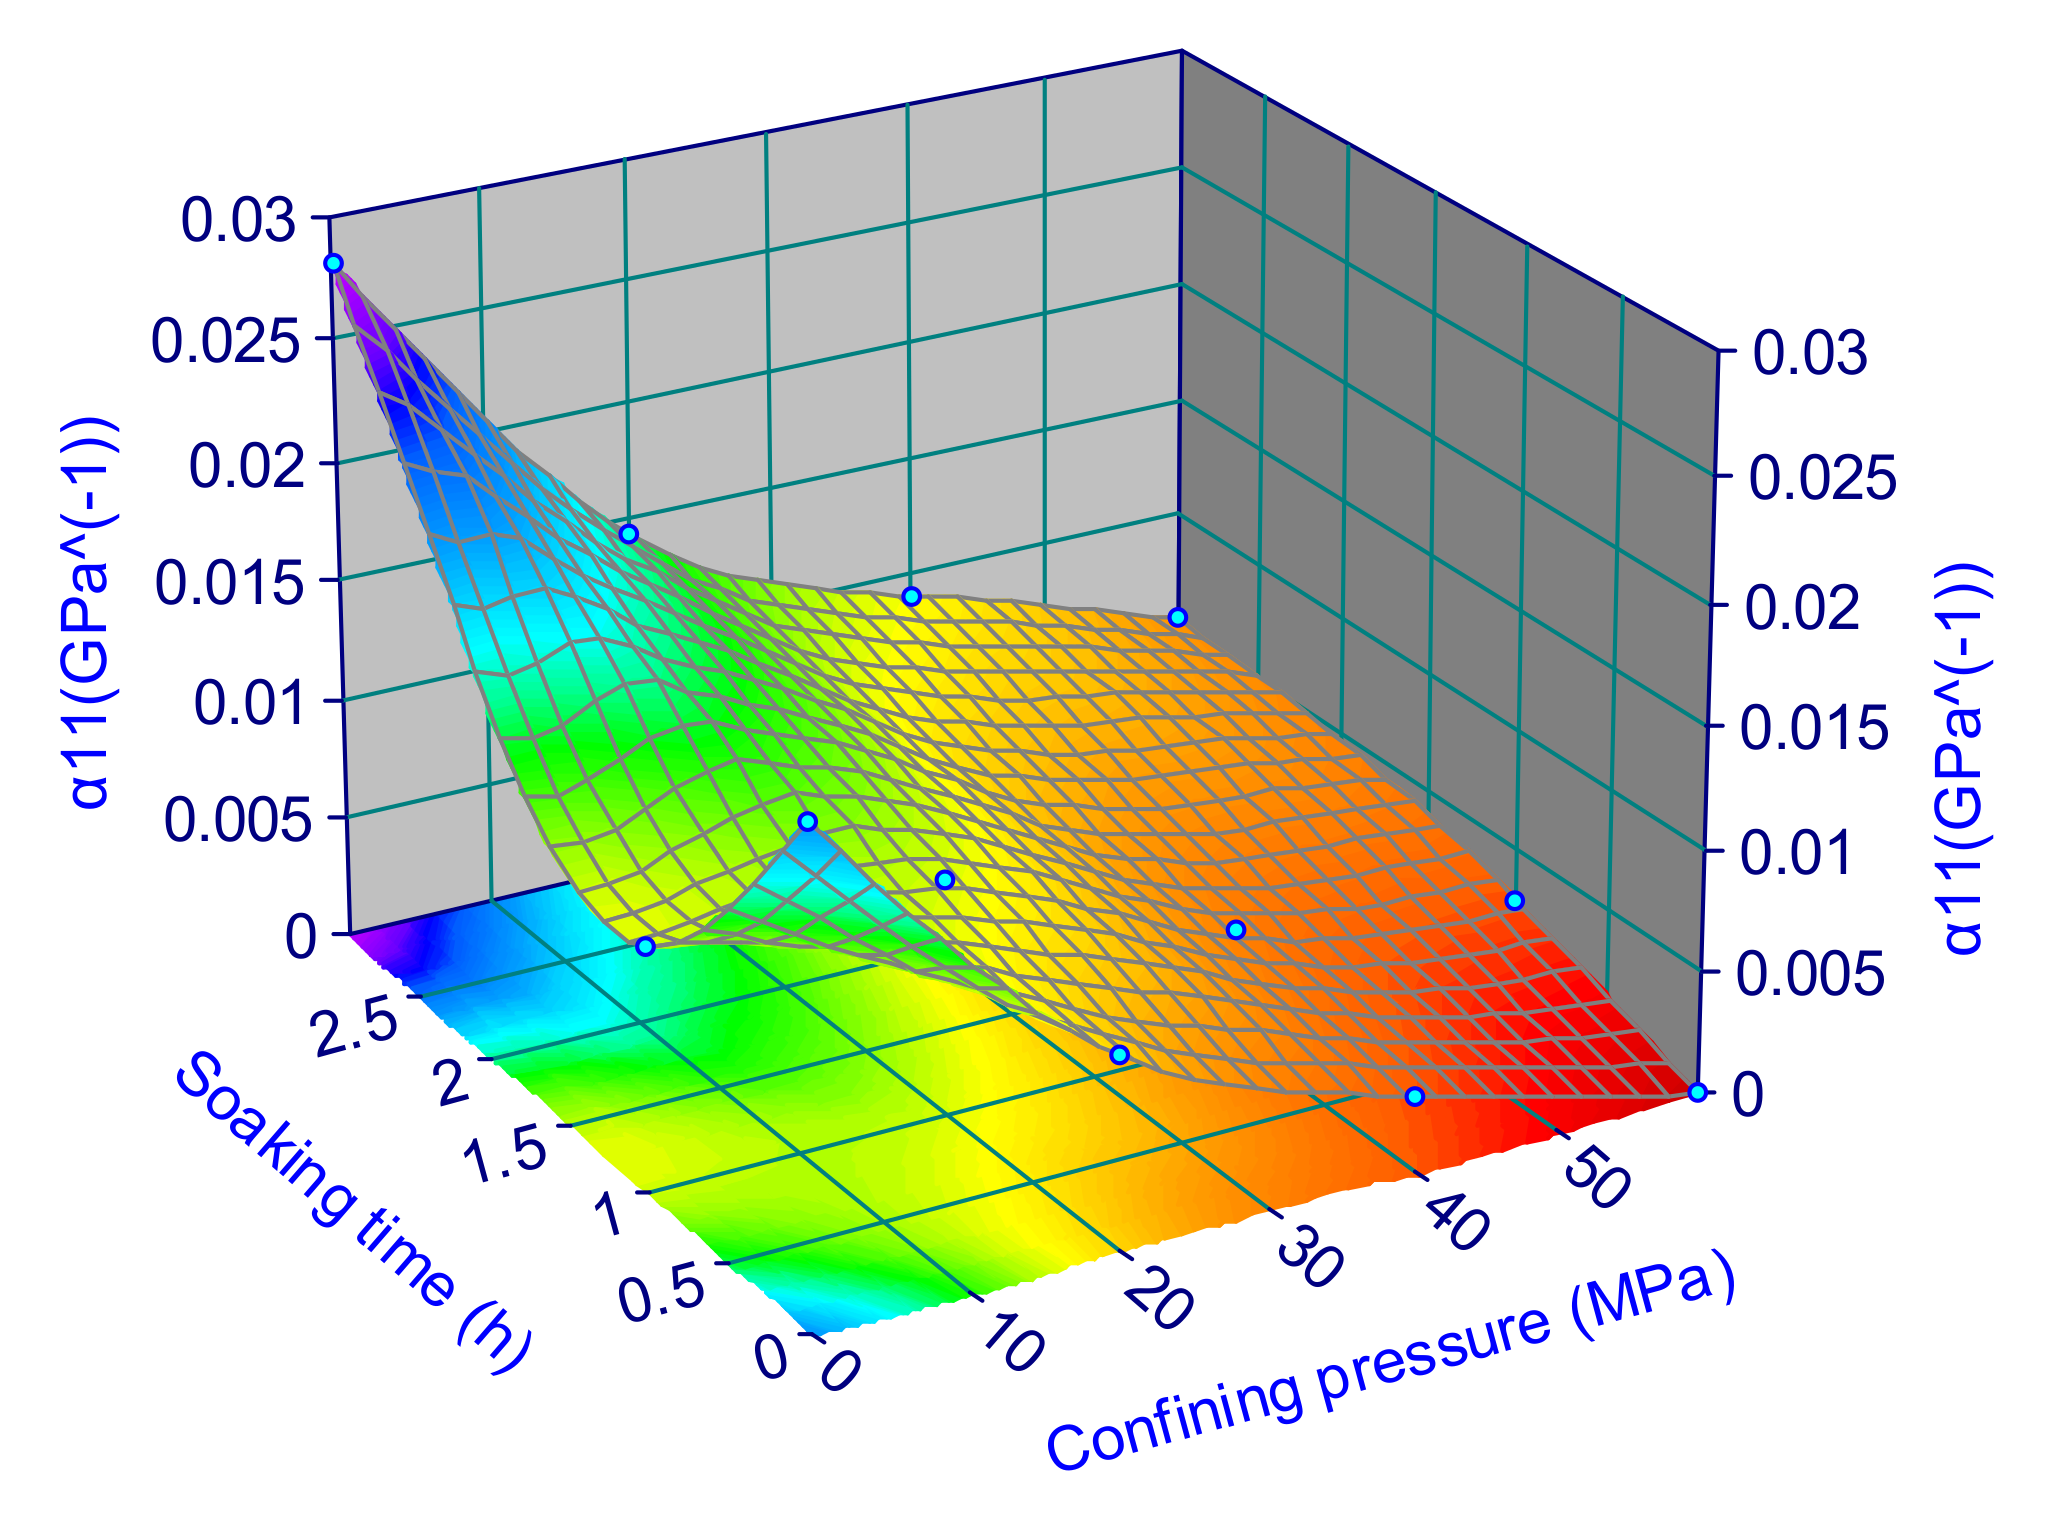
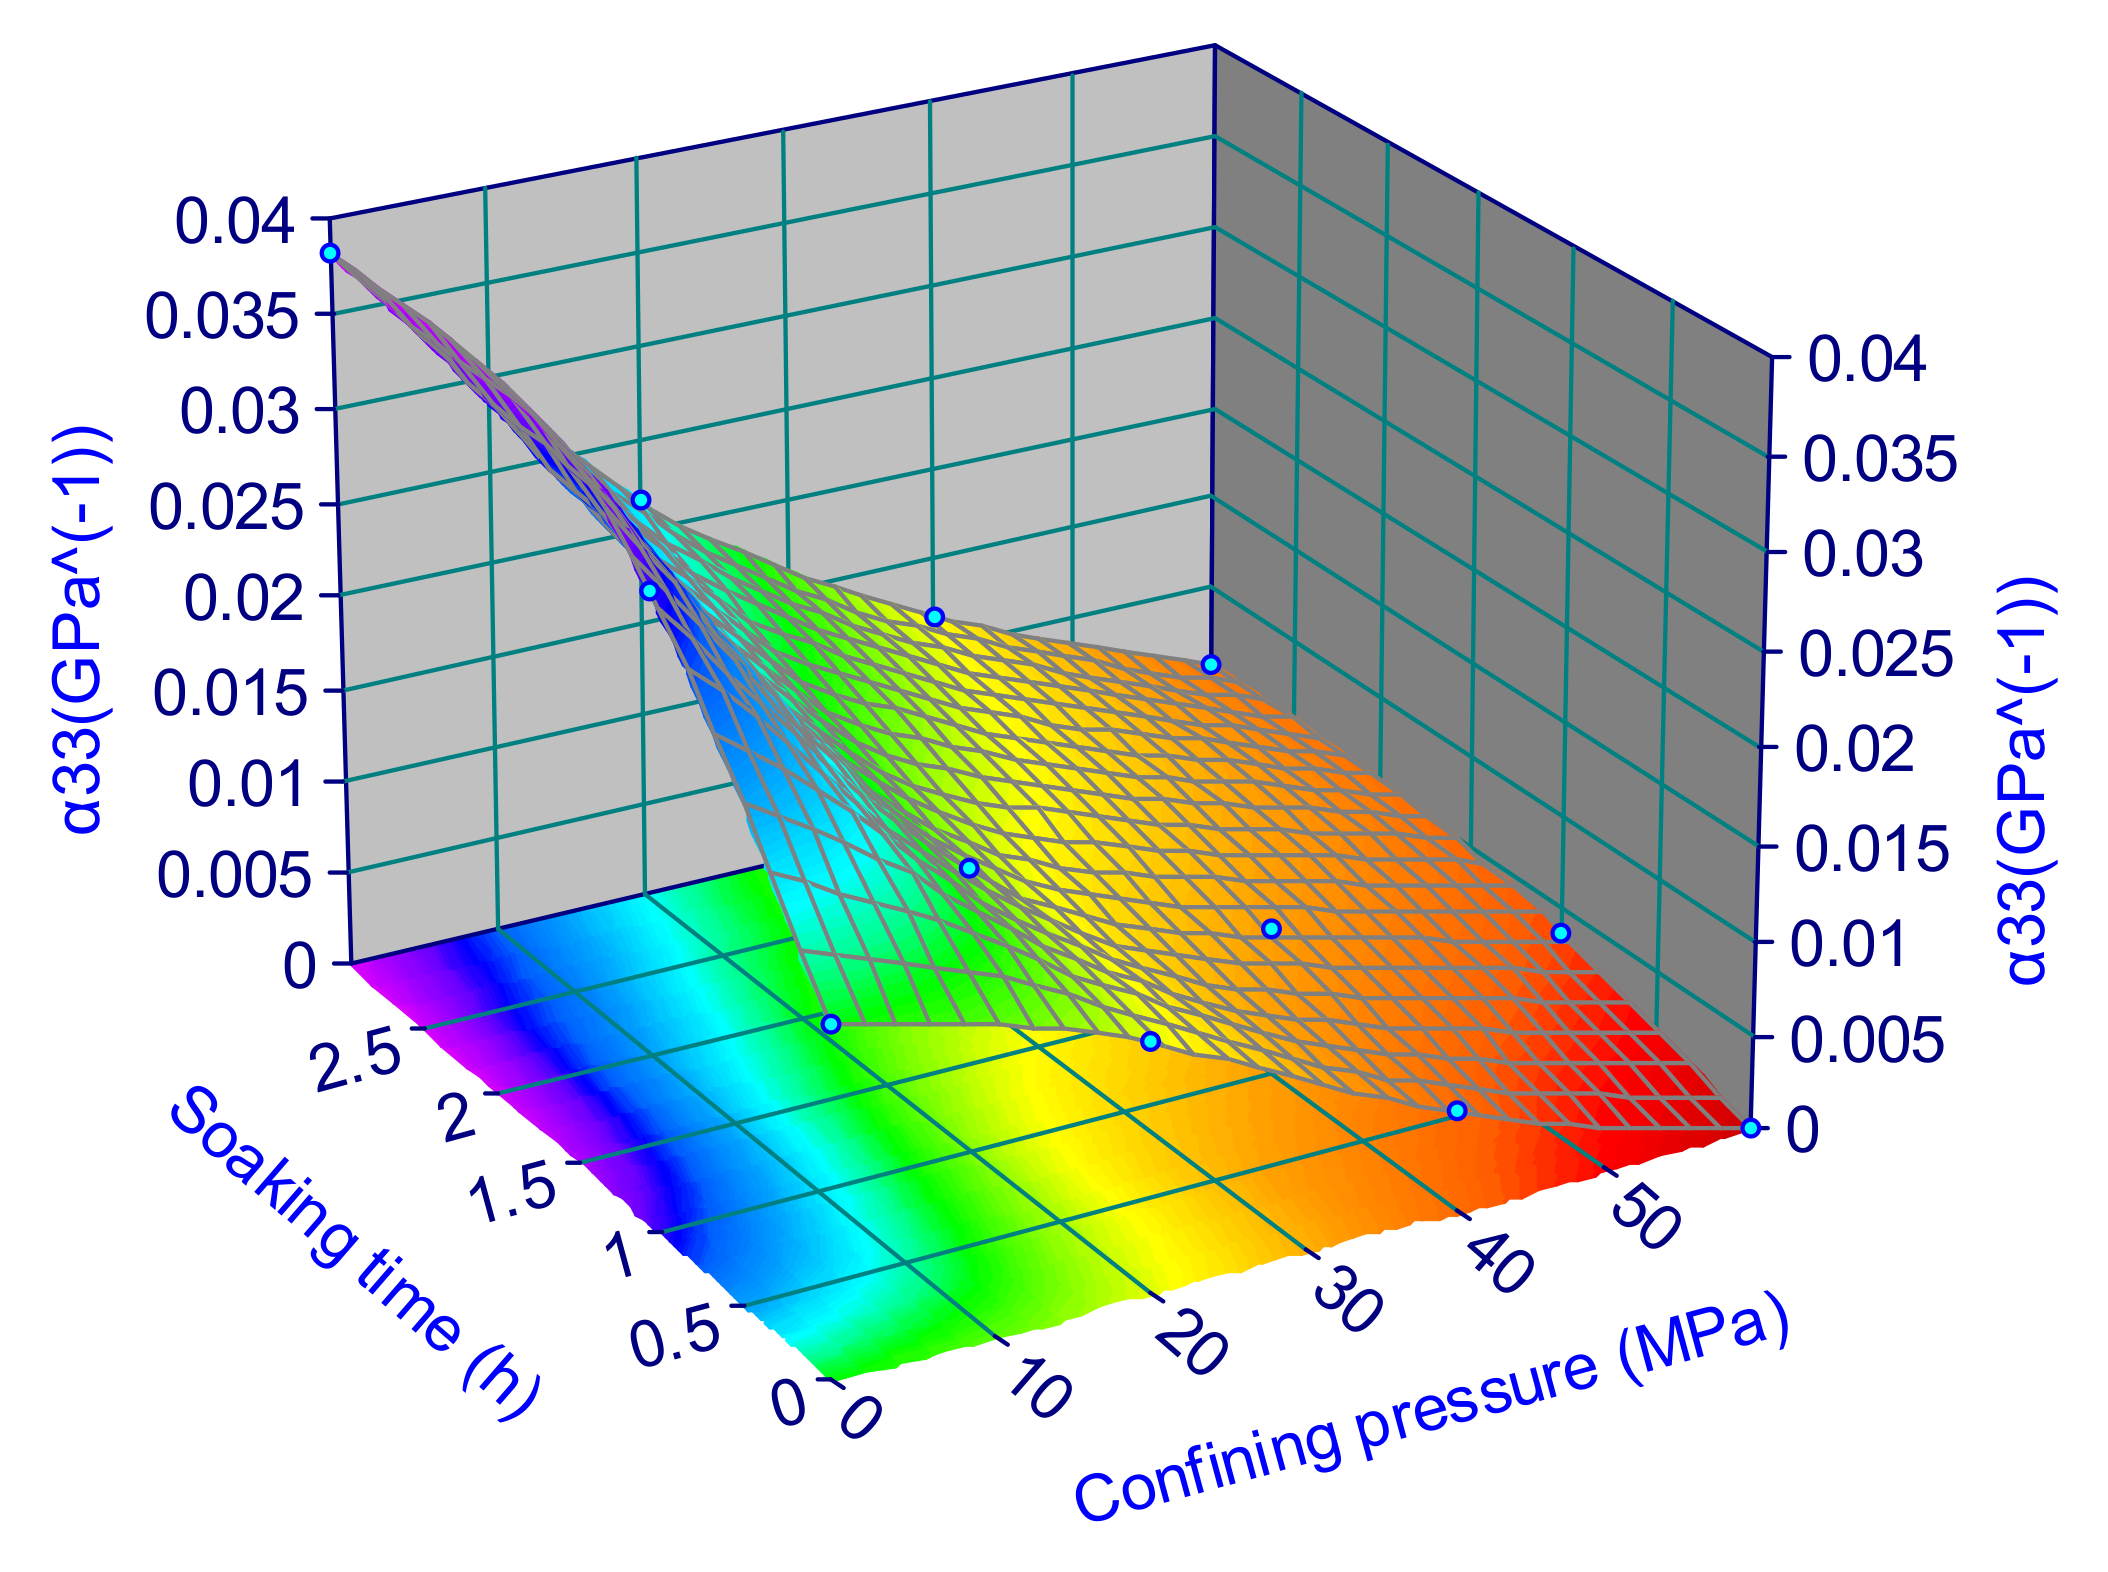
where α11 denotes the vertical damage parameter and α33 denotes the horizontal damage parameter. Here, the degree of damage under different confining pressures and different soaking times are evaluated by calculating the toughness parameters under different test conditions. With the interpolation method, the results are shown in Figure 13 and Figure 14.
Based on the dispersion damage model, the following results can be drawn: Under the same confining pressure, both α11 and α33 increase with increasing the soaking time and the microcracks are gradually opened as the result of immersion. For the same soaking time, both α11 and α33 decreased with increasing confining pressure, as the microcracks gradually closed with increasing pressure. Under the same test conditions, α33 is larger than α11, which indicates that the microcracks in the shale are mainly distributed in the horizontal direction and less in the vertical direction.
To show the effect of stress and hydration on damage parameters intuitively, Figure 13 and Figure 14 are surface-fitted. The expressions for α11 and α33 as functions of confining pressure and soaking time are obtained as follows:
Equations (10) and (11) show that a linear relationship cannot be used to describe the damage parameters with confining pressure and soaking time, which means that the confining pressure and soaking time do not have independent effects on shale damage but mutually influence and interact with each other. The damage to the rock is the product of stress and hydration coupling.
5.3. Comparison and Analysis of these Two Damage Models
The damage models mentioned above evaluate the damage of shale from two aspects. Damage parameters evaluated by Young’s modulus are dimensionless parameters, whereas the damage parameters evaluated by the dispersion model are dimensional parameters. To compare these two methods, DEv, DEh and α11, α33 must be normalized, respectively. Then, the relative errors of EDαv and EDαh can be used to calculate these two kinds of damage parameters under the same test conditions. The results are listed in Table 1.
As shown in Table 1, we can observe that the errors for 18 out of 24 data points are <20%, and the errors under low confining pressure are larger than those under high confining pressure. The results demonstrate that the damage parameters calculated by the two methods are not so different in most cases. Compared with the relative error EDαv in the vertical direction, the relative error EDαh in the horizontal direction is smaller, thus the damage parameters calculated by using the two methods are closer to each other for the horizontal direction.
6. Conclusions
Mineral composition, the size and shape of the cracks, the spatial distribution of the pores, and the presence of fluid are the major factors affecting shale elastic parameters and mechanical properties. By conducting a triaxial compressive-acoustic-emission experiment on shale under different soaking times, the acoustic-wave velocities of the shale at different confining pressures were measured. Based on the measured acoustic-wave velocities, rock-mechanics parameters and shale’s anisotropy were calculated. Damage to the shale under stress and hydration were evaluated by using Young’s modulus and the diffusion model. Through the research and analysis of this paper, the following conclusions are drawn:
- (1)
- For the same test case, the acoustic-wave velocity is the fastest in the direction parallel to the bedding plane, followed by the 45° coring angle, and lowest in the direction vertical to the bedding plane; rock-mechanics parameters in the horizontal direction are greater than those in the vertical direction; P-wave anisotropy is greater than S-wave anisotropy; and damage parameters in the horizontal direction are greater than those the vertical direction, as microcracks are mainly distributed horizontally.
- (2)
- Under the same confining pressure, with the increase of soaking time, generally speaking, the acoustic-wave velocities decreased, Young’s modulus decreased, Poisson’s ratios increased, ε increased, γ decreased, and both α11 and α33 increased.
- (3)
- For the same soaking time, with increasing confining pressure, the acoustic-wave velocities increased, Young’s modulus and Poisson’s ratio increased, ε decreased, γ increased, and all damage parameters decreased.
- (4)
- By surface-fitting the damage parameters, expressions for α11 and α33 as functions of confining pressure and soaking time were obtained. The fitting results show that the confining pressure and soaking time do not have independent effects on shale damage but mutually influence and interact with each other. The damage to the rock is the product of stress and hydration coupling.
Acknowledgments
This work is supported by the National Natural Science Foundation of China (Grant No. 51604230), the China Postdoctoral Science Foundation (Grant Nos. 2016M600626 and 2017T100592), and the Young Elite Scientists Sponsorship Program by CAST (Grant No. 2017QNRC001).
Author Contributions
Ping Chen, Heyi Yuan and Tianshou Ma designed the study. Heyi Yuan and Tianshou Ma conducted the experiments, Junchuan Gui analyzed the data, Junchuan Gui, Tianshou Ma and Heyi Yuan wrote the paper. Ping Chen and Zhaoxue Guo reviewed the manuscript. All the authors read and confirmed the final manuscript.
Conflicts of Interest
The authors declare no conflict of interest.
Abbreviations
| Cij | Component of elastic stiffness matrix, GPa |
| ρ | Bulk density, g/cm3 |
| VP11, VS11 | P-wave and S-wave velocities in the 0° directions with respect to the plane of symmetry, m/s |
| VP45, VS45 | P-wave and S-wave velocities in the 45° directions with respect to the plane of symmetry, m/s |
| VP33, VS33 | P-wave and S-wave velocities in the 90° directions with respect to the plane of symmetry, m/s |
| Ev, Eh | Young’s modulus perpendicular and parallel to the bedding plane, GPa |
| μv, μh | Poisson’s ratio perpendicular and parallel to the bedding plane, dimensionless |
| ε, γ, δ | Thomsen coefficients, dimensionless |
| DEv, DEh | Vertical and horizontal damage parameters defined by Young’s modulus, dimensionless |
| Evset, Ehset | Vertical and horizontal Young’s modulus of shale under a confining pressure of 60 MPa and without soaking, GPa |
| S0ijkl | Inherent elastic toughness matrix, GPa−1 |
| ∆Sijkl | Additional elastic toughness matrix, caused by the stress and hydration, GPa−1 |
| δij | Kronecker symbol, where δij = 0 (i ≠ j) and δij = 1 (i = j), dimensionless |
| αij | Second-order damage parameter, related to the void, GPa−1 |
| βijkl | Fourth-order damage parameter, related to the fluid in the void, GPa−1 |
| Pc | Confining pressure, MPa |
| Ts | Soaking time, h |
References
- Ma, T.; Chen, P. A wellbore stability analysis model with chemical-mechanical coupling for shale gas reservoirs. J. Nat. Gas Sci. Eng. 2015, 26, 72–98. [Google Scholar] [CrossRef]
- Ma, T.; Chen, P.; Yang, C.; Zhao, J. Wellbore stability analysis and well path optimization based on the breakout width model and Mogi-Coulomb criterion. J. Pet. Sci. Eng. 2015, 135, 678–701. [Google Scholar] [CrossRef]
- Ma, T.; Chen, P.; Zhang, Q.; Zhao, J. A novel collapse pressure model with chemical-mechanical coupling in shale gas formations with multi-weakness planes. J. Nat. Gas Sci. Eng. 2016, 36, 1151–1177. [Google Scholar] [CrossRef]
- Ma, T.; Zhang, Q.; Chen, P.; Yang, C.; Zhao, J. Fracture pressure model for inclined wells in layered formations with anisotropic rock strengths. J. Pet. Sci. Eng. 2017, 149, 393–408. [Google Scholar] [CrossRef]
- Dong, D.; Zou, C.; Yang, H.; Wang, Y.; Li, X.; Chen, G.; Wang, S.; Lü, Z.; Huang, Y. Progress and prospects of shale gas exploration and development in China. Acta Petrol. Sin. 2012, 33, 107–114. [Google Scholar]
- Wang, H.; Liu, Y.; Dong, D.; Zhao, Q.; Du, D. Scientific issues on effective development of marine shale gas in southern China. Pet. Explor. Dev. 2013, 40, 574–579. [Google Scholar] [CrossRef]
- Bustin, R. Barnett shale play going strong. AAPG Explor. 2005, 26, 4–6. [Google Scholar]
- Ma, T.; Cheng, P. Study of meso-damage characteristics of shale hydration based on CT scanning technology. Pet. Explor. Dev. 2014, 41, 249–256. [Google Scholar] [CrossRef]
- Ma, T.; Yang, C.; Chen, P.; Wang, X.; Guo, Y. On the damage constitutive model for hydrated shale using CT scanning technology. J. Nat. Gas Sci. Eng. 2016, 28, 204–214. [Google Scholar] [CrossRef]
- Zou, C.; Dong, D.; Wang, C.; Li, J.; Li, X.; Wang, Y.; Li, D.; Cheng, K. Geological characteristics, formation mechanism and resource potential of shale gas in China. Pet. Explor. Dev. 2010, 37, 641–653. [Google Scholar] [CrossRef]
- Ma, T.; Wu, B.; Fu, J.; Zhang, Q.; Chen, P. Fracture pressure prediction for layered formations with anisotropic rock strengths. J. Nat. Gas Sci. Eng. 2017, 38, 485–503. [Google Scholar] [CrossRef]
- Ma, T.; Yang, Z.; Chen, P. Wellbore stability analysis of fractured formations based on Hoek-Brown failure criterion. Int. J. Oil Gas Coal Technol. 2018, 17, 143–171. [Google Scholar] [CrossRef]
- Heng, S.; Yang, C.; Guo, Y.; Wang, C.; Wang, L. Influence of bedding planes on hydraulic fracture propagation in shale formations. Chin. J. Rock Mech. Eng. 2015, 34, 228–237. [Google Scholar]
- Lyu, Q.; Long, X.; Ranjith, P.; Tan, J.; Kang, Y. Experimental investigation on the mechanical behaviours of a low-clay shale under water-based fluids. Eng. Geol. 2018, 233, 124–138. [Google Scholar] [CrossRef]
- Lyu, Q.; Ranjith, P.; Long, X.; Ji, B. Experimental investigation of mechanical properties of black shales after CO2-water-rock interaction. Materials 2016, 9, 663. [Google Scholar] [CrossRef] [PubMed]
- Lyu, Q.; Ranjith, P.; Long, X.; Kang, Y.; Huang, M. A review of shale swelling by water adsorption. J. Nat. Gas Sci. Eng. 2015, 27, 1421–1431. [Google Scholar] [CrossRef]
- Wasantha, P.; Ranjith, P. Water-weakening behavior of Hawkesbury sandstone in brittle regime. Eng. Geol. 2014, 178, 91–101. [Google Scholar] [CrossRef]
- Mavko, G. Predicting stress-induced velocity anisotropy in rocks. Geophysics 1995, 60, 1081–1087. [Google Scholar] [CrossRef]
- Schoenberg, M. Elastic wave behavior across linear slip interfaces. J. Acoust. Soc. Am. 1980, 68, 1516–1521. [Google Scholar] [CrossRef]
- Sayers, C.; Kachanov, M. Microcrack-induced elastic wave anisotropy of brittle rocks. J. Geophys. Res. Solid Earth 1995, 100, 4149–4156. [Google Scholar] [CrossRef]
- Sayers, C. Stress-dependent seismic anisotropy of shales. Geophysics 1995, 64, 93–98. [Google Scholar] [CrossRef]
- Sarout, J.; Molez, L.; Guéguen, Y.; Hoteit, N. Shale dynamic properties and anisotropy under triaxial loading: Experimental and theoretical investigations. Phys. Chem. Earth Parts A/B/C 2007, 32, 896–906. [Google Scholar] [CrossRef]
- Tang, J.; Wu, G. Stress-dependent anisotropic of mudstone and shale with low porosity. Chin. J. Geophys. 2015, 58, 2986–2995. [Google Scholar]
- Ma, T.; Peng, N.; Zhu, Z.; Zhang, Q.; Yang, C.; Zhao, J. Brazilian Tensile Strength of Anisotropic Rocks: Review and New Insights. Energies 2018, 11, 304. [Google Scholar] [CrossRef]
- Hornby, B.; Schwartz, L.; Hudson, J. Anisotropic effective-medium modeling of the elastic properties of shales. Geophysics 1994, 59, 1570–1583. [Google Scholar] [CrossRef]
- Johnston, J.; Christensen, N. Elastic constants and velocity surfaces of indurated anisotropic shales. Surv. Geophys. 1994, 15, 481–494. [Google Scholar] [CrossRef]
- Walsh, J.; Sinha, B.; Donald, A. Formation anisotropy parameters using borehole sonic data. In Proceedings of the SPWLA 47th Annual Logging Symposium, Veracruz, Mexico, 4–7 June 2006. SPWLA-2006-TT. [Google Scholar]
- Tang, X.; Zheng, C. Quantitative Logging Acoustic; Petroleum Industry Press: Beijing, China, 2004. [Google Scholar]
- Higgins, S.; Goodwin, S.; Donald, A.; Bratton, T.; Tracy, G. Anisotropic stress models improve completion design in the Baxter Shale. In Proceedings of the SPE Annual Technical Conference and Exhibition USA, Denver, CO, USA, 21–24 September 2008. SPE 115736. [Google Scholar]
- Denney, D. Improving horizontal completions in heterogeneous tight shales. J. Pet. Technol. 2012, 64, 126–130. [Google Scholar] [CrossRef]
- Song, L.; Hareland, G. Minimum horizontal stress profile from logging data for Montney formation of North East British Columbia. In Proceedings of the SPE Unconventional Resources Conference Canada, Calgary, AB, Canada, 30 October–1 November 2012. SPE 162233. [Google Scholar]
- Wang, H.; Wang, B.; Jing, A.; Tao, G. An algorithm for extracting shear-wave anisotropy parameter γ from stoneley-wave inversion and its case study. Well Logging Technol. 2007, 31, 49–52. [Google Scholar]
- Thomsen, L. Weak elastic anisotropy. Geophysics 1986, 51, 1954–1966. [Google Scholar] [CrossRef]
- Becker, K.; Shapiro, S.; Stanchits, S.; Dresen, G.; Vinciguerra, S. Stress induced elastic anisotropy of the Etnean basalt: Theoretical and laboratory examination. Geophys. Res. Lett. 2007, 34, 224–238. [Google Scholar] [CrossRef]
- Yu, S.; Feng, X. Damage Mechanics; Tsinghua University Press: Beijing, China, 1997. [Google Scholar]
- Eshelby, J. The determination of the elastic field of an ellipsoidal inclusion, and related problems. Proc. R. Soc. Lond. A Math. Phys. Eng. Sci. 1957, 241, 376–396. [Google Scholar] [CrossRef]
- Withers, P. The determination of the elastic field of an ellipsoidal inclusion in a transversely isotropic medium, and its relevance to composite materials. Philos. Mag. A 1989, 59, 759–781. [Google Scholar] [CrossRef]
- Sarout, J.; Guéguen, Y. Anisotropy of elastic wave velocities in deformed shales: Part 2—Modeling results. Geophysics 2008, 73, D91–D103. [Google Scholar] [CrossRef]
- Dewhurst, D.; Siggins, A. Impact of fabric, microcracks and stress field on shale anisotropy. Geophys. J. Int. 2006, 165, 135–148. [Google Scholar] [CrossRef]
- Horsrud, P.; Sønstebø, E.; Bøe, R. Mechanical and petrophysical properties of North Sea shales. Int. J. Rock Mech. Min. Sci. 1998, 35, 1009–1020. [Google Scholar] [CrossRef]
- Shapiro, S. Elastic piezosensitivity of porous and fractured rocks. Geophysics 2003, 68, 482–486. [Google Scholar] [CrossRef]
- Shapiro, S.; Kaselow, A. Porosity and elastic anisotropy of rocks under tectonic stress and pore-pressure changes. Geophysics 2005, 70, 27–38. [Google Scholar] [CrossRef]
- Sayers, C.; Munster, J.; King, M. Stress-induced ultrasonic anisotrophy in Berea sandstone. Int. J. Rock Mech. Min. Sci. Geomech. Abstr. 1990, 27, 429–436. [Google Scholar] [CrossRef]
Figure 1.
Relationship between acoustic-wave propagation direction and bedding surface.

Figure 2.
Principle of experimental apparatus.

Figure 3.
Wave velocities versus confining pressure in the 0° direction with respect to the plane of symmetry. (a) P-wave (VP11) versus confining pressure and time; and (b) S-wave (VS11b) versus confining pressure and time.
Figure 3.
Wave velocities versus confining pressure in the 0° direction with respect to the plane of symmetry. (a) P-wave (VP11) versus confining pressure and time; and (b) S-wave (VS11b) versus confining pressure and time.

Figure 4.
Wave velocities versus confining pressure in the 90° direction with respect to the plane of symmetry. (a) P-wave (VP33) versus confining pressure and time; and (b) S-wave (VS33) versus confining pressure and time.
Figure 4.
Wave velocities versus confining pressure in the 90° direction with respect to the plane of symmetry. (a) P-wave (VP33) versus confining pressure and time; and (b) S-wave (VS33) versus confining pressure and time.

Figure 5.
Wave velocities versus confining pressure in the 45° direction with respect to the plane of symmetry. (a) P-wave (VP45) versus confining pressure and time; and (b) S-wave (VS45) versus confining pressure and time.
Figure 5.
Wave velocities versus confining pressure in the 45° direction with respect to the plane of symmetry. (a) P-wave (VP45) versus confining pressure and time; and (b) S-wave (VS45) versus confining pressure and time.

Figure 6.
Young’s modulus versus confining pressure under stress and hydration coupling. (a) Young’s modulus Ev; and (b) Young’s modulus Eh.
Figure 6.
Young’s modulus versus confining pressure under stress and hydration coupling. (a) Young’s modulus Ev; and (b) Young’s modulus Eh.

Figure 7.
Poisson’s ratio versus confining pressure under stress and hydration coupling. (a) Poisson’s ratio μv; and (b) Poisson’s ratio μh.
Figure 7.
Poisson’s ratio versus confining pressure under stress and hydration coupling. (a) Poisson’s ratio μv; and (b) Poisson’s ratio μh.

Figure 8.
Thomsen coefficient (ε) versus confining pressure under stress and hydration coupling.

Figure 9.
Thomsen coefficient (γ) versus confining pressure under stress and hydration coupling.

Figure 10.
Damage parameter DEv versus confining pressure under stress and hydration coupling.

Figure 11.
Damage parameter DEh versus confining pressure under stress and hydration coupling.

Figure 12.
Conceptual model of the evolution of anisotropic pores under stress and hydration coupling.
Figure 12.
Conceptual model of the evolution of anisotropic pores under stress and hydration coupling.

Figure 13.
Damage parameter α11 under stress and hydration coupling.

Figure 14.
Damage parameter α33 under stress and hydration coupling.


Table 1.
Relative error of the damage parameters calculated by using the two methods.
| Confining Pressure | Vertical Relative Error EDαv (%) | Horizontal Relative Error EDαh (%) | ||||
|---|---|---|---|---|---|---|
| 0 h | 1 h | 3 h | 0 h | 1 h | 3 h | |
| 0 | 19.19 | 86.27 | 0.00 | 71.08 | 62.49 | 0.00 |
| 20 | 25.04 | 29.91 | 41.64 | 11.11 | 15.57 | 17.71 |
| 40 | 9.58 | 12.63 | 13.30 | 5.09 | 5.55 | 16.43 |
| 60 | 0.00 | 3.66 | 0.37 | 0.00 | 5.56 | 12.38 |
© 2018 by the authors. Licensee MDPI, Basel, Switzerland. This article is an open access article distributed under the terms and conditions of the Creative Commons Attribution (CC BY) license (http://creativecommons.org/licenses/by/4.0/).
Share and Cite
MDPI and ACS Style
Gui, J.; Ma, T.; Chen, P.; Yuan, H.; Guo, Z. Anisotropic Damage to Hard Brittle Shale with Stress and Hydration Coupling. Energies 2018, 11, 926. https://doi.org/10.3390/en11040926
AMA Style
Gui J, Ma T, Chen P, Yuan H, Guo Z. Anisotropic Damage to Hard Brittle Shale with Stress and Hydration Coupling. Energies. 2018; 11(4):926. https://doi.org/10.3390/en11040926
Chicago/Turabian StyleGui, Junchuan, Tianshou Ma, Ping Chen, Heyi Yuan, and Zhaoxue Guo. 2018. "Anisotropic Damage to Hard Brittle Shale with Stress and Hydration Coupling" Energies 11, no. 4: 926. https://doi.org/10.3390/en11040926
Note that from the first issue of 2016, this journal uses article numbers instead of page numbers. See further details here.