1. Introduction
Governments and companies are increasingly alarmed about global warming, depletion of fossil fuels, environmental degradation and rising energy prices. Accordingly, effective energy use and reduced greenhouse gas (GHG) emissions are becoming increasingly important targets. In the report on the Best Availability Technologies (BAT) for energy efficiency [
1], the EU Commission underlines the priority of reducing energy use and greenhouse gas emissions as an issue within the European Union. The main reasons that justify this recent focus are climate change, the large-scale use of irreplaceable fossil fuels, the need to achieve sustainability mainly through renewable energy sources and, finally, the security of the energy supply (the EU imports over 50% of energy fuels and this is expected to rise to more than 70% in the next 20 to 30 years). The industrial sector is one of the major energy consumers and Tonn and Martin [
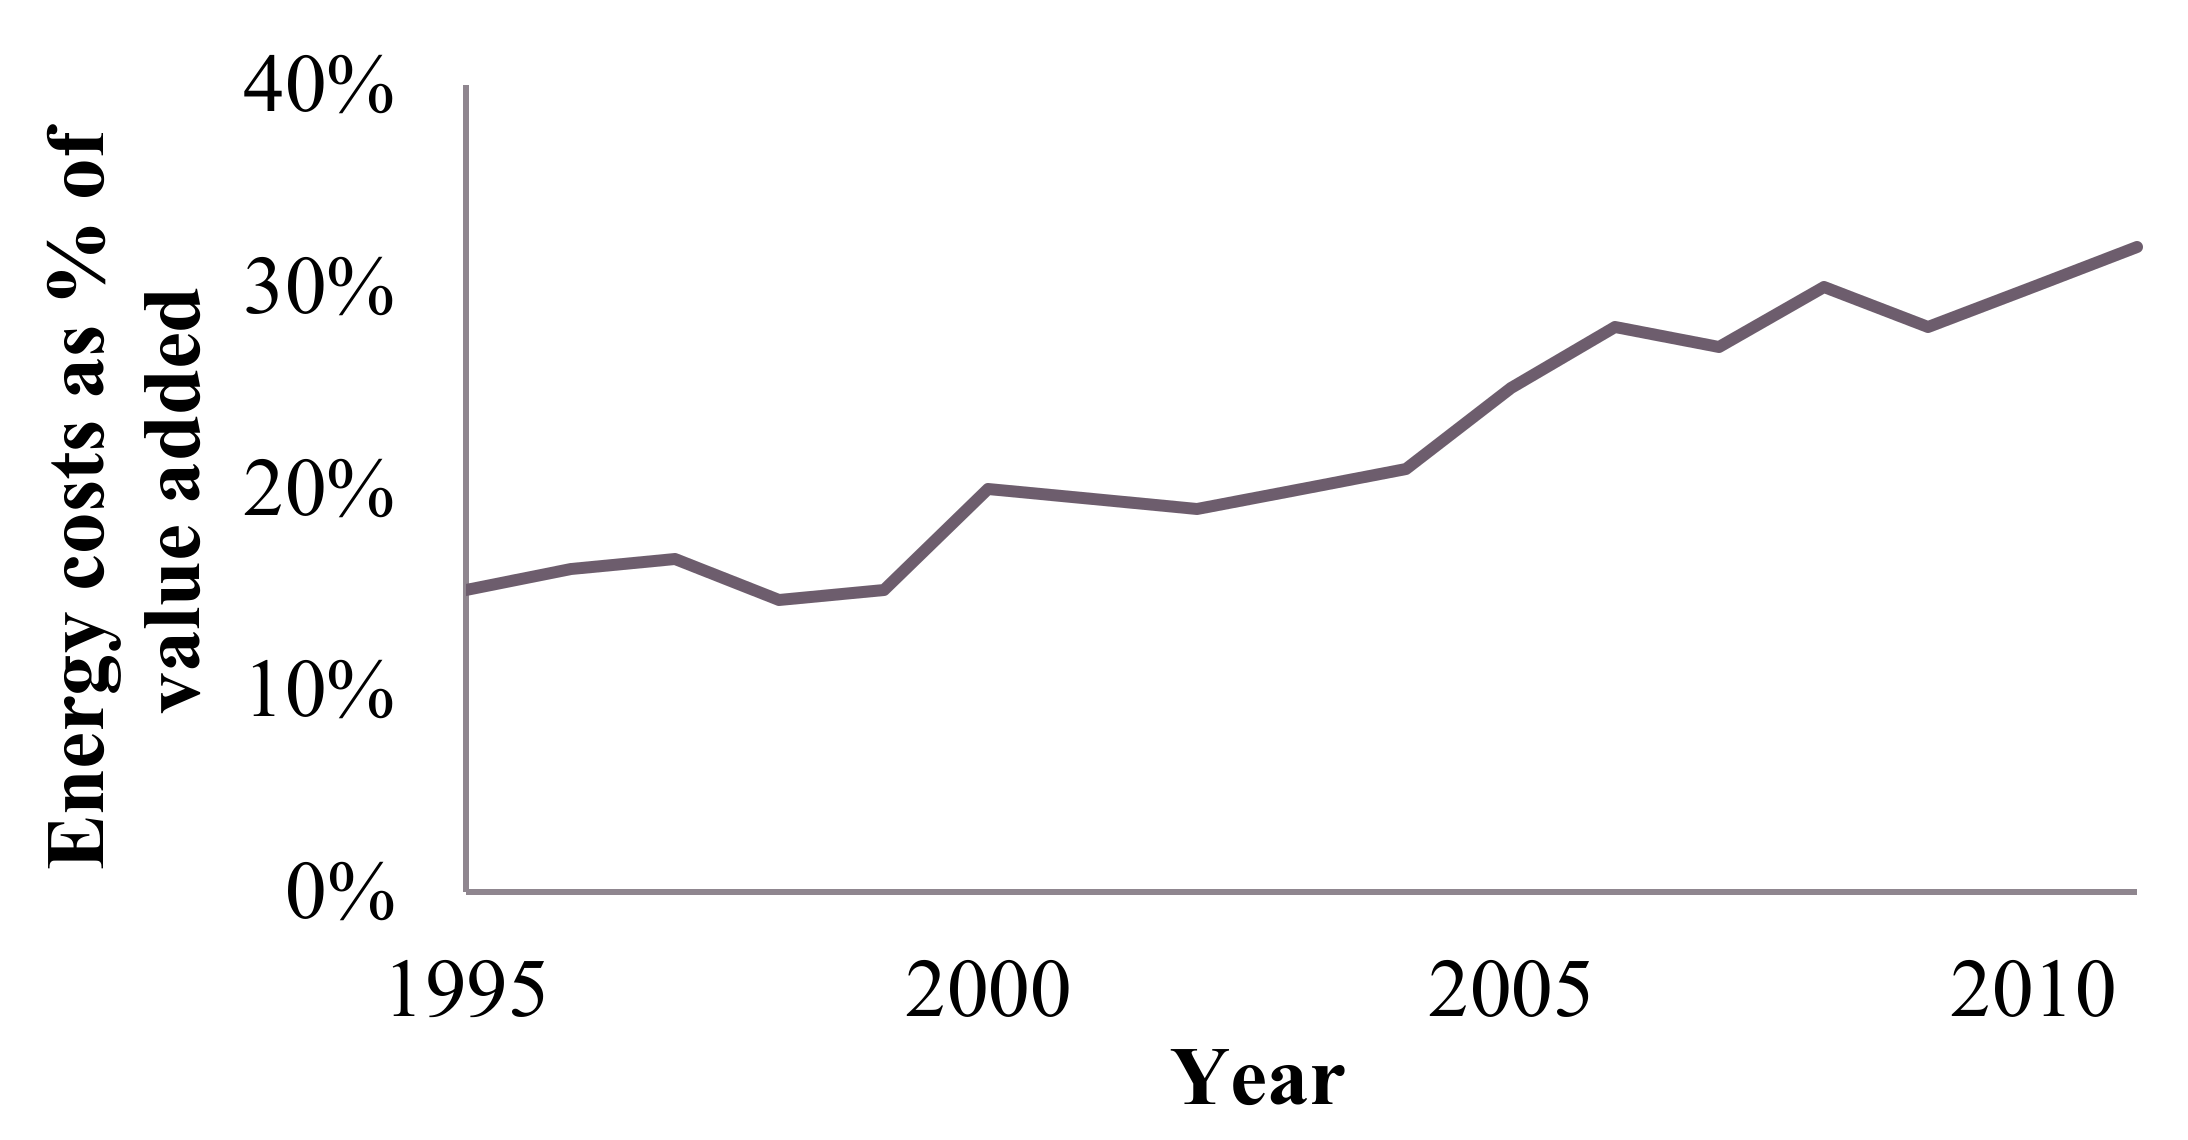
2] showed that a high potential to save energy in manufacturing processes still exists. In addition, increasing global competition puts several major demands on companies, one of which is the continuous improvement of cost savings. Since energy is a key input in many production processes and it is subject to rising prices, energy costs represent a competitiveness factor for manufacturing plants, with the intensity of use and energy prices as the major drivers. For instance,
Figure 1 shows the impact of the energy costs on the value added, considering these two drivers, in the European manufacturing sector. Investment decisions affecting the energy consumption of industrial production systems are a crucial way of dealing with changing conditions and represent a significant factor in reaching higher cost efficiency and competitiveness [
3]. These investments that reduce energy consumption can lead to relevant cost savings in the energy bill and they can also affect the manufacturing cost, since energy costs are one of its components. In fact, the unit production cost is characterized by different contributions (e.g., labour, raw materials, consumables, services, etc.) and among these contributions it is possible to identify some components that are a function of energy performance (e.g., specific energy consumption, SEC).
Despite the great benefits achievable through the implementation of energy efficiency measures, many barriers still exist and the main ones are [
5]: decisions based only on payback periods instead of interest rate calculations, limited capital available for investments, low priority given to energy efficiency by management and a lack of information or “difficult-to-measure components” of energy investments. In particular, energy efficiency investments require a huge amount of capital and/or time and often companies, especially small and medium enterprises (SMEs), are in a particular disadvantageous position in obtaining both the capital from third parties (such as banks) and the strategic information on new and existing technologies [
6]. The coordination across the supply chain of both operational and financial decisions represents a relevant opportunity to make investments profitable also for those weaker firms [
7]. Supply chain finance (SCF) identifies the recent research stream in which the coordination across the supply chain interests also the financial flows in addition to the traditional centralization of operational decisions peculiar to supply chain management (SCM) [
8,
9].
Especially, against the background of a general economic crisis, SCF provides the opportunity to reach better global results, to invest more in strategic areas such as the environmental one and to strengthen the relationships among the members. Coordination effects are particularly relevant when companies belonging to the same chain have unequal access to capital, for instance due to different site locations which are characterized by different regulatory schemes, economic conditions and ratings, or different plant sizes and market power, which lead to different accessibility to bank loans and interest rates. To make the share of financial resources profitable for all the members of the supply chain and to reduce the incentive to deviate from the global optimal decision, incentive mechanisms for cooperation should be undertaken. Examples of these mechanisms are the establishment of a specific contract, which sets a transfer payment scheme (e.g., savings distributed proportionally to the partners’ amount of investment), information sharing, reduction in price components due to higher efficiency, transaction-specific investments to reinforce the specific relationship and not the other competitors [
10,
11,
12]. Jaber and Osman [
13] proposed a centralized supply chain model characterized by an agreement on the order quantity and the trade credit (e.g., quantity discounts and delay in payments), introducing also a profit-sharing mechanism for distribution among the players in the supply chain of the net savings generated. Along this line of research, recently Marchi et al. [
14] presented a Joint Economic Lot Size (JELS) model where a buyer has access to capital at a lower interest rate than its vendor for different reasons (e.g., dimension, location, bank agreements). The study illustrates that, in case the opportunity to invest on the vendor’s production capacity exists, thoroughly coordinating the financial flow, considering the option to share the capital cost and the inventory replenishment activities help to improve the performance of the entire supply chain.
To monitor the progress in the energy performance of a given production plant and to see the impact of energy efficiency measures over time, energy efficiency indicators have been introduced. The most relevant indicator is the Energy Efficiency Index (
EEI), which is defined by the ratio between a specific energy consumption taken as a reference and the specific energy consumption of the considered unit or process [
1]:
. The specific energy consumption, that is, the amount of energy consumed per unit of output, shows how much energy is used for a given output but one single value is of limited use without other reference data. On the other hand, the
EEI, thanks to its relativity, can be used to show the real changes in the energy efficiency within the time period given for the system, process or installation. Technological learning curves have been commonly used as a tool to understand the technological change and to forecast the evolutionary trajectory of a technology as a function of cumulative production volume, also known as “learning-by-doing” [
15]. In a recent work [
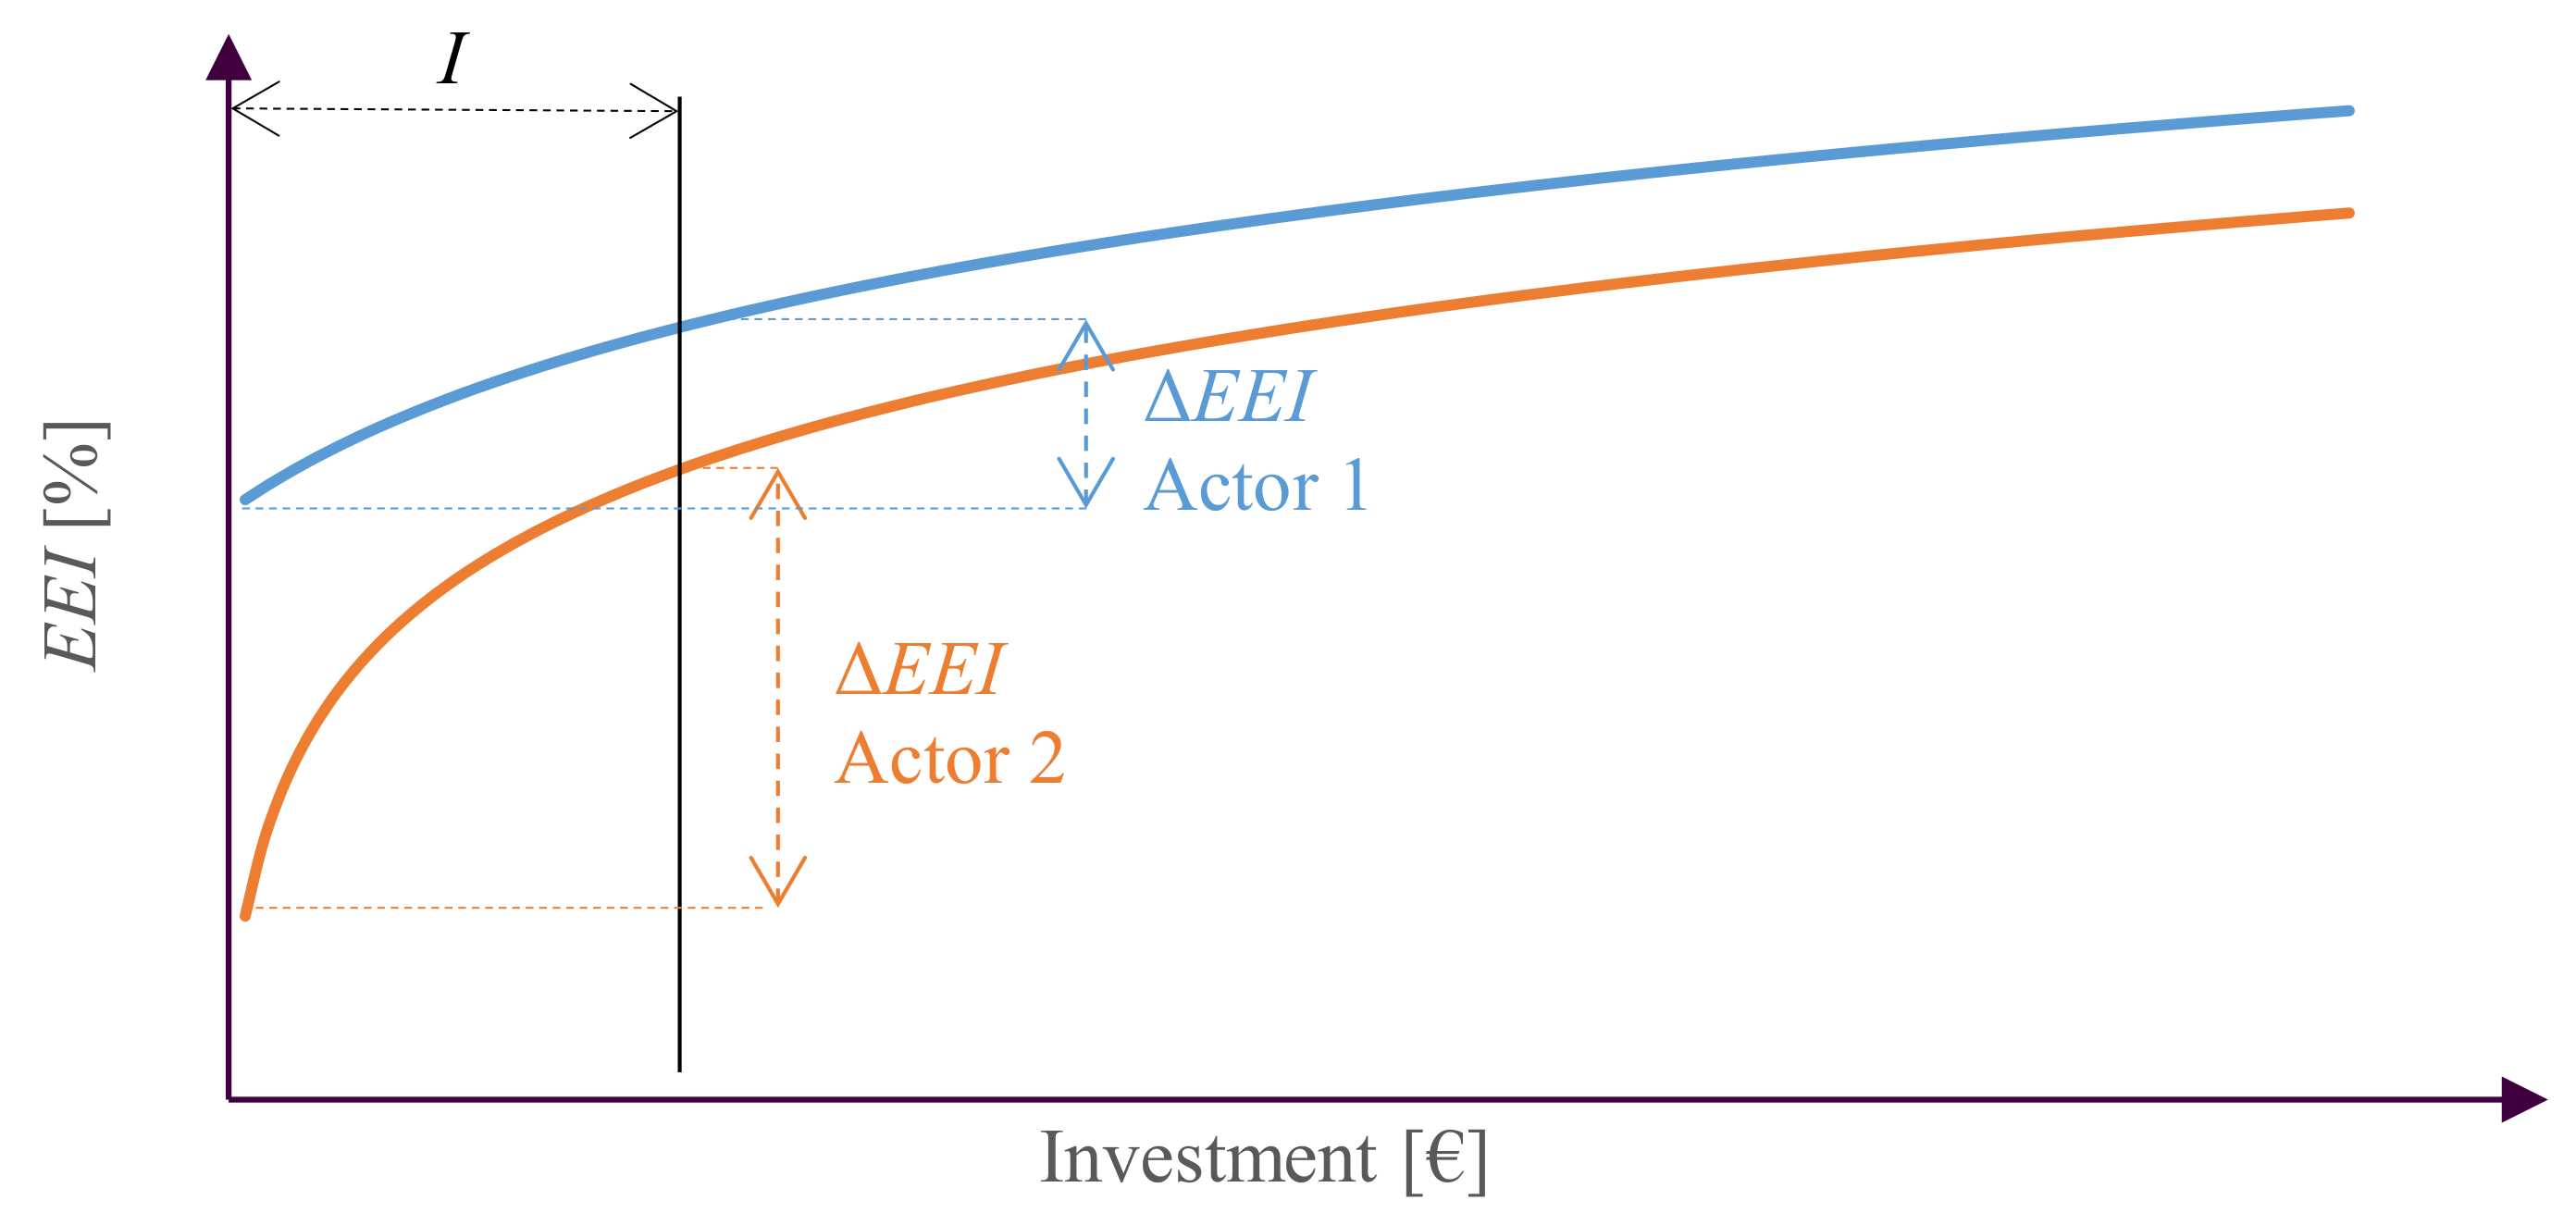
16], the authors presented a framework that distinguishes the different effects of learning on direct inputs to a technology and the effects on the value added. Different firms of the supply chain are characterized by a different learning curve for the implementation of the new measure and by a different cumulated investment amount which is due to a different investment history. For these reasons, the potential investments present different effects if implemented by different actors.
Figure 2 shows an example in which the two actors of the same supply chain are located at different points of their learning curve. It is possible to observe how the same investment,
I, leads to different effects on the energy performance which are measured through the Energy Efficiency Index, Δ
EEI. The coordination of the supply chain allows also to overcome the barrier due to lack of awareness, knowledge and information reducing the differences among the companies through a supplier development process or, simply, through a financial cooperation across the supply chain. Recently, Glock et al. [
17] provided a systematic review of decision support models for supplier development and developed a research agenda supporting the identification of the most promising areas for future research in this area.
In the last decades, research streams on energy efficiency in the industrial sector have been widely developed, highlighting the relevance of the topic in real application and some relevant literature reviews have been produced,—for example, Marchi and Zanoni [
7] proposed a systematic review of papers focused on the integration of energy efficiency in supply chain design and management; Biel and Glock [
18] analysed the decision support models that integrate energy aspects into the mid-term and short-term production planning of manufacturing companies; Schulze et al. [
19] provided a systematic review of existing academic journal publications on energy management in industry; Tanaka [
20] developed a contextual framework for policy analysis for enhancing energy efficiency and conservation in industry; Pons et al. [
21] defined a map of the adopted technologies for the reduction of energy consumption in production and related them to the performances of manufacturing firms, while Abdelaziz et al. [
22] presented a comprehensive literature review about industrial energy saving by management, technologies and policies. In addition, some other interesting works on investment in industrial energy efficiency are the one of Blomqvist and Thollander, [
23], that presented a dataset integrating energy efficiency data from Sweden and USA in order to overcome information barriers and the one of Marchi and Zanoni, [
24], which quantitatively analysed the effects that different types of investments have on the energy performances when the demand is variable. Later, Marchi et al. [
25] analysed the effects on energy efficiency of the integration of the decision-making process concerning operations and heat recovery opportunities for a single-vendor single-buyer supply chain; while, Bazan et al. [
26] presents a two-level closed-loop supply chain model with two coordination policies (classical and Vendor Managed Inventory with the Consignment Stock agreement, VMI-CS) considering two critical environmental issues, that is, the energy used in production processes and the GHG emissions from production and transportation activities.
To the best knowledge of the authors, a feasibility evaluation of energy efficiency investments and an analysis of the effects introduced through a supply chain perspective have not yet been presented even though some works considering a supply chain perspective to improve the energy performance currently exist [
7]. In addition, the benefits that coordination across the supply chain can provide in overcoming the energy efficiency barriers are not considered and analysed. The main goal of this paper is, hence, to analyse joint investment opportunities in energy efficiency, investigating the savings and costs introduced through the evaluation of the net present value of a two-echelon supply chain model. Specifically, with this work the authors want to propose a model that support decision maker in answering the following research questions: which effects has joint decision-making on the amount of the invested capital and on the benefits introduced through energy efficiency investments? Could the coordination of the different actors allow the overcoming of current barriers faced in the implementation of energy efficiency measures? The methodology proposed is based on the net present value approach since it is the most accurate methods for the evaluation of investments’ feasibility and for ranking alternative investments [
27].
The remainder of this paper is organized as follows:
Section 2 introduces the notations and assumptions and presents the mathematical models of the different scenarios considered;
Section 3 provides numerical examples to illustrate the proposed models and, finally,
Section 4 concludes the paper summarizing the main findings and providing suggestions for future research.
2. Model Formulation
This paper considers the problem of coordinating financing decisions to implement energy efficiency investment in a two-stage supply chain, that is, a buyer and a vendor. The objective is to determine the optimal values of the invested amounts leading to an improvement in the energy efficiency of the overall supply chain and maximizing the Net Present Value (
NPV) of the supply chain in the lifetime of the investments. In addition, it is assumed that the buyer has a better financial position, in terms of liquidity and solvency, than the vendor and, consequently, he has huge availability of capital at an interest rate lower than the one of the vendor,
. Hence, aiming at improving the overall performance, the buyer could increase the energy efficiency of the partner through supplier development initiatives. In the model, both the actors are assumed to have no budget available and, thus, they need a loan by a third-party actor (e.g., bank, Energy Service Company). Two different models corresponding to alternative scenarios have been considered, where the distinctive aspect is the investment decision-making of the actors: firstly, we analyse the scenario in which the actors act independently (decentralized scenario, defined as “D”) and then the integrated scenario (centralized scenario, defined as “C”). In the decentralized scenario, each player optimizes its own
NPV independently and the decision variables for the buyer and the vendor are their own invested amount, that is,
IB and
IV respectively. On the contrary, in the centralized scenario, the optimal invested amounts are found by maximizing the
NPV of the whole supply chain. Due to the financial cooperation, the buyer can finance the investment of the weaker partner by direct investments: that is, the buyer acquires efficient technologies and equipment, remaining their owner, and/or finances energy audit and consequent processes’ re-organization to improve the vendor energy performance. What motivates the buyer to invest in the vendor’s production plant is the increase of the overall efficiency, which means the reduction of the vendor production costs, also transferable into a reduction of the product selling prices to the buyer itself. Investment decisions identify a profitable energy efficiency investment when the discounted sum of savings,
S, is greater than the total investment cost,
I. In this case, the
NPV provides an estimate of the net financial benefit obtained by the organization if this investment is undertaken [
28]. A positive
NPV value infers that the investment is profitable for the firm and the higher the value, the more profitable the investment.
Notations:
Ak—Annual amount of the loan payment for actor k [€]
α—fixed component of the production cost for the vendor [€/unit]
β—fixed component of the production cost for the buyer [€/unit]
ck0—initial unit cost, without investment, for actor k [€/unit]
ck—unit cost for actor k [€/unit]
cen,k—energy cost for actor k [€/kWh]
D—annual demand rate [unit/year]
EEIk0—initial energy efficiency index of actor k [%]
EEIk—actual energy efficiency index of actor k after investment decision [%]
γk—coefficient defining the investment effect of actor k
k—subscript that identifies the actor, k = {v, b} for the vendor and the buyer respectively
ik—capital cost for actor k [year−1]
Ik—amount of the investment made to improve the energy efficiency index of actor k [€] (decision variable)
mv—mark-up of the vendor [%]
ρ—discount rate [%]
SECref,k—reference specific energy consumption for actor k [kWh/unit]
Ω—share of the vendor’s investment benefits transferred to the buyer [%].
Assumptions:
Demand at the buyer’s side is constant.
The buyer has a better financial position in terms of liquidity and solvency than the vendor; thus, he has access to capital at a lower interest rate: ib < iv.
The unit production costs for the vendor is given by a variable component which is a function of the energy consumption and a fixed one (
α and
β, for the vendor and the buyer respectively), which represents a cost relevant for the production but which is not influenced by the energy efficiency improvement as so it is not differential for this study. The buyer’s production cost is composed by an additional component, which defines the purchasing price from the vendor.
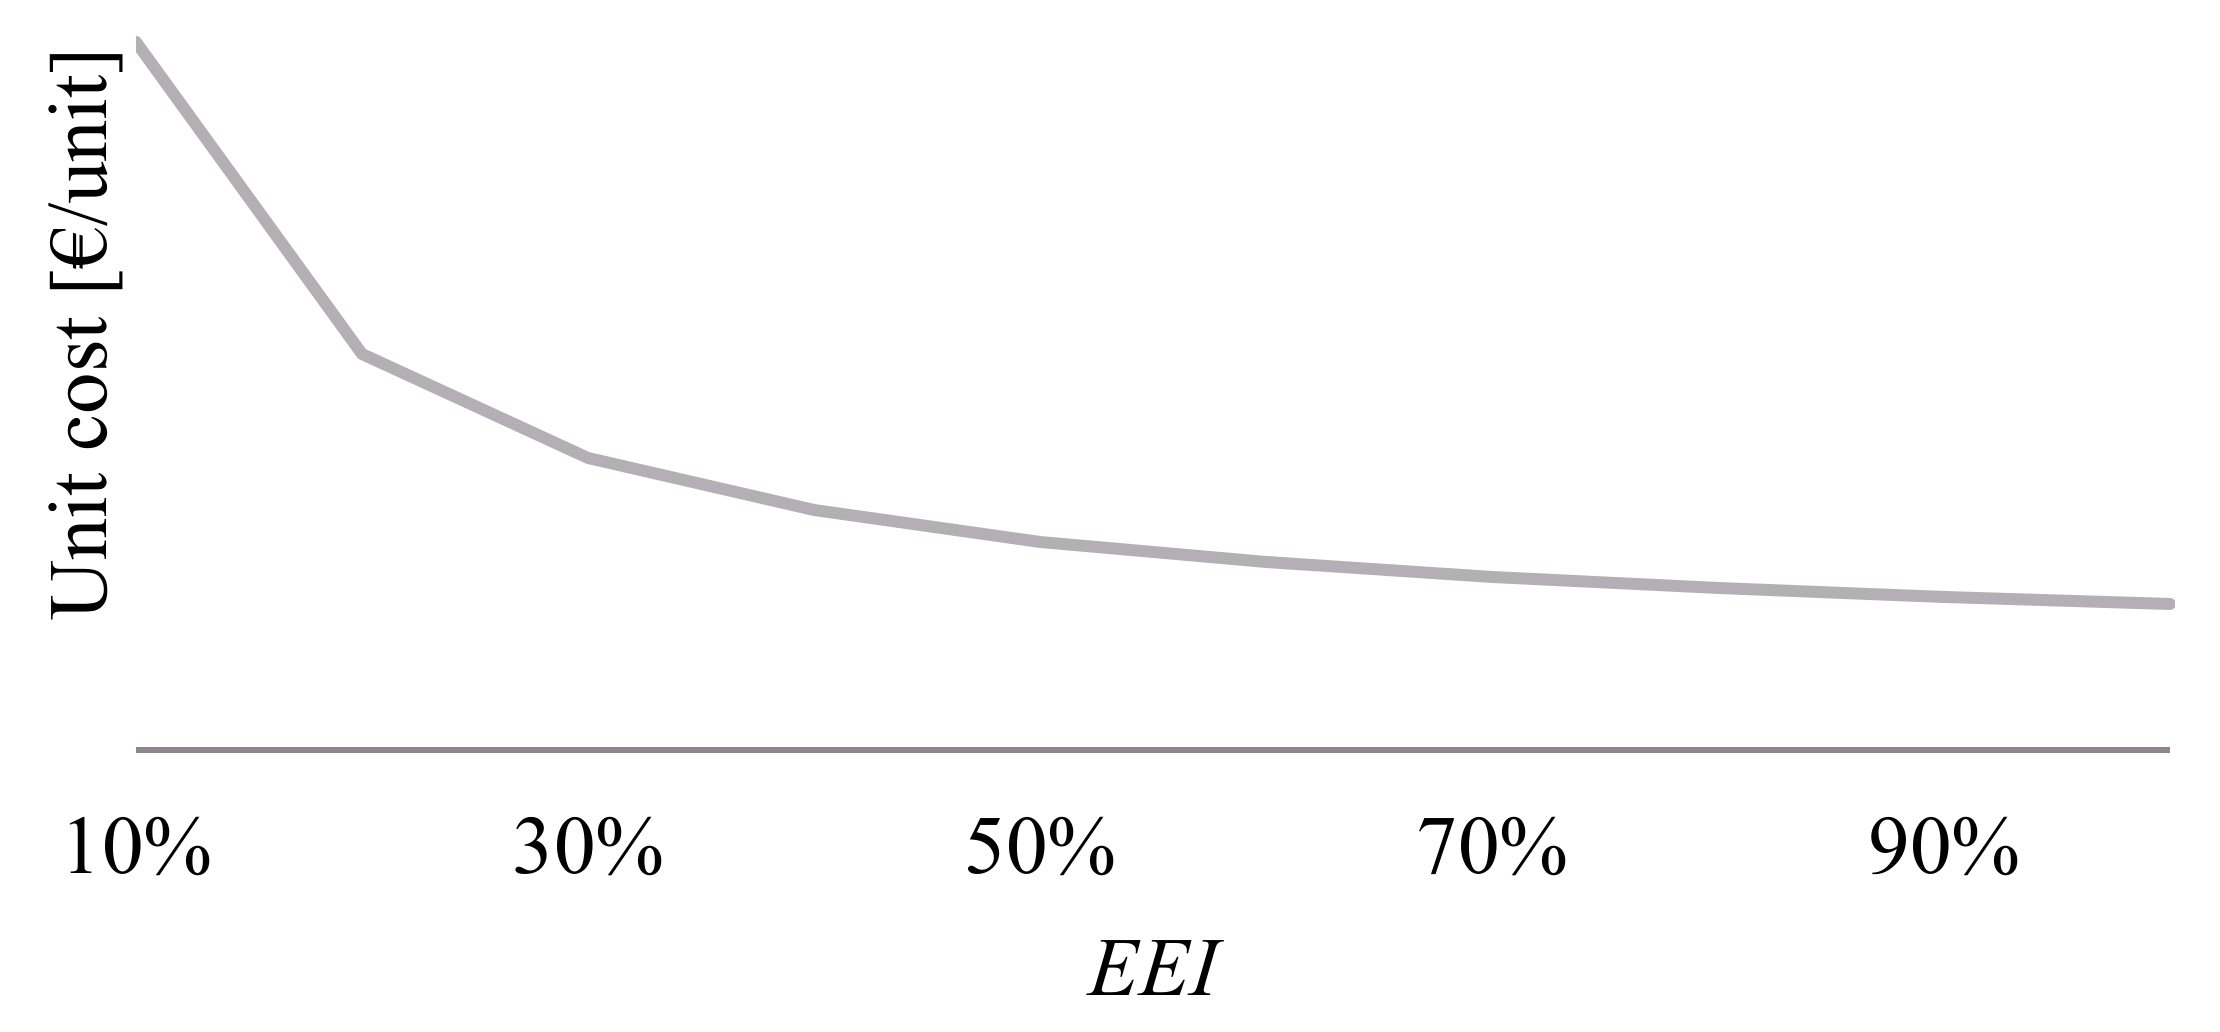
The energy efficiency indexes are assumed to affect the unit production costs as follows [
1]:
The relationship between the investment and the index of energy performance (
EEI) is described by a logarithmic function. The formulation for the generic actor
k is:
The logarithmic form can be derived from the abatement cost curves, which are technology related [
29,
30]. For instance,
Figure 3 presents a general relationship between
EEI and the unit cost.
2.1. Decentralized Decisions with Individual Investments (D)
In the decentralized scenario, each player optimizes independently its own
NPV. The savings for both the actors are given by the reduction of the energy-related component of the production cost and, thus, by the increase of the energy efficiency index determined by the investments.
Hence, the optimal function for actor k, which should be separately maximized, is given by:
where
S represents the savings in the period,
Ab and
Av are the annual amounts of loan payment for the buyer and the vendor respectively (
,
with
pva(n,i) as the present value annuity factor considering
n periods of time and an interest rate of
i), while the subscript
j identifies the period considered and it varies from 1 to
n, which is the lifetime of the investment. Studying the objective functions, it can be easily shown that the
NPV of the vendor and the one of the buyer, given in Equation (6), are concave in the invested amount (
Iv and
Ib). The analyses of the concavity of the
NPVs are presented in
Appendix A. However, the optimal solution of the invested amounts is quite complex to reach analytically. Thus, the following algorithm was implemented to obtain the optimal solutions and the optimal values of the decision variables:
Step 1—Set Ik = 1 and NPVk (Ik − 1) = 0.
Step 2—Calculate NPVk (Ik) trough Equation (6).
Step 3—If NPVk (Ik) > NPVk (Ik − 1), then set Ik = Ik + 1 and go to Step 2, otherwise Ik − 1 is the optimal solution.
2.2. Centralized Decisions with Integrated Investments (C)
In the centralized scenario, the optimal investments are found by maximizing the NPV of the supply chain. Due to the cooperation, the interest rates for both the actors are given by the lower capital cost, that is, min {
iv,
ib}. Note that the investment of the vendor has effects on his own performance reducing the production costs; however, at the same time, these effects are in part transferred to the buyer since it should face a lower purchasing price as a mean for sharing the benefit obtained. The
NPVs, in this scenario, are given by:
The objective function of the centralized scenario is given by the maximization of the supply chain net present value which is defined as follows:
where
.
As it is shown in
Appendix A, Equation (9) is concave with respect to
Ib and
Iv. However, also in this scenario the optimal solution of the invested amounts is quite complex to be analytically obtained. Thus, it is necessary to implement the following algorithm:
Step 1—Set Iv = 0 and Ib = 0.
Step 2—Calculate NPVs (Iv, Ib) through Equation (9).
Step 3—Find the optimal value of NPVs (Iv, Ib) by increasing the invested amount Iv with a unitary increment. Until NPVs (Iv, Ib) < NPVs (Iv + 1, Ib), set IV = Iv + 1 and go to Step 2, otherwise Iv is the optimal solution.
Step 4—Repeat Step 3 for different increased values of Ib, with a unitary step and register the value of the decisions variables corresponding to the maximum NPVs (Iv*, Ib*).
3. Numerical Study
In this section, a numerical example is presented. It is based on a specific sector, that is, automotive sector, in which the vendor is represented by a die casting firm while the buyer is an automotive assembly company. The aim of the present example is to analyse the performance of the models developed in
Section 2 and to compare the behaviour of the actors of the supply chain in the investment decisions under the different decision-making processes. In particular, we consider the base case of a vendor-buyer system with the following parameters:
D = 15,000 unit/year,
α = 15 €/unit,
β = 5 €/unit,
n= 5 years,
mv = 0.2,
iv = 0.25,
ib = 0.1,
cen,v = 0.2 €/kWh,
cen,b = 0.15 €/kWh,
SECref,v = 100 kWh/unit,
SECref,b = 250 kWh/unit,
EEIv0 = 50%,
EEIb0 = 90%,
γv = 0.065,
γb = 0.075,
ρ = 4% and
Ω = 0.7. The above data have been slightly adapted from an industrial case in the automotive sector where the vendor supplies die-casted and machined aluminium components to the buyer that assembles the final vehicles. The die-casting process is inherently energy intensive and material and energy costs are the main drivers of manufacturing costs [
31]: for instance, roughly 25% of the cost of die-cast products can be traced to some form of energy consumption [
32]. Conversely in assembly plants, energy expenditures are a relatively small cost factor in the total production process [
33]. However, even at this stage, energy efficiency improvements can provide a significant means to reduce costs without negatively affecting the yield or the quality of the product. Moreover, the buyer is represented by a multinational corporation while the vendor is a local supplier and for that reason, the buyer presents the strongest contractual power and the best financial position among the members of the supply chain.
Table 1 shows the results of the numerical example for the two scenarios considered.
Table 1 reveals the positive economic impact defined by the
NPVs in both the scenarios, resulting from the opportunity to invest in energy efficiency, as it leads to significant energy savings for the actors and for the supply chain. Specifically, the investments in the decentralized scenario leads to a reduction of 197 k€ (−23.9%) for the vendor and 8.5 k€ (−0.5%) for the buyer in the annual energy cost with respect to the base case where no investments are considered. Whereas in the centralized scenario, the reduction is of 229 k€ (−27.7 %) and 8.5 k€ (−0.5 %), respectively. Moreover, switching from decentralized scenario to the centralized scenario, the buyer incurs in a higher overall investment (276 k€ compared to 29 k€) in the supply chain’s energy efficiency to support the improvement of the performance of the weakest actor (
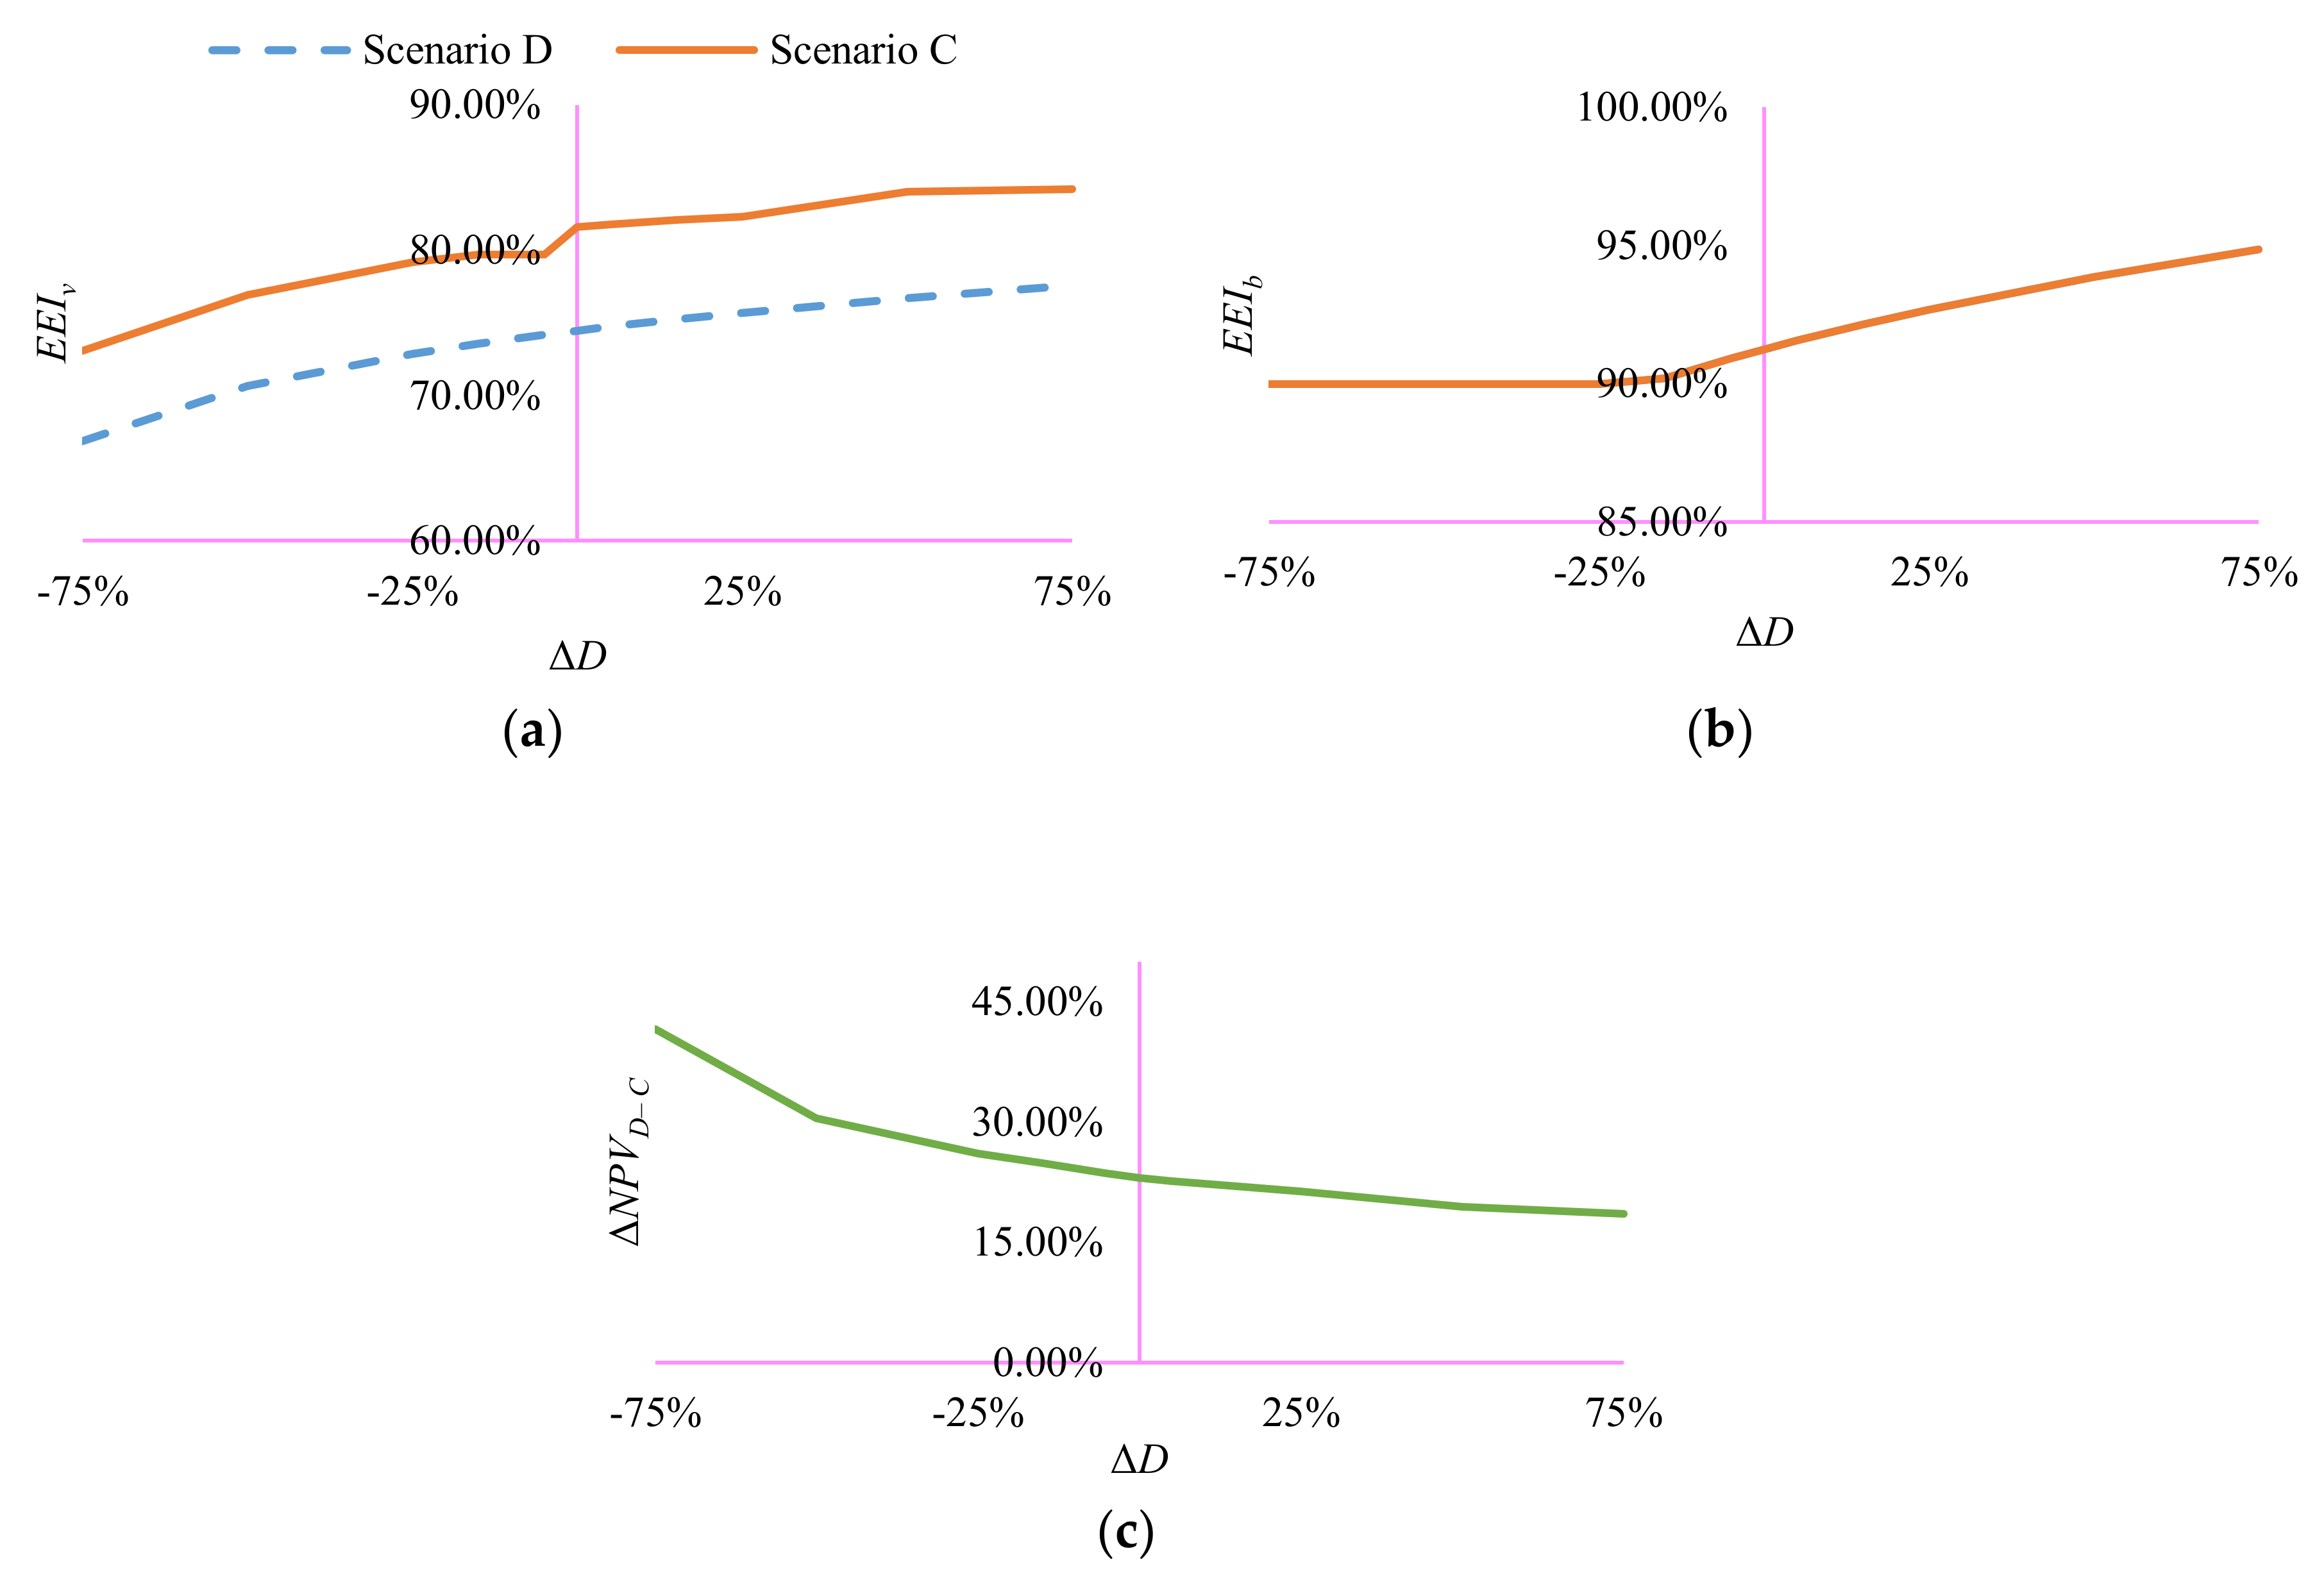
). The investment is greater on the energy efficiency index of the firm characterized by the lower energy efficiency performance, because of the diminishing marginal return of the investment. Globally, the centralized investment decision leads to a relevant increase in the energy efficiency of the supply chain, leading in turn to higher energy savings. To appreciate the general behaviour of the model, some sensitivity analyses have been performed. Different companies and different years presents huge differences in the final demand and, in addition, energy efficiency measures are mainly long-run investments that interest a wide period of time in which the customers demand is not always constant. Thus, firstly, the behaviour of the model for different demand rates has been analysed. As it is shown in
Figure 4a,b, a higher demand rate leads to a higher investment in the energy efficiency index of the vendor (higher
EEIv) and for the buyer (higher
EEIb) even if with different relative impacts. The behaviour of the two scenarios overlaps in the energy efficiency’s improvement of the buyer since its financial conditions does not change shifting from one scenario to the other and thus the optimal amount for the investment is the same.
Figure 4c shows that lower demand rates correspond to a higher convenience of the investments with a financial agreement in the centralized decision (Δ
NPVD–C, that is, the variation of the
NPV shifting from scenario D to scenario C).
Afterwards, a sensitivity analysis has been performed on the energy cost per kWh. Obviously, the higher the energy cost per kWh, the higher the focus on the energy efficiency issue (thus, higher investments). Variations of the energy cost per kWh show similar effects to the ones introduced with variations of the demand rate, as both contribute to an increase of the annual energy cost. Another relevant parameter in the model presented is the interest rate of the different actors, as their financial position highly influences the convenience of sharing the benefits introduced and of the centralization of the investment decisions. Consequently, an investigation of the results for different values of the interest rates is required. The only scenario that it is influenced by a variation of the interest rate of the vendor is scenario D, in which for higher
iv values, the investment of the vendor decreases and thus the benefits introduced with the financial agreement are higher (
Figure 5a). Then, if a variation of the buyer interest rate is considered, even scenario C is interested (
Figure 5b): higher
ib leads to lower overall investments performed by the buyer and thus the cooperation gives rise to lower advantages.
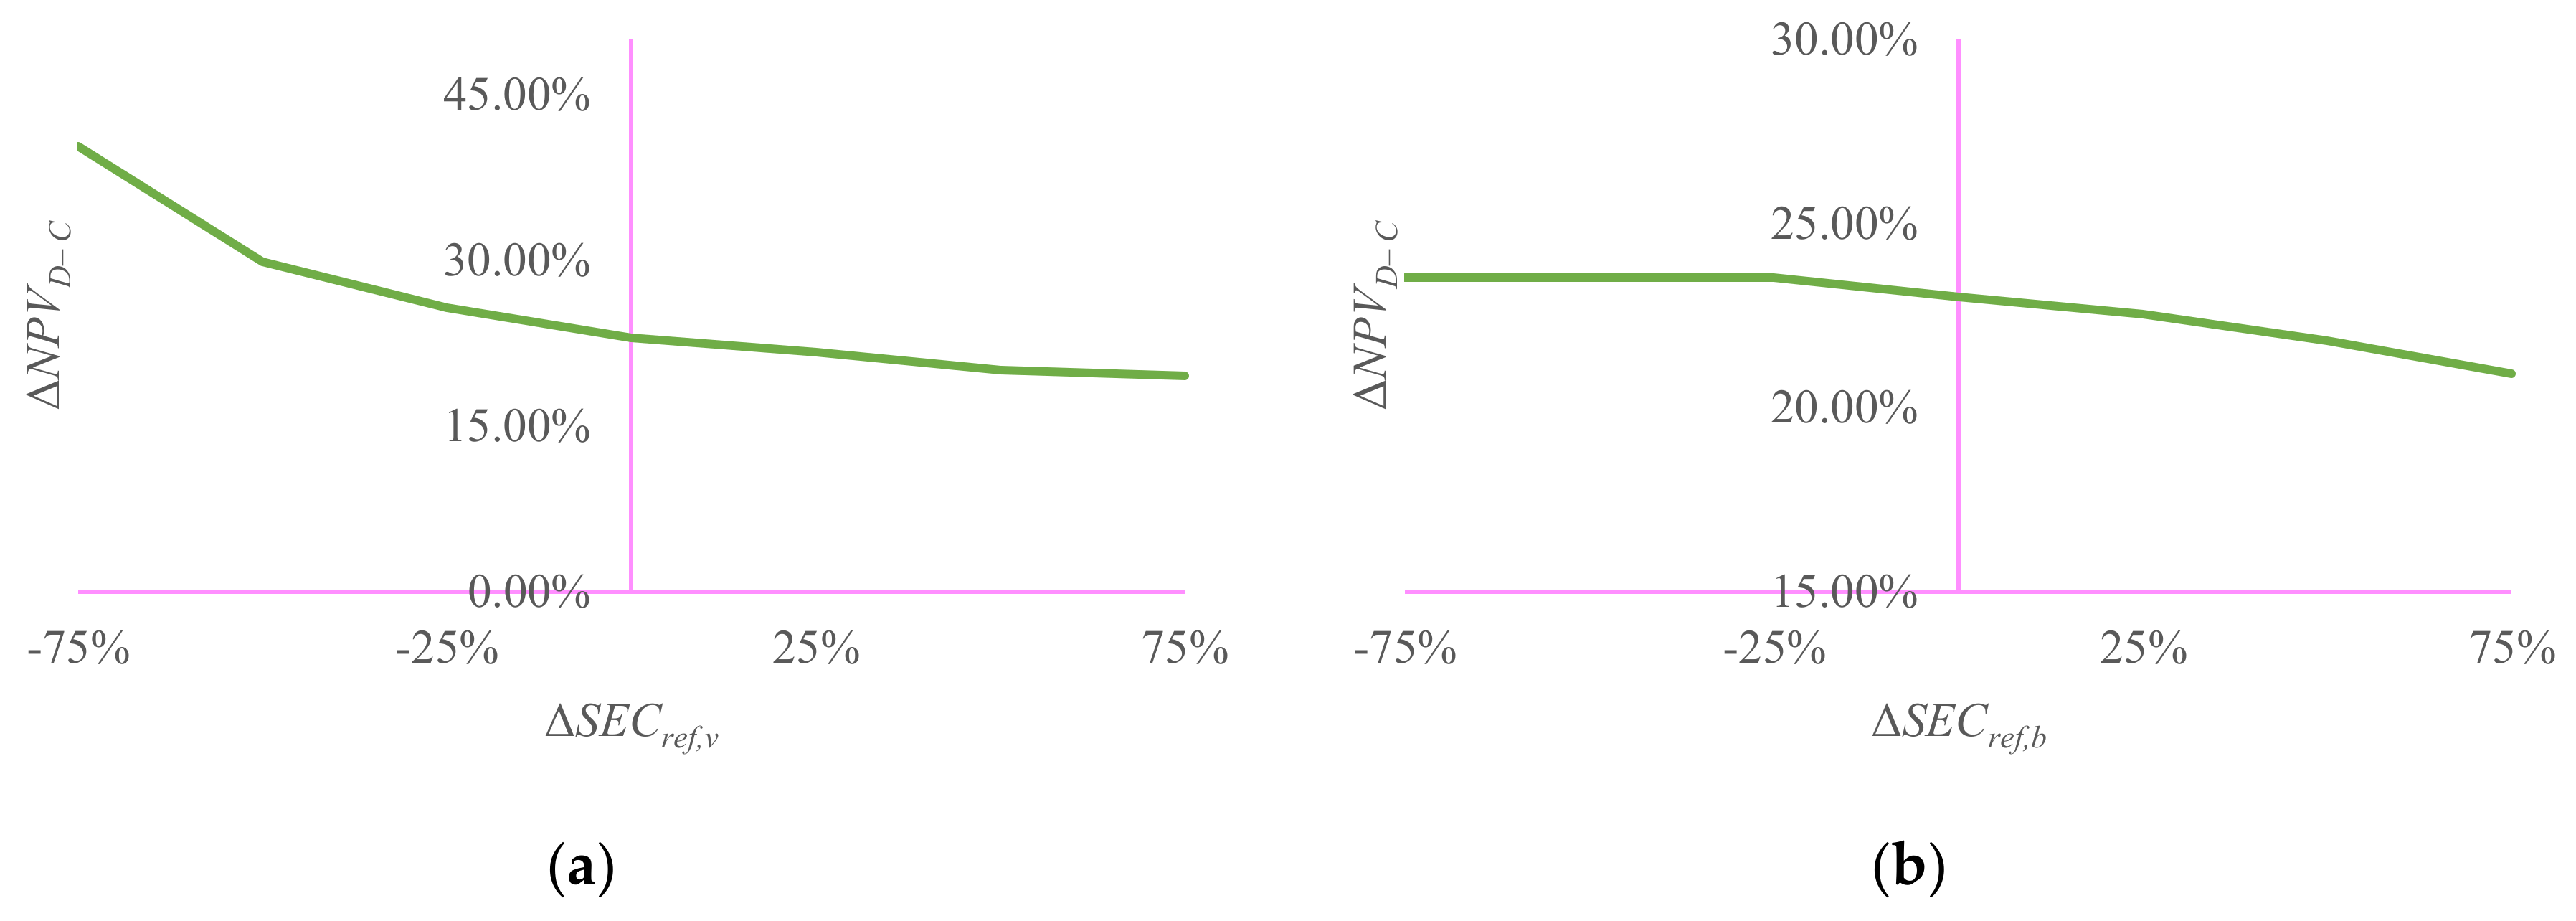
In addition, an analysis of the results for different reference values of the specific energy consumption were performed, since it is strictly dependent on the considered sample which includes a wide range of companies and technologies. For example, the specific energy consumption of the die-casting company is highly affected by the specific process, alloy, equipment and tools used. For that reason, the reference value could not identify exactly the considered case study. Hence, effects of variations of that parameter should be evaluated in order to analyse in a more general way the behaviour of the investment decisions. In addition, they can be subject to variation due to improvements in the processes. Positive variations in
SECref, which identify higher energy consumptions, lead to higher investment in the energy efficiency of both actors, independently of the scenarios. Moreover, higher
SECref values raise the relevance of the energy issue, leading to higher investments in scenario D, too; thus, the benefits introduced by financial agreement and centralization are lower (
Figure 6a,b).
The last analysis performed is on the parameter that defines the transfer of benefits from the vendor to the buyer
, to analyse the effects of the benefit sharing. Since this coefficient has effects only on the way the savings are shared between the actors, it does not influence the supply chain results. However, it has relevant effects on the single
NPVs of the two actors and, consequently, on the incentive they have for the cooperation. For higher values of
, as can be imagined, the buyer is encouraged to invest on the weaker partner, since the vendor holds lower benefits and transfers a larger share of them in reducing the price for the buyer (
Figure 7). From
Figure 7, it is also possible to observe that the range in which the centralization is convenient for both the actors is limited (about 15–25%). The results are strictly dependent on the parameters of the numerical example and, precisely, the value for
is determined by the contractual power of the two actors.
4. Conclusions
This paper presents a supply chain model where the buyer, for different reasons (e.g., dimension, location, bank agreements etc.), has a budget available for investments and access to capital at a lower interest rate than the one of its vendor. For this reason, sharing financial resources and acting jointly on the capital market could lead to a higher investment in the energy efficiency of the firm with the worst performance, leading to a better result in the supply chain. The decision-support model proposed helps in evaluating the effects of financial collaboration between the members of the supply chain on the amount of the invested capital and on the overcoming of current energy efficiency barriers also for the weaker actor with the poorest energy efficiency performance. In this work, the optimal value of a decentralized scenario, in which two actors undergo individual investments, has been compared with a centralized scenario in which a joint investment decision with financial cooperation is considered: that is, the buyer can support initiatives in supplier development by direct investments in order to capitalize on its better financial position. The analyses performed show that for the company with the higher EEI and better financial position (buyer) is more convenient to invest on its partner (vendor) with lower energy efficiency performances, instead of investing only on itself. In this way, the energy performance of the entire supply chain is improved at the lowest cost. Investing in energy efficiency leads to great savings in energy cost and, switching from decentralized to centralized scenario, the energy related cost undergoes to a slight decrease, because of the additional improvement in the energy performance. This opportunity acquires greater significance when the vendor presents several energy efficiency barriers that reduce the feasibility of implementing the investments. The collaboration with other stronger supply chain’s partners allows to overcome or at least reduce those barriers. A relevant example is represented by the case in which a local vendor supplies products to a multinational buyer. The vendor due to the limited resources and awareness usually prefers to favour core processes over the improvement of energy performance. Hence, the multinational buyer, which presents lower financial constraints and greater consciousness towards the environmental and energetic topics, can support the weaker partner, leading to better supply chain results. A case study of that specific context is presented in the paper. In terms of future research, some assumptions in this paper could be relaxed, such as considering a variable mark-up of the vendor, uncertainty in the investment’s outcome, price-sensitive demand functions, allowing shortages and backorders under stochastic demand. It should be interesting also to enhance the model including the risk that the vendor induces to the buyer, for example, buyer’s extra costs due to energy inefficiency in the vendor’s process. Moreover, other interesting extensions may include: the simultaneous integration of financial and operational decisions, the adoption of different types of curves (e.g., stepwise increase), multi-echelon systems and specific investments (such as assets, both tangible and intangible, that have value only inside a specific relationship) as a mean to develop the partner of the supply chain without reinforcing those competitors which could be supplied by the same vendor.


