Smart Grid Architecture for Rural Distribution Networks: Application to a Spanish Pilot Network

 ,
,  ,
,  , and
, and
Abstract
:1. Introduction
2. Typical Rural Distribution Networks
2.1. General Features of Rural Distribution Networks
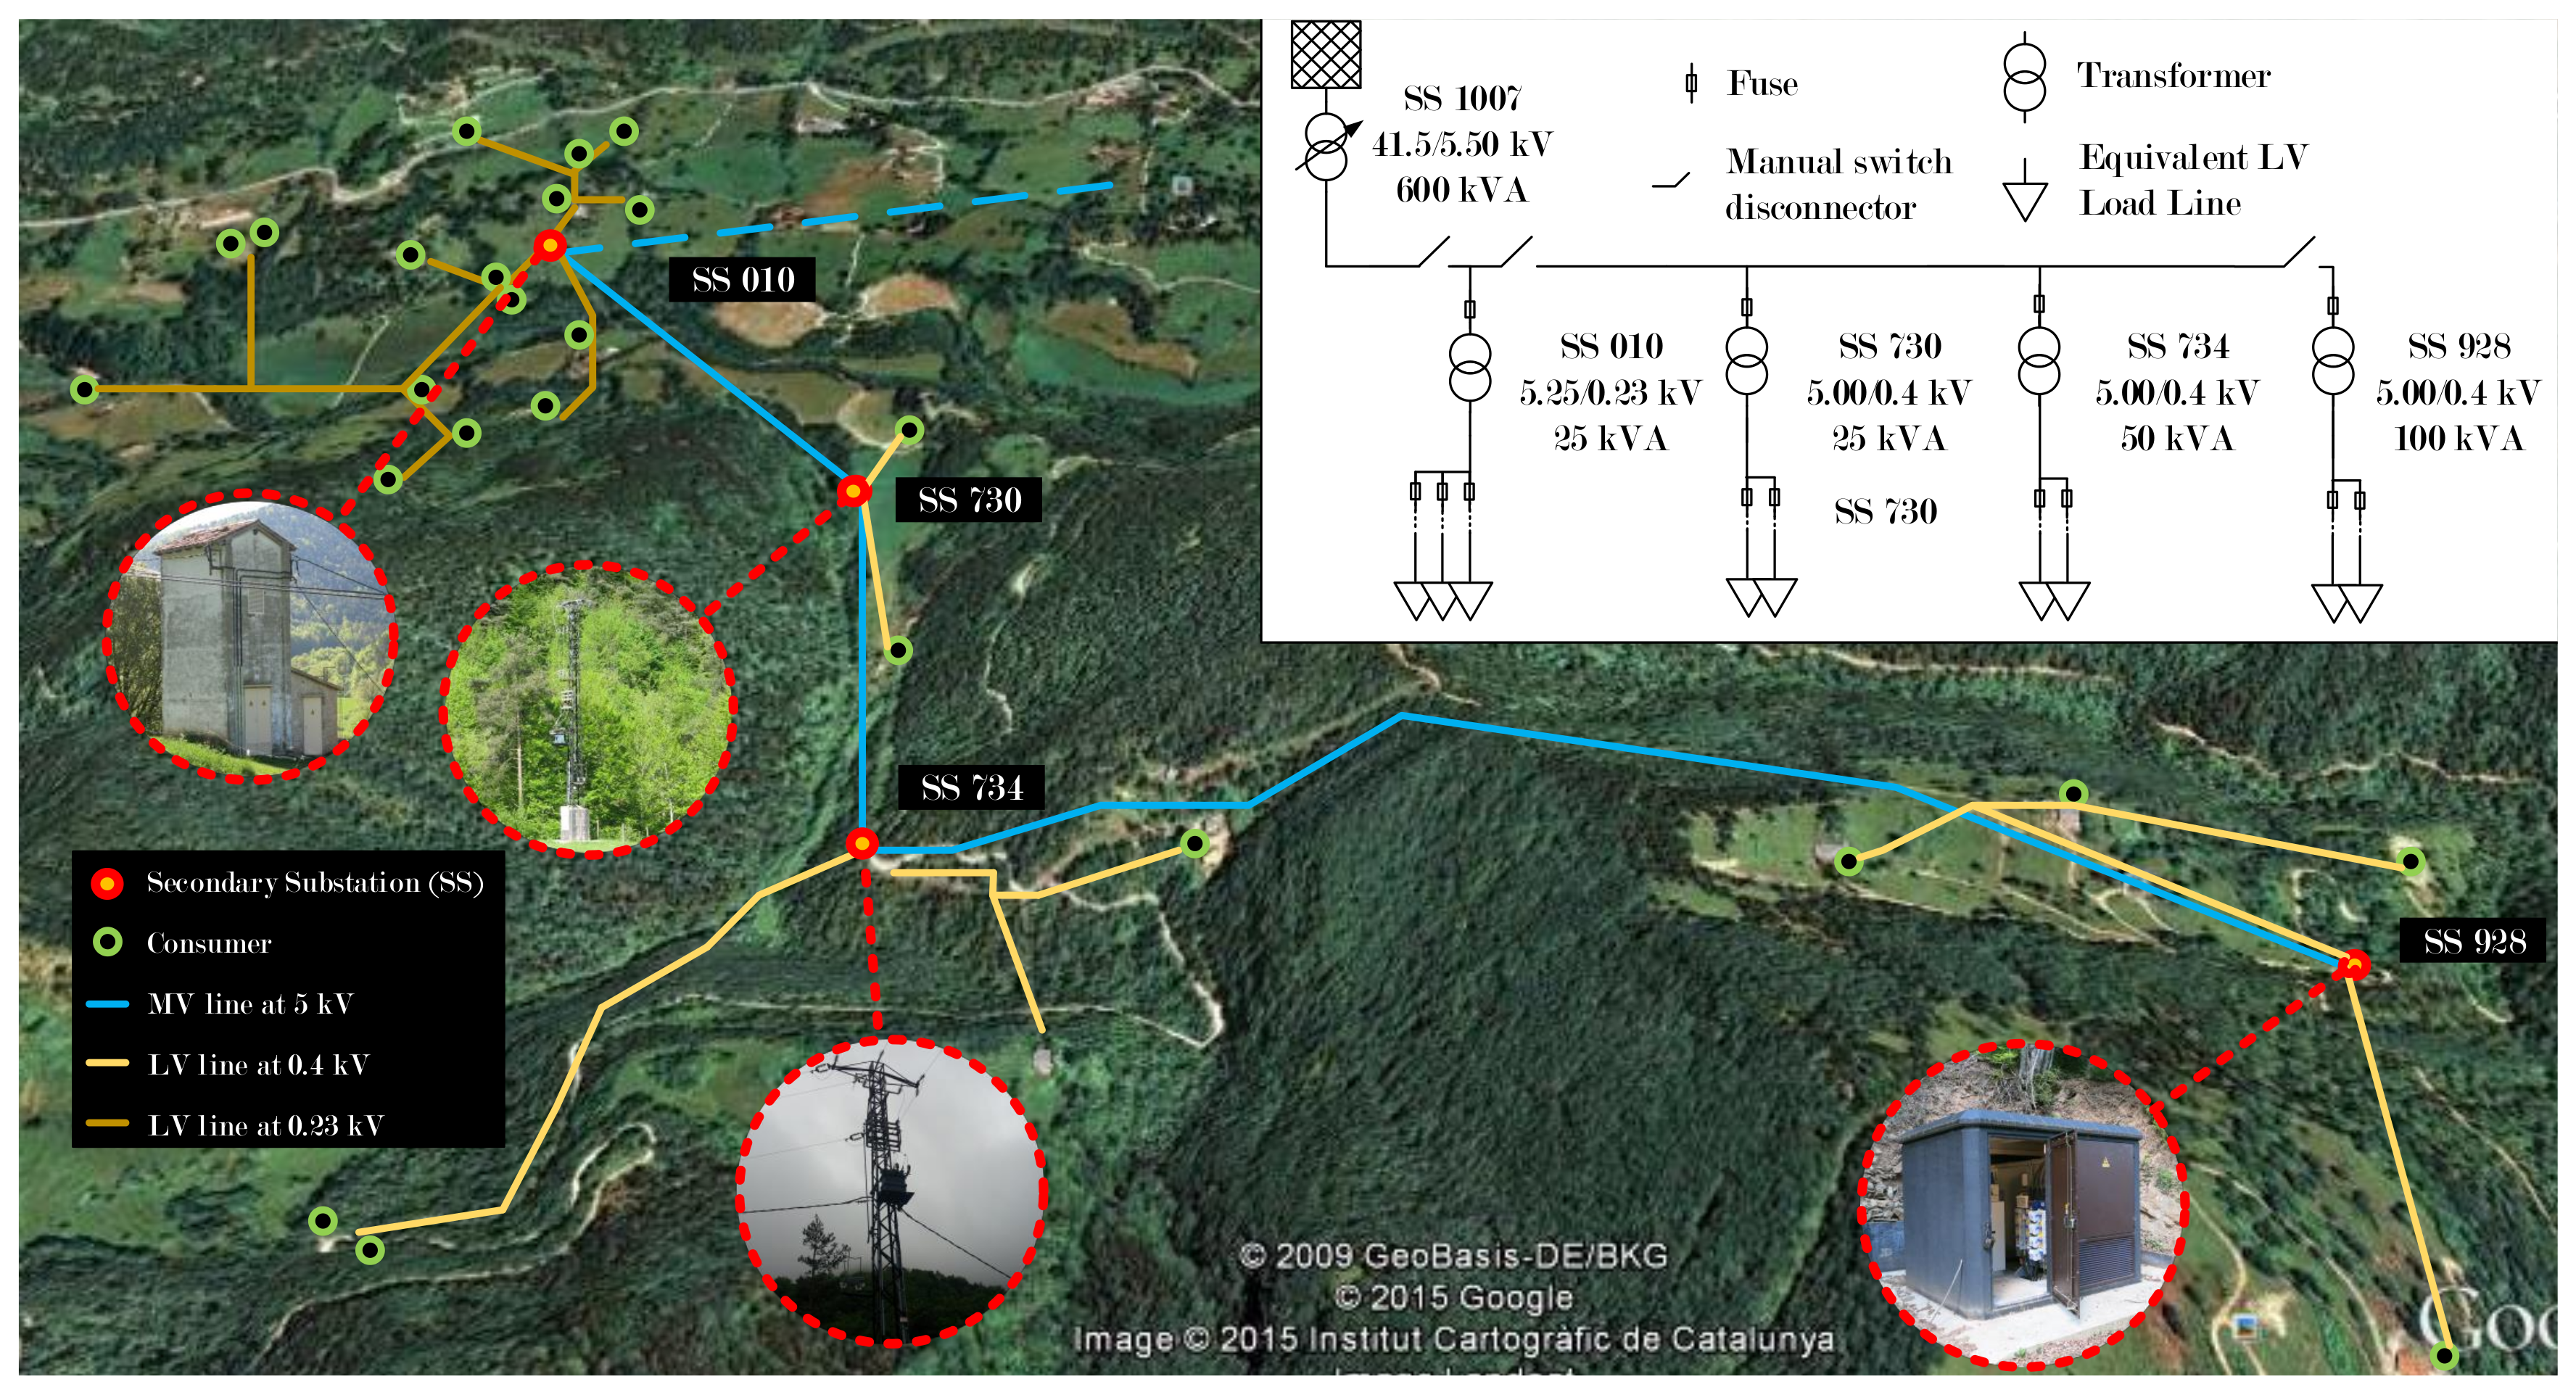
2.2. A Particular Pilot Network in a Rural Area
3. Electrical Actuations to Evolve the Rural Grid
3.1. Promotion of Distributed Generation
3.2. Inclusion of New Protection and Monitoring Devices
3.3. Back-Up Resources
3.4. New Telecommunications Network
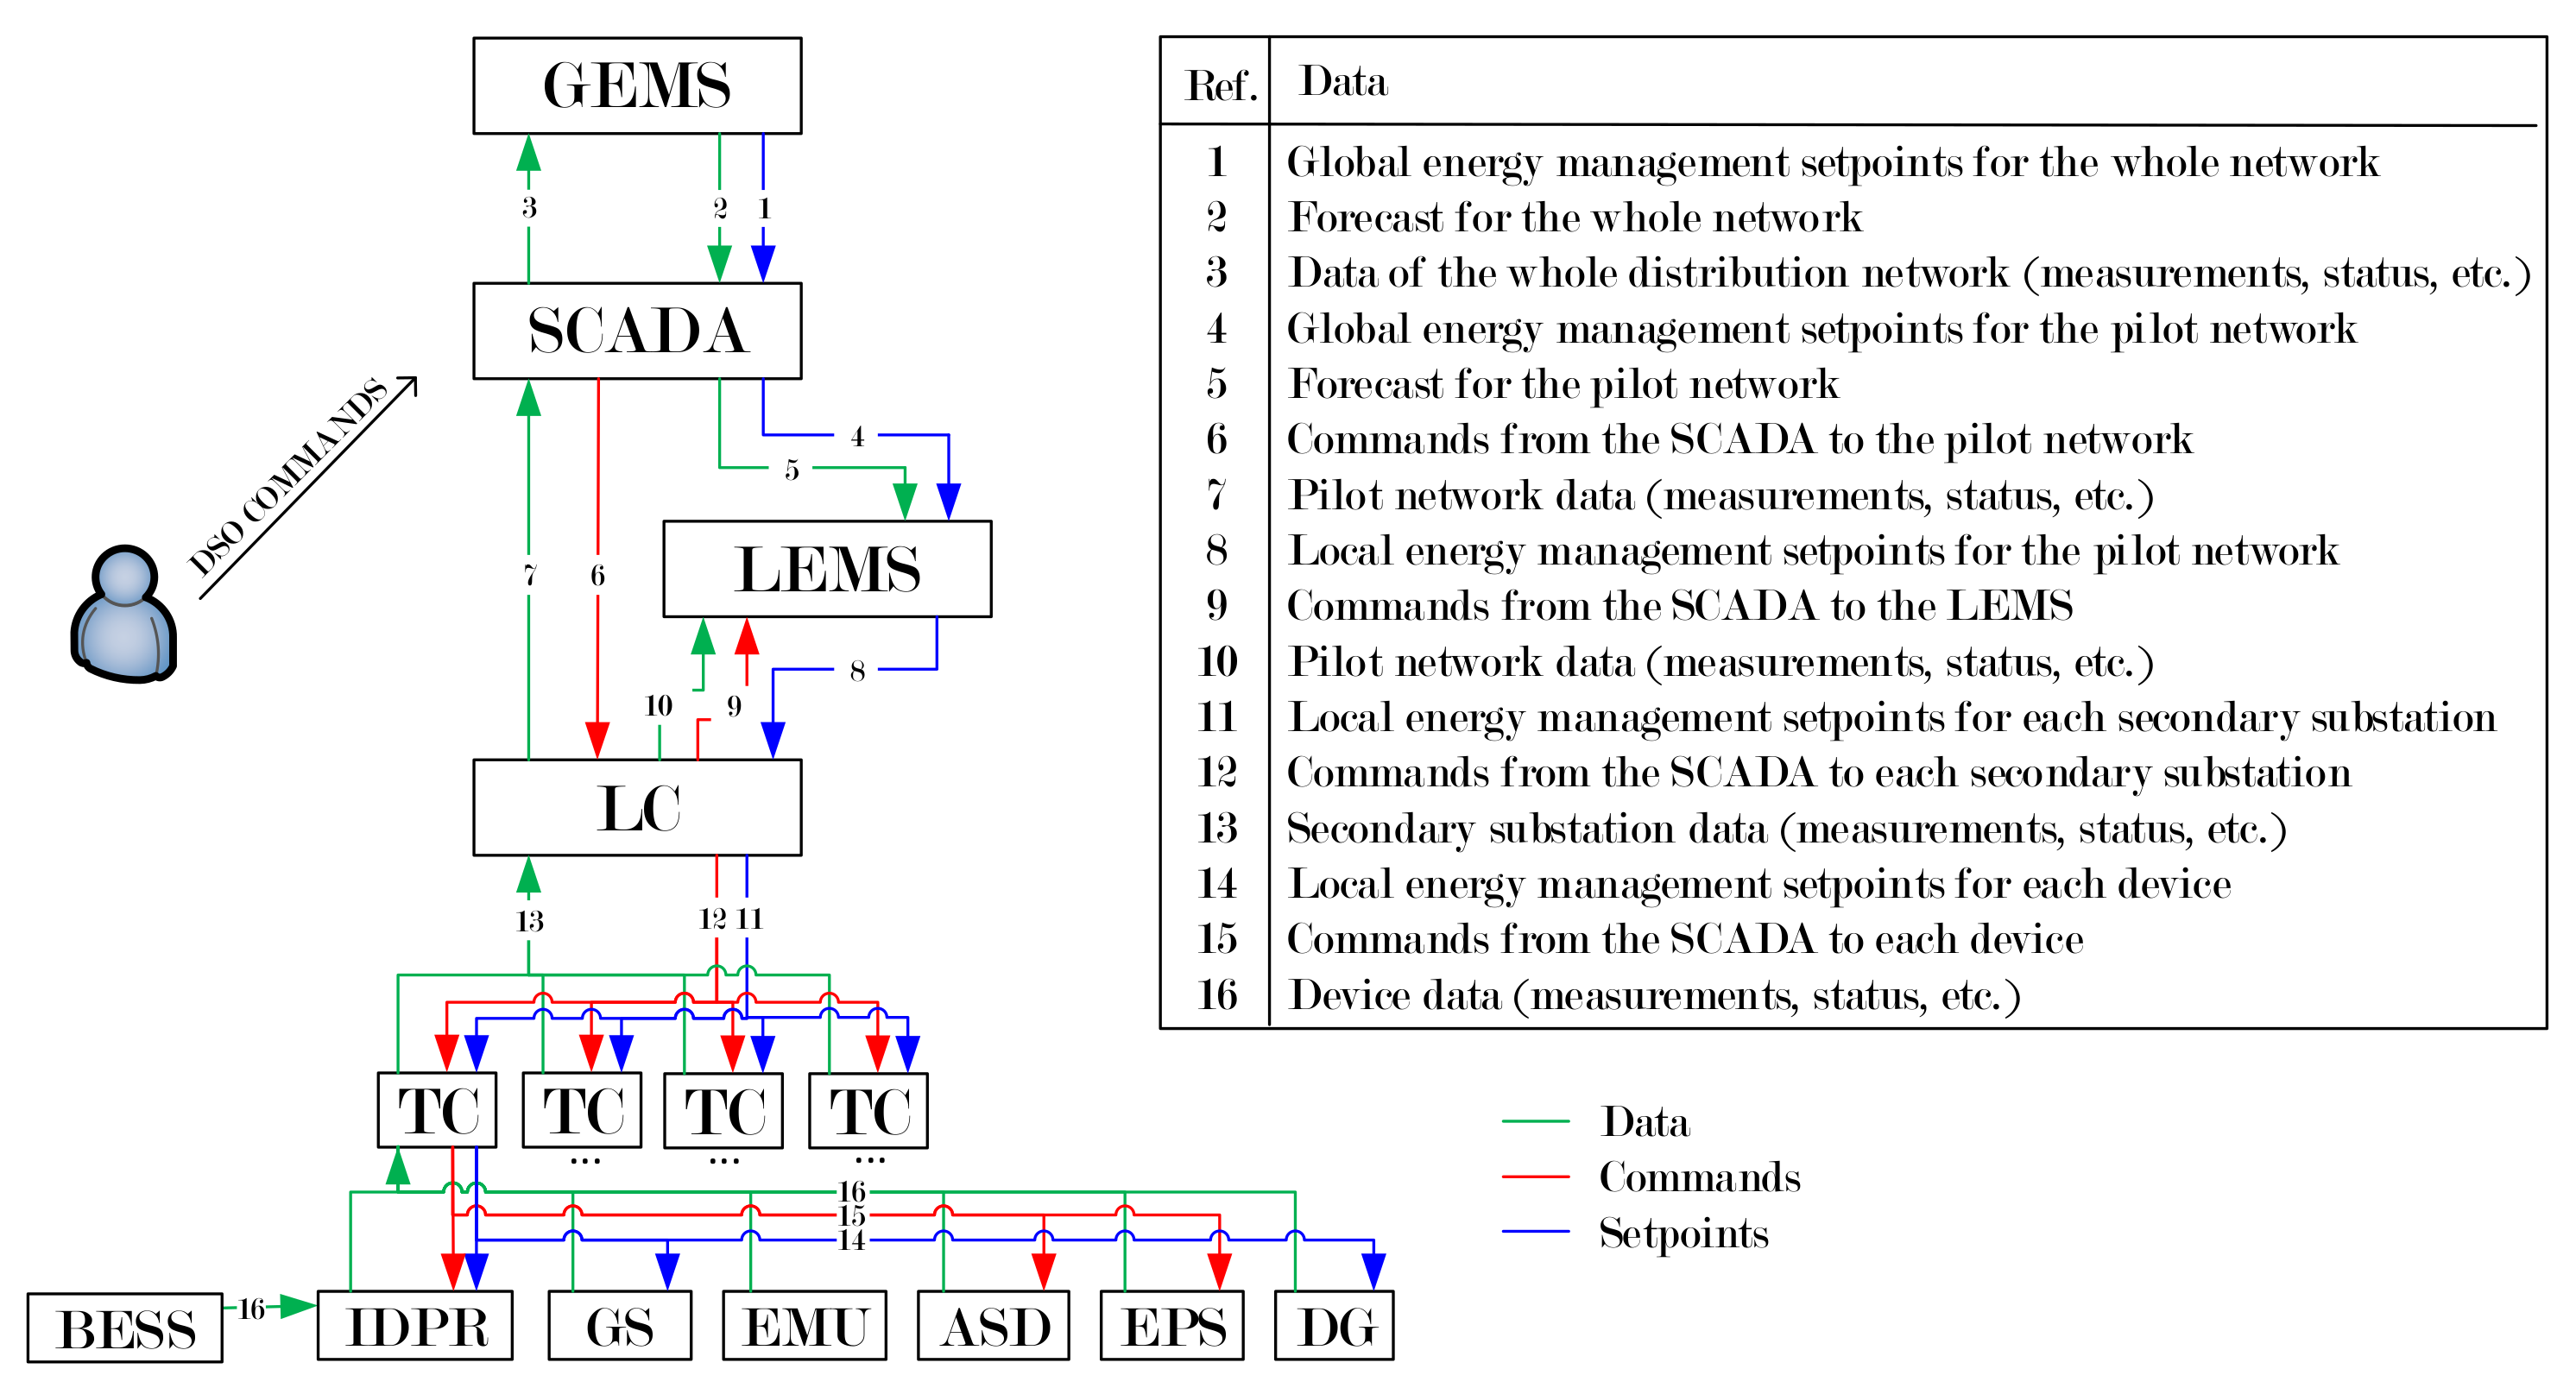
3.5. New Control and Management Agents
3.6. Overview of the Applications of the New Technologies
4. New Electrical Configurations and Operation Modes
4.1. Operational Circumstances for the Pilot Network
4.2. Particular Goals for Each of the Agents of the Pilot Network Architecture
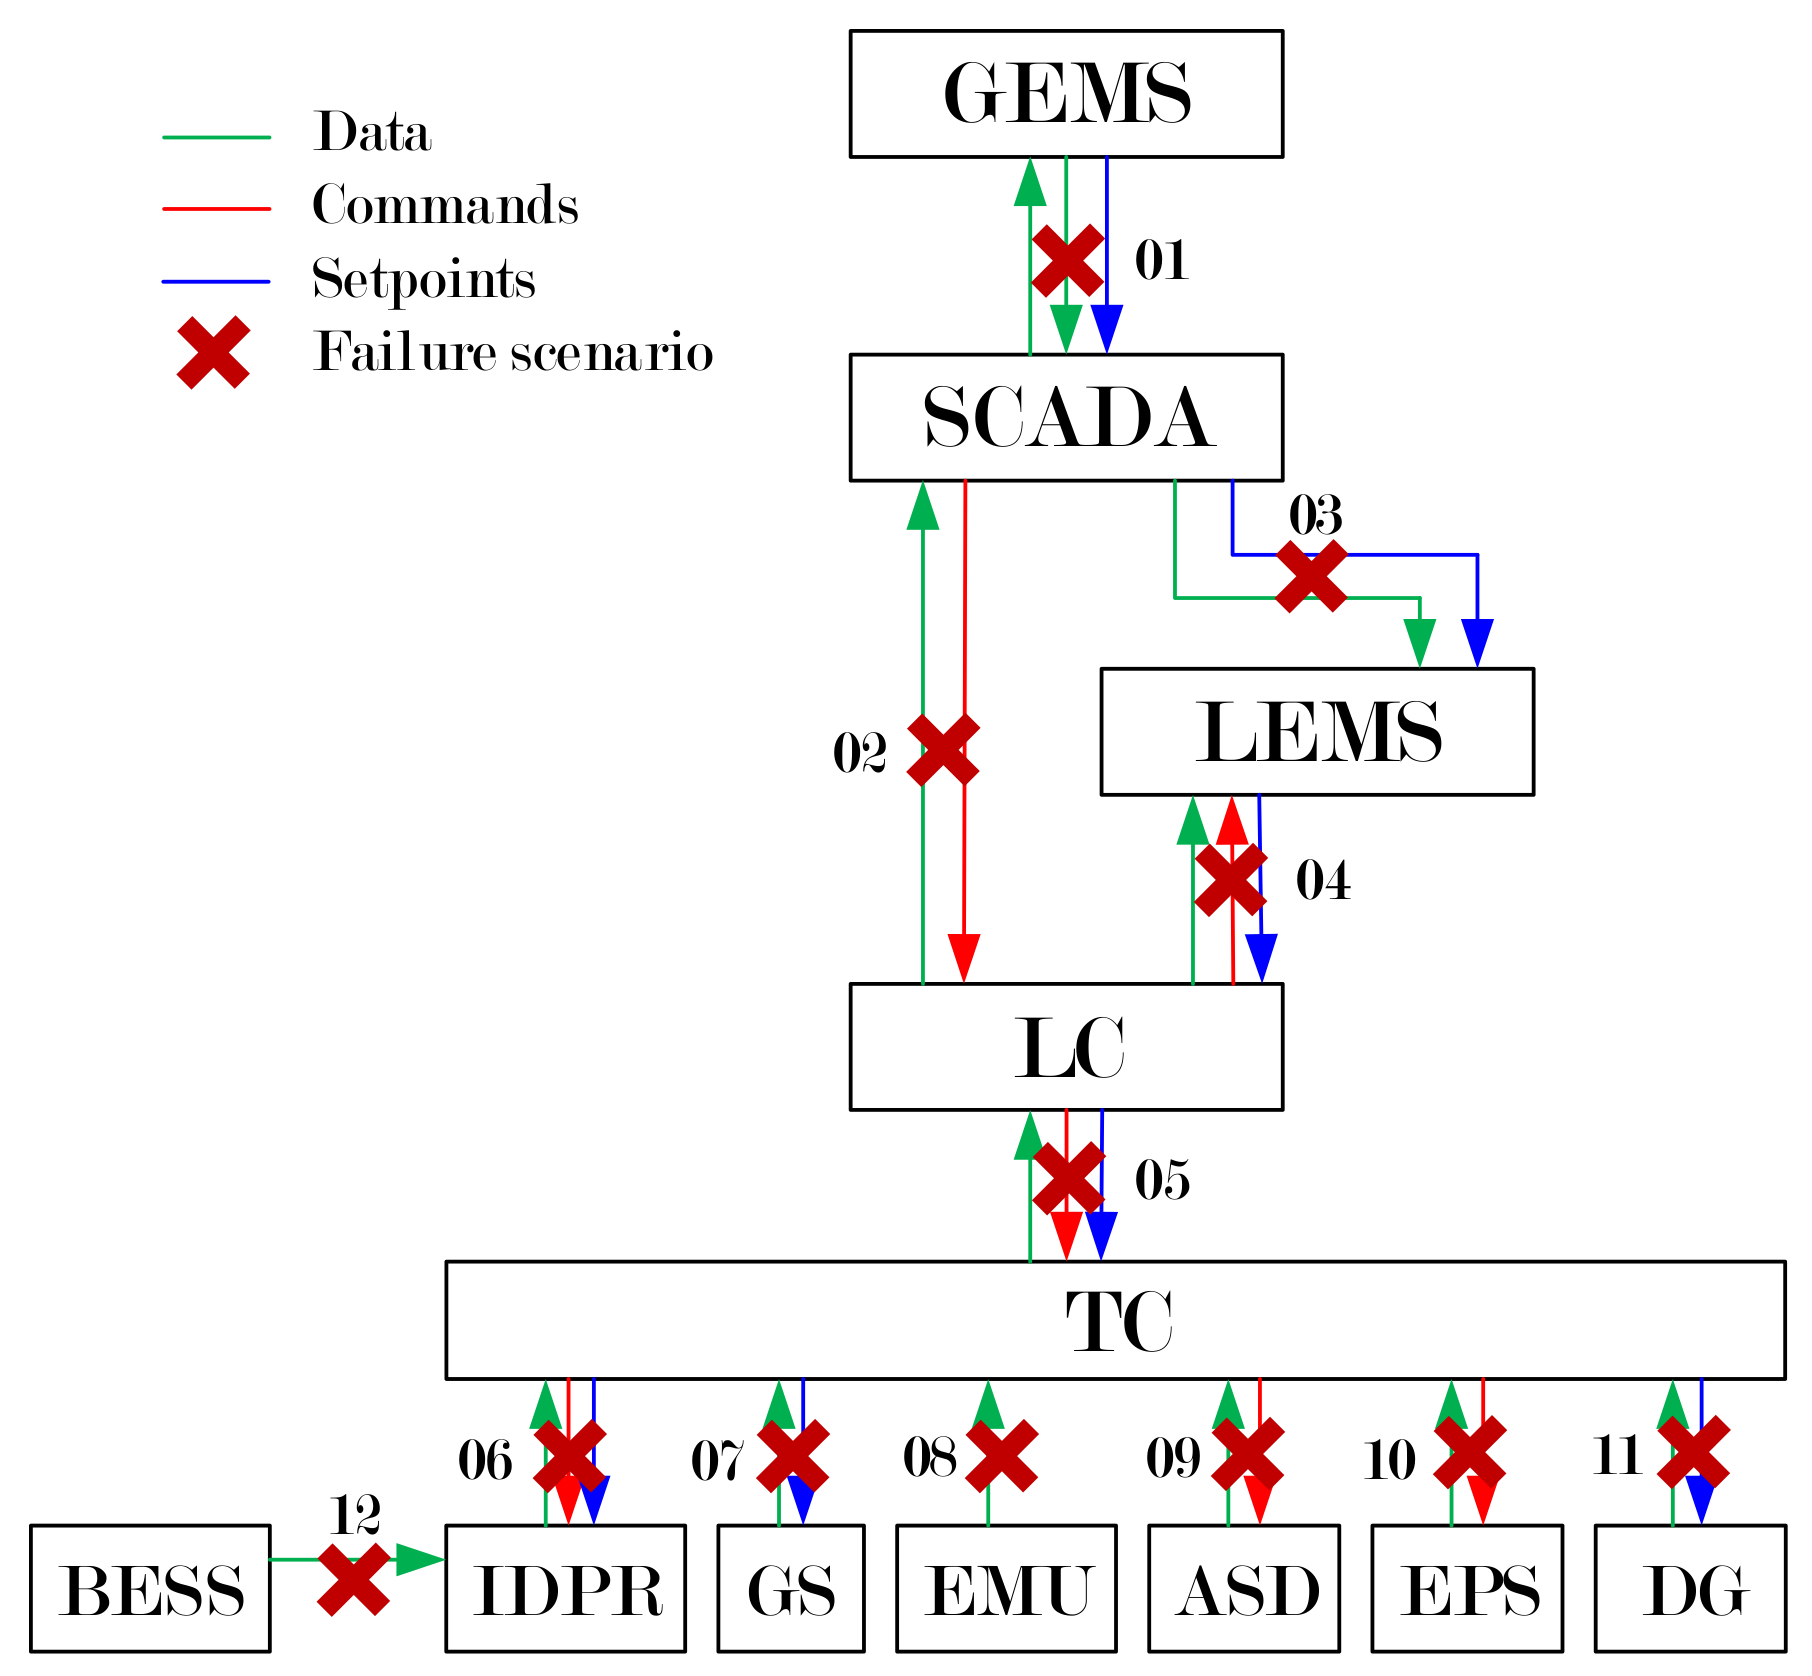
4.3. Analysis in Vulnerabilities on Communications and Related Management Plan
5. Study Case
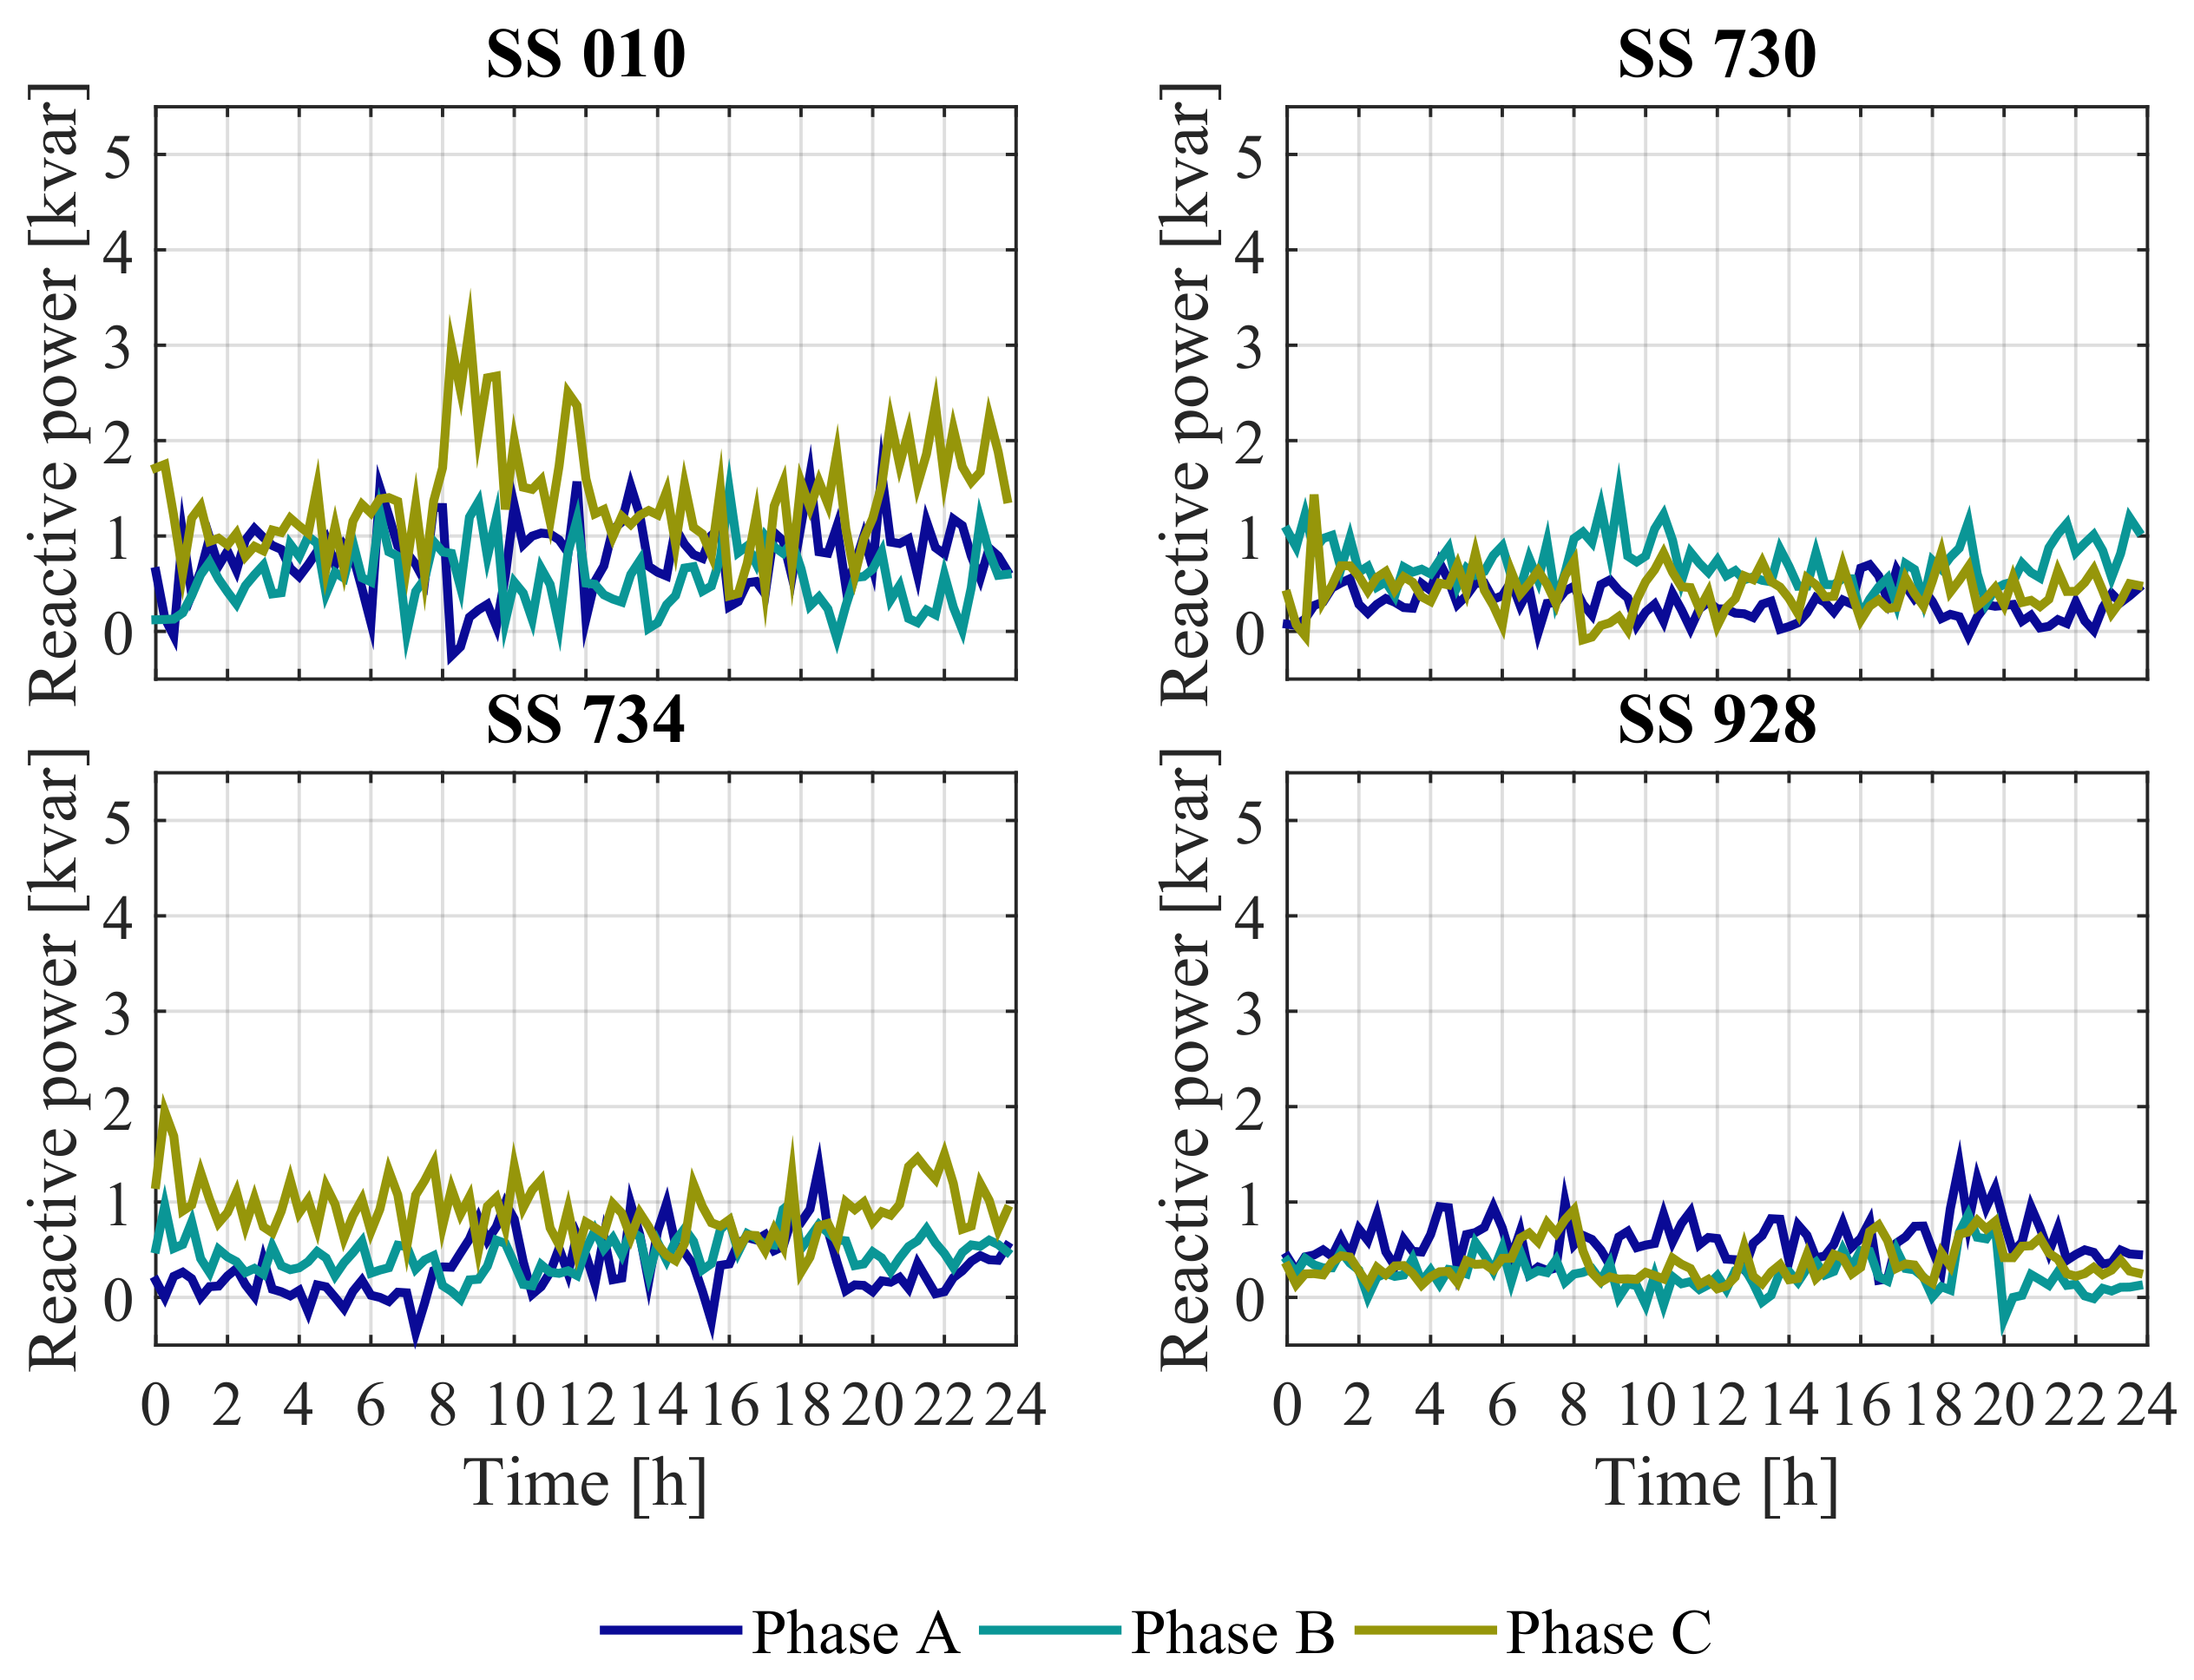
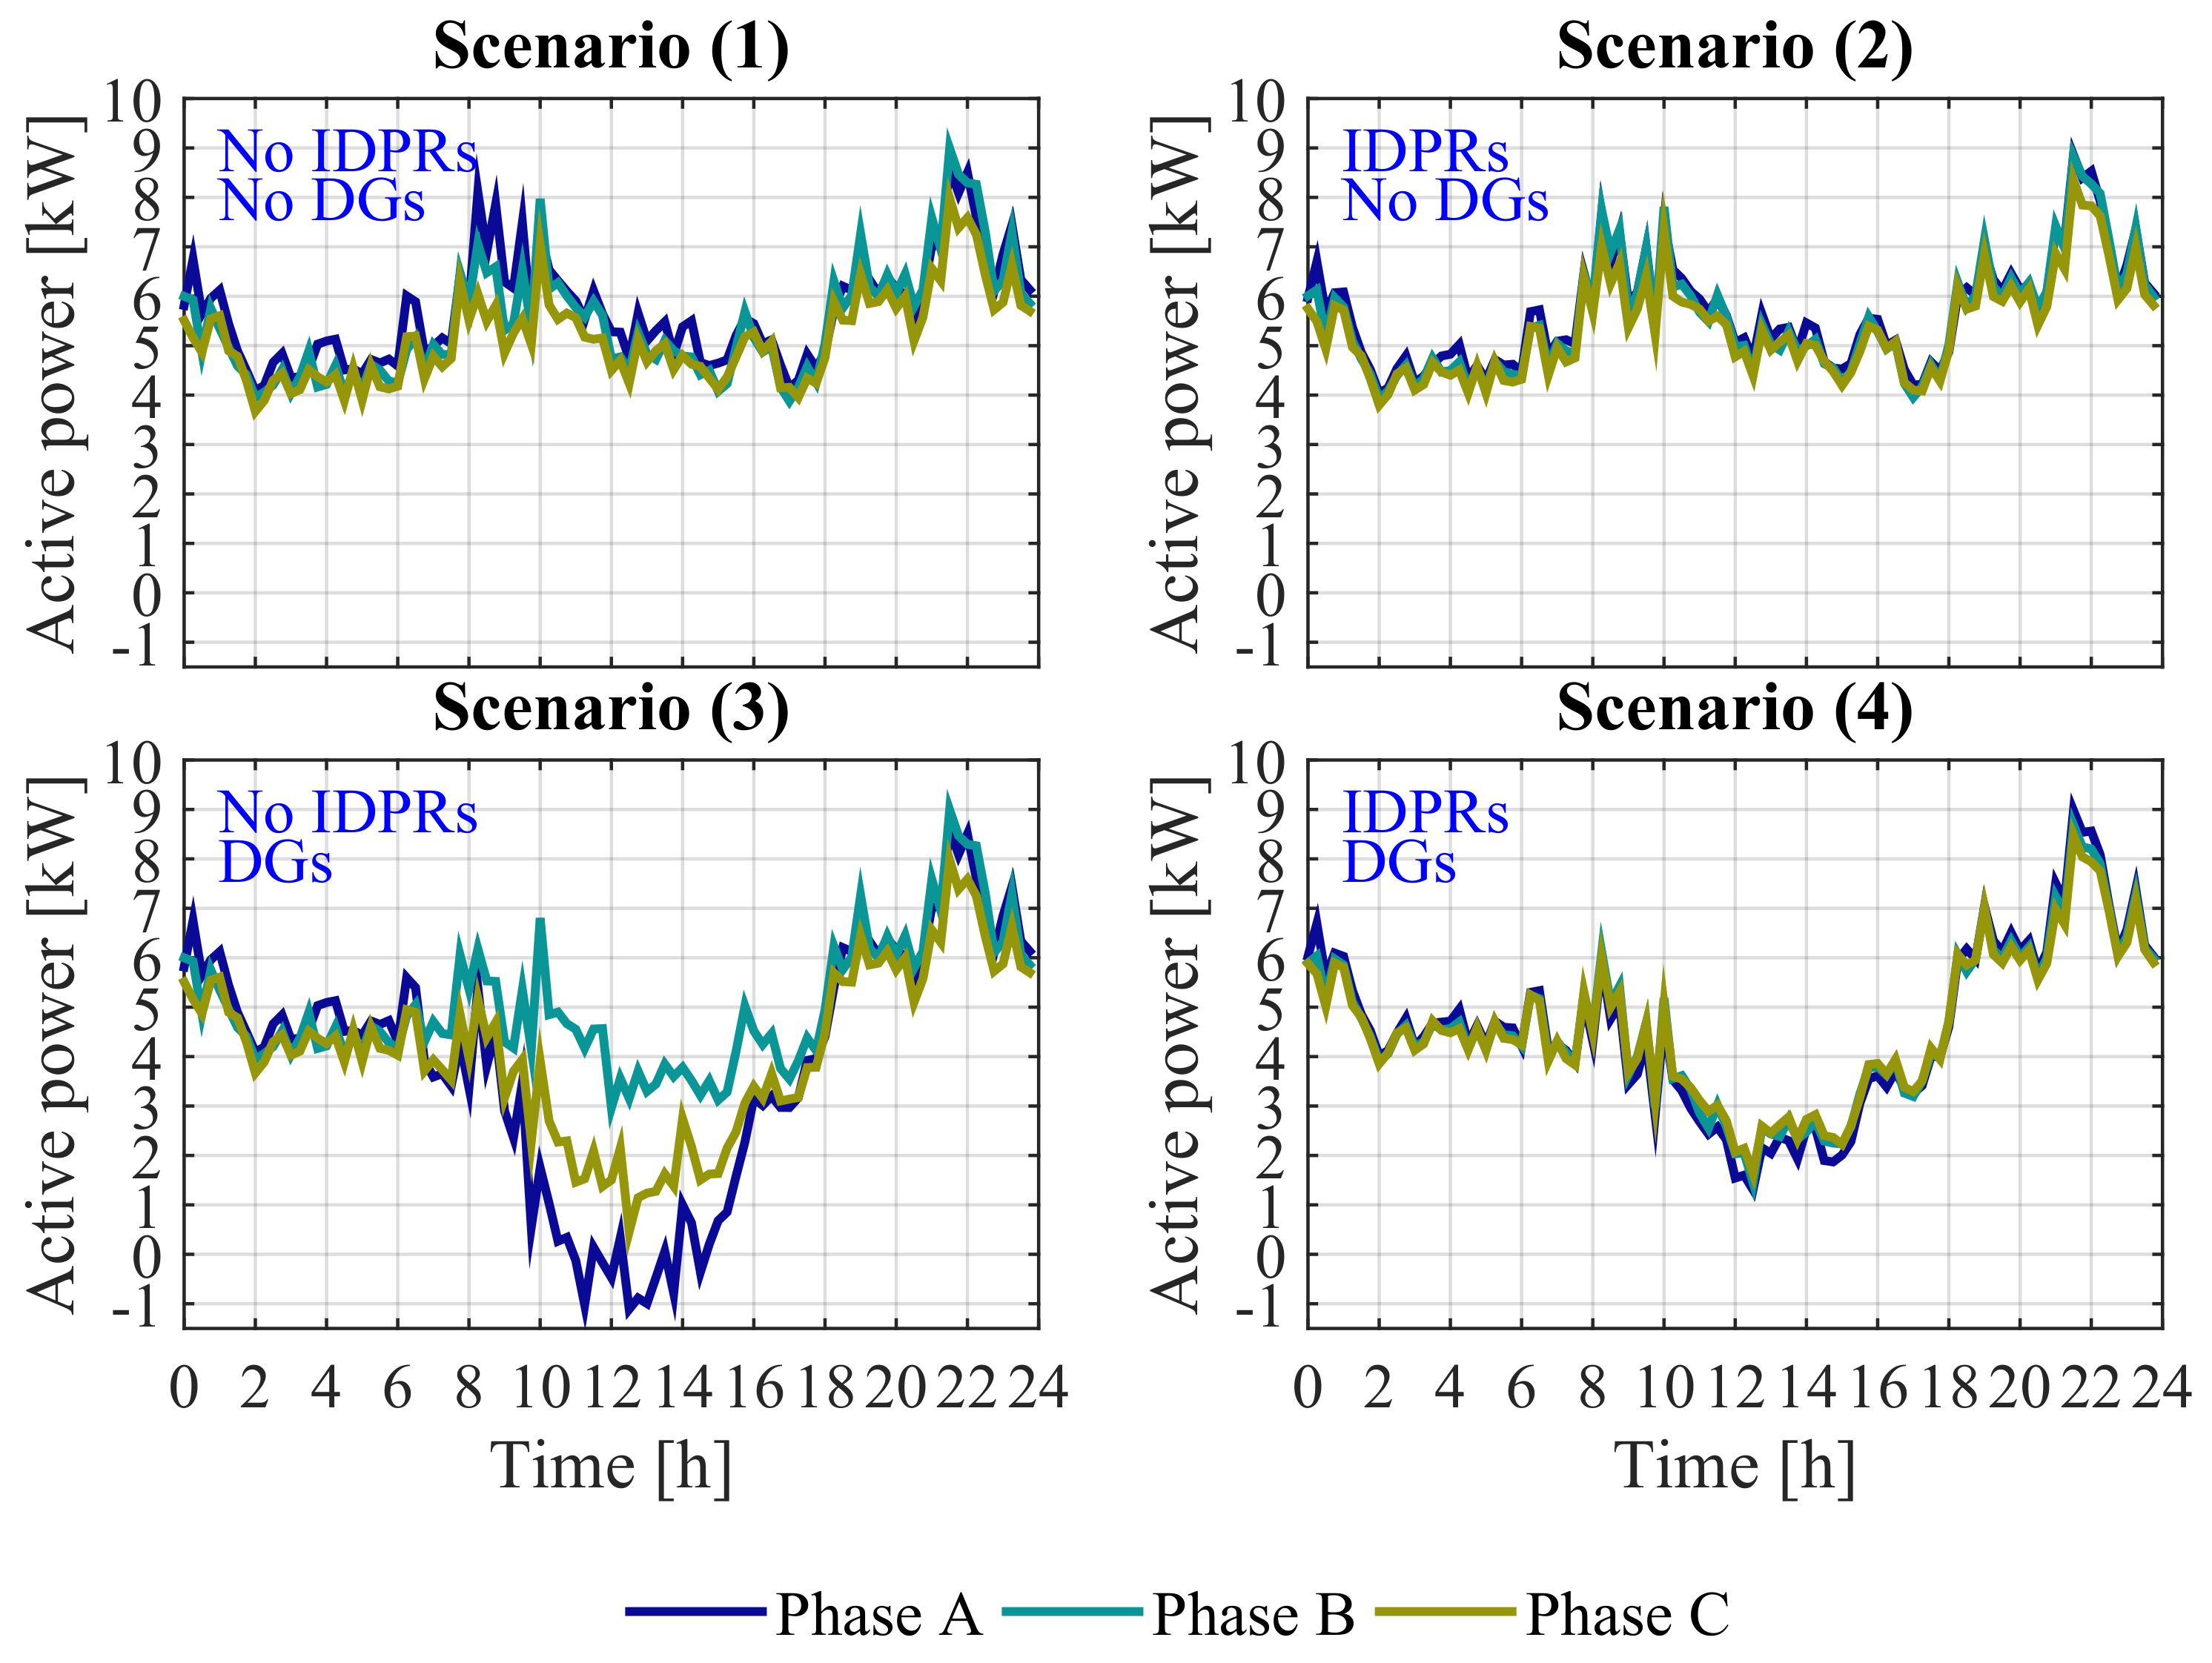
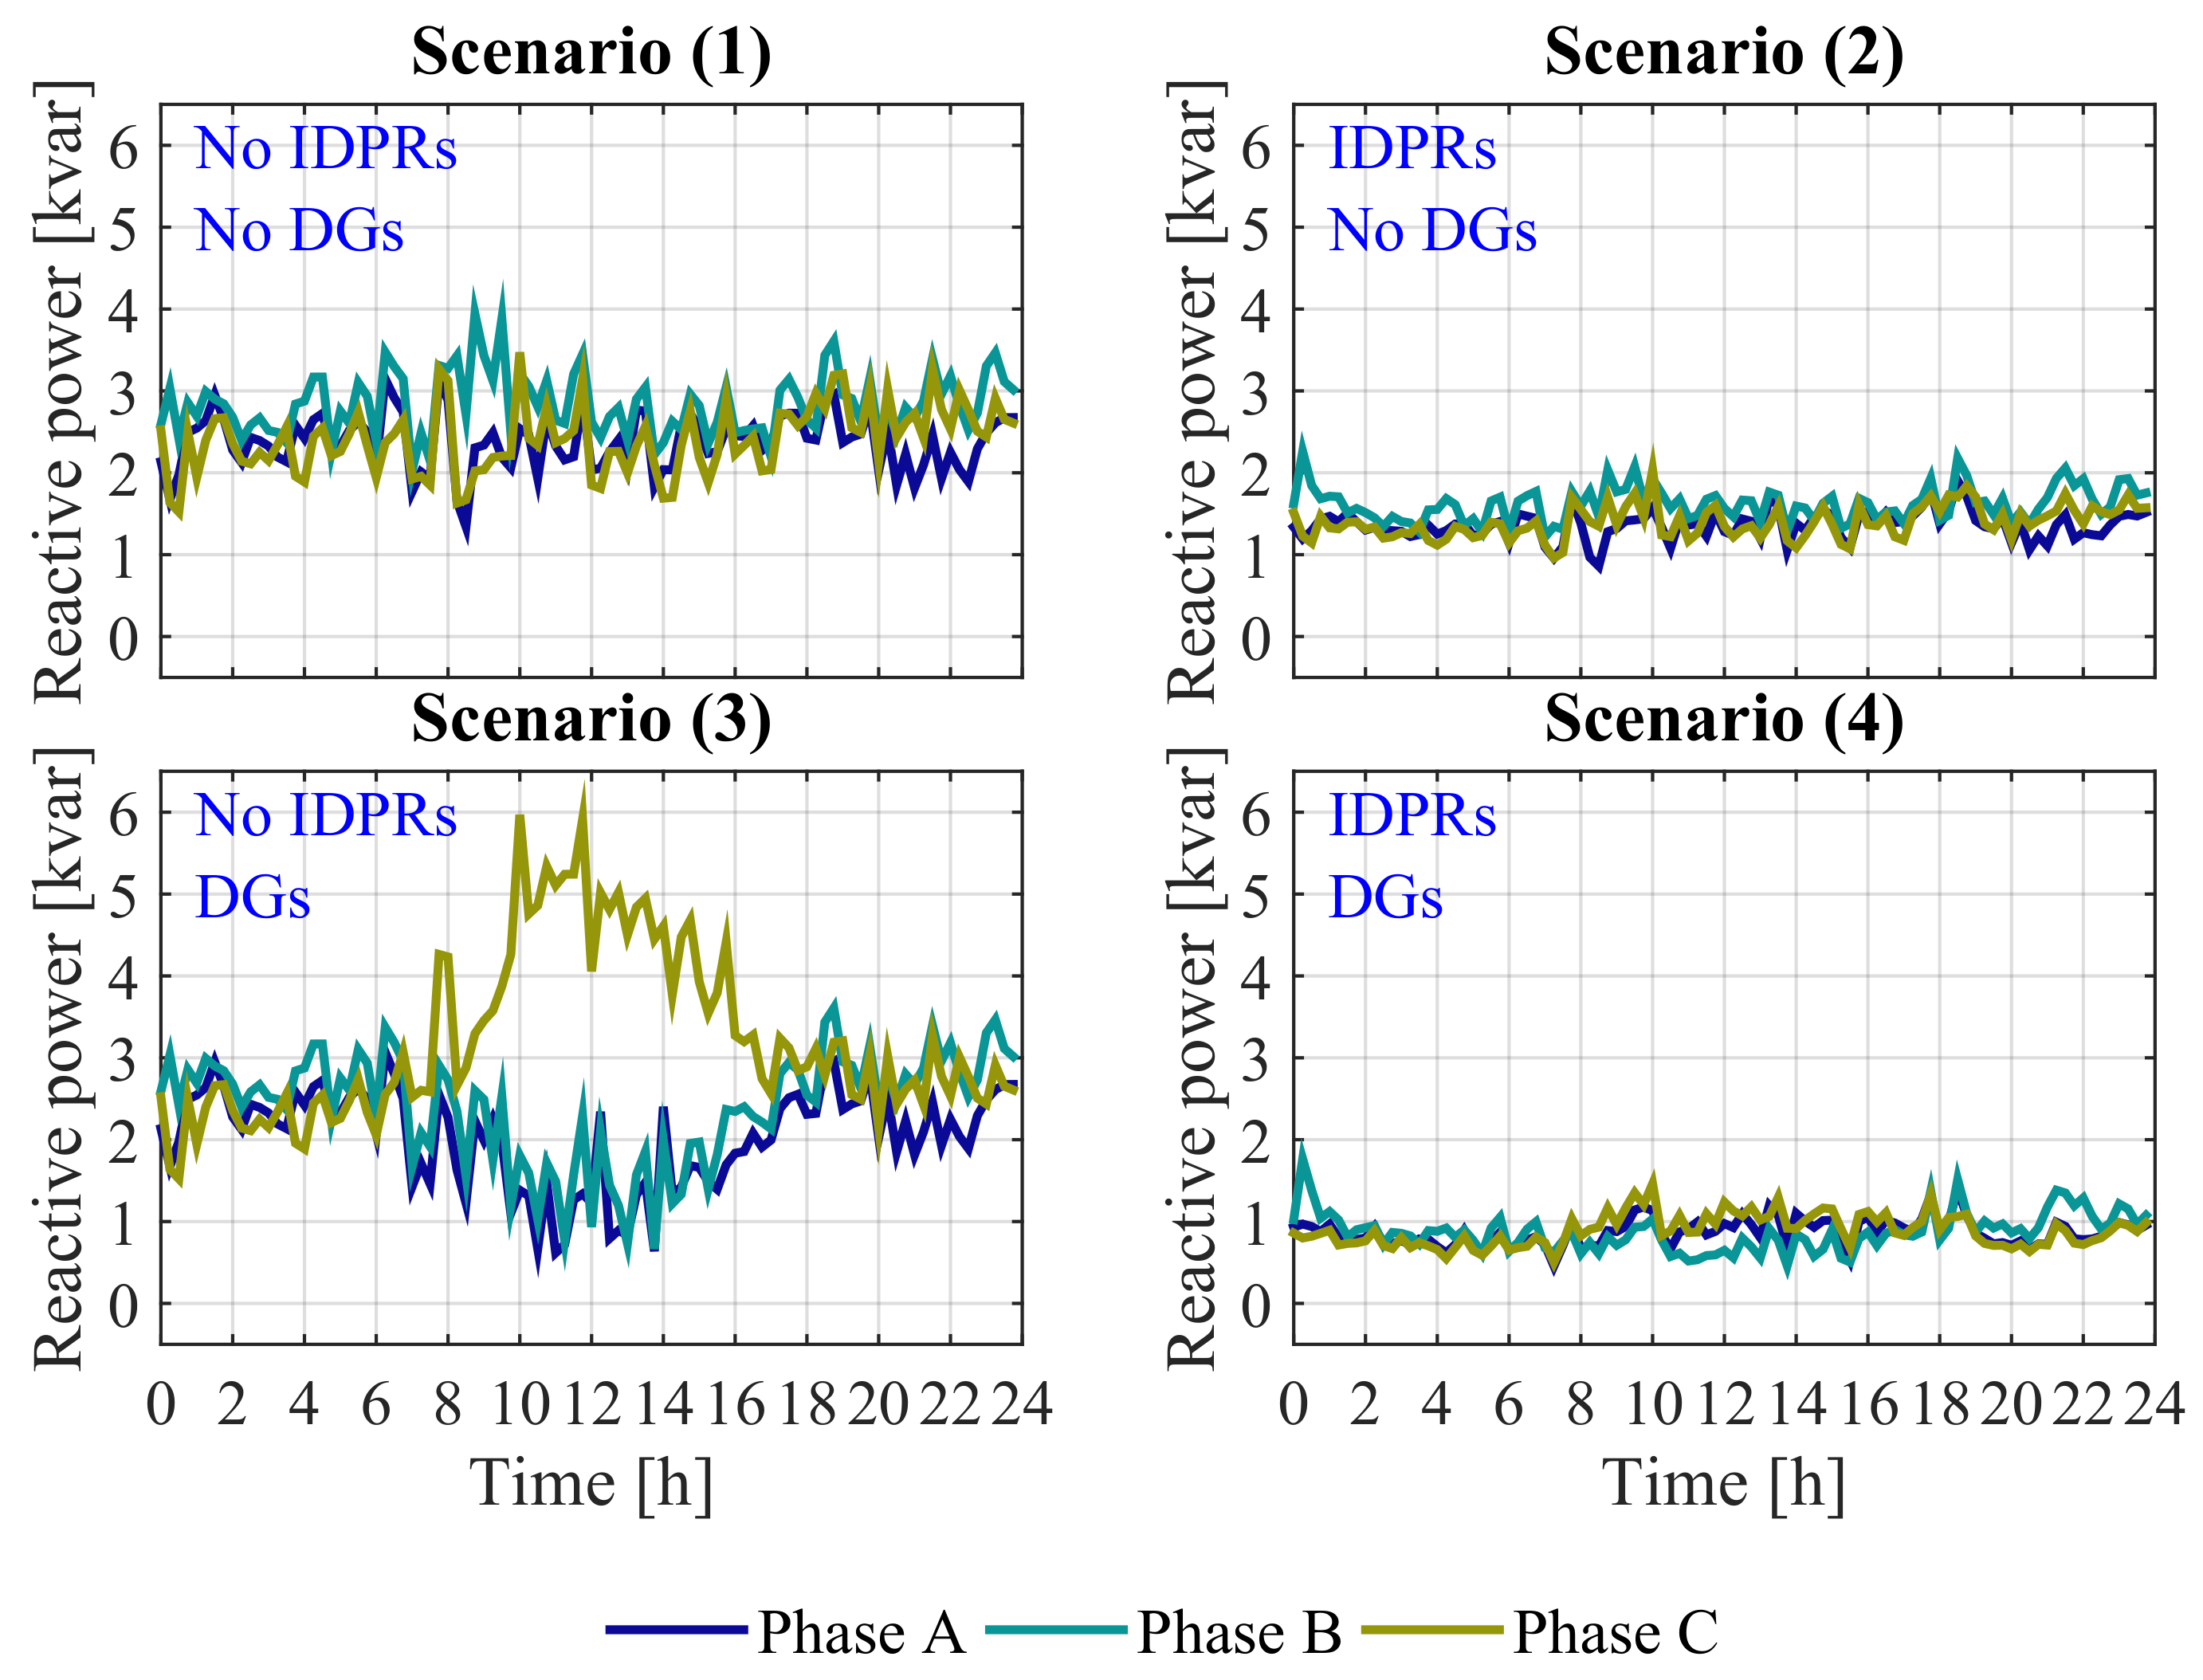
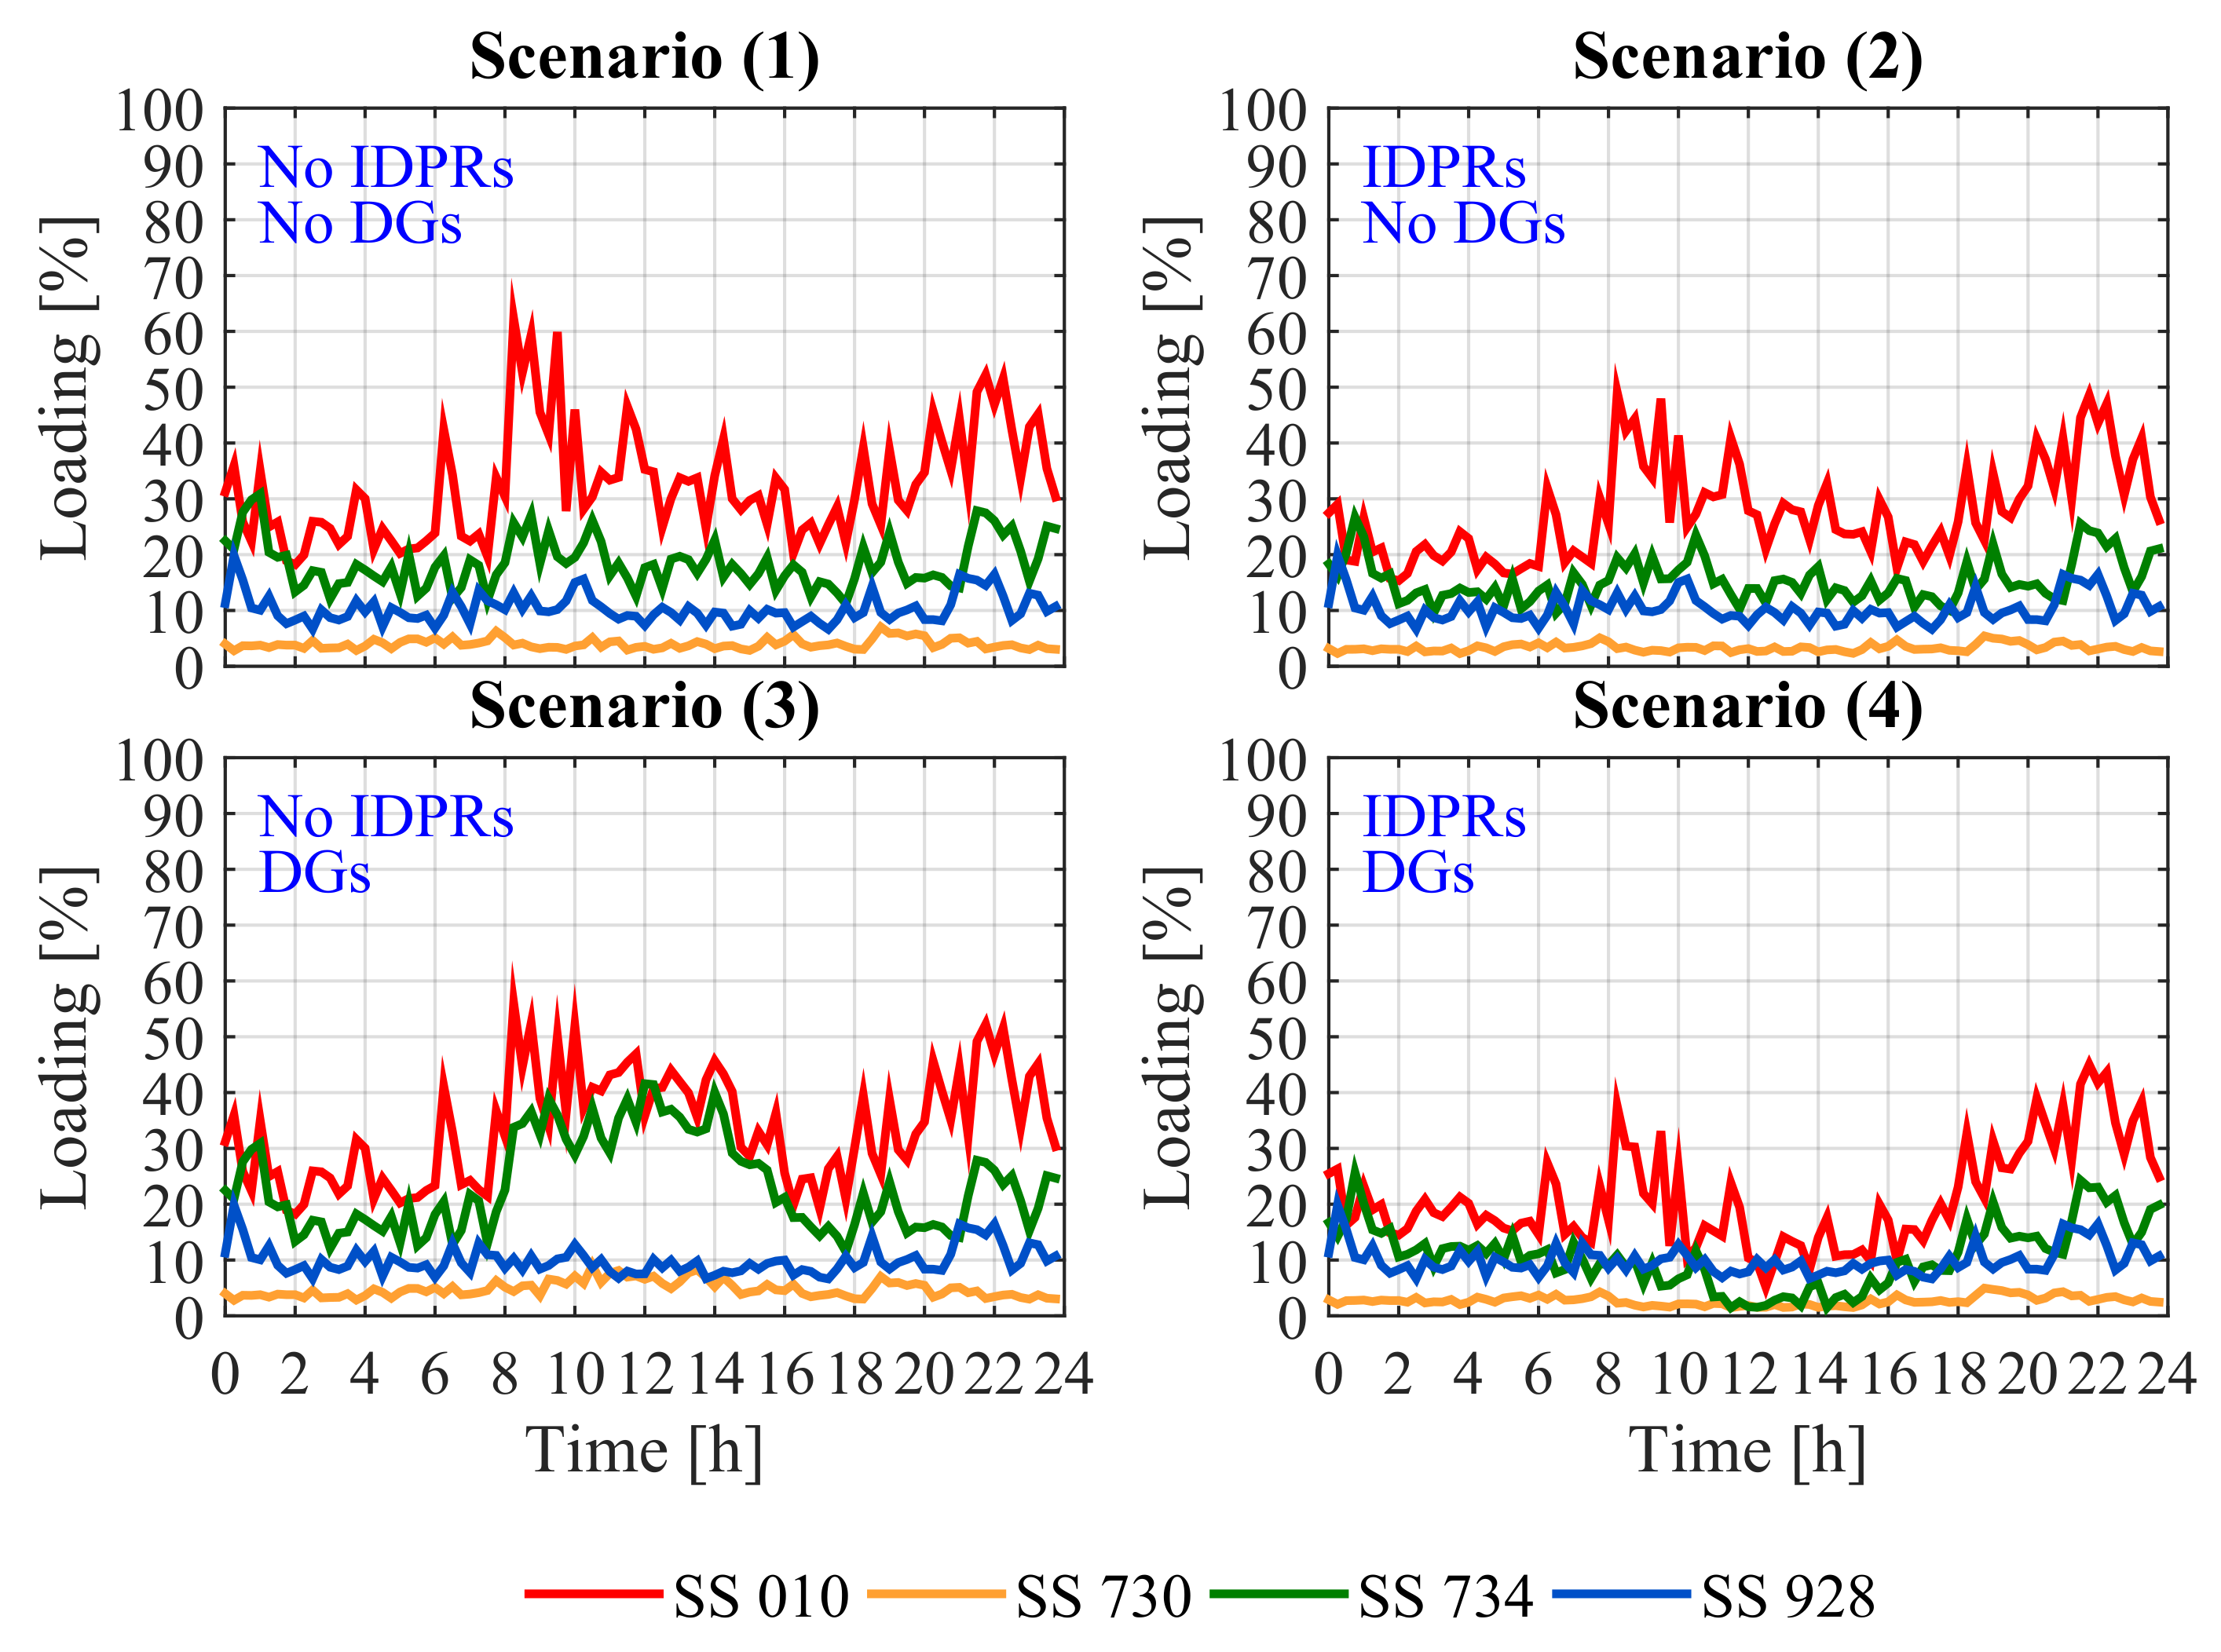
5.1. IDPRs Contributions in the Electrical Network
- Scenario (1) serves as the base case; this scenario is representative of the initial state of the PN, which does not comprise IPDRs neither DGs. This scenario comprises the existing unbalance power flows among the three-phase distribution system.
- Scenario (2) represents a transitory situation in which SSs are equipped with IDPRs, but there are no DGs. This scenario considers the initial state of the PN in a short term. The objective here is to evaluate the performance of the IDPRs while solving unbalanced power flows (and reactive components) among the three-phase distribution system due to the existing single phase loads.
- Scenario (3) represents a fictitious situation in which the PN is not equipped with IDPRs, but it does comprise DGs. This situation can be representative of an unplanned evolution of DGs in a rural area. Such DGs are considered to be single phase facilities and their integration into the network is not pursuing balanced power flows.
- Scenario (4) represents a final situation in which the PN is equipped with IDPRs and comprises DGs. The objective here is to evaluate the performance of the IDPRs while solving unbalanced power flows (and reactive components) among the three-phase distribution system due to single phase DGs and loads.
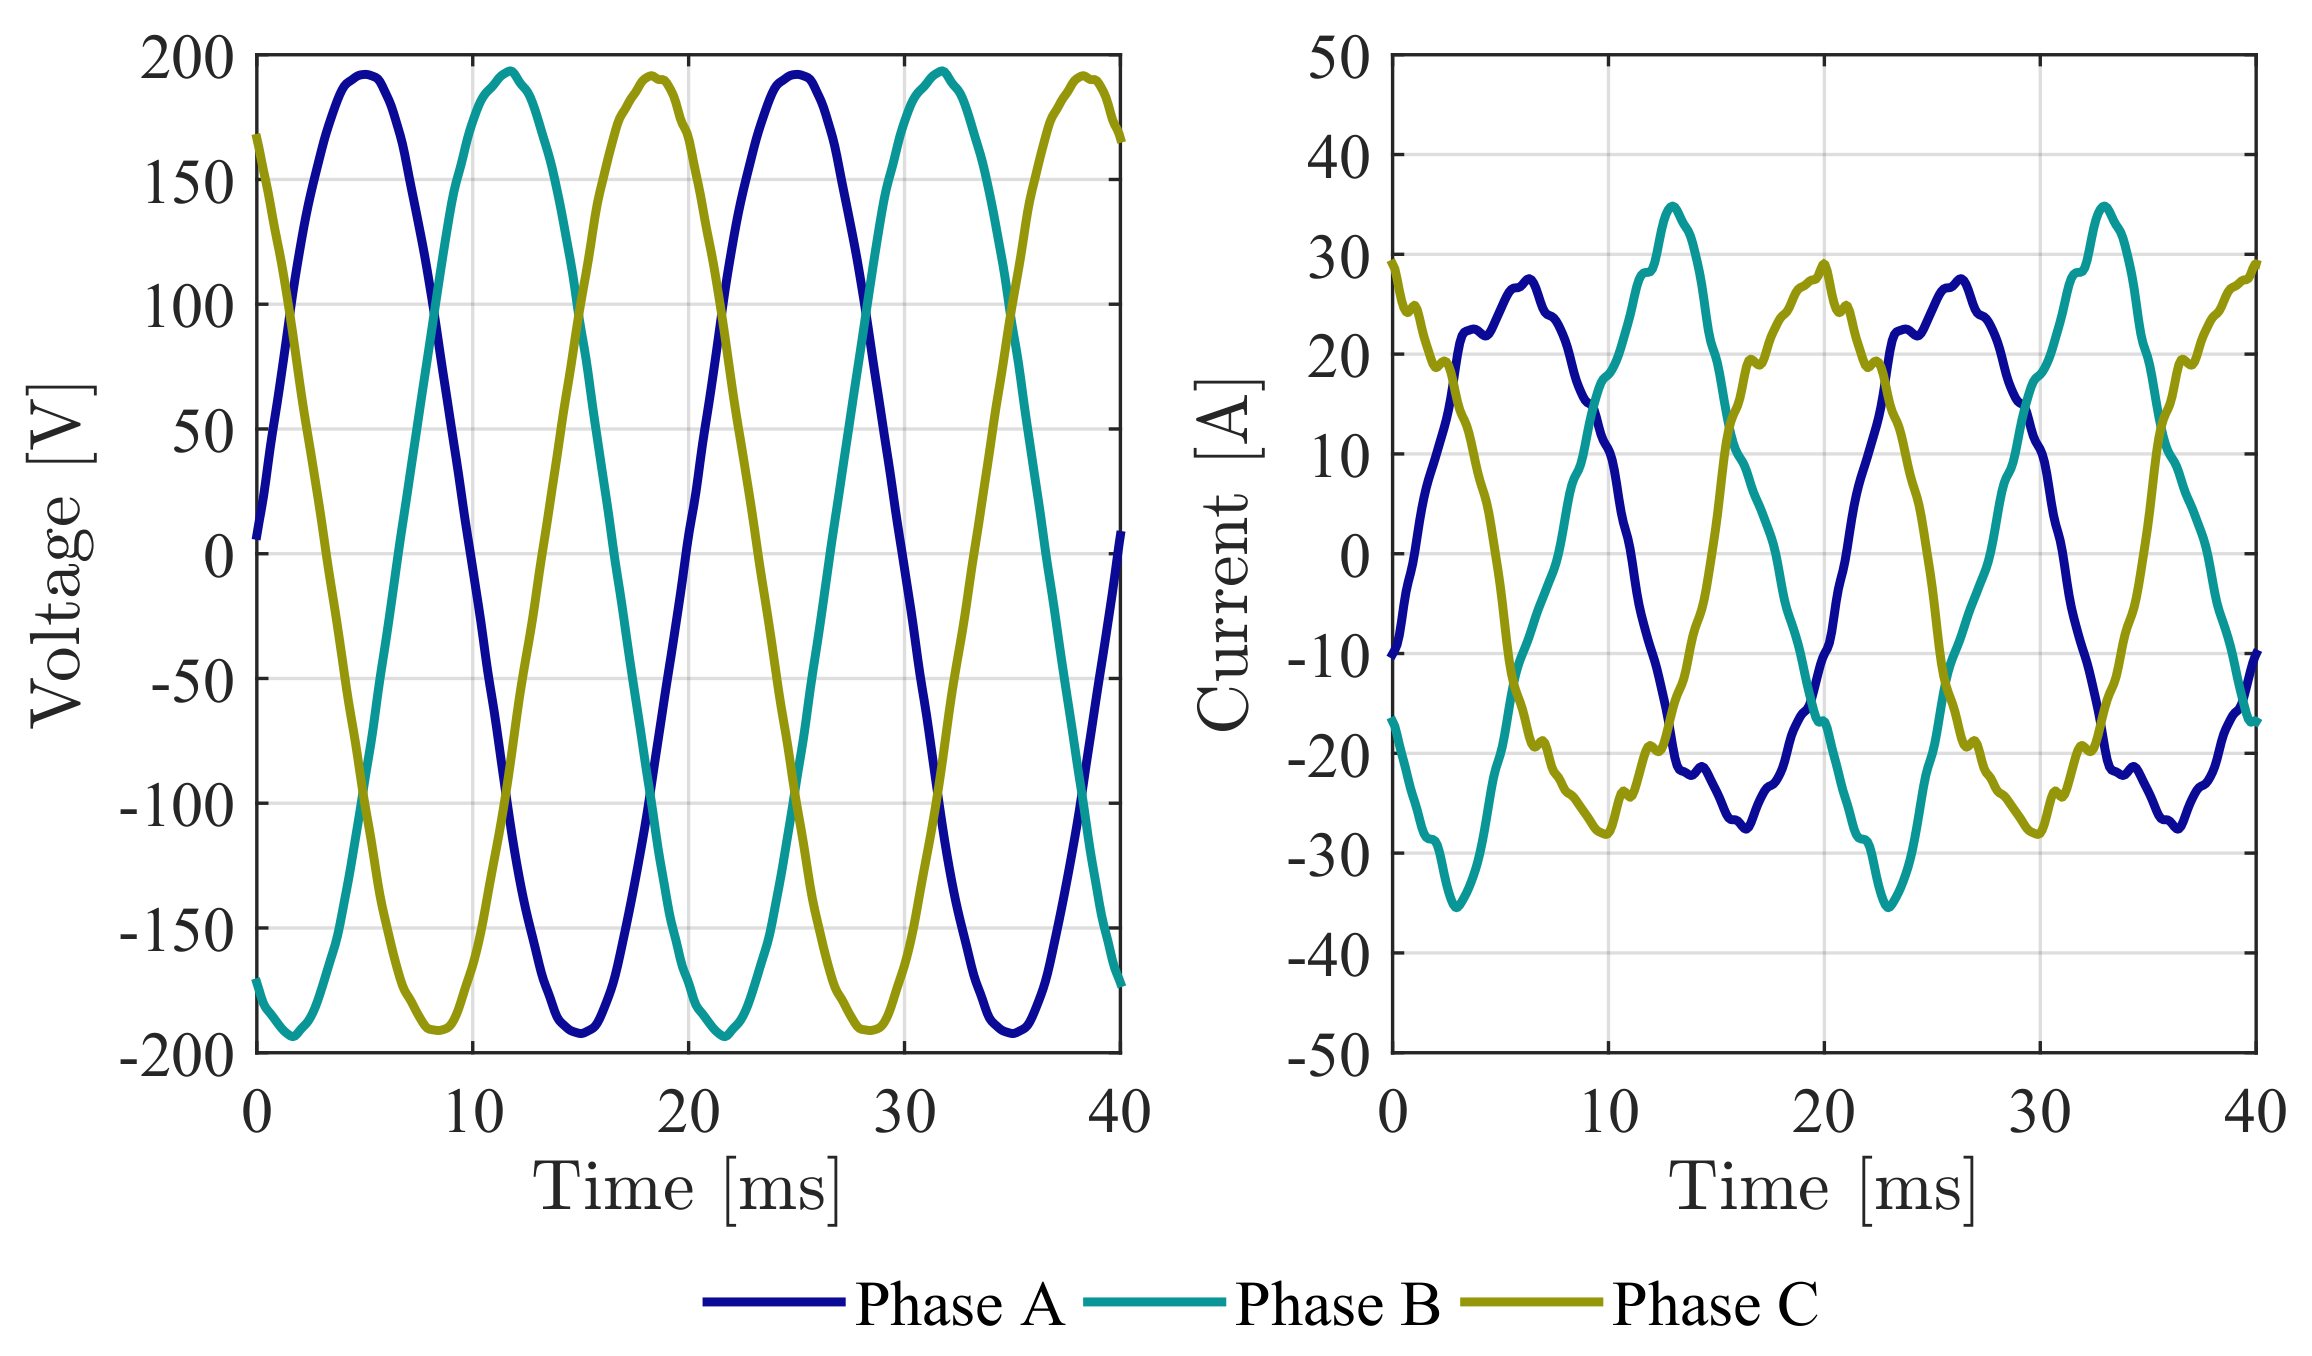
5.2. IDPR Field Performance
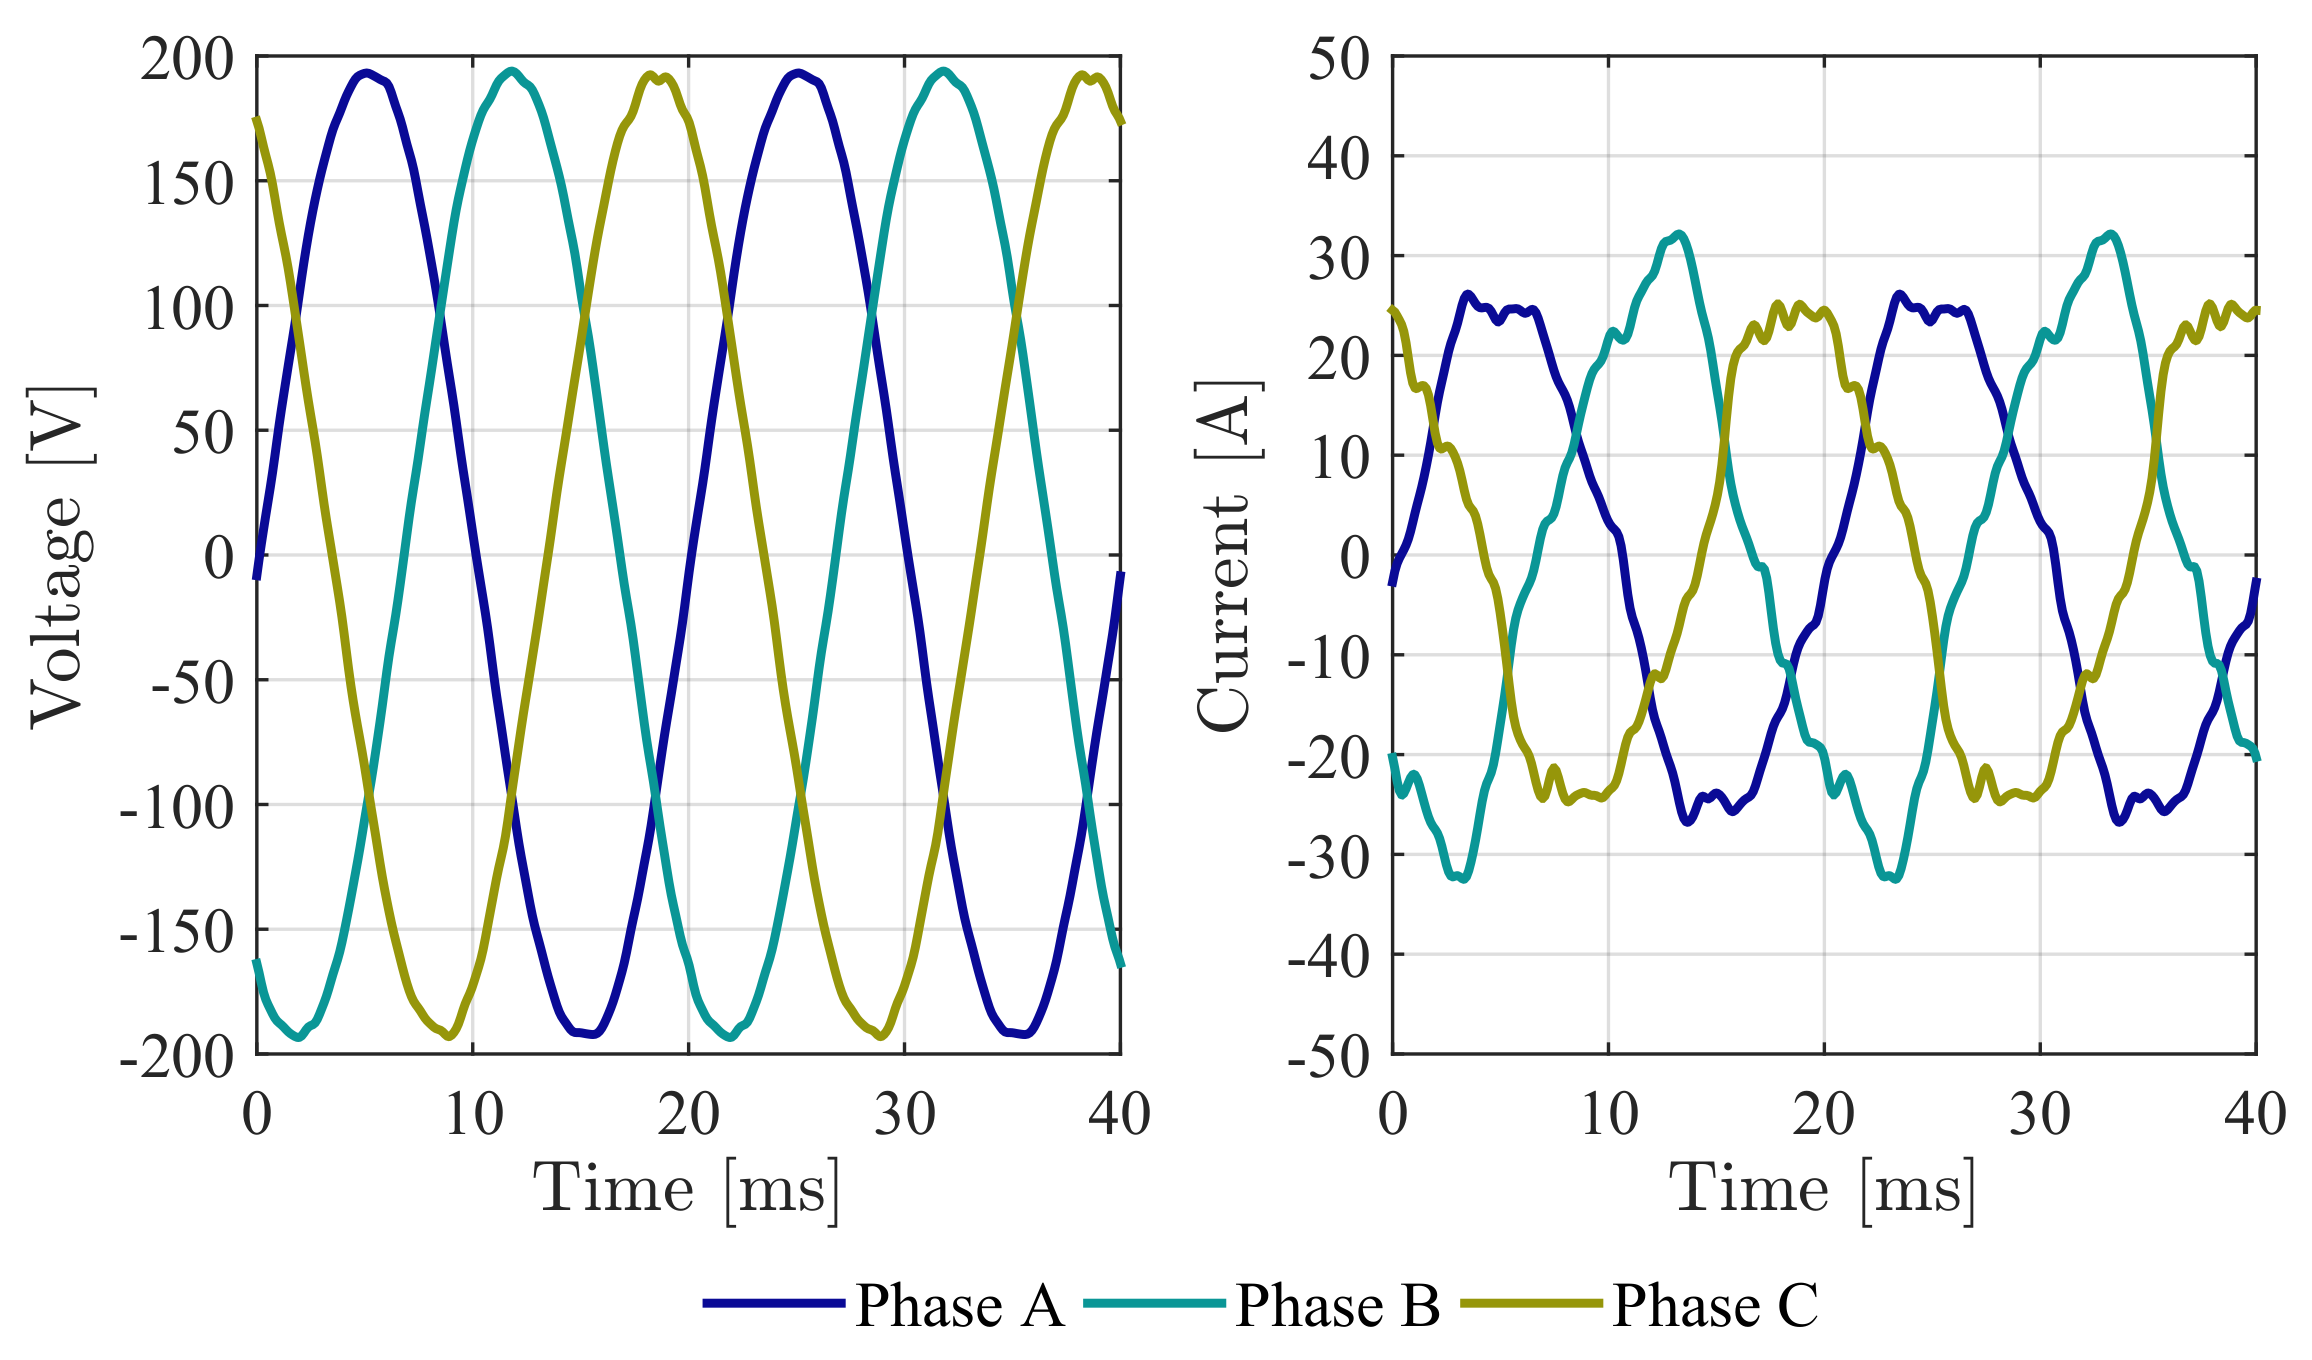
- The scenario (1) depicts an IDPR balancing the three-phase currents.
- The scenario (2) depicts an IDPR balancing the three-phase currents and compensating the reactive power.
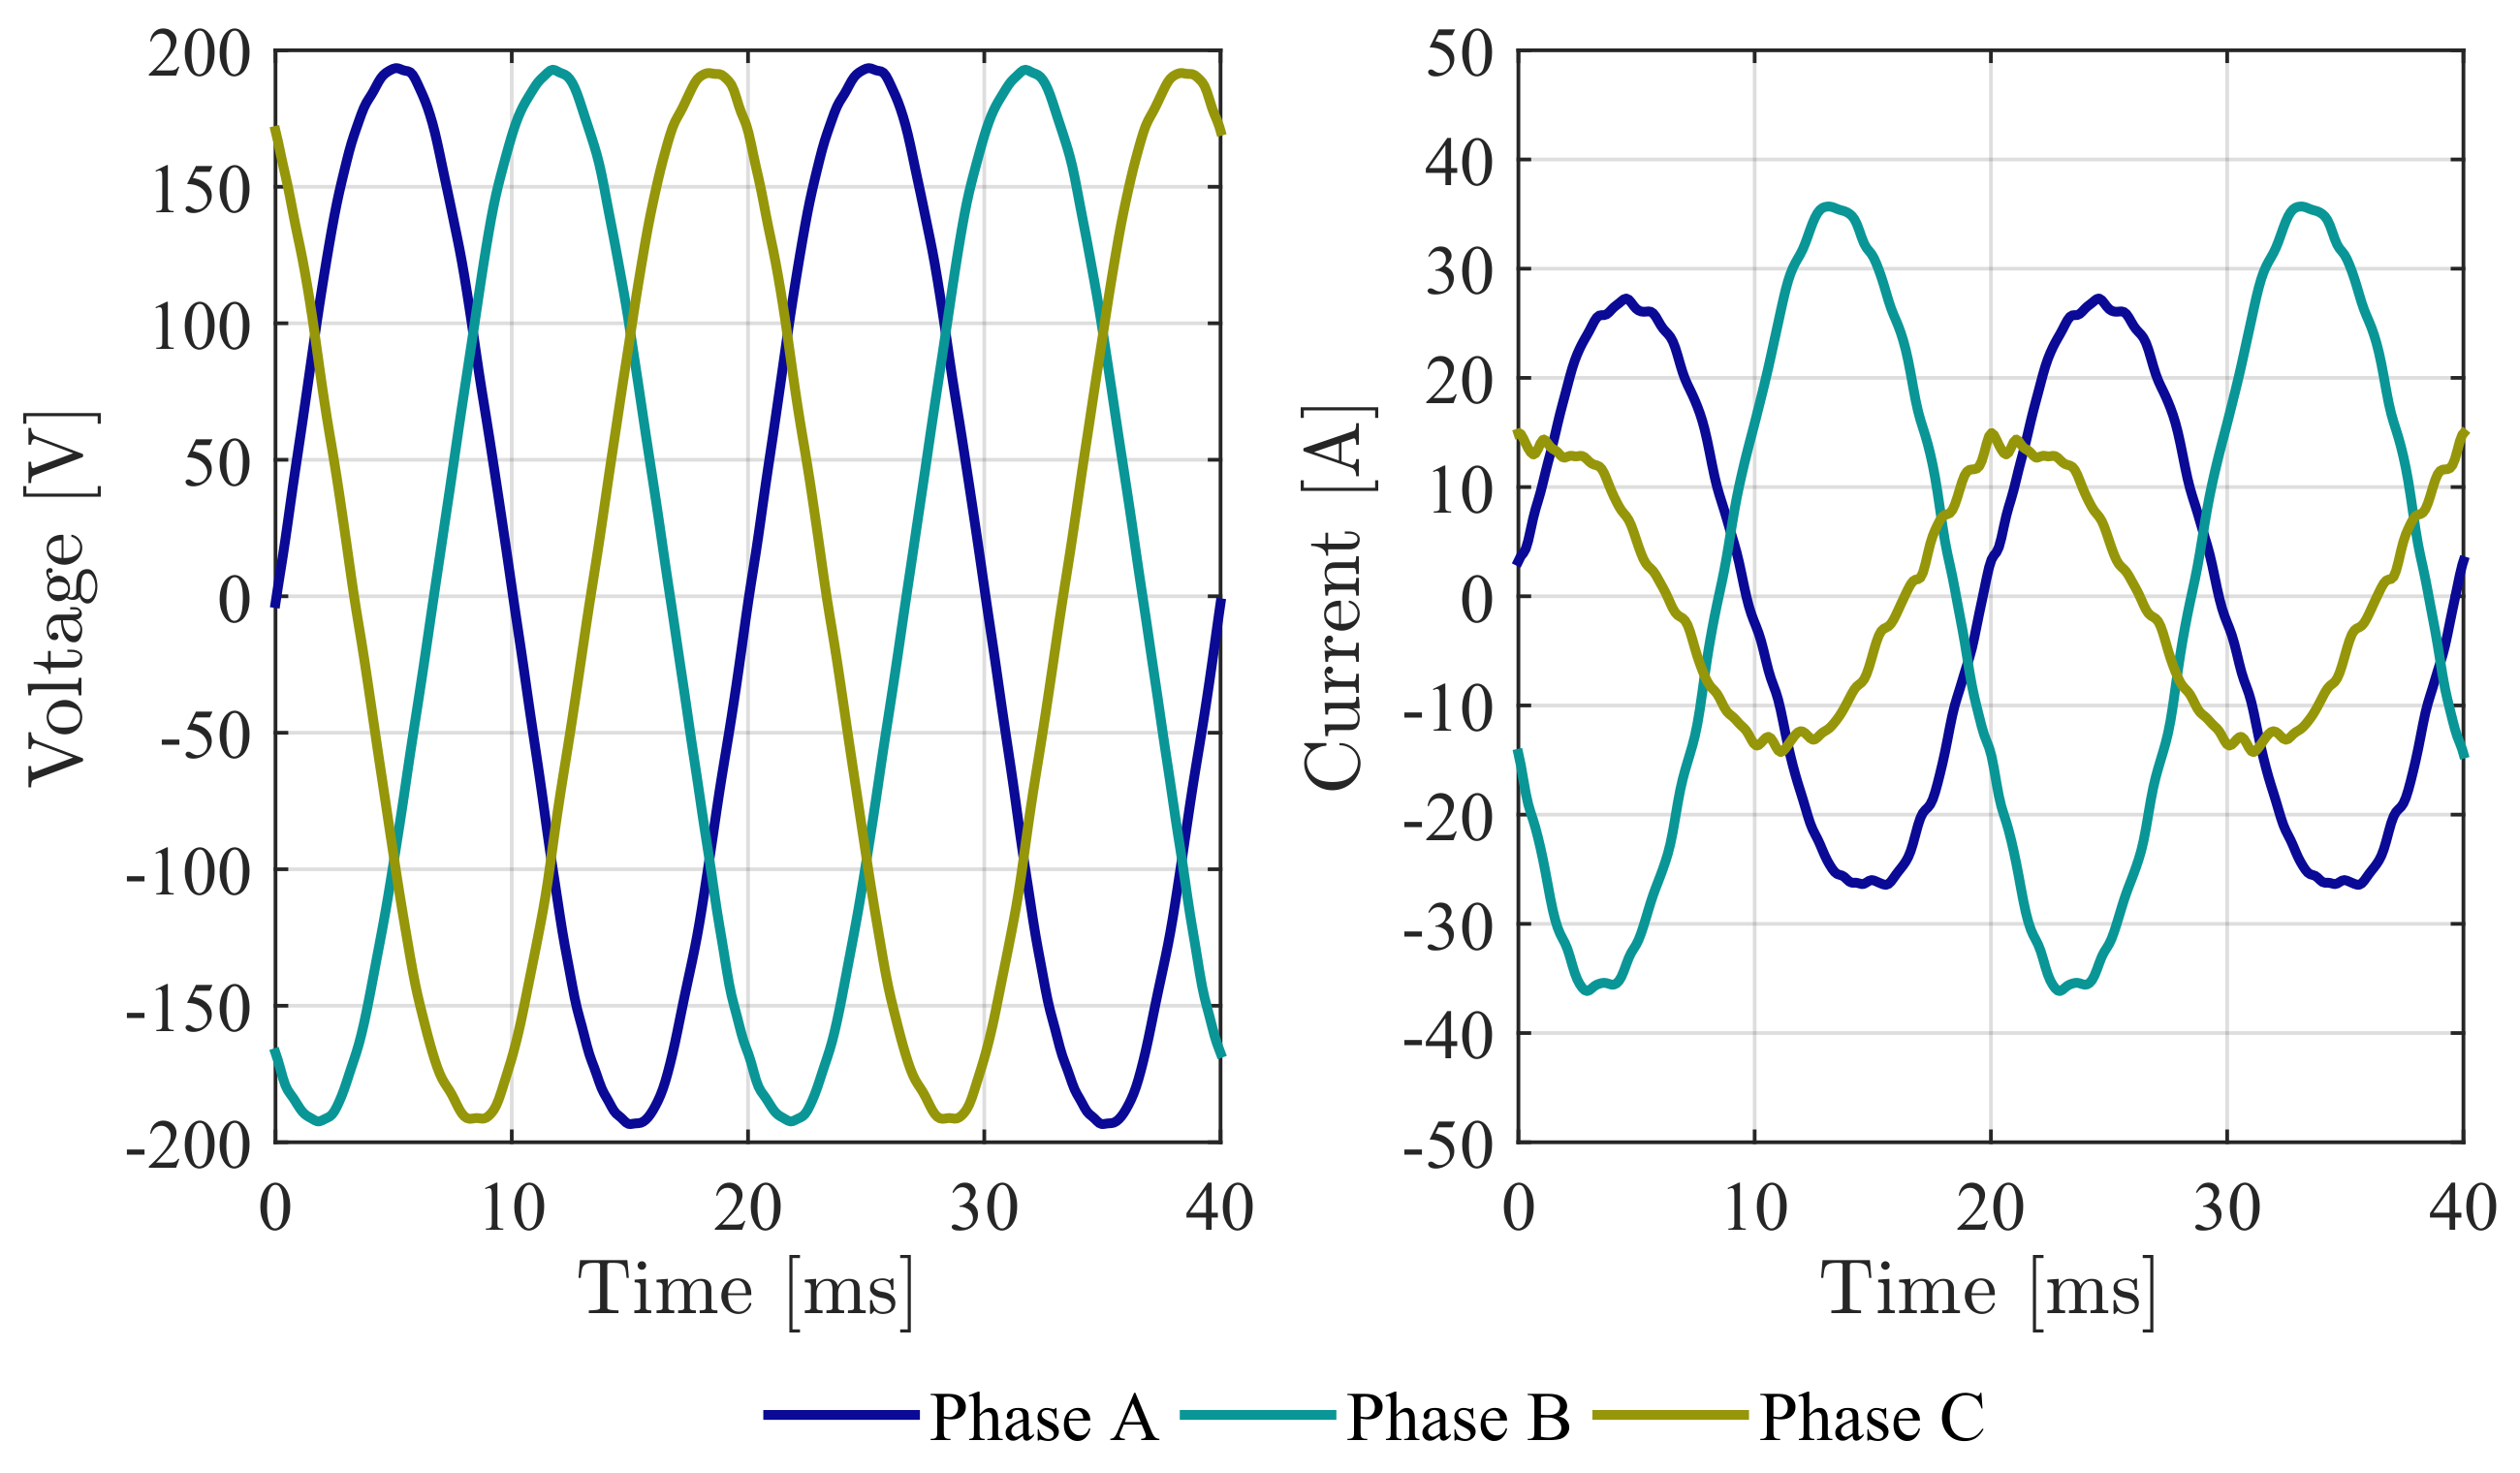
- The scenario (3) depicts an IDPR mitigating the harmonic currents.
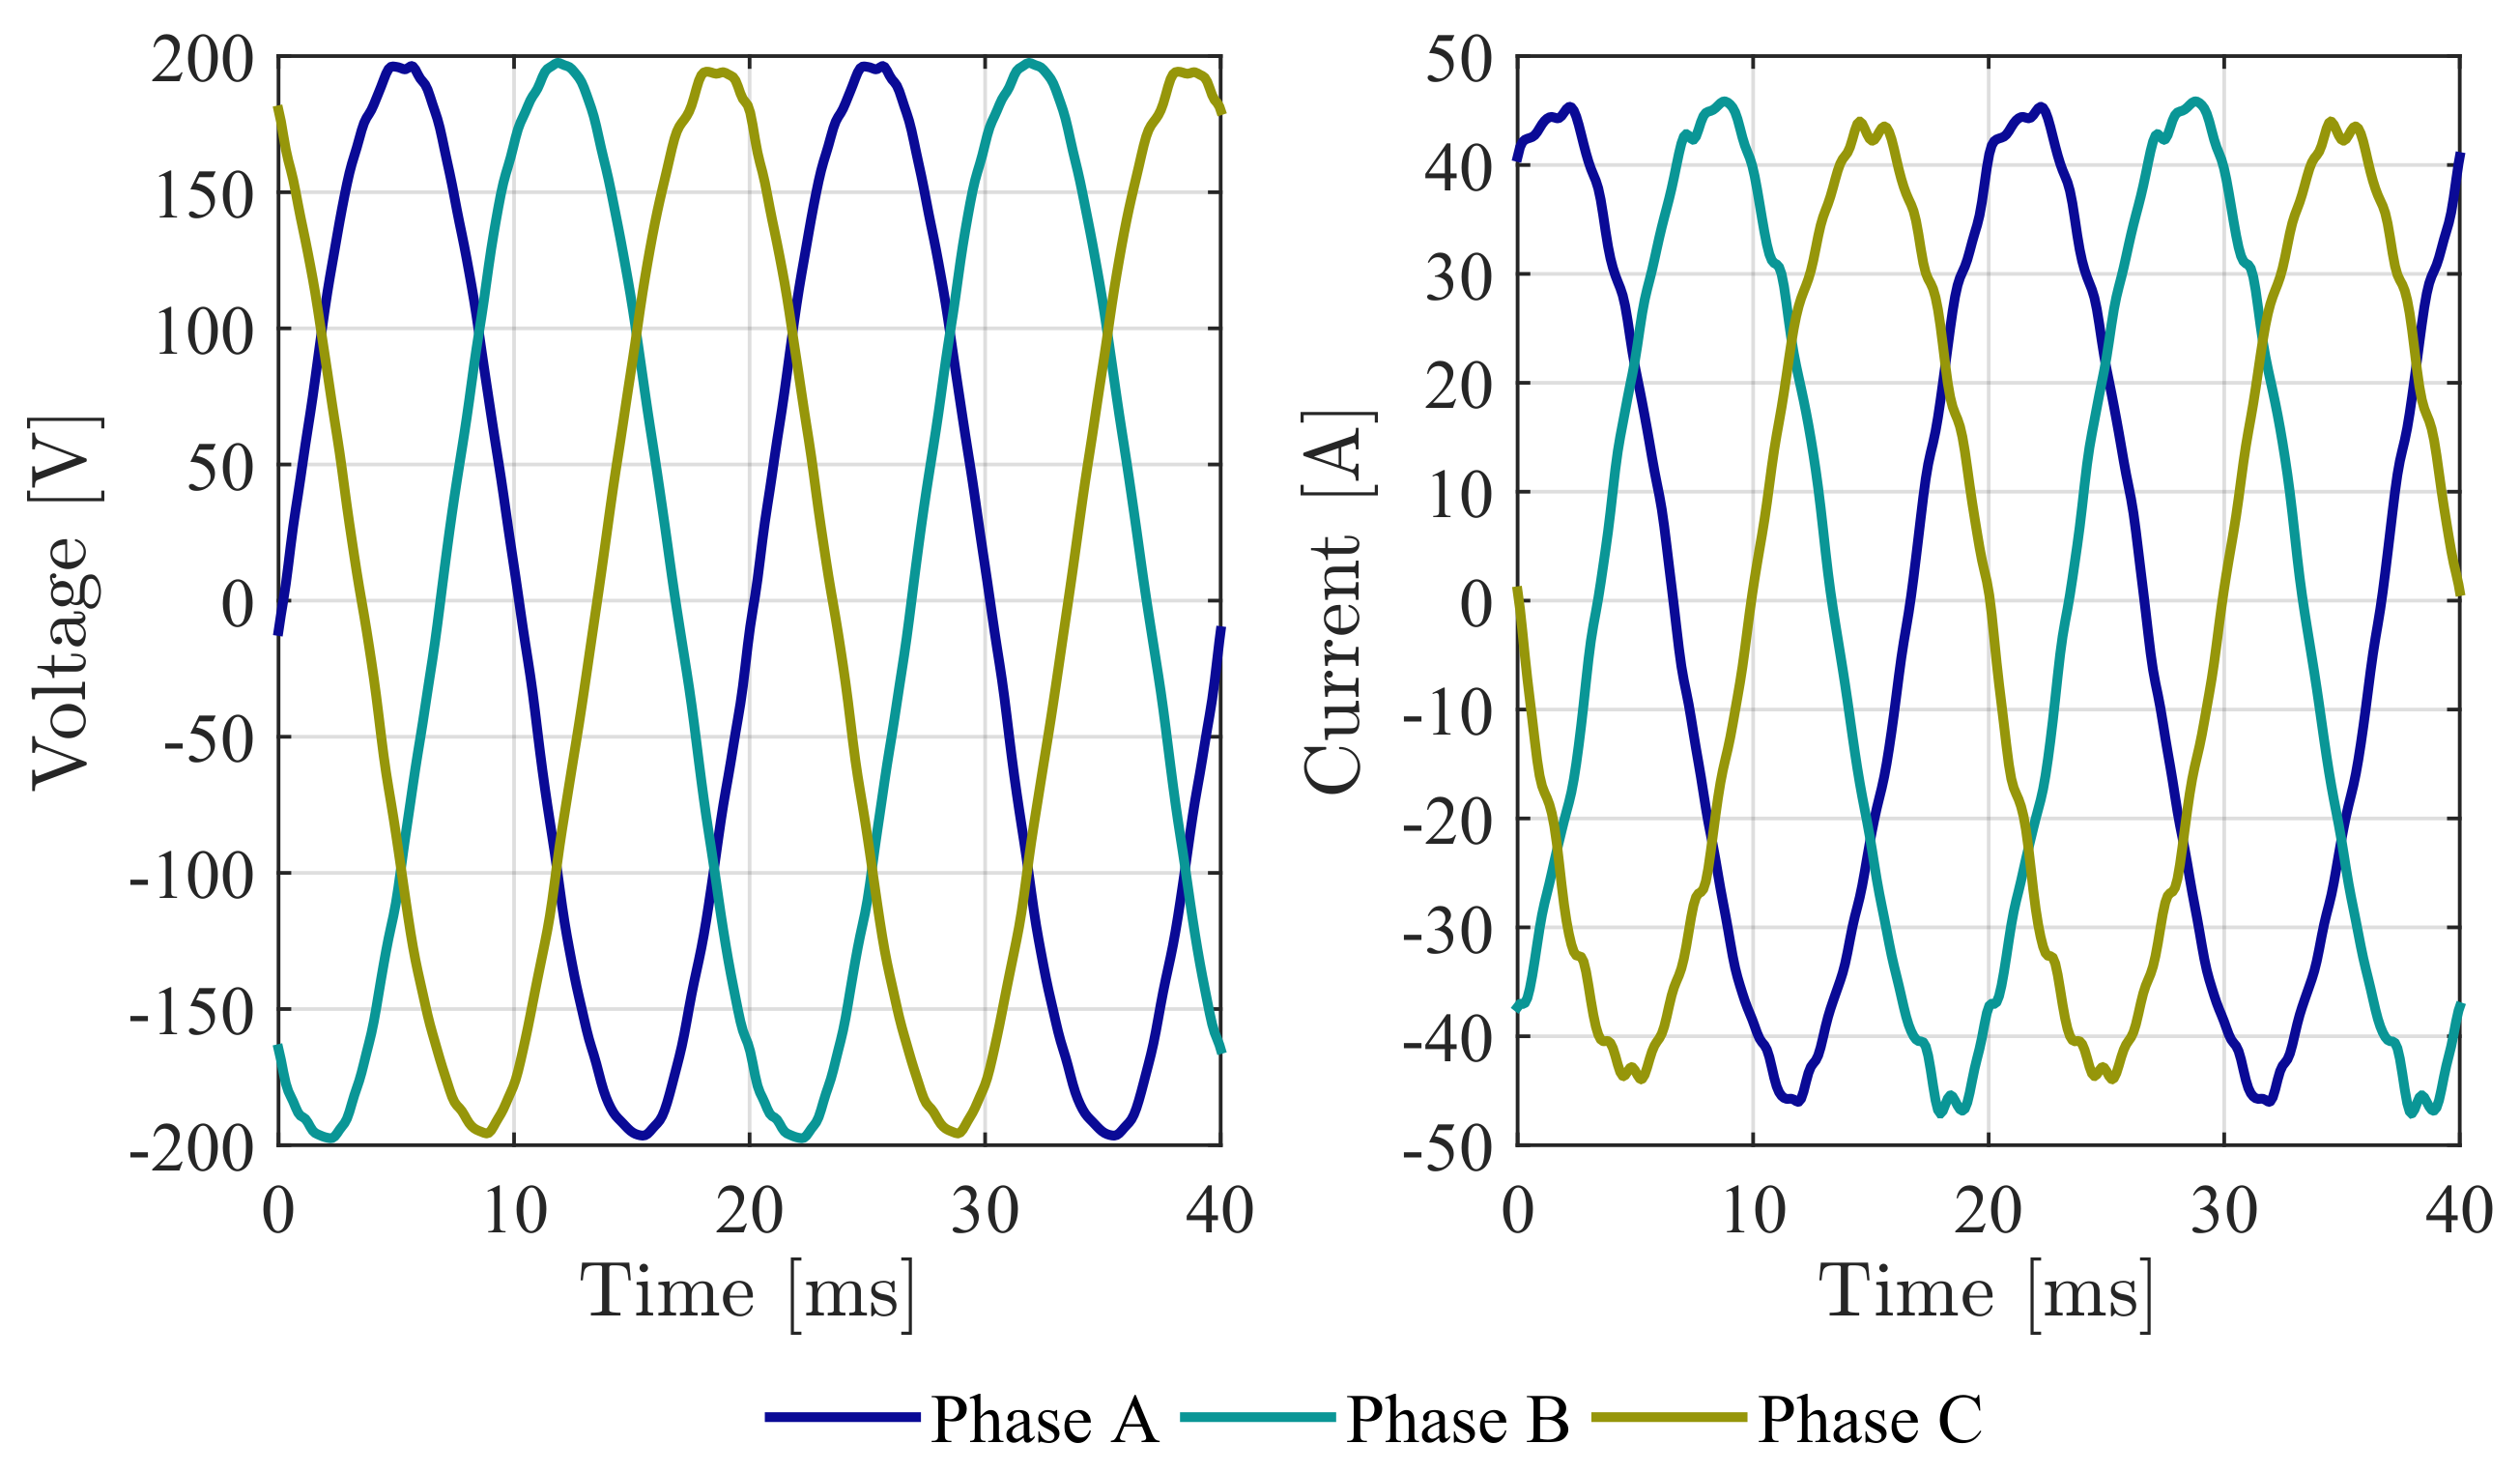
- The scenario (4) depicts an IDPR balancing the three-phase currents, compensating the reactive power and posteriorly dispatching 12 kvar.
5.3. The Dimensioning of IDPRs
6. Conclusions
Acknowledgments
Author Contributions
Conflicts of Interest
Abbreviations
| ASD | Automated Switch-Disconnector |
| BESS | Battery Energy Storage System |
| C1 | Circumstance 1 (operating connected to the EG) |
| C2 | Circumstance 2 (operating disconnected from the EG) |
| C3 | Circumstance 3 (in blackout conditionts) |
| DG | Distributed Generation |
| DSO | Distribution System Operator |
| EG | External Grid |
| EMS | Energy Management System |
| EMU | Electrical Measurement Unit |
| EPS | Electrical Power Switch |
| FOC | Fiber Optics Communication |
| GEMS | Global Energy Management System |
| GPRS | General Packet Radio System |
| GS | Auxiliary diesel generator |
| IDPR | Intelligent Distribution Power Router |
| IEC | International Electrotechnical Commission |
| IP | Internet Protocol |
| LC | Local Controller |
| LV | Low Voltage |
| LEMS | Local Energy Management System |
| MV | Medium Voltage |
| OPF | Optimal Power Flow |
| PLC | Power Line Communications |
| PN | Pilot Network |
| RADIUS | Remote Authentication Dial-In User Service |
| RIP | Routing Information Protocol |
| RTU | Remote Terminal Unit |
| RMS | Root Mean Square |
| S1 | Sector 1 (comprises only the SS 010) |
| S2 | Sector 2 (comprises SSs 730 and 734) |
| S3 | Sector 3 (comprises only the SS 928) |
| SCADA | Supervisory Control and Data Acquisition |
| SFTP | Secure File Transfer Protocol |
| SNMP | Simple Network Management Protocol |
| SS | Secondary Substation |
| SSH | Secure Shell |
| SRG | Smart Rural Grid |
| TC | Transformer Controller |
| THD | Total Harmonic Distortion |
| TN | Telecommunications Networks |
| VPN | Virtual Private Network |
| WLC | Wireless Communications |
| WiMAX | Worldwide Interoperability for Microwave Access |
| XOC | Xarxa Oberta de Catalunya |
References
- Zomers, A. The challenge of rural electrification. Energy Sustain. Dev. 2003, 7, 69–76. [Google Scholar] [CrossRef]
- Foley, G. Rural electrification in the developing world. Energy Policy 1992, 20, 145–152. [Google Scholar] [CrossRef]
- Farhangi, H. The path of the smart grid. IEEE Power Energy Mag. 2010, 8, 18–28. [Google Scholar] [CrossRef]
- Zviedritis, M.; Gavrilovs, A.; Kutjuns, A. Power supply reliability vs profitability in rural distribution networks. In Proceedings of the 2014 Electric Power Quality and Supply Reliability Conference (PQ), Rakvere, Estonia, 11–13 June 2014; pp. 335–340. [Google Scholar]
- Gómez-Expósito, A.; Conejo, A.J.; Cañizares, C. Electric Energy Systems: Analysis and Operation; CRC Press: Boca Raton, FL, USA, 2008. [Google Scholar]
- Edso for Smart Grids, We Are the European Distribution System Operators’ Association for Smart Grids. Available online: http://www.edsoforsmartgrids.eu/ (accessed on 25 May 2016).
- Fang, X.; Misra, S.; Xue, G.; Yang, D. Smart grid—The new and improved power grid: A survey. IEEE Commun. Surv. Tutor. 2012, 14, 944–980. [Google Scholar] [CrossRef]
- Kundur, P.; Balu, N.J.; Lauby, M.G. Power System Stability and Control; McGraw-Hill: New York, NY, USA, 1994. [Google Scholar]
- Amin, S.M.; Wollenberg, B.F. Toward a smart grid: power delivery for the 21st century. IEEE Power Energy Mag. 2005, 3, 34–41. [Google Scholar] [CrossRef]
- Li, F.; Qiao, W.; Sun, H.; Wan, H.; Wang, J.; Xia, Y.; Xu, Z.; Zhang, P. Smart transmission grid: Vision and framework. IEEE Trans. Smart Grid 2010, 1, 168–177. [Google Scholar] [CrossRef]
- Perez-Arriaga, I.J.; Batlle, C. Impacts of intermittent renewables on electricity generation system operation. Econ. Energy Environ. Policy 2012, 1, 3–18. [Google Scholar] [CrossRef]
- Cabrera-Tobar, A.; Banna, H.; Koch-Ciobotaru, C. Scope of electrical distribution system architecture considering the integration of renewable energy in large and small scale. In Proceedings of the 2014 IEEE PES Innovative Smart Grid Technologies Conference Europe (ISGT-Europe), Istanbul, Turkey, 12–15 October 2014; pp. 1–7. [Google Scholar]
- Dena German Energy Agency, Electricity Distribution Grids Require Significant Expansion for the Energy Turnaround. Available online: https://www.dena.de/en/home/ (accessed on 30 May 2016).
- Rodríguez-Roncero, J. Integration is key to Smart Grid management. In Proceedings of the 2008 IET-CIRED Seminar SmartGrids for Distribution, Frankfurt, Germany, 23–24 June 2008; pp. 1–4. [Google Scholar]
- Keyhani, A.; Marwali, M. Smart Power Grids 2011; Springer: Berlin, Germany, 2012. [Google Scholar]
- Ruester, S.; Pérez-Arriaga, I.J.; Schwenen, S.; Batlle, C.; Glachant, J.M. From Distribution Networks to Smart Distribution Systems: Rethinking the Regulation Of European Electricity DSOs; THINK Reports Florence School of Regulation; European University Institute: Fiesole, Italy, 2013. [Google Scholar]
- Pérez-Arriaga, I.J.; Gómez, T.; Olmos, L.; Rivier, M. Transmission and Distribution Networks for a Sustainable Electricity Supply; Edward Edgar Publishing: Cheltenham, UK, 2011. [Google Scholar]
- Boehner, V.; Franz, P.; Hanson, J.; Gallart-Fernández, R.; Martínez-Farrero, S.; Sumper, A.; Girbau-Llistuella, F. Smart grids for rural conditions and e-mobility-applying power routers, batteries and virtual power plants. In Proceedings of the “Actas CIGRE 2016” A: International Council on Large Electric Systems, Paris, France, 21–26 August 2016; pp. 1–9. [Google Scholar]
- Hashmi, M.; Hänninen, S.; Mäki, K. Survey of smart grid concepts, architectures, and technological demonstrations worldwide. In Proceedings of the 2011 IEEE PES Conference on Innovative Smart Grid Technologies (ISGT Latin America), Medellin, Colombia, 19–21 October 2011; pp. 1–7. [Google Scholar]
- Richard, E.B. Impact of smart grid on distribution system design. In Proceedings of the 2008 IEEE Power and Energy Society General Meeting-Conversion and Delivery of Electrical Energy in the 21st Century, Pittsburgh, PA, USA, 20–24 July 2008; pp. 1–4. [Google Scholar]
- Siano, P. Demand response and smart grids—A survey. Renew. Sustain. Energy Rev. 2014, 30, 461–478. [Google Scholar] [CrossRef]
- Ancillotti, E.; Bruno, R.; Conti, M. The role of communication systems in smart grids: Architectures, technical solutions and research challenges. Comput. Commun. 2013, 36, 1665–1697. [Google Scholar] [CrossRef]
- Zubia, I.; Arrambide, I.; Azurza, O.; García, P.M.; Ugartemendia, J.J. Rural smart grids: planning, operation and control review. Renew. Energy Power Qual. J. 2013, 11, 1099–1104. [Google Scholar] [CrossRef]
- Gungor, V.C.; Sahin, D.; Kocak, T.; Ergut, S.; Buccella, C.; Cecati, C.; Hancke, G.P. Smart grid technologies: communication technologies and standards. IEEE Trans. Ind. Inform. 2011, 7, 529–539. [Google Scholar] [CrossRef]
- Micangeli, A.; Del-Citto, R.; Kiva, I.N.; Santori, S.G.; Gambino, V.; Kiplagat, J.; Vigan’o, D.; Fioriti, D.; Poli, D. Energy Production Analysis and Optimization of Mini-Grid in Remote Areas: The Case Study of Habaswein, Kenya. Energies 2017, 10, 2041. [Google Scholar] [CrossRef]
- Girbau-Llistuella, F.; Sumper, A.; Heredero-Peris, D.; Pagès-Giménez, M.; Chillón-Antón, C.; Vidal-Clos, J.A.; Díaz-González, F.; Gallart-Fernández, R. Demonstration and experience of the smart rural grid project. In Proceedings of the 2016 IEEE PES Innovative Smart Grid Technologies Conference Europe (ISGT-Europe), Ljubljana, Slovenia, 9–12 October 2016; pp. 1–6. [Google Scholar]
- Hamidi, V.; Smith, K.S.; Wilson, R.C. Smart grid technology review within the transmission and distribution sector. In Proceedings of the 2010 IEEE PES Innovative Smart Grid Technologies Conference Europe (ISGT Europe), Gothenberg, Sweden, 11–13 October 2010; pp. 1–8. [Google Scholar]
- Smart Rural Grid, Smart Rural Means ... Cachign the Future Bringing Ubran Electricity Quality to Rural Areas. Available online: http://smartruralgrid.eu (accessed on 30 May 2016).
- El-Khattam, W.; Salama, M.M.A. Distributed generation technologies, definitions and benefits. Electr. Power Syst. Res. 2004, 71, 119–128. [Google Scholar] [CrossRef]
- Girbau-Llistuella, F.; Sumper, A.; Gallart-Fernández, R.; Buehner, V. Operation of rural distribution grids with intermittent generation in connected and island mode using the open source EMS solver SCIP. In Proceedings of the 2015 International Conference on Renewable Energy Research and Applications (ICRERA), Palermo, Italy, 22–25 November 2015; pp. 983–988. [Google Scholar]
- Girbau-LListuella, F.; Díaz-González, F.; Sumper, A. Optimization of the Operation of Smart Rural Grids through a Novel Energy Management System. Energies 2017, 11, 9. [Google Scholar] [CrossRef]
- Girbau-LListuella, F.; Sumper, A.; Díaz-González, F.; Sudrià-Andreu, A.; Gallart-Fernández, R. Local performance of the Smart Rural Grid through the Local Energy Management System. In Proceedings of the 2017 International Conference on Modern Power Systems (MPS), Cluj-Napoca, Romania, 6–9 June 2017. [Google Scholar]
- Ackermann, T.; Andersson, G.; Söder, L. Distributed generation: a definition. Electr. Power Syst. Res. 2001, 57, 195–204. [Google Scholar] [CrossRef]
- Saint, B. Rural distribution system planning using smart grid technologies. In Proceedings of the 2009. REPC’09 IEEE Rural Electric Power Conference, Fort Collins, CO, USA, 26–29 April 2009; pp. B3-1–B3-8. [Google Scholar]
- Puret, C. MV Public Distribution Networks throughout the World. Available online: http://www.studiecd.dk/cahiers_techniques/MV_public_distribution_networks.pdf (accessed on 6 July 2016).
- Gao, J.; Xiao, Y.; Liu, J.; Liang, W.; Chen, C.L.P. A survey of communication/networking in smart grids. Future Gener. Comput. Syst. 2012, 28, 391–404. [Google Scholar] [CrossRef]
- Estabanell Energia, els Orígens D’estabanell Energia. Available online: https://www.estabanell.cat/corporativa/origens/ (accessed on 15 May 2016).
- General Cable. Announcements and Price Sheets. Available online: https://www.generalcable.com/na/us-can/information-center/pricing-information/price-announcements-price-sheets (accessed on 21 March 2018).
- Smart Rural Grid, Archive|Project Deliverables. Available online: http://smartruralgrid.eu/archive_category/project-deliverables/ (accessed on 10 April 2016).
- Ministerio de Ciencia y Tecnologia. Reglamento ElectrotéCnico Para Baja Tensión; Real Decreto 842/2002, de 2 de Agosto 2002, BOE Núm. 224; Ministerio de Ciencia y Tecnologia: Palma de Mallorca, Spain, 2002. [Google Scholar]
- Branker, K.; Pathak, M.J.M.; Pearce, J.M. A review of solar photovoltaic levelized cost of electricity. Renew. Sustain. Energy Rev. 2011, 15, 4470–4482. [Google Scholar] [CrossRef]
- Bielchev, I.; Richter, M.; Banka, M.; Trojan, P.; Styczynski, Z.A.; Naumann, A.; Komarnicki, P. Dynamic distribution grid management through the coordination of decentralized power units. In Proceedings of the IEEE Power and Energy Society General Meeting, Denver, CO, USA, 26–30 July 2015; pp. 1–5. [Google Scholar]
- Girbau-Llistuella, F.; Rodriguez-Bernuz, J.M.; Prieto-Araujo, E.; Sumper, A. Experimental validation of a single phase intelligent power router. In Proceedings of the 2014 IEEE PES Innovative Smart Grid Technologies Conference Europe (ISGT-Europe), Istanbul, Turkey, 12–15 October 2014; pp. 1–6. [Google Scholar]
- Rodriguez-Bernuz, J.M.; Prieto-Araujo, E.; Girbau-Llistuella, F.; Sumper, A.; Villafafila-Robles, R.; Vidal-Clos, J.A. Experimental validation of a single phase intelligent power router. Grids Netw. Sustain. Energy 2015, 4, 1–15. [Google Scholar] [CrossRef]
- Heredero-Peris, D.; Pagès-Giménez, M.; Montesinos-Miracle, D. Inverter design for four-wire microgrids. In Proceedings of the 2015 17th European Conference on Power Electronics and Applications (EPE’15 ECCE-Europe), Geneva, Switzerland, 8–10 September 2015; pp. 1–10. [Google Scholar]
- Heredero-Peris, D.; Chill’on-Ant’on, C.; Gross, G.I.; Montesinos-Miracle, D. Grid-connected to/from off-grid transference for micro-grid inverters. In Proceedings of the PCIM 2013-International Exhibition & Conference for Power Electronics, Intelligent Motion, Power Quality, Nuremberg, Germany, 14–16 May 2013; pp. 1629–2636. [Google Scholar]
- Heredero-Peris, D.; Chill’on-Ant’on, C.; Gross, G.I.; Montesinos-Miracle, D. Implementation of grid-connected to/from off-grid transference for micro-grid inverters. In Proceedings of the IECON 2013 39th Annual Conference of the IEEE Industrial Electronics Society, Vienna, Austria, 10–13 November 2013; pp. 840–845. [Google Scholar]
- Nuaymi, L. WiMAX: Technology for Broadband Wireless Access; John Wiley & Sons: Chichester, UK, 2007. [Google Scholar]
- Andrews, J.G.; Ghosh, A.; Muhamed, R. Fundamentals of WiMAX: Understanding Broadband Wireless Networking; Pearson Education: London, UK, 2007. [Google Scholar]
- Pavlidou, N.; Vinck, A.J.H.; Yazdani, J.; Honary, B. Power line communications: state of the art and future trends. IEEE Commun. Mag. 2003, 41, 34–40. [Google Scholar] [CrossRef]
- Halonen, T.; Romero, J.; Melero, J. GSM, GPRS and EDGE Performance: Evolution towards 3G/UMTS; John Wiley & Sons: Chichester, UK, 2004. [Google Scholar]
- International Electrotechnical Commission. Part 5-104: Transmission Protocols—Network Access for IEC 60870-5-101 Using Standard Transport Profiles, 2nd ed.; IEC 60870-5-104:2006(E); International Electrotechnical Commission: Geneva, Switzerland, 2006. [Google Scholar]
- Naumann, A.; Bielchev, I.; Voropai, N.; Styczynski, Z. Smart grid automation using IEC 61850 and CIM standards. Control Eng. Pract. 2014, 25, 102–111. [Google Scholar] [CrossRef]
- Díaz-González, F.; Sumper, A.; Gomis-Bellmunt, O.; Villafáfila-Robles, R. A review of energy storage technologies for wind power applications. Renew. Sustain. Energy Rev. 2012, 16, 2154–2171. [Google Scholar] [CrossRef]
- Resch, M.; Bühler, J.; Klausen, M.; Sumper, A. Impact of operation strategies of large scale battery systems on distribution grid planning in Germany. Renew. Sustain. Energy Rev. 2017, 74, 1042–1063. [Google Scholar] [CrossRef]
- Kassing, P.; Sumper, A.; Muller, T.; Heiswolf, M. Battery storage systems feasibility study for revenue models in Germany. In Proceedings of the International Conference on Modern Power Systems (MPS), Cluj-Napoca, Romania, 6–9 June 2017; pp. 1–5. [Google Scholar]
- Díaz-González, F.; Sumper, A. Implicaciones en los modelos de negocio. In El Almacenamiento de Energía en la DistribucióN EléCtrica del Futuro; Gómez-Expósito, A., Sudrià-Andreu, A., Eds.; Grafilia, S.L.: Madrid, Spain, 2017. [Google Scholar]
- Barrett, D.J.; Silverman, R.E. SSH: The Secure Shell. The Definitive Guide. Available online: https://docstore.mik.ua/orelly/networking_2ndEd/ssh/index.htm (accessed on 28 March 2018).
- European Commission, Joint Research Centre. Institute for Energy, Renewable Energy Unit. Available online: http://re.jrc.ec.europa.eu/pvgis/ (accessed on 5 May 2016).
- European Standard EN 50160. Voltage Characteristics of Electricity Supplied by Public Distribution Systems; Low Voltage Directive; BSI: London, UK, 2015. [Google Scholar]


| Network Architecture Requirements | Solution Adopted |
|---|---|
| Addressing | Via IP version 4 with private addresses |
| Quality of service | Traffic segmentation via VPNs |
| Topology discovery and routing | Route creation via RIP |
| Cybersecurity | Though VPNs with IP security and RADIUS protocol authentication |
| Network management | With SolarWinds platform via SNMP |
| Time synchronism | Through IEC-60870-5-104 master |
| Application | Involved Technologies | Stakeholders | Description |
|---|---|---|---|
| Power quality improvement | IDPR (back-up resource) | DSO | Fulfilment of stardards related to power quality in LV grids through power electronics. |
| Integration of DG (e.g., self consumption) | IDPR with BESS; GEMS and LEMS (new management agents); telecommunication network | DSO; final grid users | New technologies ensure the proper operation of the network under both grid connected and isolated modes. |
| Optimal power distribution | IDPR with BESS; GEMS and LEMS; telecommunication network | DSO | Optimal power dispatch of controllable resources permits the DSO to minimize distribution power losses. |
| Promotion of electrical vehicles | IDPR with BESS | DSO; final grid users | Power electronics and distributed storage facilitate the integration of electrical vehicle charging facilities into LV grids. |
| Grid ancillary services (e.g., voltage control) | IDPR | DSO | Power electronics can manage reactive power for voltage control. |
| Grid ancillary services (e.g., frequency control) | IDPR with BESS; LEMS; telecommunication network | Transmission System Operator and DSO interaction | Power electronics can manage active power for frequency control. |
| Continuity of supply | IDPR with BESS; protection and monitoring devices; LEMS; telecommunication network | DSO | Islanded operation reduces the time final users may be affected by planned eventual (either planned or unplanned) mains failures. In addition, protection and monitoring devices permit the detection and isolation of grid faults. |
| Grid congestion alleviation | IDPR with BESS; GEMS and LEMS; telecommunication network; monitoring devices | DSO | New technologies ensure permit to maintain peak power flows through distribution infrastructure within admissible levels. |
| Grid update deferral | IDPR with BESS; GEMS and LEMS; telecommunication network; monitoring devices | DSO | New technologies extend the lifespan of aged infrastructure respecting electrical standards. |
| Links between Sectors | Operationality | Circumstances | ||||
|---|---|---|---|---|---|---|
| EG-S1 | S1-S2 | S2-S3 | S1 | S2 | S3 | |
| C | C | C | O | O | O | C1 |
| C | C | D | O | O | N | C1 + C3 |
| C | D | D | O | N | N | C1 + C3 |
| D | C | C | O | O | O | C2 |
| D | C | D | O | O | O | C2 |
| D | D | C | O | O | O | C2 |
| D | C | D | O | O | N | C2 + C3 |
| D | D | C | N | O | O | C2 + C3 |
| D | D | D | O | N | O | C2 + C3 |
| D | D | D | O | N | N | C2 + C3 |
| D | D | D | N | N | O | C2 + C3 |
| C | C | D | O | O | O | C1 + C2 |
| C | D | C | O | O | O | C1 + C2 |
| C | D | D | O | N | O | C1 + C2 + C3 |
| GEMS | LEMS | |
|---|---|---|
| C1 | • Generates the consumption and generation forecasts for the whole system. • Executes the global economic optimization, function of the global market aspects, availability and cost of DGs and back-up resources. • Executes the global OPF, function of the global economic optimization setpoints and network features. • Provides the global setpoints file for the following 24 h, in time steps of 15 min. | • Adjusts the global setpoints on a one-minute basis while considering other technical eventualities • Provides the adjusted global setpoints to the DGs and back-up resources. |
| C2 | • Generates the consumption and generation forecasts for the PN. • Provides the forecast file for the following 24 h, in time steps of 15 min. | • Executes the local economic optimization, function of the local market, availability and cost of DGs and back-up resources. • Executes the local economic optimization, function of the local market, availability and cost of DGs and back-up resources. • Provides the local setpoints to DGs and back-up resources. |
| Scenario: Interaction | Actions | Result | Detection Time |
|---|---|---|---|
| 01: GEMS to SCADA | • GEMS: It is responsible for detecting the communication failure, but it continues calculating the global setpoints (only in C1) and doing forecasts without the SCADA updated data. It tries to exchange the information with the SCADA via SFTP again. • SCADA: It is responsible for detecting the communication failure and notifying all downstream devices (LC, TCs and LEMS). It updates the corresponding error register and displays a warning message on the operator console. It tries to exchange the information with the GEMS via SFTP again. It continues communicating with the LC but stops the information transfer to the LEMS. • LEMS: It continues adjusting and sending setpoints to IDPRs/DGs until it finishes the last global setpoints provided by the GEMS via SCADA and after that, it will send null setpoints to IDPRs and no setpoints to DGs in C1. Conversely, it continues calculating and sending the setpoints to IDPRs/DGs until it finishes the last forecast provided by the GEMS, and after that, it applies the rule based disconnected operation in order to guarantee the supply in C2. • LC/TCs/IDPRs: They continue operating as usual. | The PN operates with the non-updated or without setpoints in C1, or with the calculated setpoints based on a local optimization (if there is an available forecast) or by predefined rules, in C2. Therefore the PN performance may not be optimal. Note that there is no problem in C3. | 15 min |
| 02: SCADA to LC | • SCADA: It is responsible for detecting the communication failure and notifying the upstream device (GEMS). It updates the corresponding error register and displays a warning message on the operator console. It continues exchanging information with the GEMS and LEMS, and tries to communicate with the LC via IEC-60870-5-104 protocol again. • LC: It is responsible for detecting the communication failure and notifying all downstream devices (TCs and LEMS), and updates the corresponding error register. LC refuses any change in the grid configuration and operation. • GEMS/LEMS/TCs/IDPRs: They continue operating as usual. | There is an external loss of control and information over PN. The PN performance may not be optimal because of the GEMS does not have the LC updated data. Note that in this case it is not possible to start up or reconfigure the network in C3. | 3 min |
| 03: SCADA to LEMS | • SCADA: It is responsible for detecting the communication failure and notifying the upstream device (GEMS), updates the corresponding error register and displays a warning message on the operator console. It continues exchanging information with the GEMS and the LC, and tries to transfer the information to the LEMS via SFTP again. • LEMS: It is responsible for detecting the communication failure. In C1, it continues adjusting the last global setpoints provided by the GEMS and sending them to IDPRs/DGs until there are global setpoints, and, after that, it will send null setpoints to IDPRs and no setpoints to DGs. Conversely, in C2, it continues calculating until it finishes the last forecast provided by the GEMS, and sending then to IDPRs/DGs, and after that, the LEMS will apply the rule based disconnected operation in order to guarantee the continuity of the supply. • GEMS/LC/TCs/IDPRs: They continue operating as usual. | The PN operates with the non-updated or without setpoints in C1, or with the calculated setpoints based on a local optimization (if there is an available forecast) or by predefined rules, in C2. Therefore, the PN performance may not be optimal. Note that there is no problem in C3. | 15 min |
| Scenario: Interaction | Actions | Result | Detection Time |
|---|---|---|---|
| 04: LC to LEMS | • LC: It is responsible for detecting the communication failure and notifying all upstream and downstream devices (GEMS, SCADA and TCs) and updates the corresponding error register. In such circumstances, it imposes null power and the last voltage and frequency setpoints to IDPRs, and no setpoints to DGs. It also send null setpoints to the auxiliary diesel generator. • SCADA: It continues operating without any change expect that it displays a warning message on its operator console. • GEMS: It continues operating as usual and assumes that the LC has performed control actions for IDPRs, DGs and GS. • LEMS: It is responsible for identifying the communication failure and updates the corresponding error register. It assumes that the LC has performed control actions for IDPRs, DGs and GS. It tries to transfer the setpoints to IDPRs/DGs and to read the information from the LC via Modbus again. • TCs/IDPRs: They continue operating as usual. | The PN operates with the predefined setpoints. Therefore, the PN performance may not be optimal. Note that there is no problem in C3. | 1 min |
| 05: LC to TC | • LC: It is responsible for detecting the communication failure and notifying all upstream devices (GEMS, SCADA and LEMS), and updates the corresponding error register. The LC refuses any change in the grid configuration and operation from the SCADA that has a direct impact on this TC. The LC tries also to communicate with this TC via IEC-60870-5-104 protocol again. • GEMS/LEMS: They continue operating as usual and assume that the TC has performed control actions for IDPRs, DGs and GS. • SCADA: It continues operating as usual and it displays a warning message on its operator console. • TC: It is responsible for detecting the communication failure and updating the corresponding error register. In such circumstances, it imposes null power and the last voltage and frequency setpoints to IDPRs, and no setpoints to DGs. It also sends null setpoints to the auxiliary diesel generator. • IDPRs: They continue operating as usual. | The PN operates with the predefined setpoints. Therefore, the PN performance may not be optimal because the TC updated uncompleted data. Note that in this case it is not possible to start up or reconfigure the affected part of the network in C3. | 3 min |
| 06: TC to IDPR | • TC: It is responsible for detecting the communication failure and notifying all upstream devices (LC, LEMS, SCADA and GEMS), and updates the corresponding error register. The TC tries also to communicate with IDPRs via Modbus RTU again. • GEMS/LEMS: They continue operating as usual and assume that the IDPRs are not available for the network operation and that they operate with null power and the last voltage and frequency setpoints. • SCADA: It continues operating as usual and displays a warning message on its operator console. • IDPR: It is responsible for detecting the communication failure, it self-imposes null power and the last voltage and frequency setpoints. • LC: It continues operating as usual. | The PN operates without the IDPR power management capabilities. Therefore, the network performance may not be optimal. | 1 min |
| 07: TC to GS | • TC: It is responsible for detecting the communication failure and notifying all upstream devices (LC, LEMS, SCADA and GEMS), and updates the corresponding error register. The TC blocks any setpoint to GS and tries also to communicate with this GS via Modbus RTU again. • GEMS/LEMS: They continue operating as usual and assume this GS is not available for the network operation. • SCADA: It continues operating as usual and displays a warning message on its operator console. • LC: It continues operating as usual. | There is only a loss of control and information over the auxiliary diesel generator. Note that the auxiliary diesel generator must detect that no setpoints arrives and turns off itself automatically. | 3 min |
| Scenario: Interaction | Actions | Result | Detection Time |
|---|---|---|---|
| 08: TC to EMU | • TC: It is responsible for detecting the communication failure and notifying all upstream devices (LC, LEMS, SCADA and GEMS), and updates the corresponding error register. TC refuses any change in the grid configuration and operation. • GEMS/LEMS: They continue operating as usual assuming that there is a loss of information. • SCADA: It continues operating as usual and displays a warning message on its operator console. • LC/IDPRs: They continue operating as usual. | There is a loss of information. Therefore, the network performance may not be optimal. Note that in this case it is not possible to start up or reconfigure the affected part of the network in C3. | 3 min |
| 09: TC to ASD | • TC: It is responsible for detecting the communication failure and notifying all upstream devices (LC, LEMS, SCADA and GEMS), and updates the corresponding error register. TC refuses any change in the grid configuration and operation. • GEMS/LEMS: They continue operating as usual and they consider the state of the automatic switch-disconnector is the same as before. • SCADA: It continues operating as usual and displays a warning message on its operator console. • LC/IDPRs: They continue operating as usual. | There is a loss of control and information over automated switch-disconnectors. Note that in this case it is not possible to start up or reconfigure the affected part of the network in C3. | 3 min |
| 10: TC and EPS | • TC: It is responsible for detecting the communication failure and notifying all upstream devices (LC, LEMS, SCADA and GEMS), and updates the corresponding error register. TC refuses any change in the grid configuration and operation. • GEMS/LEMS: They continue operating as usual and consider that the state of the electrical power switch is the same as before. • SCADA: It continues operating as usual and it displays a warning message on its operator console. • LC/IDPRs: They continue operating as usual. | There is a loss of control and information over electrical power switches. Note that in this case it is not possible to start up or reconfigure the affected part of the network in C3. | 3 min |
| 11: TC and DG | • TC: It is responsible for detecting the communication failure and notifying all upstream devices (LC, LEMS, SCADA and GEMS), and updates the corresponding error register. • GEMS/LEMS: They continue operating as usual assuming that there is a loss of control and information over this DG. • SCADA: It continues operating as usual and displays a warning message on its operator console. • LC/IDPRs: They continue operating as usual. | There is a loss of control and information over distributed generation. Therefore, the network performance may not be optimal. Note that there is no problem in C3. | 15 min |
| 12: IDPR and BESS | • IDPR: It is responsible for identifying the communication failure and notifying all upstream devices, opens the DC main switch thus isolating the battery. It also ignores the active power setpoints and reenergising commands. • GEMS/LEMS: They continue operating as usual assuming that IDPR is not able to provide active power capabilities or energise the grid. • SCADA: It continues operating as usual and displays a warning message on its operator console. • LC/TCs: They continue operating as usual. | The PN operates without IDPR active power capabilities. In C2, the PN may be switch off as a consequence of loss of the IDPR which is energising the island. Therefore, the network performance may not be optimal. Note that in C3 it is not possible to start up the affected part of the network with the IDPR. | 100 ms |
| Parameter | Scenario | Phase A | Phase B | Phase C |
|---|---|---|---|---|
| Voltage | (1) | 137.38 V | 137.60 V | 135.75 V |
| (2) | 137.54 V | 137.96 V | 135.97 V | |
| (3) | 138.10 V | 137.14 V | 136.48 V | |
| (4) | 140.05 V | 140.54 V | 138.32 V | |
| Current | (1) | 19.25 A | 21.31 A | 19.87 A |
| (2) | 18.51 A | 20.55 A | 18.07 A | |
| (3) | 19.32 A | 25.25 A | 9.95 A | |
| (4) | 31.78 A | 32.20 A | 30.64 A |
| Parameter | IDPR Contribution | Phase A | Phase B | Phase C |
|---|---|---|---|---|
| THD of voltage | No contributing | 1.66% | 2.52% | 2.09% |
| Contributing | 1.46% | 1.50% | 1.50% | |
| THD of current | No contributing | 12.42% | 17.09% | 15.83% |
| Contributing | 6.44% | 6.54% | 6.77% | |
| Power factor | No contributing | 0.9949 | 0.8380 | 0.6005 |
| Contributing | 0.9999 | 0.9982 | 0.9910 | |
| Degree of unbalance | No contributing | 35.5% | 46.3% | 18.2% |
| Contributing | 33.6% | 34.0% | 32.4% |
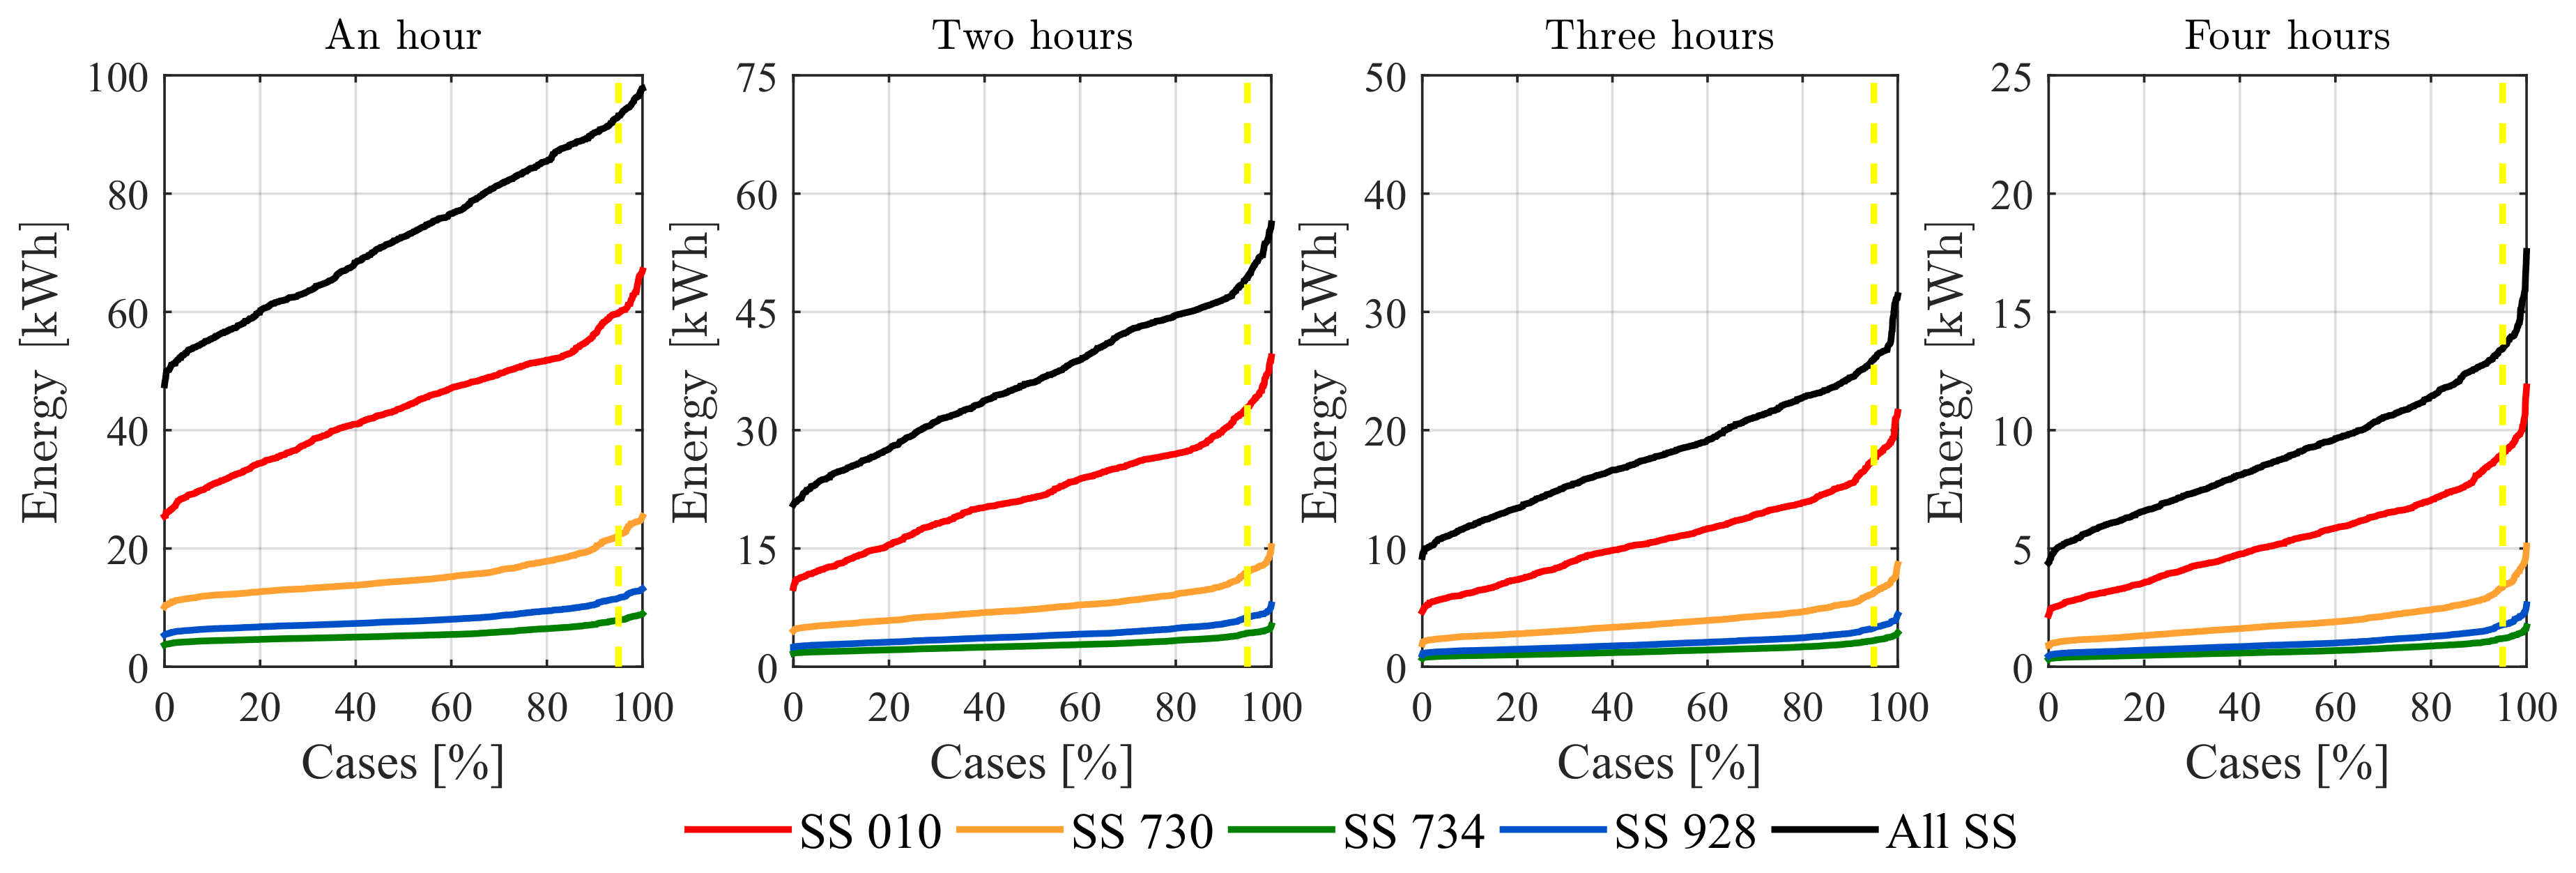
| SS | An Hour | Two Hours | Three Hours | Four Hours |
|---|---|---|---|---|
| SS 010 (S1) | 9.91 kWh | 19.39 kWh | 36.21 kWh | 65.81 kWh |
| SS 730 | 3.35 kWh | 6.26 kWh | 12.05 kWh | 22.19 kWh |
| SS 734 | 1.19 kWh | 2.21 kWh | 4.37 kWh | 7.85 kWh |
| SS 928 (S3) | 1.77 kWh | 3.26 kWh | 6.28 kWh | 11.61 kWh |
| S1 + S2 | 11.99 kWh | 23.10 kWh | 43.47 kWh | 79.30 kWh |
| S2 + S3 | 4.74 kWh | 8.73 kWh | 16.84 kWh | 31.08 kWh |
| S1 + S2 + S3 (all SS) | 13.75 kWh | 26.36 kWh | 49.76 kWh | 90.91 kWh |
© 2018 by the authors. Licensee MDPI, Basel, Switzerland. This article is an open access article distributed under the terms and conditions of the Creative Commons Attribution (CC BY) license (http://creativecommons.org/licenses/by/4.0/).
Share and Cite
Girbau-Llistuella, F.; Díaz-González, F.; Sumper, A.; Gallart-Fernández, R.; Heredero-Peris, D. Smart Grid Architecture for Rural Distribution Networks: Application to a Spanish Pilot Network. Energies 2018, 11, 844. https://doi.org/10.3390/en11040844
Girbau-Llistuella F, Díaz-González F, Sumper A, Gallart-Fernández R, Heredero-Peris D. Smart Grid Architecture for Rural Distribution Networks: Application to a Spanish Pilot Network. Energies. 2018; 11(4):844. https://doi.org/10.3390/en11040844
Chicago/Turabian StyleGirbau-Llistuella, Francesc, Francisco Díaz-González, Andreas Sumper, Ramon Gallart-Fernández, and Daniel Heredero-Peris. 2018. "Smart Grid Architecture for Rural Distribution Networks: Application to a Spanish Pilot Network" Energies 11, no. 4: 844. https://doi.org/10.3390/en11040844