Article

Space Plasma Distribution Effect of Short-Circuit Arc on Generation of Secondary Arc

1
School of Electrical and Electronic Engineering, North China Electric Power University, Beijing 102206, China
2
State Grid Beijing Urban District Power Supply Company, Beijing 100037, China
*
Author to whom correspondence should be addressed.
Energies 2018, 11(4), 828; https://doi.org/10.3390/en11040828
Submission received: 12 March 2018 / Revised: 29 March 2018 / Accepted: 1 April 2018 / Published: 3 April 2018

Abstract

:
Secondary arc is more severe in the ultra-high voltage (UHV) power grid. However, the mechanism for the generation process of secondary arc at the extinction moment of a short-circuit arc is not yet clear. It is of great theoretical significance and technological application value to study the generation mechanism and dynamic physical characteristics of secondary arc, and further to develop effective suppression technology. In this article, an arc numerical simulation model based on the coefficient partial differential equations combining with classical drift-diffusion model was established, and the implementation method based on the finite element software COMSOL (COMSOL Multiphysics 5.2a, COMSOL Inc., Stockholm, Sweden) was given. Then, the transient analysis method was applied to simulate the generation, diffusion and dissipation phenomena of the short-circuit arc strike, and further to explore the electric field, microscopic particle spatial distribution and reaction process during the arc discharge process. The simulation results show that the development of short-circuit arc mainly includes two processes: corona discharge and arc discharge, of which the former has a very short duration and the latter is caused by short-circuit. During the discharge process, the electron density first increases and then decreases, which is different from the general characteristics of streamer discharge. Although the concentration distribution curve of the positive ions and negative ions has the same trend, there are subtle differences. The diffusion effect of space ions in the initial discharge stage is almost zero, while radial diffusion direction in the peak discharge stage and axial direction in the late discharge stage. The electric field intensity in space has an S-shaped upward trend during discharge. The time relationship of the ion source generated by the neutralization reaction and by the short-circuit arc discharge are basically the same, and the rate of neutralization reaction is lowest near the electrode. When the ionic reaction is approaching the end of the simulation, the ionic concentration is higher than the initial level, which proves that the space ionic concentration is increased due to the short-circuit discharge, and providing the necessary environmental conditions for the subsequent generation of the secondary arc.

1. Introduction

Secondary arc is a kind of long-gap arc that can be freely burning in the air. If the secondary arc cannot be extinguished in time, it would lead to the single-phase reclosing failure. In the ultra-high voltage (UHV) power grid, the secondary arc problems are more prominent and the hazards of which are more serious. The reliable extinction of the secondary arc is very important for the successful implementation of single-phase automatic reclosing [1,2,3]. At present, a great deal of research has been carried out on the physical characteristics [4,5,6,7] and mathematical model [8,9,10,11,12] of short-circuit arc and secondary arc. Since the diameter of the short-circuit arc channel is much larger than that of the secondary arc channel, the initial position of the secondary arc in the short-circuit arc channel is random. However, the mechanism of the initial process of secondary arc after the extinction of short-circuit arc is not yet clear [6,8]. Therefore, it is necessary to further study the initial process of secondary arc after the short-circuit arc extinction.
The experimental test can provide a direct means for studying the arc physical characteristics. However, it is still difficult to analyze its intrinsic micro-physical mechanism due to the condition limitations, large investments and lack of flexibility. With the popularization and development of computer simulation technology, the numerical model of air discharge is advancing. Based on the charge density continuity equations and the partial differential equations, the hydrodynamic model can reflect air discharge processes, such as migration, diffusion, ionization, neutralization and adsorption. Therefore the air discharge process can be effectively simulated. In the study of the hydrodynamic model based on the partial differential equations, Davie and Yoshida [13] established a two-dimensional hydrodynamic model of discharge between plate electrodes, which can accurately reveal the phenomenon of discharge process. Then this model continued to be improved by GE Georghiou [14] and other scholars [15,16,17], and the simulation object was mostly limited to short-gap discharges, such as corona. The finite element method-flux corrector transport (FEM-FCT) was used for the first time to conduct numerical calculation on the streamer discharge of air gap by Georghiou and Metaxas [18] from Cambridge University, and then this method was widely applied to the calculation of fluid models [19,20,21]. The hydrodynamic model was used by Atsushi Komuro [22] to simulate the positive streamer development process between needle-plate electrodes, and the simulation results showed that the developing speed and the channel radius of streamer coincided with the experimental results. Lin Zhang [23] studied the developing characteristics of streamer with the effect of air pressure, humidity and voltage amplitude in the needle-plate air gap. As the arc simulation involves many physical processes such as electricity, heat, light, fluid and plasma, the research is complex, diverse and interdisciplinary. Therefore, a continuous numerical model based on partial differential equations is chosen to simulate arc process.
In this article, a numerical model of arc discharge process based on the finite element simulation software (COMSOL) was established to study the influence of short-circuit arc on secondary arc. The production, adsorption and neutralization phenomena of positive ions, negative ions and electrons were described by the partial differential equations and the Gauss theorem. Then the generation, diffusion and adsorption processes of short-circuit arc discharge were simulated with transient analysis, and the spatial distribution of positive ions, negative ions and electrons in the discharge process were further explored.

2. Arc Numerical Simulation Theory Model

2.1. Coefficient Partial Differential Equation and Classical Drift-Diffusion Model

The coefficient partial differential equations can effectively define the physical process covered by the first derivative and second derivative of space physical quantity in time and space. By specifying the coefficient term of the equations, the coefficient partial differential equation can be used to solve physical phenomena such as force, vibration, diffusion, field source, absorption and convection. In general, for a single space physical quantity, the coefficient partial differential equations can be written as the following equation.
e a 2 u t 2 + d a u t + ( c u α u + γ ) + β u + α u = f
where e a is the mass coefficient, d a is the damping coefficient, c is the diffusion coefficient, α is the convective coefficient of conservative field, γ is the conservative field source, β is the convection coefficient of non-conservative field, f is the external field source, u is the space ion density.
Based on the drift-diffusion model of fluid hydrodynamics, the Equations (2)–(4) are used to describe the generation, disappearance, transportation of electrons, positive ions, and negative ions, also with the space charge development [14,15,16,17].
n e t = S + n e α | v e | n e η | v e | n e n p β ( n e v e D e n e )
n p t = S + n e α | v e | n e n p β n n n p β ( n p v p )
n n t = n e η | v e | n n n p β ( n p v n )
where ne is the electron concentration, np is the positive ion concentration, nn is the negative ion concentration, t is the time, ve is the electron migration speed (vector), vp is the positive ion migration speed (vector), vn is the negative ion migration speed (vector), α is the ionization coefficient, η is the adsorption coefficient, β is the composition coefficient, D is the diffusion coefficient, S is the source item caused by ionization.

2.2. Simplified Model of the Arc Discharge Process

In the arc discharge process, combined with the general form of the partial differential Equation (1), the reignition processes of Equations (2)–(4) can be unified in the source term f of the equations. With the above assumptions, the simplified transport equation of the gas ionization process can be written as follows
N e t + ( D e N e ) + β e N e = f e
N p t + ( D p N p ) + β p N p = f p
N n t + ( D n N n ) + β n N n = f n
where N is the particle concentration, the subscript e refers to the electrons, p refers to the positive ions and n refers to the negative ions. D is the particle diffusion coefficient. In the actual air ionization process, the diffusion speed of particles in space is affected by the environmental factors such as temperature and pressure. Therefore, the higher the temperature and the greater the pressure difference is, the greater diffusion rate of the positive and negative ions. In order to simplify the computational difficulty of the model, the diffusion speed of the particles is assumed to be not affected by the temperature and the pressure. Then the diffusion coefficient Di is used to describe the diffusion process. β i = μ iE is the convection coefficient vector of particles under the Coulomb force in the electric field, in which μi is the mobility of particles. f, is the source term of the particles, which represents the net rate of particle production. The main particle reactions involved are: fion = α   N e μ eE refers to the electron-impact ionization term, fatt = η   N e μ eE indicates that the electron is adsorbed onto the electronegative molecule, such as CO2, H2O and O2, fdet = kdet N e N n refers to the electrons detached from a negative ion, fep = β ep N e N p refers to the electron and positive ion recombination process, fpn = β pn N p N n refers to the electron and negative ion recombination process, f0 refers to the ionization coefficient under background electric field. In the above expressions, α is the ionization conversion rate of the electron-impact ionization, η is the adsorption coefficient, kdet is the segregation coefficient, βij is the complex coefficient of particles with different electrical properties. Therefore, the net generation rates of electron, negative ions and positive ion can be written as
f e = f i o n + f d e t + f 0 f a t t f e p
f n = f i o n + f 0 f p n f e p
f p = f a t t f a t t f p n
As most of the reaction rates in the particle source terms are related to the electric field intensity, the Equations (5)–(7) need to be coupled with the Poisson equation to calculate the whole discharge process completely, which can be written as follows
( ε 0 ε r V ) = e ( n p n e n n )
V = E
where ε 0 is the vacuum permittivity, ε r is the relative permittivity, e is the quantity of electric charge, V is the electric potential, E is the electric field intensity (vector).
It is necessary to point out that the volume charge density on the right side of the Equation (11) would change with the discharge process in the space, resulting in the increase or decrease of the local field intensity. Then the change of the field strength would in turn affect the generation and disappearance of the local charged particles. In this way, the continuity equation and the Poisson equation are coupled to obtain the drift-diffusion model which can describe the entire discharge process.

3. Finite Element Simulation Model of Arc

3.1. Model Definition and Mesh Generation

The geometric model of the arc simulation is shown in Figure 1a. The model is simplified as a two-dimensional discharge model by axisymmetric rotation, and the whole discharge space is 1.62 m high and 0.4 m wide. The length of the insulator string (the distance between the upper and lower plates) is 1 m, and the center column radius of insulator is 0.025 m. The physical structure of ceramic insulating structure, arc-striking line, positive electrode, negative electrode and discharge area are respectively established by two-dimensional geometric entities such as Bezier curve and rectangle embedded in COMSOL. Furthermore, the above structure is meshed using free triangles. The model mesh is composed of 10,821 triangles, of which the largest mesh size is 0.06 m and the smallest is 0.01 m, as shown in Figure 1b.

3.2. Boundary Conditions Setting

3.2.1. Reaction Coefficient of Air Discharge Equation

There are more than 300 ionic reaction equations during the air discharge process. Generally speaking, even when the ionization reaction equations are simplified to the ionization phenomenon of oxygen and nitrogen there are still 27 equations, and the impact cross-section coefficient of reaction equations are affected by the parameters like pressure and temperature [16]. The collision cross-section of reaction equation is generally estimated by the Boltzmann equation or the Maxwell equations electrodynamics theory combined with basic experiments [17]. However, there are still an error of about ±10%. Once evenly distribute on each reaction equation, it would cause uncertainty in model analysis, affecting the convergence of the finite element model and the reliability of the results.
In this study, the ion categories of ionization reaction were normalized, and the PDE equation was used to describe the ion transport phenomenon during arc discharge. The constant coefficient term involved in the equation is adjusted according to the collision cross section data of ionization reaction provided by reference [24] and the convergence of the model. The acquired parameters are shown in Table 1. For the collision cross section coefficients related to the electric field intensity, such as ionization and recombination, the fitting results were obtained by fitting the cross-sectional data listed in [24], as shown in Figure 2. The reduce electric field is defined as Ered = E/N, in which N is the density of the gas molecules (in m−3) at the given atmospheric pressure and temperature.

3.2.2. Numerical Simulation of Short-Circuit Arc

As the secondary arc is triggered after the short-circuit arc, the metallic line was used to strike short-circuit arc in the experiment, and then the secondary arc was produced. Therefore in this article, an arc striking line was added into the simulation model, and the high charge density arc channel generated by the short-circuit arc combustion was simulated by setting the ion source on the arc striking line after the beginning of simulation. The particle sources are expressed by the Gauss pulse function in the following form
{ g e 2 = 1 × 10 13 g p 1 ( t ) g p 2 = 3 × 10 13 g p 1 ( t ) g n 2 = 2 × 10 13 g p 1 ( t )
where ge2 refers to the electrons, gp2 refers to the positive ions, gn2 refers to the negative ions, gp1(t) is the Gauss pulse function, of which the most appropriate value obtained by simulation for the center position is 3 × 10⁻¹⁰, and for the standard deviation is 1 × 10⁻¹⁰.

3.2.3. Initial Conditions and Boundary Conditions

Considering the sustainability of the ionic reactions and combined with the geometric structure of Figure 1, the boundary conditions used in the numerical simulation were obtained, as shown in Table 2. The symmetrical boundary condition was satisfied on the symmetry axis, and 600 kV high voltage was applied to the upper electrode. In consideration of the adsorption and neutralization, the negative ion concentration was set to zero here. Similarly, the positive ion concentration at the negative electrode surface was set to zero. The transient Gaussian pulse sources were added on the surface of the arc striking line according to Equation (10). The outer boundaries of the simulation domain during the ion transport process were defined by the open boundaries which were conceded as the zero flux boundaries, as shown in Figure 1a.

4. Space Plasma Distribution Effect of Short-Circuit Arc on Generation of Secondary Arc

The model was calculated by the PARDISO transient solver embedded in COMSOL, and the BDF algorithm control solver was used to solve the time step.

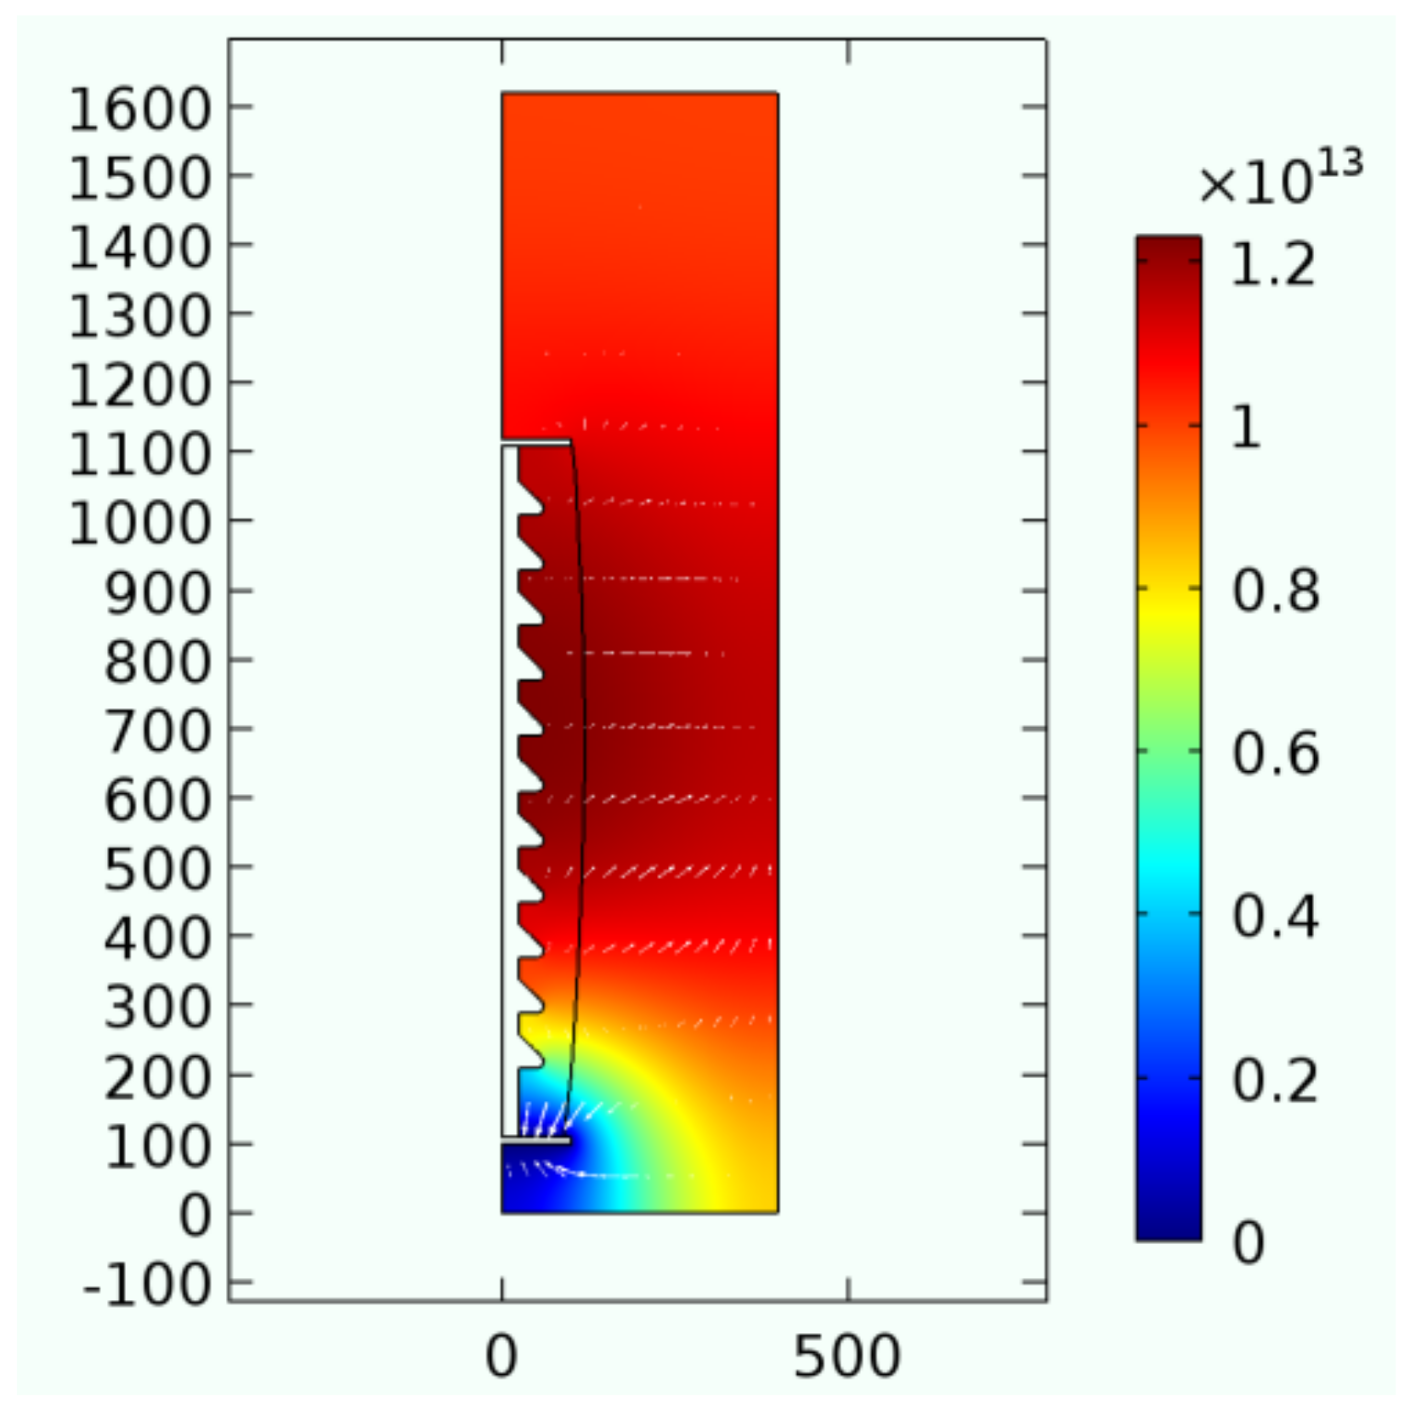
4.1. Electric Field Distribution

The steady state calculation results of the spatial electric field intensity distribution and the electric field vector during the discharge process are shown in Figure 3. According to the definition of electric field E = −∇V, the higher the intensity of the electric field, the greater the spatial change rate of the potential distribution. As can be seen in Figure 3, due to the restriction of the potential boundary conditions of the electrostatic field, the inner potential distributions of the positive electrode and the negative electrode are more uniform, so the electric field intensity distribution inside the electrode almost approaches to zero. However, due to the geometrical effect of the electrode shape, the spatial variation of the potential distribution is remarkable, resulting in a large electric field intensity in the convex portion of the positive electrode, which is the cause of the point discharge phenomenon.

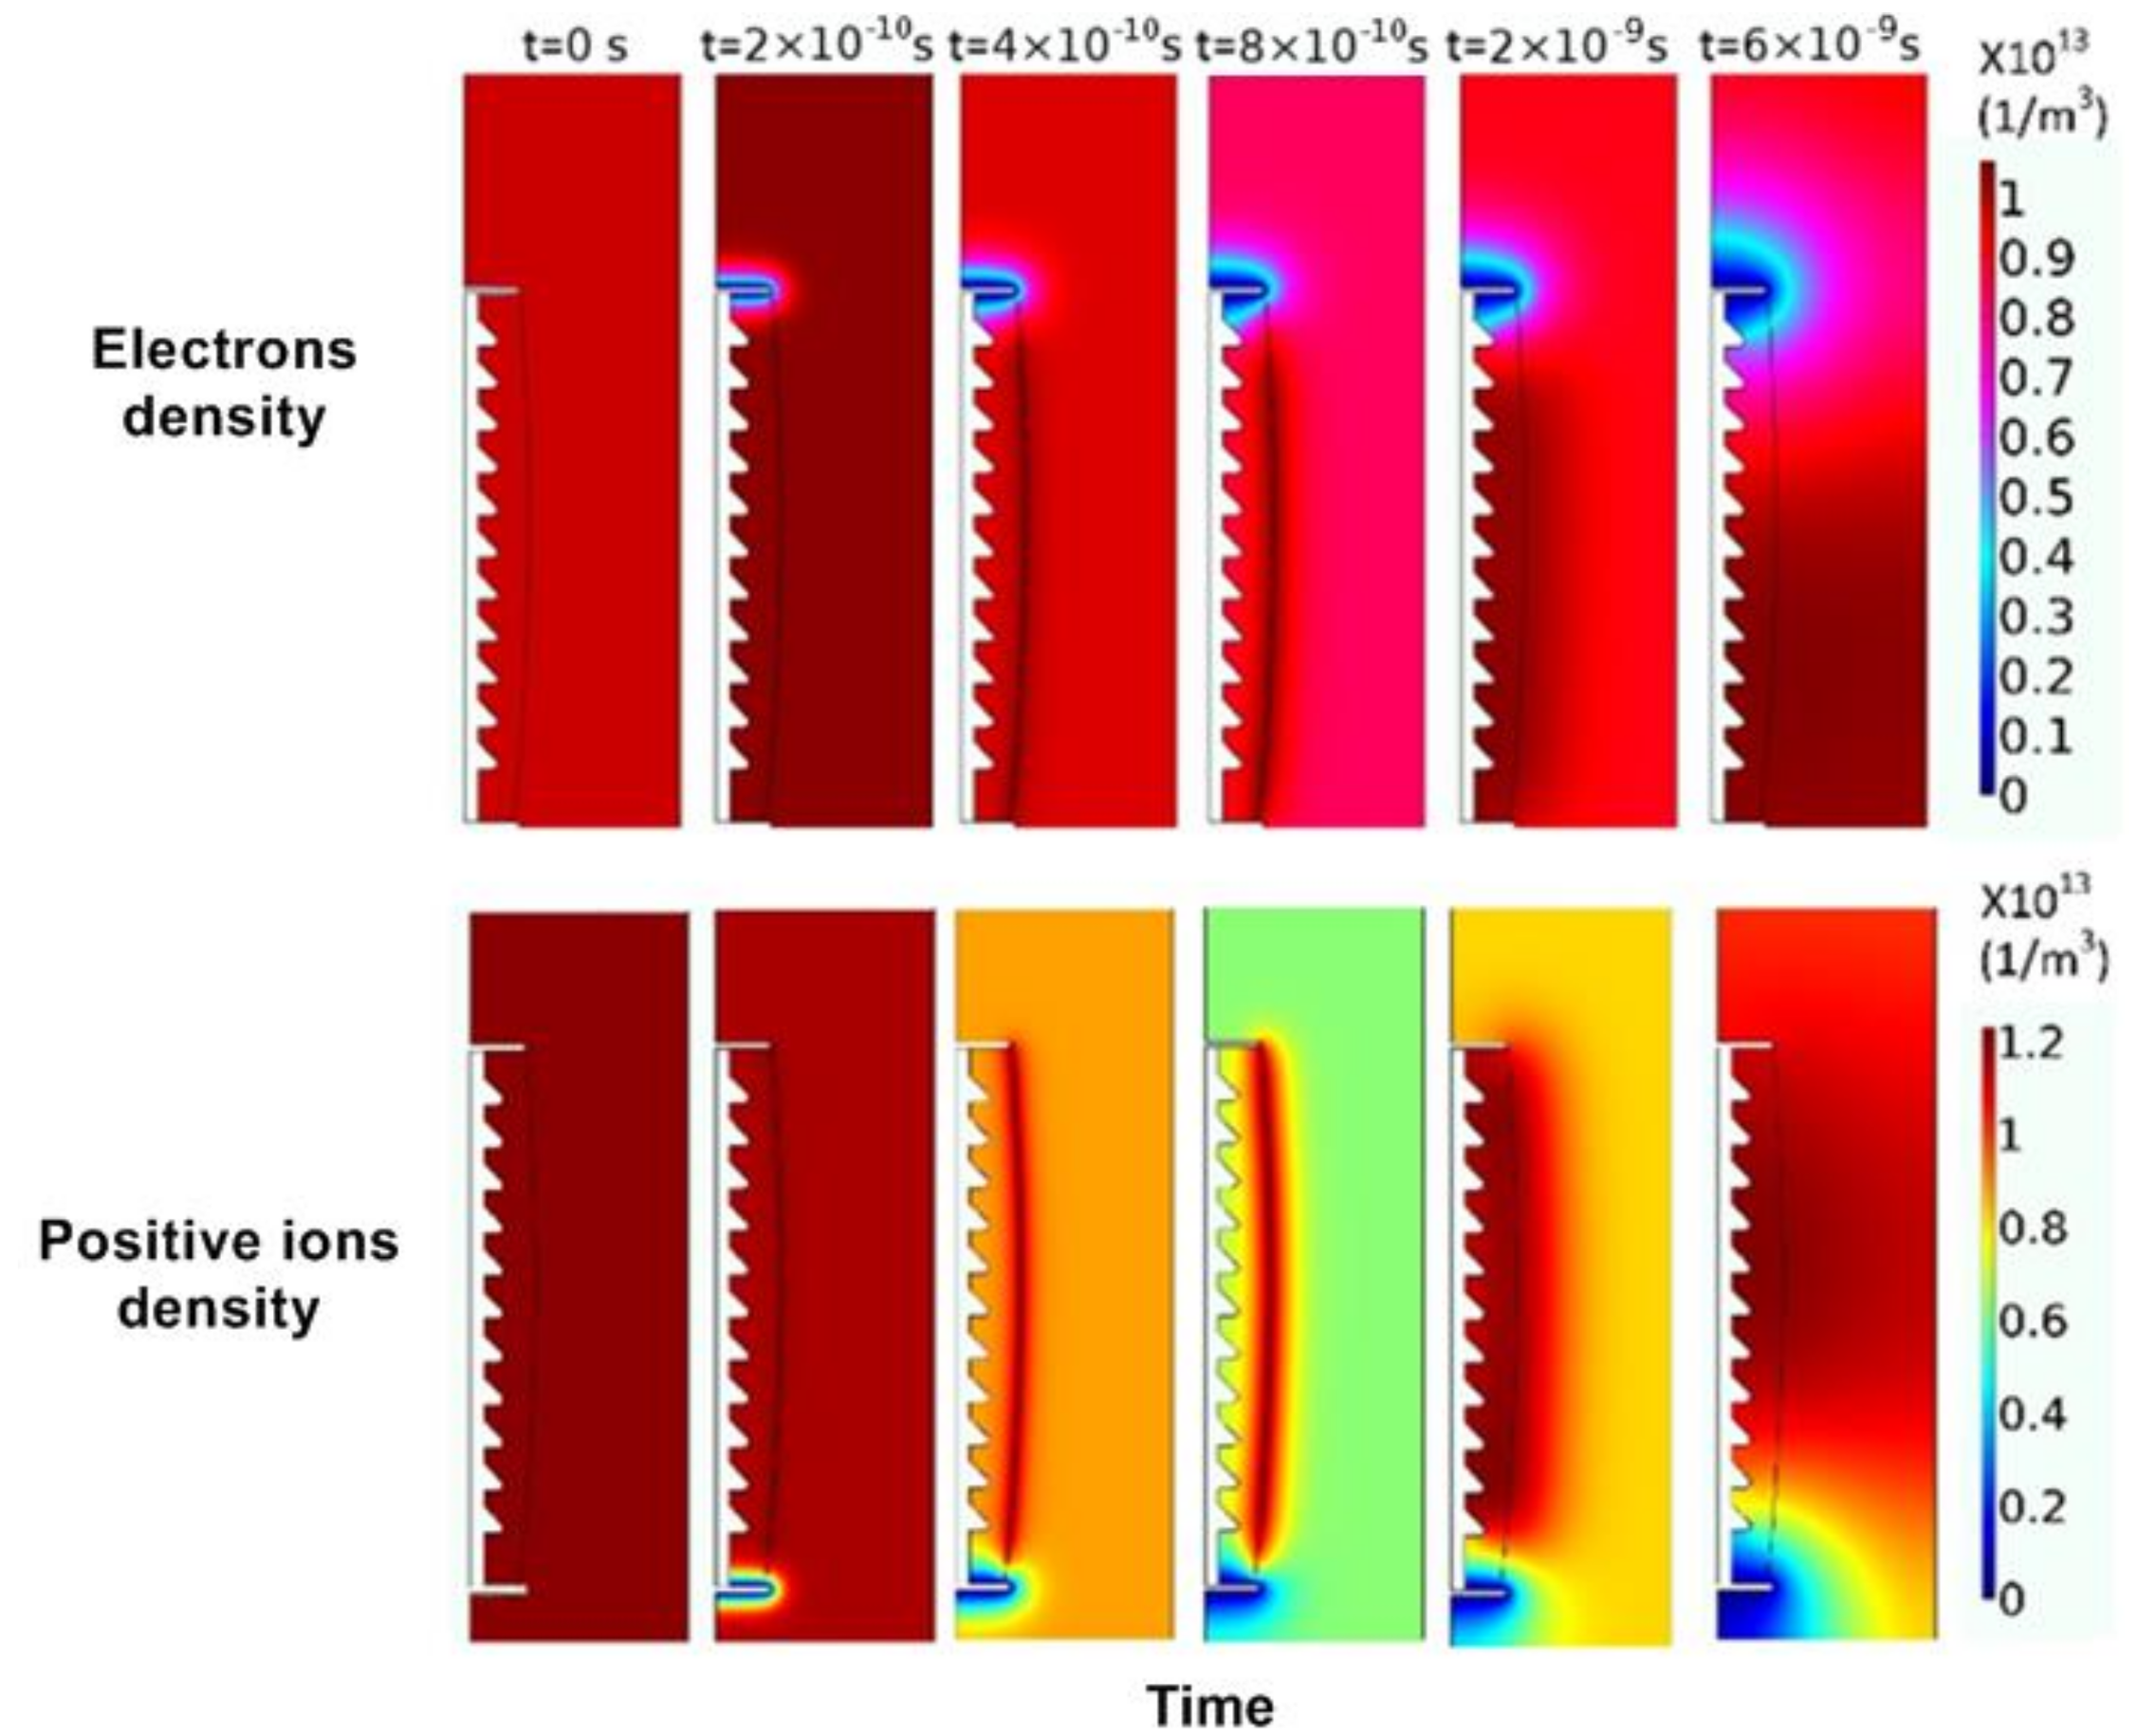
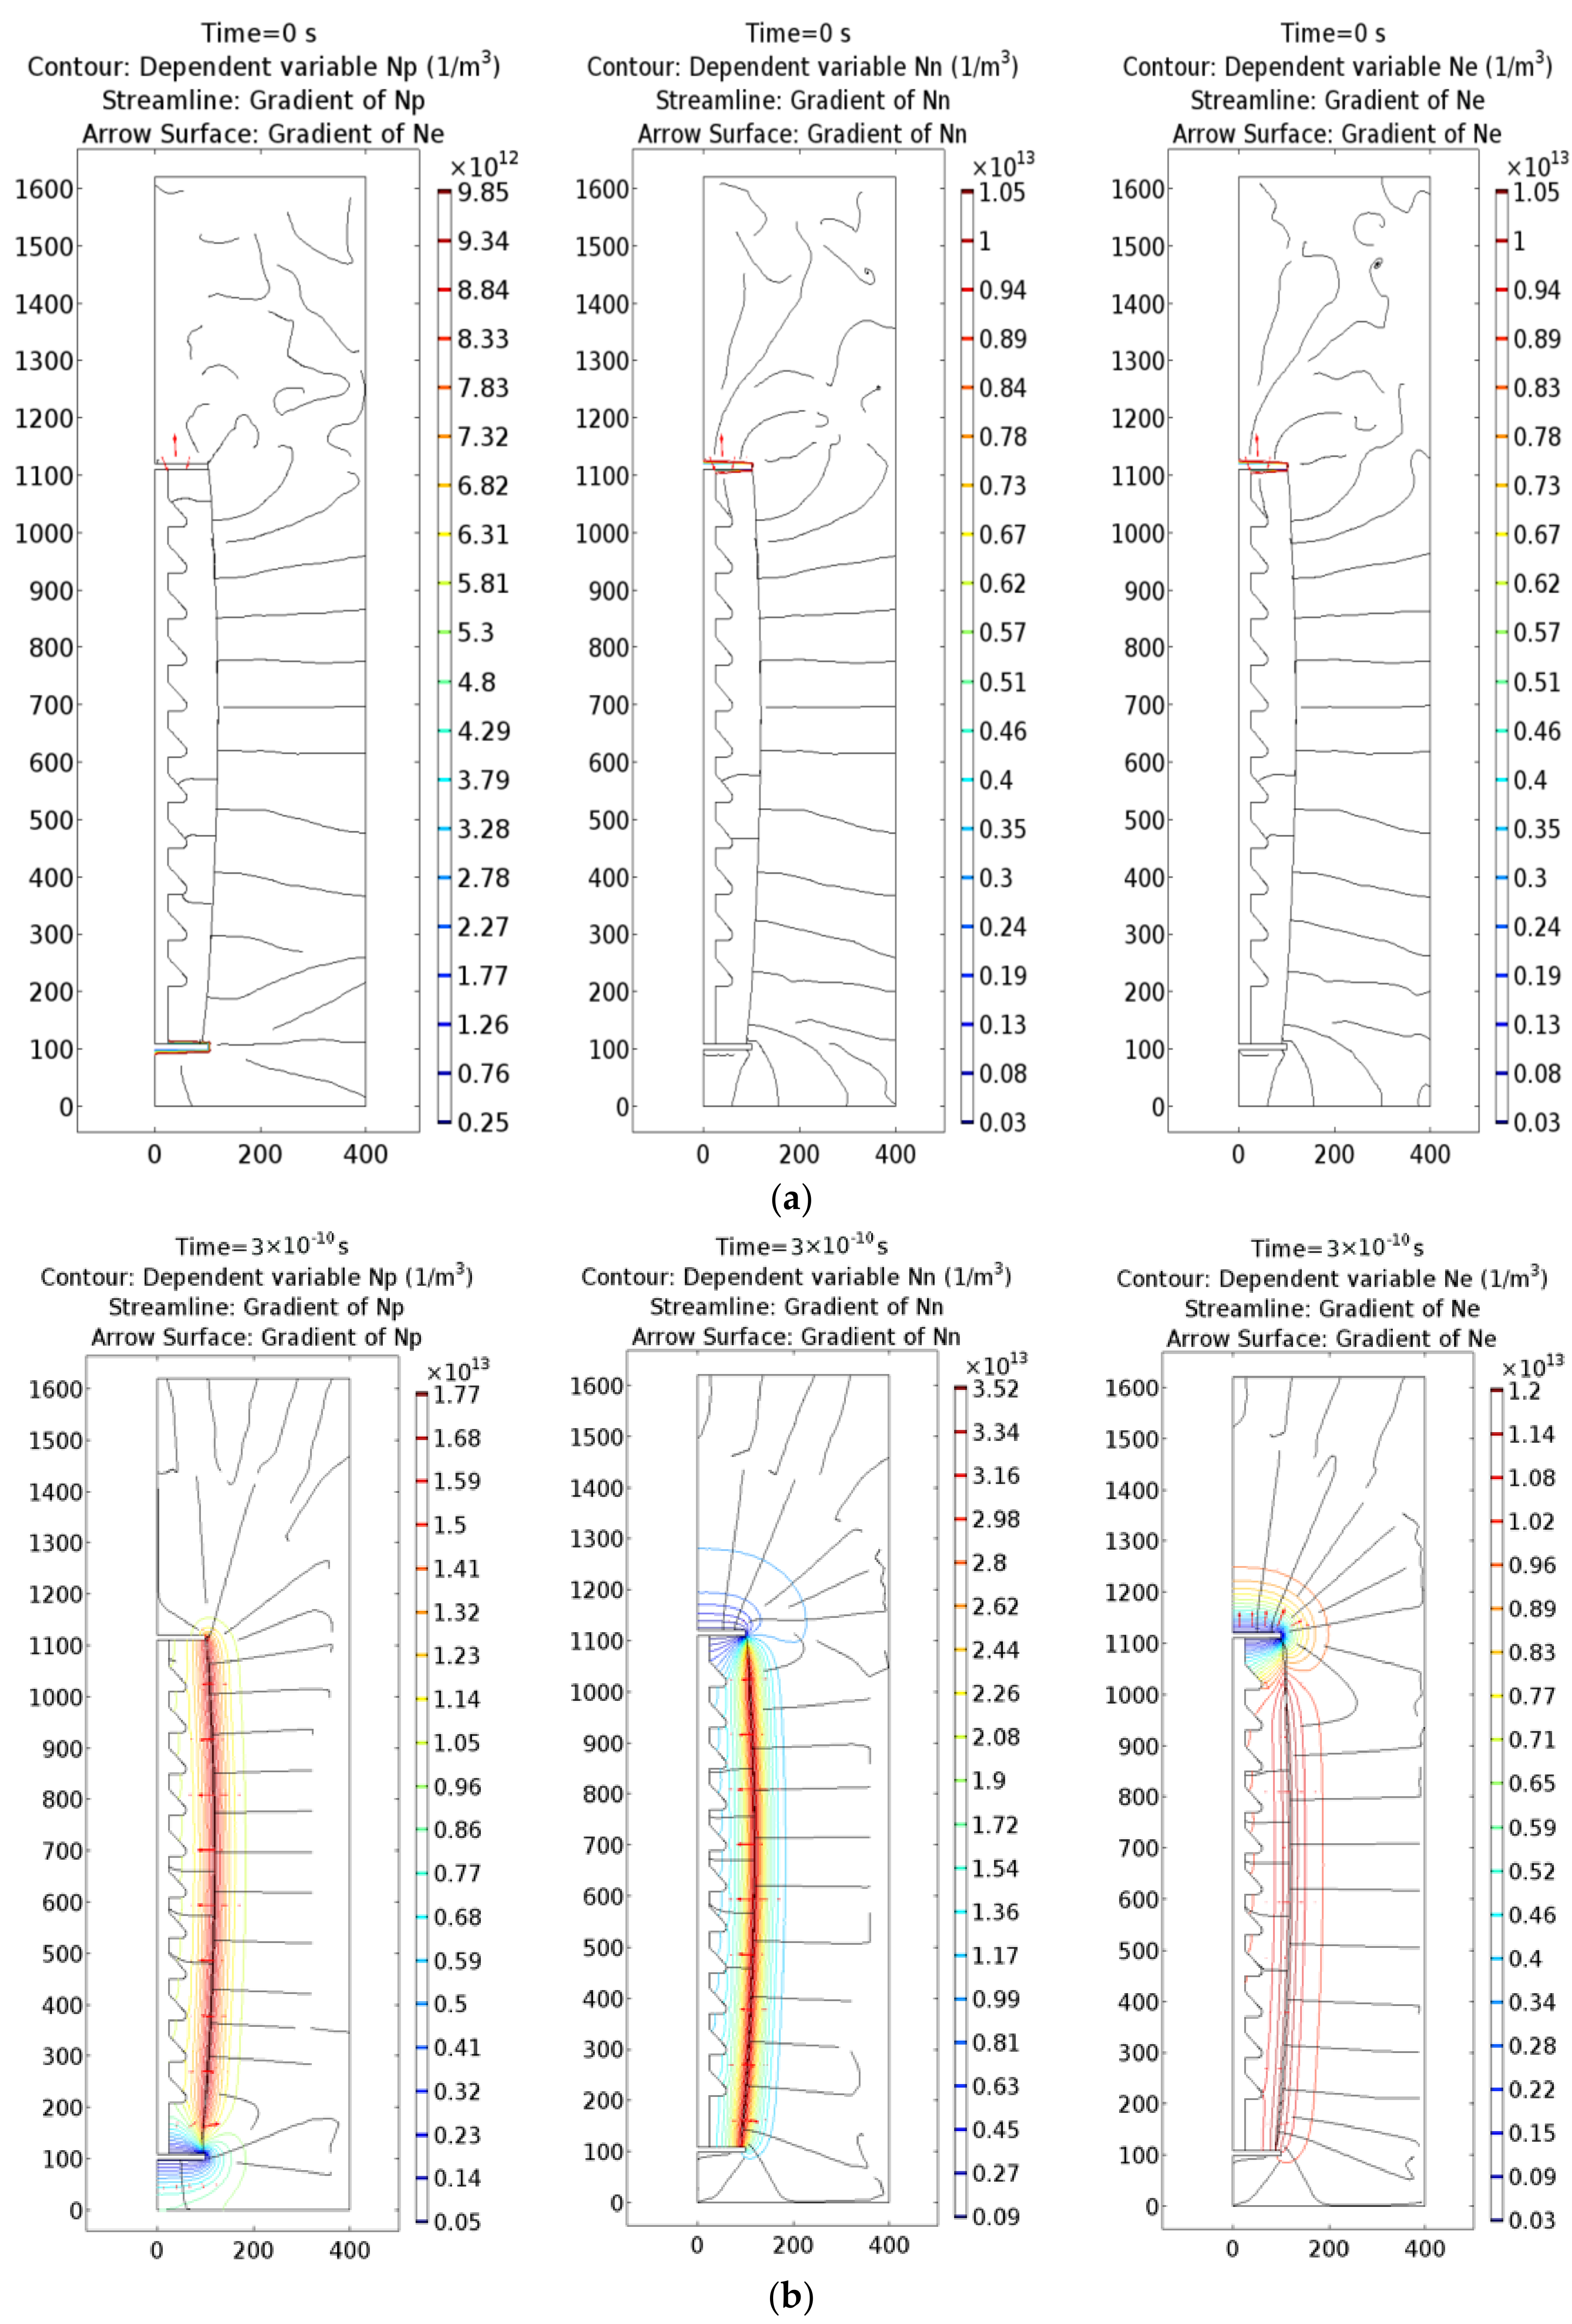
4.2. Concentration Distribution of Electrons, Negative Ions and Positive Ions

The distribution chart of electrons, negative ions and positive ions at the end of the transient analysis is shown in Figure 4, Figure 5 and Figure 6, respectively. As can be seen in Figure 4, the maximum electron concentration at the end of a short-circuit discharge is concentrated near the negative electrode, about 1.05 × 10¹³ m−3. On the contrary, the electron concentration near the positive electrode is lowest under the positive electrode adsorption and neutralization to electrons, where the surface electron concentration is zero. The migration direction of the electrons in the discharge process points to the positive electrode. Figure 5 shows the concentration distribution of negative ions at the end of arc discharge. Similar to the distribution of electron concentration, the concentration of negative ions reaches the highest value, about 1.59 × 10¹³ m−3, which is near the negative electrode and migrates from the negative electrode to the positive electrode. As shown in Figure 6, contrary to the concentration distribution of negative ions, the positive ions reach the highest value of 1.23 × 10¹³ m−3 at the positive electrode due to the adsorption and neutralization of the negative electrode. Under the action of the Coulomb force, the migration direction is directed from the positive electrode to the negative electrode.
Figure 7 shows the electron concentration distribution along the arc striking line at five different times. The electron density first increases and then decreases with the short-circuit arc discharge progress, and tends to concentrate to the cathode electrode. Due to the absorption of electrons by the anode electrode, the electron density in the anode sheath is approximately zero. It is important to note that there is not an obvious increase in electron density from the negative arc root to the middle plasma region, which is quite different from the typical streamer discharge. The strong Joule heating effect produced by the large current arc of the short circuit made the surrounding air strongly ionized, so there would be no breakdown caused by electron impact ionization. The maximum electron concentration throughout the short-circuit arc process reached 1.3 × 13 m−3, and even up to 1.05 × 13 m3 at the end of the simulation, which proved that the space ions concentration increased due to the short circuit discharge, providing the necessary environmental conditions for the subsequent generation of secondary arc.

4.3. The Generation, Diffusion and Arc Extinguishing Process of Short-Circuited Arc

The concentration distribution of the electrons and positive ions at several critical moments during the arc discharge process is shown in Figure 8. The figure shows that the concentrations of positive ions and the electrons in the internal space are both over 1 × 10¹³ m−3, and evenly distributed in the space. When the short-circuit current has not melted the arc-striking wire after the start of the discharge process, the discharge in the internal ionization space would be mainly dominated by the corona discharge near the electrodes. By comparing this with the concentration of space electrons and positive ions generated by a short-circuit current, in the rising and peak phase stage, the electrons and positive ions were concentrated near the arc striking wire and produce the luminescent effect. After the fusing of arc striking wire, the new electrons and positive ions would gradually spread to the surrounding space (at the moment t = 6 × 10⁻⁹ s in Figure 8), and eventually the spatial concentration distribution of the electrons and positive ions would reach stable states.
In the subsequent study, the average concentration of positive ions and negative ions at different moments during the short-circuit arc discharge process was analyzed. The change rules vary with time of negative ions at the anode surface, cathode surface and the midpoint of the arc striking line, as shown in Figure 9, which reflects the gradual change process from the initial concentration to the steady state concentration during the short-circuit arc discharge process. It can be seen that the space ions concentration at the initial time is 1 × 10¹³ m−3. With the passage of time, the space ions concentration rises first, then attenuates, and finally tends to smooth. Although the trend of attenuation curves of positive ions and negative ions are consistent, there are slight differences due to the difference of diffusion, convection and adsorption coefficient. When the ion reaction approached the end of the simulation time, the ion concentration was higher than the initial level, which proves that the space ion concentration was increased due to the short-circuit arc discharge, providing the necessary environmental conditions for the subsequent secondary arc generation.
In order to further quantitatively describe the transient process of short-circuit arc discharge in a high-voltage electrostatic field, the distribution of the positive ion concentration along the arc striking wire at critical time points during the discharging process was evaluated in depth. The evaluation results are shown in Figure 10, in which the zero point on the horizontal axis corresponds to the cathode electrode surface. The migration of positive ions from the positive electrode to the negative electrode varying with time can be shown clearly and quantitatively if an auxiliary line is made parallel to the abscissa.

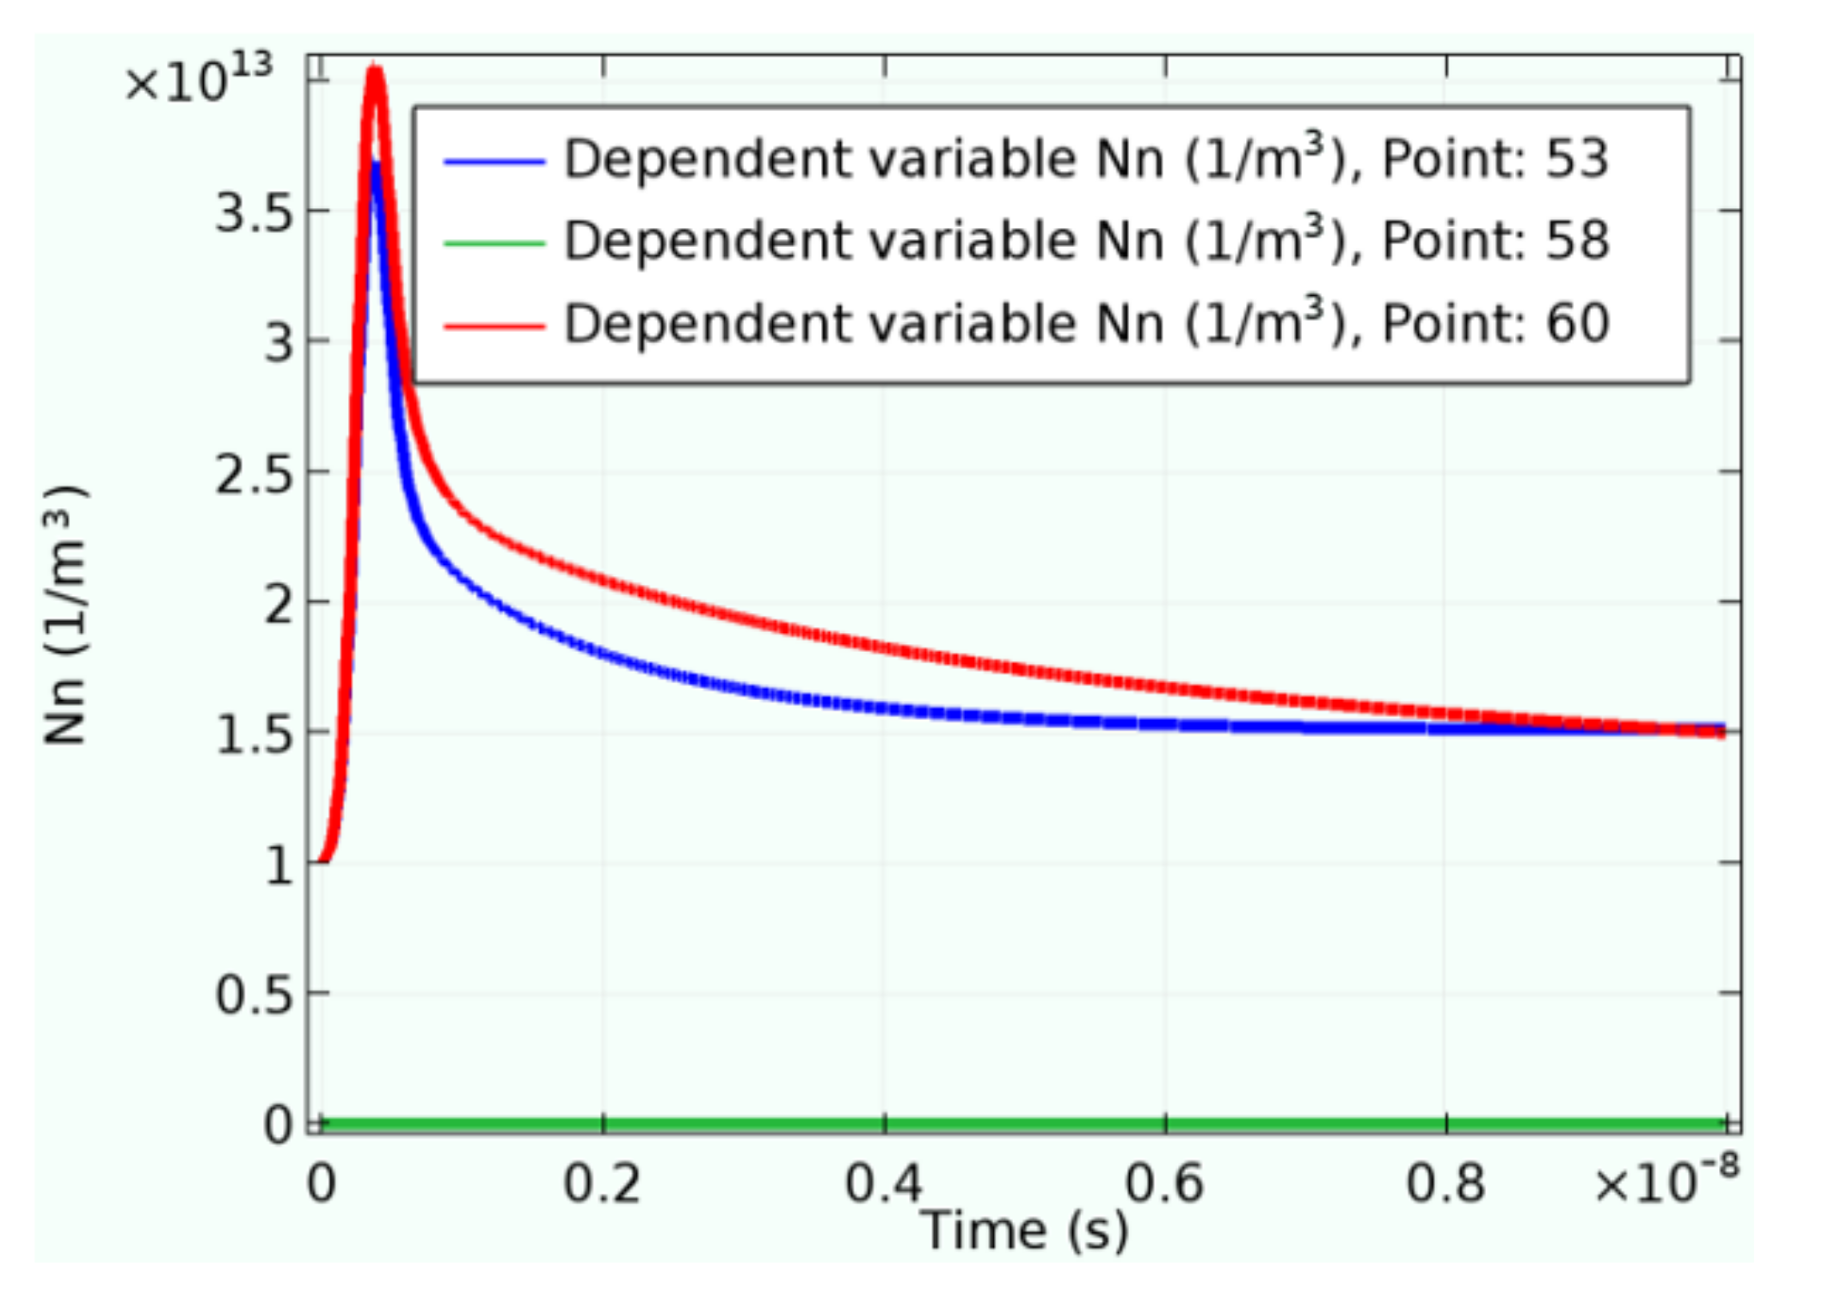
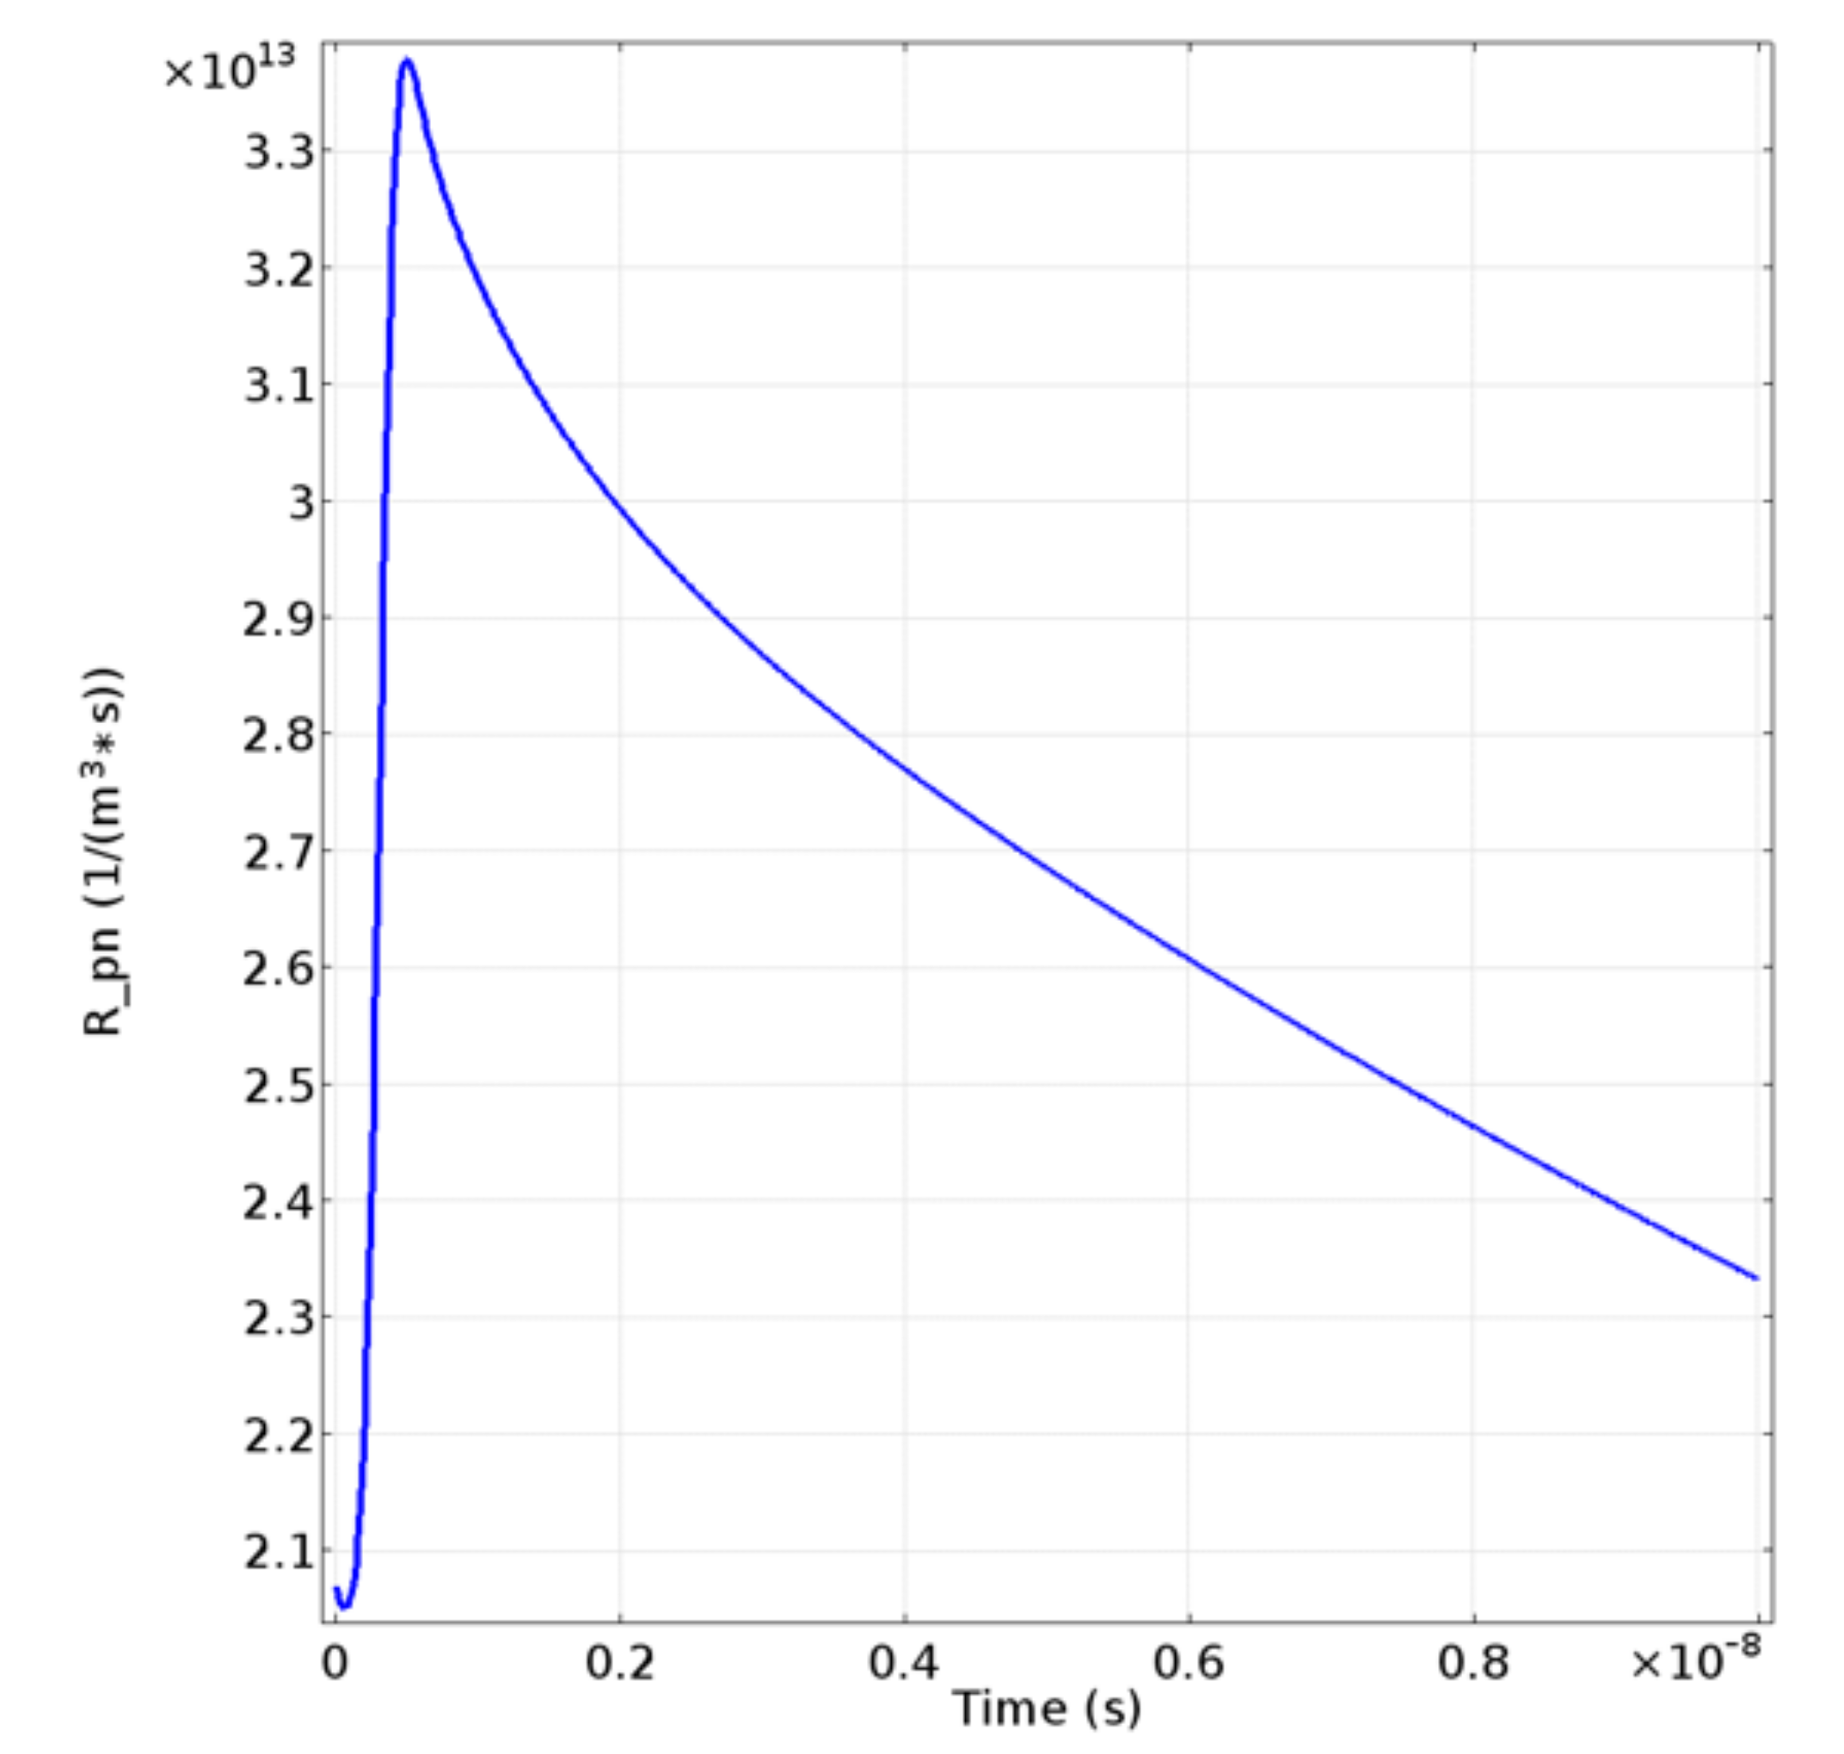
4.4. Time Dependence of Ionic Reaction during Arc Discharge

The time-dependent calculation results of the average neutralization reaction rate in the arc discharge region are shown in Figure 11. The change of ion sources produced by the neutralization reaction and short-circuit arc discharge processes are basically the same. The reaction rates increased sharply in the initial stage, and the value of ion sources peaked at the same time with the short-circuit arc discharge process simulated by Gaussian pulse. This is because the negative ions and the positive ions produced rapidly in the short-circuit arc discharge were neutralized again in the space. The rate curve of the neutralization reaction is shown in Figure 11. As can be seen from the figure, after the short-circuit arc discharge was completed, the neutralization reaction rate is gently attenuated, which is different from the developing trend of ion sources during the short-circuit arc discharge. This phenomenon can be explained that neutralization reaction is relatively slow in space and the slow attenuation of reaction rate is due to slower diffusion and migration of space ions.
The spatial distribution of the neutralization reaction rate at the initial stage of discharge, the short-circuit peak period and the post-discharge period were further studied. The study shows that the neutralization rate in the initial stage of the discharge was relatively uniform, as the positive and negative ions in the initial stage maintain electrical neutrality in space. At the peak of the short-circuit process, the neutralization reaction rate was strongest near the arc striking line. The neutralization rate was lowest near the electrode, as the positive and negative electrodes repel the positive ions and negative ions. Respectively, there is only one dominant ion concentration near the electrode. The concentration of single ion would greatly inhibit and reduce the neutralization rate. In the later stage of short-circuit discharge, the spatial distribution of positive and negative ion concentration tended to be uniform under the migration and diffusion of electric field. The spatial distribution of neutralization rate tended to be uniform, but it is still affected by the historical distribution, showing the trend of low on the side and high in the middle.

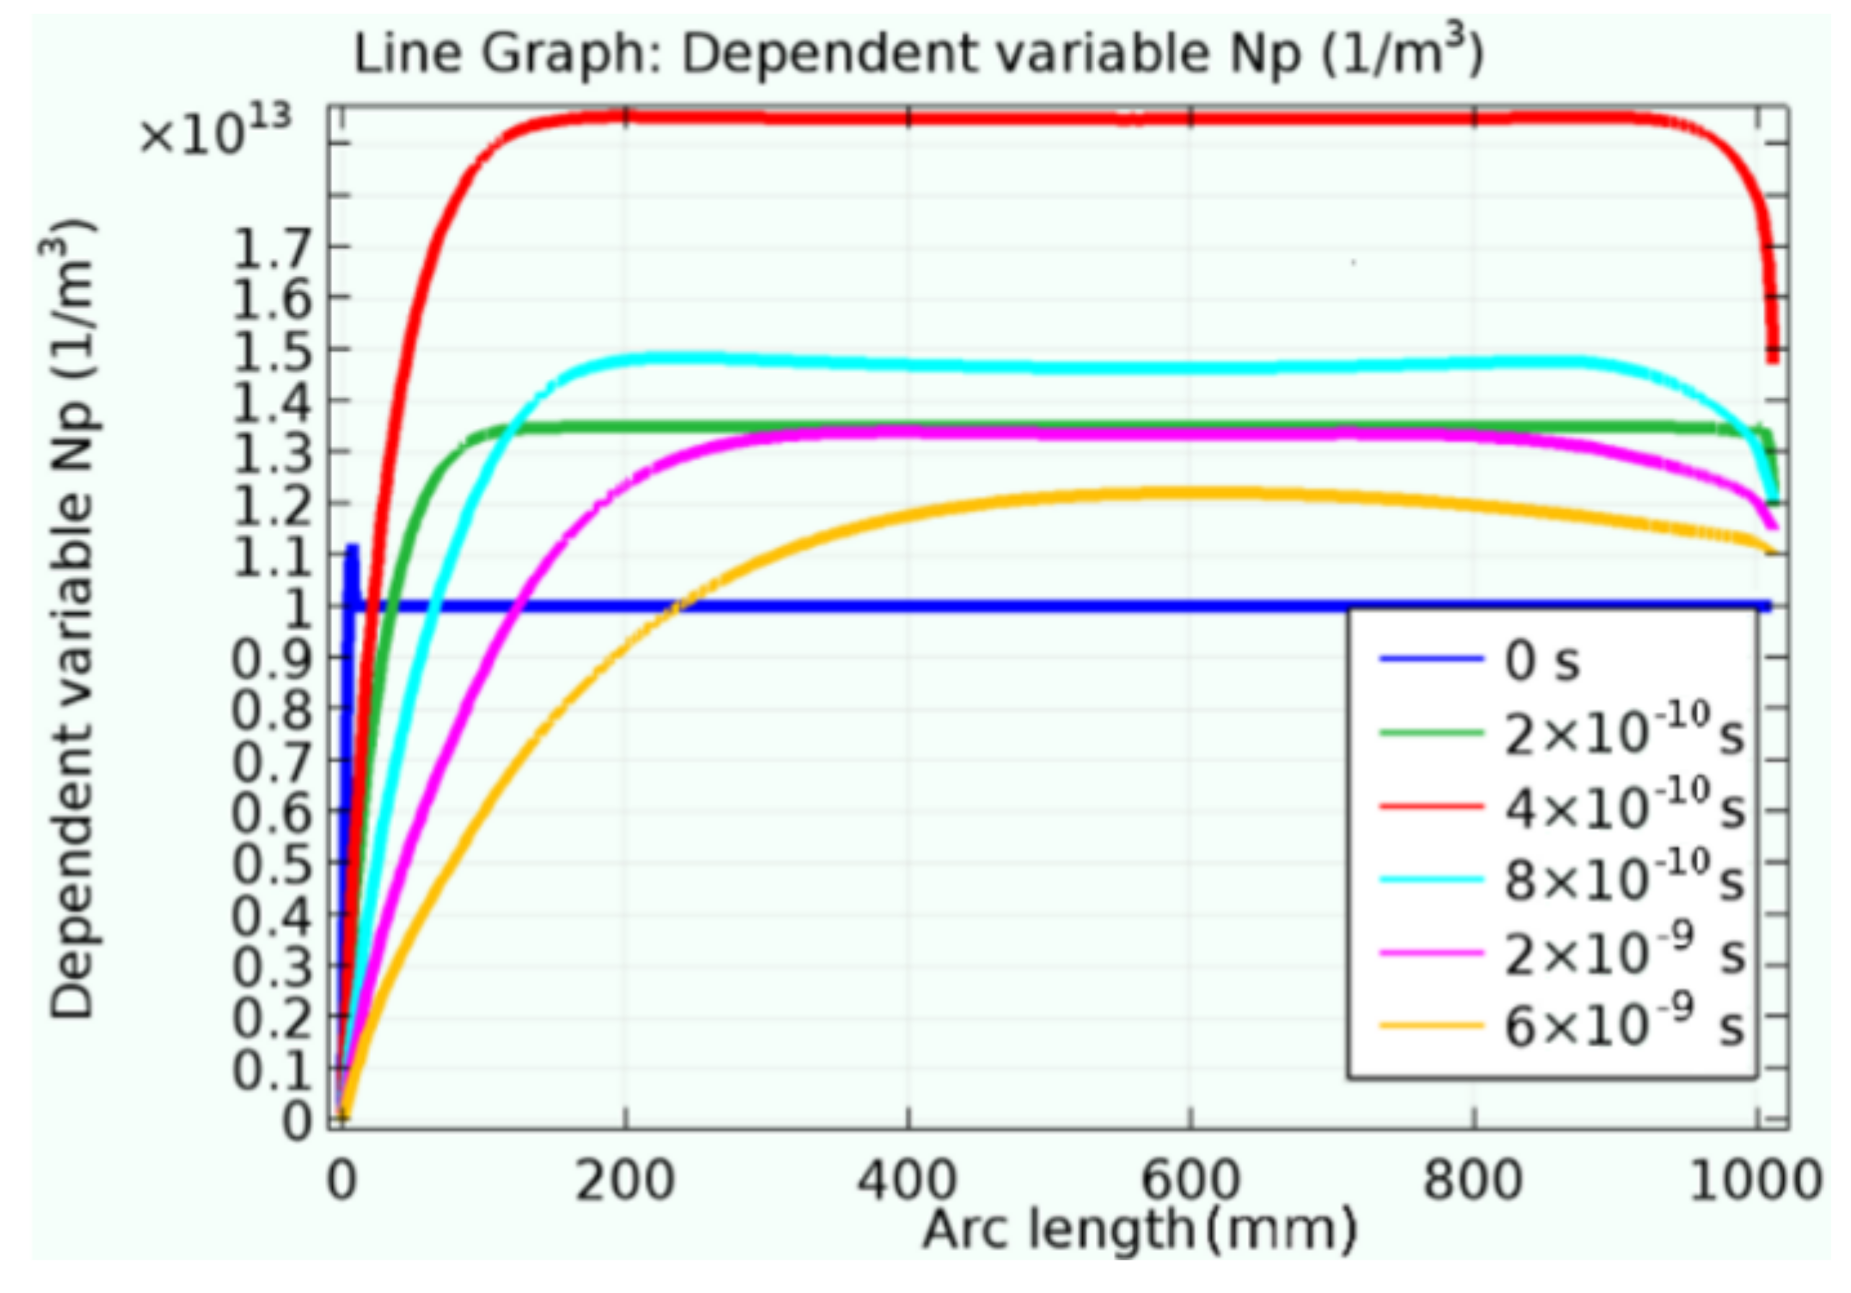
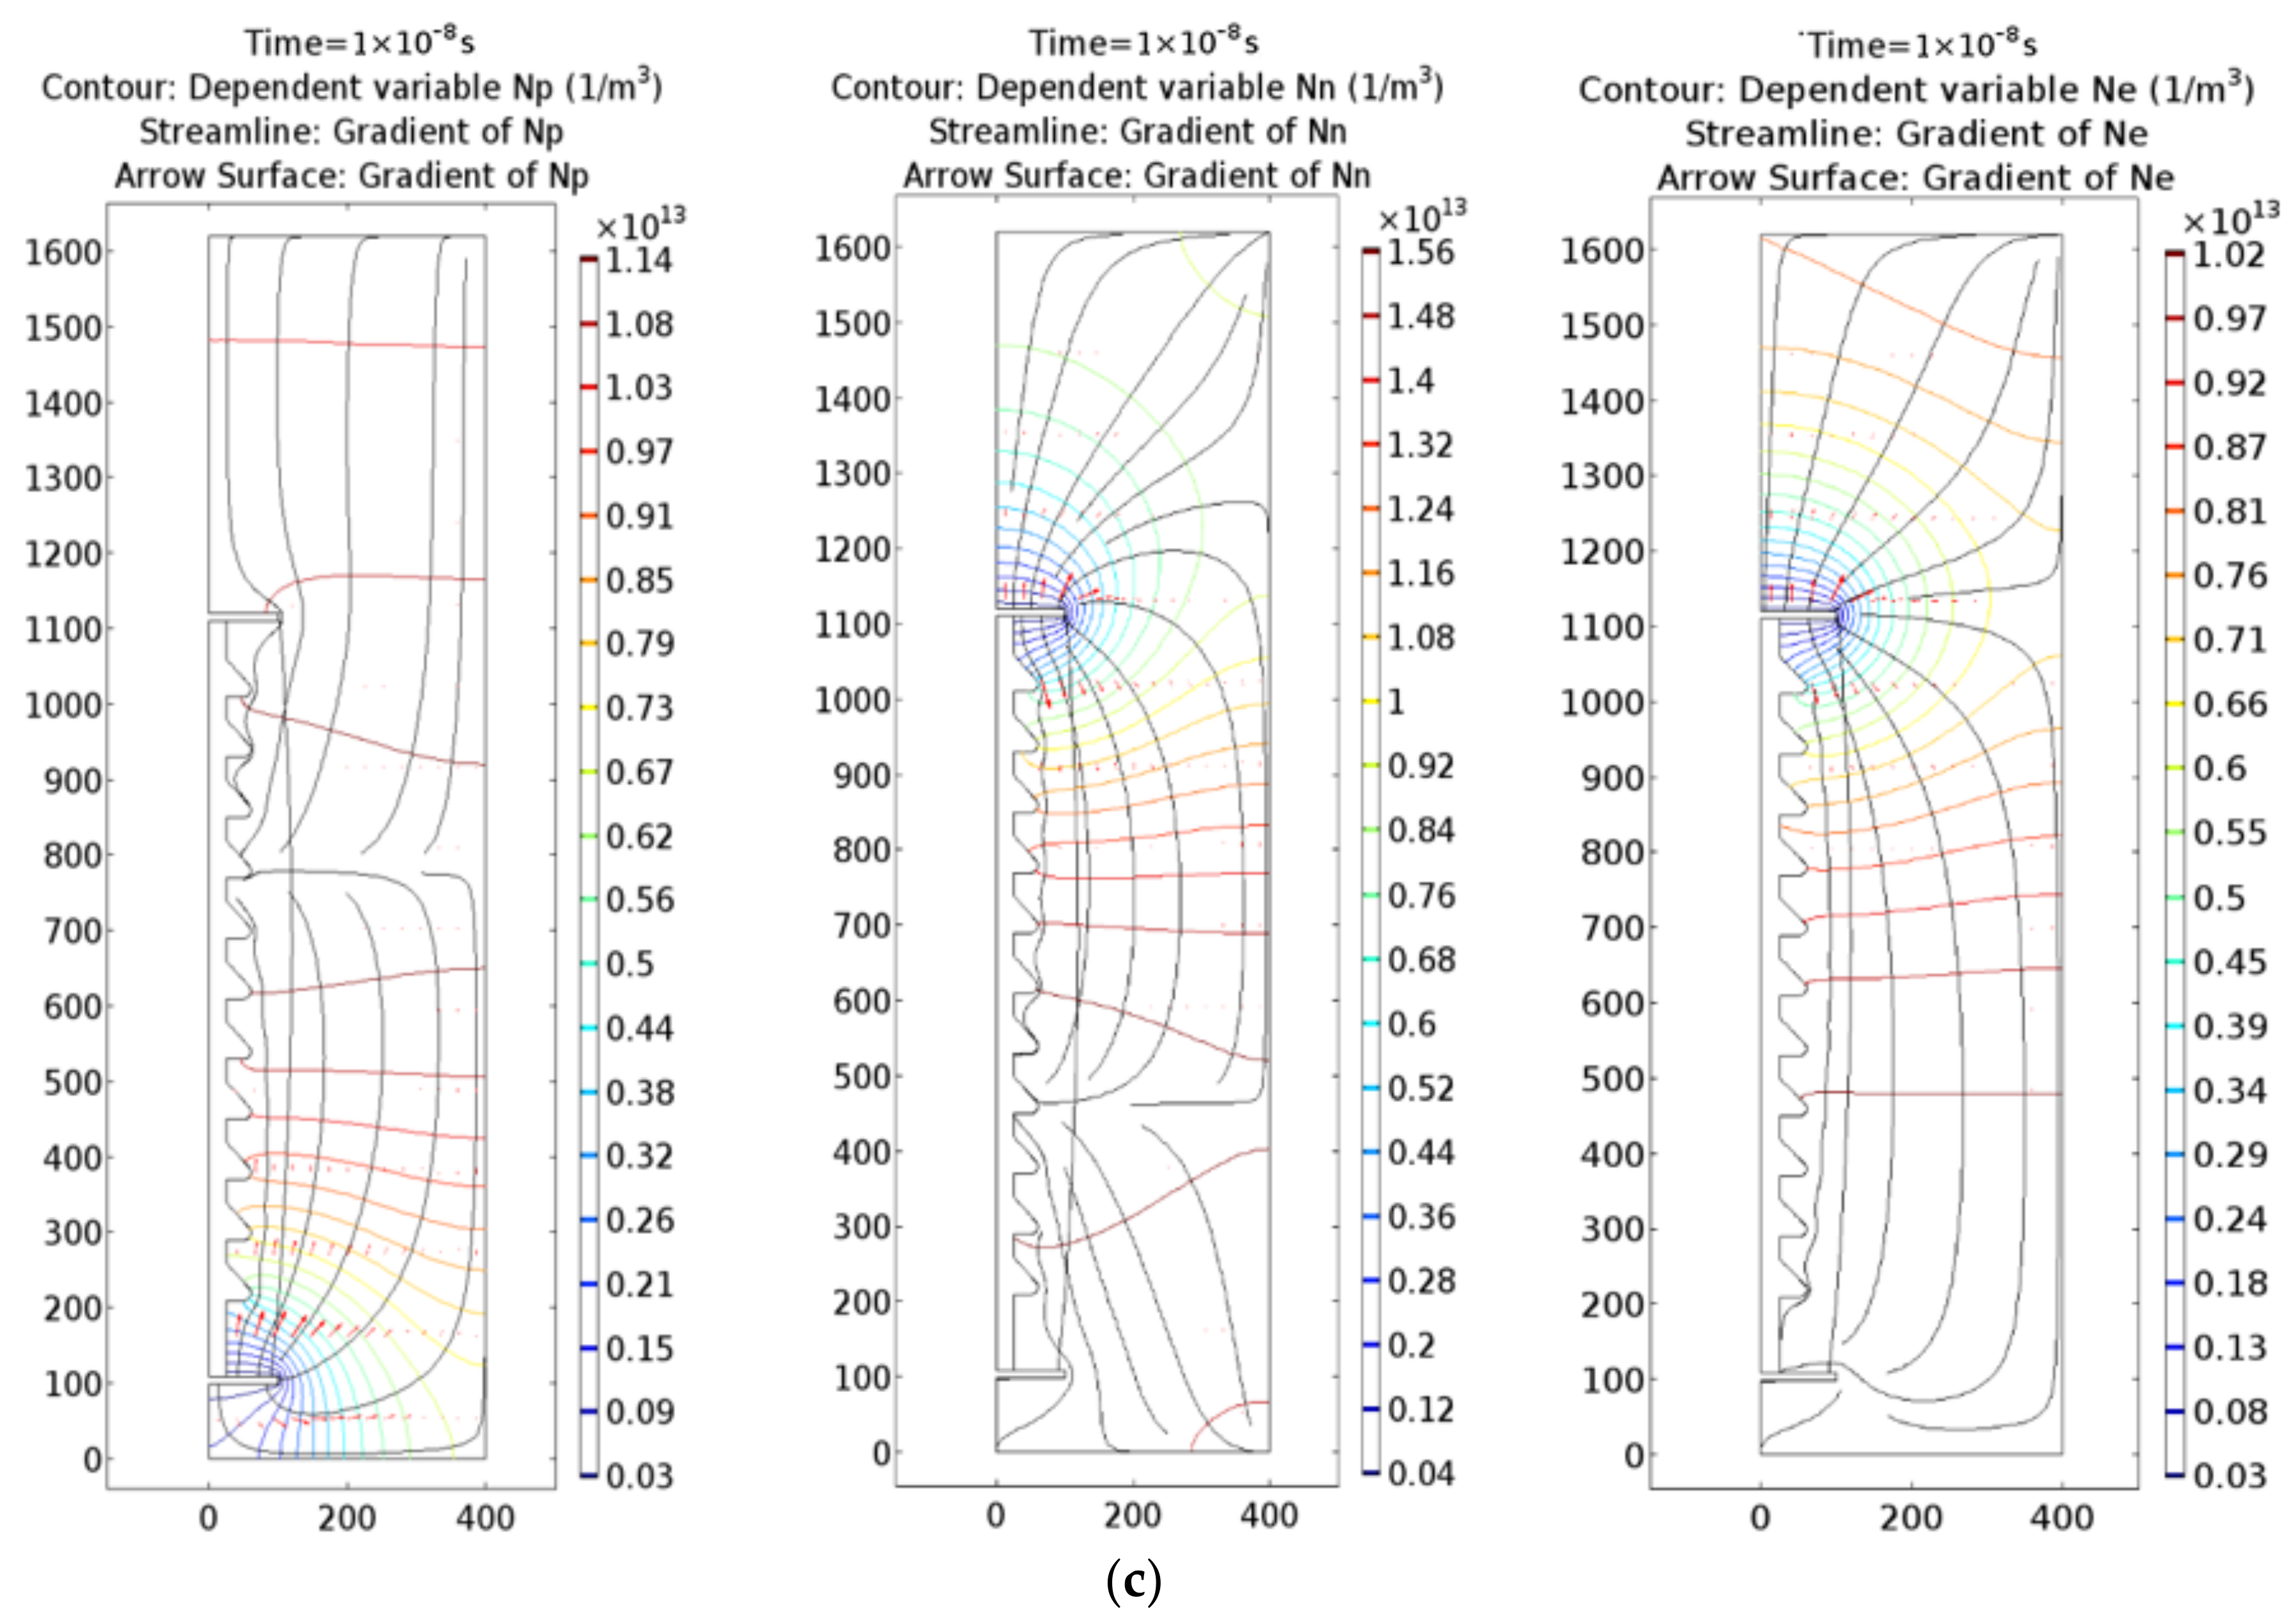
4.5. Gradient Distribution of Spatial Ions Concentration

Consistent with the analysis method mentioned before, the ion concentration distributions at initial, peak and late stage are show in Figure 12. The ion concentration in the graph is expressed by the contour line, and the concentration gradient of the ion is expressed by the black streamline. As can be seen from the figure, in the initial stage of arc discharge the ion concentration in space was more evenly distributed and the concentration gradient was close to zero. However, the ion sources generated by short-circuit are gathered around the short-circuited striking arc line at the peak of discharge, and the direction of the concentration gradient is diffused around the short-circuit wire. The concentration gradient directly determines the diffusion speed and direction of the ion motion in the space. Therefore, the spatial variation of the ion concentration caused by the diffusion at each moment independently can be obtained by analyzing the ion concentration gradient. Figure 12c shows that the ion concentration in the late stage of discharge mainly diffused from the middle of the discharge region to the two end electrodes. Comparing in Figure 12, it can be found that the diffusion effect of space ions in the initial stage of discharge was almost zero, then the ion diffusion direction was radial in the peak discharge phase while axial in the late discharge.

5. Conclusions

In this paper, an arc numerical simulation model based on the combination of coefficient partial differential equations and the classical drift-diffusion model was established. The generation, adsorption, recombination and neutralization processes of short-circuit arc discharge process at the initial stage of secondary arc fault were simulated. Then transient analysis was used to simulate the generation, diffusion and dissipation of the short-circuited arc discharge. The space distribution of electric field and the microscopic particles of the reaction process during arc discharge were further explored. The main conclusions are as follows.
  • The time-space analysis results of positive ion, negative ion and electron concentrations indicate that the short-circuit arc discharge process at the initial stage includes two processes: the corona discharge and arc discharge caused by short-circuit, and that the duration of the former is very short. During the arc discharge process, the electron density at the arc striking wire increases first and then decreases due to the anode electrode adsorption of electrons and the Joule heating effect of high current caused by short-circuit arc, which is different from the general streamer discharge.
  • The concentration distribution curves of the positive ions and negative ions are the same, but there are still slight differences due to their difference of diffusion, convection and adsorption coefficient. When the ion reaction approaches to the end of the simulation time, the ion concentration is higher than the initial level, which proves that the space ion concentration is increased due to the short-circuit discharge, providing the necessary environmental conditions for the generation of secondary arc.
  • The diffusion effect of space ions in the initial stage of discharge is almost zero. The ion diffusion direction was radial in the peak discharge phase, while axial in the late discharge. The electric field intensity in space has an S-shaped upward trend during discharge. Both ends are strongly influenced by the electrode, while the middle region is mainly influenced by the particle reaction. The time relationship of the ion source generated by the neutralization reaction and by the short-circuit arc discharge are basically the same, and the rate of neutralization reaction is lowest near the electrode.

Acknowledgments

This work was supported by the National Natural Science Foundation of China (51277061 & 51420105011) and supported by the Fundamental Research Funds for the Central Universities (2017017).

Author Contributions

Haoxi Cong conceived and designed the simulation model; Qingmin Li and Yangfei Lu gave important advice on the simulation; Haoxi Cong, Shiyue Du and Jinsong Li finished the simulation, data analysis and finally wrote the paper.

Conflicts of Interest

The authors declare no conflicts of interest.

References

  1. Dias, O.; Magrin, F.; Tavares, M.C. Comparison of secondary arcs for reclosing applications. IEEE Trans. Dielectr. Electr. Insul. 2017, 24, 1592–1599. [Google Scholar] [CrossRef]
  2. Sun, Q.; Yin, J.; Wang, F.; Yan, J.; Li, Q.; Chen, S. Influence of grading capacitor of multiple-break circuit breaker on the extinction of secondary arc—A new method for reducing dead time. IET Gener. Transm. Distrib. 2017, 11, 1954–1965. [Google Scholar] [CrossRef]
  3. Dudurych, M.; Gallagher, T.J.; Rosolowski, E. Arc effect on single-phase reclosing time of a UHV power transmission line. IEEE Trans. Power Deliv. 2004, 19, 854–860. [Google Scholar] [CrossRef]
  4. Tsuboi, T.; Takami, J.; Okabe, S.; Aoki, K.; Yamagata, Y. Study on a field data of secondary arc extinction time for large-sized transmission lines. IEEE Trans. Dielectr. Electr. Insul. 2013, 20, 2277–2286. [Google Scholar] [CrossRef]
  5. Tavares, M.C.; Talaisys, J.; Camara, A. Voltage harmonic content of long artificially generated electrical arc in out-door experiment at 500 kV towers. IEEE Trans. Dielectr. Electr. Insul. 2014, 29, 1005–1014. [Google Scholar] [CrossRef]
  6. Li, Q.; Cong, H.; Sun, Q.; Xing, J.; Chen, Q. Characteristics of secondary AC arc column motion near power transmission line insulator string. IEEE Trans. Power Deliv. 2014, 29, 2324–2331. [Google Scholar] [CrossRef]
  7. Gu, S.; He, J.; Zeng, R.; Zhang, B.; Xu, G. Motion characteristics of long ac arcs in atmospheric air. Appl. Phys. Lett. 2007, 90, 051501. [Google Scholar] [CrossRef]
  8. Cong, H.; Li, Q.; Xing, J.; Siew, W.H. Modeling study of the secondary arc with stochastic initial positions caused by the primary arc. IEEE Trans. Plasma Sci. 2015, 43, 2046–2053. [Google Scholar] [CrossRef]
  9. Gu, S.; He, J.; Zhang, B.; Xu, G.; Han, S. Movement simulation of long electric arc along the surface of insulator string in free air. IEEE Trans. Magn. 2006, 42, 1359–1362. [Google Scholar]
  10. Horinouchi, K.; Nakayama, Y.; Hidaka, M.; Sasao, H. A method of simulating magnetically driven arcs. IEEE Trans. Power Deliv. 1997, 12, 213–218. [Google Scholar] [CrossRef]
  11. Terzija, V.V.; Koglin, H.J. On the modeling of long arc in still air and arc resistance calculation. IEEE Trans. Power Deliv. 2004, 19, 1012–1017. [Google Scholar] [CrossRef]
  12. Cong, H.; Li, Q.; Xing, J.; Siew, W.H. Simulation model of secondary arc for long-distance transmission lines with multi-field coupling dynamics. Int. J. Appl. Electromagn. 2015, 48, 423–436. [Google Scholar] [CrossRef]
  13. Davies, A.J.; Davies, C.S.; Evans, C.J. Computer simulation of rapidly developing gaseous discharges. Proc. Inst. Electr. Eng. 1971, 118, 816–823. [Google Scholar] [CrossRef]
  14. Georghiou, G.E.; Papadakis, A.P.; Morrow, R.; Metaxas, A.C. Numerical modelling of atmospheric pressure gas discharges leading to plasma production. J. Phys. D Appl. Phys. 2005, 38, R303–R328. [Google Scholar] [CrossRef]
  15. Sattari, P.; Castle, G.S.P.; Adamiak, K. Numerical simulation of trichel pulses in a negative corona discharge in air. IEEE Trans. Ind. Appl. 2011, 47, 1935–1943. [Google Scholar] [CrossRef]
  16. Sun, H.; Lu, B.; Wang, M.; Guo, Q.; Feng, Q. The role of photoionization in negative corona discharge: The influences of temperature, humidity, and air pressure on a corona. Phys. Plasmas 2017, 24, 103506. [Google Scholar] [CrossRef]
  17. Zhang, J.; Wang, Y.; Wang, D. Numerical study on mode transition characteristics in atmospheric-pressure helium pulsed discharges with pin-plane electrode. IEEE Trans. Plasma Sci. 2018, 1, 19–24. [Google Scholar] [CrossRef]
  18. Georghiou, G.E.; Morrow, R.; Metaxas, A.C. Two-dimensional simulation of streamers using the FEM-FCT algorithm. J. Phys. D Appl. Phys. 2000, 33, L27. [Google Scholar] [CrossRef]
  19. Paria, S.; Castle, G.S.P.; Adamiak, K. FEM–FCT-based dynamic simulation of corona discharge in point–plane configuration. IEEE Trans. Ind. Appl. 2010, 46, 1699–1706. [Google Scholar]
  20. Li, X.; Lu, X.; Li, B.; Zheng, G.; Li, L.; Geng, Z.; Shan, C.; Lin, X. Research on dielectric characteristics of SF6/N2 gas mixtures based on FEM-FCT. In Proceedings of the China International Conference on Electricity Distribution, Xi’an, China, 10–13 August 2016. [Google Scholar]
  21. Lin, X.; Zhang, J.; Li, X.; Xu, J.; Geng, Z.; Li, L.; Chen, H. Numerical calculation and experimental study on the insulation characteristics of SF6-N2 and SF6-CF4 gas mixtures. In Proceedings of the 4th International Conference on Electric Power Equipment-Switching Technology, Xi’an, China, 23–25 October 2017. [Google Scholar]
  22. Komuro, A.; Ono, R.; Oda, T. Two-dimensional simulation of streamer discharge including the vibrationally excited molecules effects. In Proceedings of the IEEE Industry Applications Society Meeting, Orlando, FL, USA, 9–13 October 2011. [Google Scholar]
  23. Zhang, L.; Hui, J.; Meng, X.; Bian, X.; Wang, L.; Guan, Z. The simulation of streamer dynamics in the air gap. In Proceedings of the IEEE Conference on Electrical Insulation & Dielectric Phenomena, Cancun, Mexico, 16–19 October 2011. [Google Scholar]
  24. Wu, F.; Liao, R.; Yang, L.; Liu, X.; Wang, K.; Zhou, Z. Numerical simulation of Trichel pulse characteristics in bar-plate DC negative corona discharge. Acta Phys. Sin. 2013, 62, 348–357. [Google Scholar]
Figure 1. The geometry definition of arc simulation and its mesh generation. (a) Geometric model definition; (b) The mesh generation.
Energies 11 00828 g001
Figure 2. Collision cross section-reduce electric field function of ionization and recombination.
Energies 11 00828 g002
Figure 3. Electric field distribution at the end of short-circuit arc discharge simulation.
Energies 11 00828 g003
Figure 4. Electron density distribution at the end of arc discharge simulation.
Energies 11 00828 g004
Figure 5. Negative ion density distribution at the end of arc discharge simulation.
Energies 11 00828 g005
Figure 6. Positive ion density distribution at the end of arc discharge simulation.
Energies 11 00828 g006
Figure 7. The electron concentration distribution along striking wire during the arc discharge process.
Energies 11 00828 g007
Figure 8. The electrons and positive ions density distribution at critical times.
Energies 11 00828 g008
Figure 9. Negative ion density as function of time at positive electrode (point 58), negative electrode (point 53) and mid-point of short circuit wire (point 60).
Energies 11 00828 g009
Figure 10. Positive ion density distribution along short circuit wire at critical times.
Energies 11 00828 g010
Figure 11. Time dependence of average neutralization reaction in discharge space.
Energies 11 00828 g011
Figure 12. Three ion concentration contour lines and their gradient stream patterns: (a) in the initial discharge space; (b) in the peak discharge space; (c) in the late discharge space.
Energies 11 00828 g012aEnergies 11 00828 g012b
Table 1. Reaction parameters.
NameExpressionDescription
μ p2.0 × 10−4 (m2/V·s)Positive ion mobility
D p 5.05 × 10⁻⁴ (m2/s)Positive ion diffusivity
μ n2.2 × 10−4 (m2/V·s)Negative ion mobility
D n 5.56 × 10⁻⁴ (m2/s)Negative ion diffusivity
β ep5.0 × 10−14 (m3/s)Electron-positive ion recombination rate
β pn2.07 × 10−13 (m3/s)Positive-negative particle recombination rate
f01.7 × 109 (1/m3·s)Source item
kdet1 × 10−18 (m3/s)Electron separation rate from negative ions
Table 2. Boundary conditions.
BoundaryDrift Diffusion NeDrift Diffusion NpDrift Diffusion Nn
Symmetry axis N e r = 0 N p r = 0 N n r = 0
Upper electrode N e = 0 n · ( D p N p ) = f + N n =0
Lower electrode n · ( D e N e ) = f N p =0 n · ( D n N n ) = f
Arc striking line n · ( D e N e ) = g e 2 n · ( D p N p ) = g p 2 n · ( D n N n ) = g n 2
Others n · ( D e N e ) = 0 n · ( D p N p ) = 0 n · ( D n N n ) = 0

