1. Introduction
With the development of marine rights and marine economy, island exploration has received great attention, and power supply has emerged as a key issue. Many islands are usually far away from the urban power grid, and a diesel generator provides the power. Transportation of diesel fuel to power these islands is costly, and the diesel generator noise is annoying and has a negative impact on the ecology of islands. Islands are rich in renewable resources, such as solar and wind energy, and its loads are also distributed in separated regions. A microgrid links the distributed renewable energy generation and loads together, reduces power transmission loss, and realizes the transition from a traditional diesel power generation system to a clean energy power system on the island [
1].
A great deal of research on stand-alone microgrids has been carried out throughout the world [
2,
3]. Stand-alone microgrids are autonomous systems. There are only a limited number of generation units and loads with fluctuating and intermittent power. Appropriate microgrid configuration and control strategy are needed to provide a stable and economic power supply [
4]. Like the urban power grid, the conventional microgrid has a common AC bus. The diesel generator or the storage battery plays the role of the main voltage source individually in different operation modes, which needs the smooth switching control of different operational modes [
5]. A standardized three-layer control structure has been proposed for the stand-alone microgrid [
6,
7]. The primary control maintains voltage and frequency stability, and usually the frequency droop and voltage droop control of the converters are adopted [
8]. The secondary control is the coordinated control of converters and regulates the microgrid voltage and frequency to the nominal ratings [
9,
10]. The tertiary control aims to achieve the performance optimum objectives of the microgrid [
11]. It is complicated to fulfill the above three-layer control strategy.
The conventional microgrid mentioned above needs a specific converter, complex communications, and control devices with high reliability. The system is therefore expensive. Many islands are small-scale, and their load increases gradually. It is not economical to construct and maintain a conventional microgrid on an island. We have carried out a series of studies on the stand-alone microgrid technology suitable for practical application with small or medium capacity. A stand-alone modular microgrid based on distributed batteries was proposed by the authors [
12]. Each storage battery was configured to realize the power regulation within each module. The diesel generator was no longer the main voltage source and was only connected to one module as a power source for occasional energy supplement. One storage battery worked as the main voltage source and the rest of the storage batteries worked as power sources. The master-slave control method of the modular microgrid needed two types of converters and also reduced the reliability of the system. The modular microgrid still had a common AC bus and it was difficult to ensure that the AC bus voltages of all modules were within a reasonable range. Therefore, the stand-alone modular microgrid proposed in [
12] needs a lot of improvements.
This paper proposes a new stand-alone modular microgrid which is the further improvement and development of the modular microgrid in Ref. [
12]. Each module consists of wind and solar power, a storage battery, load and three-port converter. Modules are interconnected by the transmission network through three-port converter to form the microgrid. The AC bus of each module is independent and so it is easier to ensure the AC bus voltage quality within the module. The stand-alone modular microgrid runs only in single mode, and so there is no need of mode-transfer control. The stand-alone modular microgrid has a fully decentralized control structure. The system control is simplified to the module control and the three-port converter is the core control equipment. The primary control and secondary control are integrated into the AC bus voltage control of the three-port converter. The tertiary control is the power economic dispatch among modules. The modular structure and decentralized control method make the construction, maintenance and expansion of the microgrid easy.
Study of the economic dispatch of stand-alone microgrids has garnered great interest and it is a complex mixed-integer programming problem. Operational expenses [
13], emission costs [
14], or power supply reliability [
15] can be the optimization objectives. Constraints usually include equality constraints, such as power conservation, and inequality constraints, such as the rated power limits of the converter. Different methods like Static Programming (SP), Dynamic Programming (DP) [
16], Genetic Algorithm (GA) [
17], Evolutionary Programming (EP) [
18], and Particle Swarm Optimization (PSO) [
19] are adopted to solve the problem. Batteries are the weakest parts of the microgrid. The State of Charge (SOC) of battery is directly related to the performance and lifespan of the battery. The SOC of battery is the accumulative amount of power. Economic dispatching studies of a conventional stand-alone microgrid usually treated the batteries as a whole, so there was only one integral unit in the model. Distributed batteries in modular microgrid lead to multiple integral units. Research on energy dispatch among multiple batteries is limited. Due to the complex constraints, it is difficult to produce a feasible solution and is even more difficult to create an improved solution. Simplified swarm optimization (SSO) is an emerging population-based stochastic optimization method proposed by Yeh to overcome the drawbacks of particle swarm optimization (PSO) [
20]. Simulation results reveal that SSO has better convergence to quality solutions than PSO, GA, Estimation of Distribution Algorithm (EDA) and Artificial Neural Network (ANN) methods [
21,
22,
23,
24]. SSO has therefore been widely used in a range of applications.
Characteristics, operation principle, control of the modular microgrid and the three-port converter are analyzed in detail. In order to realize the economic dispatch of modular microgrid through distributed storages, a day-ahead operation optimization model including fuel cost, battery operation cost, and power transmission cost is established. An improved simplified swarm optimization (iSSO) method is proposed to solve the mixed-integer programming problem of economic dispatch. The iSSO scheme designs the new update mechanism and survival of the fittest policy. The experiments are carried out with the demonstration project on DongAo Island. Results show the effectiveness of the stand-alone modular microgrid. The economic dispatching strategy based on the iSSO method can quickly provide the global optimum solution and realize the economic operation of modular microgrid. This paper provides a new form of microgrid suitable for rapid and economical engineering application on islands.
The organization of this paper is as follows:
Section 2 analyses the configuration, operation mode, and control method of the modular microgrid.
Section 3 builds the day-ahead economic optimum dispatching model.
Section 4 presents the iSSO strategy. Experiments on the stand-alone modular microgrid are discussed in
Section 5, and conclusions are provided in
Section 6.
2. Stand-Alone Modular Microgrid
The stand-alone modular microgrid demonstration project was constructed on the DongAo Island, which is a tourism island in Zhuhai City, China. The original power supply system was a diesel generator, which had poor power quality, a high price (up to 0.39
$/kWh), and could not meet the requirements of uninterruptible power supply. The stand-alone modular microgrid was established based on the existing transmission system. Three individual load centers were the diesel generator plant zone, comprehensive building zone, and cultural center zone as shown in
Figure 1. Three modules were established accordingly. Photovoltaic arrays and wind turbines were installed in each zone to provide clean power supplies. A storage battery was configured to realize the power balance.
2.1. System Configuration
The stand-alone microgrid on DongAo Island consists of modules A, B, and C as shown in
Figure 2. Module A is the diesel generator plant zone, Module B is the comprehensive building zone, and Module C is the cultural center zone. The modular microgrid can make full use of the existing power system, and the red line in
Figure 2 presents the existing 10 kV transmission and distribution network on the island. Each module is connected to the 10 kV transmission network with a transformer. The distance between modules is about 1 km. When the module has excess energy, it can release energy to the microgrid. When there is no enough energy, it can absorb energy from the microgrid.
Each module consists of solar and wind power, a storage battery, loads and three-port converter. The installed capacities of photovoltaic arrays and wind turbines are 50 kW and 30 kW individually in each module. The rated power of diesel generator connected to the module A is 100 kW. The three-port converter with AC-DC-AC topology is the key equipment for the system configuration, control and energy dispatch. The storage battery, a lead acid battery, is connected to the DC terminal. The rated DC voltage of the battery is 480 V and its capacity of the battery is 300 kWh. The battery can not only smooth the fluctuation of the solar and wind power but also compensate for the power difference between the power generation and power consumption. The left AC-DC part is the rectifier in active power and reactive power (PQ) control mode to realize the bidirectional power flow between the module and the microgrid. The right DC-AC part is the inverter in voltage control mode to establish AC bus voltage for the module. The wind turbine generator and PV generation are connected to the AC bus via converters and work in the maximum power point to make full use of the renewable energy. The diesel generator in module A works in the PQ control mode for energy supplement and power dispatch when renewable energy is not sufficient.
The modular microgrid has the following characteristics:
- (1)
Each module can run independently or be connected to the microgrid, which improves the power supply reliability within the module. The inverter always works as a voltage source. The operation mode switch of the module between grid-connected and off-grid does not affect the voltage quality in the module.
- (2)
Each module can be configured based on the local load demand and available renewable resources to balance the power supply and demand as much as possible. The configuration of the microgrid is decomposed into the configuration of individual modules.
- (3)
Optimal power flow can be achieved among modules to make more benefits and alleviate the power shock of the battery to prolong the lifetime.
- (4)
Capacity expansion can be easily completed by adding another module. No complicated communication and control devices are needed.
- (5)
The AC bus is segmental and is interconnected by three-port converters. The sectional AC bus can be controlled by individual modules. It is easier to guarantee the voltage quality compared to the conventional microgrid.
2.2. Three-Port Converter and Its Control Strategy
The three-port converter in
Figure 3 consists of an AC/DC rectifier and DC/AC inverter. The left half is the AC/DC rectifier. The rectifier is the three-phase three-wire system and realizes the controllable three-phase balanced power flow. Because variables can be transformed to DC variables which are easily filtered and controlled in the
dq rotating reference frame [
25], the mathematical model of the rectifier is described as:
where
,
,
,
,
, and
are the filter currents, grid voltages, and control voltages in the
dq rotating reference frame.
is the voltage frequency of the microgrid.
Figure 4 displays the power control block of the rectifier, where
P* are
Q* are the reference values of active power and reactive power, respectively,
, and proportional-integral (PI) controllers are adopted for the filter current control.
The right half is the DC/AC inverter with three-phase four-wire structure. Three-pole reactors and transformers are adopted to realize electrical isolation. There are three full-bridges on the primary side. The secondary side of the transformer is connected in Y mode.
There are single-phase load and nonlinear load in the module. Three-phase balanced voltage is required and the voltage control is therefore crucial. According to the structure of the inverter, the three-phase inverter’s control is simplified to control the three individual single-phase inverters. Precise digital phase-lock control is a prerequisite to other control loops. Phase difference between phase A voltage and the system synchronous pulse is used to regulate the period of SPWM wave with P controller. Phase B and C voltage references can be obtained by delaying the phase A voltage reference by 120° and 240°, respectively.
The voltage control strategy of the inverter is shown in
Figure 5, which includes RMS control and waveform control of voltage. The RMS voltage control adopts the traditional PI controller. The voltage waveform control consists of feedforward control, instantaneous voltage current dual-loop control, and repetitive control. The feedforward control is used to eliminate the influence of battery voltage variation through proportional gain
. The instantaneous voltage current dual-loop control is used to improve the system dynamic response through proportional gains
Ku and
Ki. Repetitive theory is based on internal model principle and can realize the zero-error tracking of sine signal [
26]. The repetitive controller (
RC) indicated with the dashed frame in
Figure 5, is used to reduce the total harmonic distortion of the voltage especially the resistor-capacitor-diode (RCD) load.
The
Z domain transfer function of the repetitive controller is:
where
N is the sample number in one period time.
is the proportional gain to determine the final output.
improves the robustness of the system. Leading loop
generates the correcting signal ahead of
K steps in terms of the error of the previous cycle. Compensator
shapes the plant to ensure the system is stable.
A 100 kVA three-port converter is developed with DSP TMS320F28335. Filters , Capacities . PWM modulation frequency is 9.6 kHz. Parameters of the repetitive controllers are .
4. Proposed Methodology
In this section, an improved SSO called iSSO is proposed. Before introducing the proposed iSSO, the original population-based stochastic optimization method SSO proposed by Yeh in [
21] is discussed in
Section 4.1.
4.1. Overview of the Original Simplified Swarm Optimization (SSO)
Yeh’s SSO is a straightforward SI, efficient evolutionary computation method, and is able to hybridize with other algorithms. Like most soft computing, SSO needs to be initialized with solutions randomly, and it then updates solutions from generation to generation. Let pBest Pi = (pi1, pi2, …, piNvar) be the best ith solution currently and PgBest = (g1, g2, …, gNvar) be the best among all pBests currently. The fundamental concept of SSO is that each variable of any solution needs to be updated to a value related to its current value, its present pBest (a local search), the present PgBest (a global search), or a random movement to a feasible value. Note that the purpose of a random movement is to continue the diversity of population and the capacity to escape from a local optimum.
After
cw,
cp, and
cg are given, the original SSO update mechanism is established based on the simple modeling below:
where for
i = 1, 2, …,
Nsol,
j = 1, 2, …,
Nvar, and
t = 1, 2, …,
Ngen − 1. Note that
cw,
cp, and
cg are three predetermined parameters that construct four interval probabilities and can be fixed or flexible. The detailed steps of SSO are described as follows:
PROCEDURE SSO
- STEP S1.
Initialize randomly, calculate , let t = 1, and find gBest, PgBest for i = 1, 2, …, Nsol.
- STEP S2.
Let i be 1.
- STEP S3.
Update to based on Equation (25).
- STEP S4.
Let if . Otherwise, go to STEP S6.
- STEP S5.
Let gBest = i if F(Pi) < F(PgBest).
- STEP S6.
Let i = i + 1 and go to STEP S3 if i < Nsol.
- STEP S7.
Let t = t + 1 if t < Ngen and go to STEP S2; otherwise, halt.
4.2. The Matrix-Based Solution Structure in the Proposed iSSo
In the problem discussed in
Section 3, we needed to solve the best
PE2(
ti),
PE3(
ti), and
Pdsl(
ti) for
i = 1, 2, …, 96. Thus, there were 3 × 96 decision variables that needed to be solved. The proposed solution structure was a matrix with size 3 × 96. In this matrix, the values of
PE2,
PE3, and
Pdsl were represented in the first, second, and third rows; the
ith column was the related value at time
ti.
4.3. The New Update Mechanism in the Proposed iSSO
The update mechanism is always the most important in an AI algorithm. There are more than 6 × 96 constraints in the proposed problem. Hence, it is easy to have an infeasible solution. To avoid obtaining an unfeasible solution in the search process of the proposed iSSO, the update mechanism of the original SSO was revised in the proposed iSSO as follows:
where
i = 1, 2, …,
Nsol;
j = 1, 2, 3;
k = 1, 2, …,
Nvar = 96;
t = 2, 3, …,
Ngen;
is a random number generated from a uniform distribution between 0 and 1; and
is a random integer generated from a uniform distribution between 1 and 96. Note that each variable has different value of
if
k <
in the above update mechanism. However,
is fixed for each solution in each generation.
The basic idea behind the above update mechanism was to try to keep the feasibility of the solution because the large number of constraints resulted in a high chance of having an infeasible solution. Hence, one tk was selected randomly first for each solution in each generation and all variables before tk were either copied from gBest, the same solution, or generated randomly. The first two situations described above were able to keep the feasibility of these variables since and PgBest were already feasible. It was still necessary to have a random movement to escape from possible local traps, i.e., these variables needed to be regenerated after k < .
Hence, there are two major differences between the traditional SSO and the proposed iSSO in the update mechanism:
The role of the
pBest is removed completely, i.e.,
cp is no longer used. Note that effective and efficient exploration with SSO depends on the quality of
gBest [
6,
16,
17,
18,
19,
20,
21,
22] and the roles of
pBest can be removed for some cases.
The proposed update mechanism has two stages: first decide a variable randomly, then all variables before the selected variable need to be generated completely randomly, copied from the gBest, or kept the same according to the in the first stage. All variables positioned after the selected variable are generated randomly in the second stage.
Note that the related update solutions or the initial solutions need to be regenerated if they are infeasible.
4.4. Survival of the Fittest Policy
It is very hard to produce a feasible solution in the proposed problem and it is even harder to provide an improved solution. Hence, the selection policy of updated solutions was changed from the “compulsory replace policy” in the original SSO to the “survival of the fittest policy” in the proposed iSSO. The former policy accepts the new updated solution unconditionally even if it is worse than the old solution; the latter policy replaces the old solution with a better updated solution. Furthermore, only these improved solutions are compared to the gBest, and a new solution can replace gBest if it is better than gBest.
4.5. The Pseudo-Code for the Proposed iSSO
The pseudo code of the proposed iSSO based on the proposed new solution structure, new update mechanism, and the “survival of the fittest policy” is listed as follows:
- STEP 0.
Generate Xi, calculate F(Xi), find the gBest, and let t = 1, for all i = 1, 2, …, Nsol.
- STEP 1.
Let i = 1.
- STEP 2.
Update Xi based on Equation (26).
- STEP 3.
Keep the new Xi based and go STEP 4 if it is better than old Xi. Otherwise, discard the new Xi, keep the old Xi, and go to STEP 5.
- STEP 4.
Let gBest = i if F(Xi) < F(PgBest).
- STEP 5.
Let i = i + 1 and go to STEP 3 if i < Nsol.
- STEP 6.
Let t = t + 1 and go to STEP 2 if t < Ngen.
Figure 7 shows the flowchart of economic dispatch of modular microgrid based on the iSSO method. The red dotted line frame depicts the new update mechanism. The blue dotted line frame depicts the survival of the fittest policy. When date time and weather parameters are inputted to the basic database, the database will output the wind and solar power, load power for economic dispatch.
5. Experiments
Empirical research on configuration and operation control of the modular microgrid was conducted on the DongAo Island. One day was chosen as an example. The weather is clear. The maximum temperature is 27 °C and the minimum temperature is 17 °C. Wind direction is north and wind speed is 3–4 level.
Figure 8 shows the voltages of DC/AC inverter of three-port converter. It realized three-phase balanced AC bus voltage output with low distortion.
Figure 9 shows the load currents of one measurement point in the comprehensive building zone. There exists two power consumption peaks in a day. One was from 8:00 to 12:00 and the other was from 18:00 to 22:00. There were serious unbalanced three-phase currents in the measurement point. Phase B load current varied drastically from 10 A to 70 A. Phase C load current remained steady around 10 A. The amplitude of Phase A load current was between Phase B and Phase C. Voltages shown in
Figure 10 varied between 235 V and 245 V. Though the voltages at the output terminal of the three-port converter were three-phase balanced, the voltages at the measurement point were unbalanced through the transmission line and voltages also needed the reactive compensator in the microgrid.
Figure 11,
Figure 12 and
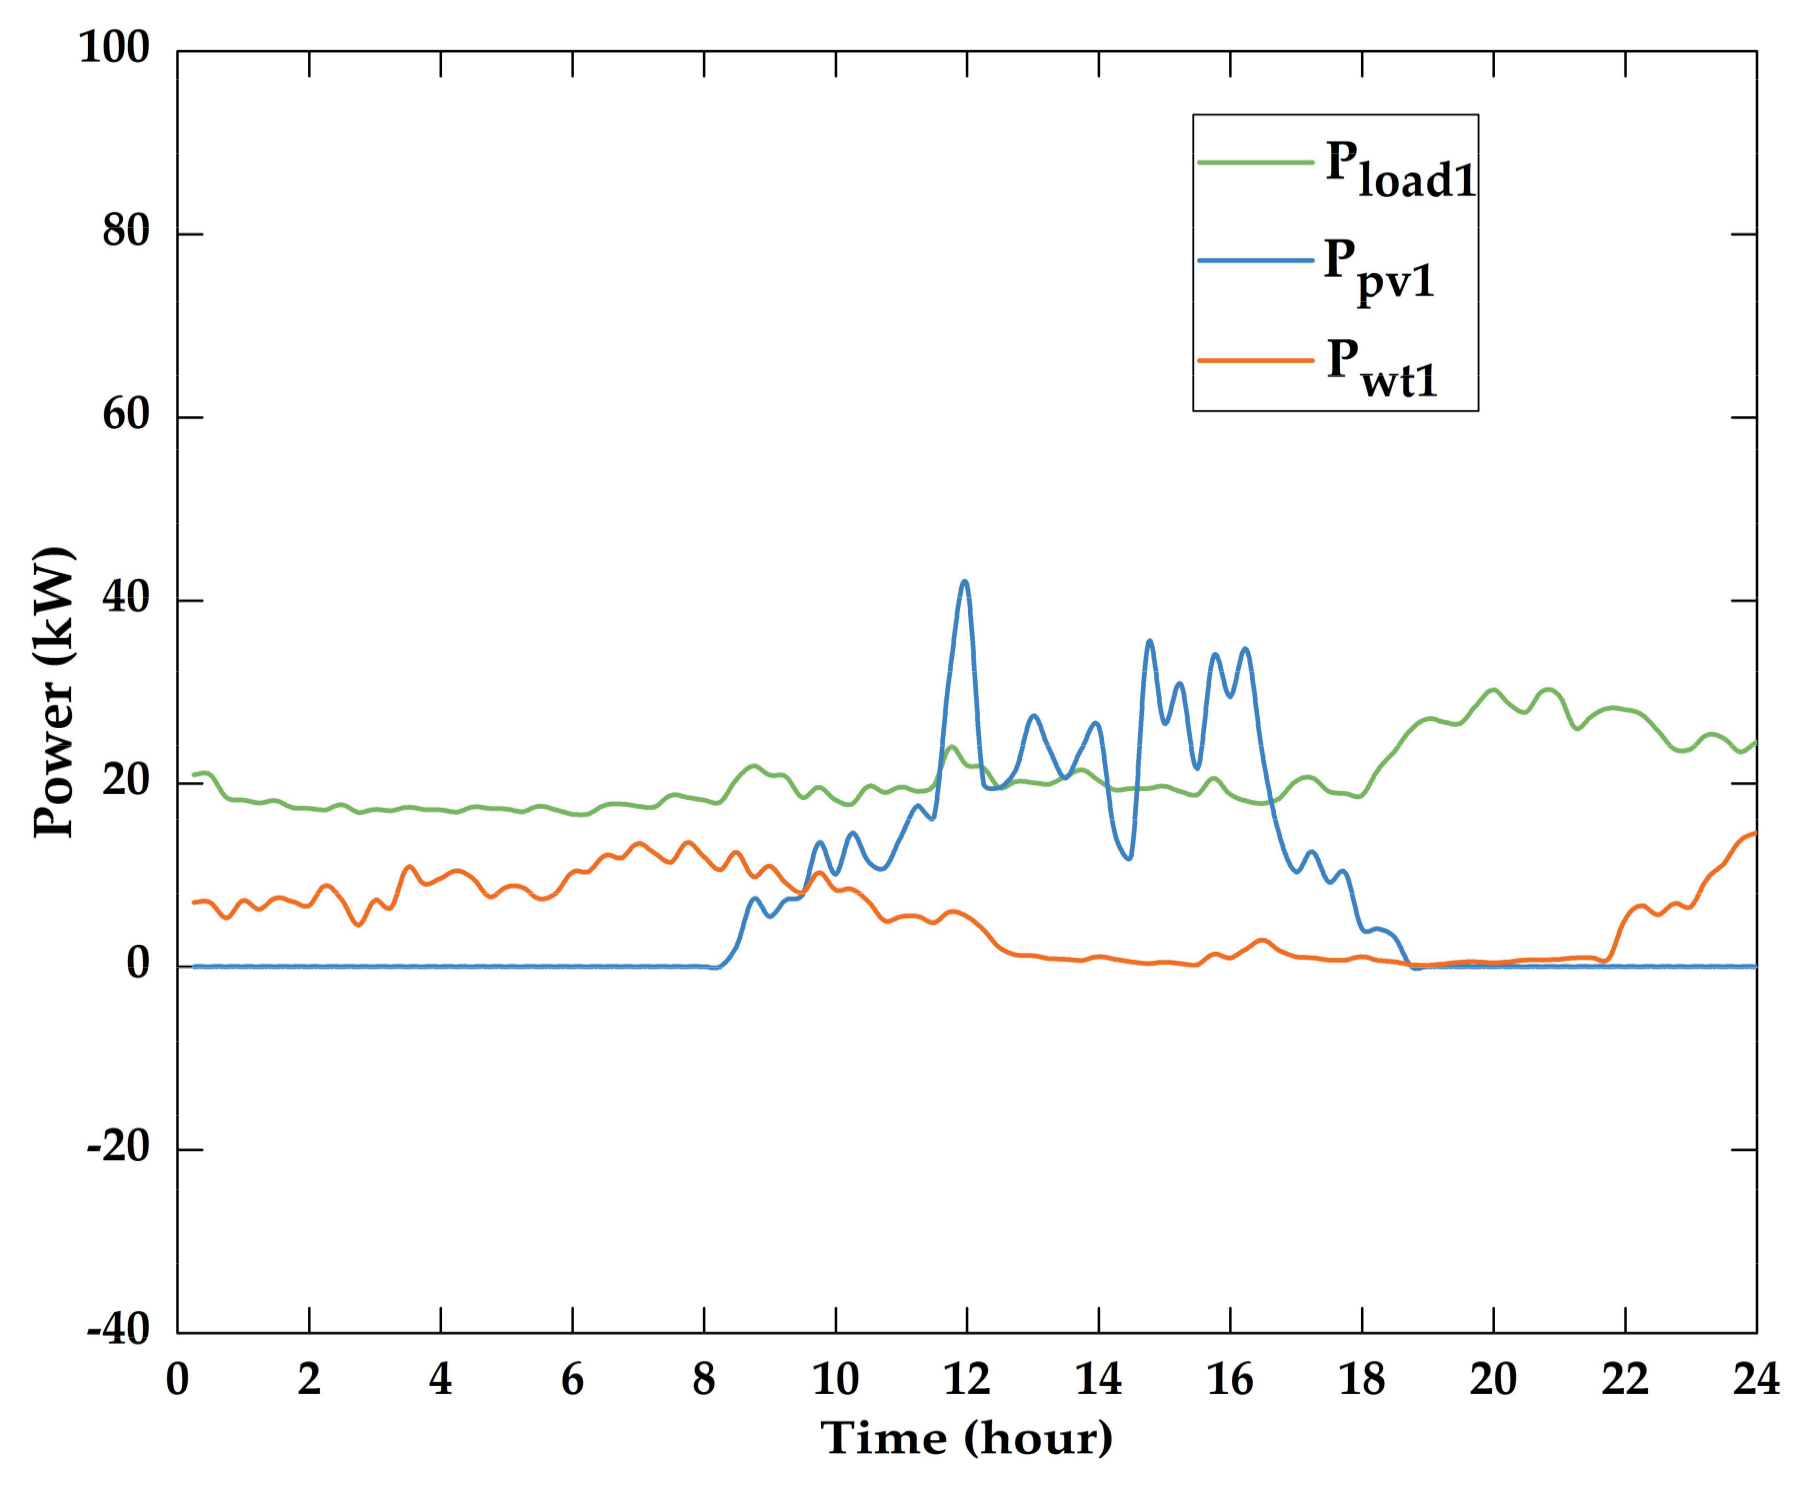
Figure 13 show wind power, solar power, and load power in modules A, B, and C. Solar power showed the same trend and was generated between 8:00 to 18:00. Different geographical location leads to different wind speed and wind direction. Therefore, wind power differed between modules. The load power also changed greatly in different regions corresponding to different electrical equipment.
Figure 12 shows the sum power of modules A, B, and C. It is evident that the variation in solar power increased while the load power was smoothed.
Figure 14 shows the total wind power, solar power and load power in the microgrid. From
Figure 14 total load power and wind power can be smoothed through the module interconnection, but the variation of the solar power enforces.
Figure 15 shows the battery power when modules run independently. The charge and discharge power of batteries varied greatly. Because the solar power was greater than the load power, batteries in modules A, B and C were charged from 11:00 to 16:00. Batteries were discharged during the remainder of the time.
Figure 16 shows SOCs of batteries when modules run independently. The power of battery 1 in module A discharged 50% of the maximum SOC at 9:00 and ran out at 21:45. The power of battery 2 in module B discharged 50% of the maximum SOC at 4:30 and ran out at 9:00. Battery 3 in module C was overcharged from 15:45. If modules run independently, the capacity of the batteries has to be enlarged to maintain reliable operation. Modules working in grid-connected mode can make full use of the distributed batteries in the microgrid and lower the battery investment. Therefore, economic dispatch of modular microgrid is essential.
In order to get the optimal operation strategy, the proposed iSSO was implemented in C programming language and run on an Intel Core i7 3.07 GHz PC with 6 GB memory. The runtime unit is CPU seconds. Moreover, cg = 0.45, cw = 0.30, Ngen = 3000 (the number of generations), Nrun = 30 (the number of independent runs), and Nsol = 100 (the number of solutions) for the proposed iSSO.
Table 1 shows the results of the numerical calculations. It only shows 10 particles due to the limitation of space. It can be seen that the minimum operation cost was about
$1163, convergence was achieved within the number of generations
Ngen = 3000, and the runtime was about 70 s.
Table 2 shows the results of the numerical calculations by the PSO method. It also only shows 10 particles due to the limitation of space. It can be seen that the minimum operation cost was about
$1310, convergence was achieved within the number of generations
Ngen = 4000, and the runtime was about 100 s. The operational cost of the iSSO method is 12.6% lower than that of the PSO method. Because the new update mechanism and survival of the fittest policy are adopted, the convergence rate of iSSO method is increased by 29% compared with the rate of convergence of PSO method. Results clearly indicate the proposed iSSO method is more effective than the traditional PSO method.
Figure 17,
Figure 18,
Figure 19 and
Figure 20 show the solutions obtained from the proposed iSSO for the economic dispatch problem.
Figure 17 shows the start-stop time and output power of the diesel generator power. The diesel generator mainly ran between 0:00 and 9:00. During this period, renewable power generation was less than consumption power, and so the diesel generator had to be used. The diesel generator worked mainly above 80% of the rated power so as to increase the generation efficiency. In order to reduce the charging cost of the battery, a low power output from the diesel generator was sometimes needed, such as 50% at 7:00. At 14:30, there was a deep drop in solar power, and the diesel generator power was immediately needed to compensate for the power fall. The solar power declined from 18:00, and the load should be met by wind power and battery discharge. From 19:00 to 20:00, the diesel generator also ran.
Figure 18,
Figure 19 and
Figure 20 show the power exchanges among modules and microgrid. 6:00 is chosen as an example. The total renewable wind power was 44 kW and the total load power was 82 kW in the microgrid. Therefore, the power shortage was 38 kW and the diesel generation worked with 70 kW output. The wind power was 18 kW and the load power was 48 kW in module B so the power shortage was 30 kW. Module B borrowed 16 kW from the microgrid with
PE2 = −16 kW and the discharge power of battery 2 was 13 kW, which alleviated the intensity of the discharge. The wind power was 14 kW and the load power was 17 kW in module C, so the power shortage was 3 kW. Module C borrowed 6 kW from the microgrid with
PE3 = −6 kW and the charge power of battery 3 was 3 kW. Accordingly, Module A sent 22 kW to the microgrid and the charge power of battery 1 was 41 kW.
Figure 21 shows the battery power. The charging process and discharge process were alternating. Therefore, the SOCs of batteries were always within the permissible range as shown in
Figure 22. Results show that the diesel generator worked at high efficiency and module interconnection could realize the optimal power flow and improve the economic returns. The final SOCs of batteries were the same (150 kWh), and the SOCs during the whole process did not exceed the upper limit of 300 kWh, which verifies the effectiveness of the economic dispatch strategy.


