Study of Photovoltaics and LED Energy Efficiency: Case Study in Hungary

1
Department of Economic Methodology, University of Pannonia, Georgikon Faculty, 8360 Keszthely, Hungary
2
Department of Business, Colorado Mesa University, 1100 North Ave, Grand Junction, CO 81501, USA
*
Author to whom correspondence should be addressed.
Energies 2018, 11(4), 790; https://doi.org/10.3390/en11040790
Submission received: 28 February 2018
/
Revised: 26 March 2018
/
Accepted: 27 March 2018
/
Published: 29 March 2018
(This article belongs to the Special Issue Sustainable and Renewable Energy Systems)
Abstract
:Photovoltaic (PV) energy and energy efficiency have an increasing role in global energy usage. This paper is a study of building photovoltaic systems (PVS) to modernize existing or developed street lighting systems in Hungarian villages of 900–1200 inhabitants. The objective of this study is to show the economic questions related to the investments in photovoltaic systems and light emitting diode (LED) street lighting developments under Hungarian regulations. With the help of this study, it may be possible to support local governments to use combined photovoltaic energy for street lighting developments. This article presents the Hungarian regulations regarding photovoltaic systems and shows why local governments are not able to connect their street lighting systems to photovoltaic systems. Three different investment alternatives for local governments are studied with the help of economic indicators. Our conclusion is that investments in photovoltaic street lighting systems can be profitable if a street lighting system already exists and requires no modernization. Under the current regulations of Hungary, the examined projects can be viable only to offset the energy costs of street lighting by the delivery price of electricity from the PVS.
1. Introduction
1.1. Change in Spread of Photovoltaic (PV) Technology
Energy consumption has had an essential role in humanity since the last century, and the constantly growing energy demand of the world is one of mankind’s biggest issues. We can see that renewable energies have an increasing role in the process of energy production [1,2].
Renewable energy resources are becoming increasingly important. There are two main reasons: firstly, the ever-increasing energy demand of the world, and secondly, the reduction of negative environmental effects. Solar energy from the Sun is a sustainable and clean energy source available in a huge volume with the greatest potential for human use. The efficiency of the utilization of solar energy coming to the Earth can be influenced by a number of factors [3]. The extensive use of solar energy production is increasingly justified by humanity’s growing energy demands, and it can make an important contribution to the promotion of sustainable energy management, in addition to providing many other benefits [4,5,6]. There are many applications of solar energy; we can find complex, concentrated energy generation methods and also passive heat production, etc. [7].
PV technologies use solar modules that transform solar energy into electricity. A significant increase in solar energy production can be seen in recent years, mainly due to decreasing investment costs, quick technological development, and governmental support announced in numerous countries: The total installed power of solar PV systems was 23 GW in 2009; it stood at 177 GW in 2014; and this figure was at 303 GW in 2016 with the largest proportion (106 GW) in the EU (Germany 41.3 GW), according to the International Energy Agency (IEA) and the Renewable Energy Policy Network. Renewable energy production represented 24.5% of all energy produced at the global level, of which solar energy systems accounted for almost 1.5% in 2016 [8,9,10,11,12].
1.2. Feed-In-Tariff (FiT) in Hungary, Overall Summary
Electricity from renewable energy sources is supported by a FiT for installations with a capacity of 50–500 kW in Hungary. For installations with a capacity of 500–1000 kW, the market premium applies. Power plants with a capacity over 1000 kW and generally all wind power plants are obliged to participate in a tendering procedure in order to receive the green premium. A government decree currently inhibits the grid connection and the construction of wind power plants until at least 2019. Household-sized power plants (HMKE) up to 50 kW can benefit from net metering. In general, subsidy programs also promote the use of renewable energy sources in the heating and electricity category. In 2017, those subsidy programs were realized foremost within the framework of the Economic Development and Innovation Programme (EDIOP) and the Environment and Energy Efficiency Operational Programme (EEEOP), which offered non-repayable favorable loans and grants, inter alia in combination with the FiT. The majority of the invitations to tender has not been published yet. The major support scheme of using renewable energy is a quota system supplemented by a reimbursement of an excise duty in the transportation category [13]. Renewable energy plants shall be given priority grid access and grid connection. The expansion of the grid and the costs for the connection of renewable energy plants are borne either by the plant operator or by the grid operator, depending on certain criteria. There are a number of policies intending to promote the installation, development, and use of renewable energy source installations [13].
The support system for ‘green electricity’ from renewable energy sources was modified in 2016 and was partially replaced by the new Renewable Energy Support Scheme (METÁR), which came into force on 1 January 2017. The FiT system comprises three subsystems for support determined by the power plant’s capacity [13]. With this regulation, 15 min electricity production forecasts should be made for every single day if the system size is above 50 kW. In the case of a deviation of more than +/−50% (in the case of a 15-min measurement interval), the PV power plant owners have to pay surcharge [14].
In Hungary, it is possible for even residential customers, business customers, and local governments with HMKE, which means a PV system (PVS) smaller than 50 kW, to feed the energy produced by PV modules into the grid in addition to purchasing energy. The amount fed into the system and the amount of energy consumed are calculated every year and only the difference has to be financially settled. In this case, it is not necessary to create a 15-min electricity production forecast and there is no surcharge. If there is extra consumption, the HMKE owner will pay, but in the event of extra production the power company pays (about 50% less) the consumer. Thus, the national grid also has an energy storage role from which both parties benefit [15,16], the benefits of which are described in greater detail below:
- It is beneficial to consumers that they can be self-sufficient even with smaller-sized PV systems and they do not have to face the losses of storage and costs.
- The electricity company meets the legal requirements. The owner of the PVS continues to pay the network access fee, and there is no need to develop the grid in order to provide the security of supply due to the currently small number of such PV systems.
1.3. Energy Efficiency Aspects in the European Union (EU)
From generation to final consumption, energy efficiency has to increase at every stage of the energy chain. The benefits of energy efficiency must outweigh the costs at the same time, such as those that result from carrying out renovations [17].
By 2020, the EU has set itself a 20% energy savings goal. From production to final consumption, all EU countries will need to use energy more efficiently at all stages of the chain. In 2016, the European Commission proposed an update for the Energy Efficiency Directive including a new 30% energy efficiency target by 2030 [17].
For industry and consumers alike, new national measures must ensure major energy savings, for example:
- energy distributors or retail energy sales companies have to achieve 1.5% energy savings/year through energy efficiency,
- the public sector in EU countries should purchase energy efficient buildings, services, and products,
- the management of energy consumption should be progressing,
- energy audits for large companies to help them identify ways to reduce their consumption should be conducted,
- the monitoring system should be progressing [17].
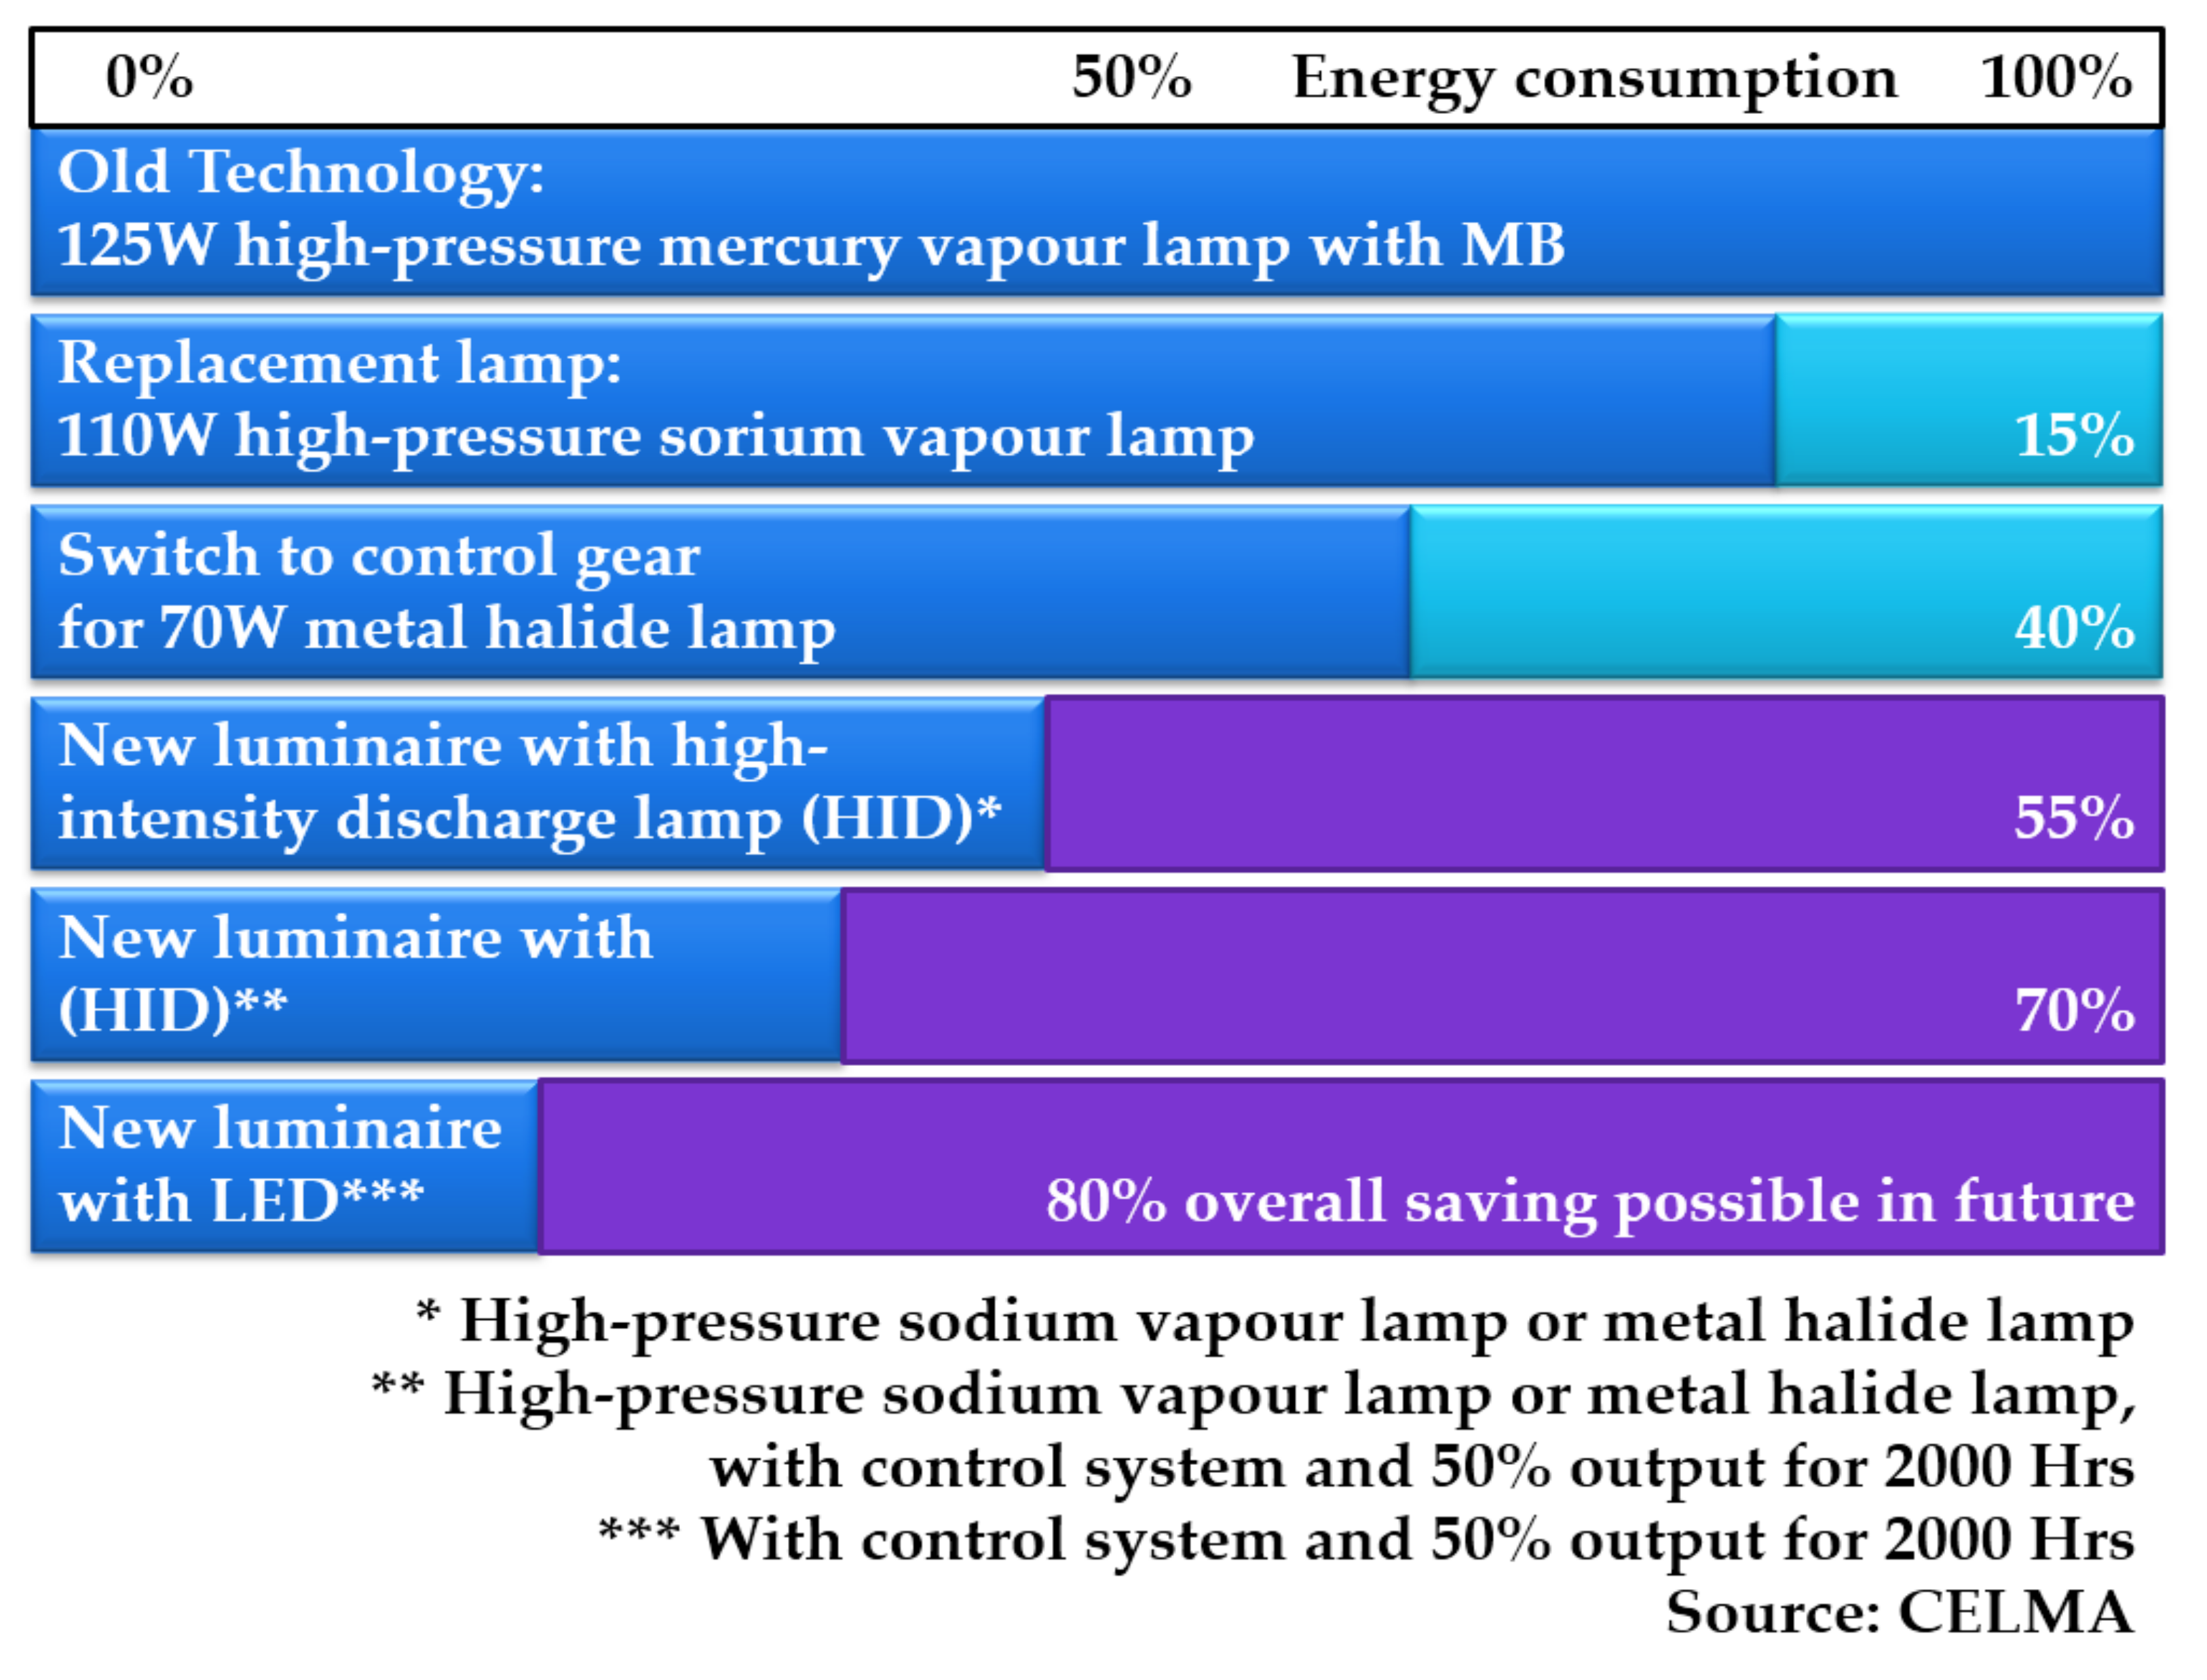
Public lighting is responsible for 2.3% of the global electricity consumption. Thus, municipal energy efficiency projects can be financially feasible and environmentally friendly. Some energy-saving projects in this field have enabled reductions in electricity consumption by more than 50%. Policymakers are paying more attention to the energy consumption of urban street lighting. This is demonstrated by the increasing commitment of city authorities towards energy efficiency and using green energy for public lighting systems. The smart lighting system can be controlled together and separately as well, which means that luminous intensity and lumen packages are dimmable depending on the requirements. The disadvantage is the extra 5–10% investment cost [18,19,20]. The theoretical energy-saving potential of exterior lighting is shown in Figure 1.
1.4. Public lighting in the European Union
In the 21st century, pursuing energy-efficient improvements has become a priority in all fields of public administration, not only from environmental sustainability viewpoints, but also since the prediction of energy consumption forecasts a global increase of almost 40% by the year 2030 [18,22]. Not surprisingly, the improvement of energy efficiency is at the basis of the internationally significant trend towards smart city projects and research [18,23,24,25,26].
Referring to the operations that can be undertaken, the recommendations for energy efficiency by the IEA cover seven different priority areas: lighting, buildings, transport, appliances, industry, energy utilities, and cross-sectoral issues [18,25,26].
Street lighting is an important contributor to public and traffic safety. Nevertheless, assuring good visibility during hours of darkness also requires a substantial amount of money and electricity. In street lighting, the possibility of improving efficiency was also recognized by European policies, which has led to the compulsory phasing out of many types of lamps frequently used for street lighting. About 80% of all lamps currently in operation will be affected by the phase-out (these product groups will no longer be available for purchase), including high-pressure mercury (HPM) and high-pressure sodium (HPS) lamps. In the EU, more than 56 million street lighting luminaires are in operation, with an estimated electricity consumption of 35 TWh. The older, inefficient street lighting systems can account for 30–50% of the total electricity consumption. With current light emitting diode (LED) technologies, 30–70% energy savings are possible—a potential that has been incorporated in and recognized by European policies. An important ‘STREETLIGHT-EPC’ project has been successfully developed for creating supply and demand for energy performance contracting (EPC) in 9 regions by setting up regional EPC facilitation services. There is a significant connection between investments in the energy management of public lighting and its influence on lower emissions of CO2. LED technology for street lighting offers high savings, and its cost reduction can be as much as 50%. Over the course of the STREETLIGHT-EPC project [19,27]:
- 63 projects were realized, triggering an investment of 29 million euros and annual savings of 28,000 MWh, as well as over 3.5 million euros in maintenance and electricity costs.
- 12 new European Skills/Competences and Occupations (ESCO) have implemented projects and 8 more companies have started offering energy performance contracting services.
The project team included 9 regional organizations/agencies, which provided the energy performance contracting facilitation services, and a European network of 9 municipalities [27].
Local governments in the EU paid 7.6 billion EUR to light public streets in 2015. Therefore, the European Commission is trying to help cities find support. Technological fixes that cut pollution and save energy in cities could qualify for European Commission funds designated for projects that meet EU lowered emission goals or energy efficiency. Funds set aside for smart city projects through the Horizon 2020 programme are earmarked to develop low-emission or transport system energy efficiency [28].
2. Economic Aspects of PV Systems and LED Street Lighting Developments
This study focuses on villages with 900–1200 inhabitants. Villages of that size account for 20% of the total number of Hungarian settlements. These villages have a lack of money; therefore, PV and street lighting developments can be a project that can decrease the financial expenditures of these settlements. This part deals with the economic questions related to the investments in the PV systems and LED street lighting development.
In the course of these economic calculations, not only the investment needed for the PV and/or LED street lighting system is examined, but also the annual extra yield and financial expenditure under the current regulations in Hungary, in case of HMKE. This option is available for residential, business, and local government customers on a yearly basis [15,16,29,30]. In this case, it is not necessary to create an electricity production forecast; therefore, this option is more attractive for investors than METÁR.
It is not possible to set up an HMKE for places of consumption for public lighting because the public lighting distribution network is not a local government property. This means that the electricity consumption of public lighting must be paid for from other budgets. The HMKE regulatory system provides a solution to this because local governments prefer the installation of PV systems by the institutions they own, such as libraries, hospitals, schools, kindergartens, etc. Some renewable energy or energy efficiency investments can get 60% or even 85% non-refundable support in Hungary [14,16,20,30,31,32].
The primary data was provided by the local government of Pusztacsalád, a village in the Northwestern part of Hungary, and Bács-Zöldenergia Ltd. (Kecskemét, Hungary). The model was validated based on empirical data, provided by PANNON Pro Innovations Ltd. (Budapest, Hungary) and the local government of Pusztacsalád. PANNON Pro Innovations Ltd., has developed a business model for PV project development and successfully launched Pannon Green Power Ltd. (Budapest, Hungary), which has become the leading private PV development company in Hungary. Other information and data come from the street lighting developments of the two West Hungarian towns of Balatonfüred and Balatonakarattya [20,31,32,33,34,35,36,37].
The following equipment, materials and services are required for a PVS and for a street lighting system [35,36,37]:
- PV system: PV modules, PV-inverter, frames, cable with outlets, additional electric outfit, and costs of design, installation, and transportation.
- Street lighting system: light fixture, intelligent lighting with sensors and digital processors (optional), cable with outlets, additional electric outfit, and costs of design, installation, and transportation.
Calculations were made in relation to the public lighting costs of the local government of Pusztacsalád (the village has about 260 inhabitants), which is 2042.7 EUR/year gross. It means 55 pieces of old-technology luminaires. This amount could be offset by a 12 kW system for the local government under Hungarian regulatory and climatic conditions. Based on this data, it can be stated that a 50 kW on-grid PVS (this is the maximum size system in HMKE) can generate the electricity consumption costs of 229 light fixtures, which is 8511.3 EUR/year in Hungary. A 50 kW system can be suitable for a village with 900–1200 inhabitants [30,34,35,36,37].
Local governments in Hungary have the opportunity to choose from the following three investment alternatives to decrease their electricity costs related to street lighting systems by PV energy:
- Only a PVS is built (without any street lighting development) to reduce the energy costs of the existing street lighting system.
- Photovoltaic investment for an existing old street lighting system (PVOSLS): An old street lighting system (OSLS) already exists. 50 kW PV investment, without street lighting development, a target of 8511.3 EUR offset per year.
- Photovoltaic investment for an existing non-smart street lighting system (PVNSLS): A non-smart street lighting system (NSLS) with 229 luminaires already exists. The local government decides to build a PVS to offset the remaining electricity costs of the street lighting system. This means 3404.5 EUR saved.
- Photovoltaic investment for an existing smart street lighting system (PVSSLS): A smart street lighting system (SSLS) with 229 luminaires already exists. The local government decides to build a PVS to offset the costs of the street lighting system. This means 2553.4 EUR saved.
- Only the street lighting system of the village is developed without any PVS.
- NSLS: A non-smart street lighting system is developed with 229 luminaires but without a PVS.
- SSLS: A smart street lighting system is developed) with 229 luminaires but without a PVS.
- The old street lighting system (OSLS) has been replaced by a new street lighting system (NSLS/SSLS) (60%/70% energy saving compared with the OSLS [21] and a PVS is built to offset the electricity consumption cost of the OSLS.
- Photovoltaic and non-smart street lighting investment (PV+NSLS): 20 kW PV investment, with street lighting development without smart lighting system, 60% energy saving, a target of 3404.5 EUR saved per year after street lighting development.
- Photovoltaic and smart street lighting system (PV+SSLS): 15 kW PV investment, street lighting development with a smart lighting system, 70% energy saving, a target of 2553.4 EUR saved per year after street lighting development.
Table 1 shows the nomenclature of the investment alternatives used in this paper.
The following three colors are used in the tables in the following chapter:
- Green: only PV investment.
- Orange: only street lighting investment.
- Grey: PV + street lighting investment.
A period of 20 years was studied, mainly due to the 20-year lifespan of LED lighting [38]. Maintenance work usually needs to be carried out during this time period, and the inverter should be replaced every 10 years as well. The annual performance degradation characteristic of crystalline PV modules was determined as 0.5%, which is a generally accepted value [39,40]. The calculations involved 10% loss in the PVS and a tilt angle of 35°. Based on dynamic return indicators, the net present value (NPV), profitability index (PI), and discounted payback period (DPP) of PV and street lighting systems were determined according to internationally applied methods for economic calculations [41].
The current interest rate needed for the calculation of the time value of the dynamic economic indicators was determined to be 2.8% in accordance with the 8 January 2018 status of the long-term Hungarian bond yields (The lifetime of this bond yield is 20 years, equal to the lifetime of the investments). The annual change of the electricity price has been determined to be 0.62% in accordance with the inflation rate of the period of 2014–2017. Inflation is important because of the changes in feed-in-tariffs, while government bond yields are needed for future income expectations [42,43]. In the case of business customers, gross values were used for the calculation. The electricity gross price for local governments was determined to be 15.42 EURcent/kWh in the first year of the calculation [44]]. An exchange rate of 310 HUF/EUR was used for calculation (Table 2) [45]. For PV energy simulations, we used the JRC Photovoltaic Geographical Information System (PVGIS). Data of the PVGIS included real climatic data series of several decades. The ratio of CO2/electricity was calculated with a 0.537 kg / kWh correlation [46]. In Hungary, local governments do not have the opportunity to sell their CO2 savings on the global market and the state does not compensate them.
3. Economic Evaluations
The above-mentioned scenarios are presented here in the same order as above.
3.1. First Investment Scenario: Only PV Investment
We study the only PV investment scenario first (marked by green). A given village (with 900–1200 inhabitants) has a street lighting system (OSLS, NSLS, or SSLS). The local government has decided to pay for the costs of the street lighting system from the incomes of the PVS. This means only one investment: a PV investment, whose size is determined by the electricity costs of the consumption of the street lighting system.
The 50 kW PV investment has the highest power, and it also has the biggest investment cost. The profitability index has its peak value here. 50 kW is the maximum power that is allowed in the HMKE system. Consequently, it is not worth it to increase the system power above 50 kW. For PV systems above 50 KW, 15-min electricity production forecasts should be made for every day, and if the forecast has a deviation, the forecast maker has to pay a fine [14].
Because of the HMKE, the energy generated by the PVS will not provide power for street lighting systems (SLS) in Hungary, but the selling price of the electricity from the PVS will offset the purchase price of electricity for SLS. That is the reason why it is not a good decision to improve the power of the PVS below 50 kW for any SLS if the energy cannot be used.
It is a good choice for a local government to build a PVS to reduce the costs of the electricity consumption of street lighting systems. According to our study, every Hungarian village with 900–1200 inhabitants should do so if it has enough money to pay for the investment. If the local governments can receive a loan with a maximum interest of 14.4% for 50 kW systems, 7.9% for 20 kW systems, and 7.5% for 15 kW systems, local governments could make the investment (Table 3).
3.2. Second Investment Scenario: Only Street Lighting Development
The local government does not want to build a PVS and prefers only street lighting development. Thus, no energy is produced; only the costs of the electricity consumption of the street lighting system are reduced. A non-smart street lighting system saves 60% of the energy, and a smart street lighting system can achieve energy savings of 70% compared to the OSLS.
Table 4 shows us that this development is not a profitable investment for a local government in Hungary. Regarding an investment lifespan of 20 years, a 37% support intensity is needed for a smart lighting system, and 28% support intensity is needed for a non-smart street lighting system.
A smart system results in more savings than a non-smart system but it also costs more. The difference is bigger between the investment costs than between the net present values. We can determine in Table 3 that choosing a smart street lighting system is better than a non-smart system, taking only economic factors into consideration.
3.3. Third Investment Scenario: PV Investment Plus Street Lighting Development
Table 5 shows us a street lighting development including PVS. The size of the PVS is determined by the cost of the electricity consumption of the SLS.
The 20 kW system has the target to save 3404.5 EUR per year, and the 15 kW system is supposed to save 2553.4 EUR per year. The PVS will offset the whole electricity cost of the street lighting system. Two street lighting systems are studied here: smart and non-smart. The smart street lighting system has smaller consumption than the non-smart one. Consequently, a PVS with a smaller performance is needed for this system.
Both investments have negative net present values, and their discounted payback periods are longer than 20 years. An 18% support intensity is needed for the non-smart system and 16% for the smart system.
Based on Table 5, we can determine that a smart street lighting system development with a PVS is a better investment than a non-smart street lighting system with a PVS.
3.4. Comparison of the Investment Scenarios Studied
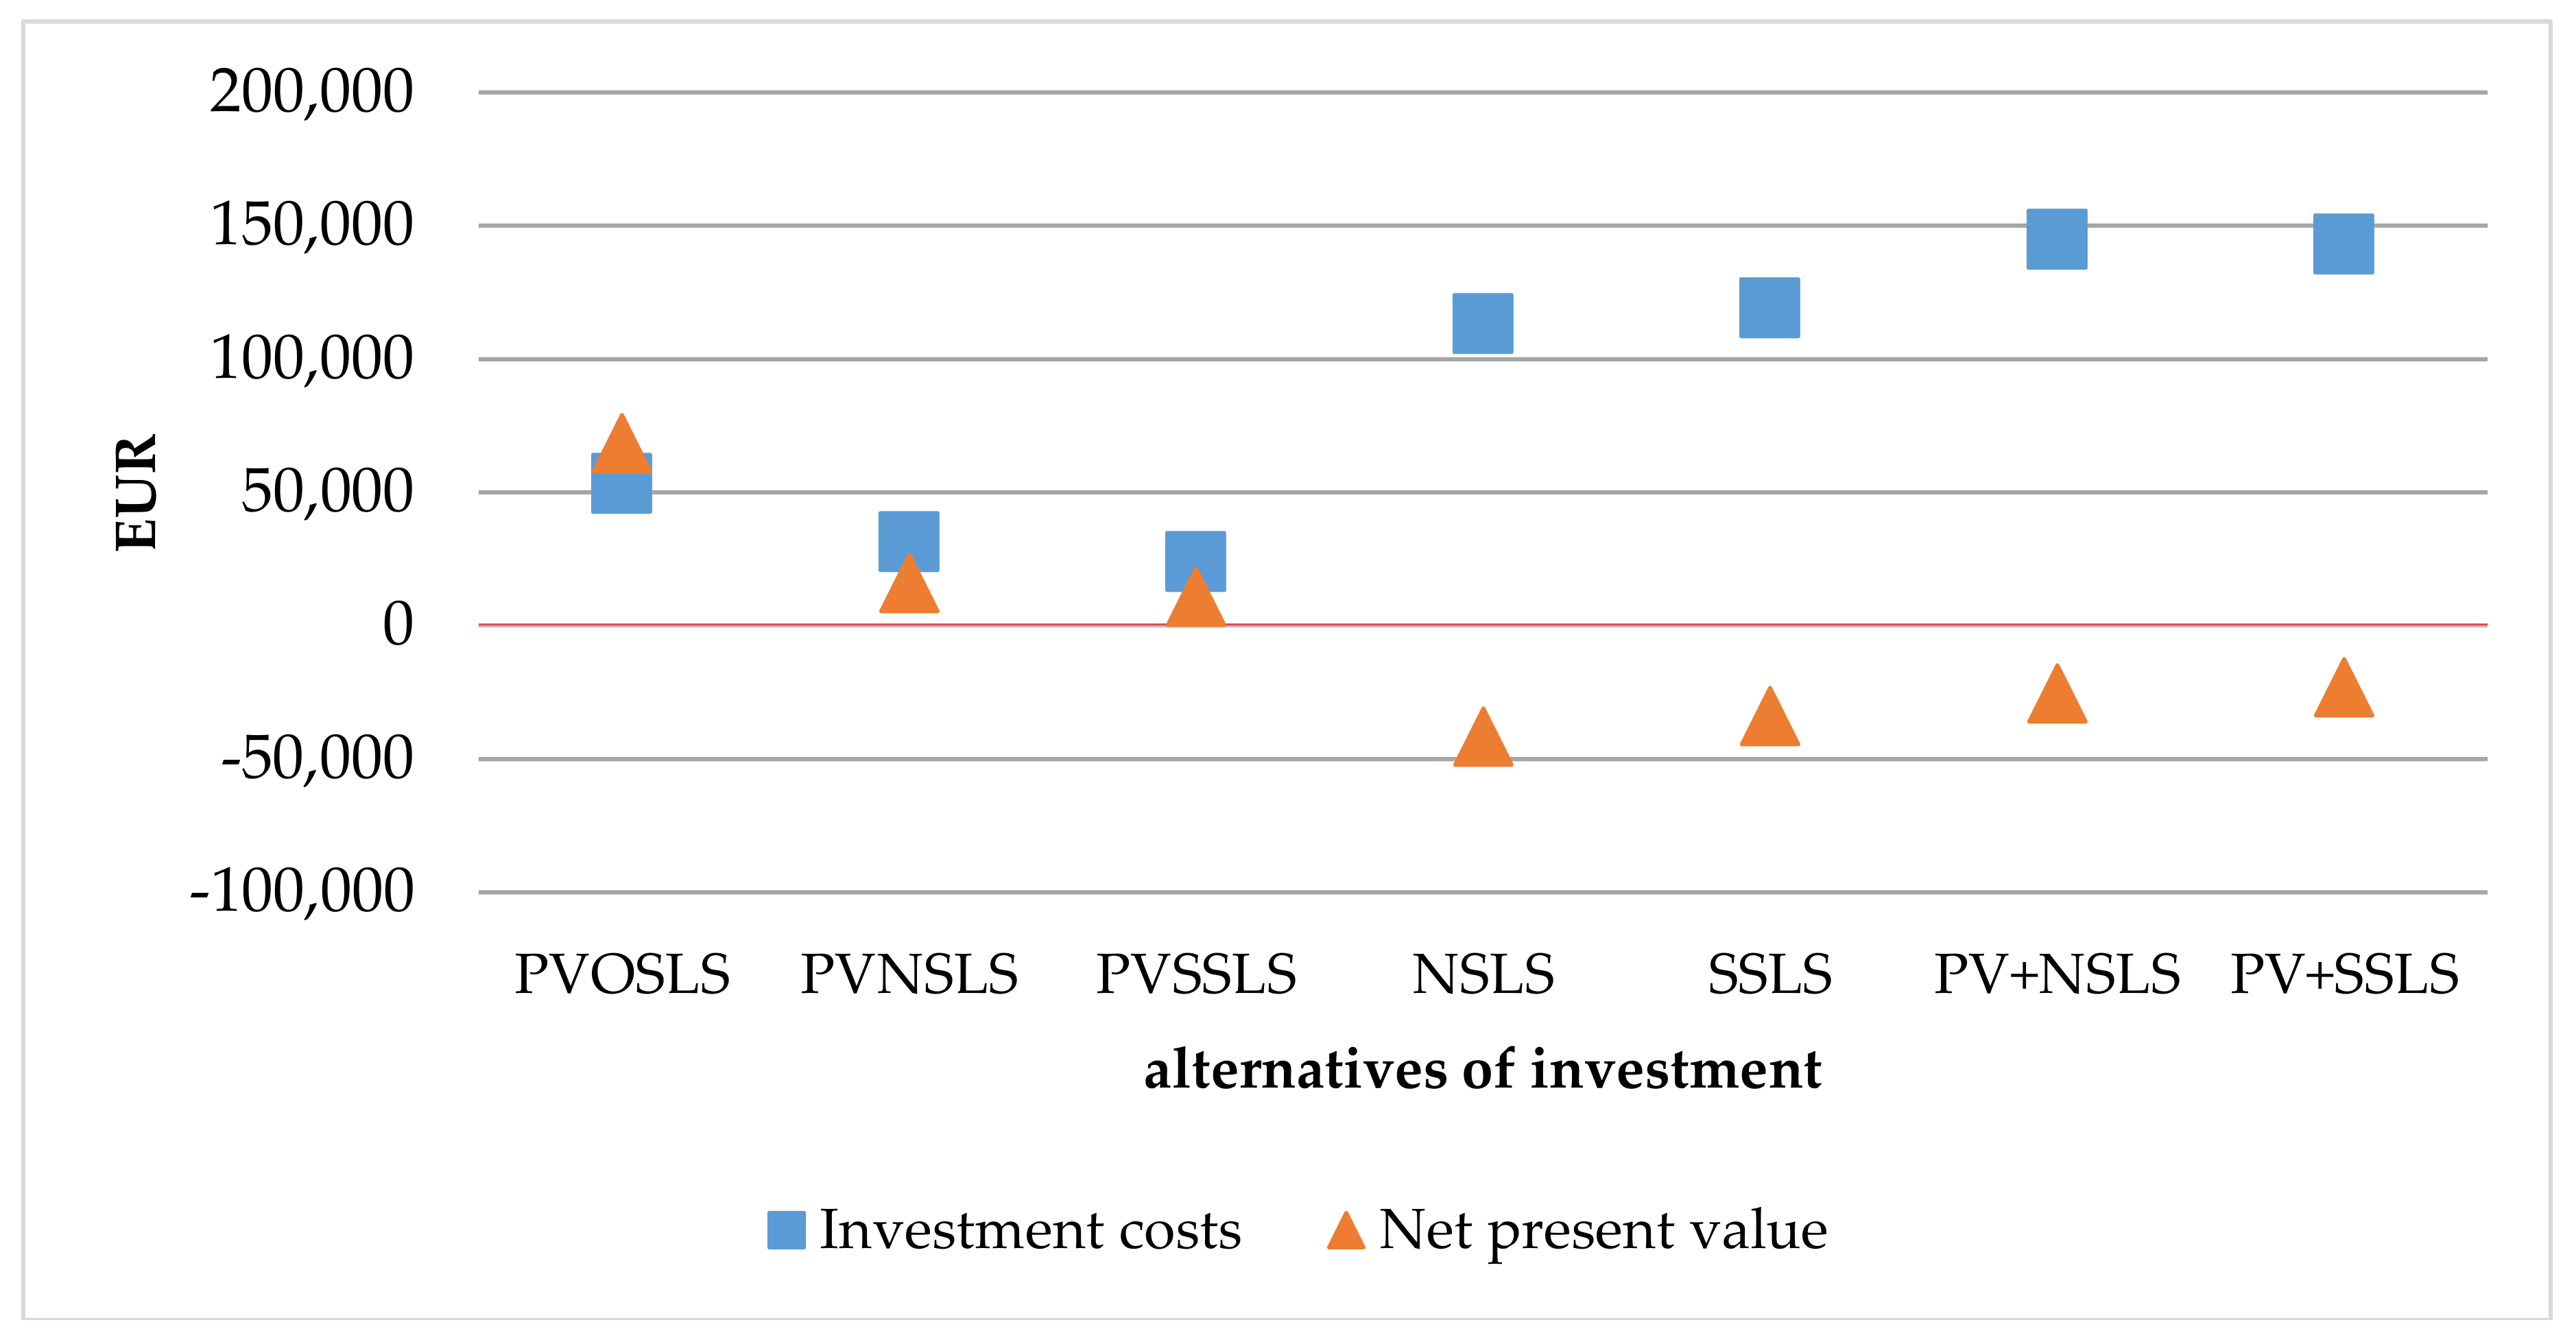
Figure 2 shows us the comparison of the different investment alternatives. If the net present value is positive, the investment can be profitable. We can see that the best investment choice is the PV investment without any street lighting development (PVOSLS in the case of an existing old street lighting system, PVNSLS in the case of an existing non-smart street lighting system, or PVSSLS in the case of an existing smart street lighting system).
The value of the investment cost for the local government is also an important factor. The investment cost is the lowest if the local government builds a PVS for its existing street lighting system. Development of a street lighting system has bigger investment costs than building a PVS, and the investment is not profitable within 20 years.
4. Conclusions
This study analyzed the economic questions related to investments in PV systems and LED street lighting developments. In the course of the economic calculations, not only the financial investments needed for PV and/or LED street lighting system, but also the annual extra yield and financial expenditures under the current regulations in Hungary were examined, in the case of HMKE. The HMKE option is available for residential, business, and local government customers on a yearly basis, and there is no surcharge or requirement of 15-min electricity production forecasts. This is the reason why the authors recommend the HMKE system to local governments whose street lighting systems consist of less than 230 luminaires, which means a PVS with a maximum size of 50 kW.
The state could be interested in the macroeconomic benefits of green energy production (such as enterprise development, indirect job creation, and the subsequent budgetary income, conforming to the obligations related to renewable energy production and environmental aspects). Energy savings are only the first step to make the EU ‘greener’. NSLS and SSLS intelligent lighting with sensors and digital processors with PV technologies can provide an essential enabling technology for smart cities. The EU Smart Cities Initiative will support this development by pooling resources from the areas of information and communications technologies, transport, and energy.
According to our study, the best choice for a village of 900–1200 inhabitants in Hungary is to build a PVS without any street lighting development, if only the investment indicators are taken into consideration. It means that no street lighting development is preferable without any support.
Smart street lighting systems are favorable to non-smart systems because there is no big investment cost difference, but there is a big difference in the NPV. If a minimum of 16% support of the total investment cost is available for the project, the combined system is advantageous: smart street lighting development + PV system. In Hungary, local governments do not have the opportunity to sell their CO2 savings on the global market, so without any support they are not interested in LED street lighting development.
Many Hungarian villages would prefer to choose the first investment option: to build only a PVS without any street lighting development, but they do not have enough money for it. The authors suggest a governmental loan to local governments with a maximum interest of 7.5% for a 20-year term. With the help of this project, every local government (of villages with 900–1200 inhabitants) could have the opportunity to build their own PV systems to decrease their electricity consumption costs related to street lighting systems.
With the help of the suggested loan, local governments could improve their financial balance after 20 years. This can be a short period if we think globally, and we try to take care of our environment, but 20 years is not a short period for an investment.
Acknowledgments
We acknowledge the financial support of Széchenyi 2020 under the EFOP-3.6.1-16-2016-00015.
Author Contributions
Gábor Pintér and Henrik Zsiborács wrote the paper and did the calculations. Gábor Pintér was responsible for the economic aspects, while Henrik Zsiborács focused on technology. Nóra Hegedűsné Baranyai helped with the calculation process and she created the graphs and tables in the paper. Alec Wiliams looked into the international context of the subject and revised the grammar.
Conflicts of Interest
The authors declare no conflict of interest.
Abbreviations
The following abbreviations are used in this manuscript:
| DPP | Discounted payback period |
| EDIOP | Economic Development and Innovation Program |
| EEEOP | Environment and Energy Efficiency Operational Program |
| EPC | Energy performance contracting |
| ESCO | European Skills/Competences and Occupations |
| FiT | Feed-in-tariff |
| HMKE | House-hold-sized power plants |
| HPM | High-pressure Mercury |
| HPS | High-pressure Sodium lamps |
| IEA | International Energy Agency |
| METÁR | Renewable Energy Support Scheme |
| NPV | Net present value |
| NSLS | Non-smart street lighting system |
| OSLS | Old street lighting system |
| PI | Profitability index |
| PV | Photovoltaic |
| PV+NSLS | Photovoltaic and non-smart street lighting investment |
| PV+SSLS | Photovoltaic and smart street lighting investment |
| PVNSLS | Photovoltaic investment for an existing non-smart street lighting system |
| PVOSLS | Photovoltaic investment for an existing old street lighting system |
| PVS | Photovoltaic system |
| PVSSLS | Photovoltaic investment for an existing smart street lighting system |
| SLS | Smart lighting system |
| SSLS | Smart street lighting system |
References
- Szabó, S.; Enyedi, P.; Horváth, M.; Kovács, Z.; Burai, P.; Csoknyai, T.; Szabó, G. Automated registration of potential locations for solar energy production with Light Detection And Ranging (LiDAR) and small format photogrammetry. J. Clean. Product. 2016, 112, 3820–3829. [Google Scholar] [CrossRef]
- Zsiborács, H.; Pintér, G.; Pályi, B. The energetic utilization of solar photovoltaic systems for individuals, price changes in Hungary. Rev. Agric. Rural Dev. 2014, 3, 2063–4803. [Google Scholar]
- Zsiborács, H. Technical-Economic Study of Cooled Solar Modules. Ph.D. Thesis, University of Pannonia Georgikon Faculty, Festetics Doctoral School, Keszthely, Hungary, 2017; pp. 1–28. [Google Scholar]
- Hosenuzzaman, M.; Rahim, N.A.; Selvaraj, J.; Hasanuzzaman, M.; Malek, A.B.M.A.; Nahar, A. Global prospects, progress, policies, and environmental impact of solar photovoltaic power generation. Renew. Sustain. Energy Rev. 2015, 41, 284–297. [Google Scholar] [CrossRef]
- Roth, W. General Concepts of Photovoltaic Power Supply Systems; Fraunhofer Institute for Solar Energy Systems ISE: Freiburg, Germany, 2005; pp. 1–23. [Google Scholar]
- Kumar Sahu, B. A study on global solar PV energy developments and policies with special focus on the top ten solar PV power producing countries. Renew. Sustain. Energy Rev. 2015, 43, 621–634. [Google Scholar] [CrossRef]
- Guney, M.S. Solar power and application methods. Renew. Sustain. Energy Rev. 2016, 57, 776–785. [Google Scholar] [CrossRef]
- International Energy Agency Technology Roadmap Solar Photovoltaic Energy, 2014 ed. 2014, pp. 1–60. Available online: https://www.iea.org/publications/freepublications/publication/TechnologyRoadmapSolarPhotovoltaicEnergy_2014edition.pdf (accessed on 28 March 2018).
- Renewable Energy Policy Network for the 21st Century Renewables 2015 Global Status Report—REN21. 2015, pp. 1–251. Available online: http://www.ren21.net/wp-content/uploads/2015/07/REN12-GSR2015_Onlinebook_low1.pdf (accessed on 28 March 2018).
- Renewable Energy Policy Network for the 21st Century Renewables 2016 Global Status Report—REN21. 2016, pp. 1–272. Available online: http://www.ren21.net/wp-content/uploads/2016/05/GSR_2016_Full_Report_lowres.pdf (accessed on 28 March 2018).
- Renewable Energy Policy Network for the 21st Century Renewables 2017 Global Status Report—REN21. 2017, pp. 1–302. Available online: http://www.ren21.net/wp-content/uploads/2017/06/17-8399_GSR_2017_Full_Report_0621_Opt.pdf (accessed on 28 March 2018).
- Fraunhofer Institute for Solar Energy Systems—ISE Photovoltaics Report. 2017, pp. 1–44. Available online: https://www.ise.fraunhofer.de/content/dam/ise/de/documents/publications/studies/Photovoltaics-Report.pdf (accessed on 28 March 2018).
- European Commission. Legal Sources on Renewable Energy—Hungary. Available online: http://www.res-legal.eu/en/search-by-country/hungary/ (accessed on 2 February 2018).
- Hungarian Transmission System Operator—MAVIR ZRt. Useful Documents. Available online: https://www.mavir.hu/web/mavir/ugyfelszolgalat (accessed on 2 February 2018).
- Bai, A.; Popp, J.; Balogh, P.; Gabnai, Z.; Pályi, B.; Farkas, I.; Pintér, G.; Zsiborács, H. Technical and economic effects of cooling of monocrystalline photovoltaic modules under Hungarian conditions. Renew. Sustain. Energy Rev. 2016, 60, 1086–1099. [Google Scholar] [CrossRef]
- E.ON Hungária Zrt. House-Hold-Sized Power Plants (HMKE). Available online: http://energia.eon.hu/hmke/# (accessed on 2 February 2018).
- European Commission. Energy Efficiency Directive—European Commission. Available online: https://ec.europa.eu/energy/en/topics/energy-efficiency/energy-efficiency-directive (accessed on 2 February 2018).
- Carli, R.; Dotoli, M.; Pellegrino, R. A decision-making tool for energy efficiency optimization of street lighting. Comput. Op. Res. 2017, 1–13. [Google Scholar] [CrossRef]
- Radulovic, D.; Skok, S.; Kirincic, V. Energy efficiency public lighting management in the cities. Energy 2011, 36, 1908–1915. [Google Scholar] [CrossRef]
- GE Lighting Europe. Lighting Project-Europe, Middle East & Africa. Available online: http://emea.gelighting.com/LightingWeb/emea/projects/index.jsp (accessed on 7 February 2018).
- GE Lighting Europe. Cut Running Costs—Shorten Your ROI Period with Our Energy-Efficient Light Sources. Available online: http://emea.gelighting.com/LightingWeb/emea/products/applications/municipality-lighting/lower-your-cost.jsp (accessed on 2 February 2018).
- Lobão, J.A.; Devezas, T.; Catalão, J.P.S. Energy efficiency of lighting installations: Software application and experimental validation. Energy Rep. 2015, 1, 110–115. [Google Scholar] [CrossRef]
- Velik, R.; Nicolay, P. Energy management in storage-augmented, grid-connected prosumer buildings and neighborhoods using a modified simulated annealing optimization. Comput. Op. Res. 2016, 66, 248–257. [Google Scholar] [CrossRef]
- Zha, Y.; Zhao, L.; Bian, Y. Measuring regional efficiency of energy and carbon dioxide emissions in China: A chance constrained DEA approach. Comput. Op. Res. 2016, 66, 351–361. [Google Scholar] [CrossRef]
- Carli, R.; Dotoli, M.; Pellegrino, R.; Ranieri, L. A Decision Making Technique to Optimize a Buildings’ Stock Energy Efficiency. IEEE Trans. Syst. Man Cybern. Syst. 2017, 47, 794–807. [Google Scholar] [CrossRef]
- Jollands, N.; Waide, P.; Ellis, M.; Onoda, T.; Laustsen, J.; Tanaka, K.; de T’Serclaes, P.; Barnsley, I.; Bradley, R.; Meier, A. The 25 IEA energy efficiency policy recommendations to the G8 Gleneagles Plan of Action. Energy Policy 2010, 38, 6409–6418. [Google Scholar] [CrossRef]
- OÖ Energiesparverband. Streetlight Refurbishment with Energy Performance Contracting. Available online: http://www.streetlight-epc.eu/publications-events/#c12511 (accessed on 2 February 2018).
- EURACTIV. European Cities Want 10 Million “Smart” Streetlamps. Available online: https://www.euractiv.com/section/digital/news/european-cities-want-10-million-smart-streetlamps/ (accessed on 2 February 2018).
- Zsiborács, H.; Pályi, B.; Pintér, G.; Baranyai, N.H.; Szabó, P.; Farkas, I. Economic questions and energy performance of the cooled polycrystalline solar photovoltaic (PV) technology. Rev. Agric. Rural Dev. 2016, 5, 162–170. [Google Scholar]
- Kocsis, K.; Schweitzer, F. Hungary in Maps; Geographical Institute, Research Centre for Astronomy and Earth Sciences of the Hungarian Academy of Sciences: Budapest, Hungary, 2011. [Google Scholar]
- VÜZ Kft. Winning Tenders. Available online: http://www.khvuz.hu/index.php/nyertes-palyazataink (accessed on 2 February 2018).
- E.ON Hungária Zrt. House-Hold-Sized Power Plants (HMKE), Frequently Asked Questions. Available online: http://energia.eon.hu/hmke/gyik (accessed on 2 February 2018).
- Vulcano Energia. Keszthely City Hospital PV System. Available online: http://www.napelem-napkollektorok.hu/hirek/keszthely-varosi-korhaz-napelem-rendszer (accessed on 2 February 2018).
- Local Government of Keszthely. KEOP-4.10.0/N/14-2014-0066. Available online: https://www.keszthely.hu/onkormanyzat/palyazatok/onkormanyzat-altal-elnyert-palyazatok/keszthely-varos-onkormanyzata-tulajdonaban-levo-intezmenyek-napelemekkel-torteno-felszerelese-# (accessed on 2 February 2018).
- Bács-Zöldenergia Kft. Photovoltaic Prices. Available online: http://bze.hu/napelem-arak (accessed on 2 February 2018).
- PANNON Pro Innovations Ltd. Energy Sizing Informations. Available online: https://klimainnovacio.hu/en/pannon-pro-innovations (accessed on 2 February 2018).
- GE Lighting. Lighting Products, Outdoor Lighting. Available online: http://emea.gelighting.com/LightingWeb/emea/products/ (accessed on 28 March 2018).
- NIPSCO. LED Street Light Program. Available online: https://www.nipsco.com/our-services/led-streetlights (accessed on 2 February 2018).
- Jordan, D.C.; Kurtz, S.R. Photovoltaic Degradation Rates—An Analytical Review. Prog. Photovolt. Res. Appl. 2013, 21, 12–29. [Google Scholar] [CrossRef]
- Zsiborács, H.; Pályi, B.; Pintér, G.; Popp, J.; Balogh, P.; Gabnai, Z.; Pető, K.; Farkas, I.; Baranyai, N.H.; Bai, A. Technical-economic study of cooled crystalline solar modules. Sol. Energy 2016, 140, 227–235. [Google Scholar] [CrossRef]
- Richard, A.; Brealey, S.C.; Myers, F.A. Principles of Corporate Finance; McGraw-Hill/Irwin: New York, NY, USA, 2003. [Google Scholar]
- Investing.com. European Government Bonds Yields. Available online: https://www.investing.com/rates-bonds/european-government-bonds?maturity_from=10&maturity_to=310 (accessed on 2 February 2018).
- Inflation.eu. Historic Inflation Hungary—Historic CPI Inflation Hungary. Available online: http://www.inflation.eu/inflation-rates/hungary/historic-inflation/cpi-inflation-hungary.aspx (accessed on 2 February 2018).
- E.ON Hungária Zrt. Energy Tariffs. Available online: https://www.eon.hu/hu/uzleti/aram/arak-tarifadijak.html (accessed on 2 February 2018).
- Hungarian National Bank. Foreign Exchange Rates. Available online: https://www.mnb.hu/arfolyamok (accessed on 7 February 2018).
- Corona Energy. How to Calculate Your CO2 Emissions. Available online: https://www.coronaenergy.co.uk/how-to-calculate-co2-emissions/ (accessed on 8 March 2018).
- European Commission. JRC Photovoltaic Geographical Information System (PVGIS). Available online: http://re.jrc.ec.europa.eu/pvg_tools/en/tools.html#PVP (accessed on 2 February 2018).
- Kacira, M.; Simsek, M.; Babur, Y.; Demirkol, S. Determining optimum tilt angles and orientations of photovoltaic panels in Sanliurfa, Turkey. Renew. Energy 2004, 29, 1265–1275. [Google Scholar] [CrossRef]
- Breyer, C.; Schmid, J. Global Distribution of optimal Tilt Angles for fixed tilted PV Systems. Horizon 2010, 2, 1. [Google Scholar] [CrossRef]
Figure 1.
Theoretical energy saving potential for exterior lighting [21].
Figure 1.
Theoretical energy saving potential for exterior lighting [21].

Figure 2.
Comparison of the different investments studied.


Table 1.
The abbreviations for the investment alternatives.
| Number of the Investment Alternative | Letter of the Investment Alternative | Abbreviation | Meaning |
|---|---|---|---|
| 1. | a | PVOSLS | photovoltaic investment for an existing old street lighting system |
| b | PVNSLS | photovoltaic investment for an existing non-smart street lighting system | |
| c | PVSSLS | photovoltaic investment for an existing smart street lighting system | |
| 2. | a | NSLS | development of an old street lighting system to a non-smart one |
| b | SSLS | development of an old street lighting system to a smart one | |
| 3. | a | PV+NSLS | photovoltaic plus non-smart street lighting investment |
| b | PV+SSLS | photovoltaic plus smart street lighting investment |
| Average electric energy production of 1 kW photovoltaic (PV) system (PVS) in West of Hungary [kWh] | 1100 |
| Lifespan of the investment [year] | 20 |
| Maximum size of the house-hold-sized power plants (HMKE) PVS [kW] | 50 |
| Tilt angle of PV modules [0] | 35 |
| Orientation (azimuth) [0] | 180 |
| System loss (PV inverter, grid) [%] | 10 |
| Average street lighting electric energy price in the case of a Hungarian local government [EURcent/kWh] | 19.89 |
| Delivery price for electric energy for business customer in the HMKE system, (2018) [EURcent/kWh] | 15.42 |
| Rate of average inflation (2014–2017) [%] | 0.62 |
| Bond yield interest rate 15 January 2018 [%] | 2.8 |
| Decrease of annual performance of crystalline modules [%] | 0.5 |
Table 3.
50, 20, 15 kW PV investments for offsetting electricity consumption costs of street lighting systems.
Table 3.
50, 20, 15 kW PV investments for offsetting electricity consumption costs of street lighting systems.
| Time [years] | 20 | ||
| Type of the existing public lighting system | OSLS | NSLS | SSLS |
| Savings target [EUR] | 8511.3 | 3404.5 | 2553.4 |
| System size [kW] | 50 | 20 | 15 |
| Average CO2 emission savings potential over 20 years [tons] | 534 | 214 | 160 |
| Investment costs, gross [EUR] | 53,258.1 | 31,611.9 | 24,080.0 |
| Maintenance costs, gross [EUR] | 12,114.6 | 6 328.1 | 5893.8 |
| Net present value (NPV) [EUR] | 68,555.3 | 16,128.7 | 10,963.0 |
| Internal rate of return (IRR) [%] | 14.4 | 7.9 | 7.5 |
| Profitability index (PI) [-] | 2.3 | 1.5 | 1.5 |
| Discounted payback period (DPP) [year] | 7.0 | 11.8 | 12.1 |
| Needed support intensity for 0 NPV [%] | - | - | - |
OSLS = old street lighting system; NSLS = non-smart street lighting system; SSLS = smart street lighting system.
Table 4.
Only street lighting development: without smart lighting system with 60% energy saving and with smart lighting system with 70% energy saving.
Table 4.
Only street lighting development: without smart lighting system with 60% energy saving and with smart lighting system with 70% energy saving.
| Time [years] | 20 | |
| Number of Street Lights [piece] | 229 | |
| Type of system | Non-smart | Smart |
| Investment costs, gross [EUR] | 11,3203.9 | 11,9162.0 |
| Average CO2 emission savings potential over 20 years [tons] | 293 | 341 |
| Maintenance costs, gross [EUR] | 13,566.5 | |
| Net present value (NPV) [EUR] | −41,540.3 | −33,886.6 |
| Internal rate of return (IRR) [%] | - | - |
| Profitability index (PI) [-] | 0.6 | 0.7 |
| Discounted payback period (DPP) [year] | >20 | >20 |
| Needed support intensity for 0 NPV [%] | 37 | 28 |
Table 5.
Overall investment-efficiency indexes: street lighting development including PVS.
| Time [years] | 20 | |
| Number of Street Lights [piece] | 229 | |
| Type of investment | NSLS + 20 kW PV | SSLS + 15 kW PV |
| Average CO2 emission savings potential over 20 years [tons] | 507 | 501 |
| Investment costs, gross [EUR] | 144,816 | 143,242 |
| Net present value (NPV) [EUR] | −25 412 | −22 924 |
| Internal rate of return (IRR) [%] | - | - |
| Profitability index (PI) [-] | 0.8 | 0.8 |
| Discounted payback period (DPP) [year] | >20 | >20 |
| Needed support intensity for 0 NPV [%] | 18 | 16 |
© 2018 by the authors. Licensee MDPI, Basel, Switzerland. This article is an open access article distributed under the terms and conditions of the Creative Commons Attribution (CC BY) license (http://creativecommons.org/licenses/by/4.0/).
Share and Cite
MDPI and ACS Style
Pintér, G.; Baranyai, N.H.; Wiliams, A.; Zsiborács, H. Study of Photovoltaics and LED Energy Efficiency: Case Study in Hungary. Energies 2018, 11, 790. https://doi.org/10.3390/en11040790
AMA Style
Pintér G, Baranyai NH, Wiliams A, Zsiborács H. Study of Photovoltaics and LED Energy Efficiency: Case Study in Hungary. Energies. 2018; 11(4):790. https://doi.org/10.3390/en11040790
Chicago/Turabian StylePintér, Gábor, Nóra Hegedűsné Baranyai, Alec Wiliams, and Henrik Zsiborács. 2018. "Study of Photovoltaics and LED Energy Efficiency: Case Study in Hungary" Energies 11, no. 4: 790. https://doi.org/10.3390/en11040790
Note that from the first issue of 2016, this journal uses article numbers instead of page numbers. See further details here.