Article

Energy Requirements for Biomass Harvest and Densification

Department of Biological Systems Engineering, University of Wisconsin, Madison, WI 53706, USA
*
Author to whom correspondence should be addressed.
Energies 2018, 11(4), 780; https://doi.org/10.3390/en11040780
Submission received: 6 March 2018 / Revised: 23 March 2018 / Accepted: 27 March 2018 / Published: 28 March 2018
(This article belongs to the Section A: Sustainable Energy)

Abstract

:
This research quantified the unit and bulk density of several biomass crops across a variety of harvest and processing methods, as well as the energy and fuel requirements for these operations. A load density of approximately 240 kg·m−3 is needed to reach the legal weight limit of most transporters. Of the three types of balers studied, only the high density (HD) large square baler achieved this target density. However, the specific energy and fuel requirements increased exponentially with bale density, and at the maximum densities for corn stover and switchgrass, the dry basis energy and fuel requirements ranged from 4.0 to 5.0 kW·h·Mg−1 and 1.2 to 1.4 L·Mg−1, respectively. Throughputs of tub grinders when grinding bales was less than any other harvesting or processing methods investigated, so specific energy and fuel requirements were high and ranged from 13 to 32 kW·h·Mg−1 and 5.0 to 11.3 L·Mg−1, respectively. Gross size-reduction by pre-cutting at baling increased bale density by less than 6% and increased baling energy requirements by 11% to 22%, but pre-cut bales increased the tub grinder throughput by 25% to 45% and reduced specific fuel consumption for grinding by 20% to 53%. Given the improvement in tub grinder operation, pre-cutting bales should be considered as a means to increase grinder throughput. Additional research is needed to determine the energy required to grind high density pre-cut bales at high throughputs so that better estimates of total energy required for a high density bale system can be made. An alternative bulk feedstock system was investigated that involved chopping moist biomass crops with a precision-cut forage harvester, compacting the bulk material in a silo bag, and then segmenting the densified material into modules optimized for efficient transport. The specific fuel use for chopping and then compacting biomass crops in the silo bag ranged from 1.6 to 3.0 L·Mg−1 and 0.5 to 1.3 L·Mg−1, respectively. At the proposed moistures, the compacted density in the silo bags was sufficient to achieve weight-limited transport although there would be less dry matter (DM) shipped than with the high density dry bale system. Additional development work is needed to create transportable modules from the compacted silo bag. The overall results of this research will allow more accurate estimates of biomass logistics costs based on product density and energy expenditures.

1. Introduction

The low mass- and energy-density of biomass feedstocks challenges the economic viability of large-scale biofuel production. Harvesting, storage, transportation, and processing can contribute up to 50% of feedstock cost [1]. Although traditional hay and forage equipment have been used to harvest biomass crops, performance limitations exist when harvesting biomass. The limitations include inadequate machine and system capacity, low product density, and high energy and fuel requirements.
Biomass, like hay and forage crops, are typically harvested in one of two ways: chopped in-field with a self-propelled forage harvester (SPFH) or baled [2,3,4]. The large square bale (LSBe) and large round bale (LRBe) are currently the dominant methods used to harvest and store biomass feedstocks because chopped material has low bulk-density [2,4]. As distance from field to end use increases, there is greater economic justification to increase biomass bulk density through baling or other means [5,6]. Greater product density reduces costs associated with aggregation, handling, storage, and transport. The most economical transport of biomass feedstocks occurs when legal weight limits of the transport vehicle are achieved [6,7,8]. To achieve most legal weight limits in many countries, the load density should be approximately 240 kg·m−3 [8]. Because LSBes are sized to fill the transporter volume, bale density should equal this target value. The cross-section of LRBes do not allow for filling the transporter volume, so the LRBe density must be greater than the LSBe to achieve weight-limited transport. Bale densities between 145 and 200 kg·m−3 (LSBe) and 120 and 180 kg·m−3 (LRBe) have been reported for switchgrass, straw and corn stover, well under the desired value needed for weight-limited transport [2,3,9,10,11,12,13].
It has been suggested that ever greater load density up to the value that ensures weight-limited transport would incrementally decrease biomass logistics costs. Transportation costs decreased 25% as bale density increased from 128 to 208 kg·m−3 [14]. However, an analysis by Sokhansanj et al. [15] suggested there is an optimum bale density which balances lower transport costs against greater harvest costs. In their analysis, greater bale density was estimated to decrease costs of aggregation, handling, storage, and transport, but greater costs for harvesting and bale grinding more than offset these saving when bale densities were greater than 175 kg·m−3. The harvest cost was greatly affected by the size and subsequent expense of the high density (HD) large square baler (LSBr) and the tractor required to operate the baler. Because there is a lack of published research concerning the relationship between bale density and tractor power in field trials, Sokhansanj et al., had to rely on power density models from lab-scale compression studies to estimate specific energy requirements (SERs). Sokhansanj et al. estimated power requirements of 85 and 375 kW to produce corn stover bales at 110 and 240 kg·m−3, respectively.
Idaho National Laboratory identified preprocessing and size-reduction early in the supply chain as a means to improve downstream operations if storage and transport bulk density could be increased [1]. In field size-reduction with precision-cut forage harvesters may be more efficient than downstream bale decomposition and grinding, so this approach may be more economical if the bulk density of the product can approach that of baled feedstocks [1,4]. However, compaction of dry, chopped switchgrass in a solid-waste compactor increased dry bulk density to only 139 kg·m−3.
Although biomass density has a great impact on feedstock costs, there are limited published research results on biomass density across a variety of biomass crops and harvest schemes (i.e., baled or chopped). Particularly lacking is how achieving a given density affects the required energy inputs. Availability of this information would help make estimations of biomass feedstock costs more accurate. Therefore, the objectives of this research were to collect biomass density across a variety of common biomass crops using both baling and chopping as a means of harvest and to quantify the energy required during harvest and processing.

2. Materials and Methods

2.1. Crop Preparation

Field experiments were conducted at the University of Wisconsin Arlington Agricultural Research Station (43.3453° N, 89.4125° W) and Dane County (WI) Silverwood Park (42.8925° N, 89.0239° W). Crops harvested included switchgrass (SWG: Panicum virgatum), reed canarygrass (RCG: Phalaris arundinacea), native grasses (NTG: mix of big bluestem (Andropogon gerardii) and indiangrass (Sorghastrum nutans)), alfalfa (AL: Medicago sativa), forage sorghum (FS: Sorghum bicolor), wheat straw (WS: Triticum aestivum), and corn stover (CS: Zea mays). A John Deere (Moline, IL, USA) model 4995 disk cutterbar windrower (4.5 m cut width) was used to cut the SWG, RCG, NTG, AL and FS. Single windrows of RCG or AL were raked into double windrows prior to harvest, otherwise single windrows were harvested for the remaining crops. The WS was windrowed during grain harvest with a Case IH (Racine, WI, USA) model 7120 combine harvester equipped with a 6.1 m wide grain header. Two single windrows were raked together into double windrows prior to baling. Corn grain was harvested with a Case IH model 5140 combine harvester. After grain harvest, CS was chopped and simultaneously windrowed with a Hiniker (Mankato, MN, USA) model 5620 stalk chopper (6.1 m width). Prior to baling with the LSBr, the stalk chopper was operated so that on each subsequent pass, the second windrow was placed adjacent to the first, effectively placing a width of 12 m of material into the windrow. A single windrow (6.1 m harvest width) was used for large round baler (LRBr) experiments. When using either type of baler, the crop was allowed to field dry with the goal of having crop less than 20% (wet basis—w.b.) moisture before baling. Harvesting with the SPFH occurred at various target moisture contents (details provided below).

2.2. Baling

Crops used when baling with the LSBrs included SWG, RCG, NTG, AL, FS, WS, and CS. Two HD LSBrs balers were used, a Krone (Spelle, Germany) model 1290 HDP and a Krone model 1290 HDP XC which was configured with a pre-cutter (Table 1). The bale cross-section was 90 × 120 cm and bale length was set to 2.4 m. A baler pre-cutter consists of a rotor which sweeps crop past a set of stationary knives so that gross size-reduction is accomplished prior to crop entering the bale chamber [16]. Each new portion of crop fed into the bale chamber is defined as a flake [16] and the LSBes were usually made up of 35 to 50 flakes depending on actual bale length and density. During all tests ground speed was targeted so that the feeding mechanism in the baler pre-compression chamber delivered a new flake to the bale chamber at every plunger stroke (45 strokes per min). Typical baling speeds were 11 to 13 km·h−1. However, under some conditions, ground speed was limited by yield, tractor power, field roughness, or baler feeding difficulties.
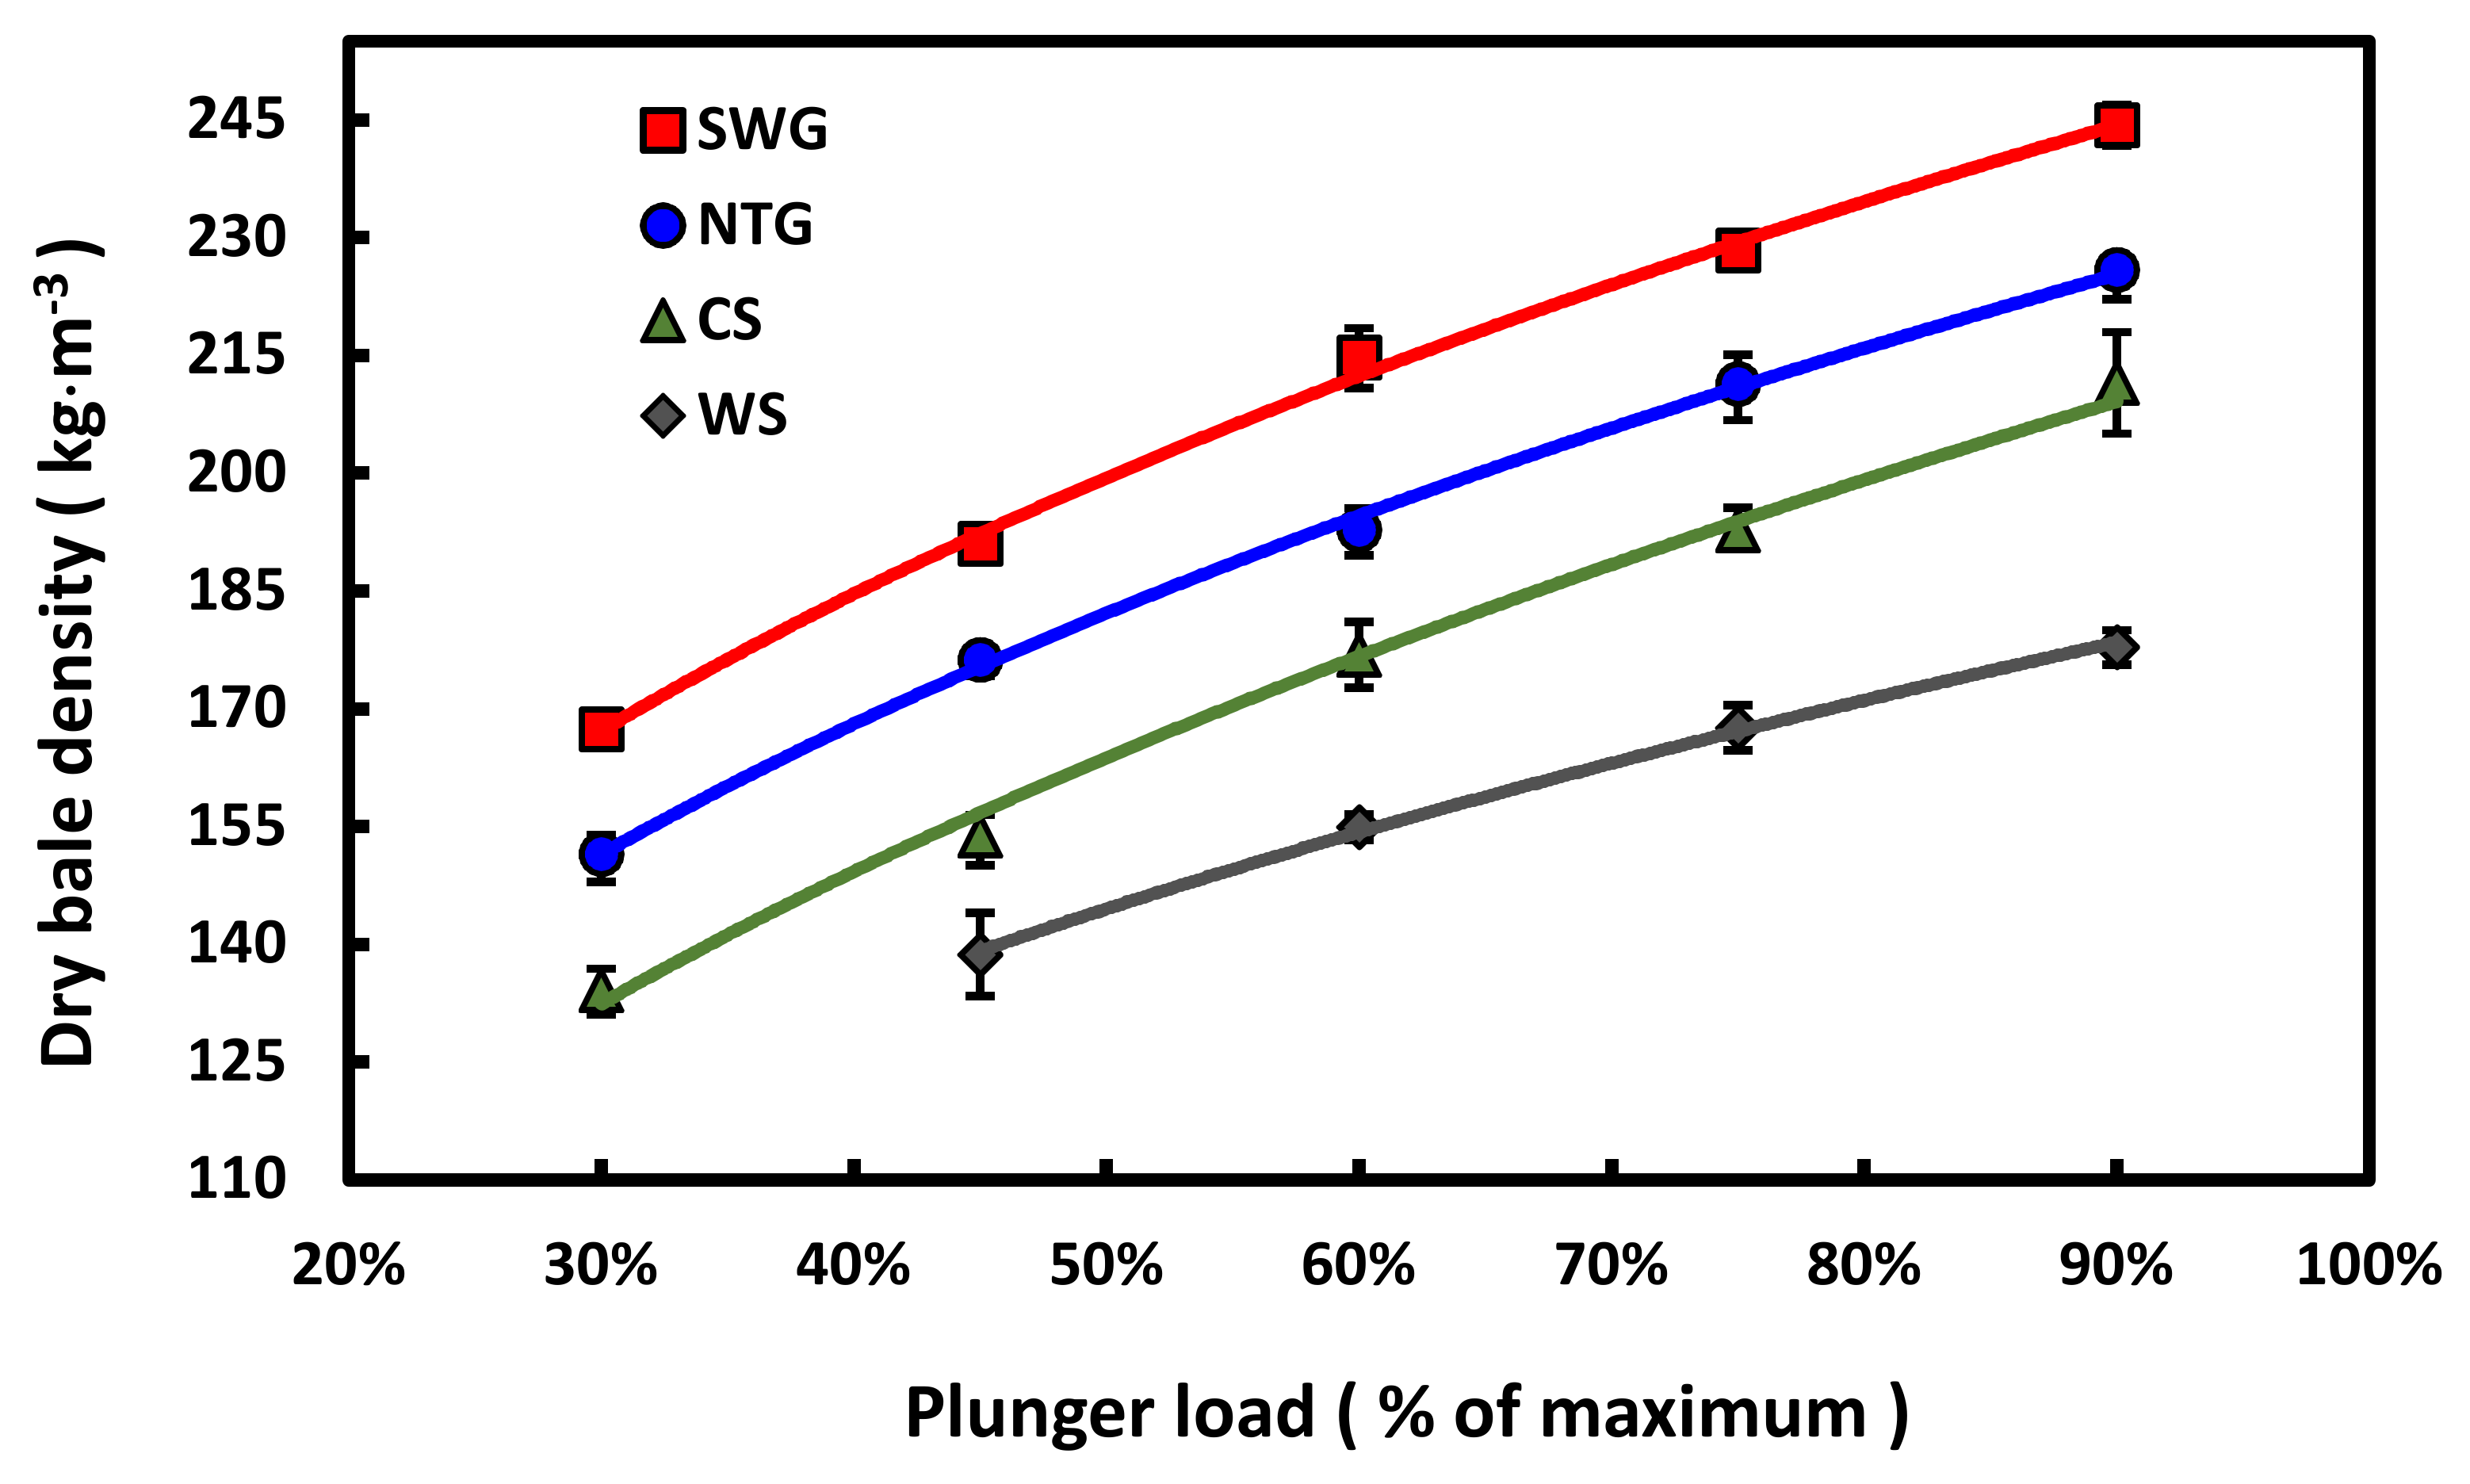
Densification in an LSBr is caused by resistance to bale movement created by the variable convergence of the bale chamber, and the load on the plunger crank arms is used to measure the force to overcome this resistance. The plunger load sensors measure the force applied to the bale face, and the LSBr processor then controls the hydraulic pressure to the chamber convergence cylinders to adjust the bale density based on the plunger force [13]. In this research bale density was altered by setting the baler control system to target a given plunger load expressed as a fraction of the maximum allowed by the manufacturer. The range of plunger loads tested was typically 30% to 90% of maximum, set in increments 10, 15 or 20 percentage units. The number and range of plunger loads used in each experiment depended upon the availability of crop and the ability of the available twine to restrain the bales without knot failure. Knot strength of the twine used in LSBr experiments 1 and 2 and LSBr experiment 3 was 1950 and 2750 N, respectively, so greater plunger loads and subsequent bale densities were possible in the latter experiment. The third experiment was conducted both with and without the baler pre-cutter engaged. The pre-cutter was configured with 22 knives with 44 mm spacing between knives. In all cases, the balers were operated until the plunger load reached equilibrium with the targeted value and then data collection proceeded through at least the next five replicate bales.
A conventional density (CD) LSBr (Case IH model LB334) was used for comparison with the HD LSBr, but due to limited crop and machine availability, this comparison was limited to the second LSBr experiment (Table 1). This baler did not have a pre-cutter option and plunger frequency was 48 strokes per minute. Typical ground speeds were 7 to 12 km·h−1. Other aspects of the baling operation were similar to those described above.
Three different LRBrs were used (Table 1) and all three balers were belt-type variable chamber balers that made bales 1.2 m wide. Bale diameter varied from approximately 1.5 to 1.7 m. Each balers density control system was set to the maximum allowed and typical baling speeds were 6 to 8 km·h−1. Each baler was equipped with a pre-cutter and each could be configured with varying number of knives which altered knife spacing and the pre-cutter theoretical length of cut (TLOC). In addition to configuring the balers so there was no pre-cutting, two pre-cutter knife configurations were used: either with full- or half-complement of available knives (FK or HK). The distance between the knives ranged from 11 to 16 cm for HK or 5 to 8 cm for FK. When harvesting CS, none of the balers were capable of using the FK configuration due to plugging issues. All bales were wrapped with four layers of mesh net wrap after baling.
The duration required to form each LSBe or LRBe was measured with a stop watch and recorded to the nearest second. The distance traveled was recorded to the nearest 1 m from the tractors distance sensor located on its performance monitor (LSBes) or by hand with a land wheel (LRBes). Time and distance spent maneuvering on headlands were omitted from calculations, as was idle time spent wrapping LRBs, so that the reported baler throughput was based solely on the time actually gathering and baling crop. Rate of fuel use, and ground, power-take-off (PTO) and engine speeds were captured from the tractors ISO-11783 controller area network (CAN) bus with an ECOM (FW Murphy, Tulsa, OK, USA) communication cable connected to the tractor’s diagnostic CAN terminal. The signals sent over the CAN network were captured at 10 Hz, decoded, and exported to an Excel spreadsheet by CANCapture software (https://www.cancapture.com/) according to the SAE J1939 protocol. Data captured with CANCapture was concurrent with time and distance measurements as previously described. Previous published research has shown that tractor fuel use rates as recorded from a tractors CAN bus resulted in a ±1% error of actual measured fuel rates [17]. Therefore, engine shaft power for all tractors was estimated by developing linear regression equations (R2 = 0.995 to 0.998) of fuel use vs. measured tractor power from the referenced Nebraska OECD Tractor Tests reports [18,19,20,21,22,23,24,25]. Partitioning power requirements into that required for PTO power to the baler or to overcome the tractors and balers rolling resistance was not possible with this approach. What is provided is the total fuel use and estimated engine power required to perform the baling operation (i.e., shaft power to baler plus mobility requirements of tractor and baler).
Bale mass, dimensions and moisture were measured to determine the baler mass throughput and bale density on a dry basis. At several locations on the bales, relevant dimensions needed to calculate bale volume were measured by hand to the nearest 2 cm. The bales were weighed on a 1800 kg capacity platform scale with a resolution of 0.5 kg. Each bale was subsampled twice for moisture content with a 50 mm diameter boring tool to a depth of approximately 80 cm. Moisture content of the bore samples was determined by following the procedures described in ASABE Standard S358.2 [26]. Throughput was calculated by dividing dry bale mass by time required to make each bale. SER was calculated by dividing estimated engine power by throughput and specific fuel use (SFU) was calculated by dividing fuel use rate by throughput.

2.3. Chopping and Compacting Chopped Material in a Silo Bag

A John Deere model 7800 SPFH (441 kW engine power) equipped with a 3.0 m wide model 630 windrow pickup was used to gather and chop SWG, RCG, FS and CS (Table 1). The harvester cutterhead was configured with a full set of 48 knives and the kernel processor was not used in any experiment. Two experiments were conducted (Table 1) and in each experiment at least five replicate loads were harvested at each TLOC setting of 7, 14 or 21 mm. Crops intended as biomass feedstocks can be chopped at low-moisture (i.e., <25% w.b.) and stored in aerobic bulk storage bins [4] or at slightly higher moisture and stored by ensiling [27,28]. Therefore experiments were conducted to harvest material that might be used for either storage scenario (Table 1). The duration required to make one replicate test was measured with a stop watch and recorded to the nearest second. The distance traveled per test was recorded to the nearest 1 m using a land wheel. The harvested material from each replicate test was collected in a Miller Pro (St. Nazianz, WI, USA) model 8015 side-dumping forage wagon (26,900 L maximum capacity) equipped with load cells to determine harvested mass to the nearest 2 kg. The SPFH used a FloScan (Seattle, WA, USA) model 236-2K fuel monitoring system to measure fuel use rate to the nearest 0.1 L·h−1. The SPFH engine was a Cummins (Columbus, IN, USA) model QSX15-G9 and the engine manufacturers performance data was used develop a linear regression equation (R2 = 0.997) to predict engine shaft power from fuel use rate. After each replicate test, samples were randomly collected from the harvested material to determine moisture and particle size following the procedures outlined in ASABE Standards S358.2 and S424.1 [29], respectively.
Load density of chopped biomass in the wagon was periodically quantified but no formal experiments were conducted. It typically required two to four replicate SPFH harvest tests to fill the wagon close to its struck level volume and it was deemed appropriate to estimate material density on a nearly full load rather than a partial load. Therefore, the volume of the wagon occupied by the harvested crops was only periodically quantified to calculate chopped material density, so it was not possible to conduct a statistical analysis of the effect of TLOC or moisture on density. Occupied volume was determined by leveling the load by hand, measuring the height of the load to the nearest 5 cm and then using the wagon width and length to calculate volume.
After some forage harvester tests, harvested material was compacted in a conventional silo bagger to determine consolidated density of the chopped material and the specific energy required for compaction. These tests were limited due to material availability and the large mass of material required to fill a silo bag, so no statistical analysis was possible. Crops considered included SWG, RCG, FS, and CS. Material was compacted in a Kelly Ryan (Blair, NE, USA) 3 m diameter table-feed bagger. The bagger was operated using a John Deere 7320R or Case IH model MX200 [18,19,20,21,22,23,24,25] tractor, and material was delivered to the baggers feed table using silage hoist trucks. Weight of material supplied to the bagger was determined by weighing the trucks to the nearest 10 kg before and after each load using a drive-over scale. The time for each load to be placed into the bagger was determined to the nearest second using a stop watch. Several samples were collected from each load for moisture determination using the procedures described above. Measurement of fuel use rate and estimation of engine power were determined using procedures described above. Density was estimated by dividing load dry mass by the estimated bag volume occupied by each load. Volume was determined by measuring the length the bagger move forward with each load and then multiplying by the bag cross-section.

2.4. Bale Grinding and Shredding

Bales were processed with two objectives: bale decomposition by gross shredding with a bale processor or fine grinding using a tub grinder. Only LRBes were used because the available machines were not large enough to process LSBes (Table 1). Bales had been in storage 9 to 12 months and were ground in the summer after bales had been stored outdoors through the winter and spring months. Two bales were placed in the tub grinder’s hopper to insure there was sufficient mass available to fill the hopper and keep the bales engaged with the grinding rotor. Once equilibrium had been reached, measurement of mass, time and fuel use rate would begin using procedures described above. Grinding and data collection would then continue until approximately 300 kg had been collected per test. Ground material from each replicate test was collected in an H&S (Marshfield, WI, USA) model 7 + 4 forage wagon equipped with load cells to determine mass to the nearest 2 kg. At least eight replicate bales were processed for each treatment for both grinding and shredding experiments. After each replicate, samples were randomly collected from the wagon to determine moisture and particle size following procedures described above. A similar procedure was used when shredding bales in the bale processors except that only a single bale could be processed at a time. No particle size data was collected when the bales were shredded because the material was too long to be processed using the ASABE Standard S424.1 screener.

2.5. Statistical Analysis

Full-factorial analysis using the Standard Least Squares option in the Fit Model platform of JMP Pro Version 13.1 (SAS Institute Inc., Cary, NC, USA) was used to conduct the statistical analysis where appropriate. As appropriate, density, SER, SFU, or mean-particle length (MPL) were analyzed for significant differences created by the altered variables in each experiment. Statistical differences of means were determined using Tukey’s test or Student t-test at 5% significance level.

3. Results

3.1. Baling

In almost all cases, LSBe density was significantly greater with each plunger load setting (Table 2, Table 3 and Table 4). Although not always the case, each incremental increase in plunger load resulted in a slightly smaller percentage increase in bale density. Therefore, bale density versus plunger load was modeled as a power function with an exponent less than 0.5, indicating that as plunger load increased, the bale density increased, but more gradually with each incremental increase in plunger load (Figure 1). Greatest bale density occurred in grass bales, followed by CS and then WS. Due to differences in applied plunger force, the HD LSBr produced SWG and CS bales that had 33% greater density than bales produced by the CD LSBr (Table 3). Bale weight is a combination of dry matter (DM) and water, so if the target density to achieve weight-limited transport is 240 kg·m−3 and the average bale moisture is 15% (w.b.), then the required dry basis density would be 205 kg·m−3. This target was achieved when using the HD LSBr when baling CS, FS, NTG, RCG and SWG, but not WS. The use of the pre-cutter increased density by 4% to 6% (Table 4). The HD LSBe densities produced in this research were greater than those reported when baling SWG, WS or CS with a CD LSBr [2,3,9,13].
Both SER and SFU increased exponentially with bale density (Table 3 and Table 4). Biomass densification is often modeled as a power function where incrementally smaller increases in density are achieved with greater applied pressure as the process transitions from void reduction to consolidation and crushing [13]. If small increases in density require ever greater plunger pressure, and plunger frequency remains constant, then it can be expected that the density vs. SER relationship would be exponential (Equation (1), Figure 2, Table 5):
S E R L S B r = a · e ( b   ·   ρ )
where SERLSBr is the specific energy requirement (kW·h·Mg−1) on a dry basis, ρ is the dry basis bale density (kg·m−3) and a and b are model coefficients (Table 5). Since engine power to overcome baler and tractor rolling resistance can be assumed to have been relatively constant across all tests, differences in SER between bale densities can be attributed to differences in compaction energy required. The regression coefficients in Table 5 could be used to predict the incremental SER needed to achieve a desired bale density. The SFU to bale SWG bales at 145 to 181 kg·m−3 using a CD LSBr was reported to be 1.3 to 1.9 L·Mg−1 [11] which was generally greater than found in this research (Table 3 and Table 4). Throughputs reported by [11] were one-third to one-half of those achieved in this research, which could explain SFU differences. Across all crops, the use of the pre-cutter increased SER by an average of 1.23 kW·h·Mg−1 or 32% (Table 4). The SER for a baler pre-cutter with 71 mm spacing (roughly twice that used here) was 0.33 to 0.85 kW·h·Mg−1 [30]. The greater degree of pre-cutting used here would explain these SER differences.
Pre-cutting with a FK in the LRBrs increased bale density by an average of 5% across all crops (Table 6), similar to previous research with forage crops [31,32,33]. Fine stemmed AL produced greater density LRBes than bales of heavy stemmed crops like SWG or CS. For all crops studied, the maximum density achieved with the LRBr was less than the maximum achieved with the HD LSBr. However, at similar bale densities, the SER for the LRBr were less than that of the LSBr (Table 4 and Table 6) indicating that the continuous compression approach of the LRBr is more efficient than the discontinuous compression loading of the LSBr. Differences in baler mass and subsequent rolling resistance power also contributed to differences in SER between the two types of balers. Use of the pre-cutter configured with a FK increased SER by 32% to 54% across all crops. Due to the less than optimal round cross-section, the dry basis density needed to achieve weight-limited transport with LRBes at 15% (w.b.) moisture is 240 kg·m−3. Densities realized with the biomass crops studied here were well below these goals (Table 6).

3.2. Chopping and Compacting Chopped Material in a Silo Bag

Random orientation of crop entering the SPFH cutterhead often results in MPL longer than the TLOC [34]. When harvested at moistures greater than 20% (w.b.), the differences between the MPL and the TLOC became smaller as TLOC increased (Table 7). Other research with forage crops has shown similar results where the MPL became closer to the TLOC as the TLOC increased [34,35]. When harvested at moisture less than 20% (w.b.), the MPL was less than the TLOC and there were very small differences between MPL across the range of TLOC tested. These crops had overwintered and lost much of the leaf tissue during the winter, so mainly stems were harvested. The stems were very brittle and they likely shattered into particles much smaller than the TLOC when impacted by the SPFH cutterhead.
Increasing the TLOC resulted in a decrease in the SER and SFU for chopping biomass with the SPFH (Table 7). The SER were greater than that required for baling with either the HD LSBrs or the LRBrs. When harvesting corn-silage or grass haylage with a SPFH at similar TLOC to that used here, dry basis SFU ranged from 1.45 to 2.20 L·Mg−1 when the dry basis throughout ranged from 35 to 85 Mg·h−1 [36,37]. The mechanical strength of crops increases as they dry, so some of the energy differences could be due to the relatively dry biomass crops harvested here. Another reason for these differences could be the lower throughput realized with the biomass crops (Table 7). Difficulty picking up and feeding the windrowed biomass crops was often the factor that limited throughput rather than available engine power. Improved methods of collecting and feeding windrowed biomass crops should result in greater SPFH throughput and likely reduce SER and SFU when chopping biomass crops.
The uncompacted density of chopped material in the wagon container was 40% to 55% of that of the material packaged in LSBes or 60% to 75% of that packaged in LRBes (Table 8). The range of chopped biomass bulk-densities in the wagon container were comparable to those reported for similar materials but placed in a small cylindrical container and consolidated by tapping [38]. Compacting chopped material in a silo bag increased the bulk-density by a factor of 1.7 to 2.5 compared to the uncompacted bulk-density in the wagon container (Table 8). The bulk-density of chopped material compacted in the silo bag were comparable to those achieved with the LRBrs but less than the HD LSBr. The dry basis density of chopped SWG in the silo bag was greater than dry SWG compacted in a solid-waste compactor (138 kg·m−3) [4]. If the chopped material moisture was 15% (w.b.) then the wet basis density of the chopped, compacted material would fall short of that needed to insure weight-limited transport but at 25% to 35% moisture, then the density would meet that goal. Based on 54 loads of various crops, regression equations for SER and SFU for compacting with the bagger as a function of material throughput were determined (Equations (2) and (3)):
S E R B a g g e r = 10.31 · e ( 0.037   ·   T )    ( R 2 = 0.886 )
S E R B a g g e r = 2.82 · e ( 0.034   ·   T )    ( R 2 = 0.924 )
where SERBagger is the specific energy requirement (kW·h·Mg−1), SFUBagger is the specific fuel use (L·Mg−1) and T is material throughput (Mg·h−1) with all values on a dry basis. The bagger throughputs achieved ranged from 23 to 53 (Mg·h−1) and the subsequent SER then varied from 4.2 to 1.5 kW·h·Mg−1 and SFU from 1.25 to 0.48 L·Mg−1.

3.3. Bale Grinding and Shredding

The throughput achieved with the tub grinders was less than with the balers or the SPFH (Table 9). The tub grinding throughputs achieved in this research were greater than those reported when processing SWG and CS bales when using a tub grinder with similar screen size but greater engine power [39]. One reason that throughput was greater here was the use of pre-cut bales which were not used by [39]. Pre-cutting bales produced 25% to 45% greater tub grinder throughput than uncut bales because the pre-cut bales came apart more readily which allowed the crop to flow better into the grinding rotor. The SER and SFU for grinding bales were greater than for baling of chopping. The SFU reported here is in the same range as that reported for SWG and CS bales when throughputs were similar to those found here [40]. When LRBe throughputs varied from 10 to 45 Mg·h−1, SFU of tub grinding with screen sizes similar of those used here were 5.9 to 9.7 L·Mg−1 for CS and 2.6 to 3.4 L·Mg−1 for NTG [41]. Although the data is limited, the MPL achieved by tub grinding was similar to that achieved with the SPFH, albeit with greater SER and SFU.
A bale processor is intended to decompose biomass bales to improve downstream material flow to tub grinders or other size-reduction processors. Because much less size-reduction was accomplished when bales were shred with a bale processor, the throughput achieved was greater than with the tub grinders (Table 10). Pre-cutting bales resulted in a 35% to 80% increase in throughput with the bale processor. Both SER and SFU were much less for shredding compared to grinding, but by observation shredding did not achieve the same level of particle size reduction. Using a bale processor prior to tub grinding to improve tub grinder throughput could be an alternative to pre-cutting at baling, but would add an additional operation and cost to bale decomposition.

4. Discussion

The high costs of feedstock logistics represent one of the most significant challenges to the economic viability of the cellulosic feedstock industry [1,6]. Product density and the energy required to achieve a given density have a considerable impact on the feedstock logistics costs. Of the three types of balers studied, only the HD LSBr, often when operated near the maximum allowable plunger load, achieved the target dry basis density of 205 kg·m−3 needed to achieve weight-limited transport. There has been no previous published research that shows that these LSBe densities can be reached with the crops studied. The CD LSBr and the LRBrs fell well short of achieving the required densities. The SER and SFU increased exponentially with HD LBSe density, and at the maximum densities for CS and SWG, the dry basis SER and SFU ranged from 4.0 to 5.0 kW·h·Mg−1 and 1.2 to 1.4 L·Mg−1, respectively. Sokhansanj et al. [15] estimated the power requirements for creating HD LSBes at 240 kg·m−3 to be 9 to 11 kW·h·Mg−1, roughly twice what was found in this research. The results of this research will allow better future estimates of the cost of harvesting biomass in LSBes.
Previous research on tub grinding biomass has been done with LRBes or CD LSBes and the reported throughputs and SFU varied considerably across these studies [39,40,41,42]. Based on the results here and those of previous research, only estimates of SFU to grind HD LSBes can be made. We estimate that the SFU for grinding these bales would likely be in the range of 4 to 7 L·Mg−1. Therefore the total SFU to create and then grind HD LSBes should range between approximately 5 and 8 L·Mg−1. However, additional research is needed to determine the SER and SFU to tub grind HD LSBes at high throughputs so that better estimates of total energy required for a HD LSBe system can be made. Pre-cutting at baling increased the tub grinder throughput by 11% to 22% and reduced SFU by 20% to 53%. Pre-cutting increased the SFU by 0.13 and 0.18 L·Mg−1 for the LSBr and LRBr, respectively. Given the improvement in tub grinder throughput and the reasonable additional SFU at baling, pre-cutting should be considered an improvement over pre-processing by shredding prior to tub grinding.
An alternative biomass feedstock has been proposed in which material would be chopped at 25% to 35% (w.b.) moisture, compacted in a silo bag, stored anaerobically, and then the silo bag segmented into modules that have a length, cross-section and weight that are optimized for efficient transport [43,44]. At the proposed moistures, the compacted density in the silo bags reported here would be sufficient to achieve weight-limited transport. However, there would be less DM shipped with this approach than with the dry HD LSBe system. The SFU for size-reduction with the precision-cut forage harvester was 1.6 to 3.0 L·Mg−1, which was more efficient than size-reduction with the tub grinder. The SFU for compacting chopped material in a silo bagger was 0.5 to 1.3 L·Mg−1, which is in the same range as that required for compacting material with the HD LSBr. Therefore, the total energy expenditure for the chopped and compacted module system was less than the LSBe and tub grinder system. All aspects of this system—efficient size-reduction by precision-cut chopping, compaction to required density in a silo bag with an optimized rectangular cross-section, and low storage losses have been demonstrated either by this research or by [44]. A means to effectively segment the silo bag into transport modules requires additional research and development.

Acknowledgments

This research was partially sponsored by the University of Wisconsin College of Agriculture and Life Sciences; CenUSA: a research project funded by the USDA Agriculture and Food Research Initiative Competitive Grant No. 2011-68005-30411; and USDA Agriculture and Food Research Initiative Grant No. 2013-67021-21160. We also gratefully acknowledge the financial, material or technical support of Krone North America, Kuhn North America, John Deere Product Engineering Center, and John Deere Ottumwa Works.

Author Contributions

Kevin Shinners and Joshua Friede conceived, designed and performed the experiments; Kevin Shinners analyzed the data and wrote the paper.

Conflicts of Interest

The authors declare no conflict of interest.

Abbreviations

ALalfalfa
BPbale processor
CScorn stover
CDconventional density
DMdry matter
FKfull complement of pre-cutter knives
FSforage sorghum
HDhigh density
HKhalf complement of pre-cutter knives
LRBelarge round bales
LRBrlarge round baler
LSBelarge square bales
LSBrlarge square baler
MPLmean particle length
NTGnative grasses
RCGreed canarygrass
ρbale density on a dry basis
SERspecific energy requirement on a dry basis
SFUspecific fuel use on a dry basis
SPFHself-propelled forage harvester
SWGswitchgrass
Tthroughput on a dry basis
TGtub grinder
TLOCtheoretical length of cut
WSwheat straw

References

  1. Hess, J.R.; Wright, C.T.; Kenney, K.L. Cellulosic biomass feedstocks and logistics for ethanol production. Biofuels Bioprod. Biorefin. 2007, 1, 181–190. [Google Scholar] [CrossRef]
  2. Shinners, K.J.; Binversie, B.N.; Muck, R.E.; Weimer, P.J. Comparison of wet and dry stover harvest and storage. Biomass Bioenergy 2007, 31, 211–221. [Google Scholar] [CrossRef]
  3. Shinners, K.J.; Boettcher, G.C.; Muck, R.E.; Weimer, P.J.; Casler, M.D. Harvest and storage of two perennial grasses as biomass feedstocks. Trans. ASABE 2010, 53, 359–370. [Google Scholar] [CrossRef]
  4. Womac, A.R.; Groothuis, M.D.; Dye, C.; Jackson, S.; Tiller, K. Solid waste compactor and ejector transfer system performance with bulk switchgrass. Trans. ASABE 2017, 60, 263–274. [Google Scholar]
  5. Mupondwa, E.; Li, X.; Tabil, L.; Phani, A.; Sokhansanj, S.; Stumborg, M.; Gruber, M.; Laberge, S. Technoeconomic analysis of wheat straw densification in the Canadian Prairie Province of Manitoba. Bioresour. Technol. 2012, 110, 355–363. [Google Scholar] [CrossRef] [PubMed]
  6. Shah, A.; Darr, M. A techno-economic analysis of the stover feedstock supply system for cellulosic biorefineries. Biofuels Bioprod. Biorefin. 2016, 10, 542–559. [Google Scholar] [CrossRef]
  7. Searcy, E.M.; Hess, J.R. Uniform-Format Feedstock Supply System: A Commodity-Scale Design to Produce an Infrastructure-Compatible Biocrude from Lignocellulosic Biomass; EXT-1020372; Idaho National Laboratory: Idaho Falls, ID, USA, 2010. [Google Scholar]
  8. Miao, Z.; Phillips, J.W.; Grift, T.E.; Mathanker, S.K. Energy and pressure requirement for compression of Miscanthus giganteus to an extreme density. Biosyst. Eng. 2013, 114, 21–25. [Google Scholar] [CrossRef]
  9. Cundiff, J.S.; Marsh, L.S. Harvest and storage costs for bales of switchgrass in the southeastern United States. Bioresour. Technol. 1996, 56, 95–101. [Google Scholar] [CrossRef]
  10. Hofstetter, D.W.; Liu, J. Power Requirement and Energy Consumption of Bale Compression; ASABE Technical Paper No. 1111266; ASABE: St. Joseph, MI, USA, 2011. [Google Scholar]
  11. Kemmerer, B.D.; Liu, J. Spring Switchgrass Harvest with a New Holland Large Square Baler; ASABE Technical Paper No. 1009029; ASABE: St. Joseph, MI, USA, 2010. [Google Scholar]
  12. Liu, J.; Kemmerer, B. Field Performance Analysis of a Tractor and a Large Square Baler. SAE Tech. Pap. 2011, 1, 2302–2308. [Google Scholar]
  13. Afzalinia, S.; Roberge, M. Modeling of the pressure-density relationship in a large cubic baler. J. Agric. Sci. Technol. 2012, 15, 35–44. [Google Scholar]
  14. Larasati, A.; Liu, T.; Epplin, F.M. An analysis of logistic costs to determine optimal size of a biofuel refinery. Eng. Manag. J. 2012, 24, 63–72. [Google Scholar] [CrossRef]
  15. Sokhansanj, S.; Webb, E.; Turhollow, A. Cost Impacts of Producing High Density Bales during Biomass Harvest; ASABE Technical Paper No. 141912320; ASABE: St. Joseph, MI, USA, 2014. [Google Scholar]
  16. Shinners, K.J. Engineering Principles of Silage Harvesting Equipment. In Silage Science and Technology; Agronomy Monograph No 42; American Society of Agronomy: Madison, WI, USA, 2003; pp. 361–403. [Google Scholar]
  17. Marx, S.E.; Luck, J.D.; Hoy, R.M.; Pitla, S.K.; Blankenship, E.E.; Darr, M.J. Validation of machine CAN bus J1939 fuel rate accuracy using Nebraska Tractor Test Laboratory fuel rate data. Comput. Electron. Agric. 2015, 118, 179–185. [Google Scholar] [CrossRef]
  18. NTTL (Nebraska Tractor Test Laboratory). OECD Test No. 2099. John Deere 8270R. 2014. Available online: https://tractortestlab.unl.edu/documents/John%20Deere%208270RT4BDEF.pdf (accessed on 21 January 2018).
  19. NTTL (Nebraska Tractor Test Laboratory). OECD Test No. 2017. Case IH MX-235. 2012. Available online: https://tractortestlab.unl.edu/documents/Case%20IH%20Magnum%20235.pdf (accessed on 21 January 2018).
  20. NTTL (Nebraska Tractor Test Laboratory). OECD Test No. 1000. John Deere 8345R. 2015. Available online: https://tractortestlab.unl.edu/John%20Deere%208345R%20e23%20FT4.pdf (accessed on 21 January 2018).
  21. NTTL (Nebraska Tractor Test Laboratory). OECD Test No. 2702. Case IH Maxxum 140. 2012. Available online: https://tractortestlab.unl.edu/documents/Case%20IH%20Maxxum%20140-IT4.pdf (accessed on 21 January 2018).
  22. NTTL (Nebraska Tractor Test Laboratory). OECD Test No. 2035. John Deere 6210R. 2012. Available online: https://tractortestlab.unl.edu/John%20Deere%206210R.pdf (accessed on 21 January 2018).
  23. NTTL (Nebraska Tractor Test Laboratory). OECD Test No. 2701. Case IH Maxxum 120. 2012. Available online: https://tractortestlab.unl.edu/documents/Case%20IH%20Maxxum%20125-IT4.pdf (accessed on 21 January 2018).
  24. NTTL (Nebraska Tractor Test Laboratory). OECD Test No. 1922. John Deere 7230R. 2008. Available online: https://tractortestlab.unl.edu/documents/John%20Deere%207230.pdf (accessed on 21 January 2018).
  25. NTTL (Nebraska Tractor Test Laboratory). OECD Test No. 2119. Case IH MX-200. 2015. Available online: https://tractortestlab.unl.edu/Case%20IH%20Magnum%20200%20FT4.pdf (accessed on 21 January 2018).
  26. Anon. ASABE Standard S358.2. In Moisture Measurement—Forages; ASABE Standards, ASABE: St. Joseph, MI, USA, 2012. [Google Scholar]
  27. Williams, S.D.; Shinners, K.J. Farm-scale anaerobic storage and aerobic stability of high dry matter perennial grasses as biomass feedstock. Biomass Bioenergy 2014, 64, 91–98. [Google Scholar] [CrossRef]
  28. Shinners, K.J.; Wepner, A.D.; Muck, R.E.; Weimer, P.J. Aerobic and anaerobic storage of single-pass chopped stover. Bioenergy Res. 2011, 4, 61–68. [Google Scholar] [CrossRef]
  29. Anon. Method of Determining and Expressing Particle Size of Chopped Forage Materials by Screening; ASABE Standard S424.1; ASABE: St. Joseph, MI, USA, 2012. [Google Scholar]
  30. Veikle, E. Modeling the Power Requirements of a Rotary Feeding and Cutting System. Ph.D. Thesis, University of Saskatchewan, Saskatoon, SK, Canada, 2011. [Google Scholar]
  31. Borreani, G.; Tabacco, E. The effect of a baler chopping system on fermentation and losses of wrapped big bales of alfalfa. Agron. J. 2006, 98, 1–7. [Google Scholar] [CrossRef]
  32. Tremblay, D.; Savoie, P.; LePhal, Q. Power requirements and bale characteristics for a fixed and a variable chamber baler. Can. Agric. Eng. 1997, 39, 73–76. [Google Scholar]
  33. Lötjönen, T.; Paappanen, T. Bale density of reed canarygrass spring harvest. Biomass Bioenergy 2013, 51, 53–59. [Google Scholar] [CrossRef]
  34. Pitt, R.E. Theory of particle size distributions for chopped forages. Trans. ASAE 1987, 30, 1246–1253. [Google Scholar] [CrossRef]
  35. Savoie, P.; Tremblay, D.; Theriault, R.; Wauthy, J.M.; Vigneault, C. Forage chopping energy vs. length of cut. Trans. ASAE 1989, 32, 437–442. [Google Scholar] [CrossRef]
  36. Rubenschuh, U. DLG Report No. 6283F. New Holland FR 650—Fuel Consumption and Throughput in Corn. 2015. Available online: http://www.dlg-test.de/tests/6283F_e.pdf (accessed on 27 March 2018).
  37. Rubenschuh, U. DLG Report No. 6314. New Holland FR 650—Performance Test in Grass. 2016. Available online: http://www.dlg-test.de/tests/6314_e.pdf (accessed on 27 March 2018).
  38. Chevanan, N.; Womac, A.R.; Bitra, V.S.; Sokhansanj, S. Effect of particle size distribution on loose-filled and tapped densities of selected biomass after knife mill size reduction. Appl. Eng. Agric. 2011, 27, 631–644. [Google Scholar] [CrossRef]
  39. Yancey, N.A.; Wright, C.T.; Conner, C.C.; Tumuluru, J.S. Optimization of Preprocessing and Densification of Sorghum Stover at Full-Scale Operation; ASABE Technical Paper No. 1110675; ASABE: St. Joseph, MI, USA, 2011. [Google Scholar]
  40. Yancey, N.; Wright, C.T.; Westover, T.L. Optimizing hammer mill performance through screen selection and hammer design. Biofuels 2013, 4, 85–94. [Google Scholar] [CrossRef]
  41. Kaliyan, N.; Schmidt, D.R.; Morey, R.V.; Tiffany, D.G. Commercial scale tub grinding of corn stover and perennial grasses. Appl. Eng. Agric. 2012, 28, 79–85. [Google Scholar] [CrossRef]
  42. Wright, C.T.; Pryfogle, P.A.; Stevens, N.A.; Hess, J.R.; Radtke, C.W. Value of Distributed Preprocessing of Biomass Feedstocks to a Bioenergy Industry; ASABE Technical Paper No. 066151; ASABE: St. Joseph, MI, USA, 2006. [Google Scholar]
  43. An, H.; Searcy, S.W. Economic and energy evaluation of a logistics system based on biomass modules. Biomass Bioenergy 2012, 46, 190–202. [Google Scholar] [CrossRef]
  44. Orrick, J.D. Development and Evaluation of Systems to Efficiency Store and Transport Bulk Biomass Feedstock. Master’s Thesis, University of Wisconsin, Madison, WI, USA, 2015. [Google Scholar]
Figure 1. Dry bale density averaged across uncut and pre-cut bales versus plunger load (expressed as percent of maximum allowed by baler manufacturer) for switchgrass (SWG), native grasses (NTG), corn stover (CS), and wheat straw (WS) (LSBr expr. No. 3, Table 1).
Energies 11 00780 g001
Figure 2. Specific energy requirement vs. bale density (both on a dry basis) for combined switchgrass and native grass data from the high density (HD) LSBr and combined reed canarygrass and switchgrass data from the conventional density (CD) LSBr.
Energies 11 00780 g002
Table 1. Baling, chopping and bale processing experiments conducted.
Exper. No.Crops [a]Relevant EquipmentTractor [b]Experiment Details
Baling experiments conducted with large square balers (LSBrs)
LSBr 1SWG, RCG, AL, FSKrone 1290 HDPJohn Deere 8270RBaled in spring after crops overwintered or in summer (AL only).
LSBr 2SWG, NTG, CSKrone 1290 HDP, Case IH LB 334John Deere 8270R, Case IH MX235Baled in autumn.
LSBr 3SWG, NTG, WS, CSKrone 1290 HDP XCJohn Deere 8345RBaled in summer (WS only) or in autumn. Bales made with and without pre-cutting with 22 knives at 44 mm spacing.
Baling experiments conducted with large round balers (LRBrs)
LRBr 1SWG, RCGJohn Deere 582Case IH Maxxum 140Baled in autumn and repeated in spring after crop overwintered. Pre-cutter configurations [c] used were none; HK, FK.
LRBr 2SWG, RCG, AL, CSKuhn VB2160John Deere 6210RBaled in autumn. Pre-cutter configurations used were none; HK, FK.
LRBr 3SWG, RCG, CSCase IH RB454Case IH Maxxum 125Baled in autumn. Pre-cutter configurations used were none; HK, FK.
Chopping experiments conducted with self-propelled forage harvester (SPFH)
SPFH 1SWG, RCGJohn Deere 7800 Chopped in spring after crops overwintered. Theoretical length of cut (TLOC) used were 7, 14, and 21 mm.
SPFH 2SWG, RCG, FS, CSJohn Deere 7800 Chopped in fall. TLOC used were 7, 14, and 21 mm.
Bale grinding experiments conducted using tub grinder (TG)
TG 1SWG, RCGRoto Grind 760 [d]John Deere 7230RBales [e] had been baled with pre-cutter configurations [c] of none; HK, FK.
TG 2SWG, RCGHaybuster H1100 [f]John Deere 7230RBales [e] had been baled with pre-cutter configurations [c] of none; HK, FK.
TG 3SWG, RCG, CSHaybuster H1100 [f]John Deere 7230RBales [e] had been baled with pre-cutter configurations [c] of none; FK.
Bale shredding experiments conducted using bale processor (BP)
BP 1SWG, RCG, CSHaybuster 2650John Deere 7230RBales [e] processed were baled without pre-cutting.
BP 2SWG, CSKuhn Primor 4270MJohn Deere 6210RBales [e] processed were baled with pre-cutter configurations [c] of none; FK.
Notes: [a] AL—alfalfa; CS—corn stover; FS—forage sorghum, NTG—native grasses; RCG—reed canarygrass; SWG—switchgrass; WS—wheat straw; [b] See reference [18,19,20,21,22,23,24,25] for relevant Nebraska OECD Tractor Test Summary reports. All tractors and the SPFH used diesel fuel with an approximate energy value of 45.5 kJ·kg-1; [c] None—no pre-cutting; HK—half complement of knives 11–16 cm spacing; FK—complement of knives 5–8 cm spacing; [d] This tub grinder did not use screens but rather a series of fixed shear bars between hammer rotor and tub exit; [e] Only round bales were processed. Bales were processed in the summer after being stored outdoors through winter and spring months; [f] Diameter of screen openings was 8 cm.
Table 2. Large square bale density (dry basis) as affected by plunger load (LSBr expr. No. 1, Table 1).
Plunger Load [a]Bale Density (kg·m−3)
SwitchgrassReed CanarygrassForage SorghumAlfalfa
Moisture Content (w.b.)
11.1%15.9%21.4%15.6%
30%132d129d139d180d
50%161c158c167c201c
70%176b182b191b220b
90%198a214a225a249a
Significance [b]<0.0001<0.0001<0.0001<0.0001
Notes: [a] Targeted plunger load as fraction of maximum allowed by baler manufacturer. Alfalfa was baled at 30%, 45%, 60% and 75% plunger load; [b] Means in the same column followed by different letters (a–d) are significantly different using Tukey’s test at 5% significance level.
Table 3. Large square bale density and specific energy and fuel use (all on a dry basis) as affected by plunger load and baler type (LSBr expr. No. 2, Table 1).
Plunger Load [a]Bale Density (kg·m−3)Specific Energy (kW·h·Mg−1)Specific Fuel Use (L·Mg−1)Plunger Load [a]Bale Density (kg·m−3)Specific Energy (kW·h·Mg−1)Specific Fuel Use (L·Mg−1)Plunger Load [a]Bale Density (kg·m−3)Specific Energy (kW·h·Mg−1)Specific Fuel Use (L·Mg−1)
High density large square baler (Krone model 1290 HDP)
Native grasses (16.3% & 22.9 Mg·h−1) [b] Switchgrass (16.0% & 27.0 Mg·h−1) [b] Corn stover (22.7% & 19.4 Mg·h−1) [b]
20%149e2.02c0.80c20%151d2.02c0.80c30%141c4.16b1.48b
30%160d2.20bc0.84bc30%168c2.27bc0.85bc45%163b5.14ab1.74ab
40%185c2.42bc0.88bc40%188b2.45abc0.89abc60%184a6.02a1.84a
50%199b2.70ab0.94ab50%200a2.64ab0.93ab
60%211a3.22a1.04a60%208a2.88a0.97a
Significance [c]<0.0001<0.0001<0.0001 <0.00010.00160.0016 <0.00010.00330.0469
Conventional density large square baler (Case IH model LB334)
Reed canarygrass (15.4% & 23.6 Mg·h−1) [b] Switchgrass (14.5% & 24.6 Mg·h−1) [b] Corn stover (21.8% & 15.8 Mg·h−1) [b]
30%130c1.57b0.67a20%104c1.50b0.78a30%111c3.20a1.27a
50%155b1.99ab0.77a40%141b1.88a0.88a45%121b3.34a1.36a
70%179a2.23a0.83a60%157a1.98a0.90a60%137a3.73a1.46a
Significance [c]<0.00010.04280.3914 <0.00010.00780.2010 <0.00010.17300.1590
Notes: [a] Targeted plunger load as fraction of maximum allowed by baler manufacturer; [b] Average moisture content (% w.b.) and dry basis throughput, respectively; [c] Means in the same column followed by different letters (a–e) are significantly different using Tukey’s test at 5% significance level.
Table 4. Large square bale density and specific energy and fuel use (all on dry basis) as affected by plunger load and pre-cutting (LSBr expr. No. 3, Table 1).
Baler ConfigurationBale Density (kg·m−3)Specific Energy (kW·h·Mg−1)Specific Fuel Use (L·Mg−1)Bale Density (kg·m−3)Specific Energy (kW·h·Mg−1)Specific Fuel Use (L·Mg−1)
Plunger load [b]Native grasses (17.4% & 37.2 Mg·h−1) [a]Switchgrass (20.6% & 31.0 Mg·h−1) [a]
Analyzed independent of pre-cutter use
30%151e2.67c0.91c167e3.22c1.02c
45%176d2.86c0.95c191d3.40c1.05c
60%193c3.16bc1.01bc215c3.74bc1.12bc
75%211b3.79ab1.13ab228b3.98ab1.17ab
90%226a4.21a1.22a244a4.32a1.24a
Significance [c]<0.0001<0.0001<0.0001<0.0001<0.0001<0.0001
Pre-cutter [d]Analyzed independent of plunger load
None186b3.05b0.99b205b3.34b1.04b
Pre-cut197a3.62a1.10a213a4.13a1.20a
Significance [c]<0.0001<0.00010.0002<0.0001<0.0001<0.0001
Plunger load [b]Corn stover (20.6% & 31.1 Mg·h−1) [a]Wheat straw (8.3% & 28.5 Mg·h−1) [a]
Analyzed independent of pre-cutter use
30%134e4.04b1.18b
45%154b4.15b1.20b139d3.54b1.08b
60%177c4.37ab1.25ab155c3.93b1.16b
75%193b4.67ab1.31ab168b4.32ab1.24ab
90%211a4.89a1.35a178a4.85a1.34a
Significance [c]<0.00010.00390.0039<0.00010.00130.0014
Pre-cutter [d]Analyzed independent of plunger load
None167b3.81b1.13b155b3.82b1.14b
Pre-cut178a5.04a1.38a165a4.50a1.27a
Significance [c]0.0126<0.0001<0.0001<0.00010.00380.0033
Notes: [a] Average moisture content (% w.b.) and dry basis throughput, respectively; [b] Targeted plunger load as fraction of maximum allowed by baler manufacturer; [c] Means in the same column followed by different letters (a–e) are significantly different using Tukey’s test or Student t-test at 5% significance level; [d] Pre-cutter configured with 22 knives with 44 mm spacing between knives.
Table 5. Coefficients for exponential model (Equation (1)) of large square baler specific energy requirements as function of bale density (both on a dry basis).
CropModel Coefficients [a]R2
ab
LSBr experiment no. 2
High density baler, without pre-cutting [b]
Switchgrass0.8630.005670.980
Native grasses0.7260.006790.939
Corn stover1.2620.008520.995
Conventional-density baler, without pre-cutting [b]
Switchgrass0.8610.005350.991
Reed canarygrass0.6410.007050.958
Corn stover1.6340.005980.995
LSBr experiment no. 3
High density baler, without pre-cutting [b]
Switchgrass1.4890.003900.925
Native grasses1.0540.005660.941
Wheat straw1.2920.006980.952
Corn stover1.9690.003840.985
High density baler, with pre-cutting [b,c]
Switchgrass1.8450.003750.989
Native grasses0.8860.007040.945
Wheat straw1.0890.008560.980
Corn stover3.5540.001510.886
Notes: [a] See Equation (1); [b] Conventional or high density large square balers—see Table 1; [c] Pre-cutter configured with 22 knives with 44 mm spacing between knives.
Table 6. Large round bale density and specific energy and fuel use (all on a dry basis) as affected by pre-cutting (LRBr exprs. nos. 1–3, Table 1).
Pre-Cutter Knife Configuration [a,b]Bale Density (kg·m−3)Specific Energy (kW·h·Mg−1)Specific Fuel Use (L·Mg−1)
Switchgrass (16.1% and 22.6 Mg·h−1) [c]
None132b1.68c0.82b
HK132b1.91b0.87ab
FK141a2.21a0.96a
Significance [d]0.0004<0.00010.0005
Reed canarygrass (14.2% and 24.1 Mg·h−1) [c]
None132b1.53c0.74b
HK134b1.75b0.75b
FK138a2.16a0.90a
Significance [d]0.0005<0.0001<0.0001
Alfalfa (14.1% and 19.9 Mg·h−1) [c]
None203b1.43b0.99a
HK200b1.59b1.01a
FK212a2.00a1.12a
Significance [d]0.0006<0.0001<0.0001
Corn stover (23.4% and 24.3 Mg·h−1) [c]
None175a1.51b0.79b
HK183a2.33a1.08a
Significance [d]0.5897<0.0001<0.0001
Notes: [a] Pre-cutter knife spacing was 11–16 cm for HK and 5–8 cm for FK (see Table 1); [b] Data was analyzed by crop across all pertinent experiments using full-factorial analysis; [c] Average moisture content (% w.b.) and dry basis throughput, respectively; [d] Means in the same column followed by different letters (a–c) are significantly different using Tukey’s test or Student t-test at 5% significance level.
Table 7. Mean particle length and specific energy and fuel use (on a dry basis) when chopping with a self-propelled forage harvester (SPFH) using various theoretical-length-of-cut.
Theoretical Length of Cut (mm)Mean Particle Length [a] (mm)Specific Energy (kW·h·Mg−1)Specific Fuel Use (L·Mg−1)
SPFH experiment no. 1
Switchgrass (17.8% and 24.4 Mg·h−1) [b]
75c8.68a2.20a
147b7.62b1.98b
218a6.74b1.79b
Significance [c]<0.0001<0.0001<0.0001
Reed canarygrass (15.0% and 28.6 Mg·h−1) [b]
75c8.74a2.22a
146b7.34b1.92b
218a6.03c1.63c
Significance [c]<0.0001<0.0001<0.0001
SPFH experiment no. 2
Switchgrass (44.2% and 20.0 Mg·h−1) [b]
712c11.63a2.84a
1414b10.23a2.54a
2117a8.51b2.17b
Significance [c]<0.0001<0.0001<0.0001
Reed canarygrass (45.6% and 18.8 Mg·h−1) [b]
711c12.26a2.97a
1414b9.19b2.31b
2119a7.43c1.94c
Significance [c]<0.0001<0.0001<0.0001
Forage sorghum (53.9% and 27.6 Mg·h−1) [b]
79c7.83a2.02a
1412b6.34b1.71b
2115a5.64c1.55c
Significance [c]<0.0001<0.0001<0.0001
Corn stover (28.7% and 25.3 Mg·h−1) [b]
716c8.76a2.22a
1419b7.15b1.87b
2122a6.73b1.79b
Significance [c]<0.00010.00060.0007
Notes: [a] Geometric mean particle length as determined using procedures of ASABE Standard S424.1 [32]; [b] Average moisture content (% w.b.) and dry basis throughput, respectively; [c] Means in the same column followed by different letters (a–c) are significantly different using Tukey’s test at 5% significance level.
Table 8. Range of densities (dry basis) of chopped biomass material either uncompacted in the wagon container or after compaction in a silo bag.
Crop [a]Range of Moisture (w.b.)Range of Mean Particle Lengths (mm)Wagon or Silo Bag Density (kg·m−3)
Uncompacted material in wagon container
SWG, RCG [b]37–65%6–2067–105
SWG, RCG [b]10–15%5–961–78
Forage sorghum56–58%9–1577–98
Corn stover36–50%17–5556–96
Compacted material in silo bag
SWG, RCG [b]37–65%6–20150–175
SWG, RCG [b]10–15%5–9150–200
Forage sorghum55–61%10–20185–215
Corn stover27–55%14–30120–175
Notes: [a] All crops chopped with forage harvester at theoretical length of cut of 7, 14, or 21 mm; [b] Switchgrass (SWG) and reed canarygrass (RCG).
Table 9. Mean particle length and specific energy requirements (both on a dry basis) for tub grinding large round bales (TG Exprs. Nos. 1–3, Table 1).
CropBaler Pre-Cutter Configuration [a]Mean Particle Length [b] (mm)Throughput (Mg·h−1)Specific Energy (kW·h·Mg−1)Specific Fuel Use (L·Mg−1)
TG experiment no. 1 [c]
SWG and RCGNone13a6.0b15.9a6.28a
SWG and RCGHK10ab6.4b13.5ab5.76ab
SWG and RCGFK8b7.6a12.6b5.03b
Significance [d] 0.02540.00030.016250.0021
TG experiment no. 2 [e]
SWG and RCGNone10a6.8b16.8a5.96a
SWG and RCGHK10a11.2a10.1b3.60b
SWG and RCGFK9a14.5a7.5b2.81b
Significance [d] 0.56940.00280.00170.0014
TG experiment no. 3 [f,g]
SWG and RCGNone 4.0ab21.0a8.55b
SWG and RCGFK 5.7a11.6b4.97c
CSNone 3.2b32.0b11.31a
CSFK 4.6ab21.4a8.12b
Significance [d] 0.0130.0450.040
TG experiment no. 3 analyzed independent of crop type
None 3.6b26.5a9.94a
FK 5.1a16.5b6.55b
Significance [d] 0.00490.04700.028
TG experiment no. 3 analyzed independent of pre-cutter use on baler
SWG and RCG 4.8a16.3b6.76b
CS 3.9a26.7a9.72a
Significance [a] 0.07350.0400.045
Notes: [a] None—no pre-cutting; HK—half complement of knives 11–16 cm spacing; FK—complement of knives 5–8 cm spacing (Table 1); [b] Geometric mean particle length as determined using procedures of ASABE Standard S424.1 [32]; [c] Switchgrass (SWG) and reed canarygrass (RCG) bales processed at average moisture of 21.3% (w.b.); [d] Means in the same column followed by different letters (a–c) are significantly different using Tukey’s test or Student t-test at 5% significance level; [e] SWG and RCG bales processed at average moisture of 16.9% (w.b.); [f] Bales processed at average moisture of 20.1% (SWG, RCG) and 26.4% (CS) (w.b.); [g] Mean particle length data is not available.
Table 10. Throughput and specific energy requirements (both on a dry basis) for processing large round bales with a bale shredder (BP exprs. nos. 1 and 2, Table 1).
CropBaler Pre-Cutter Configuration [a]Throughput (Mg·h−1)Specific Energy (kW·h·Mg−1)Specific Fuel Use (L·Mg−1)
BP experiment no. 1 [b]
SWG and RCGNone16.4b1.95a1.76a
CSNone28.7a1.94a1.26b
Significance [c] <0.00010.9461<0.0001
BP experiment no. 2 [d]
SWG and RCGNone9.4c1.79a2.18a
SWG and RCGFK17.0b1.22b1.28b
CSNone21.1b1.62ab1.18b
CSFK28.5a1.42ab0.95b
Significance [c] <0.0001<0.0001<0.0001
BP experiment no. 2 analyzed independent of crop type
None15.3b1.71a1.68a
FK22.7a1.32b1.12b
Significance [c] <0.00010.0026<0.0001
BP experiment no. 2 analyzed independent of pre-cutter use
SWG and RCG 13.2b1.51a1.73a
CS 24.8a1.51a1.07b
Significance [c] <0.00010.9253<0.0001
Notes: [a] None—no pre-cutting; FK—complement of knives 5–8 cm spacing (see Table 1); [b] Switchgrass (SWG), reed canarygrass (RCG) and corn stover (CS) bales processed at average moisture of 18.0% (SWG, RCG) and 19.4% (CS) (w.b.); [c] Means in the same column followed by different letters (a–c) are significantly different using Tukey’s test or Student t-test at 5% significance level; [d] Bales processed at average moisture of 22.8% (SWG, RCG) and 30.4% (CS) (w.b.).

