Article

Symmetric Fuzzy Logic and IBFOA Solutions for Optimal Position and Rating of Capacitors Allocated to Radial Distribution Networks

1
Department of Electrical and Electronics Engineering, Northern India Engineering College, FC-26, Shastri Park, New Delhi, Delhi 110053, India
2
Department of Electrical and Instrumentation Engineering, Thapar Institute of Engineering and Technology, Patiala, Punjab 147004, India
3
Optical Devices and Systems, CSIR-Central Scientific Instruments Organisation, Sector 30-C, Chandigarh 160030, India
*
Author to whom correspondence should be addressed.
Energies 2018, 11(4), 766; https://doi.org/10.3390/en11040766
Submission received: 11 February 2018 / Revised: 16 March 2018 / Accepted: 20 March 2018 / Published: 28 March 2018
(This article belongs to the Section F: Electrical Engineering)

Abstract

:
This paper suggests an innovative approach for the ideal placement and categorization of capacitors in radial distribution networks (RDNs) by applying symmetric fuzzy and improved bacterial foraging optimization algorithm (IBFOA) solutions. The reactive power reimbursement significantly enhances the function of the power system, and capacitor placement is an impressive technique used to reduce loss of the system. The capacitor allocation for distribution system problems involves determining the ideal location and size of the capacitor. In this work, load flow is performed at first to compute actual losses and voltages at different nodes without compensation. In the planned technique, the loss sensitivity factor (VSF) and voltage stability index (VSI) are utilized to determine the optimal location of capacitors in RDNs. Here, the IBFOA is used to determine the proper rating of the capacitor. The suggested scheme is applied on three different types of RDNs.

1. Introduction

Electric power is constantly transferred from source to distribution via transmission, where active and reactive power losses occur [1]. Real power drop in any radial power distribution system is significant because reactive power losses that can be controlled by legitimate management of reactive power. To avoid reactive power accidents, nearby reactive power compensation via appropriate capacitor placement is the most powerful method employed throughout the world [2]. Advantages of capacitor placement include minimization of real and reactive power losses, power factor enhancement, appropriate voltage profile maintenance, and the release of overburden on feeders and transformers [3]. Aside from these advantages, if the size and location of the capacitor are not appropriate, then the framework might be defenseless and act in anomalous ways, and voltage increments might pass cut-off points, causing unsatisfactory power factors, poor arrangements, and parallel resonance issues [4,5]. Considering this as a top priority, many researchers are working for the best reproduction process for ideal capacitor placement and measurement [6].
Optimal capacitor placement has recently been the subject of numerous research works. The majority of papers on this issue have tackled the issue with graph search algorithms, ant colony direction, particle swarm optimization (PSO), fuzzy evolutionary programming, and genetic algorithms. In addition, cost per covariance for every capacitor shifts from one size to another [7]. Optimal size capacitor unit placement is a major challenge in research. In distribution systems for capacitor placement, computational time has not been a major issue, but progressive measurement has been considered to decrease computational time [8]. Appropriate location of each capacitor placement is obtained by nondominated sorting genetic algorithm (NSGA). Optimal size of capacitor incorporation at appropriate location results in more diminished estimates of cost [9].
Optimal capacitors assimilation in distribution network reduce losses, improve the voltage profile, supply reactive loads. Hence power factor of the system is also improved. Therefore, optimal capacitor arrangement is needed for today’s intricate coordinated systems [10]. An algorithm is proposed here to determine ideal capacitor placement and size. Effective cost (ECOST) is calculated to determine the adequate level of quality for shoppers. The optimization of shunt capacitor placement in distribution frameworks has been explored [11,12]. When reactive power requests are supplied in distribution feeders, power incidents can be minimized by adding shunt capacitors. A power system source does not need to supply all receptive power solicitations and mishaps [13]. In dissemination feeders, there is an opportunity to diminish setbacks connected to receptive force through buses [14].
The upsides of capacitor arrangement in dissemination frameworks are force component rectification, bus voltage regulation, force and vitality accident lessening, feeder and framework limit discharge, and influence quality changes [15]. Capacitors are designated under possible stacking conditions of the already expressed central purposes of the capacitor position in a circulation framework. This suggests enhancement, which implies that the capacitor should be made with, for example, the necessary target capacity and the ability to control voltage, influence stream, and other parameters. The proper course of action should be associated with the ideal number, place, size, control, and sort at various stages of capacitor operation [16,17].
The overview of the proposed work is as follows: Section 2 dictates the related techniques of the paper; Section 3 explains the proposed methodology that determines the capacitor’s location using fuzzy logic and the size of the capacitor using IBFOA; Section 4 explains the results and discussion in relation to MATLAB programming; Section 5 concludes.

2. Related Work

Some of the recent work related to the optimal placement and sizing of capacitor is listed below.
Changes in system voltage profiles, change in system power components, and expansions through cables and transformers are the surely understood advantages of optimal positioning of capacitors in force power circulation systems. The reduction of accidents because of the remuneration of the responsive parts of the influence stream is another point of interest in the field of capacitor placement. By diminishing flow through cables, the systems’ heap can be expanded without over-burdening the current links or including any new links. These advantages depend fundamentally on how shunt capacitors are placed in the system.
Elsheikh et al. [18] tended to the issue of how to ideally distinguish careful areas to introduce capacitors and buses of power distribution feeders. The ideal sizes of capacitors also needed to be introduced. Their procedure utilized accident affectability components to distinguish transports requiring remuneration. Additionally, a discrete PSO was utilized to determine capacitor sizes.
In [19], an ideal capacitor situation in power distribution systems understood by the HCODEQ (hybrid CODEQ technique) obtained from hybrid combination of chaotic search, opposition-based learning, differential evolution and quantum mechanics was proposed. The ideas of quantum mechanics, chaotic search, and resistance-based learning were utilized as a part of the CODEQ technique to defeat the downside of parameter choice in the differential evolution (DE).
Zeinalzadeh et al. [20] presented a utilization of multi objective particle swarm optimization (MOPSO) system. That strategy had a point of determining the ideal location and the shunt capacitor bank size (SCBs and circulated areas (DGs)) in distribution systems while considering load vulnerability conditions. The three target elements of multi-target advancement consist in enhancing voltage steadiness, diminishing active power losses for buses, and adjusting the current in framework segments. The vulnerability of losses was displayed utilizing fuzzy data theory. This strategy utilized Pareto ideal answers to handle issues of target capacities and limitations and to determine the best arrangement among the three distinctive target capacities. Notwithstanding this, a fuzzy-based mechanism was utilized.
Sultana and Roy [21] displayed the teaching-learning-based optimization (TLBO) algorithm to deal with minimize capacitor cost and the loss of power in power systems by the ideal arrangement of capacitors. The proposed computation depended on two essential ideas of instruction: teaching stage and learning stage. In the teaching stage, learners enhanced their insight or capacity through the arrangements of the teacher. Learners expanded their insight by cooperation among themselves in the learning stage. To check achievability, the proposed technique was tested on 22-node, 69-node, 85-node, and 141-node RDNs.
Shuaib et al. [22] presented the gravitational search algorithm (GSA) for optimal capacitor placement in RDNs. They tested their method on 33-node, 69-node, 85-node, and 141-node RDNs and compared their proposed method with an interior point (IP) algorithm and simulated annealing (SA).
A direct search algorithm (DSA) was used by Raju et al. [23] to obtain ideal sizes of capacitors in RDNs for reductions in losses of the system. They considered 22-node, 69-node, and 85-node RDNs to implement their method.
Abdelaziz [24] had used a power pollination algorithm (FPA) to locate capacitors in RDNs with a target to reduce the size of capacitors at the selected locations. They had selected the candidate node using the power loss index (PLI). They applied their method on 15-, 69-, and 118-node RDNs. They then compared their method with other algorithms.

3. The Proposed Methodology for Optimal Placement and Sizing of Capacitor

It is essential to integrate shunt capacitors in RDNs to retain the RDN’s stability and reduce its loss. However, improper placement and sizing of the capacitor causes additional problems. Thus, the identification of ideal placement and size is essential for the deduction of power loss of the system. Hence, this methodology is intended to develop a better work for the sizing and placement of capacitors in RDNs. In the proposed system, symmetric fuzzy power flow evaluation is proposed to maximize the accuracy of the method, to reduce computational effort, and to make it possible to achieve high levels of accuracy when applied to real systems. A multi-objective IBFOA is also suggested to determine the ideal or optimal rating of shunt capacitors in RDNs. Details pertaining to the IBFOA is available in [25].

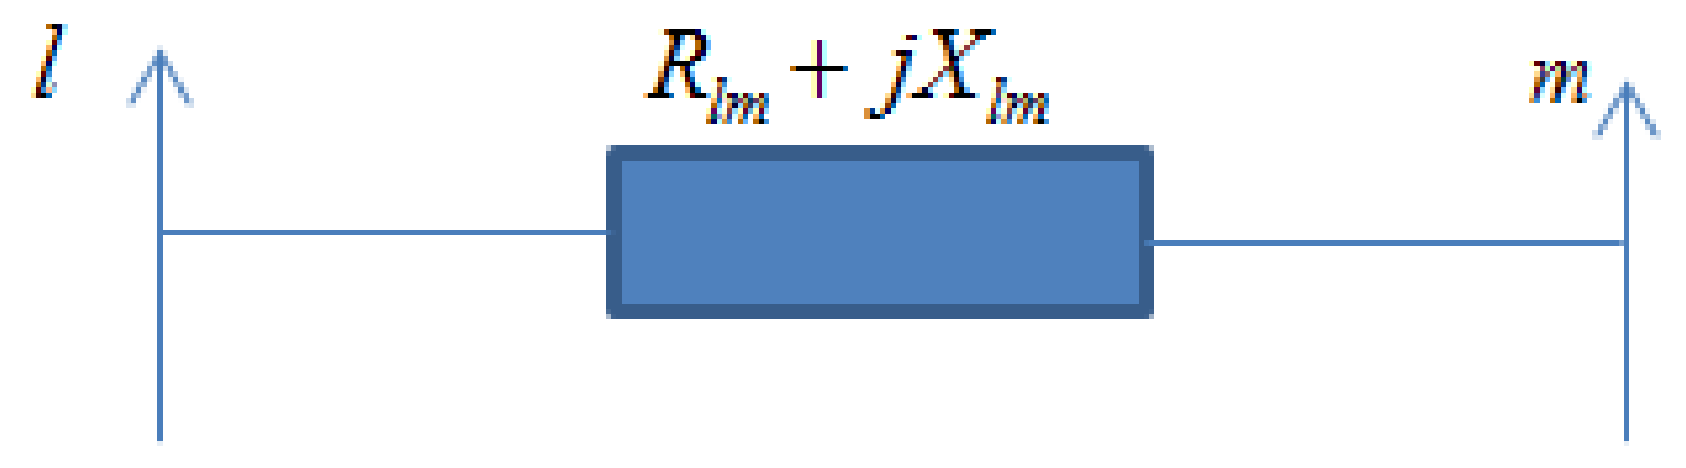
3.1. Fuzzy-Based Load Flow

The voltage stability index (VSI) and the loss sensitivity factor (LSF) are the two factors used for identifying the exact location of the capacitor. Buses with greater LSF values take highest priority for placement identification. When the voltage collapse probability of a bus is high compared with that of other buses, it is chosen as the second location for capacitor placement and is determined using VSI. Here, load flow using fuzzy modeling improves accuracy.
A distribution system sample modeled is represented in Figure 1.
The LSF and VSI are dependent on voltage and power losses at the particular node [25]. The degree of symmetry fuzzy ranges between 0 and 1. The voltage membership function is described as
μ v ( l ) = { 0 V l v min exp { w v [ V l 1 v max v min ] 2 } v min < V l < v max 1 V l v max
where w v is the weighting factor for the voltage membership function; v max is the maximum value of permitted voltage; v min is the minimum value of permitted voltage.
The formula below depicts the membership function for active power loss
μ p ( l ) = { 0 T p T p , min exp { w p × L ( p ) T p } T p , min < T p < T p , max 1 T p T p , max
where w p is the weighting factor for membership function of active power loss; L(p) is the real power loss between l and l + 1 buses; Tp is the total real power loss.
The membership function for reactive power loss is given by Equation (3).
μ Q ( l ) = { 0 T q T q , min exp { w Q × L ( q ) T q } T q , min < T q < T q , max 1 T q T q , max
where w Q is the weighting factor for reactive power loss membership function; L ( q ) is the reactive power loss between l and l + 1 bus; T q is the total reactive power loss.
Figure 2 explains the flow chart for the symmetry fuzzy load flow. The above formulae are the membership functions of the power loss and voltage values. The fuzzy power flow is used to compute the losses, voltages, and phase angles. The inputs of the general fuzzy power flow, i.e., the injection of active and reactive powers, are taken as the constraints in the symmetric flow. In the voltage calculation, it is possible to evaluate its highest and lowest limit; when these limits are considered, the active and reactive powers are within the limit. The membership functions are calculated from the initial load flow, and the fuzzy condition is formed using these membership functions. By using this condition, the LSF and VSI values are evaluated for each node. Based on the values, the optimal location for capacitor placement is identified.

3.2. Optimal Placement and Sizing of the Capacitor

Load flow is achieved using the fuzzy method. Based on the membership functions, the voltage and loss of the system are measured. By the measured value, the condition below is checked, and the LSF and VSI values are then measured in order to locate the capacitor. The loss sensitivity factor, which is higher for a node with a lower VSI value, is used to determine the location of the capacitor. At each node, the fuzzy condition is expressed as follows:
i f μ P ( l ) & μ Q ( l ) i s g r e a t e r { i f μ v ( l ) i s s m a l l e r { t h e n f i n d LSF & VSI } } .
(a) LSF: This factor is used to recognize the proper position of the capacitor. The node of the radial distribution system, which has a greater chance of determine the ideal location of the capacitor, has a supreme loss sensitivity factor value.
LSF = 2 Q m R l , m | V m | 2 .
By arranging the LSF values of all buses and nodes in descending order, we selected the node or bus that has the highest value of LSF.
(b) VSI: To check the power system’s security level, many parameters are used, one of which is the VSI. Nodes that produce more voltage collapse can be identified using VSI. Capacitor placement is determined at node with a low VSI value. The VSI at every node is computed using Equation (5) [26]:
VSI = | V l | 4 4 [ P m X l m Q m R l m ] 2 4 [ P m R l m + Q m X l m ] | V l | 2
where Pm is the effective active power at the node m; Qm is the effective reactive power at the node m; Rlm is the resistance between the node l and m; Xlm is the reactance between the node l and m; the voltage at node l is Vl; the voltage at node m is Vm.

3.3. Improved Bacterial Foraging Optimization Algorithm (IBFOA)

To deal with different optimization problems in the distribution system, the IBFOA was used, which is an enhanced version of the bacterial foraging optimization algorithm (BFOA). The BFOA is an effective swarm-intelligence-based stochastic interest technique designed by Kevin Passino. The thought driving the BFOA assumes a normal determination of beings with poor foraging strategies, eliminates these beings, and favors those with productive foraging strategies. The improved BFOA is implemented by improving the foraging processes of bacteria. The proposed work is improved with chemotaxis and an elimination and dispersal process. The strategy of poor foraging is either transformed into extraordinary ones or, after numerous eras, eliminated [25]. The normal developmental procedure strategy relies on their wellness criteria and are requested into
  • an ability to search food
  • self-charging (mobile behavior)
The foraging mechanism of E. coli bacteria is governed by four processes: (1) chemotaxis; (2) swarming; (3) reproduction; (4) eradication and dissemination. Parameters adopted in the IBFOA algorithm are P, S, Ns, Nc, Nre, Ned, Ped, n, C(i), and θi.
Chemotaxis: Chemotaxis can be achieved by swimming and tumbling movements of each bacterium. Swimming denotes the movement of a bacterium that is done in a predefined way. Tumbling refers to the random movement.
T u m b l e = S t e p l e n g t h o f t h a t b a c t e r i a × U n i t l e n g t h o f r a n d o m d i r e c t i o n
Swarming: Swarming refers to the richest food source margining of bacteria in a concentric pattern with high bacterial density.
F c c ( θ , P ( j , k , l ) ) = i = 1 S F c c ( θ , θ i ( j , k , l ) )
F c c = i = 1 S [ d a t t r a c tan t exp ( w a t t r a c tan t m = 1 p ( θ m θ m i ) 2 ) ] + i = 1 S [ h r e p e l l a n t exp ( w r e p e l l a n t m = 1 p ( θ m θ m i ) 2 ) ]
Reproduction: When the unhealthy bacteria will die, the healthiest one splits into two bacteria. This makes the bacterium population as a constant value. The new bacteria are placed in the position where the least healthy bacteria were present.
Elimination and Dispersal: The bacterium population may change due to unexpected changes. For example, a significant rise in temperature can kill bacteria in some places. All bacteria in a particular location are killed or replaced into a new location. The Pseudo code of IBFOA is given below (Algorithm 1).
Algorithm 1 Pseudo code of IBFOA
1: Initialize parameters
2: Optimal placement of capacitor
  if μ P ( l ) & μ Q ( l ) is greater and if μ v ( l ) is smaller
  then calculate VSI, LSF.
  Evaluate fitness function 1 for each node.
3: Update Elimination and dispersal, reproduction, chemotaxis steps.
4: Perform chemotaxis to find best fitness
  Calculate Fitness function for every bacterium
  Substitute the value in Flast
  Generate random vector
  Evaluate movement of bacterium
  Update fitness function
  If i S then go to the next bacterium
5: Perform reproduction up to k N r e .
6: Perform Elimination and dispersal and Evaluate fitness 2.
  Perform elimination and dispersal up to l N e d
7: Calculate fitness for capacitor size
8: End
Step 1 Parameter Initialization
The speed of convergence of the algorithm contrasts with various combinations of parameters accordingly to accomplish the fastest convergence of the algorithm, which keeps running for various lengths of time for various estimations of the parameters given above and defined now. Ns is the digit of iteration (31); P is the number of optimization variables (3); S is the numeral value of bacteria used for searching the total area (50); Nc is the numeral value of chemotactic steps (4); N e d is the maximum numeral value of elimination and dispersal events (2); Nre is the maximum numeral value of reproduction steps (4); Psd is the probability of elimination and dispersal process (0.25); n is the digit of nodes; C ( i ) is the step change in size in the random direction ( 0.05 × o n e s ( S , 1 ) ); θ i is the assigned location, and the lower and upper limits of the capacitor bank θ i = ( θ i 1 , θ i 2 , θ i 3 ) where i = 1 , 2 , , S ; the height of the repellent: hrepellent (0.1); the width of the attractant: wattractant (0.2); the width of the repellent: wrepellent (1.0); the depth of the attractant released by the cell: dattractant (0.1).
Step 2 Optimal placement
For the optimal placement of the capacitor, conditions are checked with membership functions μ P ( l ) & μ Q ( l ) and μ v ( l ) , and the VSI and LSF values determine the best location for capacitor placement. The process is repeated for all nodes. The optimum location is computed using the formula
O p t i m u m L o c a t i o n : F i t n e s s 1 = min { VSI LSF } .
Step 3 Update of the IBFOA, Elimination and Dispersal, Reproduction and Chemotaxis Processes.
After every Nre reproduction steps, the elimination and dispersal is done. Likewise, after every Ncd steps, a reproduction is taken into account.
Step 4 Chemotaxis
The chemotaxis is run for all bacterium. The fitness function is
F ( i , j , k , l ) = F ( i , j , k , l ) + F c c ( θ i ( j , k , l ) , P ( j , k , l ) ) .
In chemotaxis, by using the objective function, the fitness function is computed. The objective function is based on the repellent and attractant signal. The fitness function value is equated in the Flast value. For the next fitness, it is necessary to compute the movement. For that, a random vector is generated. The movement is computed by
θ i ( j + 1 , k , l ) = θ i ( j , k , l ) + C ( i ) Δ ( i ) Δ T ( i ) Δ ( i ) .
For every bacterium, the fitness function is computed and updated in Flast. When the number of iterations exceeds the number of bacteria, the chemotaxis process is ended.
Step 5 Reproduction
The half number of the aggregate bacteria with the highest costs will pass on and the leftover half of the bacteria with the foremost values will be separated and set at the same location as that of their parents.
F i h e a l t h = i = 1 N c + 1 F ( i , j , k , l ) .
If the value of the maximum number of reproduction is less than the k value, increments of reproduction are performed.
Step 6 Elimination and Dispersal
The low F value bacterium will be selected. Every bacterium is wiped out and dispersed with likelihood, which ensures that the quantity of the microbes in the population is a consistent value. For a conclusive bacterium population, the value of F is ascertained. The ideal size of the capacitor bank is given by the bacterium, which gives the best F value.
F 2 = F i t n e s s 2 = min { F i h e a l t h } .
By combining the two fitness values, we can determine the optimal size of the capacitor at the appropriate location.
F i t n e s s = min [ ( VSI LSF ) + F 2 ] .

4. Experimental Results

The proposed methodology was implemented in MATLAB, and the system had the following parameters:
  • Operating speed: 2.90 GHz.
  • Processor: Intel Pentium@ 2.90 GHz.
  • RAM: 4 GB.
  • MATLAB Version: R2014a.
With respect to static characteristics, there were load models are different types. These were used in the RDNs. In the proposed approach, the constant power model was used for analysis. The methodology for the distribution system analysis and load modeling was implemented in the working platform of MATLAB using 33-, 69-, and 141-node RDNs. In our proposed method, the cost value is taken as the load value. MATLAB can compute the power loss of any RDN and identify a capacitor bank’s optimal location using the load flow. The correctness of the proposed methodology has been verified with existing work. The voltage and power values of the base case were computed from the load flow analysis. The load modeling was done by using Equation (14).
P l , n e w + j Q l , n e w = α ( P l + j Q l )
where α is the cost of the capacitor.

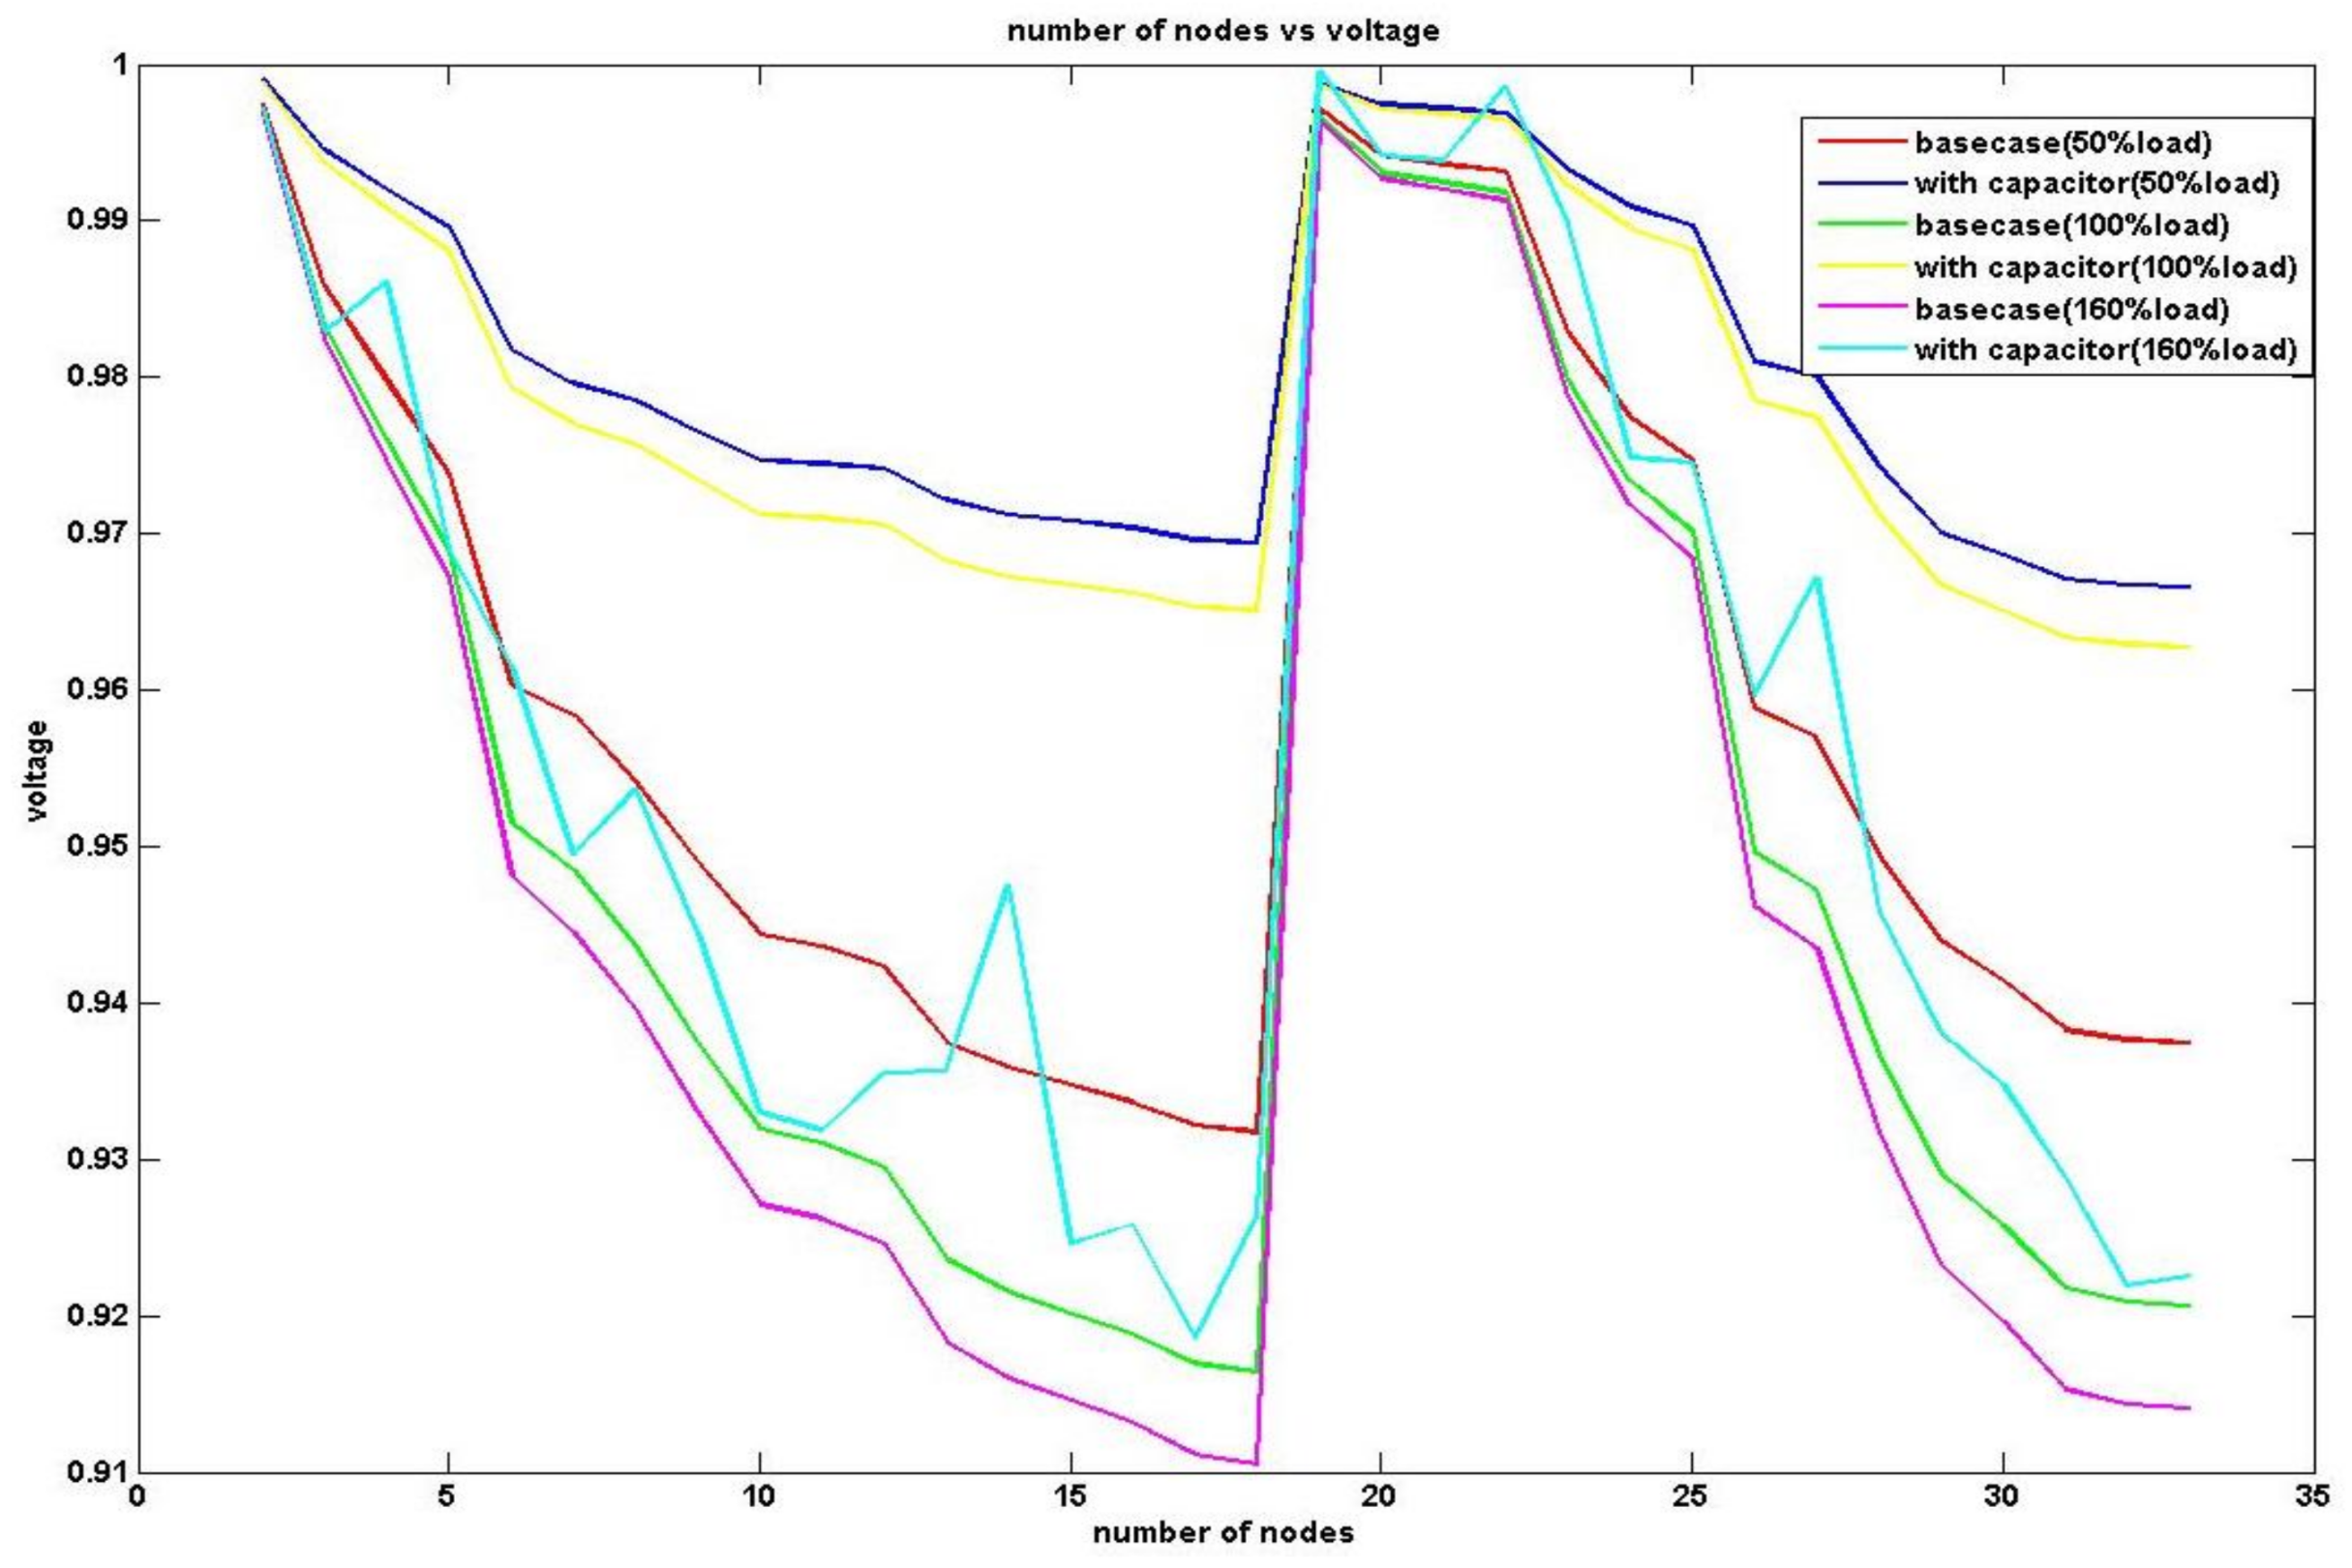
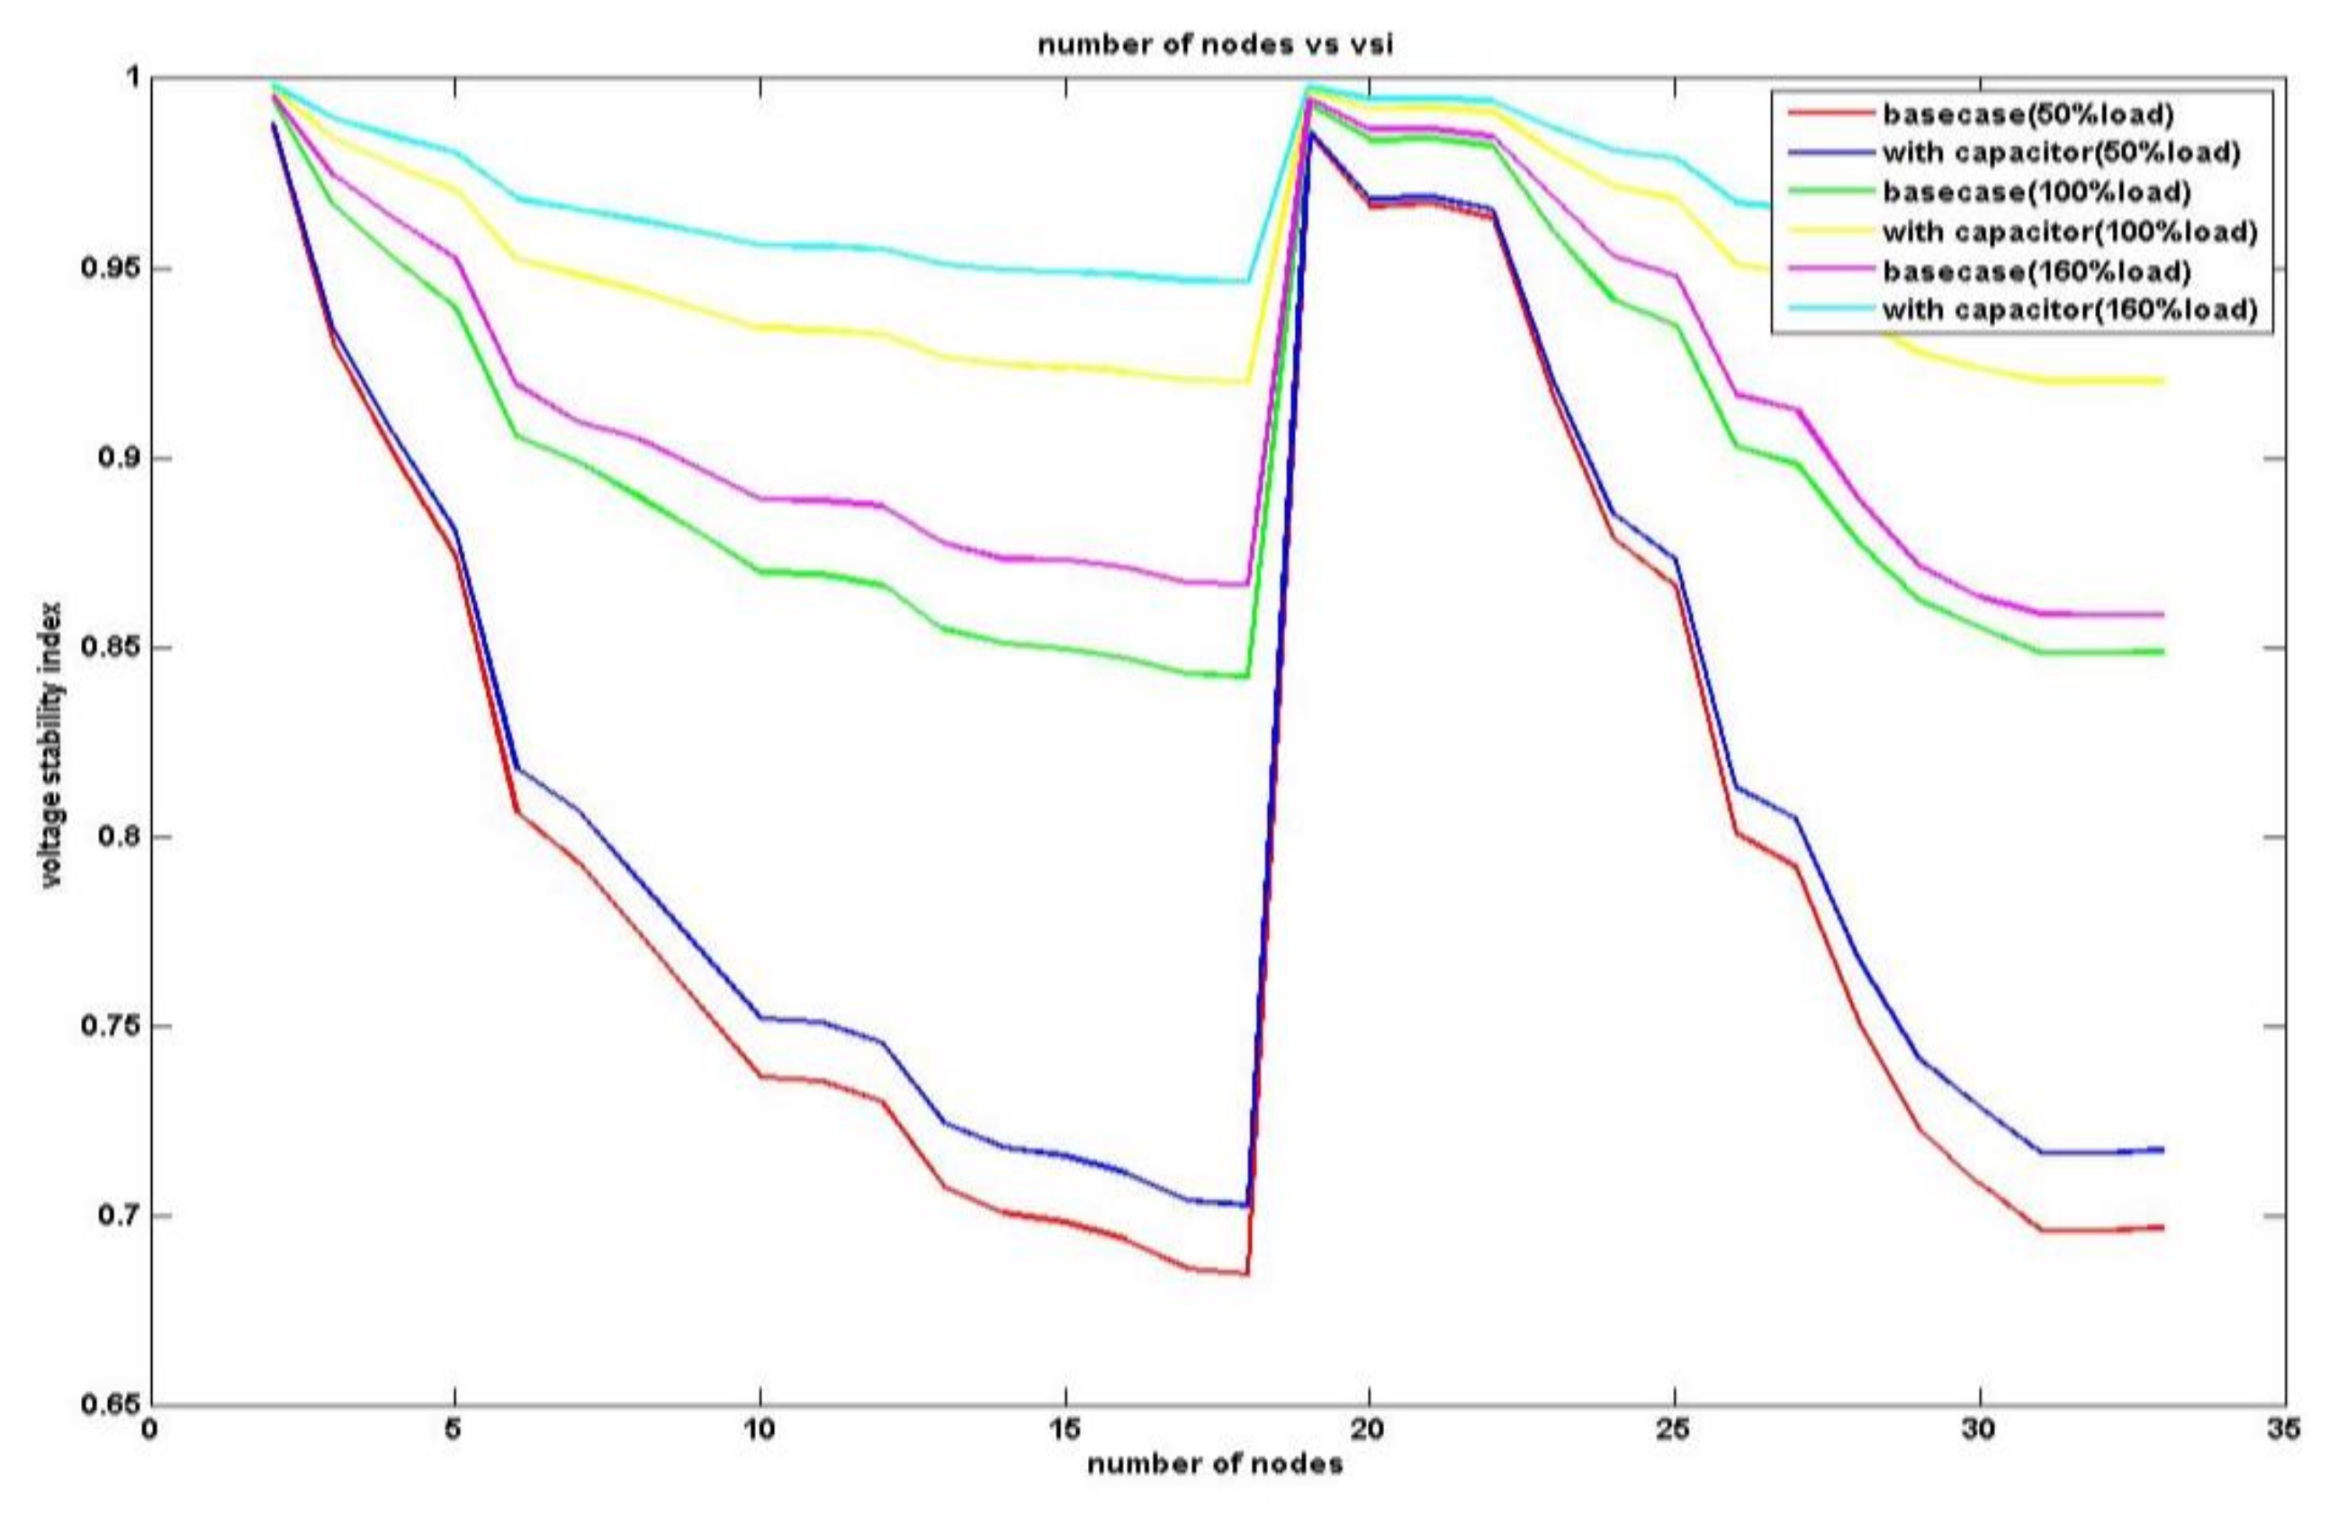
4.1. The 33-Node RDN
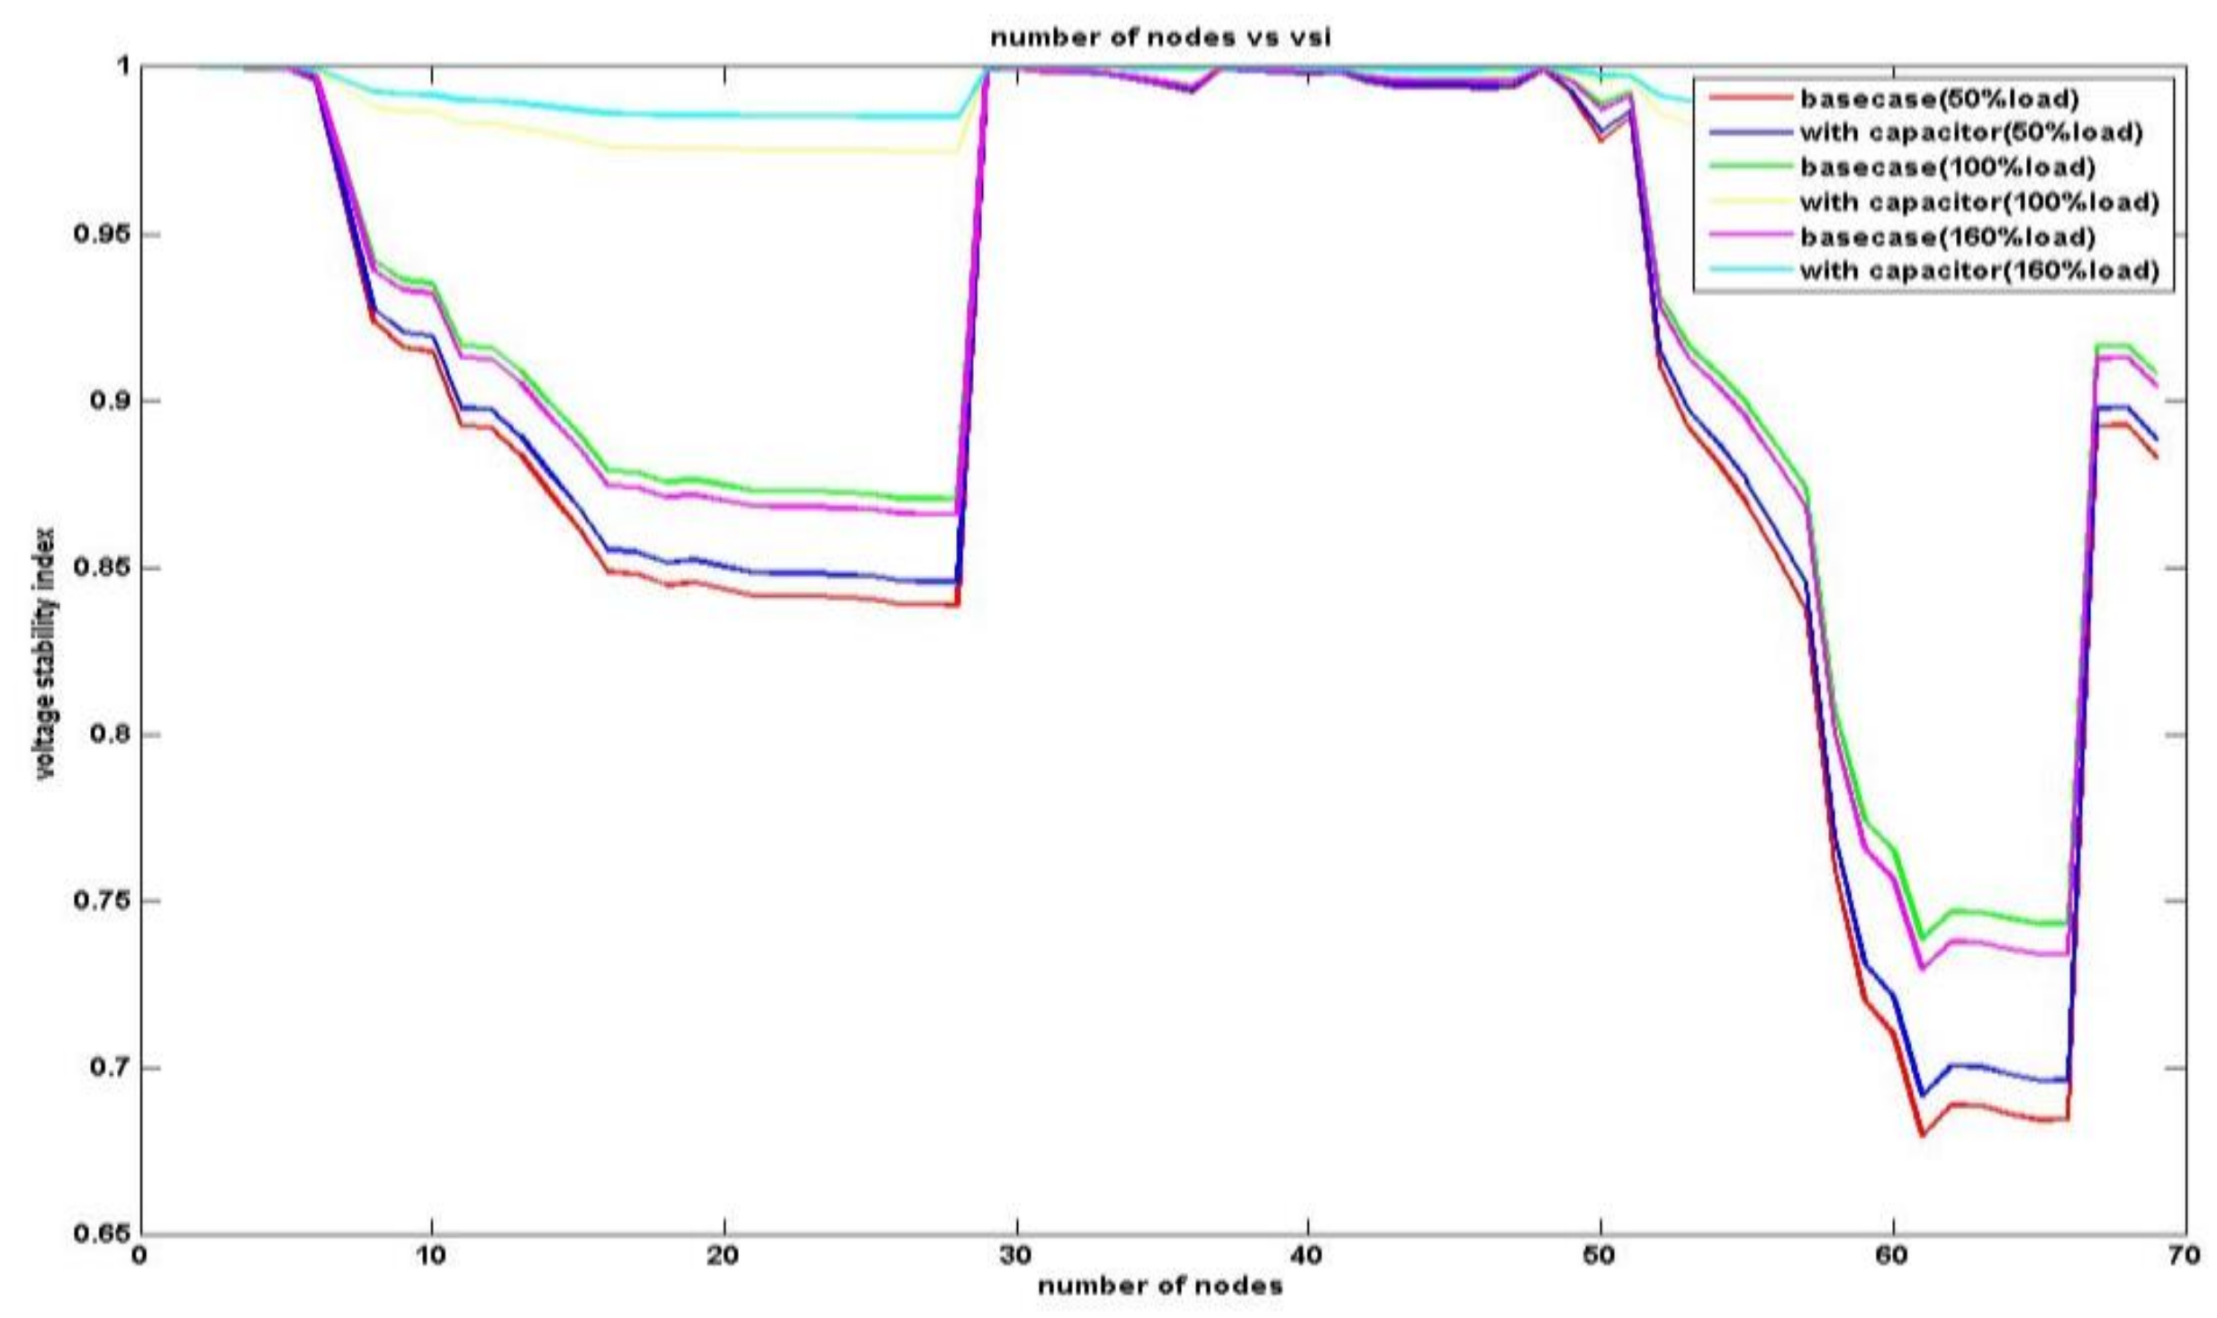
The total load of the 33-node RDN [27] with 12.66 kV and 100 MVA as base values was 3.7 + j2.3 MVA. The results (the optimal location and size, the lowest values of voltage, and the VSI along with node and real power loss for three different types of loads—light (50%), normal (100%), and peak (160%)), before and after compensations utilizing the suggested methodology, are given in Table 1.
Figure 3 plots the magnitude of the voltage vs. the number of nodes before and after compensation for light load conditions (50%), normal load conditions (100%), and peak load conditions (160%).
Figure 4 plots the VSI vs. the number of nodes before and after compensation for light load, normal load, and peak load.
The results attained from the proposed method after compensation has also been juxtaposed with GSA, SA, and IP [22] as shown in Table 2 for normal load (100%).

4.2. 69-Node RDN

In this method, a 69-node RDN [27] with 12.66 kV and 100 MVA as base values with a total load of 3.8 + j2.69 MVA is considered. The respective losses are 51.59 kW, 224.96 kW, and 652.34 kW for three different loads i.e., peak (50%), normal (100%), and light (160%) before compensation, and the corresponding minimum voltages are 0.9566 (65), 0.9099 (65), and 0.8444 (65), respectively.
The results (minimum voltage and node number, optimal location and size, and real power loss for three different loads—light (50%), normal (100%), and peak (160%)), after compensation obtained by the proposed scheme, are given in Table 3 along with the results obtained by TLBO [21], DSA [23], and FPA [24].
The magnitude of voltage vs. the number of nodes before and after compensation for each case of the above three loads are plotted in Figure 5.
Figure 6 plots the VSI vs. the number of nodes before and after compensation for the above three loads.

4.3. 141-Node RDN

The third example is a 141-node RDN with 12.47 kV and 100 MVA as base values. This network is considered with an initial loss of 116 kW. The system loads are 1171.5125 kW and 725.7846 kVAr, respectively. The system data is available in [22].
The result realized by the suggested method are here juxtaposed with TLBO [21] for three types of load (light, normal, and peak) and with GSA [22] for normal load, as shown in Table 4, after compensation. The proposed method, compared to those found in [21,22], provides improved results.

5. Conclusions

The research in this paper was motivated by power loss diminution and improved stability in the distribution system. In RDNs, enhancement in the voltage profile, the depletion of power loss, and improvement in the system stability can be performed by optimal capacitor placement, which is presented in this paper. The combined approach of symmetric fuzzy flow and IBFOA is proposed to determine the proper size and position of the capacitor in order to decrease system loss and enhance voltage stability. The best position and size of the capacitor is found out by using LSF, VSI, and the IBFOA technique. The recommended technique was exercised on 33-node, 69-node, and 141-node RDNs. Outcomes are juxtaposed with outcomes of previous related works. The proposed method provides improved results for the curtailment of loss and the enhancement of voltage.

Author Contributions

The entire research work has been carried out by Chandan Kishore under guidance of Smarajit Ghosh and Vinod Karar.

Conflicts of Interest

The authors declare no conflict of interest.

References

  1. Blaabjerg, F.; Chen, Z.; Kjaer, S.B. Power electronics as efficient interface in dispersed power generation systems. IEEE Trans. Power Electr. 2004, 19, 1184–1194. [Google Scholar] [CrossRef]
  2. Viawan, F.; Karlsson, D. Voltage and reactive power control in systems with synchronous machine-based distributed generation. IEEE Trans. Power Deliv. 2008, 23, 1079–1087. [Google Scholar] [CrossRef]
  3. Barker, P.P.; De Mello, R.W. Determining the impact of distributed generation on power systems. I. Radial distribution systems. IEEE Power Eng. Soc. Summer Meet. 2000, 3, 1645–1656. [Google Scholar] [CrossRef]
  4. Sonwane, P.M.; Kushare, B.E. Optimal Capacitor Placement and Sizing: An Overview. Int. J. Innov. Res. Adv. Eng. 2015, 2, 103–113. [Google Scholar]
  5. Naik, S.G.; Khatod, D.K.; Sharma, M.P. Optimal allocation of combined DG and capacitor for real power loss minimization in distribution networks. Int. J. Electr. Power Energy Syst. 2013, 53, 967–973. [Google Scholar] [CrossRef]
  6. Ng, H.N.; Salama, M.M.A.; Chikhani, A.Y. Classification of capacitor allocation techniques. IEEE Trans. Power Deliv. 2000, 15, 387–392. [Google Scholar] [CrossRef]
  7. Etemadi, A.H.; Fotuhi-Firuzabad, M. Distribution system reliability enhancement using optimal capacitor placement. IET Gener. Transm. Distrib. 2008, 2, 621–631. [Google Scholar] [CrossRef]
  8. Carpinelli, G.; Proto, D.; Noce, C.; Russo, A.; Varilone, P. Optimal allocation of capacitors in unbalanced multi-converter distribution systems: A comparison of some fast techniques based on genetic algorithms. Electr. Power Syst. Res. 2010, 80, 642–650. [Google Scholar] [CrossRef]
  9. Miloševič, B.; Begovič, M. Capacitor placement for conservative voltage reduction on distribution feeders. IEEE Trans. Power Deliv. 2004, 19, 1360–1367. [Google Scholar] [CrossRef]
  10. Viral, R.; Khatod, D.K. Optimal planning of distributed generation systems in distribution system: A review. Renew. Sustain. Energy Rev. 2012, 16, 5146–5165. [Google Scholar] [CrossRef]
  11. Popović, D.H.; Greatbanks, J.A.; Begović, M.; Pregelj, A. Placement of distributed generators and reclosers for distribution network security and reliability. Int. J. Electr. Power Energy Syst. 2005, 27, 398–408. [Google Scholar] [CrossRef]
  12. DcDermott, T.E.; Drezga, I.; Broadwater, R.P. A heuristic nonlinear constructive method for distribution system reconfiguration. IEEE Trans. Power Syst. 1999, 14, 478–483. [Google Scholar] [CrossRef]
  13. Borges, C.L.T.; Falcao, D.M. Optimal distributed generation allocation for reliability, losses, and voltage improvement. Int. J. Electr. Power Energy Syst. 2006, 28, 413–420. [Google Scholar] [CrossRef]
  14. Peças Lopes, J.A.; Hatziargyriou, N.; Mutale, J.; Djapic, P.; Jenkins, N. Integrating distributed generation into electric power systems: A review of drivers, challenges and opportunities. Electr. Power Syst. Res. 2007, 77, 1189–1203. [Google Scholar] [CrossRef]
  15. Wu, T.; Rothleder, M.; Alaywan, Z.; Papalexopoulos, A.D. Pricing energy and ancillary services in integrated market systems by an optimal power flow. IEEE Trans. Power Syst. 2004, 19, 339–347. [Google Scholar] [CrossRef]
  16. Valle, Y.D.; Venayagamoorthy, G.K.; Mohagheghi, S.; Hernandez, J.C.; Harley, R.G. Particle swarm optimization: Basic concepts, variants and applications in power systems. IEEE Trans. Evol. Comput. 2008, 12, 171–195. [Google Scholar] [CrossRef]
  17. Prakash, K.; Sydulu, M. Particle swarm optimization based capacitor placement on radial distribution systems. IEEE Power Energy Soc. Gen. Meet. 2007, 1–5. [Google Scholar] [CrossRef]
  18. Elsheikh, A.; Helmy, Y.; Abouelseoud, Y.; Elsherif, A. Optimal capacitor placement and sizing in radial electric power systems. Alex. Eng. J. 2014, 53, 809–816. [Google Scholar] [CrossRef]
  19. Chiou, J.P.; Chang, C.F. Development of a novel algorithm for optimal capacitor placement in distribution systems. Electr. Power Energy Syst. 2015, 73, 684–690. [Google Scholar] [CrossRef]
  20. Zeinalzadeh, A.; Mohammadi, Y.; Moradi, M.H. Optimal multi objective placement and sizing of multiple DGs and shunt capacitor banks simultaneously considering load uncertainty via MOPSO approach. Electr. Power Energy Syst. 2015, 67, 336–349. [Google Scholar] [CrossRef]
  21. Sultana, S.; Roy, P.K. Optimal capacitor placement in radial distribution systems using teaching learning based optimization. Electr. Power Energy Syst. 2014, 54, 387–398. [Google Scholar] [CrossRef]
  22. Shuaib, Y.; Mohamed, M.; Kalavathi, S.; Christober, C.; Rajan, A. Optimal capacitor placement in radial distribution system using Gravitational Search Algorithm. Int. J. Electr. Power Energy Syst. 2015, 64, 384–397. [Google Scholar] [CrossRef]
  23. Raju, M.R.; Murthy, K.R.; Ravindra, K. Direct search algorithm for capacitive compensation in radial distribution systems. Int. J. Electr. Power Energy Syst. 2012, 42, 24–30. [Google Scholar] [CrossRef]
  24. Abdelaziz, A.Y.; Ali, E.S.; Abd Elazim, S.M. Optimal sizing and locations of capacitors in radial distribution systems via flower pollination optimization algorithm and power loss index. Eng. Sci. Technol. Int. J. 2016, 19, 610–618. [Google Scholar] [CrossRef]
  25. Li, J.; Dang, J.; Bu, F.; Wang, J. Analysis and improvement of the bacterial foraging optimization algorithm. J. Comput. Sci. Eng. 2014, 8, 1–10. [Google Scholar] [CrossRef]
  26. Chakravorty, M.; Das, D. Voltage Stability Analysis of Radial Distribution Networks. Int. J. Electr. Power Energy Syst. 2001, 23, 129–135. [Google Scholar] [CrossRef]
  27. Ghosh, S.; Das, D. Method for load-flow solution of radial distribution networks. IET Proc. Gener. Transm. Distrib. 1999, 146, 641–648. [Google Scholar] [CrossRef]
Figure 1. Illustration of the distribution system.
Energies 11 00766 g001
Figure 2. Flow chart for symmetry fuzzy load flow.
Energies 11 00766 g002
Figure 3. Voltage magnitude vs. the number of nodes with and without the capacitor.
Energies 11 00766 g003
Figure 4. VSI vs. node number before and after compensation.
Energies 11 00766 g004
Figure 5. Voltage magnitude vs. the number of nodes with and without the capacitor.
Energies 11 00766 g005
Figure 6. VSI vs. node number before and after compensation.
Energies 11 00766 g006
Table 1. Results achieved by the suggested method (at loads 50%, 100%, 160%).
ParametersBase CaseProposed Method
Light Load (50%)
Optimal location & size-18 & 698
30 & 280
25 & 360
Vmin (p.u.) & node0.9545 & 180.9731 & 32
VSImin(p.u.) & node0.6959 & 180.7271 & 32
Power loss (kW)57.3341.02
Nominal Load (100%)
Optimal location & size-18 & 695
30 & 850
25 & 525
Vmin (p.u.) & node0.9133 & 180.9699 & 32
VSImin(p.u.) & node0.7849 & 180.8761 & 32
Power loss (kW)202.25131.78
Peak Load (160%)
Optimal location & size-18 & 750
30 & 820
25 & 1066
Vmin (p.u.) & node0.8543 & 180.8871 & 32
VSImin(p.u.) & node0.8876 & 180.9728 & 32
Power loss (kW)523.85411.01
Table 2. Outcomes obtained by the proposed methodology with GSA, SA, and IP [25] and for normal load.
Load TypeCasesPower Loss (kW)Min. Voltage (p.u.)Capacitor LocationCapacitor Size (kVAr)
Normal load (100%)Proposed Method132.560.9698 (32)18, 25, 30695, 525, 850
GSA [22]134.50.967226, 13, 15350, 450, 800
SA [22]151.750.959110, 30, 14450, 350, 900
IP [24]171.780.95019, 29, 30450, 800, 900
Table 3. Results of the proposed method with TLBO [21], the direct search algorithm (DSA) [23] and the power pollination algorithm (FPA) [24] (at loads 50%, 100%, and 160%).
ParametersTLBO [21]Proposed MethodDSA [23]FPA [24]
Light Load (50%)
Optimal location & size (kVAr)22 & 150
61 & 450
62 & 450
65 & 295
60 & 283
10 & 492
15 & 300
60 & 300
61 & 450
-
Vmin (p.u.) & node0.9662 & 650.9687 & 650.9683 & 65-
VSImin (p.u.) & node-0.7191 & 65--
Power loss (kW)34.4333.2835.52-
Nominal Load (100%)
Optimal location & size (kVAr)22 & 300
61 & 1050
62 & 300
65 & 432
60 & 420
10 & 828
15 & 450
60 & 450
61 & 900
61 & 1250
21 & 250
Vmin (p.u.) & node0.9321 & 650.9425 & 650.9318 & 650.9323
VSImin (p.u.) & node-0.7945 & 65--
Power loss (kW)146.80143.97147.00145.78
Peak Load (160%)
Optimal location & size (kVAr)22 & 300
61 & 1050
62 & 750
65 & 1210
60 & 570
10 & 480
15 & 900
60 & 900
61 & 1800
-
Vmin (p.u.) & node0.8795 & 650.8823 & 650.8936 & 65-
VSImin (p.u.) & node-0.9754 & 65--
Power loss (kW)417.28416.01427.3-
Table 4. Correlation of results of the proposed method with TLBO [21] (at loads 50%, 100%, and 160%) and GSA [22] (at 100% load).
ParametersTLBO [21]Proposed MethodGSA (100% Load Only) [22]
Light Load (50%)
Optimal location & size (kVAr)49 & 150
50 & 0
75 & 0
78 & 0
81 & 150
87 & 150
52 & 328
32 & 434
80 & 450
42 & 180
43 & 570
116 & 150
-
Vmin (p.u.) & node0.9680 & 520.9699 & 52-
VSImin & node-0.8598 & 52-
Power loss (kW)13.251112.18-
Nominal Load (100%)
Optimal location & size (kVAr)15 & 900
21 & 600
55 & 900
63 & 900
78 & 900
85 & 750
52 & 870
32 & 878
80 & 450
42 & 890
43 & 750
116 & 903
23 & 150
50 & 350
55 & 350
64 & 150
80 & 150
99 & 150
Vmin (p.u.) & node0.9484 & 520.9508 & 52-
VSImin & node-0.9281 & 52-
Power loss (kW)44.731143.0045.74
Peak Load (160%)
Optimal location & size (kVAr)31 & 900
45 & 900
62 & 900
63 & 900
79 & 900
87 & 900
52 & 870
32 & 750
80 & 460
42 & 350
43 & 570
116 & 360
-
Vmin (p.u.) & node0.9073 & 520.9228 & 52-
VSImin & node-0.9456 & 52-
Power loss (kW)129.1649127.25-

