Article

Rapid Estimation Method for State of Charge of Lithium-Ion Battery Based on Fractional Continual Variable Order Model

1
Department of Mechanical and Electronic Engineering, Nanjing Forestry University, Nanjing 210037, China
2
Microvast Power Systems Co., Ltd., Huzhou 313000, China
*
Author to whom correspondence should be addressed.
Energies 2018, 11(4), 714; https://doi.org/10.3390/en11040714
Submission received: 10 February 2018 / Revised: 6 March 2018 / Accepted: 20 March 2018 / Published: 22 March 2018

Abstract

:
In recent years, the fractional order model has been employed to state of charge (SOC) estimation. The non integer differentiation order being expressed as a function of recursive factors defining the fractality of charge distribution on porous electrodes. The battery SOC affects the fractal dimension of charge distribution, therefore the order of the fractional order model varies with the SOC at the same condition. This paper proposes a new method to estimate the SOC. A fractional continuous variable order model is used to characterize the fractal morphology of charge distribution. The order identification results showed that there is a stable monotonic relationship between the fractional order and the SOC after the battery inner electrochemical reaction reaches balanced. This feature makes the proposed model particularly suitable for SOC estimation when the battery is in the resting state. Moreover, a fast iterative method based on the proposed model is introduced for SOC estimation. The experimental results showed that the proposed iterative method can quickly estimate the SOC by several iterations while maintaining high estimation accuracy.

Graphical Abstract

1. Introduction

Lithium-ion batteries now become the main energy storage medium in electric vehicles. A battery’s state of charge (SOC) indicates the battery remaining power which is of great significance for battery management system (BMS). Accurate estimation method of the SOC can prevent over-charging and over-discharging, which can prolong the lifetime of the battery [1]. The electrochemical characteristics of the battery can be considered as an electrochemical system with strong non-linearity and the battery SOC cannot be directly measured [2]. Affected by applied load, temperature and cell degradation, vehicle batteries are usually divided into several groups, which switch between dynamic condition and resting state. Each battery pack is equipped with BMS to monitor the state of batteries. In the switching process of battery packs, a fast estimation method is needed to estimate the SOC for multiple battery groups, which can provide accurate initial values for other real-time estimation methods.
A number of estimation methods for battery SOC are used for different conditions. The Ampere-Hour (Ah) counting method for the calculation of battery SOC is simple and easy to implement, but it suffers from accumulated errors from noise and measurement error [3]. The data-driven approaches usually adopt artificial neural network, particle filter (PF) and relevance vector machine (RVM) to generate the nonlinear relation with respect to measurements. This kind of method relies on huge experimental data to achieve good estimation accuracy [4,5].
Kalman filter method can correct the initial error and restrain the noise of the system to a certain extent, but it relies heavily on the model [6,7,8,9]. Also, this algorithm assumes that the measurement error is Gaussian white noise with zero mean and the noise covariance is known. However, the noise characteristics are unknown in most practical cases, which may have an impact on the estimation performance of the algorithm. SOC estimation method based on electrochemical impedance spectroscopy (EIS) tries to find the relationship between the impedance parameters and the battery SOC. Although this approach is accurate, it is complex and only suitable for the theoretical research of batteries [10,11,12]. In addition, the alternating current used in EIS switches between charging and discharging. Switching system belongs to nonlinear system, which is not suitable for the analysis of frequency domain.
In recent years, the fractional order model has been introduced into SOC estimation because of the characteristic of fractional order calculus method [13].
Compared with the integer order model, the fractional modeling method can provide a more accurate battery model, and is suitable for a variety of operating conditions.
Many researchers have made efforts to estimate the battery SOC using fractional order models. In [14], a fractional order form of partnership for the new generation of vehicles (PNGV) model based on the analysis of EIS and the SOC estimation based on the fractional Kalman filter is presented. In [15], a fractional Kalman filter for SOC estimation based on a fractional order model is presented, where the differentiation order was fixed at 0.5, and the other parameters were identified based on a single pulse response. In [16], model that uses the improved Oustaloup approximation method is proposed to capture the dynamic behaviors of lithium-ion batteries, and a modeling parameters sensitivity study is performed to analysis the relationship between the fractional order and the the output performance of the fractional order model.
Although with many advantages, the SOC estimation method based on fractional order model has several defects. Most SOC estimation methods based on the fractional order model are complex and non-recursive. The high computational demand becomes one of the important reasons why the fractional order model is difficult to apply to practical situations. In addition, in most literatures, the orders used for SOC estimation are fixed without considering the effect of the battery SOC. Most of the existing fractional order modeling methods aim to capture the nonlinear dynamic behavior of batteries, so as to improve the accuracy of SOC estimation. However, the SOC estimation methods based on fractional order and integral order models are almost the same. Generally, integal order modeling method can be seen as a special case of the fractional order modeling method.
Nowadays, porous graphite is the most popular anode material in commercial lithium batteries. Fractal morphology of charge distribution on porous electrodes could be illustrated by the relaxation of water on a porous dike which has a fractal dimension [17]. The fractal structure of porous materials has the function of storing energy, usually represented by fractional order model. The non integer differentiation order between 0 and 1 being expressed as a function of recursive factors defining the fractality of charge distribution on porous electrodes. The battery SOC, temperature, and the cycle times affect the fractal morphology of charge distribution on the electrode. Therefore, the order of the fractional order model varies with the working condition. As the fractional order is one of the main characteristics that are affected by batteries’ remaining capacity, the determination of the SOC can be done by identifying the order of the fractional order model during operation of the battery. The fractal morphology of charge distribution is less influenced when the battery is charged or discharged continuously, therefore the relationship between the fractional order and the battery SOC is difficult to be found. However, the fractal morphology of charge distribution varies stably with SOC after the battery inner electrochemical reaction reaches balanced.
In this paper, a rapid estimation method for the SOC based on fractional continual variable order model is proposed. The remainder of the paper is organized as follows. In Section 2, a fractional order model has been built to describe the fractal morphology of the charge distribution of lithium-ion batteries. In Section 3, the least square method is applied to identify the fractional order at different SOC states, and the monotonic relationship between the fractal morphology of charge distribution and battery SOC has been found. However, it has been indicated that the order identification might be biased by the initial coefficient. To obtain a more accurate and stable SOC, an iterative method is introduced for finding the solution of the equilibrium problem of the parameters in Section 4. We prove the convergence of the proposed algorithm, which is the optimality condition for the minimization problem of the SOC estimation error. The results confirm that the iterative method is advantageous to SOC estimation. The summary is given in Section 5, along with an outlook of such an interesting research field.

2. Fractional Order Model of Lithium-Ion Batteries

In this section, the proposed fractional order model is built to describe the dynamic behaviors of lithium-ion batteries. The mathematical modelling equations is described and solved using the fractional order approximation method. Finally, the dynamic effect of fractional order on the output performance of the fractional capacitor is discussed.

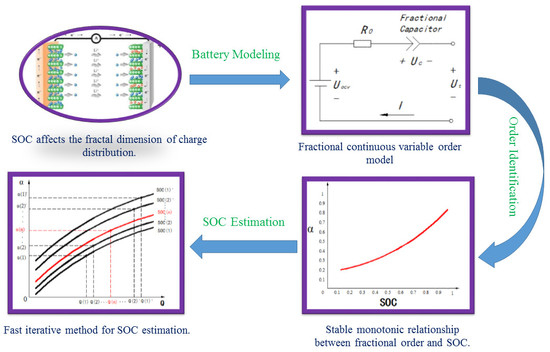
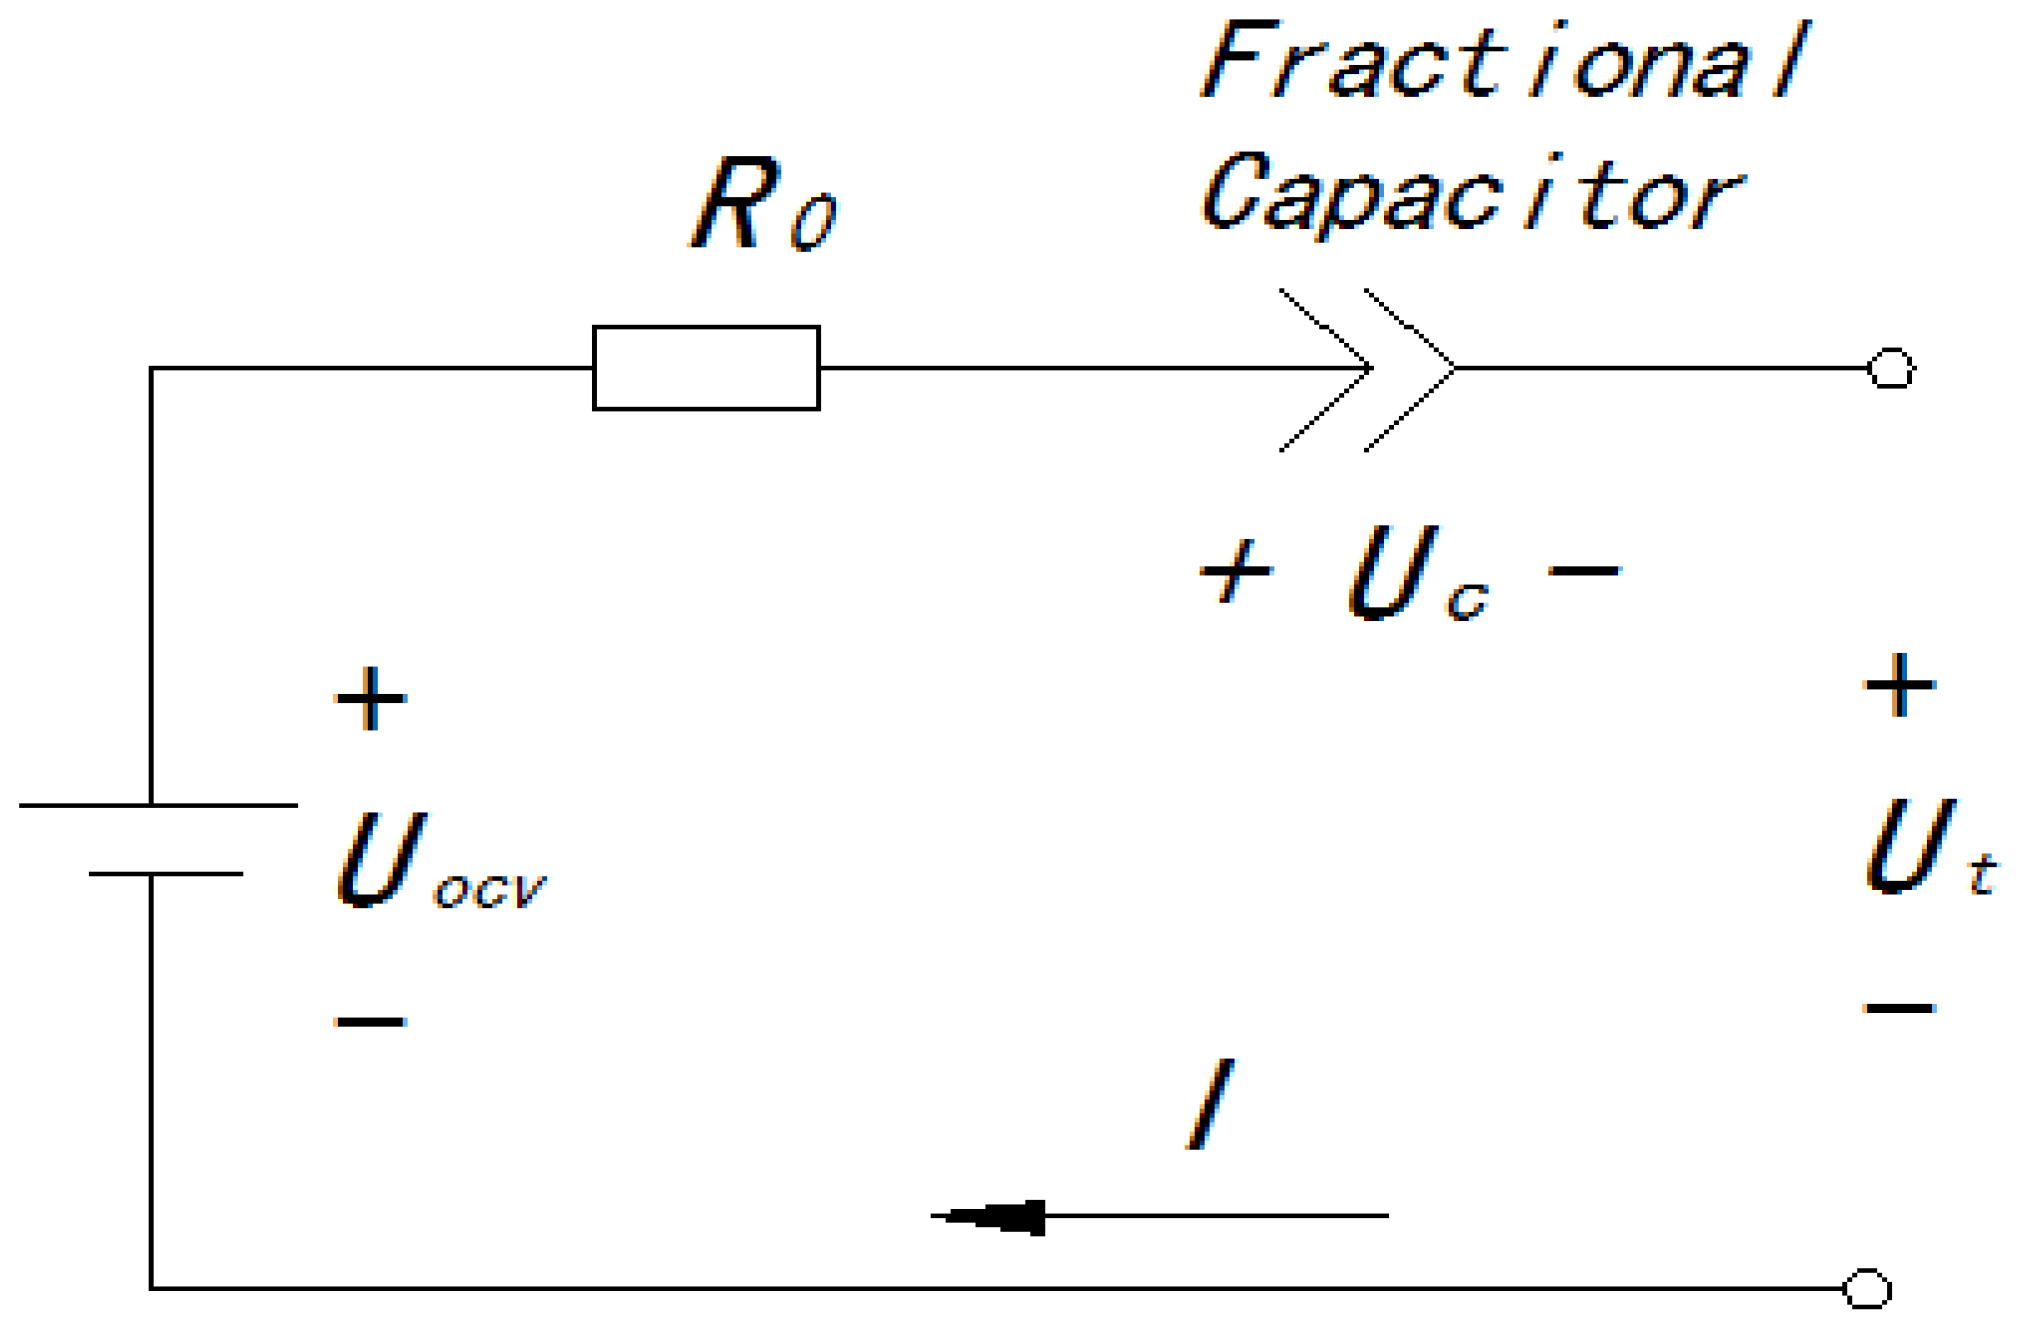
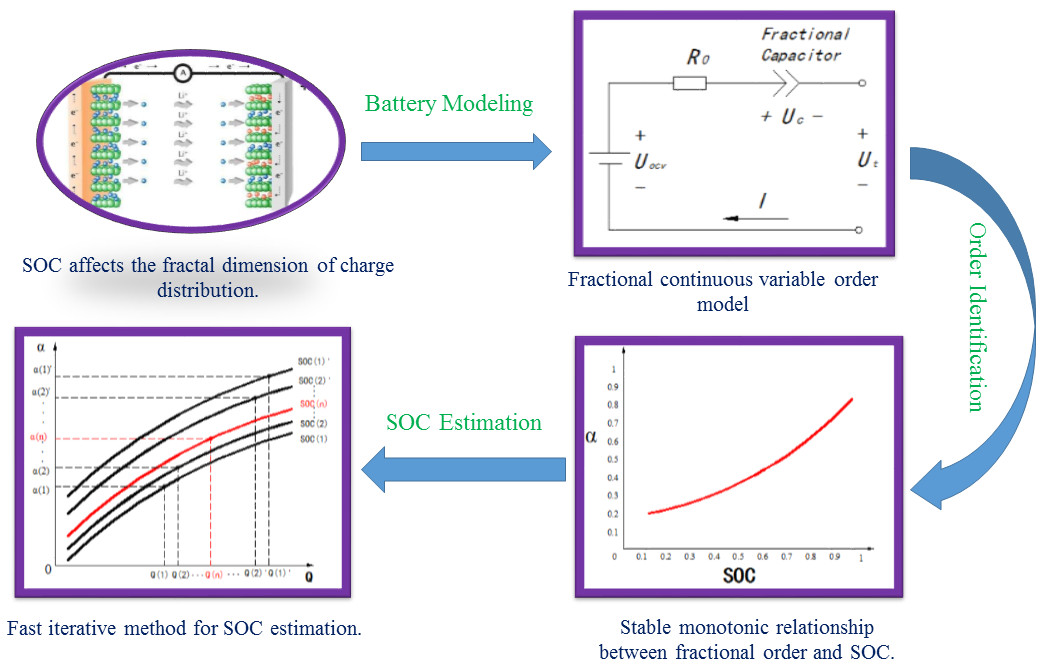
2.1. Battery Modeling

A pair of contradictions happens when the current passes through the electrode. On the one hand, the charge on electrode surfaces accumulates gradually, which is caused by the movement of electrons. This polarization phenomenon causes the potential of the electrode to deviate from the equilibrium state. On the other hand, the electrode reaction absorbs the charge so that the potential gradually returns to the equilibrium state. The electrode reaction is complex, which includes the accumulation of lithium-ion on the electrode, the diffusion of lithium-ion, the passivation of the electrode surface and so on. The dynamic effects of electrode reaction can be collectively called depolarization. The two electrochemical phenomena of polarization and depolarization are co-existing when the battery is charging or discharging [18].
The voltage response when the battery is discharged with a step current is shown in Figure 1, where the red dotted line represents the current, and the blue solid line represents the terminal voltage. The mutation between point A and point B is mainly caused by the resistances of current collectors, active material, electrolyte and separator. The recovering process of the voltage between point D and point E is mainly related to the phenomenon of lithium-ion diffusion [19].
The cumulative effect of the voltage between point B and point C, which contains several behaviors of the battery, is mainly studied in this paper. In the charge and discharge process, there exists a defect that the rate of the movement of electrons is faster than that of the electrode reaction [20]. Therefore, polarization usually plays a dominant role in the electrochemical reaction of batteries. The depolarization phenomenon can be neglected when the battery is discharged in a short time with a small current magnitude. Because the porous structure of the electrode has a fractal dimension, the fractal morphology of the charge distribution on the electrode has nonlinear characteristics, which cannot be expressed accurately by integer order calculus. Finally, when other electrochemical reactions are ignored, a fractional capacitor can be used to approximately characterize the battery polarization phenomenon between point B and point C [21,22]. The capacitor Q which has a fractional property is called fractional capacitor in general and its impedance can be defined as:
Z ( j w ) = 1 Q ( j w ) α
where Q R is a variable increment, α R ( 0 < α < 1 ) is the fractional derivation order.
We can use the equivalent circuit of fractional order model in Figure 2 to simulate the voltage response between point B and point C in Figure 1.
In Figure 2, R 0 is the voltage difference between point A and point B in Figure 1, the fractional capacitor represents the voltage variation caused mainly by polarization, U o c v is open circuit voltage source, I is the discharge current, and U c and U t are the voltage drop of fractional capacitor and terminal voltage of the battery, respectively. The state equation and the output equation of the equivalent circuit of fractional order model can be expressed as:
Δ α U c = I Q U t = U o c v I R 0 U c
where Δ is the differential operator.
Equation (2) can be rewritten as follows in state space function form:
Δ α x = B I y = C x + D I
where x = [ U c ] , y = [ U t U o c v ] , B = [ 1 / Q ] , C = [ 1 ] , D = [ R 0 ] , I is the matrix of 1×1.
According to Equation (3), the discrete state space function is obtained:
Δ α x k + 1 = B I k y k = C x k + D I k
where, at time index k, x k R is the state vector, I k R is the system input; y k R is the system output.
The Grünald-Letnikov fractional-order derivative is chosen in this work to obtain the numerical solution of the voltage differential equation. The α -order fractional order calculus for state x at time step k can be defined as [23,24,25,26]:
Δ α x k = 1 T s α j = 0 k ( 1 ) j α j x k j α j = 1 j = 0 α ( α ) ( α ( j 1 ) ) j ! j > 0
where T s is the sample interval, k is the number of samples for which the derivative is calculated, j is the distance.
According to Equation (5), Equation (4) can be written as [15,24]:
Δ α x k + 1 = 1 T s α j = 0 k + 1 ( 1 ) j α j x k + 1 j = 1 T s α ( 1 ) 0 α 0 x k + 1 0 + 1 T s α j = 1 k + 1 ( 1 ) j α j x k + 1 j = 1 T s α [ x k + 1 + j = 1 k + 1 ( 1 ) j α j x k + 1 j ] .
Equation (6) can be further formulated:
x k + 1 = T s α Δ α x k + 1 j = 1 k + 1 ( 1 ) j α j x k + 1 j = T s α B I k j = 1 k + 1 ( 1 ) j α j x k + 1 j .
The output equation can also be discretized as:
y k = C x k + D I k
Finally, Equations (7) and (8) together determine the discrete state equation and output equation of the fractional order model.

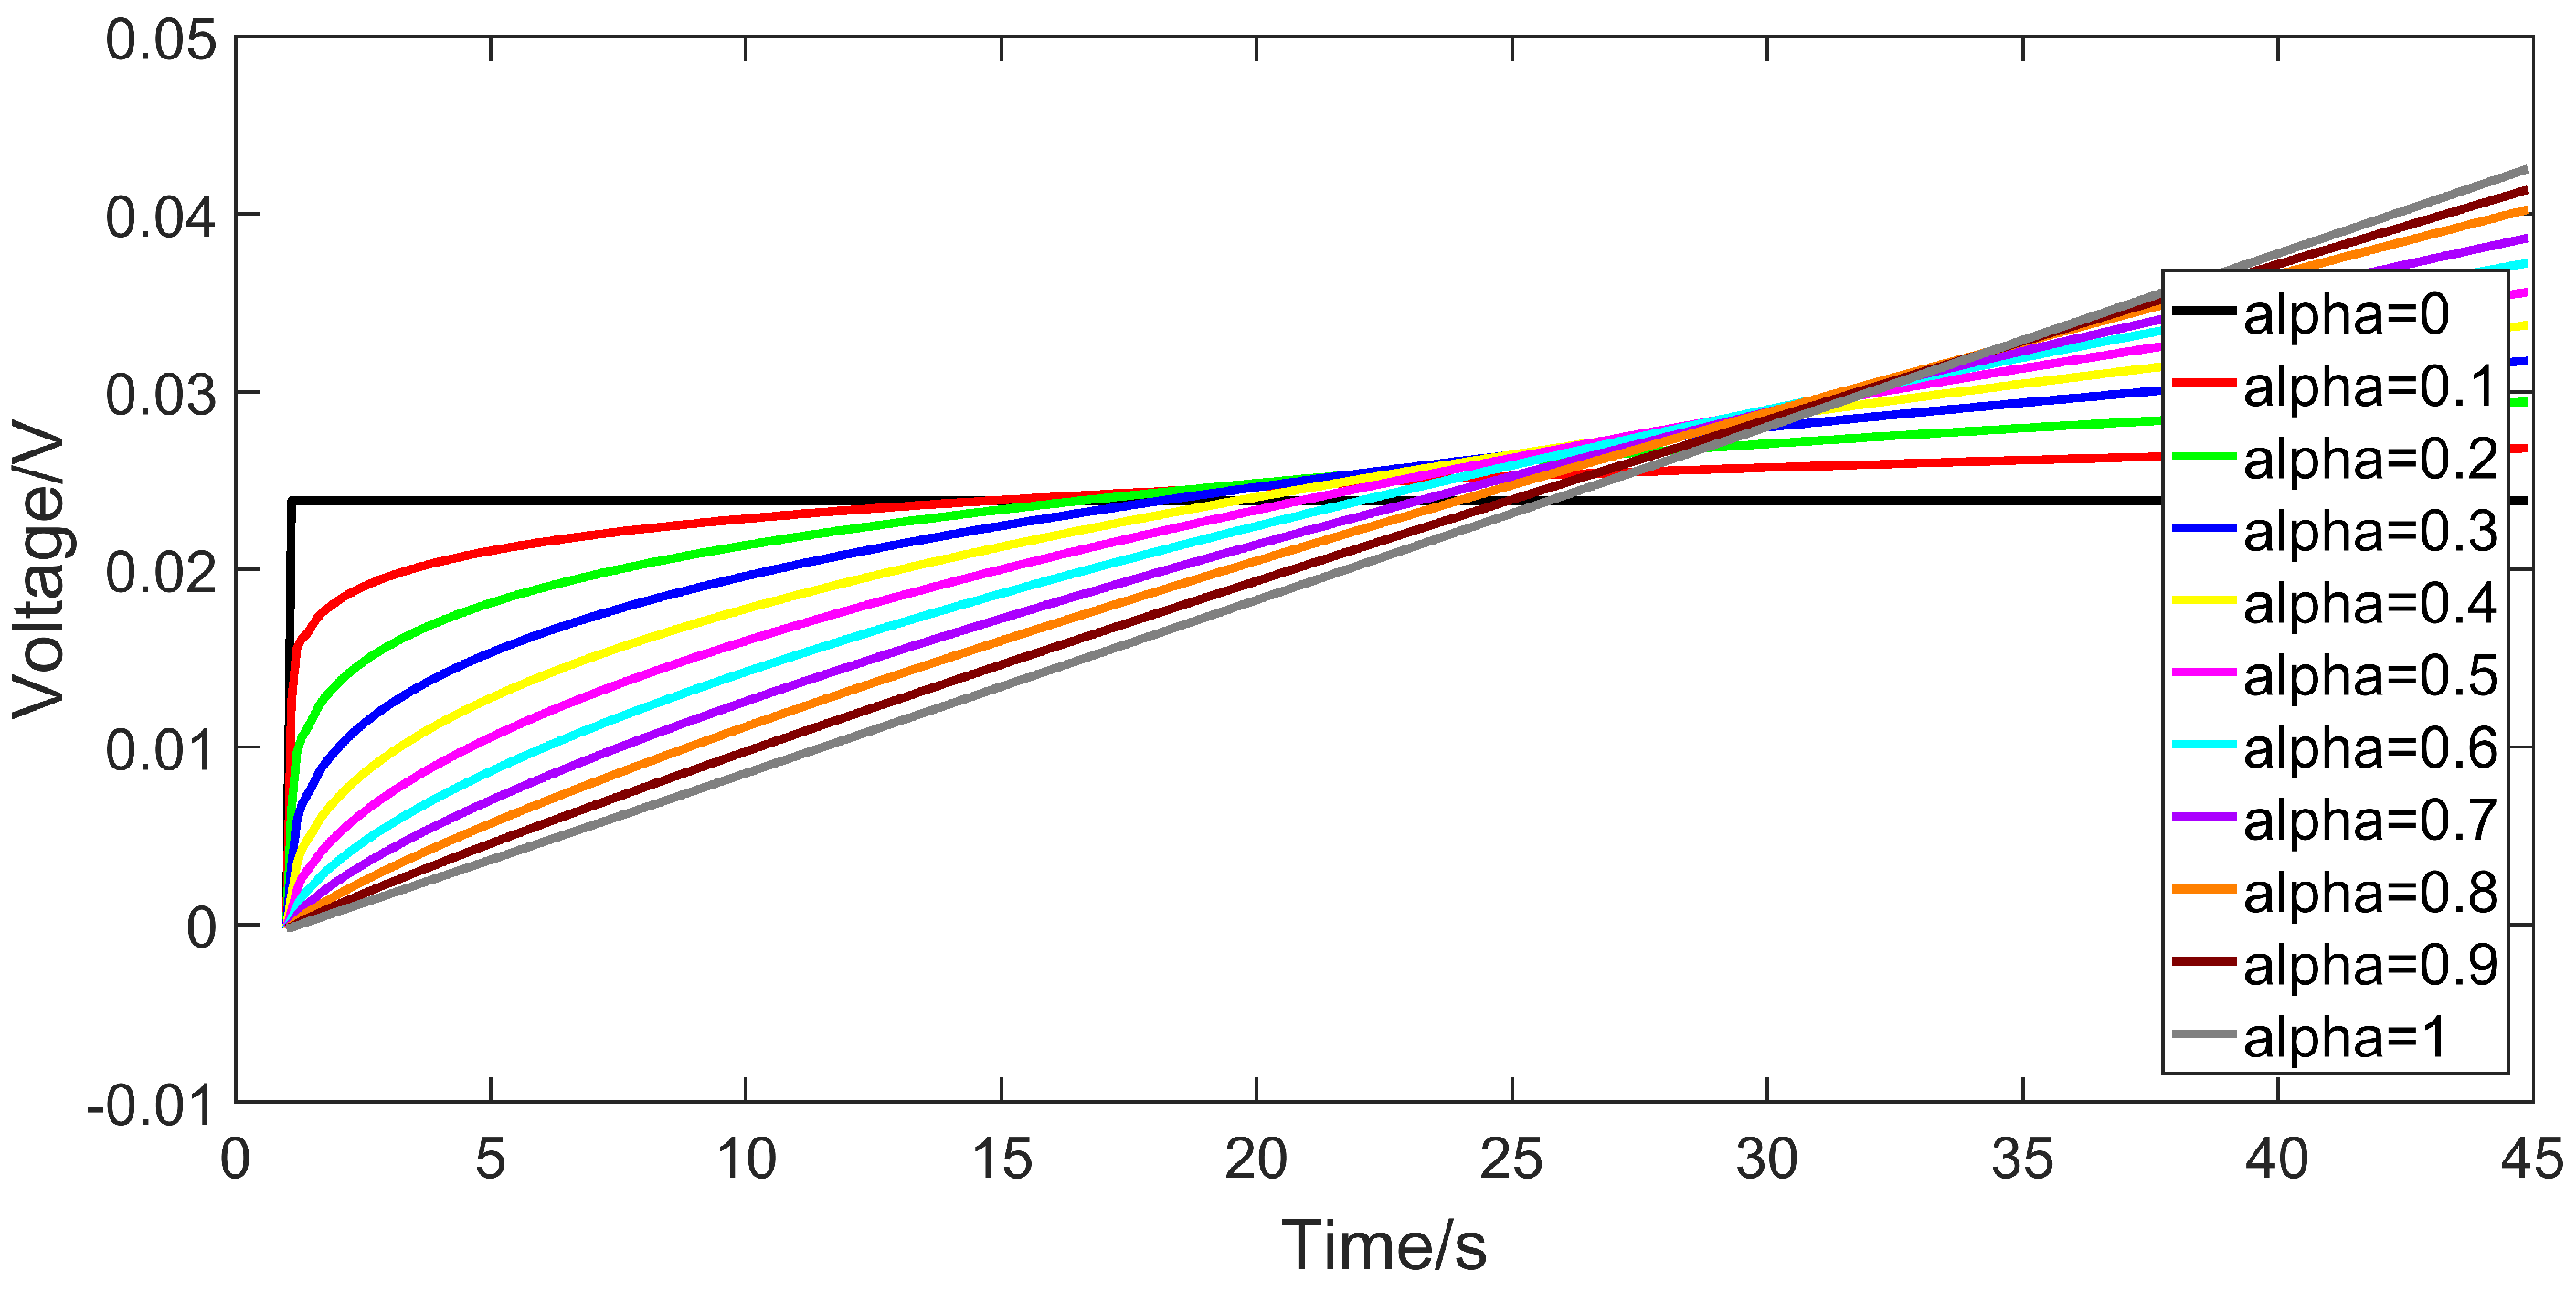
2.2. The Output Dynamic of the Fractional Capacitor

In most literatures, the fractional capacitor is used to simulate the frequency response of the battery [27]. Few literatures have studied the output dynamic of the fractional capacitor in time domain. In order to find the relationship between the voltage response and the fractional derivation order of the fractional capacitor, a constant current is taken into Equation (7), and the coefficient is fixed at a constant. The fractional order α varies from 0 to 1. By setting I = 5 A , Q = 1000 , an interval of 0.1 s, the corresponding output voltages of the fractional capacitor are calculated, which are presented in Figure 3.
From Figure 3, in the case α = 1 , the voltage curve is a straight line, and the fractional capacitor turns into a pure capacitor. In the case α = 0 , the voltage curve is a straight line parallel to the horizontal axis, and the fractional capacitor turns into a pure resistor. In the case 0 < α < 1 , the voltage of the fractional capacitor increases rapidly in the first few seconds and increases slowly in the following time. As the order of the fractional capacitor varies from 0 to 1, there exists a transformative process from the resistor to the capacitor. If the voltage response of the battery varies with the SOC, the order of the fractional capacitor can be used to characterize the battery output voltage feature, and the SOC can be estimated by the order of fractional capacitor.

3. Order Identification of Fractional Order Model

In order to study the relationship between the order of the fractional order model and the SOC, the fractional order is identified based on the least squares method, and the experimental results and analyses are performed in this section.

3.1. Identification Method

The fractional order model in this paper is used to simulate the voltage response when the discharge current is loading, which corresponds to the voltage variation between point B and point C in Figure 1. Therefore, the order identification of the fractional order model in this work is based on test dataset of BC segment in Figure 1. Time-domain system identification is usually performed by using least squares method, and this method is also utilized in this work. The ohmic resistance R 0 is calculated using the voltage difference between point A and point B. A fitness value is introduced to evaluate the model precision [28,29],
F i t = min k = T 0 T y k y ^ k 2
where y k is the voltage difference between open circuit voltage (OCV) and terminal voltage, and y ^ k is the estimated voltage at k time.
It is not suitable to identify the fractional order with other parameters in the fractional continual variable order model. In this paper, the coefficient Q is fixed at a constant and the order is identified with the dataset of pulse discharge. The typical values of the coefficient have been chosen based on the identified results and the battery characteristic. The selection of coefficient Q is discussed in Section 4, and Q is fixed at 1000 in this section.
For identification process, firstly, a series of independent random fractional orders with a uniform distribution within in the selected range is generated. Subsequently, the fractional order is used for calculating the fractional derivative equation using Grünald-Letnikov fractional-order derivative. Meanwhile, the battery current is defined as the input of fractional order model, to calculate the output voltage. The predicted terminal voltage y ^ k can be obtained using Equations (7) and (8), then the fitness value can be obtained using Equation (9). Finally, optimal order could be obtained at the end of the identification process and the relationship between the fractional order and the battery SOC could be found.
The fractional order model does not represent the same battery model when the order is continuously changed. Therefore, the fractional continual variable order model is not suitable for real-time estimation. In addition, the continual variable order will increase the computation of the model in the real time estimation. The proposed model is suitable for SOC estimation when the battery is in the resting state. The most suitable identification signal is the pulse discharge in the switching process of the battery groups and the start of the combustion engine of the hybrid vehicle. The advantages of this signal are its short duration, which guarantees a low identification effort, its unchanging shape, which allows an identification with always the same current magnitude, and its regular occurrence in the driving profile. It also appears at the beginning of the operation after longer resting periods and allows an identification of the fractional order of the balanced battery cell.

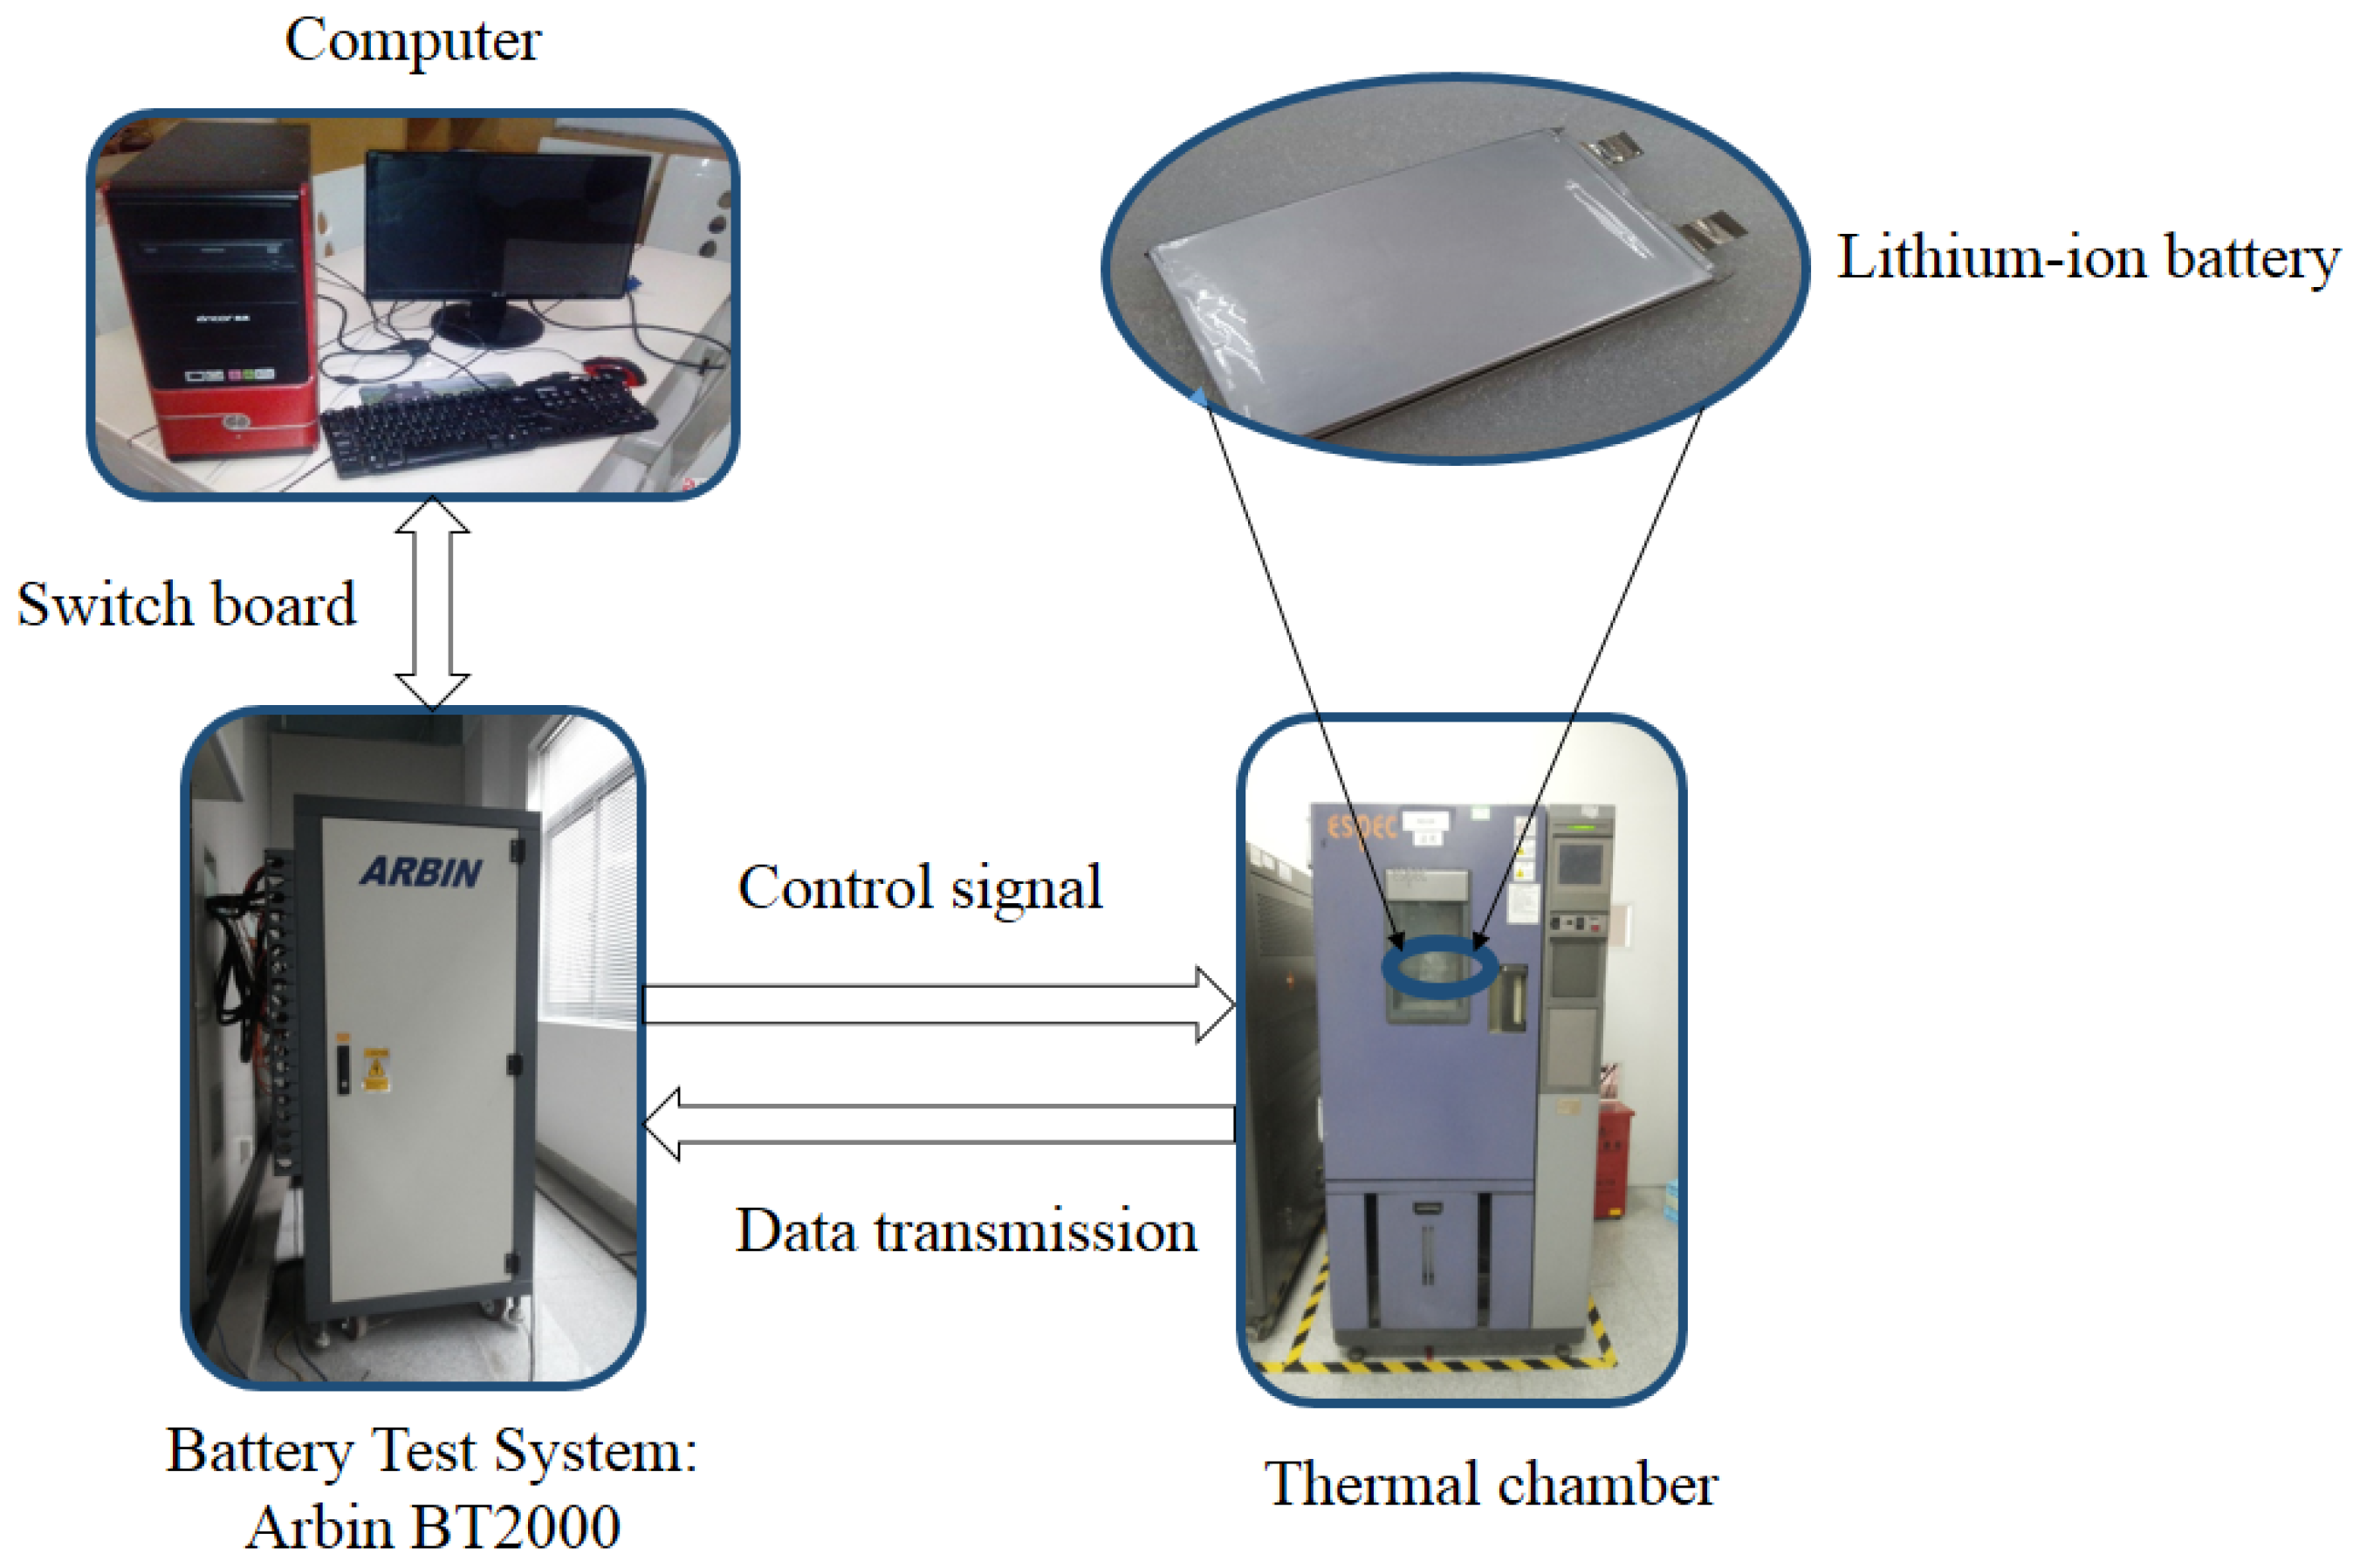
3.2. Experiment Setup

The experimental setup comes equipped with an Arbin BT2000 tester (Arbin Instruments, College Station, TX, USA), a thermal chamber for environment control, a personal computer with signal control software and data conversion software, and a lithium-ion phosphate battery (LiFePO 4 ). Arbin BT2000 tester charges and discharges the battery through signals sent by the computer, and passes the collected dataset to the computer by the conversion module. The test units can record load current, terminal voltage, temperature, accumulative Ah and so on. Both current and voltage are recorded at a frequency of 10 Hz. The experimental platform is shown in Figure 4, and the main parameters of the battery are listed in Table 1.
In Table 1, C denotes the battery capacity value in Ah. The pulse discharge carried out at various SOC levels fully reflects the relationship between fractal morphology of charge distribution and the battery SOC. In addition, the pulse signal occurs during normal operation of the battery. Therefore, the pulse excitation is carried out in this work, and the whole process of battery SOC from 100% to 0% is divided into 20 segments.
After fully charged, the battery is set to be standstill for 10 min, and the battery open circuit voltage can be measured. Then, the battery is discharged for 45 s with constant discharge rate, followed by an intermission of 10 min. Finally, discharge the battery until the remaining capacity drops by 5%. The steps can be repeated until the battery SOC come to 5%. The battery shows strong nonlinearity at 100% SOC and 0% SOC, which is beyond the scope of this study. The pulse responses when the battery is discharged in different SOC states at 0.5C at 25 C are shown in Figure 5. It is necessary to mention that the measured voltages in Figure 5 are interpolated with time.
From Figure 5, when the battery is discharging, it is obvious that the rate of the voltage variation vary monotonically with the battery SOC. The main reason for this phenomenon is that the activity of the chemicals inside the battery alleviates with the reduction of the battery remaining power, and the battery SOC affects the fractal morphology of charge distribution on the electrode. According to the analysis of Section 2, when the battery is discharging with a step current, the voltage variation is simulated by the fractional order model, and the voltage variations of the fractional capacitor can be characterized by the fractional order α . Therefore, the fractional order α of the fractional order model can be used to characterize the battery SOC.

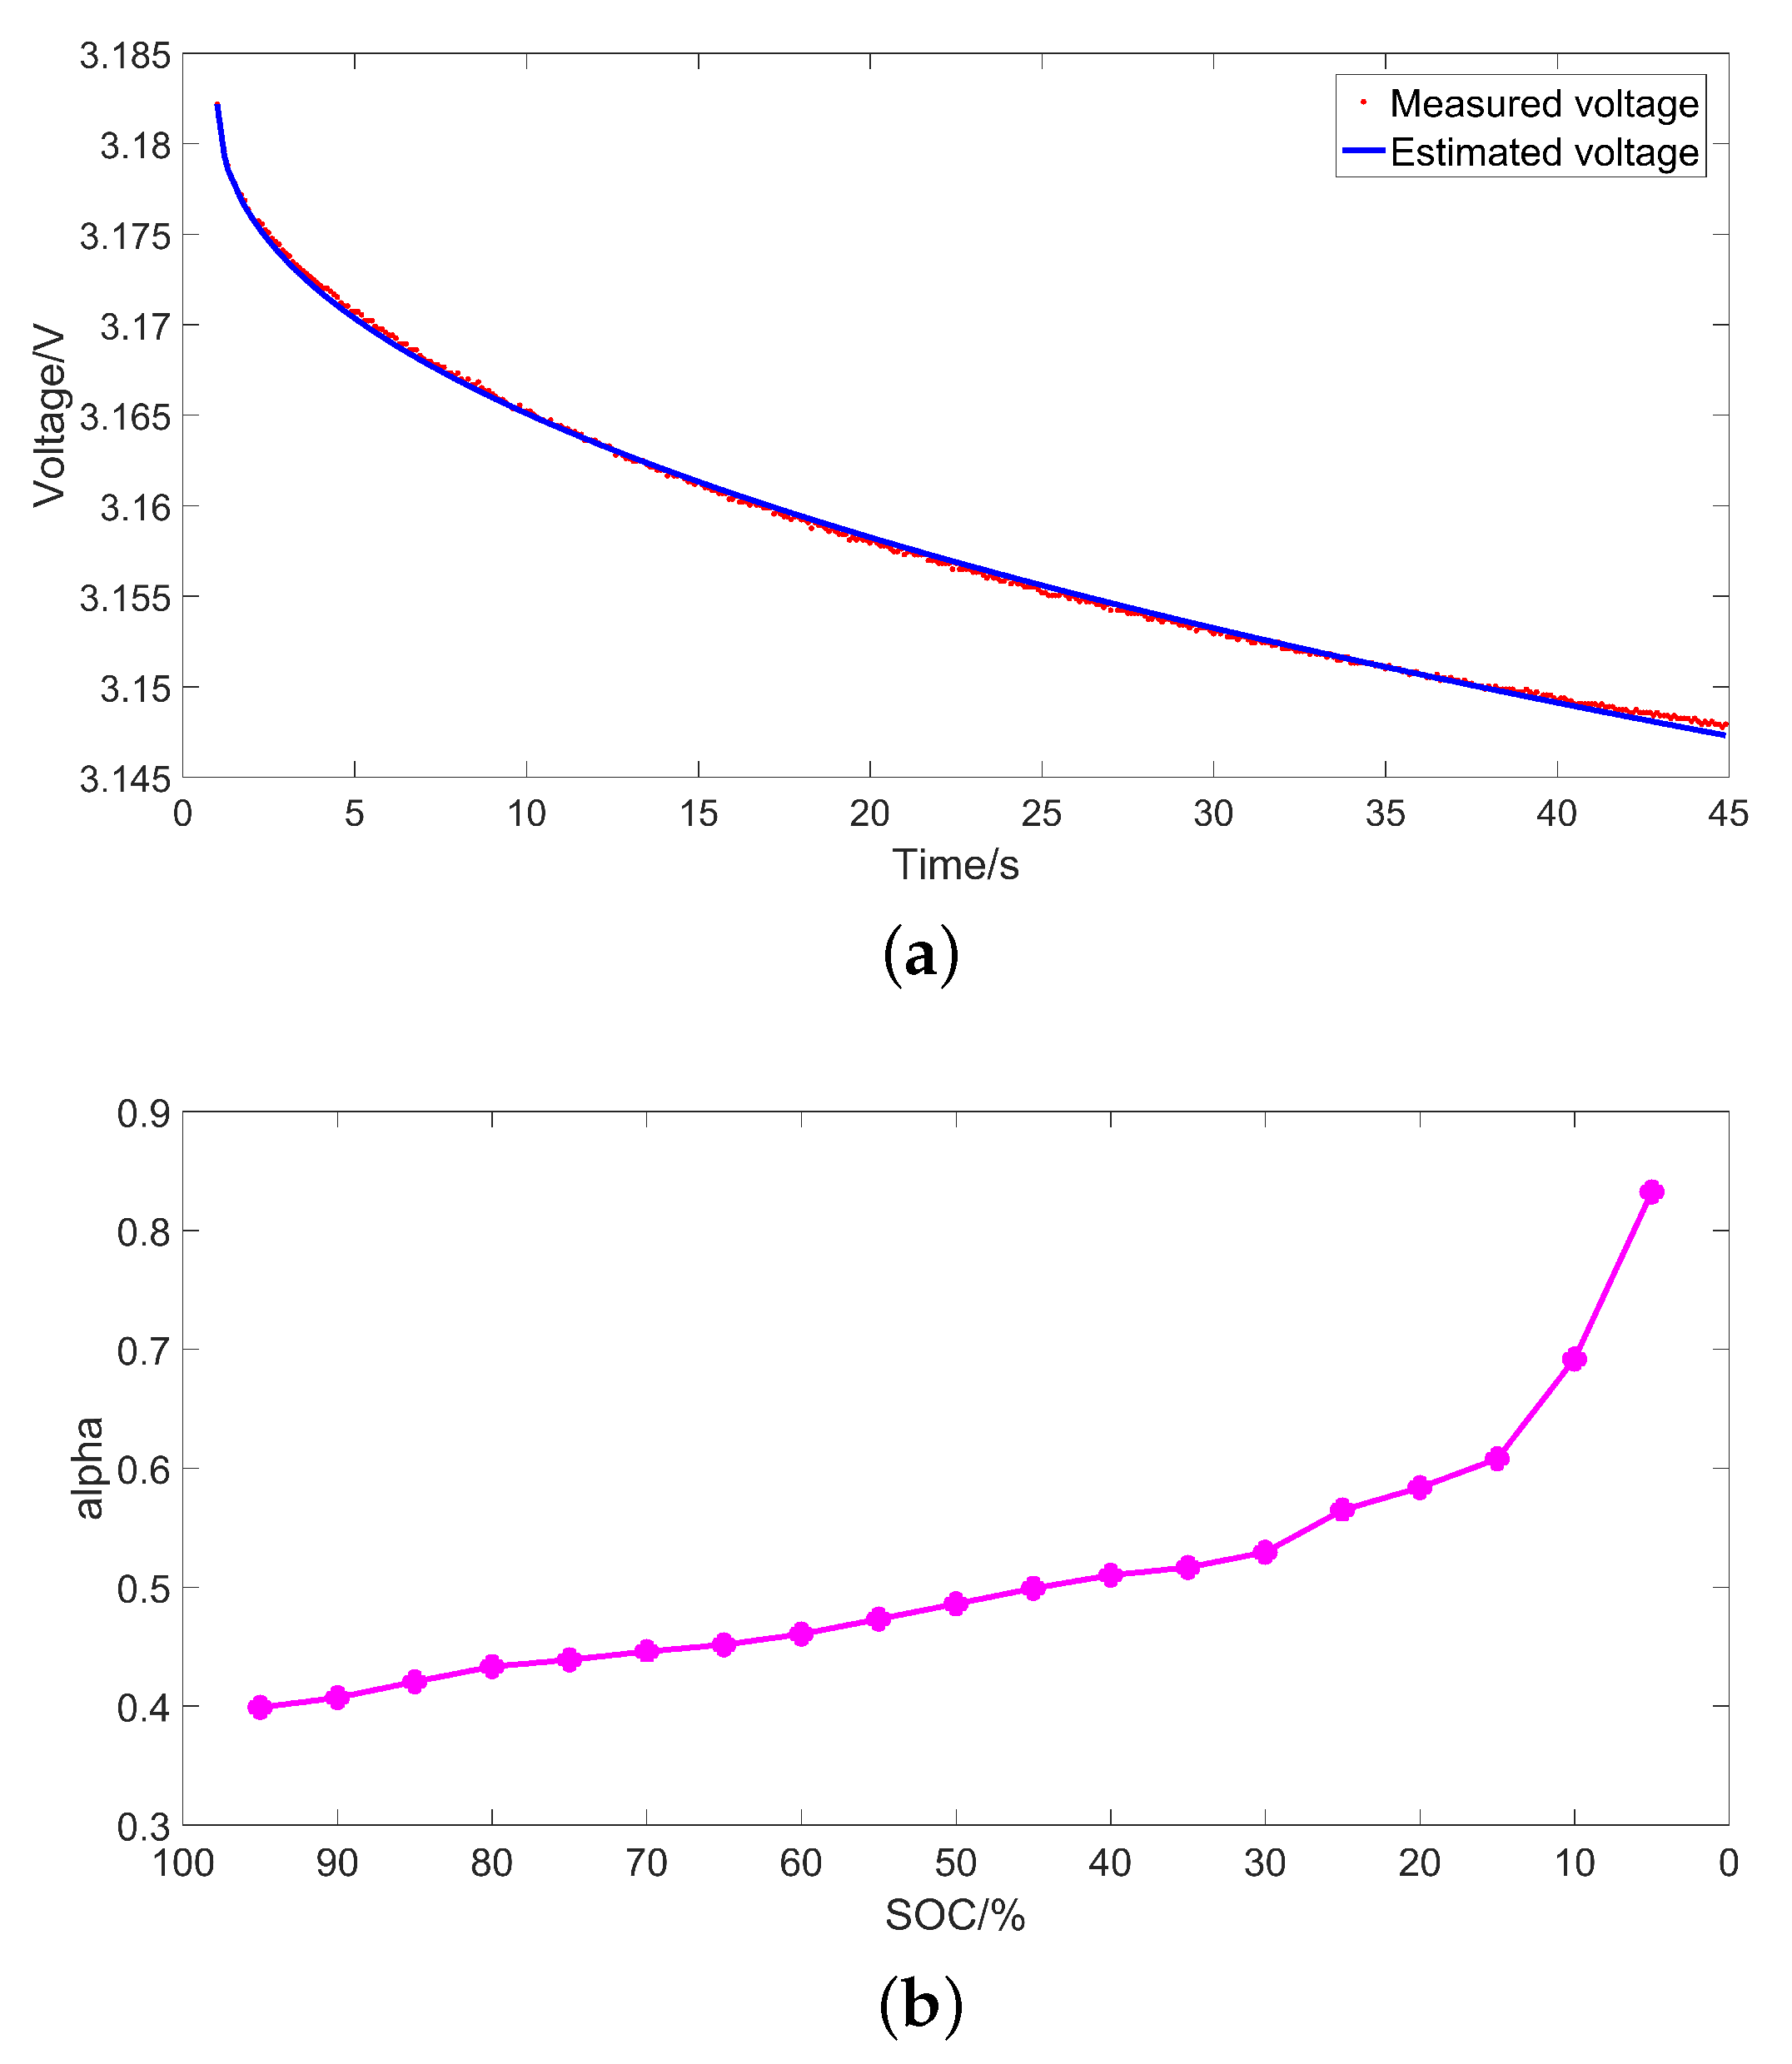
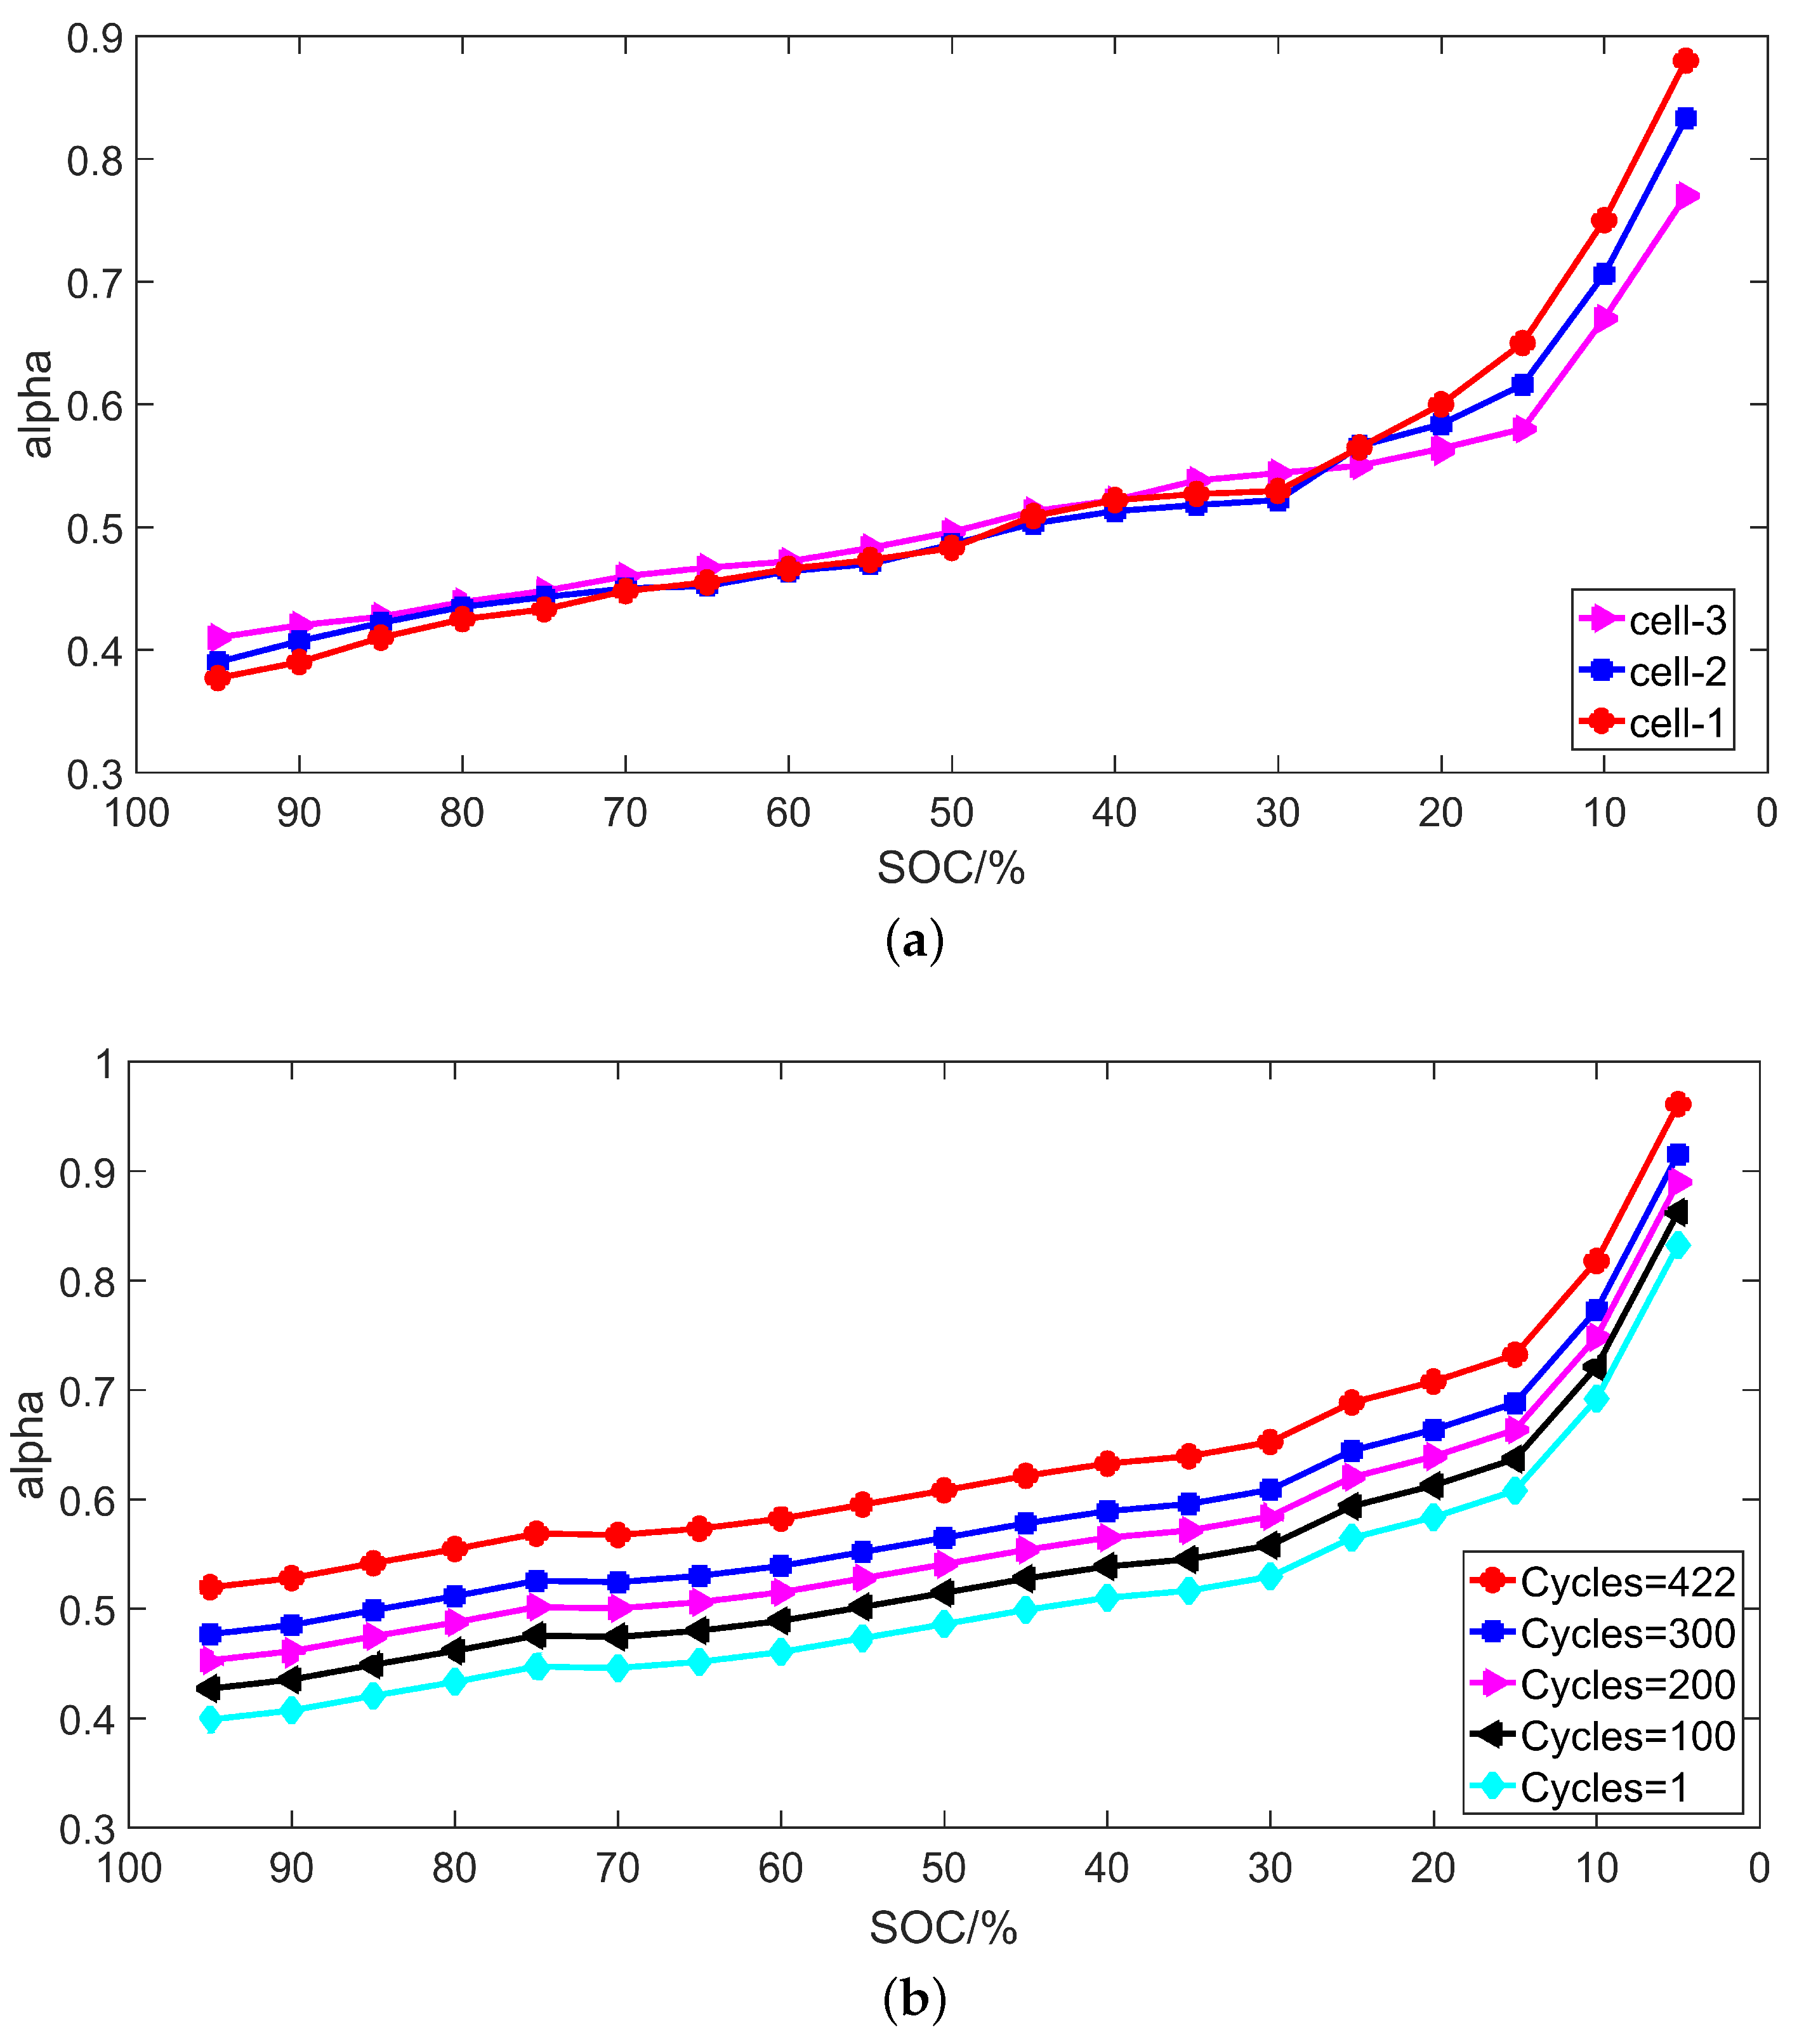
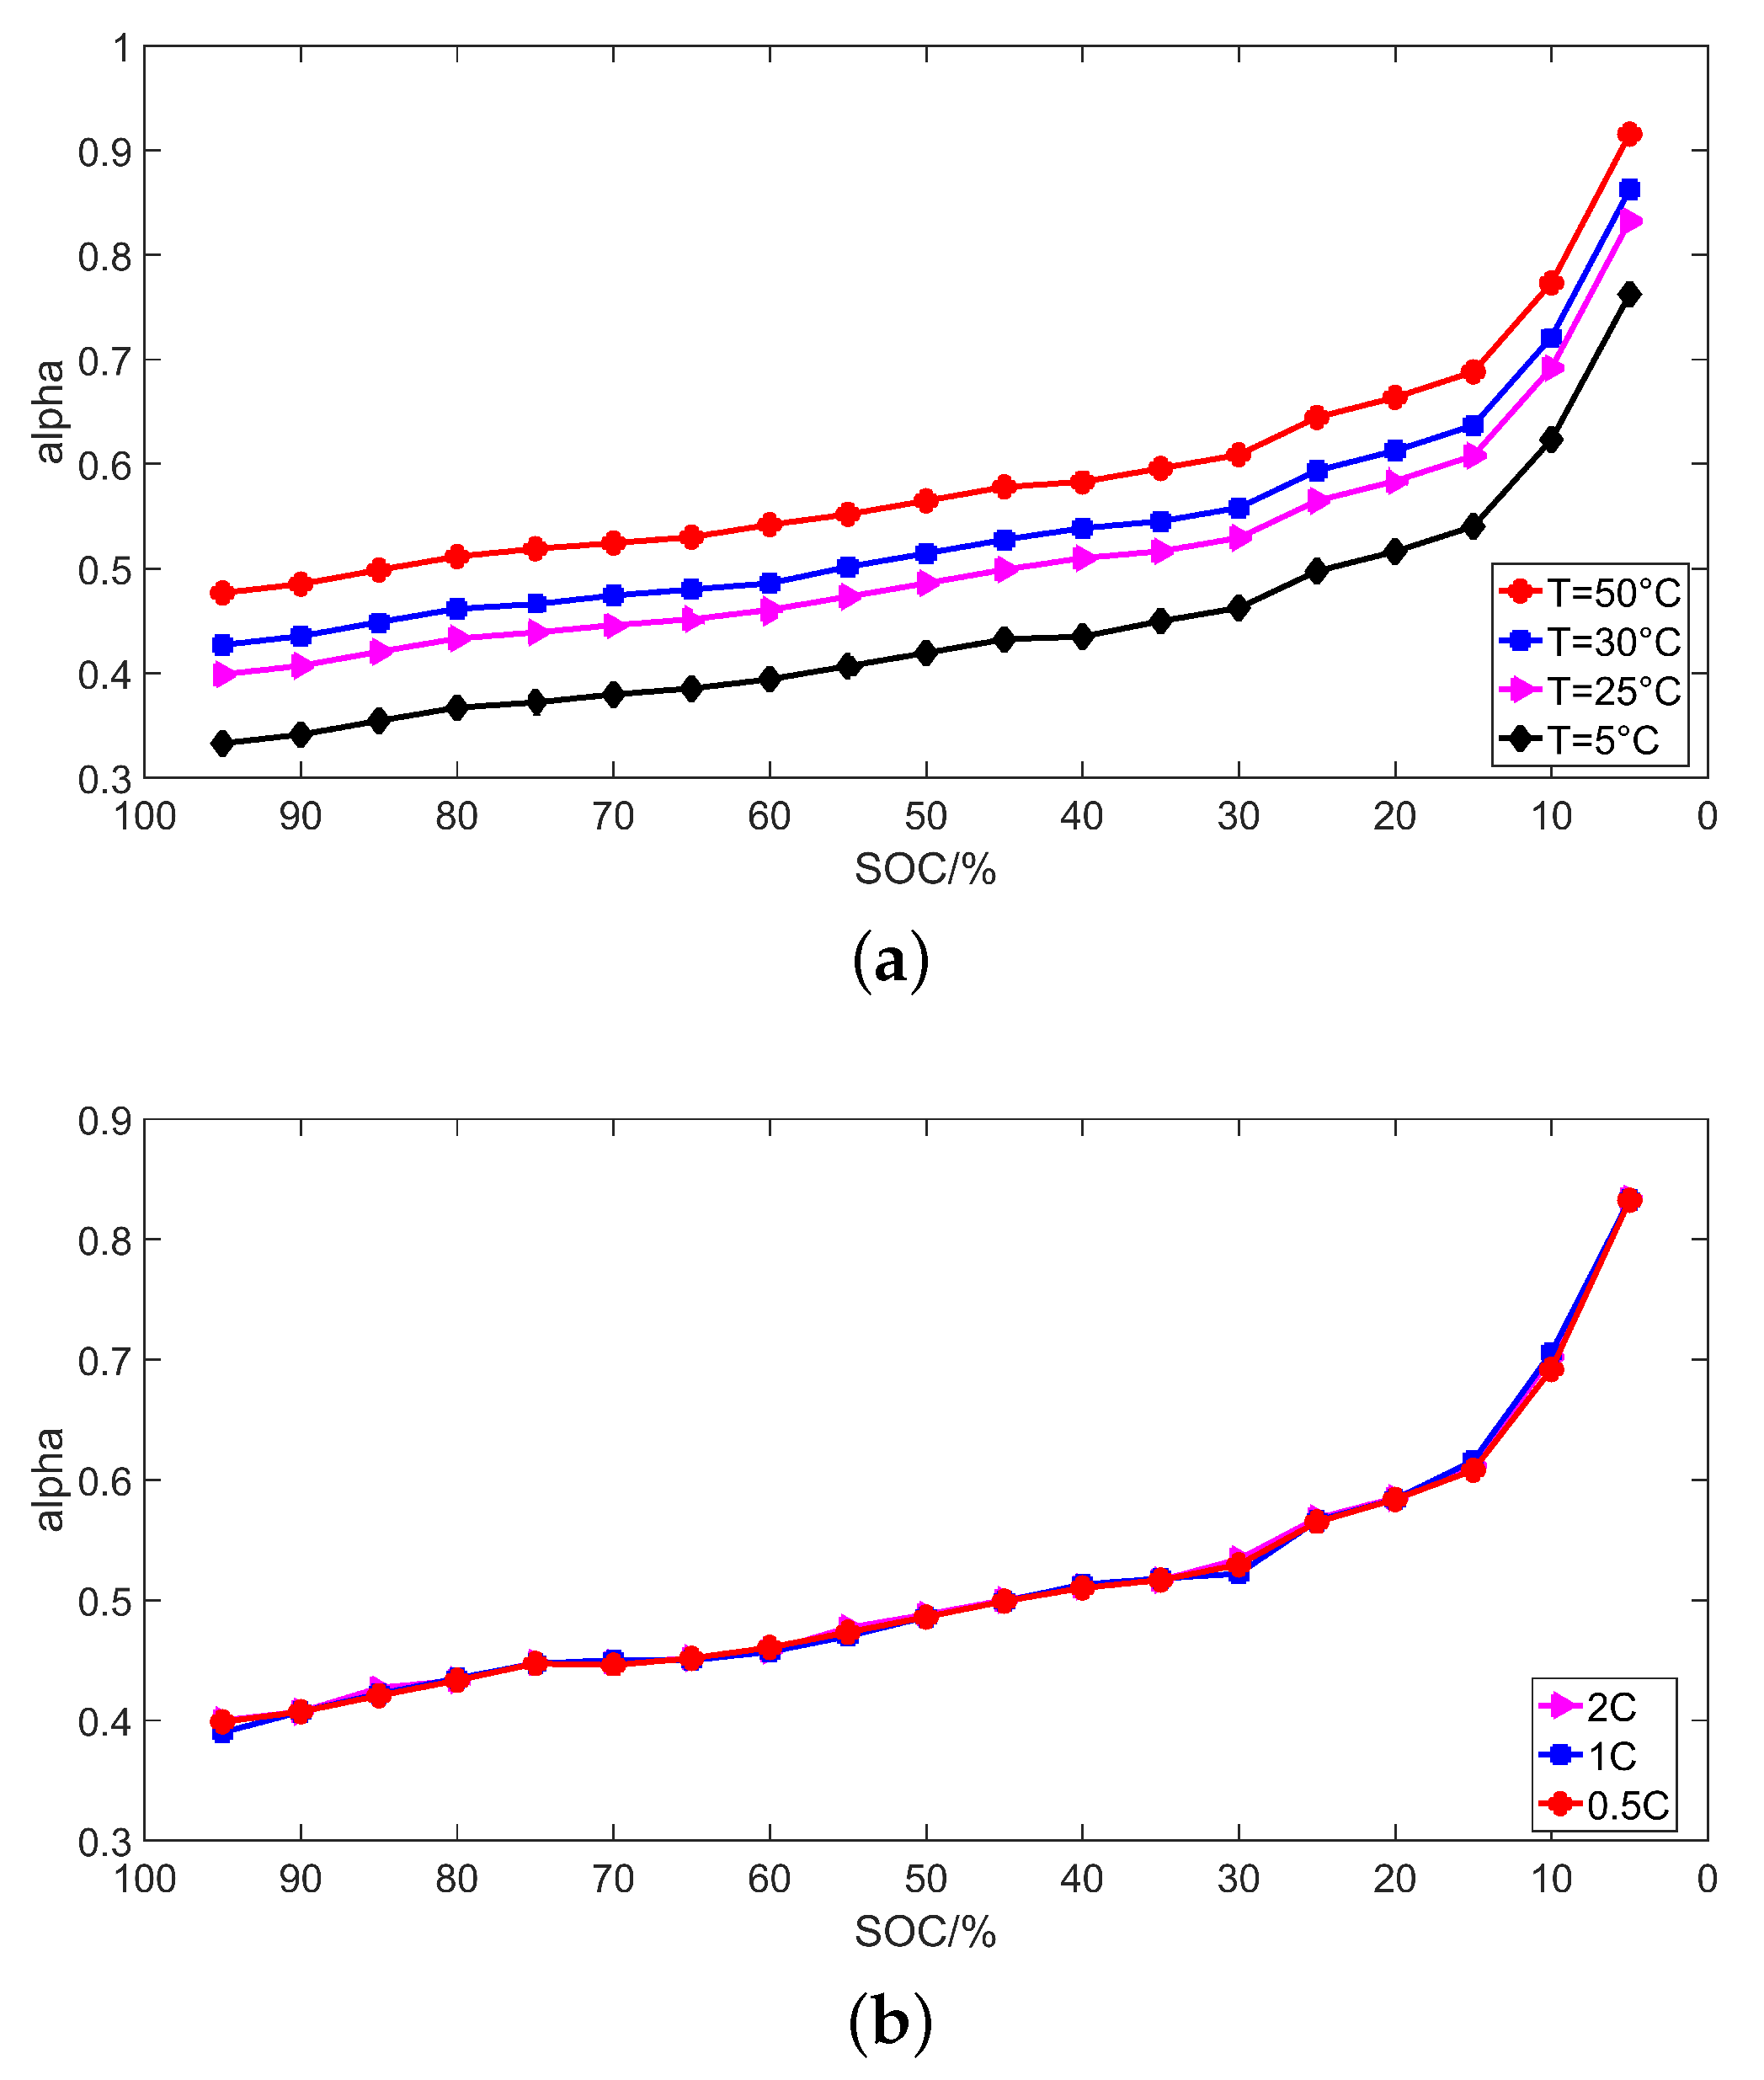
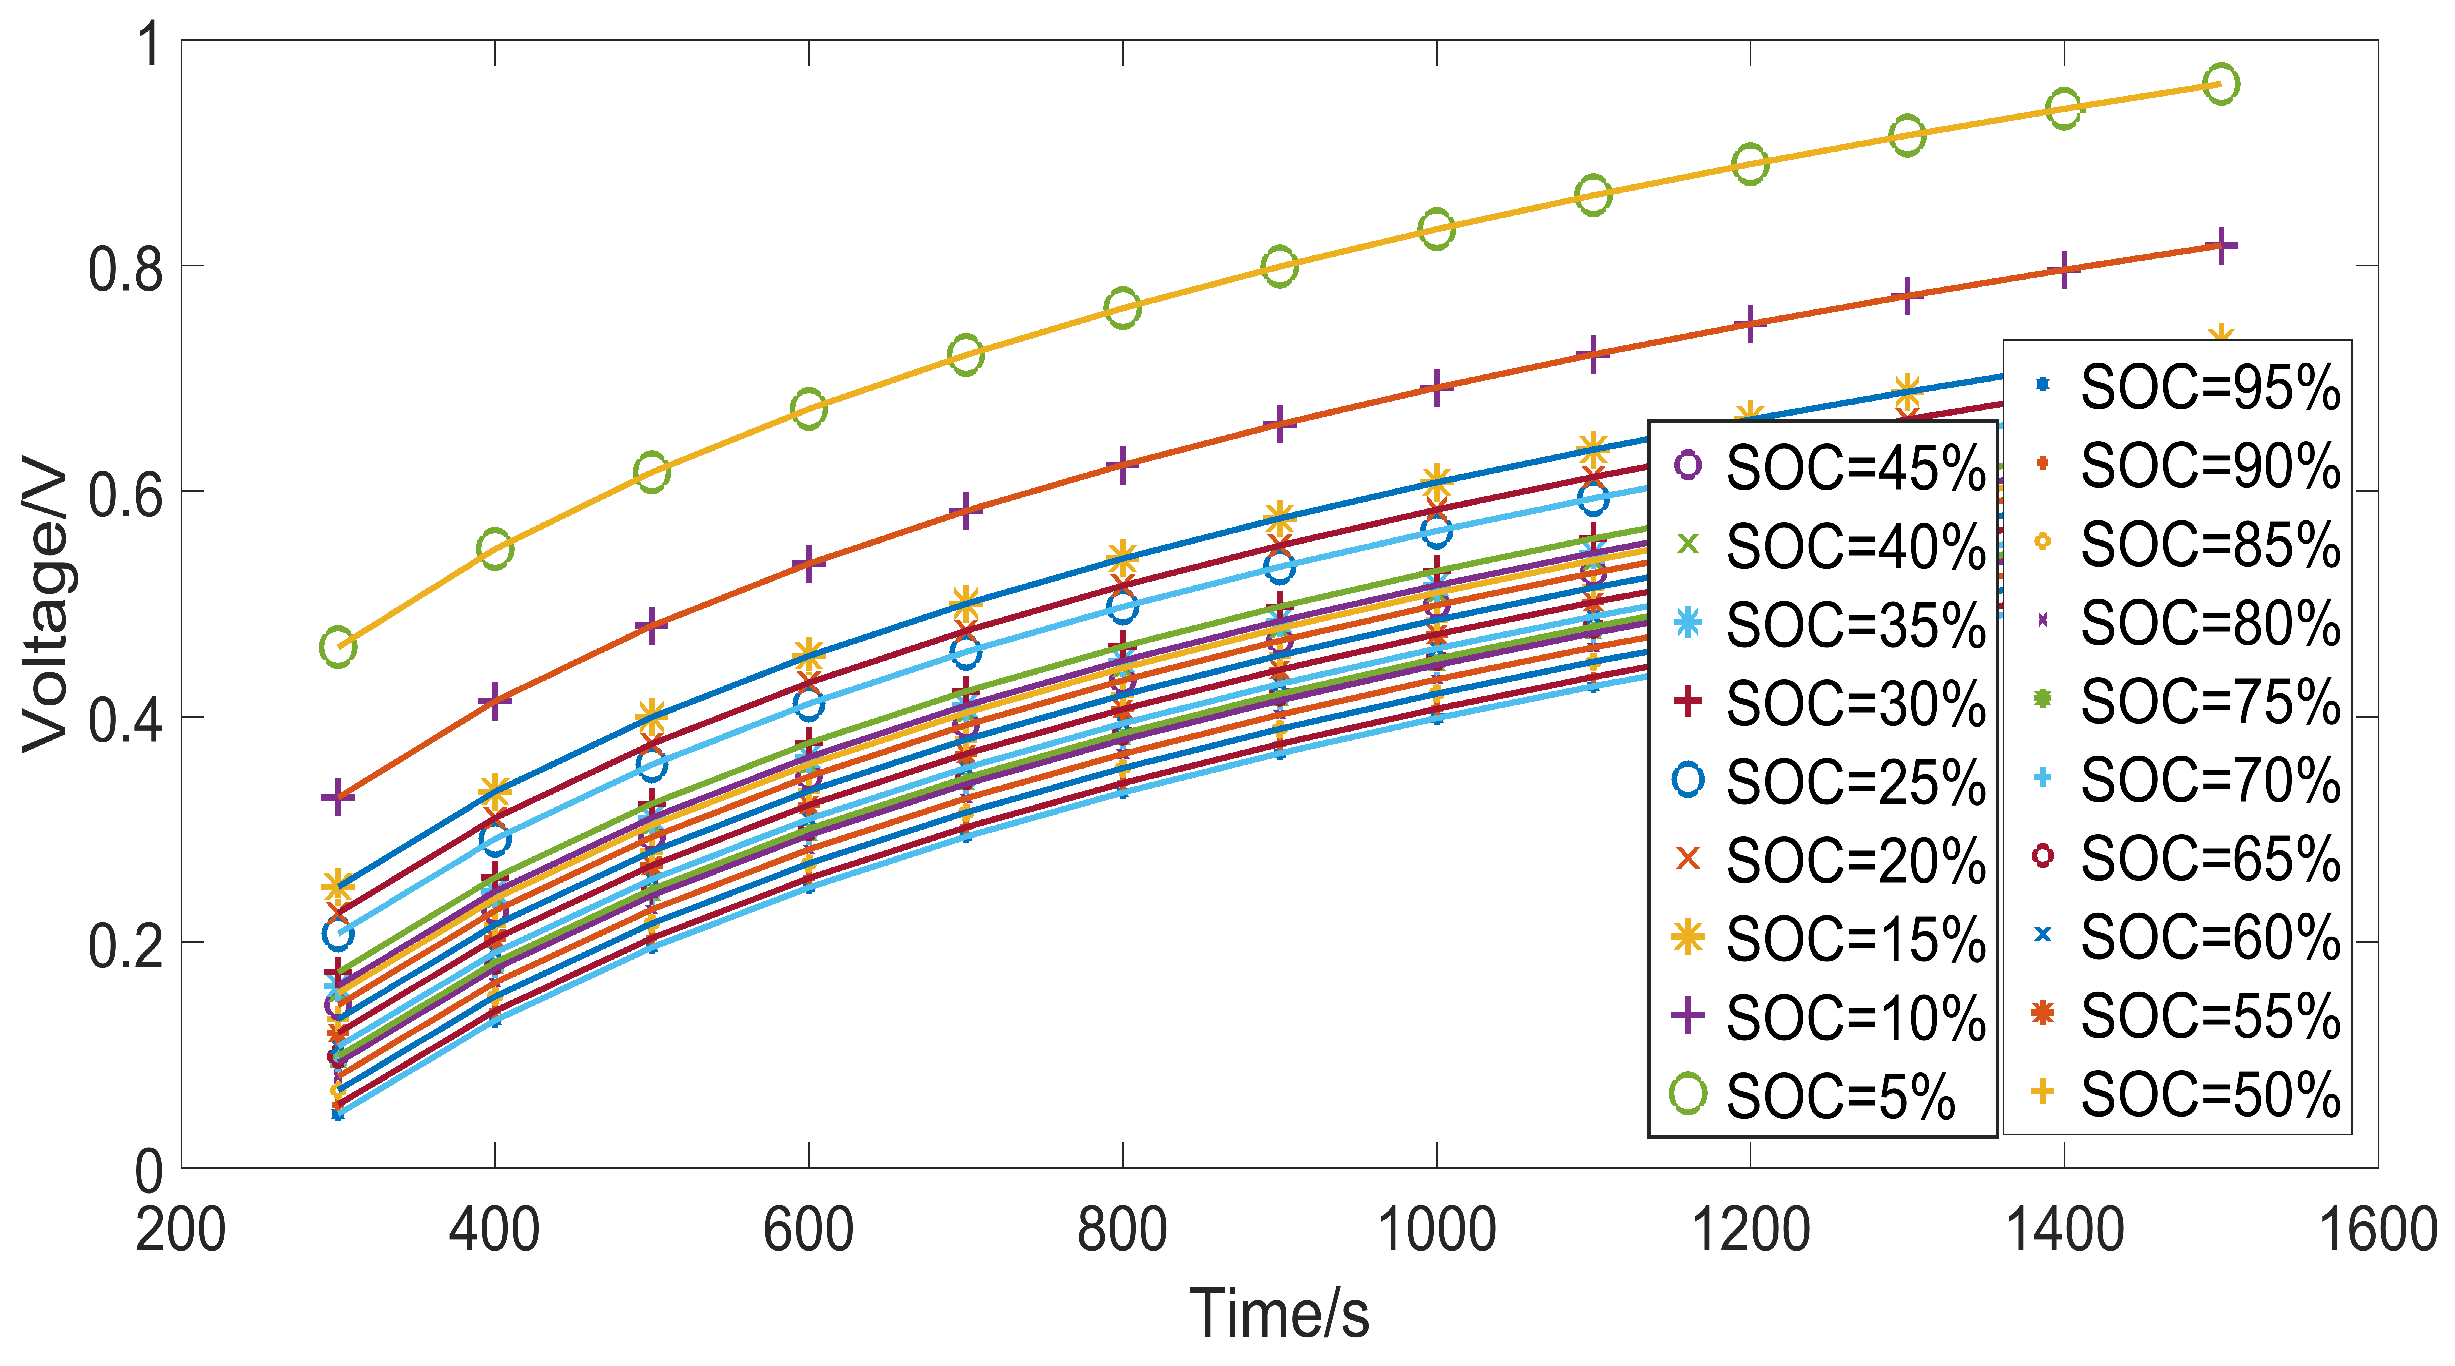
3.3. Identification Results

The fitting result when the pulse current is loading at 50% SOC and the variation of the fractional order α of the fractional order model (25 C, 0.5C discharging current) are shown in Figure 6a,b, respectively. It is worth noting that the voltage response in Figure 6a corresponds to the voltage variation between point B and point C in Figure 1.
From Figure 6b, the fractional order increases monotonously from 0.39 to 0.61 when the SOC is discharged from 95% to 15%. When SOC is less than 15%, the fractional order increases rapidly, indicating that the rate of the voltage variation is increasing. As the battery SOC decreases from 100% to 0%, the order defining the fractality of charge distribution on porous electrodes changes from fraction to integer. This meaningful phenomenon guides us that we could just take the fractional order into account when estimating SOC.
Temperature, cycling times, and current magnitude also affect the order of the fractional order model. The significance of these influences vary strongly with the battery chemistry. Figure 7a,b show the order variations under different temperatures (0.5C discharging current) and different current magnitudes (25 C).
From Figure 7a,b, it is obvious that there exists a strong temperature dependence of the fractional order, but also a negligible dependence on the current magnitude. Figure 8 shows relationships between the fractional order α and SOC for different batteries with the same model type and for different cycling times (25 C, 0.5C discharging current). Constant current and constant voltage (CC-CV) mode is adopted in the charge/ discharge and cycle life test. The battery is charged and discharged at 2C at 25 C in the cycle test. Pulse discharge test is carried out every 100 cycle life test.
In Figure 8a, the different batteries exhibited different order variation at the same SOC and temperature. These differences resulted from small variations in cell preparation.
Because the cell degradation has an influence on the activity of the electrolyte and polarization effect, the fractional order is affected by the degradation, which is observable in Figure 8b. The fractional order is found to be approximately 10% higher than the one of the new cell. This phenomenon can also be explained by the theory of charge distribution due to the porous structure of the electrode. The cell degradation changes the fractal dimension of the porous electrode. As the cycling times increase, the fractional order of the fractional model approaches 1 at the same SOC and temperature.
The battery is discharged after the battery inner electrochemical reaction reaches balanced, therefore the relationship between the fractional order and the SOC is stable. The identified order are dependent on the external operational conditions and the cell degradation. Therefore, the fractional order is time-variant and varies with temperature, power demand, and degradation. In this paper, this task is solved for the investigated lithium-ion cells implicitly by the chosen identification signals, where the battery conditions can be assumed to be homogeneous over all cells.
Nevertheless, it is necessary to compensate the influence of the varying temperature and the cell degradation of the battery, as this has immense effect on the identified fractional order. The identification of the fractional order is done with the special identification signal which has a defined timespan and occurs regularly. Due to the short sampling time, the variation of temperature can be ignored. For the calculation of the fractional order dependent SOC, the temperature and degradation dependency of the fractional order values has to be eliminated. The calculation of the fractional order is now performed by solving the equations:
α i , a c t = k α i , n e w ( θ a c t ) α i , n e w ( θ a c t ) = q α i , n e w ( θ 25 )
where α i , a c t , α i , n e w ( θ a c t ) , and α i , n e w ( θ 25 ) are the actual fractional order at i time, the fractional order of the new cell at the actual temperature and the fractional order of the new cell at 25 C, respectively. From Figure 7a and Figure 8b, there is an obvious monotonic trend between the fractional order α , temperature and cycling times at the same SOC. The scaling factor k between the theoretical fractional order of the new cell at the actual temperature and the actual fractional order is calculated as degradation index, and the scaling factor q between the theoretical fractional order of the new cell at the actual temperature and the fractional order of the new cell at 25 C is calculated as temperature index.
The actual cell temperature can be assumed to be measured by the external temperature sensor. Then, the cells are balanced after the resting period and the temperature can be measured accurately enough. The typical values of the scaling factor k and q have been chosen based on the identified results and the battery characteristic.

4. SOC Estimation

As discussed above, the fractional order can indicate the battery SOC, thus the SOC could be estimated by the relationship between the fractional order and SOC. However, during the identification process, the selection of initial coefficient may have an impact on the fitting result. Consequently, the estimated SOC will be unstable in a small range. To overcome this fitting drawback of order identification and improve the accuracy of the SOC estimation, a new iterative method based on the fractional continual variable order model is proposed in this section. The inaccurate SOC value will be amended in the iteration process, and the coefficient and order of the fractional order model gradually converge to the true value. The convergence of the iterative method is proved, and the experiment is carried out to evaluate its performance.

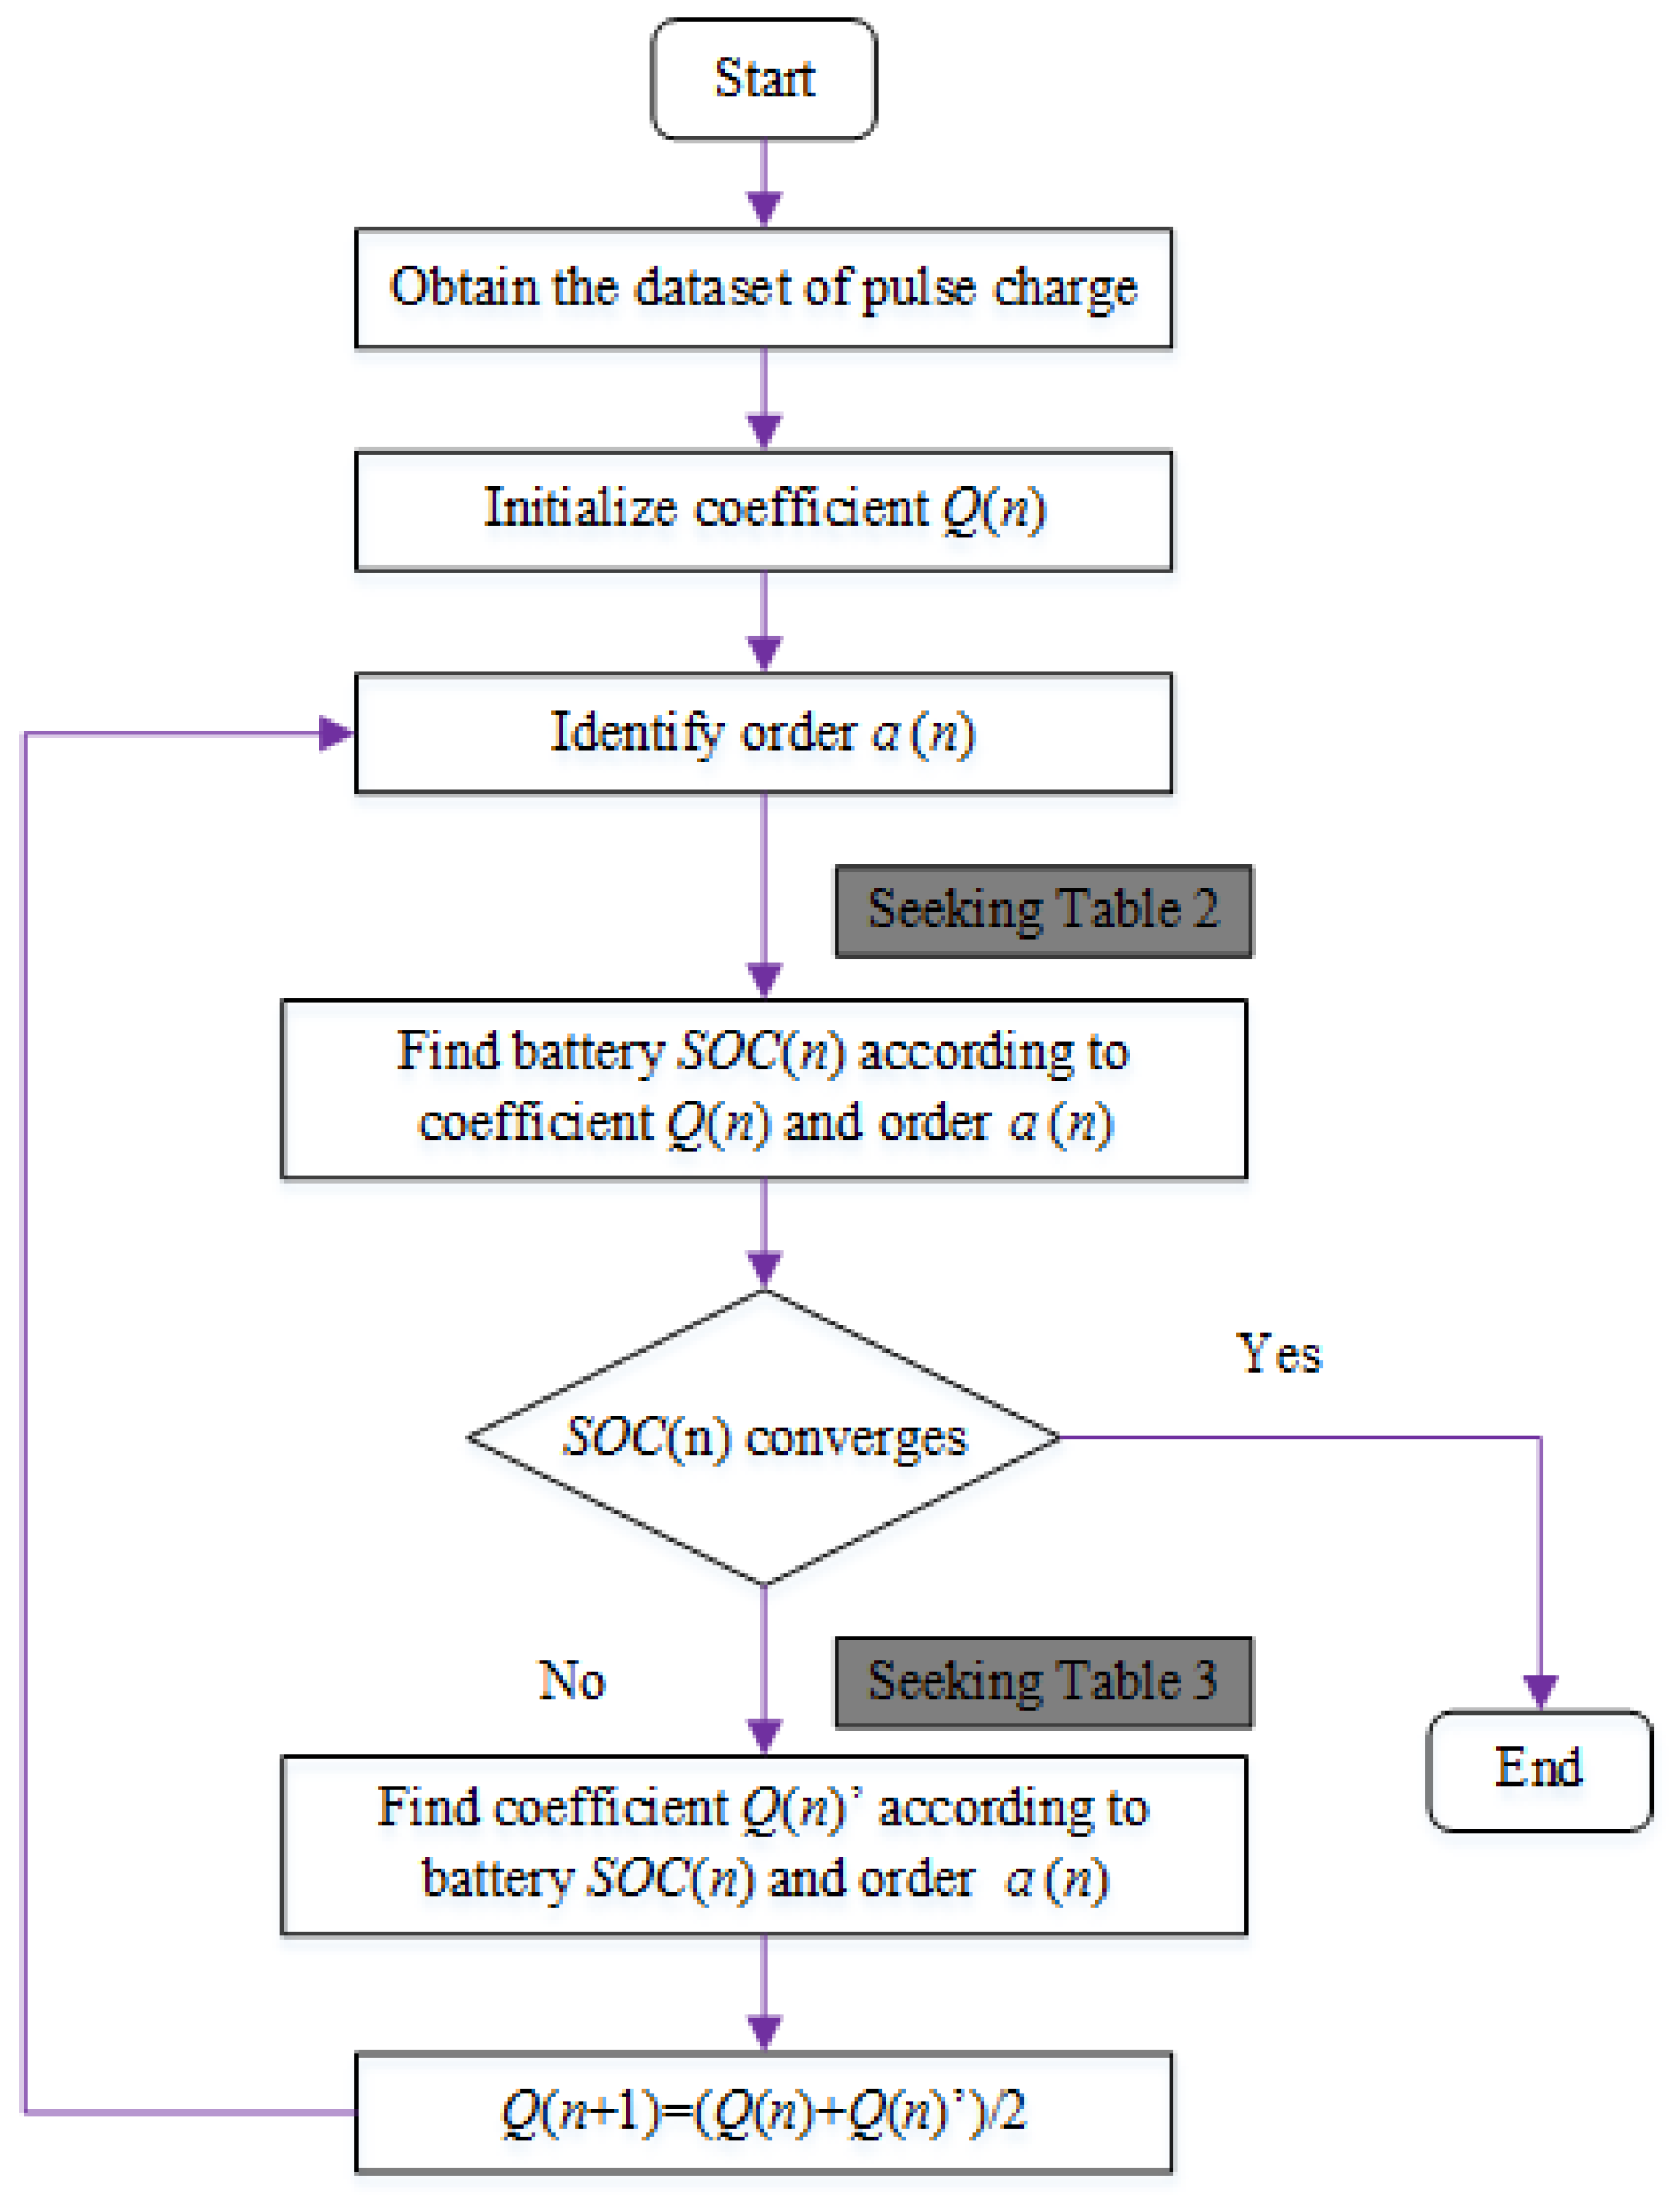
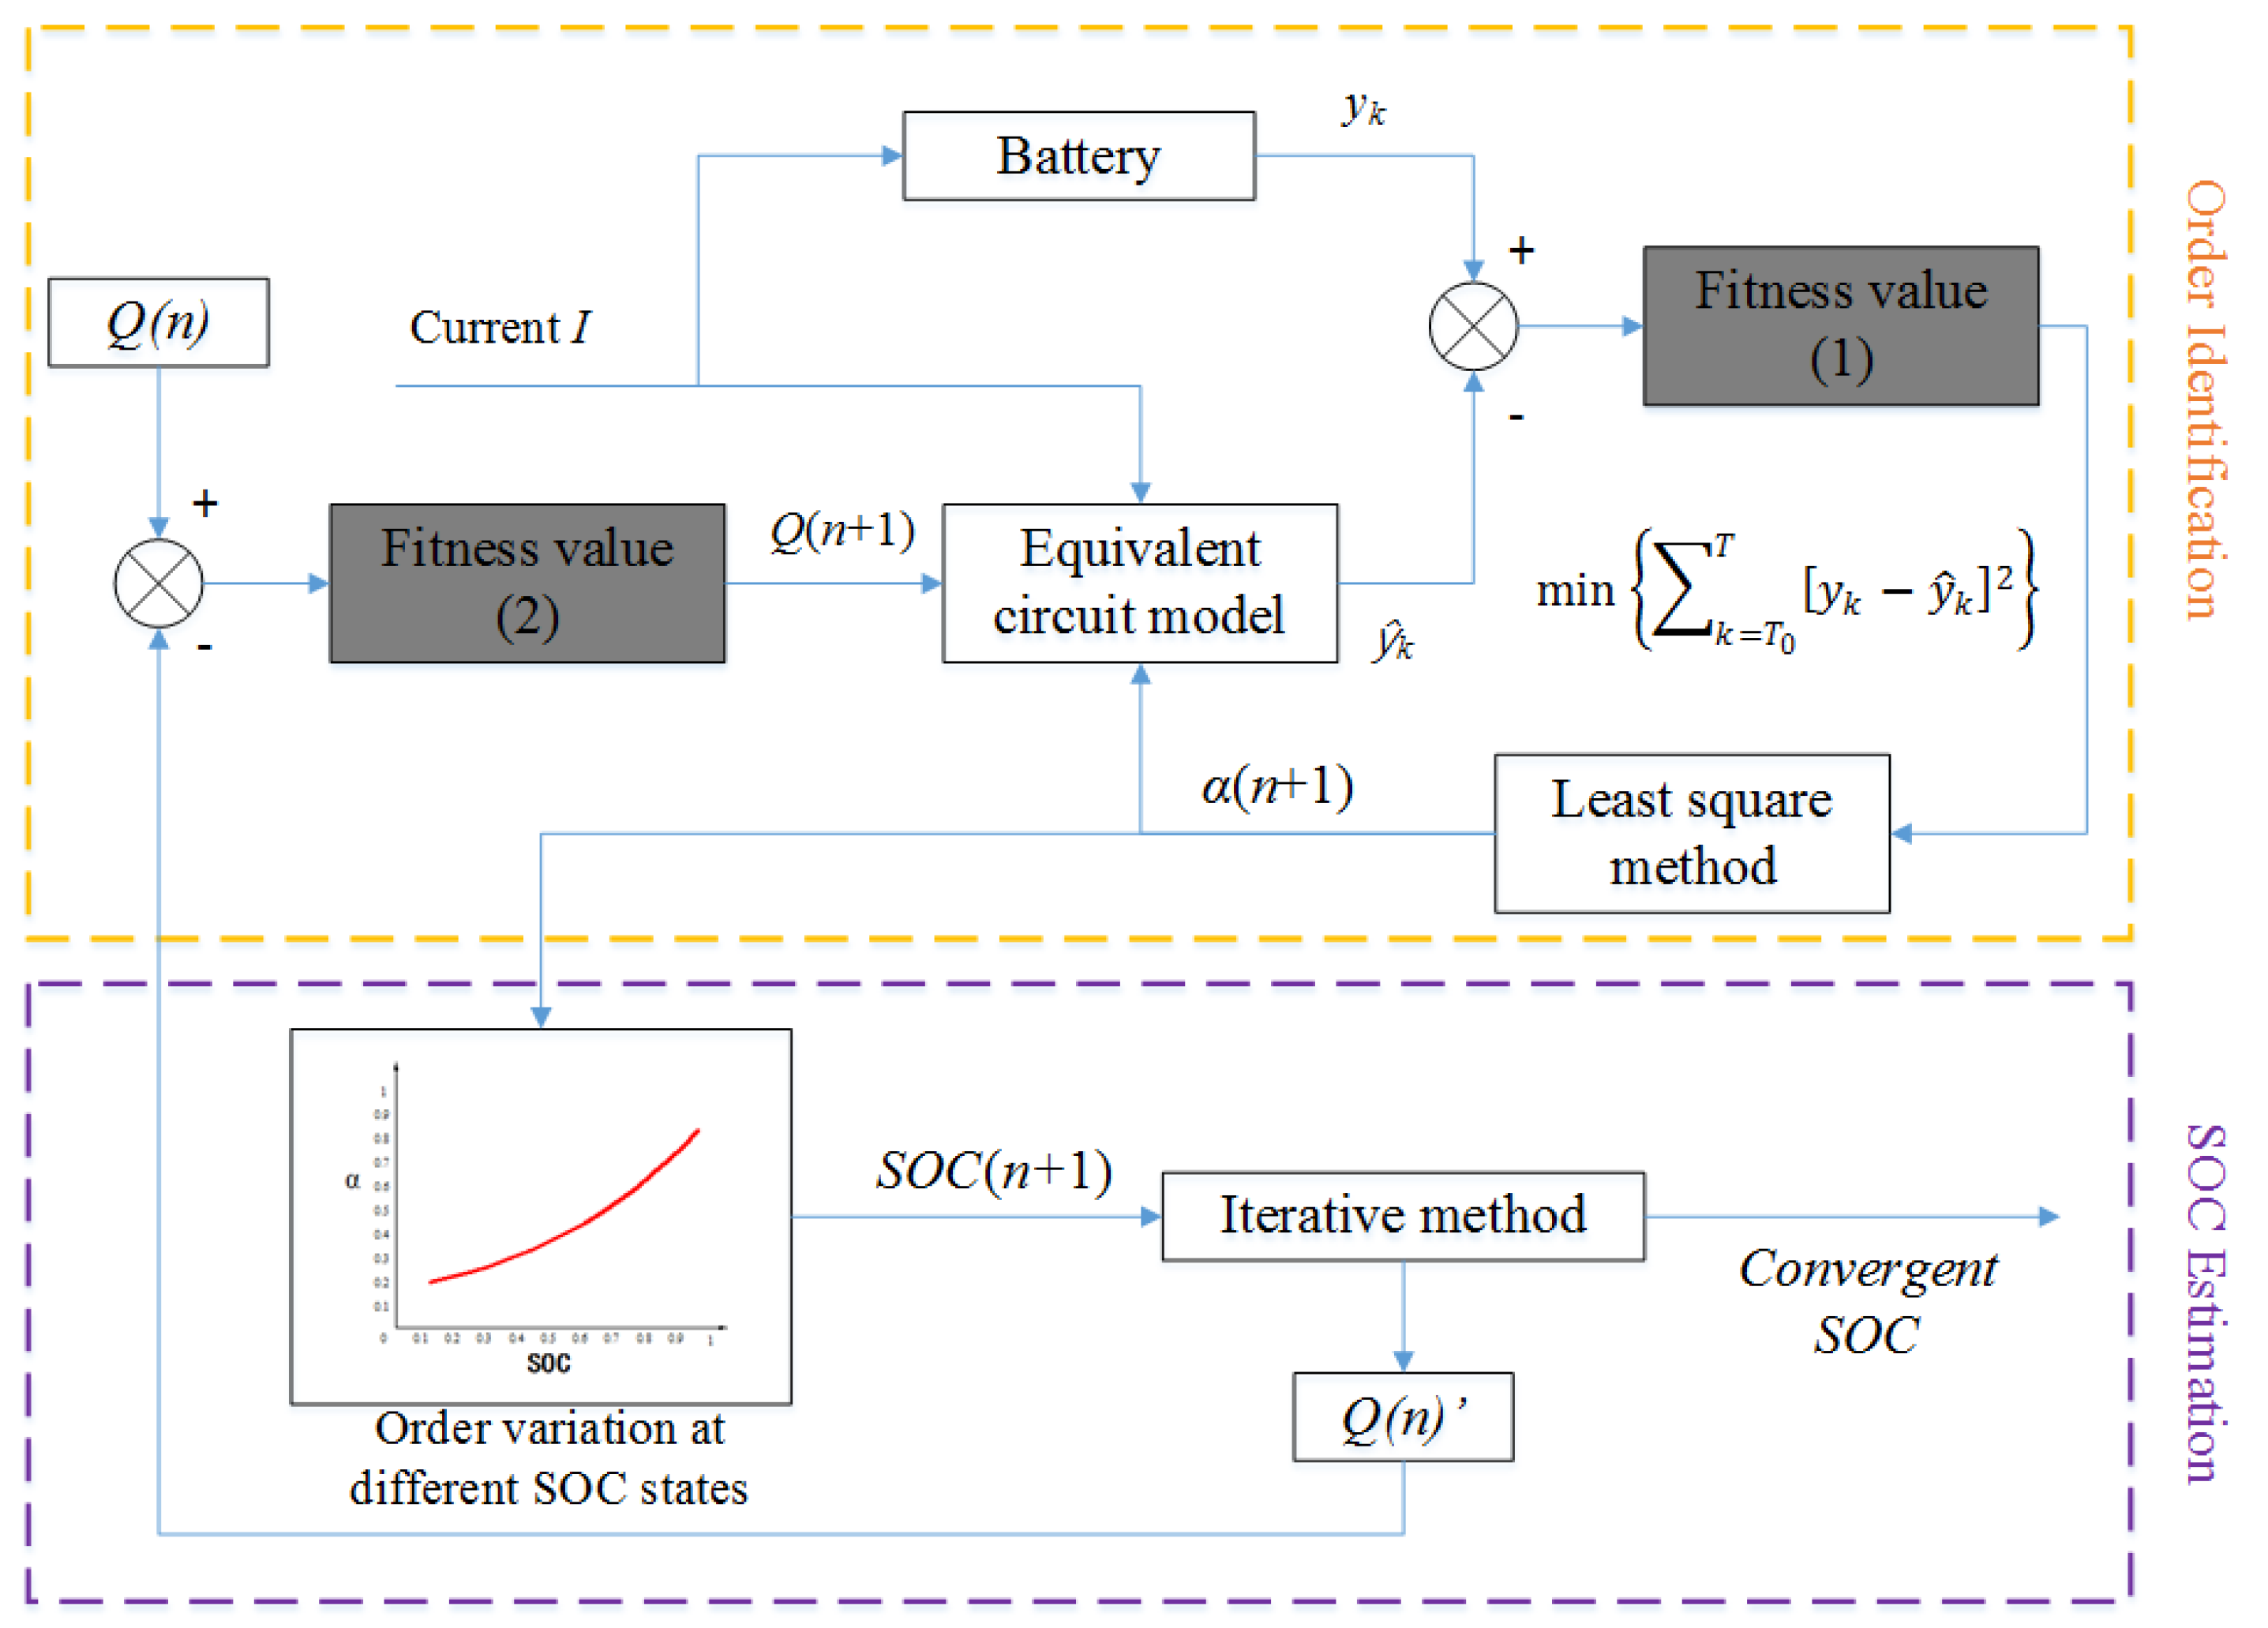
4.1. The Iterative Method for SOC Estimation

The identified order when the coefficient Q is fixed within the given variation range is shown in Table 2. The identified coefficient when the fractional order α is fixed within the given variation range is shown in Table 3.
The relationship between coefficient Q and order α of the fractional order model in different SOC states is shown in Figure 9. From Figure 9, there is an obvious monotonic trend between coefficient Q and order α at the same SOC. The interpolation curve of coefficient and order moves up with the decrease of the SOC.
The main steps of the iterative method for estimating the battery SOC are as follows:
  • The initial coefficient Q ( n ) is selected in the given variation range which is shown in Table 2. For convenience, the initial coefficient Q ( n ) is generally integer in this paper.
  • Based on the least square principle, the order α ( n ) is identified when the coefficient is fixed at Q ( n ) , and the battery SOC ( n ) can be obtained from Table 2.
  • According to Table 3, the coefficient Q ( n ) is searched when the order α (n) and the battery SOC ( n ) are known.
  • The coefficient Q ( n + 1 ) is calculated based on the formula:
    Q ( n + 1 ) = Q ( n ) + Q ( n ) 2
  • The coefficient Q ( n + 1 ) is used as the new coefficient, repeat steps 2–4 until the coefficient and the order converge to the fixed value. The framework of SOC estimation based on the iterative method is shown in Figure 10.
It is worth noting that the ranges of the parameters in Table 2 and Table 3 are selected based on the fitting results and the battery characteristic. Moreover, only part of the parameters are listed in these tables, the corresponding parameters which have not been presented in Table 2 and Table 3 can be obtained by fitting experimental data. Although part of the coefficients in Table 3 are out of the range in Table 2, they always fall within the range of Table 2 in the estimation process. The order identification of the fractional continual variable order model and the iterative method for estimating the SOC could be implemented by the schematic shown in Figure 11.
In Figure 11, fitness value (1) and fitness value (2) are calculated based on Equations (9) and (11), respectively. For the order identification, the deviation between calculated y ^ k and measured y k is fed back with the fitness value (1). In the SOC estimation process, the deviation between coefficient Q ( n ) and Q ( n ) is fed back with the fitness value (2), thus new coefficient Q ( n + 1 ) is taken into the fractional order model to update the fractional order. Since SOC is one of the states, a more accurate SOC is updated.

4.2. Proof of the Convergence of the SOC
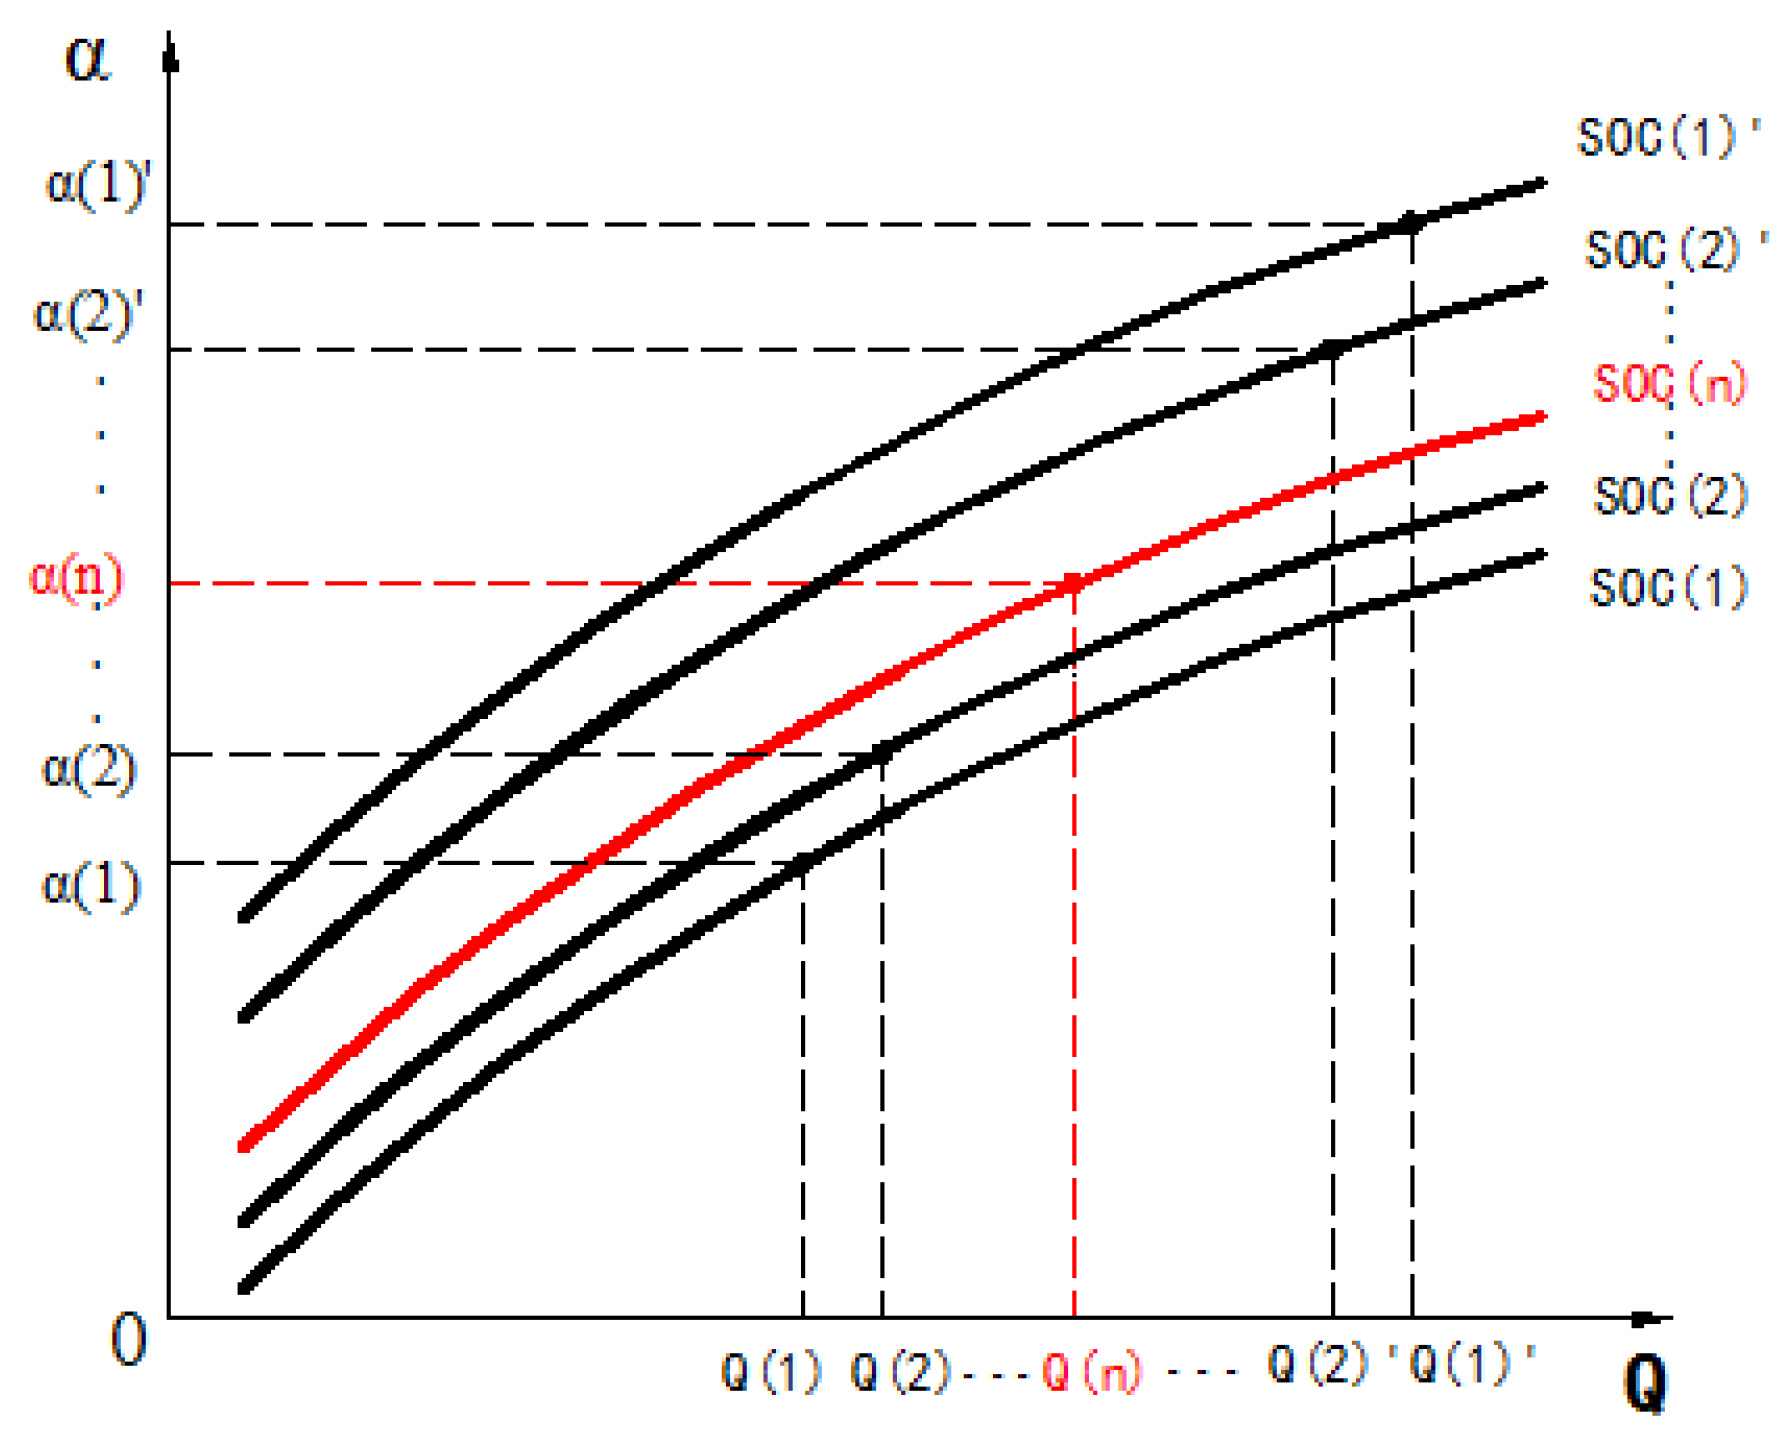
Before using the iterative method to estimate the battery SOC, it is necessary to prove the convergence of the parameters of the fractional order model and the battery SOC in the iterative process. In a stable operation condition, the relationships between the coefficient, order and SOC can be expressed as follows:
  • When the order α is fixed, the coefficient Q given by the identification is positive with SOC, and their relationship can be expressed as: Q SOC;
  • When the coefficient Q is fixed, the order α given by the identification is inversely proportional to SOC, and their relationship can be expressed as: α (1/SOC);
  • At the same battery SOC, the coefficient is proportional to the order, and their relationship is expressed as: Q α .
Assume that the initial coefficient Q ( 1 ) is smaller than the coefficient Q ( 1 ) obtained from Table 3. According to the relation: Q α , the order α ( 1 ) obtained by the first identification is smaller than the order α ( 1 ) obtained by the second identification. According to the relation: α (1/SOC), the battery SOC ( 1 ) obtained by the first identification is larger than the battery SOC ( 1 ) obtained by the second identification. Based on Equation (9), we can derive the inequality [30,31]:
Q ( 1 ) < Q ( 2 ) < Q ( 1 ) α ( 1 ) < α ( 2 ) < α ( 1 ) S O C ( 1 ) < S O C ( 2 ) < S O C ( 1 )
In the iterative process, the coefficients will present the following relations:
Q ( 1 ) < Q ( 2 ) < Q ( 2 ) < Q ( 1 ) Q ( 2 ) < Q ( 3 ) < Q ( 3 ) < Q ( 2 ) Q ( n 1 ) < Q ( n ) < Q ( n ) < Q ( n 1 )
Inequality (11) could be alternated as follows:
Q ( 2 ) Q ( 2 ) = k 1 Q ( 1 ) Q ( 1 ) , 0 < k 1 < 1 Q ( 3 ) Q ( 3 ) = k 1 k 2 Q ( 2 ) Q ( 2 ) , 0 < k 2 < 1 Q ( n ) Q ( n ) = k 1 k 2 k n 1 Q ( n 1 ) Q ( n 1 ) , 0 < k n 1 < 1
where k 1 , k 2 ,…, k n 1 is a sequence of constants. When the constant n approaches to infinity, k 1 k 2 k n 1 tend to 0, and the following equation can be obtained:
Q ( n ) = Q ( n )
Similarly, the following equations can be proved during the iterations:
α ( n ) = α ( n ) S O C ( n ) = S O C ( n )
We can draw the same conclusion when the initial coefficient Q ( 1 ) is larger than the coefficient Q ( 1 ) . The coefficient Q, order α and the battery SOC will gradually converge to the fixed value after several iterations, and the SOC estimation error will be reduced during the iterations. The schematic diagram of the convergence of the SOC of the iterative method is shown in Figure 12.

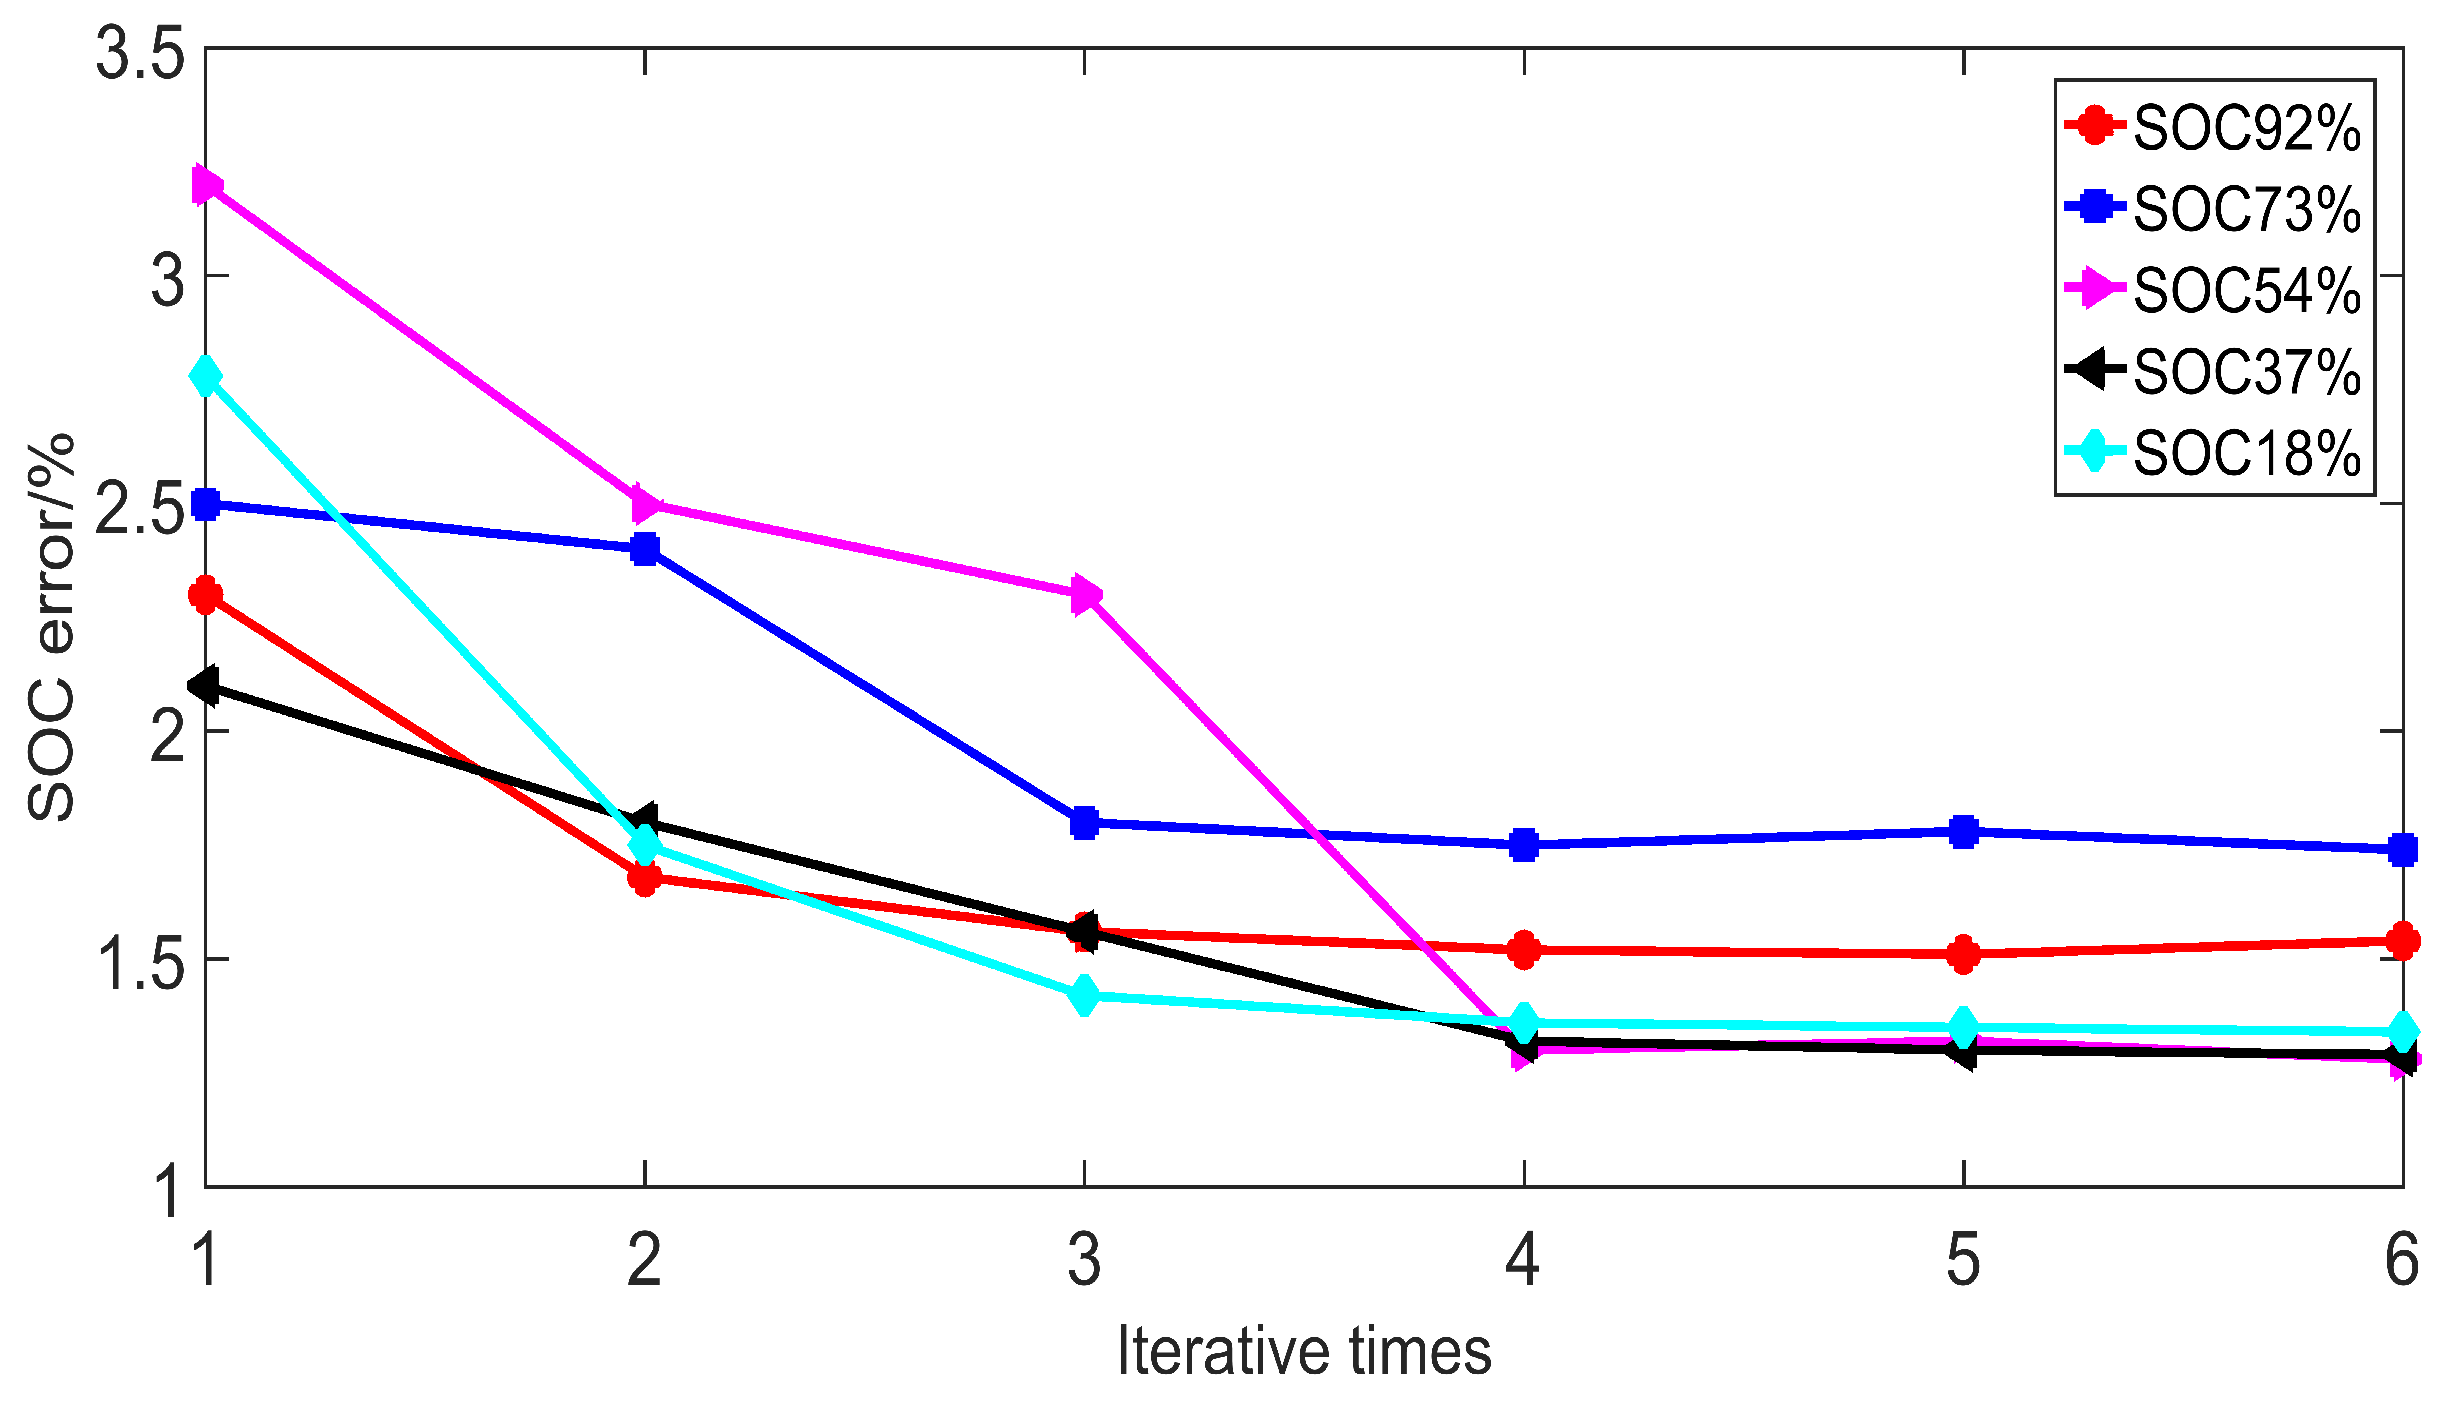
4.3. Experiment Validation

In order to verify the accuracy of the iterative method and evaluate its performance, the step-pulse current discharge is carried out at the random battery SOC (25 C, 0.5C discharging current), and the OCV method is regarded as the reference value in view of the highly precise measurement. The estimation result of the iterative method is shown in Table 4, and the relative error of the iterative method is shown in Figure 13.
From Figure 13, the initial SOC estimation error of the iterative method is usually between 2% and 3%. The estimated SOC of the iteration method gradually converges to the reference SOC and traces it well with a small error confined to 2%. When the parameters are iterated for about 6 times, the variation of the battery SOC can be neglected, and iteration calculation is terminated. Because of the short duration of the pulse discharge, the whole identification process takes much less computation time than other methods. The analysis of the iterative method for SOC estimation also illustrates its less iterative times, faster calculation speed and better convergency. Since the experimental conditions are usually different, it is difficult to make fair comparisons between different approaches. However, it is easy to see that the estimation method is effective, accurate and stable.

5. Conclusions

This paper presents a fractional continual variable order model and a rapid SOC estimation method for the battery system. It includes the fractional order modeling method of the battery, the order identification based on least square method and the SOC estimation method based on the correspondence between the fractional order and SOC. Results show the fractal morphology of charge distribution varies stably with SOC after the battery inner electrochemical reaction reaches balanced. Therefore, the proposed model is suitable for SOC estimation when the battery is in the resting state, such as the pulse discharge in the switching process of the battery groups and the start of the combustion engine of the hybrid vehicle. The proposed method can be easily implemented and applied by iteration. Experiments have been carried out to demonstrate that the iterative method can improve the precision of the estimated SOC. The drawback of the proposed method lies in where the long previous test time are required to acquire the relationship between the parameters of the fractional order model and the SOC. The proposed method is complementary to the existing SOC estimation methods. Further research of the authors will focus on the combination of the proposed SOC estimation method and fractional Kalman filtering method. When the battery is in the static state, the iterative method proposed in this paper can be used to quickly estimate the SOC. Meanwhile, the estimated fractional order is used as the new fractional order of fractional Kalman filtering method, and the real-time estimation of the battery SOC can be carried out. The fractional order will be gradually updated between the dynamic condition and the static state and converges to the true value.

Acknowledgments

The research is supported by National Science Foundation of China (11272159) in part, and the innovative plan for graduate research of Jiangsu Province (KYCX17 0863) in part.

Author Contributions

Xin Lu, Jun Xu and Siyuan Chen conceived this paper and designed the experiments; Hui Li performed the experiments; Ning Chen revised the paper and provided some valuable suggestions. The authors would like to thank them for their support and help. The authors would also like to thank the reviewers for their corrections and helpful suggestions.

Conflicts of Interest

The authors declare no conflict of interest.

References

  1. Hu, X.; Li, S.; Peng, H. A comparative study of equivalent circuit models for Li-ion batteries. J. Power Sources 2012, 198, 359–367. [Google Scholar] [CrossRef]
  2. Li, J.; Barillas, J.K.; Guenther, C.; Danzer, M.A. A comparative study of state of charge estimation algorithms for LiFePO4 batteries used in electric vehicles. J. Power Sources 2013, 230, 244–250. [Google Scholar] [CrossRef]
  3. Kong, S.N.; Moo, C.S.; Chen, Y.P.; Hsieh, Y.C. Enhanced coulomb counting method for estimating state-of-charge and state-of-health of lithium-ion batteries. Appl. Energy 2009, 86, 1506–1511. [Google Scholar] [CrossRef]
  4. Kang, L.W.; Zhao, X.; Ma, J. A new neural network model for the state-of-charge estimation in the battery degradation process. Appl. Energy 2014, 121, 20–27. [Google Scholar] [CrossRef]
  5. Yang, F.; Xing, Y.; Wang, D.; Tsui, K.L. A comparative study of three model-based algorithms for estimating state-of-charge of lithium-ion batteries under a new combined dynamic loading profile. Appl. Energy 2016, 164, 387–399. [Google Scholar] [CrossRef]
  6. Li, D.; Ouyang, J.; Li, H.; Wan, J. State of charge estimation for LiMn2O4, power battery based on strong tracking sigma point Kalman filter. J. Power Sources 2015, 279, 439–449. [Google Scholar] [CrossRef]
  7. Meng, J.; Luo, G.; Gao, F. Lithium polymer battery state-of-charge estimation based on adaptive unscented Kalman filter and support vector machine. IEEE Trans. Power Electron. 2016, 31, 2226–2238. [Google Scholar] [CrossRef]
  8. Guo, X.; Kang, L.; Yao, Y.; Huang, Z.; Li, W. Joint estimation of the electric vehicle power battery state of charge based on the least squares method and the Kalman filter algorithm. Energies 2016, 9, 100. [Google Scholar] [CrossRef]
  9. Zhang, C.; Jiang, J.; Zhang, W.; Sharkh, S.M. Estimation of state of charge of lithium-ion batteries used in HEV using robust extended Kalman filtering. Energies 2012, 5, 1098–1115. [Google Scholar] [CrossRef]
  10. Huang, J.; Li, Z.; Liaw, B.Y.; Zhang, J. Graphical analysis of electrochemical impedance spectroscopy data in Bode and Nyquist representations. J. Power Sources 2016, 309, 82–98. [Google Scholar] [CrossRef]
  11. Huang, J.; Li, Z.; Ge, H.; Zhang, J. Analytical solution to the impedance of electrode/electrolyte interface in lithium-ion batteries. J. Electrochem. Soc 2015, 162, A7037–A7048. [Google Scholar] [CrossRef]
  12. Radvanyi, E.; Havenbergh, K.V.; Porcher, W.; Jouanneau, S.; Bridel, J.S. Study and modeling of the solid electrolyte interphase behavior on nano-silicon anodes by electrochemical impedance spectroscopy. Electrochim. Acta 2014, 137, 751–757. [Google Scholar] [CrossRef]
  13. Zou, Y.; Li, S.E.; Shao, B.; Wang, B. State-space model with non-integer order derivatives for lithium-ion battery. Appl. Energy 2016, 161, 330–336. [Google Scholar] [CrossRef]
  14. Liu, C.; Liu, W.; Wang, L.; Hu, G.; Ma, L.; Ren, B. A new method of modeling and state of charge estimation of the battery. J. Power Sources 2016, 320, 1–12. [Google Scholar] [CrossRef]
  15. Xu, J.; Mi, C.C.; Cao, B.; Cao, J. A new method to estimate the state of charge of lithium-ion batteries based on the battery impedance model. J. Power Sources 2013, 233, 277–284. [Google Scholar] [CrossRef]
  16. Zhou, D.; Zhang, K.; Ravey, A.; Gao, F.; Miraoui, A. Parameter sensitivity analysis for fractional-order modeling of lithium-ion batteries. Energies 2016, 9, 123. [Google Scholar] [CrossRef]
  17. Oustaloup, A.; Sabatier, J.; Lanusse, P. From fractal robustness to the CRONE control. FCAA 2007, 2, 1–30. [Google Scholar]
  18. Mastali, M.; Samadani, E.; Farhad, S.; Fraser, R.; Fowler, M. Three-dimensional multi-particle electrochemical model of LiFePO4 Cells based on a resistor network methodology. Electrochim. Acta 2016, 190, 574–587. [Google Scholar] [CrossRef]
  19. Wang, B.; Li, S.E.; Peng, H.; Liu, Z. Fractional-order modeling and parameter identification for lithium-ion batteries. J. Power Sources 2015, 293, 151–161. [Google Scholar] [CrossRef]
  20. He, H.; Xiong, R.; Guo, H. Online estimation of model parameters and state-of-charge of LiFePO4 batteries in electric vehicles. Appl. Energy 2012, 89, 413–420. [Google Scholar] [CrossRef]
  21. Rahimi-Eichi, H.; Baronti, F.; Chow, M.Y. Online adaptive parameter identification and state-of-charge coestimation for lithium-polymer battery cells. IEEE Trans. Ind. Electron. 2014, 61, 2053–2061. [Google Scholar] [CrossRef]
  22. Li, X.; Song, K.; Wei, G.; Lu, R.; Zhu, C. A novel grouping method for lithium iron phosphate batteries based on a fractional joint Kalman filter and a new modified K-means clustering algorithm. Energies 2015, 8, 7703–7728. [Google Scholar] [CrossRef]
  23. Zhong, F.; Li, H.; Zhong, S.; Zhong, Q.; Yin, C. An SOC estimation approach based on adaptive sliding mode observer and fractional order equivalent circuit model for lithium-ion batteries. Commun. Nonlinear Sci. Numer. Simul. 2015, 24, 127–144. [Google Scholar] [CrossRef]
  24. Xiao, R.; Shen, J.; Li, X.; Yan, W.; Pan, E.; Chen, Z. Comparisons of modeling and state of charge estimation for lithium-ion battery based on fractional order and integral order methods. Energies 2016, 9, 184. [Google Scholar] [CrossRef]
  25. Riu, D.; Montaru, M.; Bultel, Y. Time domain simulation of Li-ion batteries using non-integer order equivalent electrical circuit. Nonlinear Sci. Numer. Simul. 2013, 18, 1454–1462. [Google Scholar] [CrossRef]
  26. Deng, Z.; Cao, H.; Li, X.; Jiang, J.; Yang, J.; Qin, Y. Generalized predictive control for fractional order dynamic model of solid oxide fuel cell output power. J. Power Sources 2010, 195, 8097–8103. [Google Scholar] [CrossRef]
  27. Sabatier, J.; Merveillaut, M.; Francisco, J.M.; Guillemard, F.; Porcelatto, D. Lithium-ion batteries modeling involving fractional differentiation. J. Power Sources 2014, 262, 36–43. [Google Scholar] [CrossRef]
  28. Unterrieder, C.; Zhang, C.; Lunglmayr, M.; Priewasser, R.; Marsili, S.; Huemer, M. Battery state-of-charge estimation using approximate least squares. J. Power Sources 2015, 278, 274–286. [Google Scholar] [CrossRef]
  29. Khadhraoui, A.; Jelassi, K.; Trigeassou, J.C.; Melchior, P. Identification of fractional model by least-squares method and instrumental variable. J. Comput. Nonlinear Dyn. 2015, 10, 050801. [Google Scholar] [CrossRef]
  30. Plubtieng, S.; Punpaeng, R. A new iterative method for equilibrium problems and fixed point problems of nonexpansive mappings and monotone mappings. Appl. Math. Comput. 2008, 197, 548–558. [Google Scholar] [CrossRef]
  31. Daftardar-Gejji, V.; Jafari, H. An iterative method for solving nonlinear functional equations. J. Math. Anal. Appl. 2006, 316, 753–763. [Google Scholar] [CrossRef]
Figure 1. Voltage response of lithium-ion batteries.
Energies 11 00714 g001
Figure 2. Equivalent circuit of fractional order model.
Energies 11 00714 g002
Figure 3. Differences of fractional capacitor output voltage by changing fractional order.
Energies 11 00714 g003
Figure 4. Configuration of the battery testing system.
Energies 11 00714 g004
Figure 5. Voltage response of lithium-ion batteries in different SOC states (25 C, 0.5C discharging current).
Energies 11 00714 g005
Figure 6. (a) Fitting result of the voltage response at 50% SOC; (b) The variation of the fractional order α (25 C, 0.5C discharging current).
Energies 11 00714 g006
Figure 7. (a) The variation of the fractional order α under different temperatures (0.5C discharging current); (b) The variation of the fractional order α under different current magnitudes (25 C).
Energies 11 00714 g007
Figure 8. (a) Relationships between the fractional order α and SOC for different batteries (25 C, 0.5C discharging current); (b) Relationships between the fractional order α and SOC for different cycling times (25 C, 0.5C discharging current).
Energies 11 00714 g008
Figure 9. Relationship between the coefficient and the order of the fractional order model.
Energies 11 00714 g009
Figure 10. Flow chart of the iterative method for SOC estimation.
Energies 11 00714 g010
Figure 11. Block diagram for the structure of the order identification of the fractional continual variable order model and the iterative method for SOC estimation.
Energies 11 00714 g011
Figure 12. The schematic of the convergence of the SOC of the iterative method.
Energies 11 00714 g012
Figure 13. Estimation error of the iterative method (25 C, 0.5C discharging current).
Energies 11 00714 g013
Table 1. Specification of the lithium-ion battery.
BatteryNominal Capacity (Ah)Nominal Voltage (V)Max Voltage (V)Continuous Discharge Rate
LiFePO 4 103.23.655C
Table 2. Relationship between the order of the fractional order model and the battery SOC.
Q (SOC)150014001300120011001000900800700600500400300
α 1 (95%)0.5200.4990.4770.4530.4270.3990.3680.3330.2940.2490.1960.1310.048
α 2 (90%)0.5280.5070.4850.4610.4350.4070.3760.3410.3020.2570.2040.1390.056
α 3 (85%)0.5420.5210.4990.4750.4490.4210.3890.3540.3150.2700.2170.1520.069
α 4 (80%)0.5550.5340.5120.4880.4620.4330.4020.3670.3280.2820.2290.1640.081
α 5 (75%)0.5690.5480.5260.5020.4760.4470.4160.3810.3420.2960.2430.1780.095
α 6 (70%)0.5680.5470.5240.5000.4740.4460.4150.3800.3400.2950.2420.1770.093
α 7 (65%)0.5730.5530.5300.5060.4800.4520.4200.3850.3460.3010.2470.1820.099
α 8 (60%)0.5820.5620.5390.5150.4890.4610.4290.3940.3550.3090.2560.1910.108
α 9 (55%)0.5950.5740.5520.5280.5020.4730.4420.4070.3670.3220.2680.2030.120
α 10 (50%)0.6080.5870.5650.5410.5150.4860.4550.4190.3800.3340.2810.2160.132
α 11 (45%)0.6220.6000.5780.5540.5280.4990.4680.4320.3930.3470.2930.2280.144
α 12 (40%)0.6330.6120.5890.5650.5390.5100.4780.4430.4040.3580.3040.2390.155
α 13 (35%)0.6390.6180.5960.5720.5450.5170.4850.4500.4100.3640.3110.2450.161
α 14 (30%)0.6530.6310.6090.5850.5580.5290.4980.4620.4230.3770.3230.2570.173
α 15 (25%)0.6890.6670.6450.6200.5940.5650.5330.4980.4580.4120.3580.2920.208
α 16 (20%)0.7080.6870.6640.6390.6130.5840.5520.5160.4760.4300.3760.3100.226
α 17 (15%)0.7320.7110.6880.6640.6370.6080.5760.5400.5000.4540.4000.3340.249
α 18 (10%)0.8180.7960.7730.7480.7210.6920.6590.6230.5830.5360.4810.4140.328
α 19 (5%)0.9610.9390.9160.8900.8630.8320.7990.7620.7210.6730.6170.5490.462
Table 3. Relationship between the coefficient of the fractional order model and the battery SOC.
α (SOC)10.90.80.70.60.50.40.30.20.10
Q 1 (95%)6764.894995.593701.962677.471943.051394.941004.62724.90523.43379.37277.40
Q 2 (90%)6612.034933.263561.102610.801883.991356.18980.79704.82508.37368.16269.10
Q 3 (85%)6354.774666.283429.652476.081799.931301.13936.63674.77486.86352.75258.05
Q 4 (80%)6110.804445.503282.412381.901723.121247.80898.23646.97466.62337.86247.33
Q 5 (75%)5786.834289.073111.352272.461642.531186.48854.41616.02444.06321.68235.17
Q 6 (70%)5805.854306.703124.992282.881645.931192.59859.28619.60446.84323.87236.91
Q 7 (65%)5714.464226.743065.942239.941619.711170.04842.43607.98438.43317.73232.45
Q 8 (60%)5566.954103.192975.212174.131571.841135.62818.47590.71425.68308.45225.65
Q 9 (55%)5313.813932.672851.522084.471506.801090.73785.65565.63408.37295.77216.37
Q 10 (50%)5127.953756.522731.281997.651444.121043.29753.19542.31391.52283.81207.71
Q 11 (45%)4912.033603.202613.901912.711382.93999.23721.40519.78375.20271.97199.07
Q 12 (40%)4705.023482.072522.651843.671333.26963.50695.19501.40361.84262.31192.05
Q 13 (35%)4647.453396.712475.851803.531301.79942.60680.14490.39353.92256.53187.80
Q 14 (30%)4445.223251.032373.971728.311248.71904.82652.48470.69339.78246.39180.44
Q 15 (25%)3953.722894.102110.811534.471112.68804.93580.71418.83302.44219.34160.65
Q 16 (20%)3712.562720.421982.601443.311045.15755.65545.35393.28283.97205.92150.82
Q 17 (15%)3421.802509.611831.041331.00965.15697.89503.46363.02262.12190.08139.21
Q 18 (10%)2607.841910.161395.861016.16737.65533.88385.96278.84201.70146.56107.57
Q 19 (5%)1662.631219.92892.37650.39472.720342.75248.09179.50130.0694.6869.63
Table 4. Estimation result of the iterative method (25 C, 0.5C discharging current).
OCV-SOC Method (%)Iterative Method (%)
First IterationSecond IterationThird IterationFourth IterationFifth IterationSixth Iteration
92.0094.0890.4493.3693.3893.3893.38
73.0071.1771.2474.5474.3174.3474.31
54.0052.2155.3552.7054.7254.7054.70
37.0036.2237.6637.5936.5236.5136.51
18.0017.5117.6917.7318.2518.2518.25

