1. Introduction
The lightning impulse flashover performance of insulators is the basis for the external insulation design of transmission lines. The discharge path and the 50% impulse flashover voltage (U50%) are significant parts of the flashover performance. Meanwhile, the electric field around an insulator can affect the discharge formations and then influence its flashover performance. For this reason, the analysis of the electric field around insulators is important for the further study of different flashover performances and discharge mechanisms.
Since the middle of the 19th century, numerous types of insulators have been used in power transmission lines, such as glass and composite insulators. In order to investigate the flashover performance of different insulators in different conditions, a large number of experiments have been performed. However, due to the limits of measuring instruments and the influences of the surrounding environment, these experiments incur high costs and long test periods [
1,
2]. With the development of computer technology, the numerical calculation method for acquiring the electric field has become mainstream [
3,
4,
5,
6,
7]. Many researchers began to study the flashover performance and the discharge mechanism of insulators with the help of electric field analysis [
8,
9,
10,
11].
He et al. discussed the mechanisms of the influences of the electric field on the withstand characteristics of a porcelain insulator, based on the sandstorm experiment and electric field simulation. They proposed that the electric field caused an uneven pollution deposition at different positions on the insulator string, which leads to a change of the insulator withstand voltages [
12]. Qin Hu et al. put forward a shed configuration of composite insulator influence on ice accumulation and electrical field distribution. Larger shed spacing could lead to the improvement of icing flashover voltage [
13]. Tu et al. suggested that nonuniform electric field distribution was a major factor involved in the uneven aging of the composite insulator sheds [
14]. Based on the electric field simulation with three shapes of electrodes and the DC surface flashover experiments with silicone rubber and epoxy resin, Chuan proved that the electric field and gas pressure could influence surface flashover voltage [
15]. Yongxia et al. analyzed the influences of ±800 kV insulator (I-string and V-string) suspending modes on impulse flashover characteristics using electric field simulation and impulse voltage tests. It was proved that the flashover characteristics of I-string and V-string insulators had a polarity effect with switching and standard lightning impulses [
16]. Zhao et al. presented a boundary element method for calculating electric field distribution along the non-ceramic insulators hanging on a three-phase 345 kV transmission tower in clean and dry conditions. They found that the tower structure and the location of the grading ring were important factors in determining the maximum electric field strength of the insulator, while the diameter of the grading ring tubes had a negligible effect [
17]. Hrastnik et al. put forward a new structure of composite post insulators. Their conclusions showed that the composite post insulator with an upper fitting made of insulating material could improve the electric field distribution of the insulator but the influence of the tower structure was not taken into consideration [
18]. To control the maximum electric field strength of the fittings and the insulator surface, Wen-xia et al. proposed that a series connection of glass insulators to the high-voltage end with a composite insulator could improve the electric field distribution effectively and verified their viewpoint with tests. They also presented an optimized corona ring design for long-rod insulators based on their findings on the maximum electric field strength along the insulator surface [
19]. Domínguez et al. obtained the electric field at the surface of the 115 kV non-ceramic suspension insulator and found the optimal position of the corona ring for reducing the maximum electric field. The electric field simulations were performed with the finite element method [
20].
Using numerical calculation, most researchers acquired the electric field distribution along the insulator surface or inside it in different conditions. Their research was aimed at certain types of insulators and studied the environmental factors of flashover performance by using electric field analysis, the method for improving the electric field distribution along the insulator’s surface, the parameter optimization of the grading ring and so forth. Few researchers considered the electric field in the air around the insulator or analyzed the differences in the electric field caused by the insulator material and structure. Furthermore, the research the on direct and quantitative relationship between the lightning impulse flashover performance and the electric field around the insulators have not yet been reported. Some other tests’ conclusions had no simulation results to prove either.
The purpose of this paper is to study the lightning impulse flashover performance of the insulators with different materials and structures in clean and dry conditions and to analyze the reason for the differences in flashover performance by corresponding electric field simulation. The composite and glass insulators were hung on the real 110 kV transmission tower during the test process. The simulation analysis of the electric field around the insulators in the same condition were carried out. The results of the tests and the simulation demonstrate that the differences of the flashover performance of different insulators are caused by the electric field around the insulators and the relationship between the discharge path and the electric field distribution around the insulator and that between U50% and the uneven coefficient of the electric field are explained.
The flashover tests and their results are described in
Section 2. The corresponding simulation modeling and the calculation results of the electric field are described in
Section 3.
Section 4 compares and analyzes the results of the tests and the simulation. The reason for the differences in flashover performance are given. The conclusion section represents the essential findings of the described study.
2. Lightning Impulse Flashover Test
2.1. Test Content
2.1.1. Test Site Layout
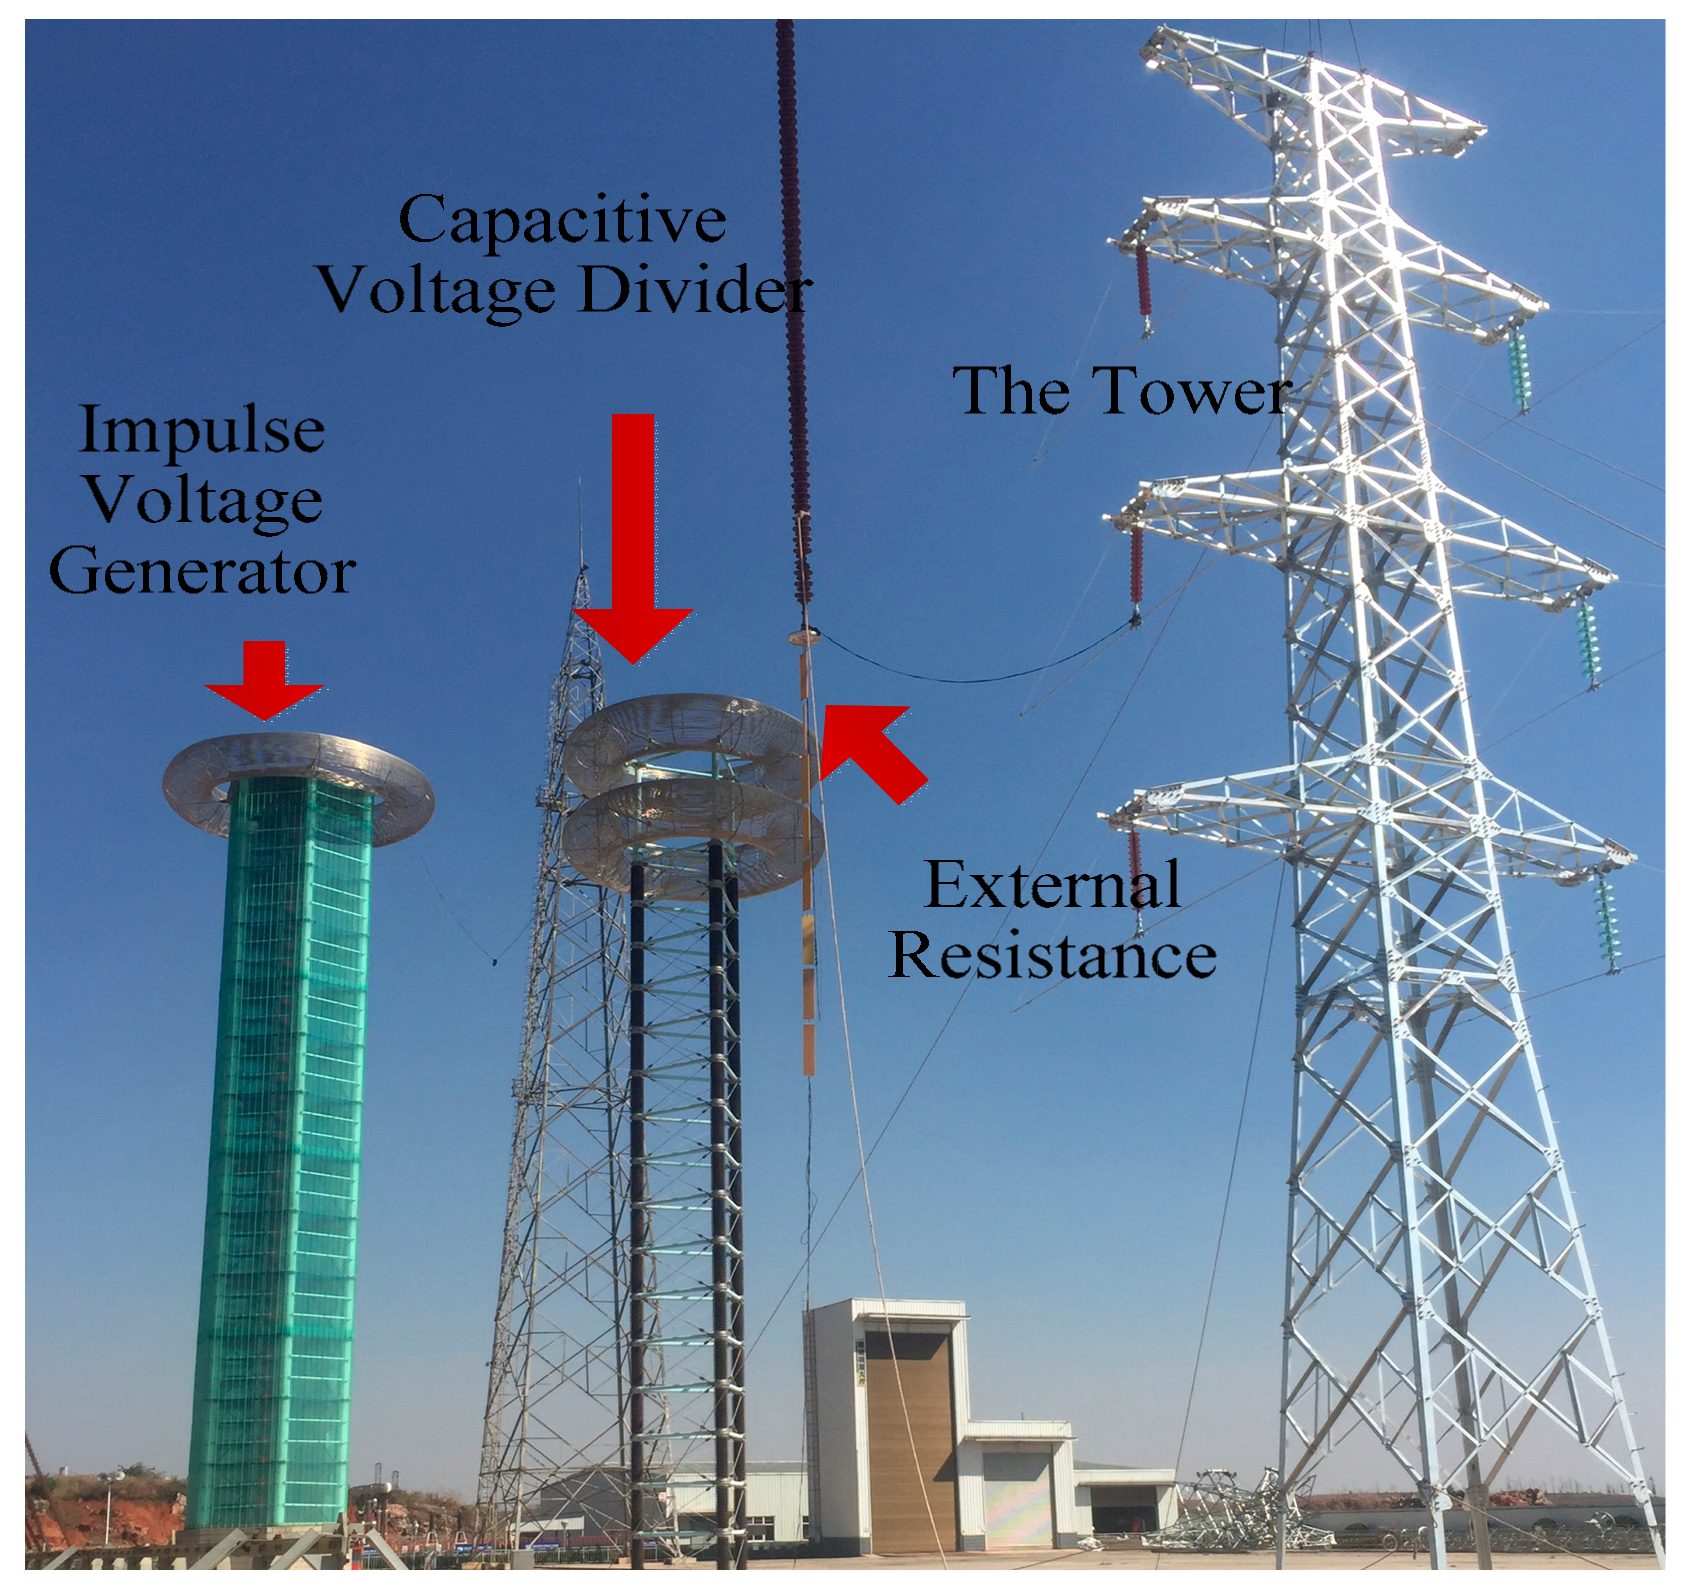
The tests were carried out in the National Engineering Laboratory (Kunming, China) for Ultrahigh-voltage Engineering Technology at an altitude of 2100 m. The test voltage was produced by a 7200 kV impulse voltage generator with the rated capacity of 720 kJ. The efficiency of the generator can reach 55–90% with 1% degree of instability.
The testing tower was built to match an actual 110 kV double-circuit transmission tower. Lightning impulse flashover tests with composite and glass insulators were conducted with a 1.2/50 μs standard lightning impulse voltage. The test layout is illustrated in
Figure 1. The insulator patterns of composite and glass insulators are FXBW4-110/100 and XP-70 respectively. The parameters of the two types of insulators are shown in
Table 1.
2.1.2. Test Method
Standard lightning impulse flashover tests were based on References [
21,
22]. An up-and-down method was applied to 50% disruptive-discharge voltage tests [
23].
The disruptive-discharge voltage of external insulation was related to atmospheric conditions (temperature and humidity). The results were corrected using the g-parameter method mentioned in Reference [
22].
2.1.3. Discharge Image
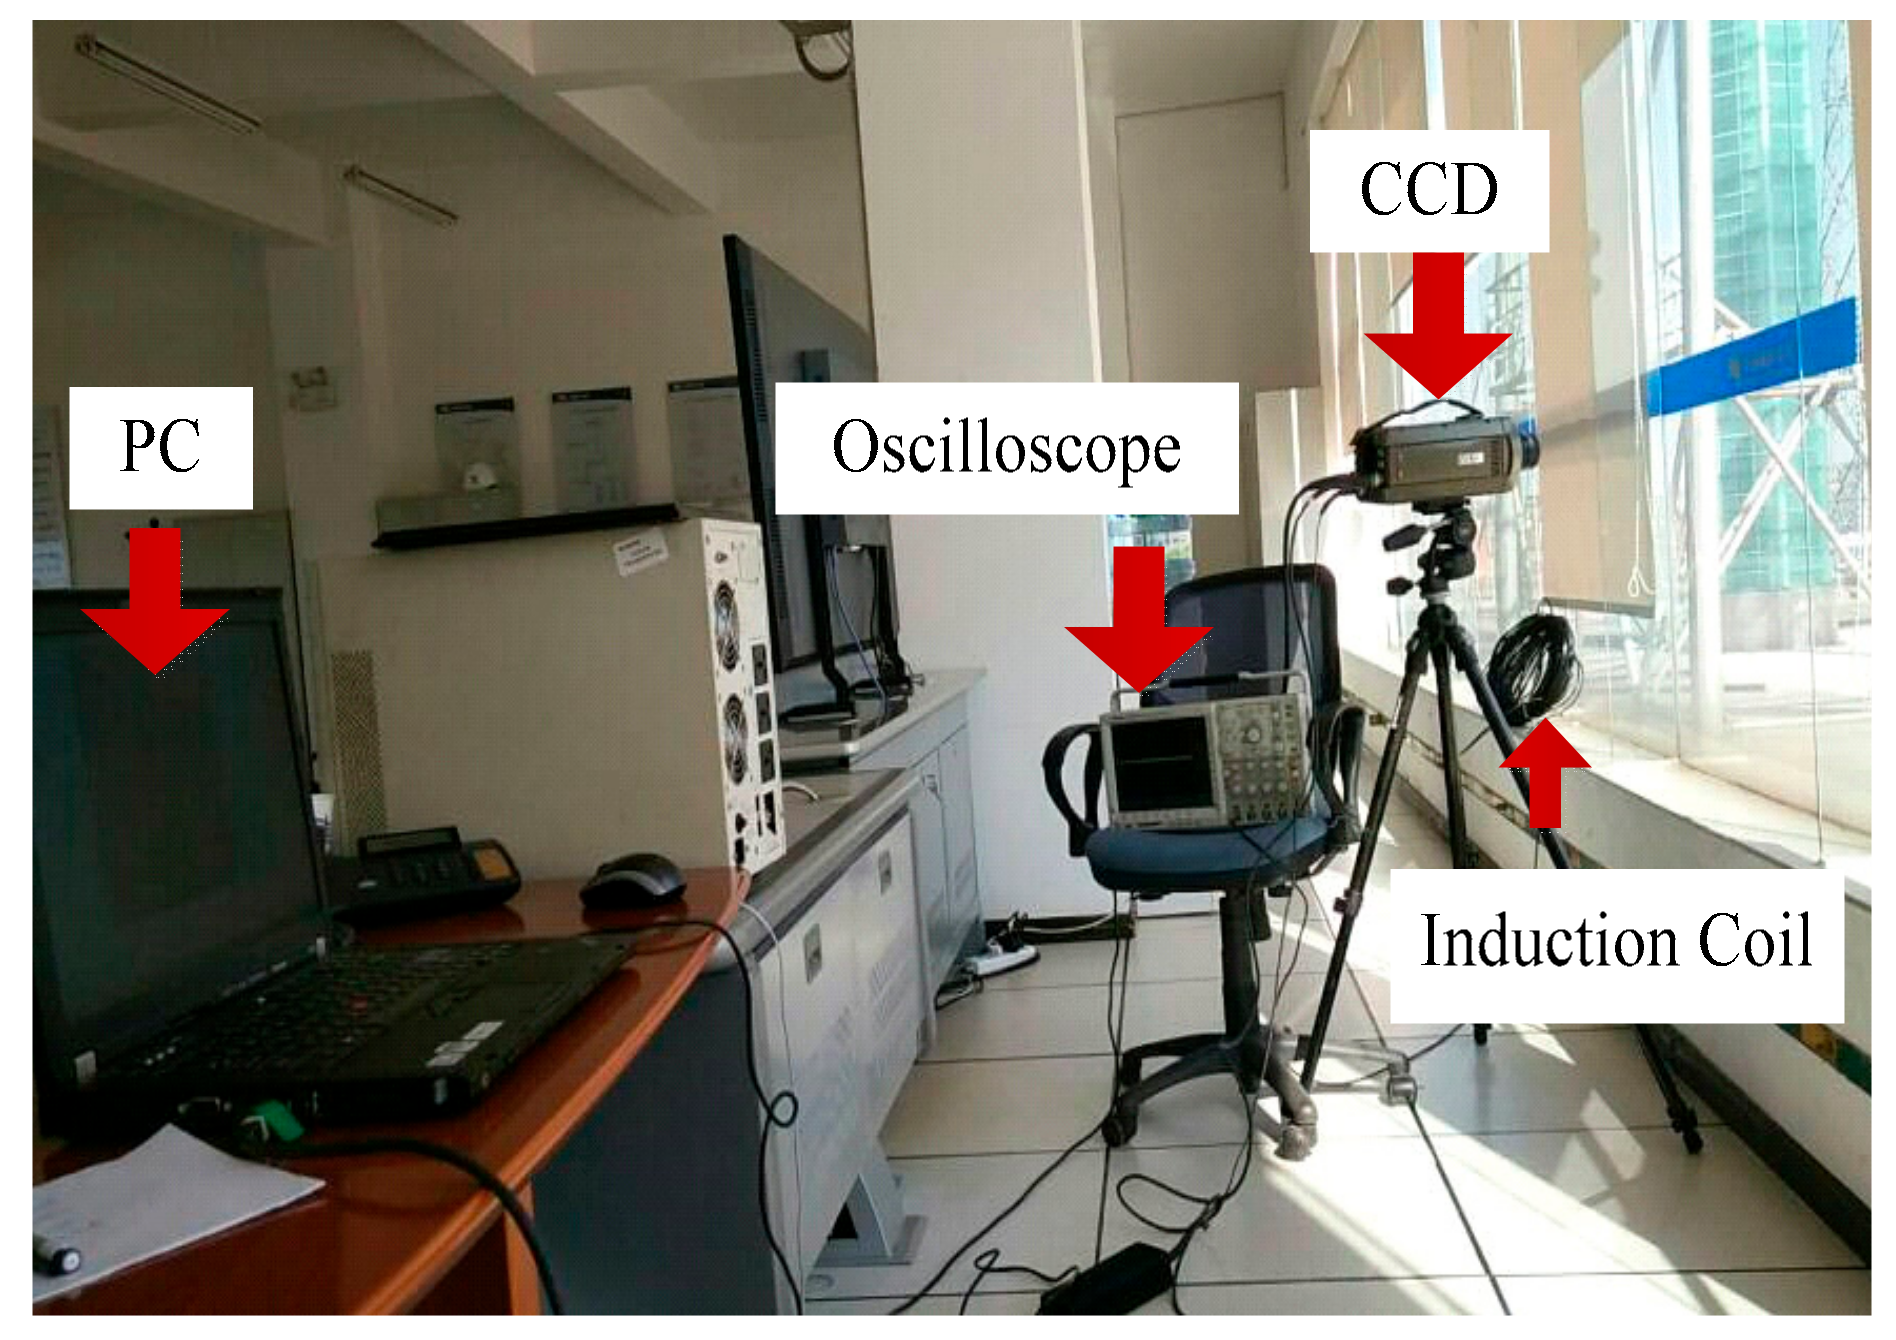
The high-speed camera (CCD) was used to obtain a discharge image. It has a resolution of 128 × 256 pixels and records images at a rate of 130–140 frames/s. The CCD was put in the meter measure cell and an induction coil was connected to the oscilloscope, as shown in
Figure 2. At the moment of the ball-gap breakdown in the impulse voltage generator, the induced current was produced on the induction coil. This current could trigger the camera shutter through the oscilloscope.
2.2. Test Results
2.2.1. Discharge Path
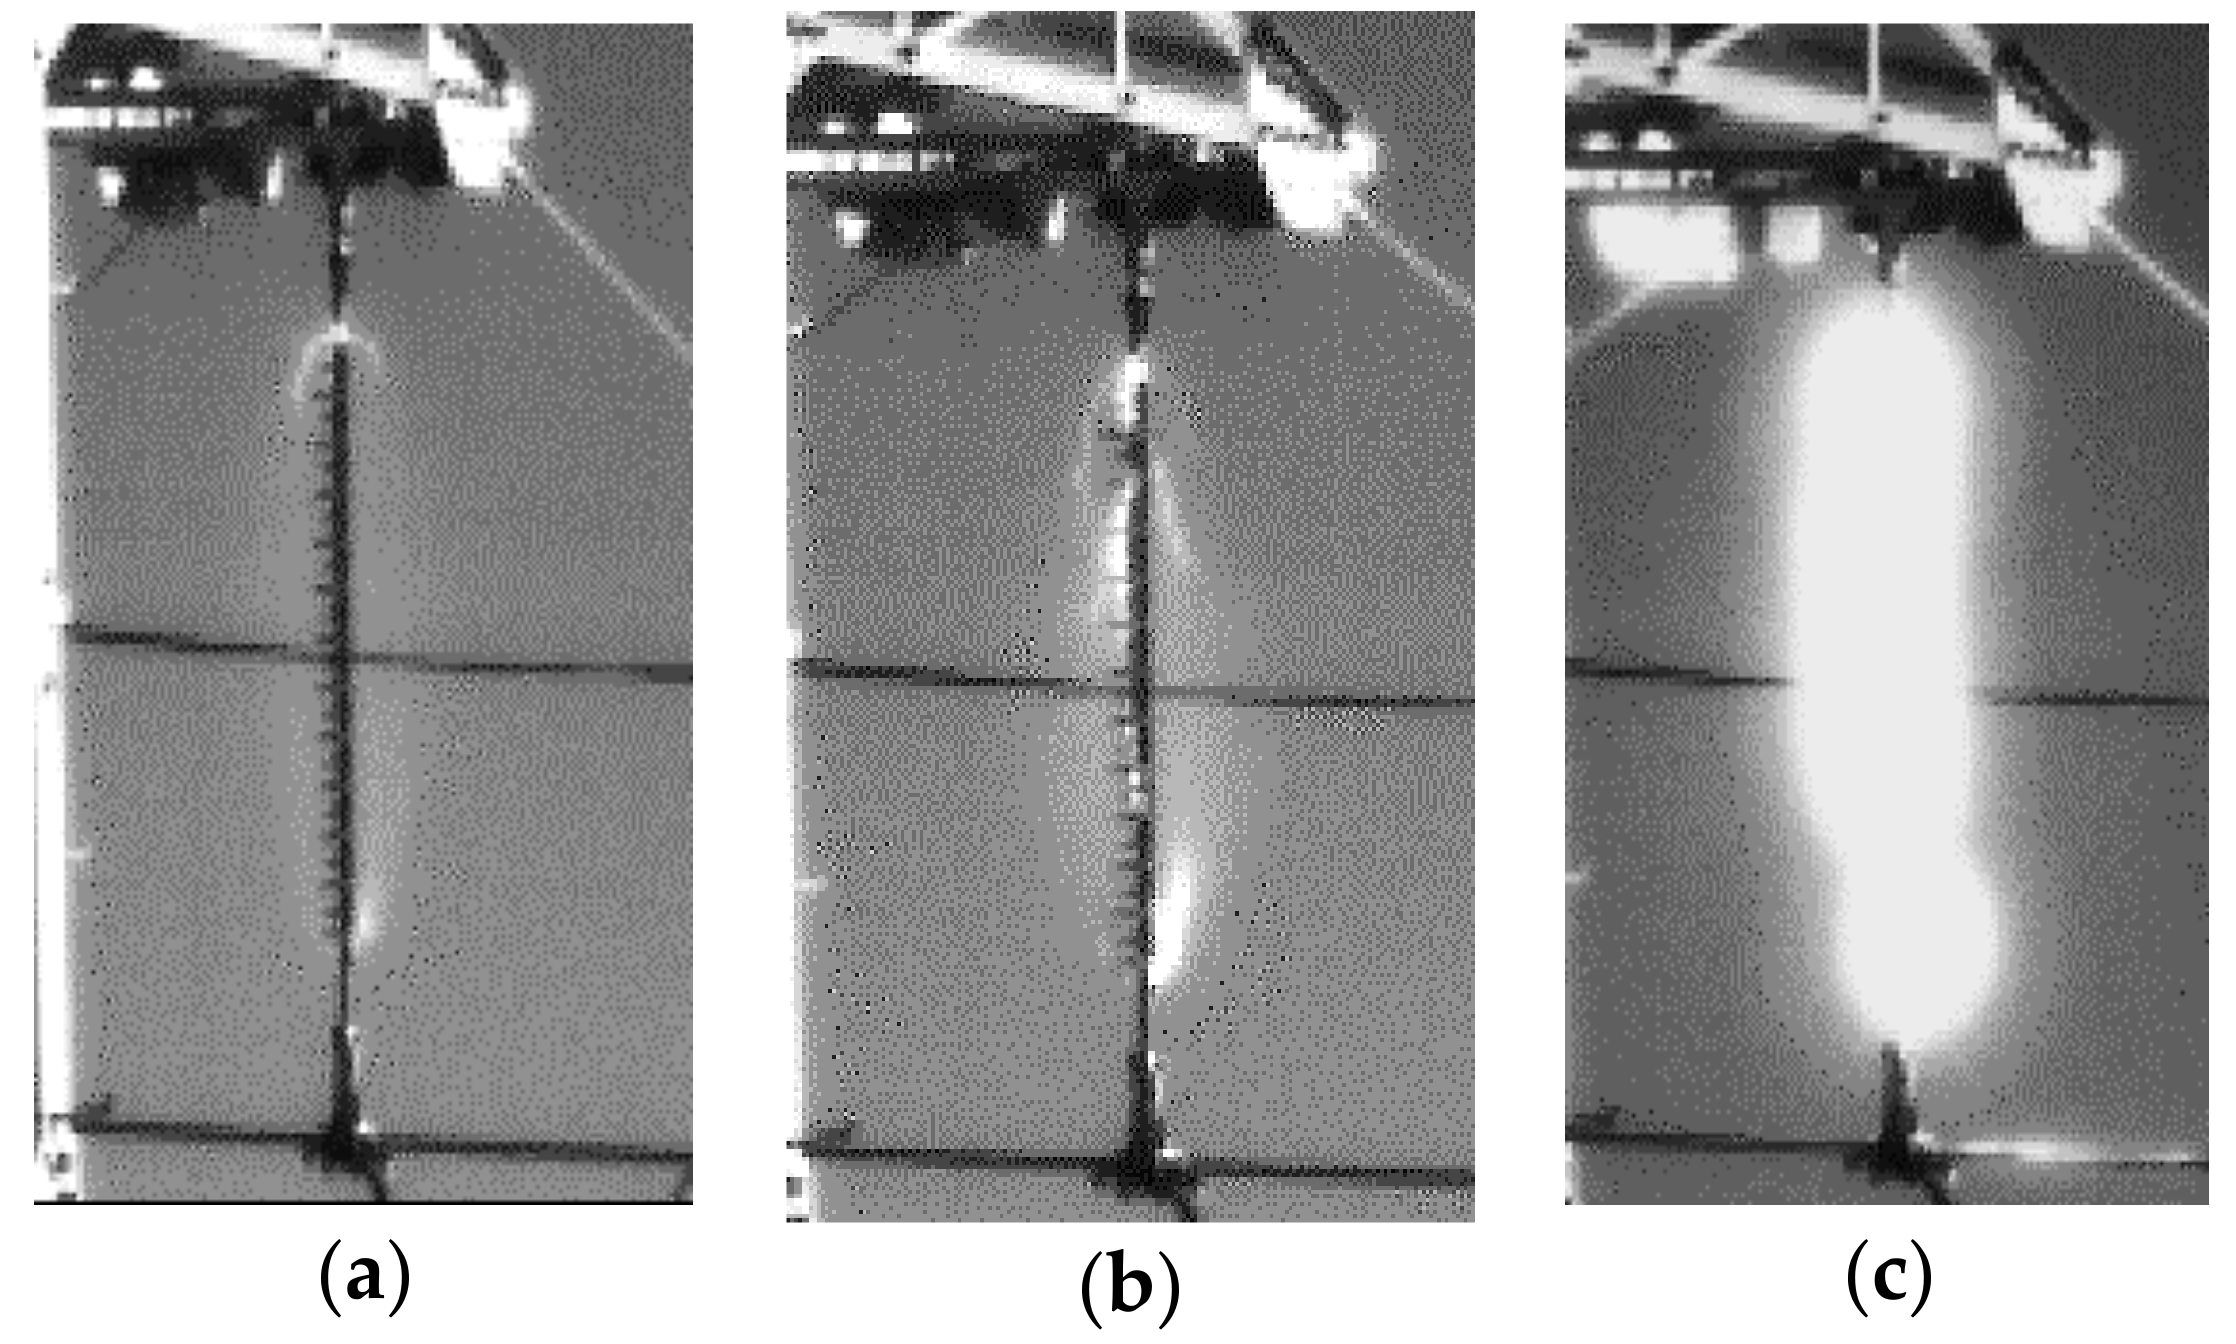
Typical lightning impulse discharge processes of composite and glass insulators are shown in
Figure 3 and
Figure 4 respectively.
Figure 3 demonstrates the first corona, with leaders starting at both ends of the composite insulator and the discharge developing in the air. The development of the upward leader is faster and the light emitted is more intense. About two or three obvious leader branches can be observed. Then, the leaders develop from the two ends of the insulator to the central area until they connect with each other. The flashover channel of the composite insulator is a convex arc and outward slightly in the air around the insulator and the discharge path of the composite insulator is in the air gap.
As shown in
Figure 4, the discharge path of the glass insulator differs sharply from the composite insulator. The situation is more complicated. At the beginning of the discharge, many bright round arcs appear on the edge of the glass sheds near the two ends. Long successive leaders can be noted in the images. In addition, a finer leader may appear at the top (low-voltage end) of the insulator. As a whole, the entire discharge channel is near the insulator surface. There exists no channel in the air far from the insulator surface and the discharge path of the glass insulator flashover is along the insulator surface.
2.2.2. U50%
The
U50% of the three-phase insulators with the 1.2/50 μs standard lightning impulse are shown in
Table 2. The data are corrected for atmospheric effects and the length discrepancy of different insulators.
Table 2 demonstrates that, with the positive and the negative standard lightning impulse, the variation rules of the
U50% of composite and glass insulators are different. Besides the upper-phase insulator, the positive
U50% of glass insulators are larger than those of composite insulators with a maximum difference of 4% but the negative
U50% of the three-phase glass insulator are smaller with a maximum difference of 6%.
3. Electric Field Simulation
Before the formation of a complete discharge channel, the instantaneous electric field around the insulator has a great influence on the discharge initiation and development process. During this period, the discharging arcs are not connected to each other though they develop rapidly and there exists no current between two ends of the insulator. Considering the above situation, the effect of the change of the discharging arcs and the discharging current on the electric field can be neglected. So, the transient electric field can be simplified as an electrostatic field and the rationality of the simplification can be confirmed in the following.
The COMSOL Multiphysics software (COMSOL 5.2, Manufacturer COMSOL Inc., Stockholm, Sweden) is used for the calculation of the 3-D electrostatic field based on the finite element method (FEM). COMSOL Multiphysics is an advanced numerical simulation software and is widely used in scientific research and engineering calculations in various fields. It achieves highly accurate numerical simulations with efficient computational performance and outstanding multi-field bidirectional direct coupling analysis capabilities. While FEM is a great numerical calculation method in COMSOL Multiphysics, based on the variation principle and the subdivision interpolation. Because the boundary value problem of the electrostatic field can be equivalent to the variation problem by the variation method, FEM is selected to solve the electrostatic field problem in this paper [
24].
3.1. Modeling
A 3-D simulation model is created, including insulators, fittings, conductors and a three-phase 110 kV transmission tower in the shape of an umbrella.
3.1.1. Insulator Model
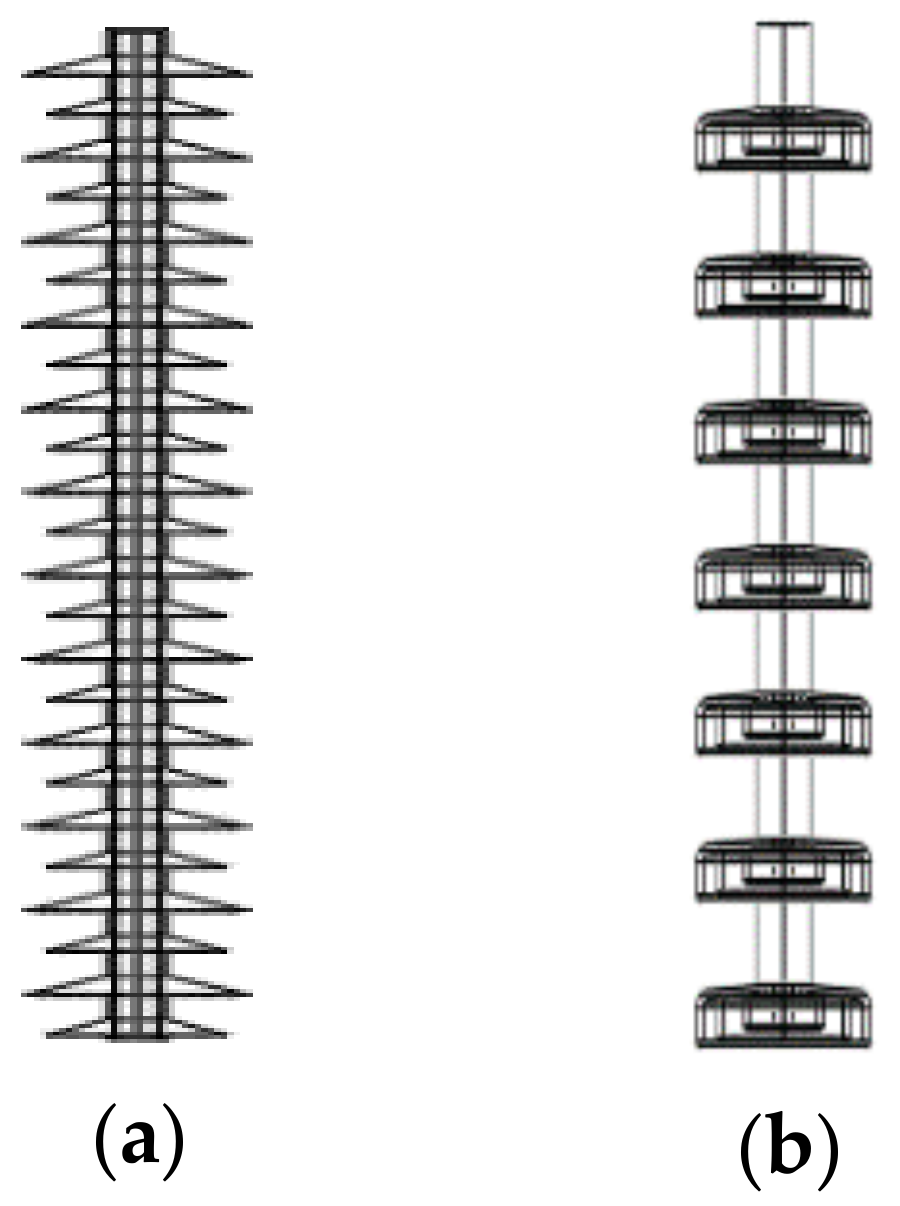
Composite and glass insulator models are created in accordance with insulator patterns FXBW4-110/100 and XP-70. The simplified geometry of the insulators to be modeled for this study is shown in
Figure 5. The composite insulator is made up of a rod core and external insulation layer and their relative dielectric constants are 3 and 3.5 respectively. The sheds of the glass insulator are connected with metal material and the relative dielectric constant of the sheds is 8.
3.1.2. Tower Model
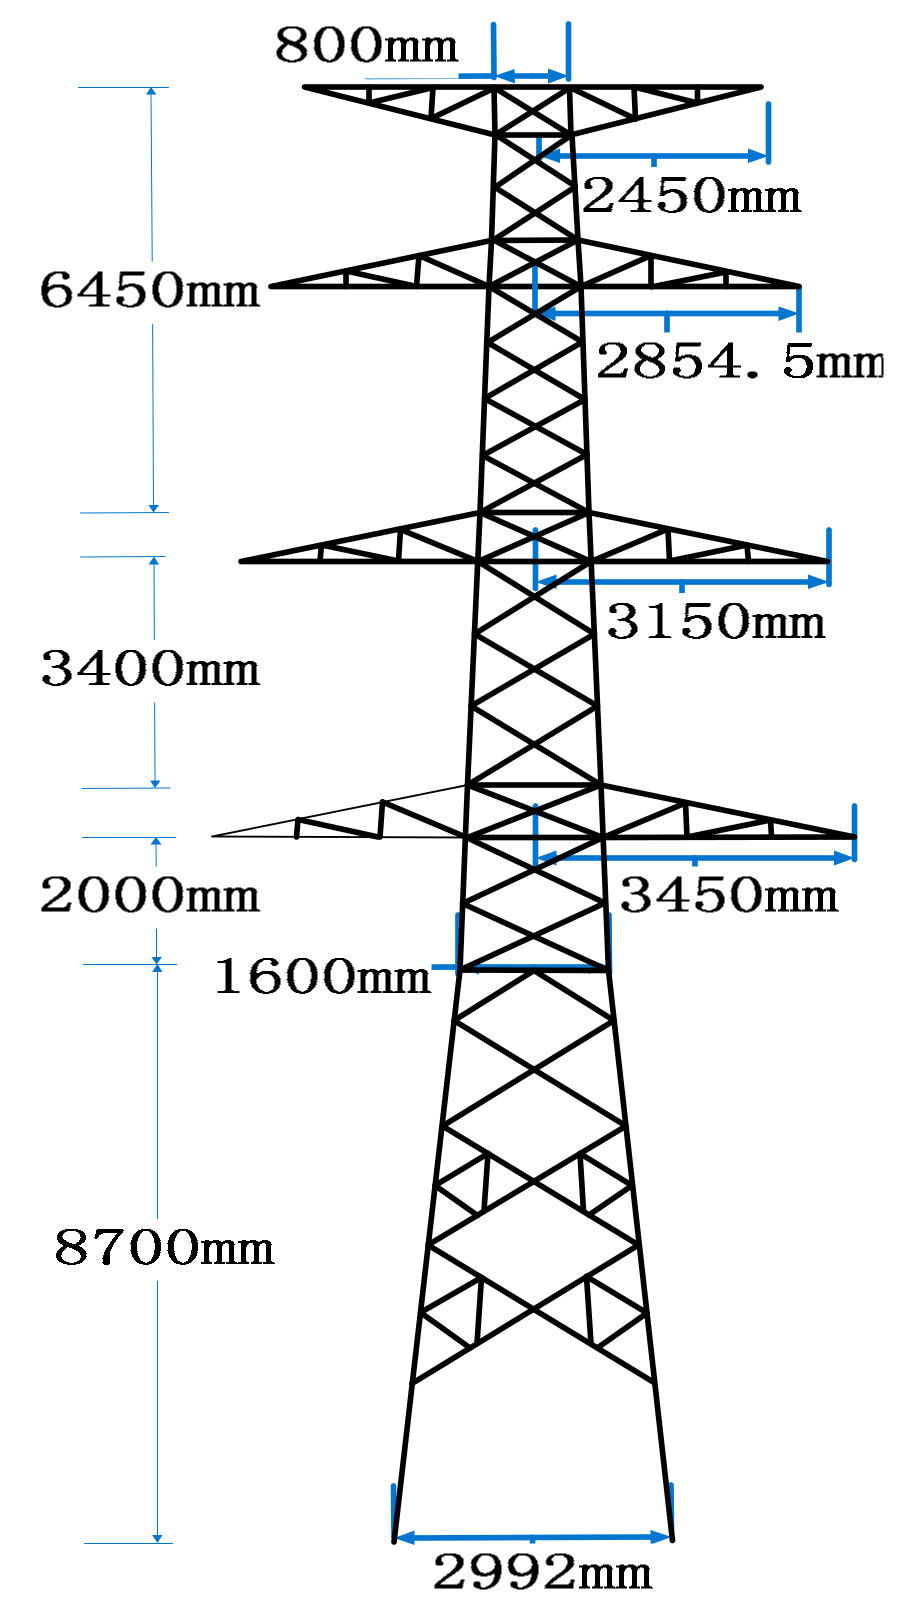
A typical tower model in the shape of an umbrella in a 110 kV double-circuit transmission line was established.
Figure 6 shows the geometry and major dimensions of the tower.
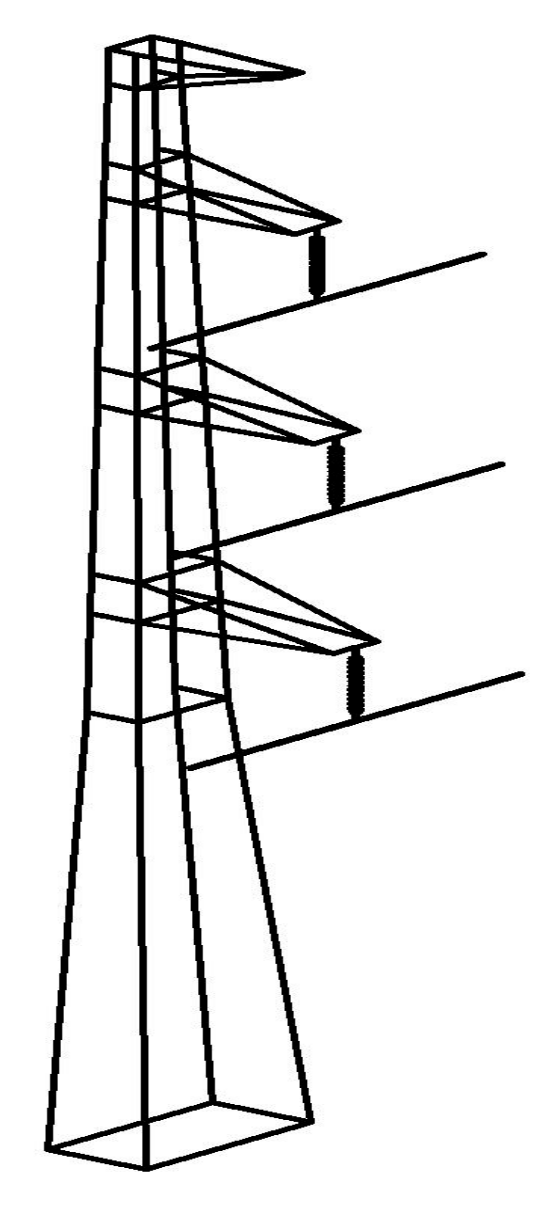
3.1.3. 3-D Simulation Model
Figure 7 shows the simulation model. There are three insulators installed on the three cross arms. The insulators are equipped with metal fittings at both ends. Bottom fittings are connected with parallel wires. Upper fittings are connected with the cross arms of the tower.
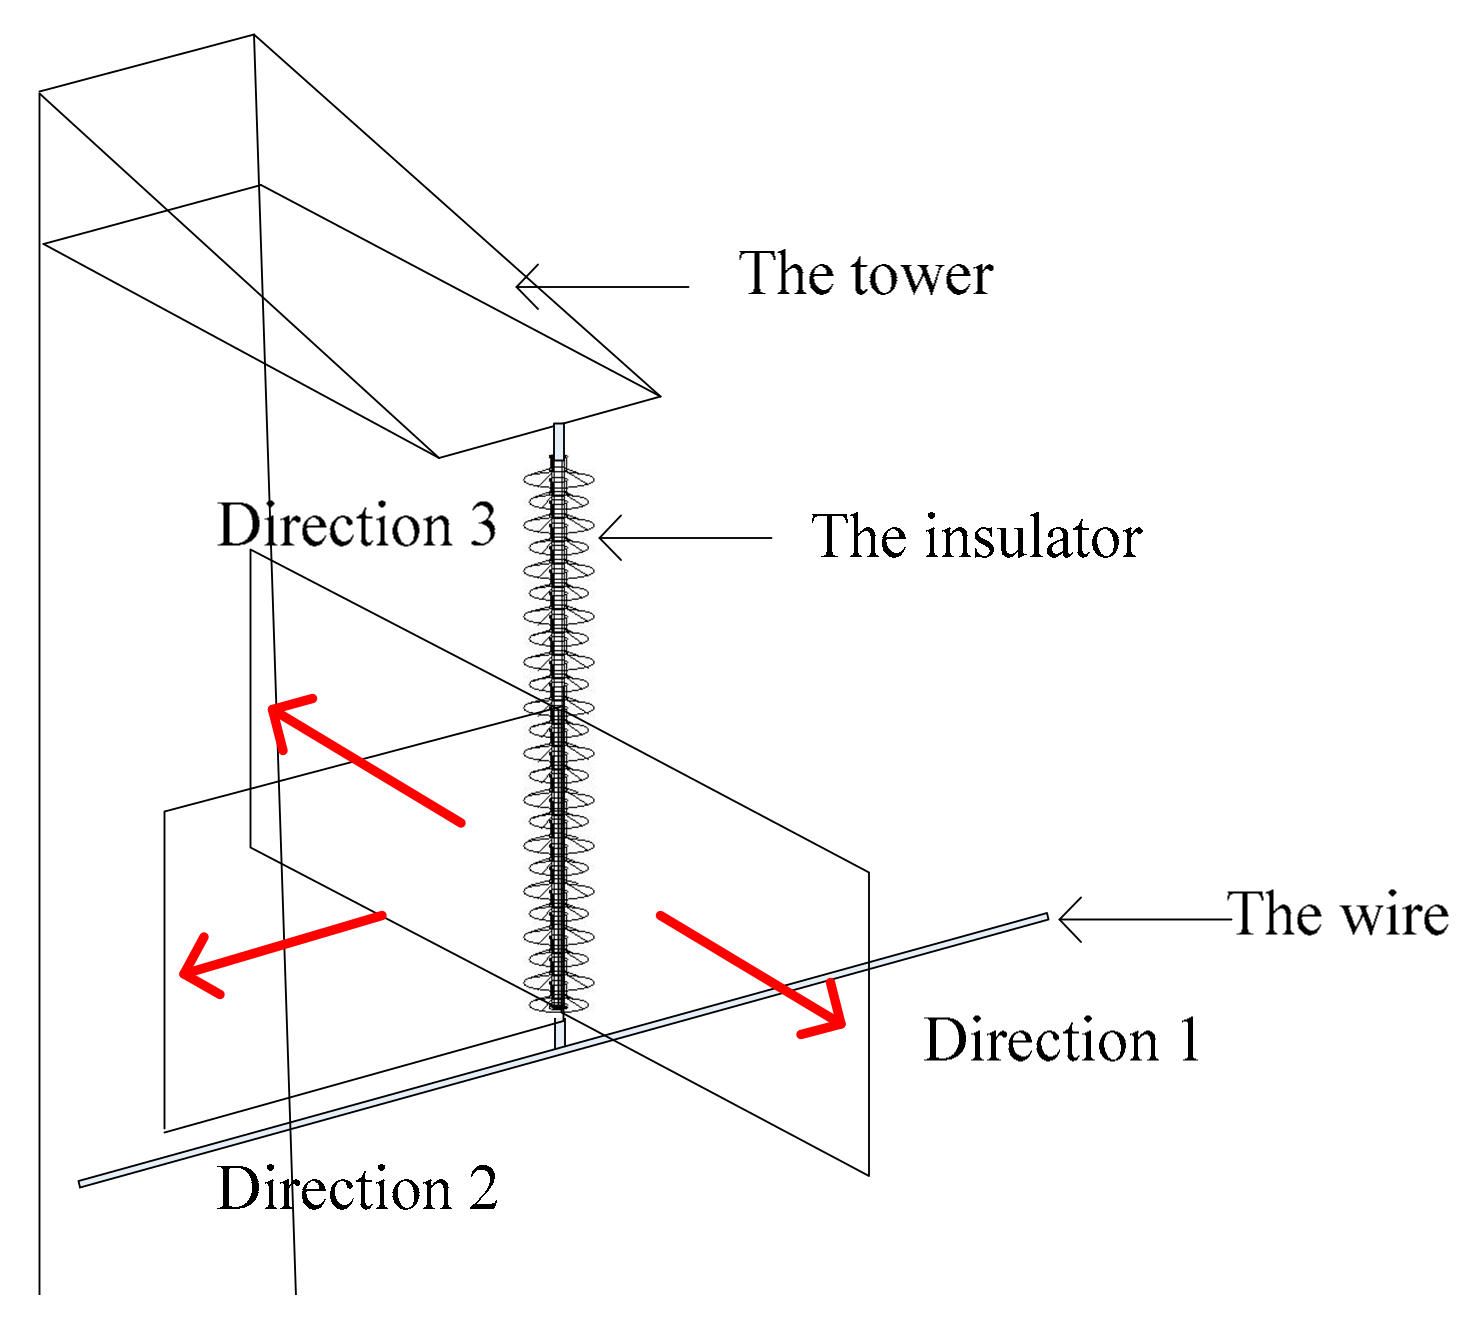
3.1.4. Research Path
In order to analyze the differences in the electric field distribution around different insulators and to illustrate the relationship between them, the electric field distribution along the possible flashover paths should be studied. Considering the symmetry and the distinction of the simulation model, the paths in three typical directions around the insulator are chosen as the possible discharge paths, as shown in
Figure 8. Direction 1 departs further off the tower from the insulator and direction 3 is in contrast to the direction 1—approaching the tower—and direction 2 is parallel to the wires.
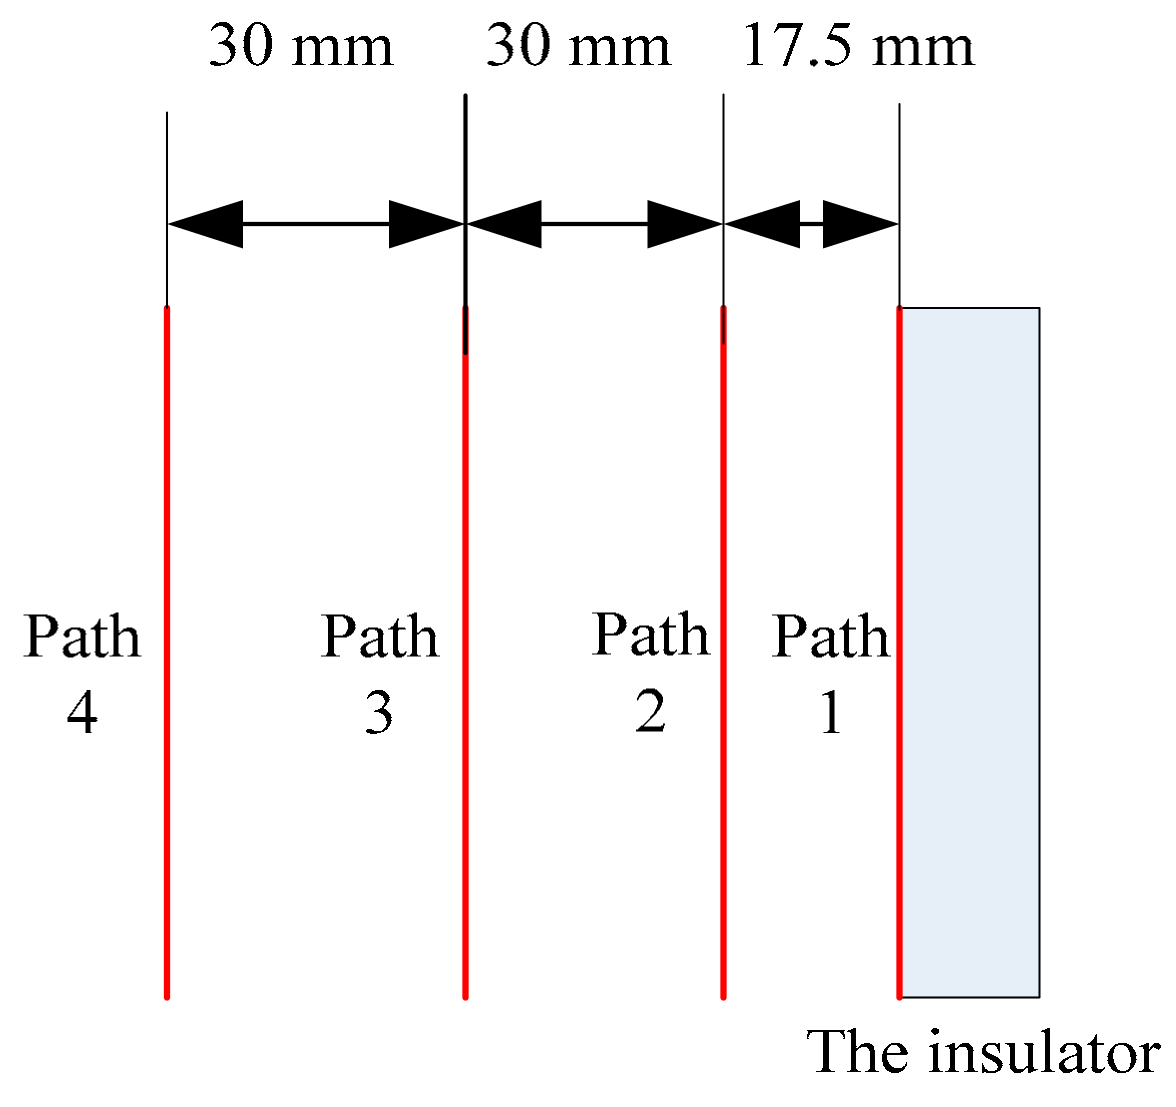
There are four paths with different distances from the insulator surface in every direction, as shown in
Figure 9. The distances of paths 1, 2, 3, 4 to the insulator surface are 0 mm, 17.5 mm, 47.5 mm and 77.5 mm respectively.
3.2. Simulation Results
Considering the similar results of the three-phase insulators, the upper-phase insulator was taken as an example in the paper. In addition, referring to the test data of the U50%, the +800 kV DC voltage source was injected into the bottom fitting of the upper-phase insulator and the wire. The upper fitting and the whole tower were grounded. The results of the electric-field distribution and the uneven coefficient along the hypothesis discharge paths were obtained. The electric field strength was an absolute value considering the electric field in horizontal and vertical directions.
3.2.1. Electric Field Distribution
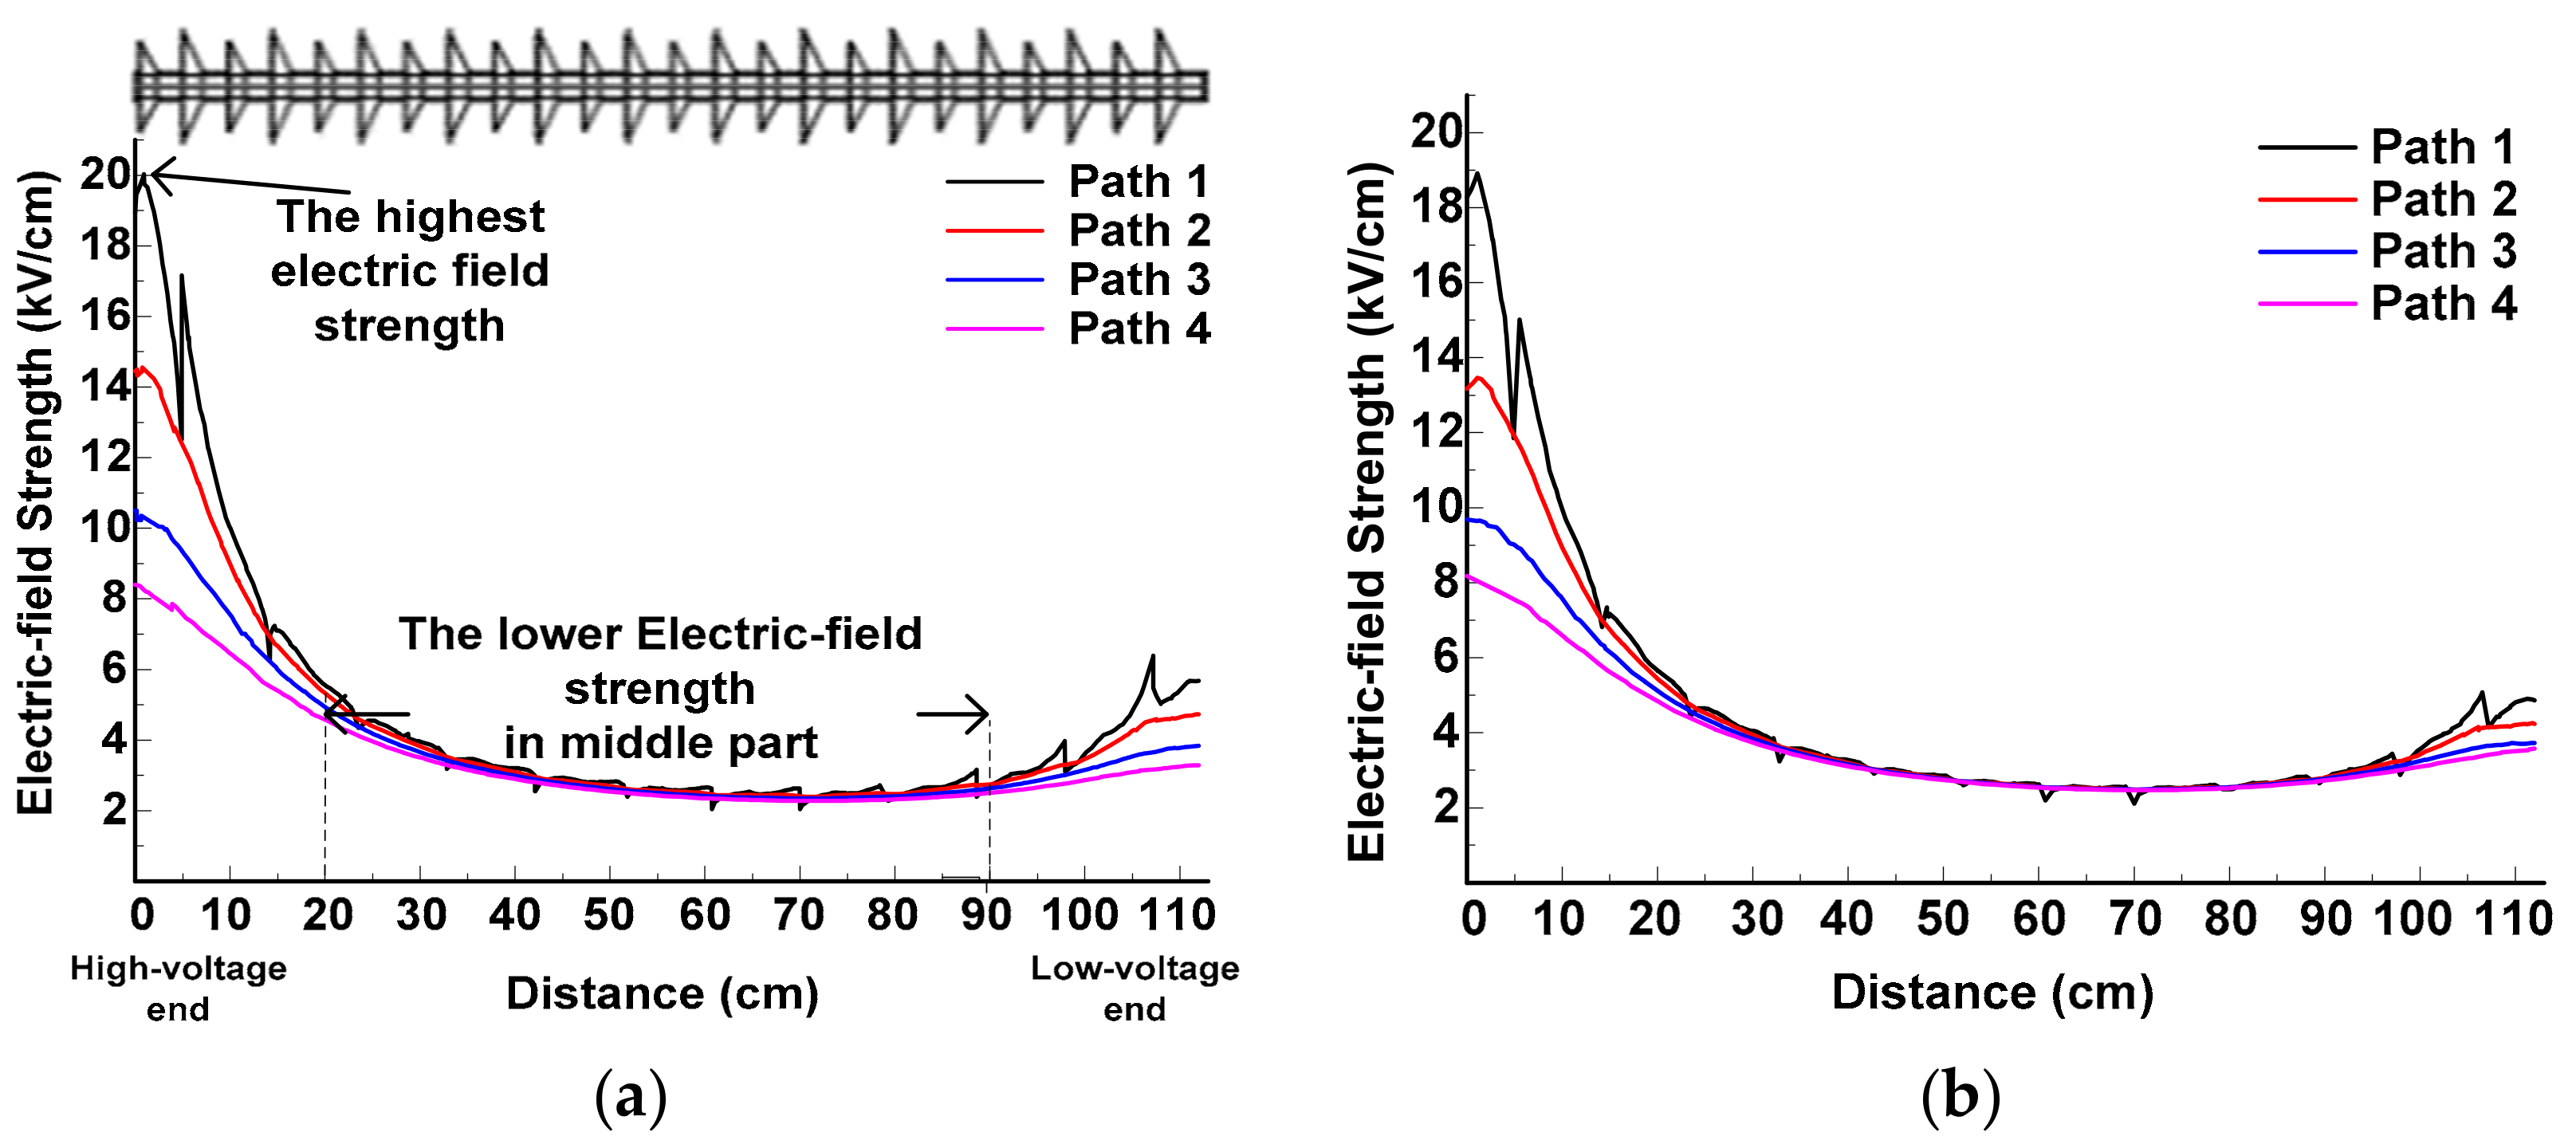
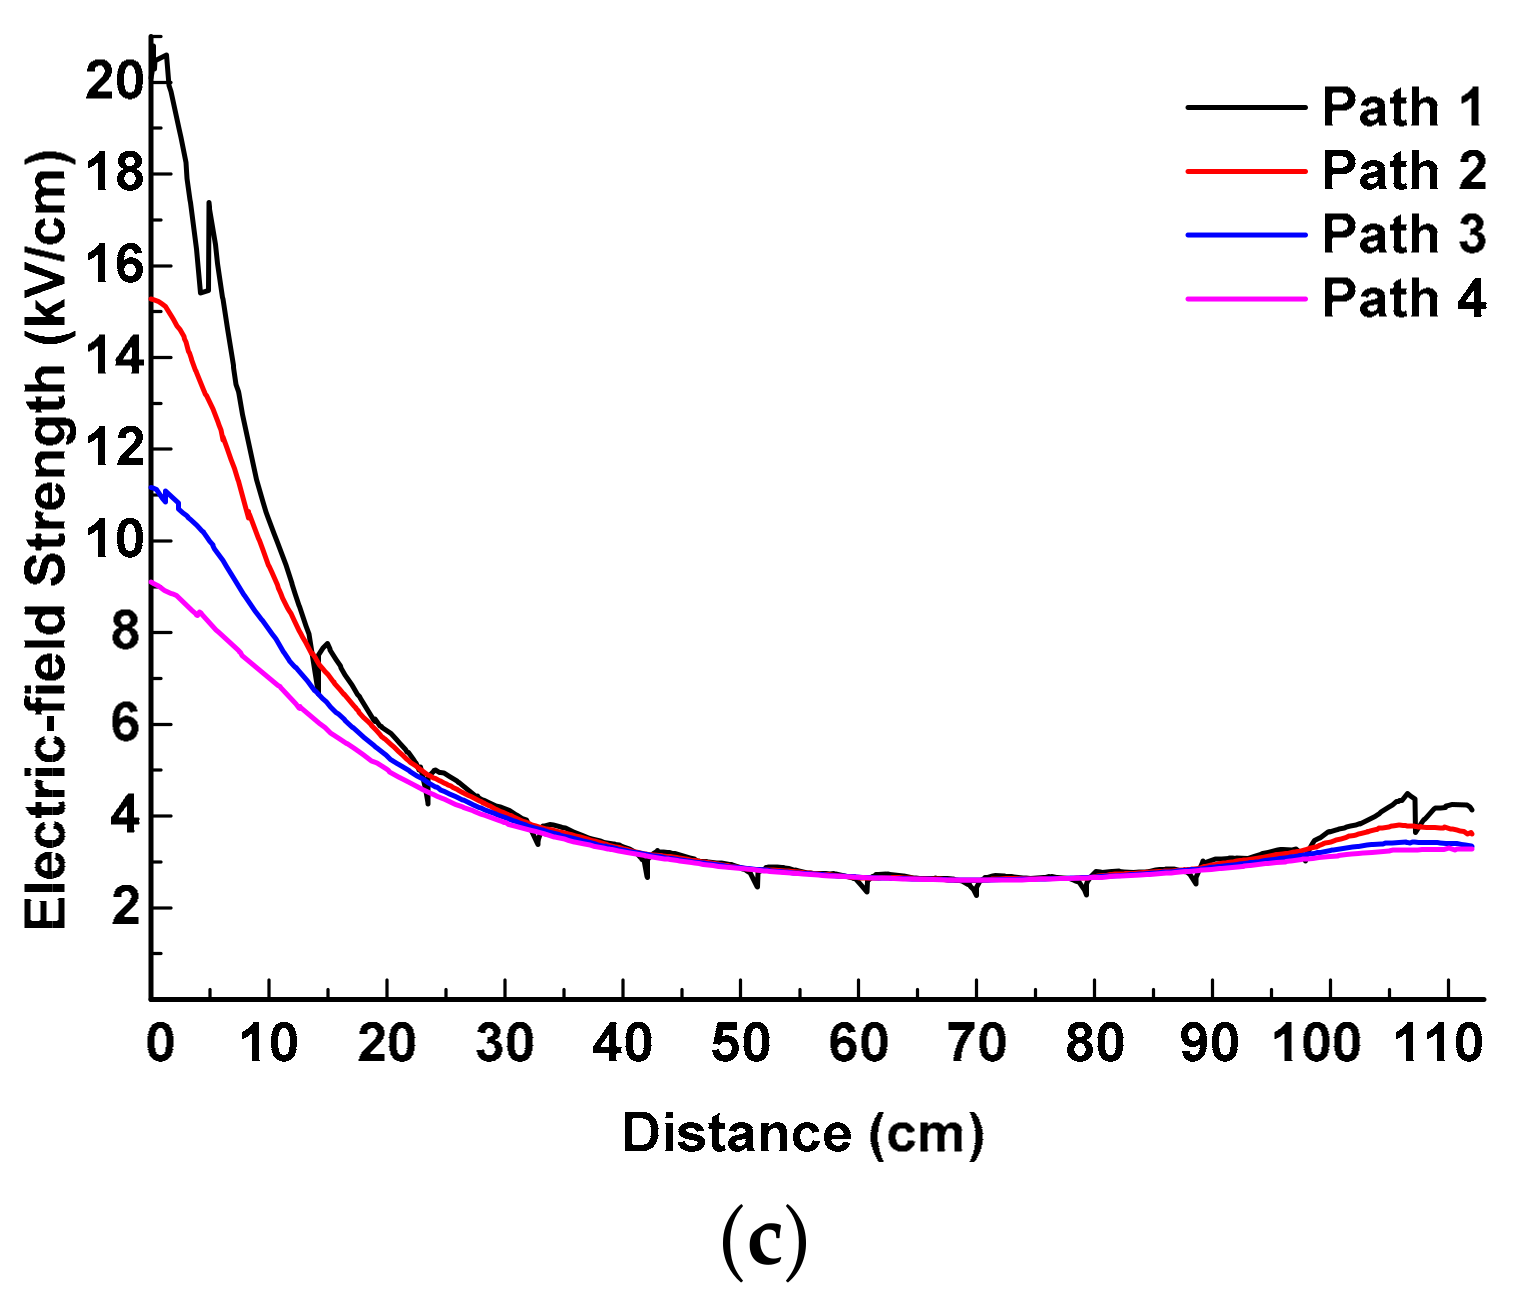
The electric field distribution along the different paths around the composite and glass insulators are shown in
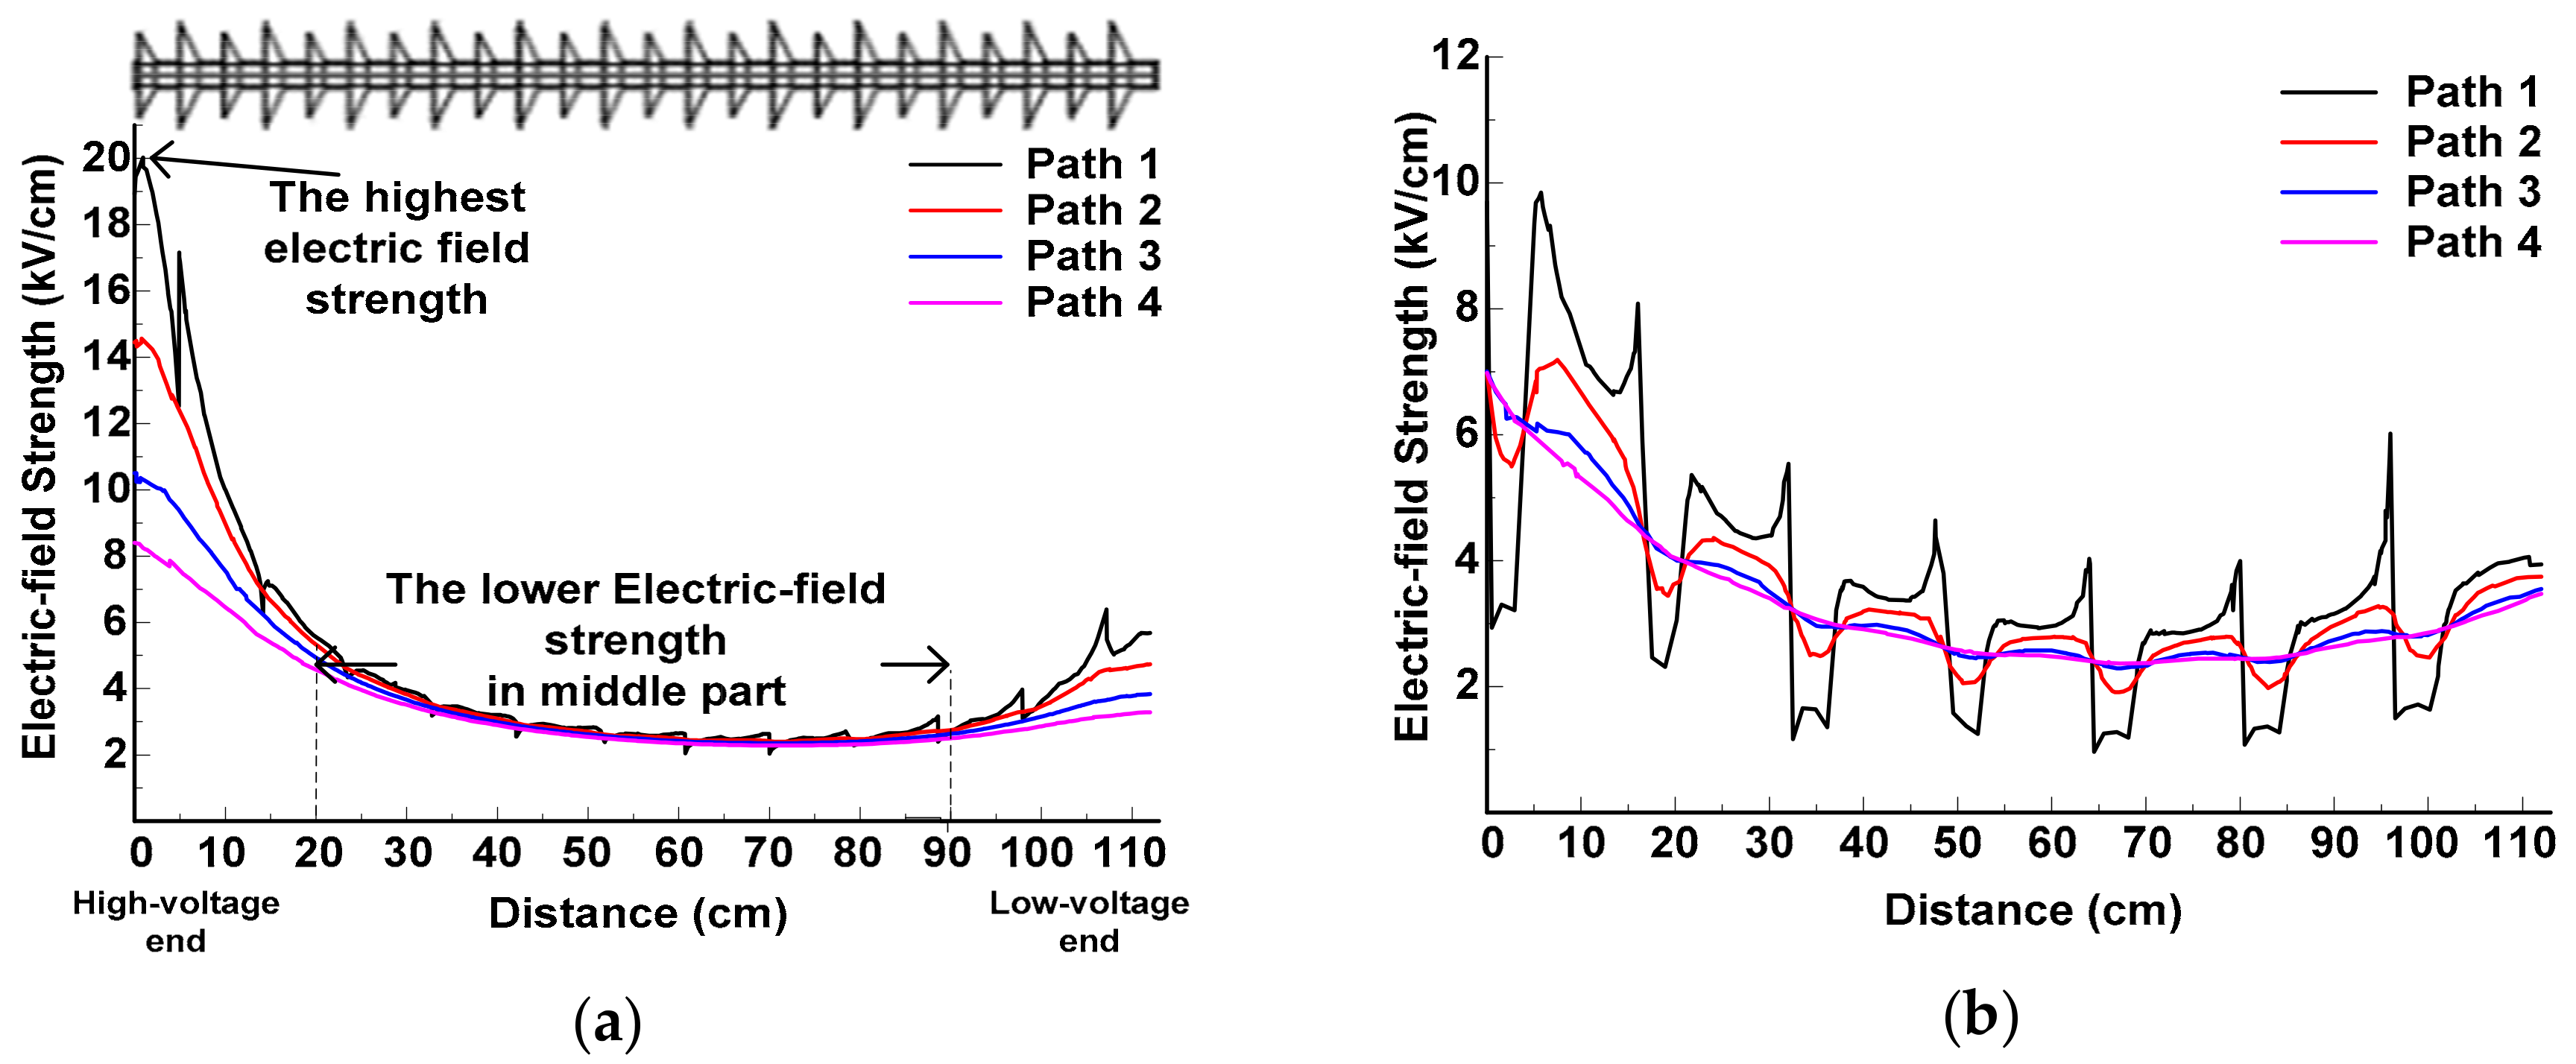
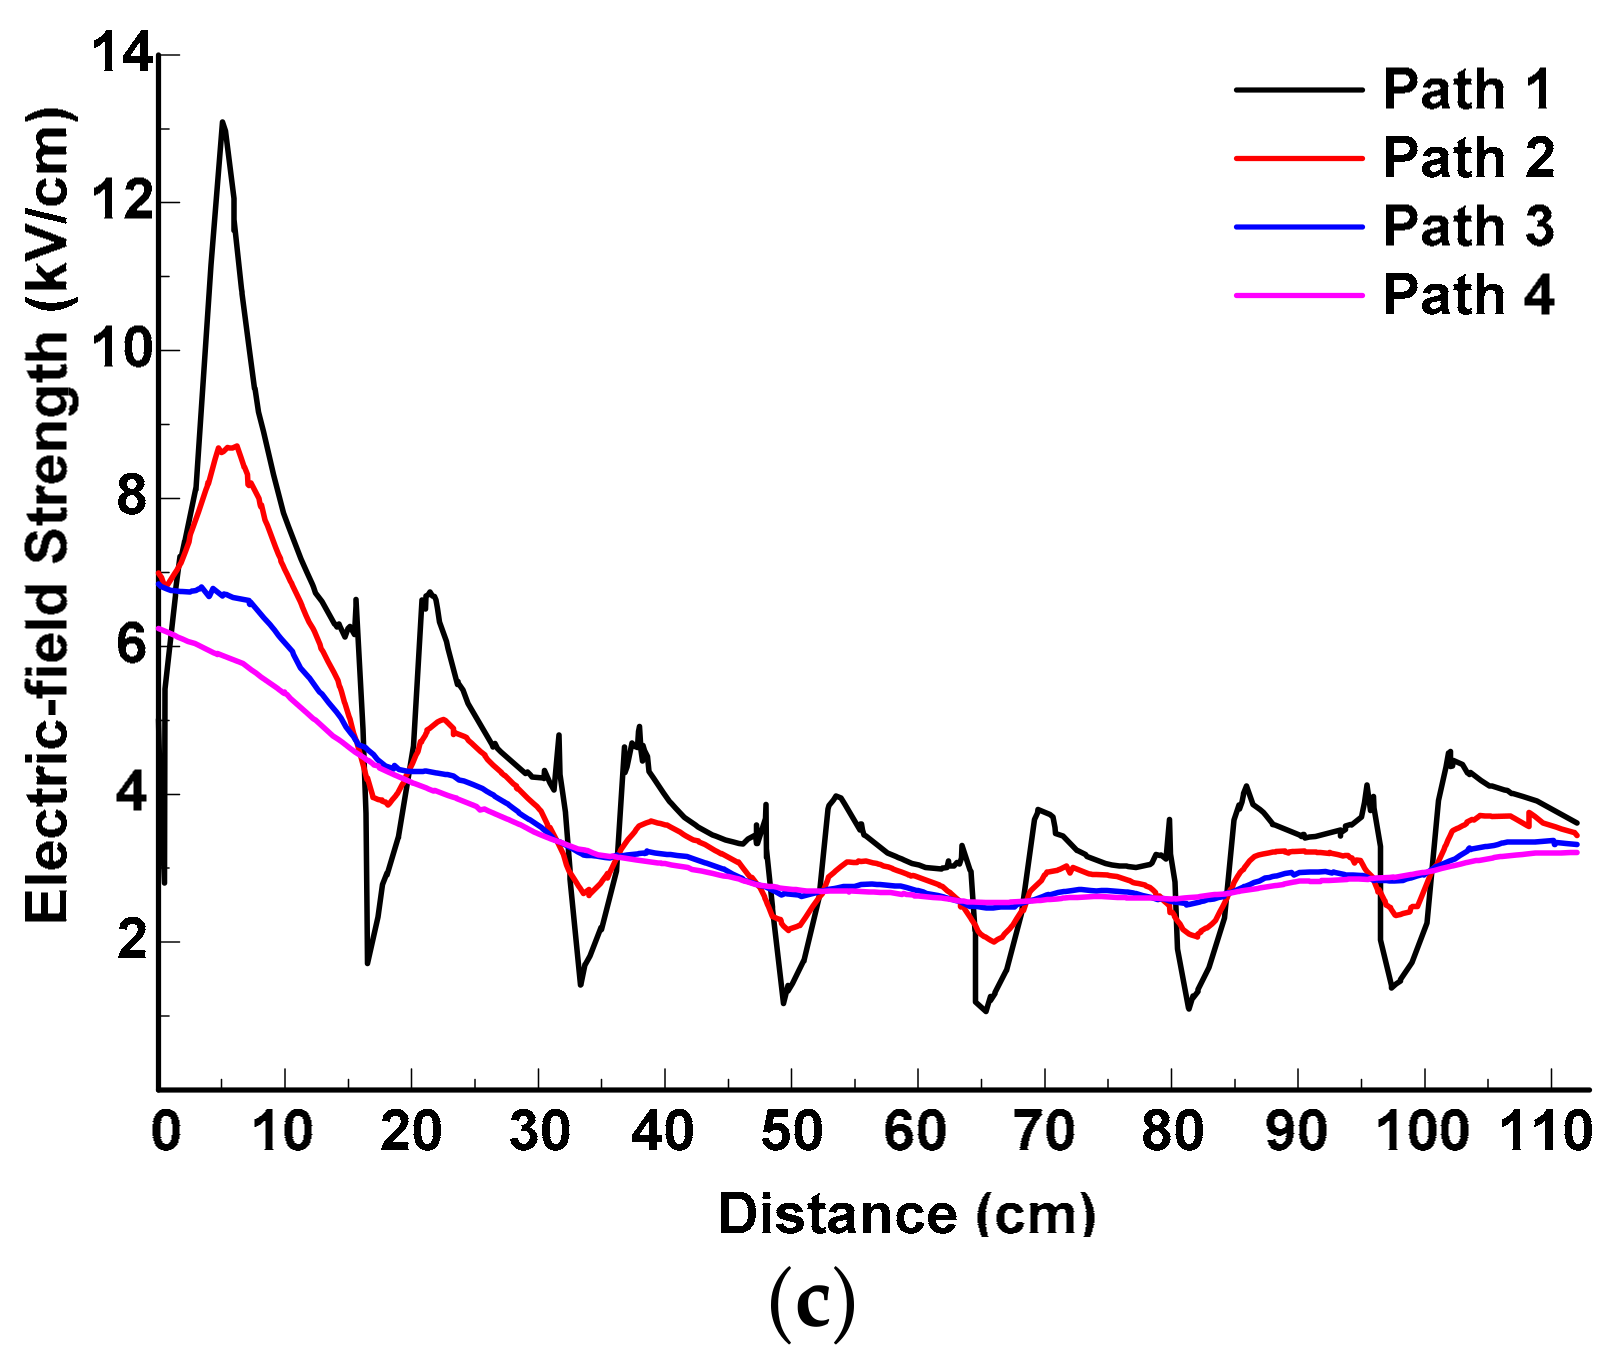
Figure 10 and
Figure 11 respectively. The horizontal ordinate starts from the high-voltage end and ends at the low-voltage end of the insulator.
Figure 10 shows that the electric-field distribution in three directions around the composite insulator is similar and presents a distribution in a U-shape. The highest electric field strength appears at the high-voltage end. At a range of 0–20 cm, the electric field strength decreases rapidly. While the electric field strength in the middle part at a range of 20–80 cm is weaker and its changing rate is smaller. The electric field strength at the low-voltage end is stronger than that in the middle part but still far weaker than that near the high-voltage end. Meanwhile, the electric-field distribution curve along path 1 (the insulator surface) fluctuates slightly because of the influence of the structure and material of insulator sheds. However, the influence on the distribution along the rest of the paths is not obvious, so their electric field distribution curves change gently.
The discharge developing process of the composite insulator can be speculated on through a comparison of the electric-field distribution along the four paths in the same direction. The first corona starts most probably from the surface at both ends of the insulator because the maxima of the electric field occurs at both ends along path 1 and these locations can reach the first corona’s starting condition at the earliest. However, the electric field’s strength at the low-voltage end is lower than that at the high-voltage end, so its corona onset may be later. After forming from both ends, discharge leaders will continue developing along the path with the highest electric field strength. The electric field strengths along the four paths in the middle part are close to each other. So, the leaders seem to develop outwards until the upward and the downward leaders complete the connection in the central area. Therefore, the discharge channel of the composite insulator can be expected to be a convex arc outward.
Figure 11 shows that though the integral trend of the electric field distribution in three directions around the glass insulator is similar to that around the composite insulator but there are still some apparent differences. First, the electric field distribution curves are zigzagged and the electric field strength changes dramatically, especially along path 1. Secondly, multiple maxima and minima of the electric field appear along path 1 and all of them appear at the edge of the glass sheds. The positions of the maxima are at the interfaces between the glass shed and the air and the positions of the minima are at the middle area on the shed edge. Thirdly, the influence on the electric field distribution along the rest of the paths is also quite noticeable. Preliminarily analyzed, the above phenomenon is caused by the material and structural differences between two types of insulators. The composite insulator is coated with insulation material as a layer, while the glass insulator sheds are connected by bare metal conductors.
The discharge developing process of the glass insulator can be assumed. It is most likely to start from multiple locations at the edge of glass sheds near the two ends of the insulator as a result of the multiple electric field strength maxima. After several corona inceptions, leaders need to develop in air gaps between every two sheds to form the whole discharge channel. Due to the impact of the higher electric field strength in the air along path 1 and formed leaders on the edge of adjacent sheds, the subsequent leader cannot develop far away from the glass insulator surface. Eventually, the discharge channel is near to the insulator surface and the apparent inception of the first corona and leaders appear at the edge of the glass sheds near the two ends.
3.2.2. Uneven Coefficient of Electric Field
Table 3 shows the uneven coefficients of the electric field along different paths around the upper-phase insulator.
It reveals that though the electric field strength of the glass insulator along the paths changes dramatically and the differences between the maxima and the minima are great, the uneven coefficients of the electric field around the glass insulator are smaller than those of the composite insulator (4–33%). That is to say, the overall electric field around the glass insulator is more homogeneous than that around the composite insulator.
4. Comparison and Analysis
Comparing the results of the flashover tests and the simulation in
Section 2 and
Section 3, it is found that the discharge path and
U50% of the insulators are related to the electric field distribution around the insulator and its uneven coefficient.
4.1. Discharge Path and Electric Field Distribution
The results of the discharge path in the flashover tests suggest that the flashover of the composite insulator is far away from the insulator surface in the air, while the flashover of the glass insulator is along the insulator surface with multi-point corona inceptions because of the higher electric field at the edge of many sheds. Similar test phenomena relating to the different discharge paths were also recorded in References [
25,
26]. The tests’ phenomena can be explained by the simulation results of the electric field distribution in
Figure 10 and
Figure 11. Therefore, the tests and the simulation results show that insulator discharge path is influenced by the electric field distribution around the insulators.
4.2. U50% and Uneven Coefficient of Electric Field
According to the theoretical analysis of discharge, the discharge in the extremely nonuniform electric field has a polarity effect. As shown in
Table 3, all of the electric field uneven coefficients around the glass insulator are smaller than those around the composite insulator. Considering the factor of an uneven coefficient, the positive
U50% of the three-phase glass insulators should be larger and the negative
U50% should be smaller than those of the composite insulators. The test results of
U50% are in accordance with the simulation results shown in
Table 3. Therefore, the uneven coefficients of the electric field have a critical influence on their
U50%.
5. Conclusions
In order to study the lightning impulse flashover performance of the insulators with different materials and structures and to analyze the reason for the differences in their flashover performances, lightning impulse flashover tests and a simulation of the 3-D electrostatic field were carried out in this paper.
The tests show that because of the different materials and structures, there are significant differences between the discharge paths of composite and glass insulators and the variation rules of U50% with a positive and a negative impulse voltage are also opposite.
The simulation illustrates that the material and the structure of an insulator affect the electric field around it. On the one hand, the simulation results suggest that the maxima of electric field strength appear at the surface of two ends of the composite insulator. The electric field strength in the middle part along the four paths in the same direction are similar and change smoothly while the glass insulator has many maxima of electric field strength. The electric field strength along the four paths in the same direction changes dramatically and has lots of differences at different locations of the paths. On the other hand, the uneven coefficients of the electric field around the glass insulator are smaller than those around the composite insulator.
It is evident from the flashover tests and the analysis of the electric field simulation that the electric field distribution can affect its discharge path. The discharge path of the composite insulator is in the air gap far from the insulator surface while that of the glass insulator is along the insulator surface. Moreover, the uneven coefficient of the electric field can affect the U50%. Due to the polar effect, the positive U50% of the three-phase glass insulator are larger and the negative U50% are smaller than those of the composite insulator.
This paper verifies that there are considerable differences in the electric field of insulators with different materials and structures and the electric field will affect the discharge path and U50% of insulators in practice. But the insulator flashover performance with different impulse voltage waveforms remains to be further analyzed. Subsequent research can analyze the flashover processes with different impulse voltage waveforms and its physical mechanism from the angle of the discharge micro-mechanism combined with the dynamic development of the discharge process.

 ,
, 


