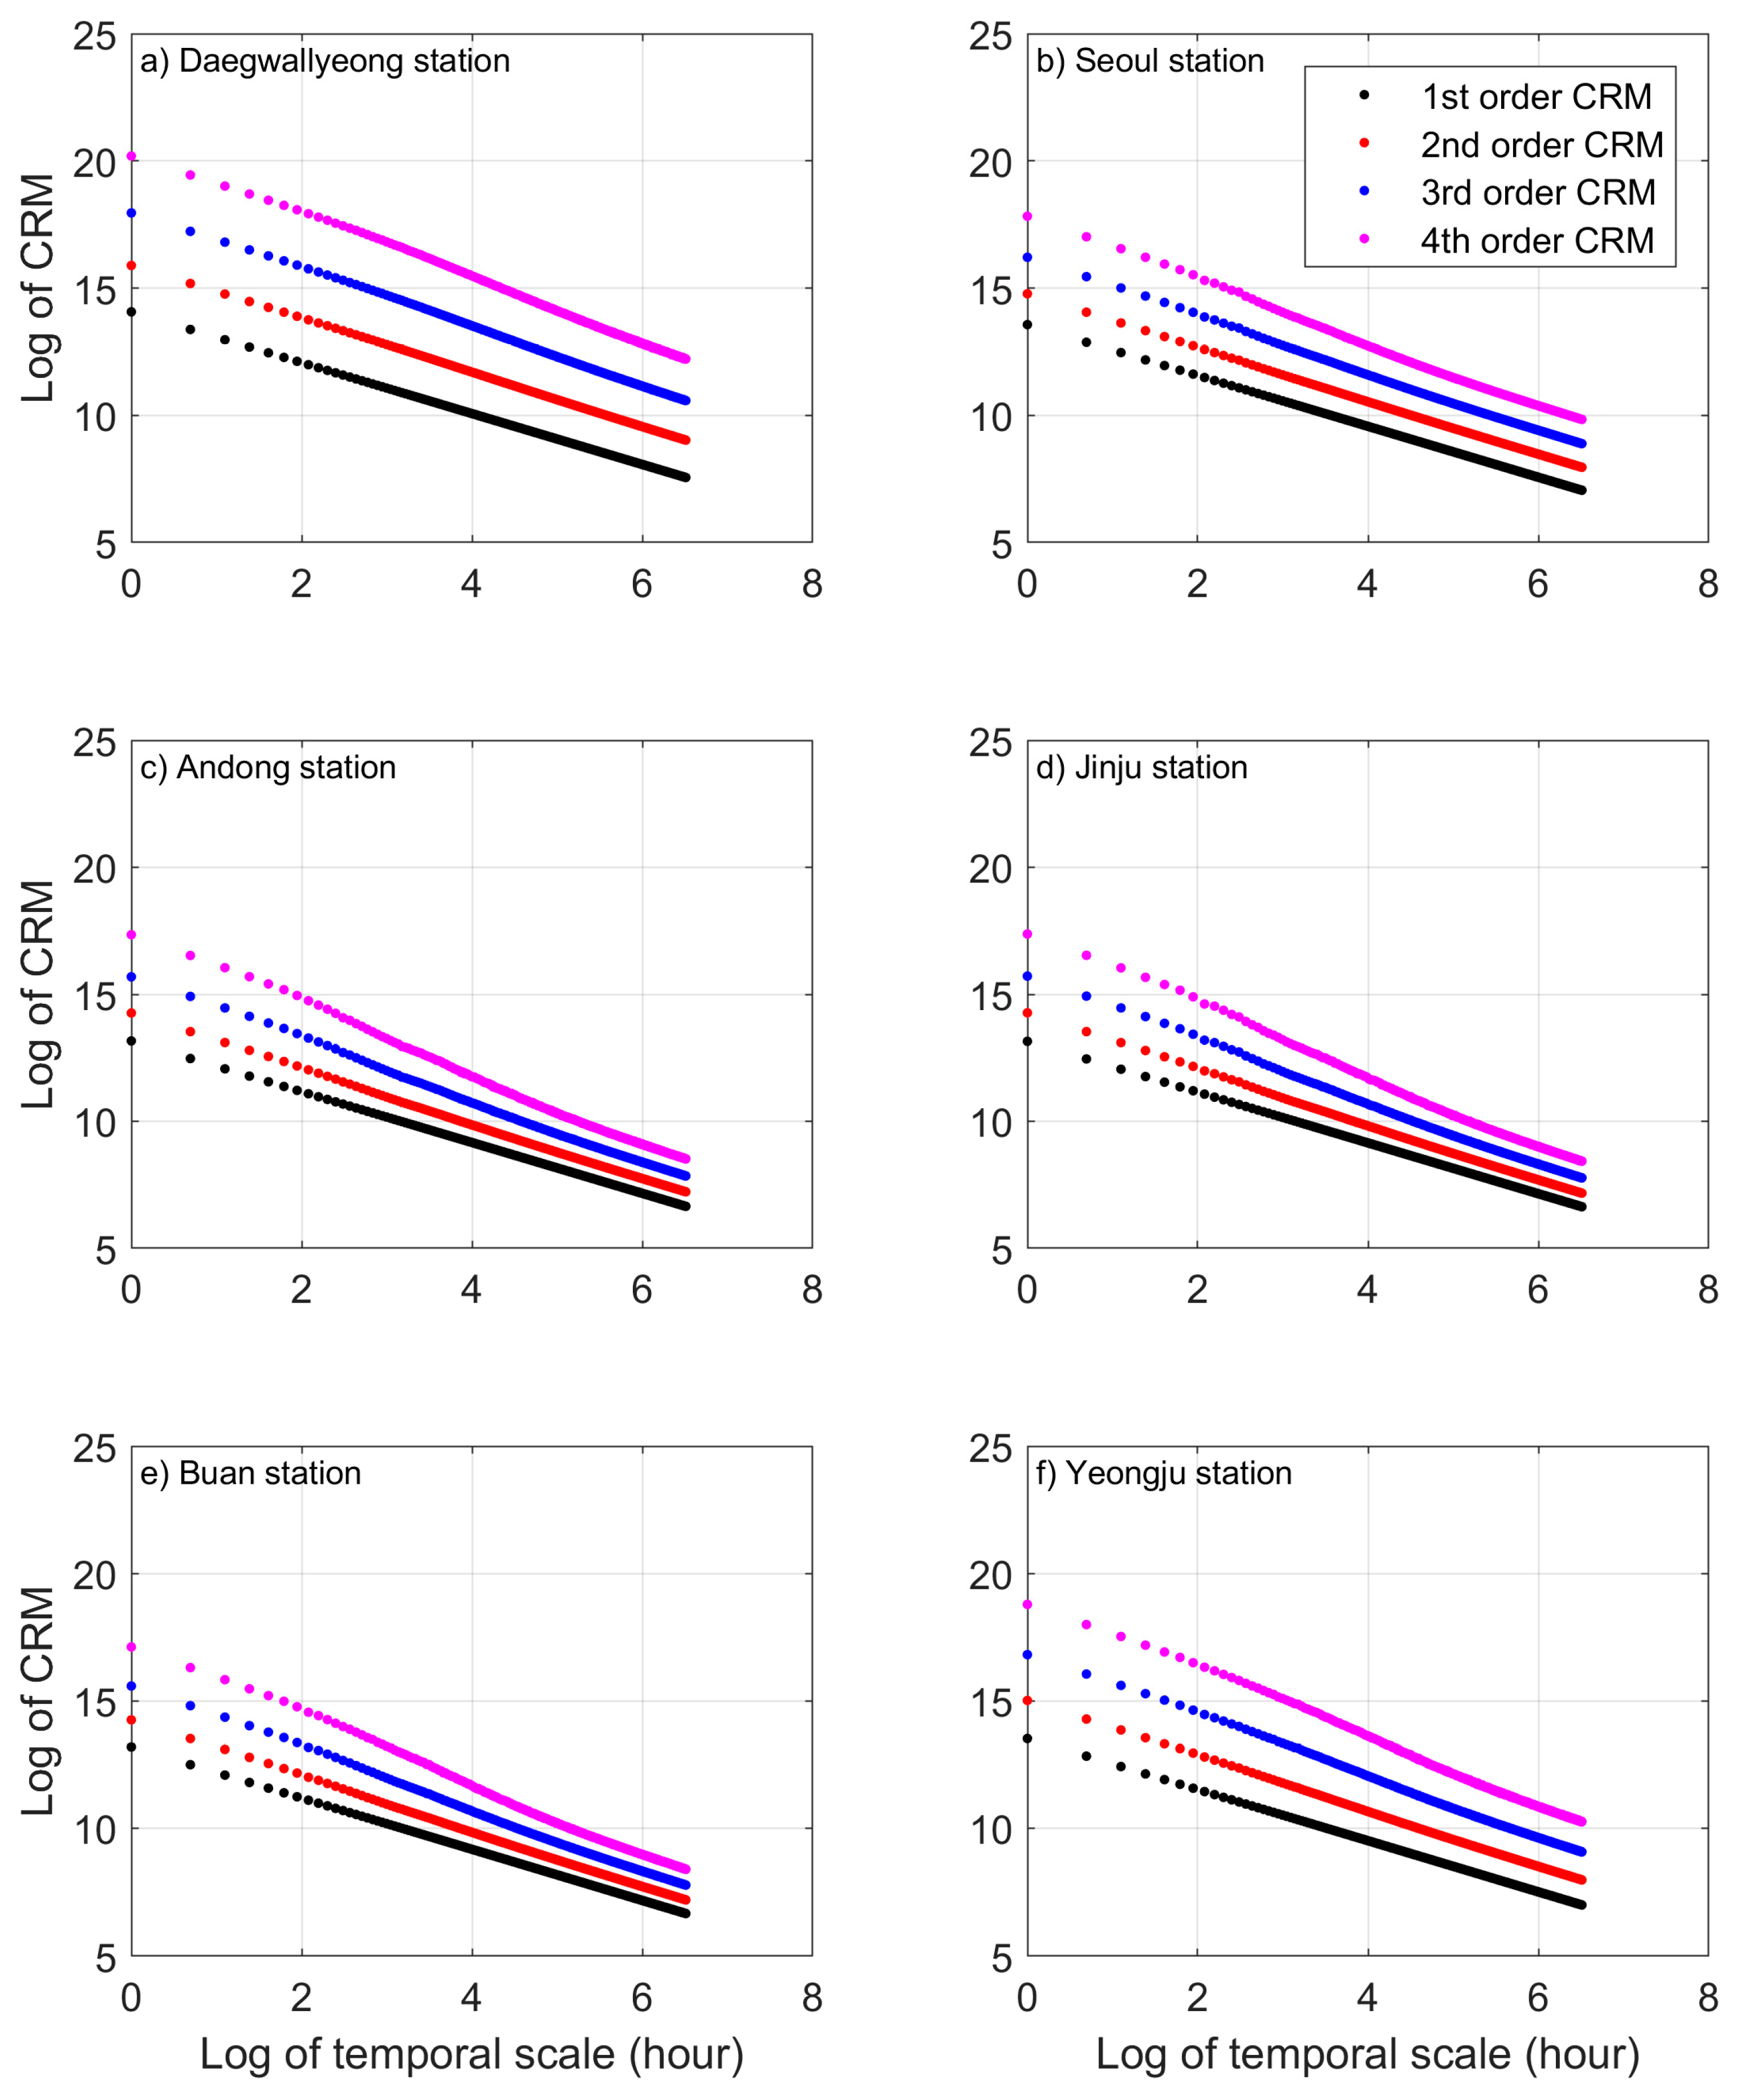
Figure 1.
Plot of the log of the CRMs of wind speed and log of the temporal scales for the 1st- to 4th-order CRMs of six stations: (a) Daegwallyeong, (b) Seoul, (c) Andong, (d) Jinju, (e) Buan, (f) Yeongju stations.
Figure 1.
Plot of the log of the CRMs of wind speed and log of the temporal scales for the 1st- to 4th-order CRMs of six stations: (a) Daegwallyeong, (b) Seoul, (c) Andong, (d) Jinju, (e) Buan, (f) Yeongju stations.
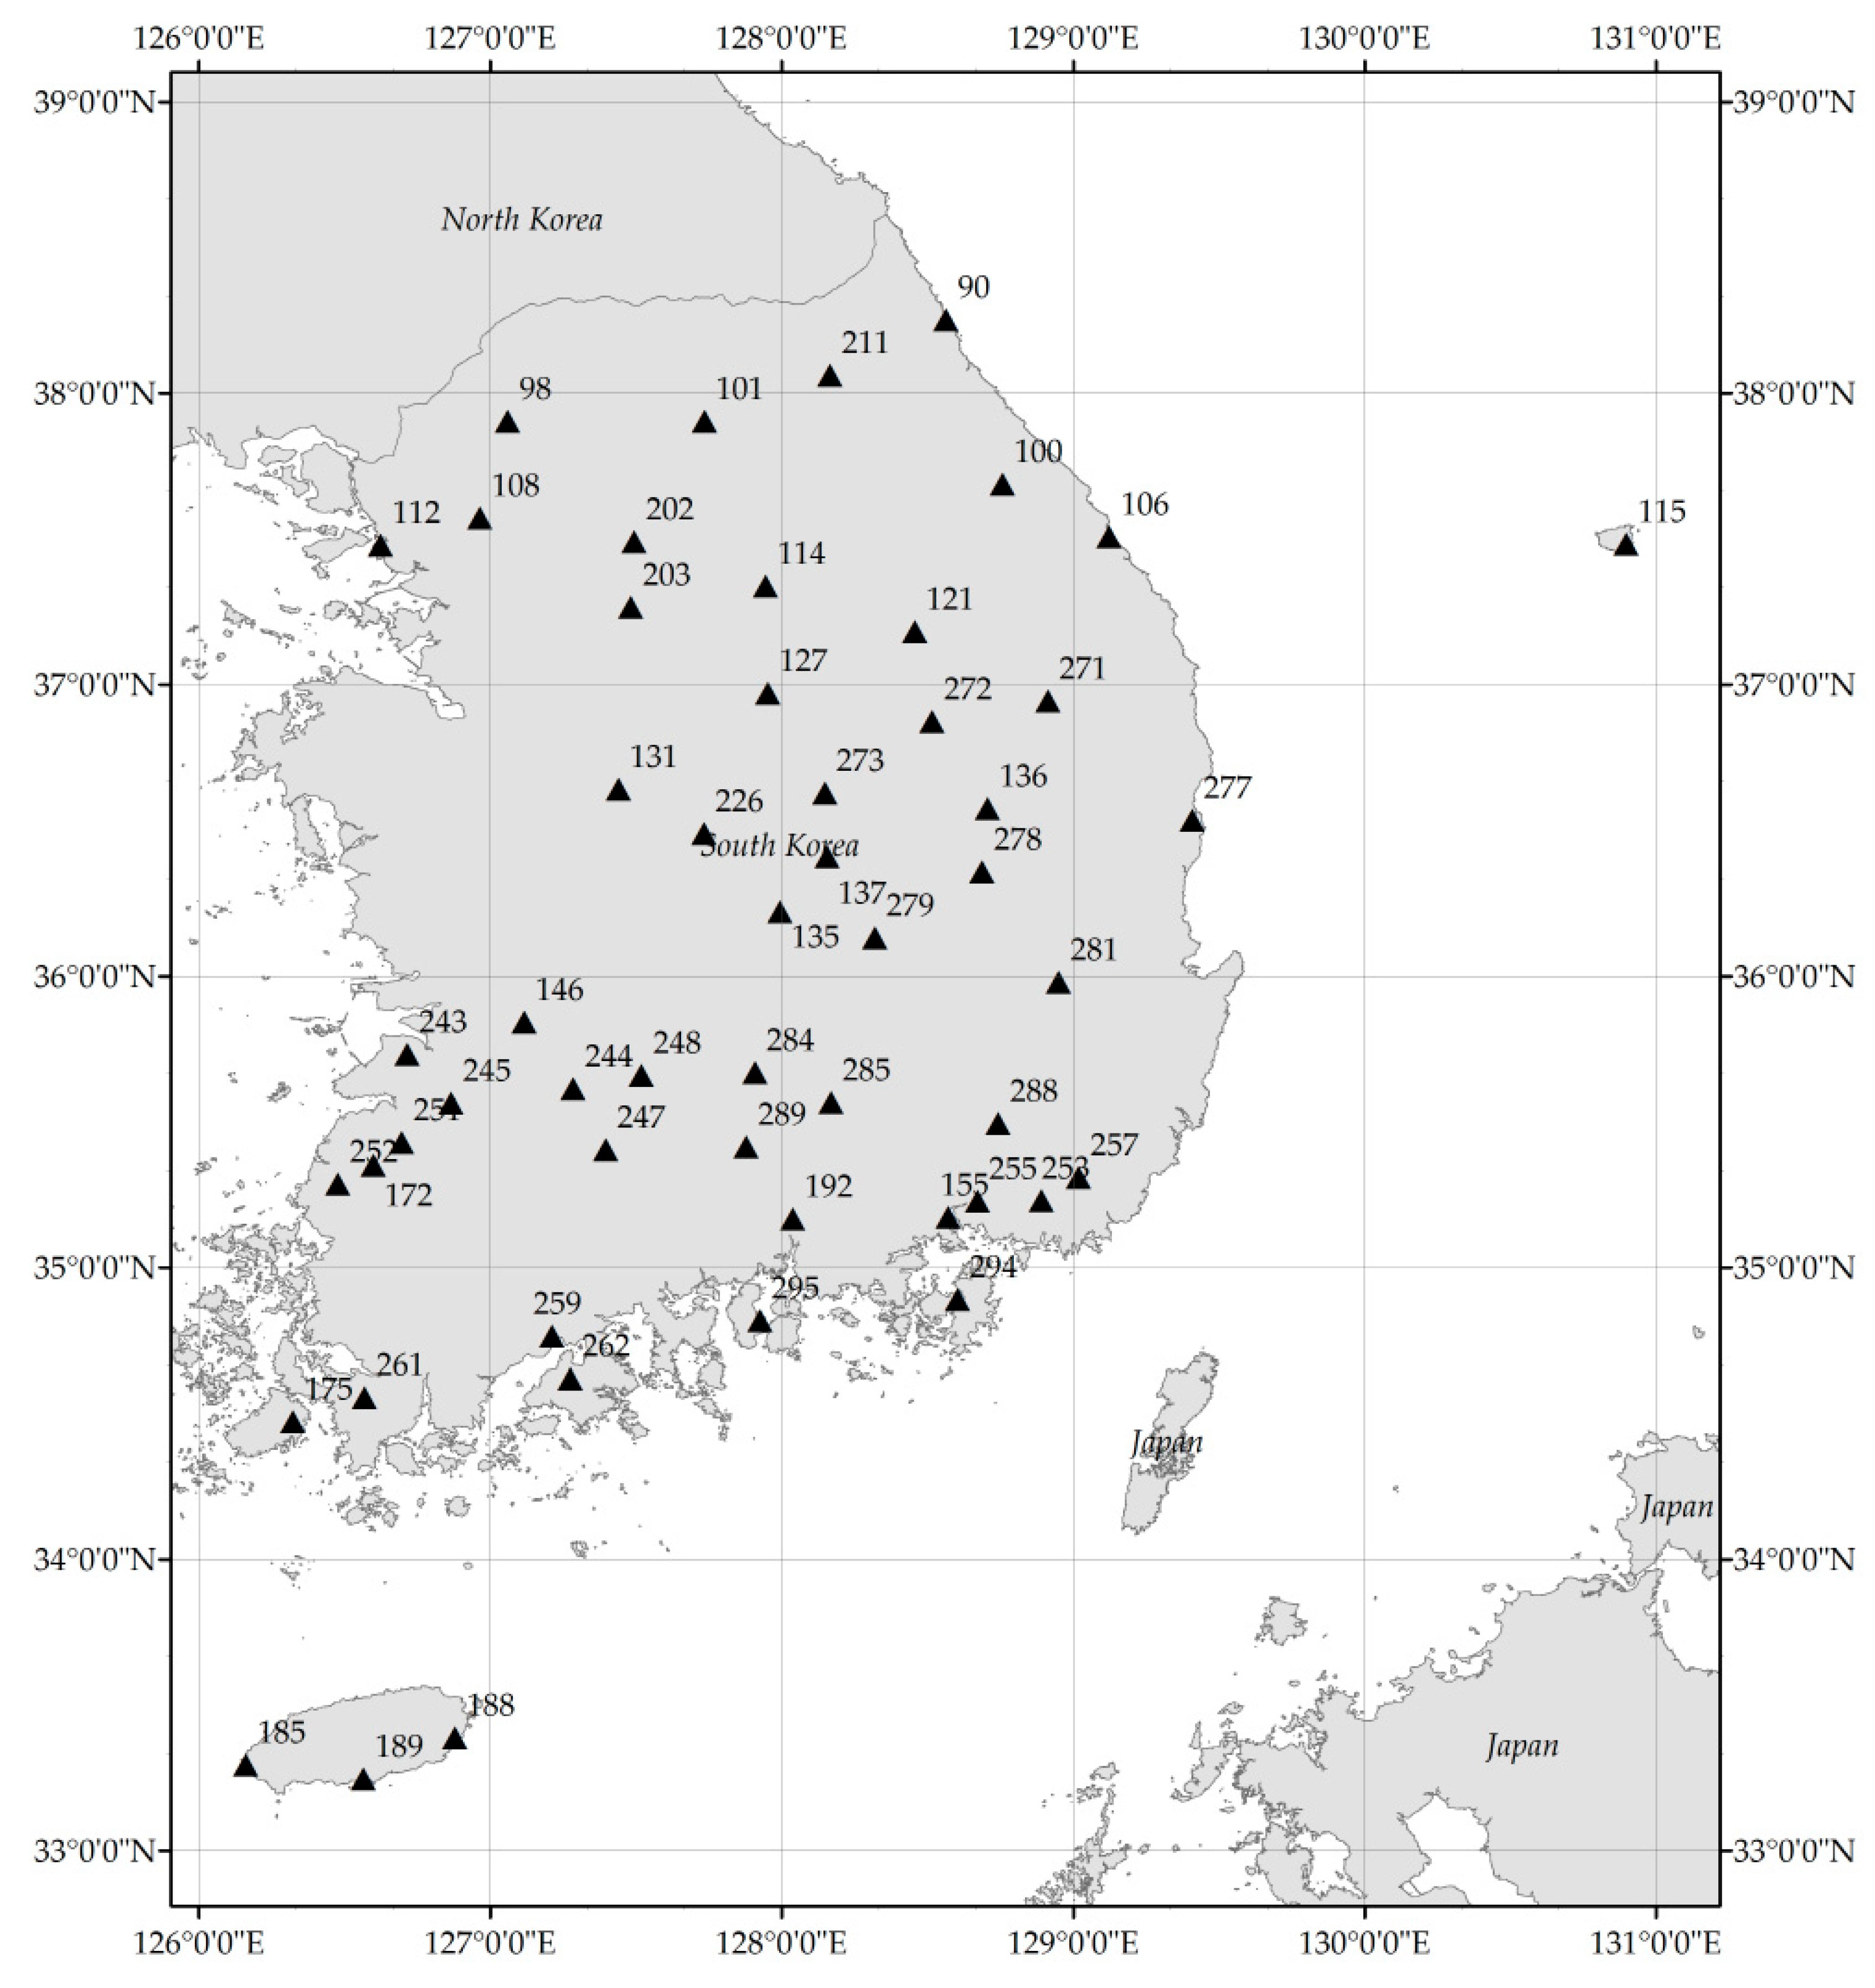
Figure 2.
Geographical location of the weather stations used for hourly mean wind speed data.
Figure 2.
Geographical location of the weather stations used for hourly mean wind speed data.
Figure 3.
Geographical location of the weather stations used for 10-min mean wind speed data.
Figure 3.
Geographical location of the weather stations used for 10-min mean wind speed data.
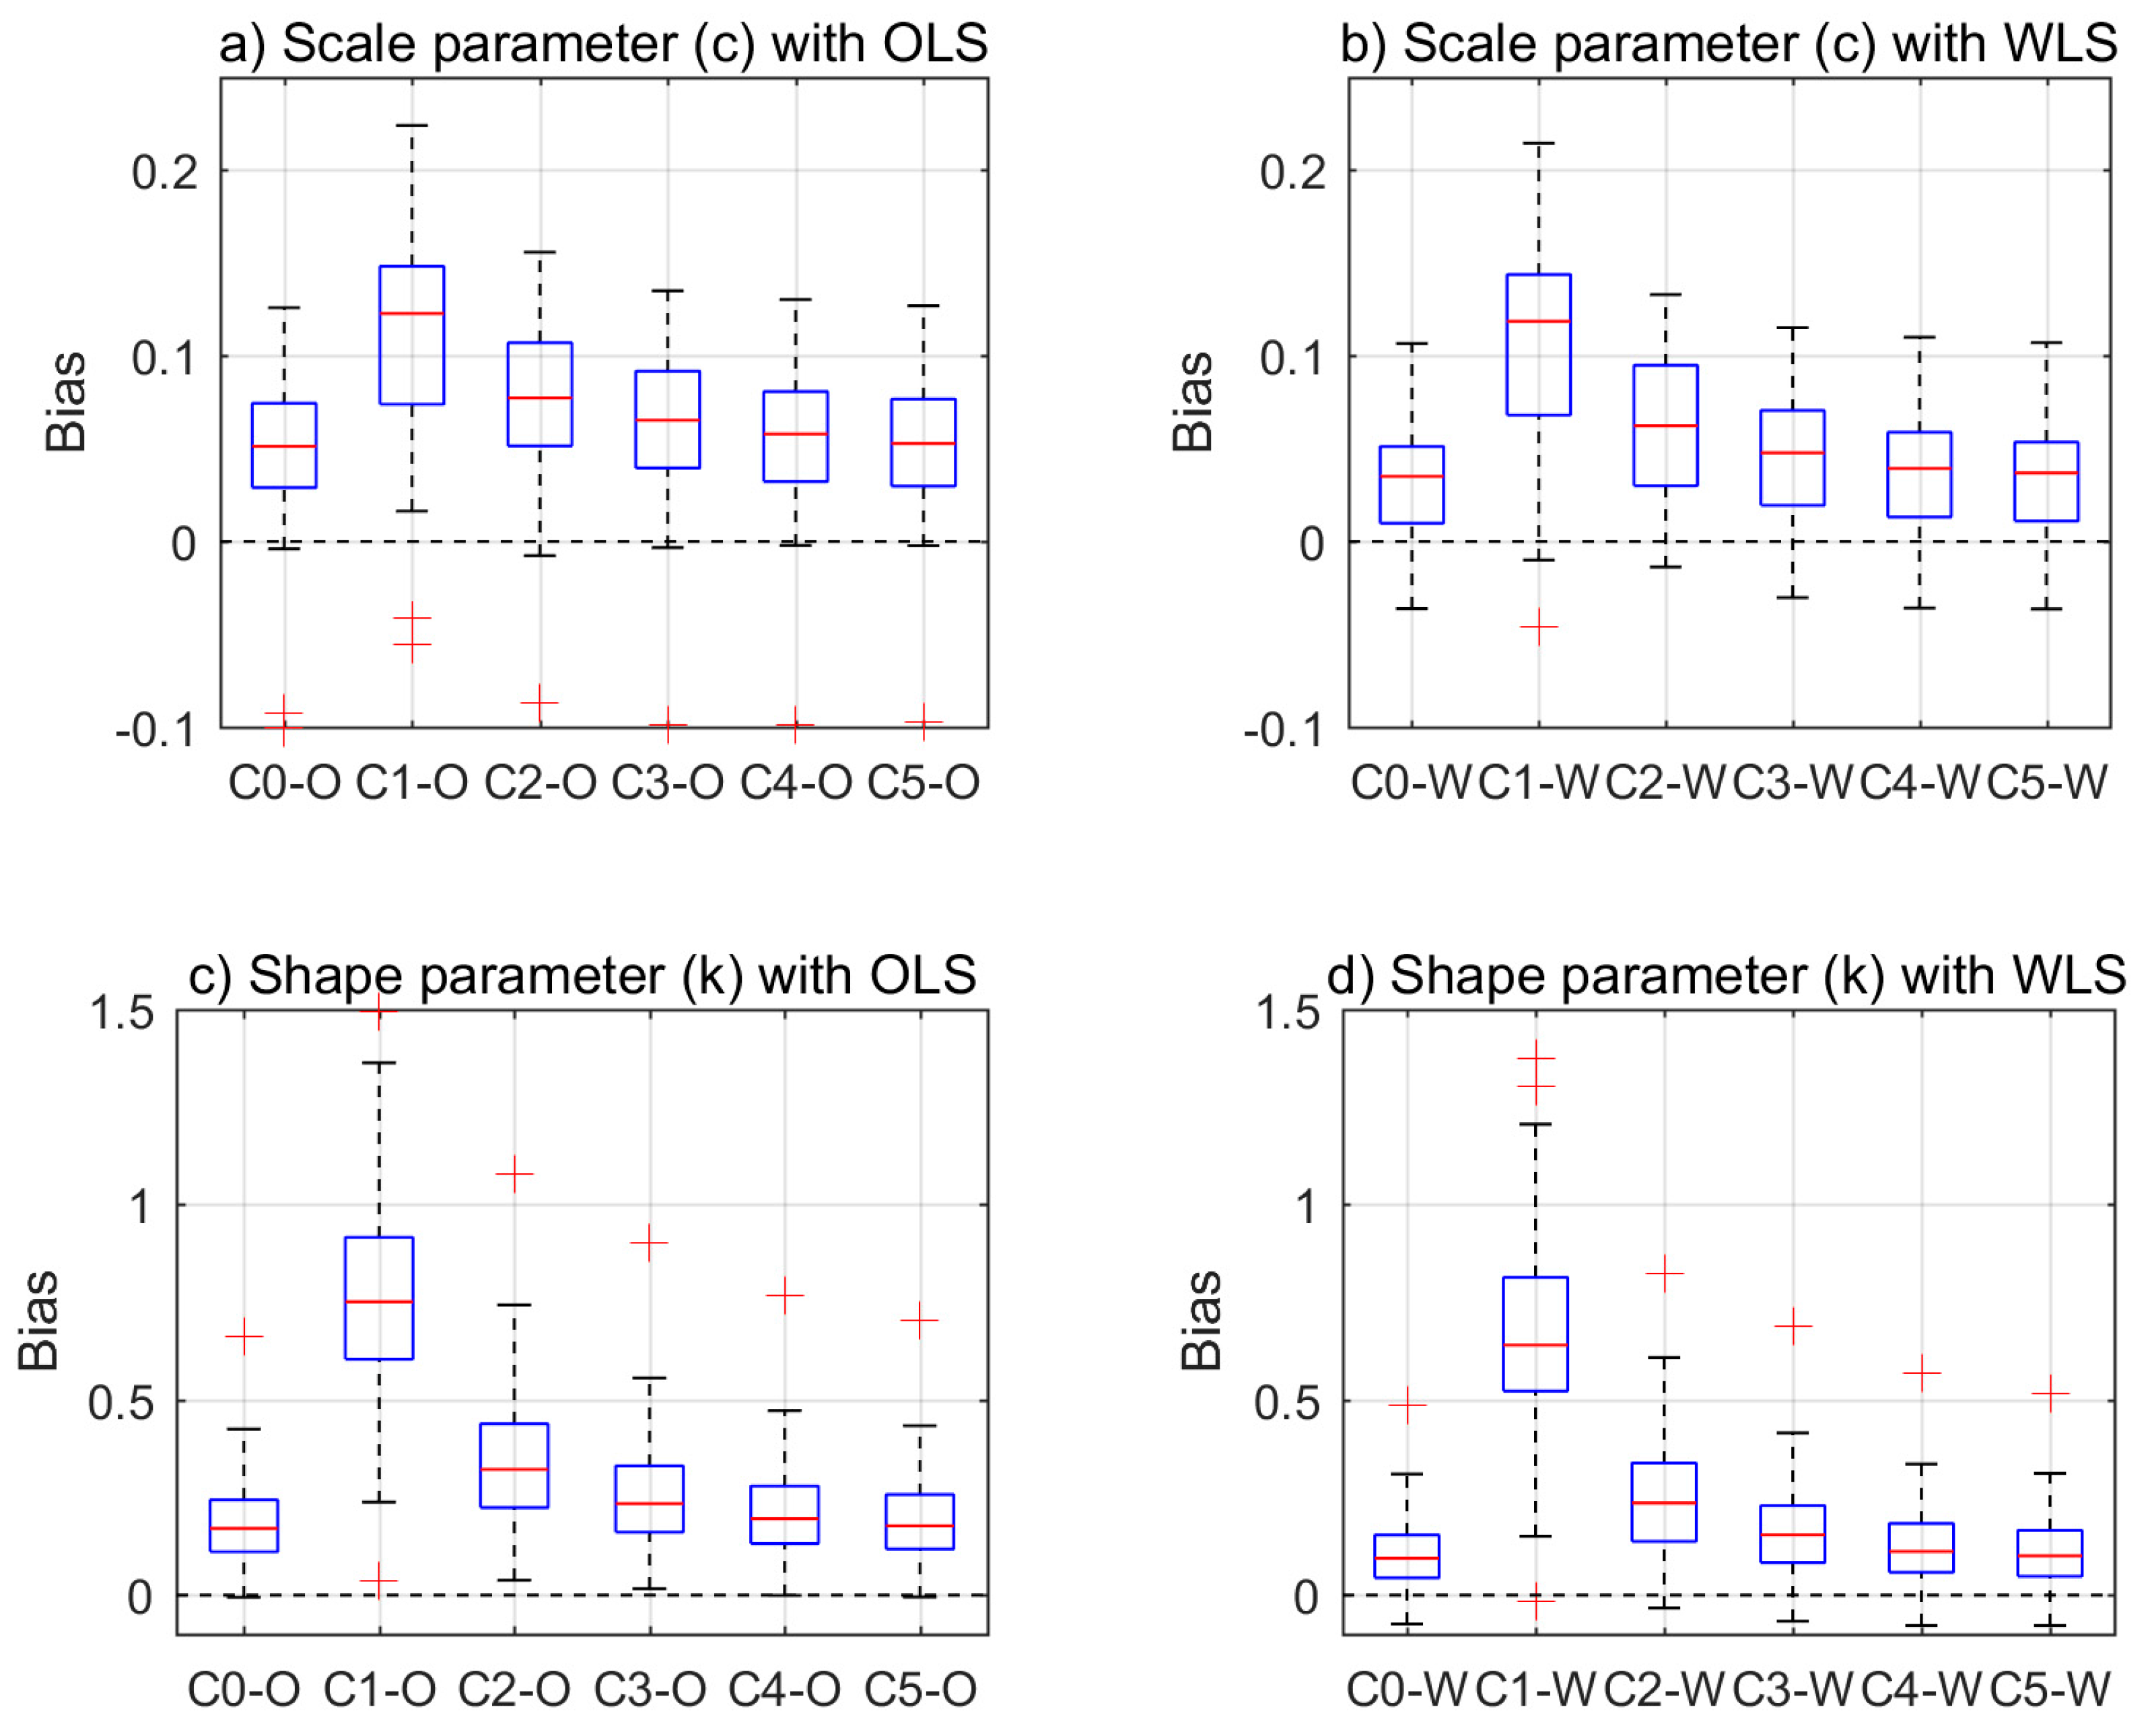
Figure 4.
Boxplots of the Bias of scale (c) and shape (k) parameters of the downscaled Weibull distiribtuion with OLS and WLS methods based on the parameter estimates from the observed Weibull distribution. Note that (a–d) presents boxplots of scale parameter estimates with OLS, scale parameter estiamtes with WLS, shape parameter estimates with OLS, and shape parameter with WLS, respectively.
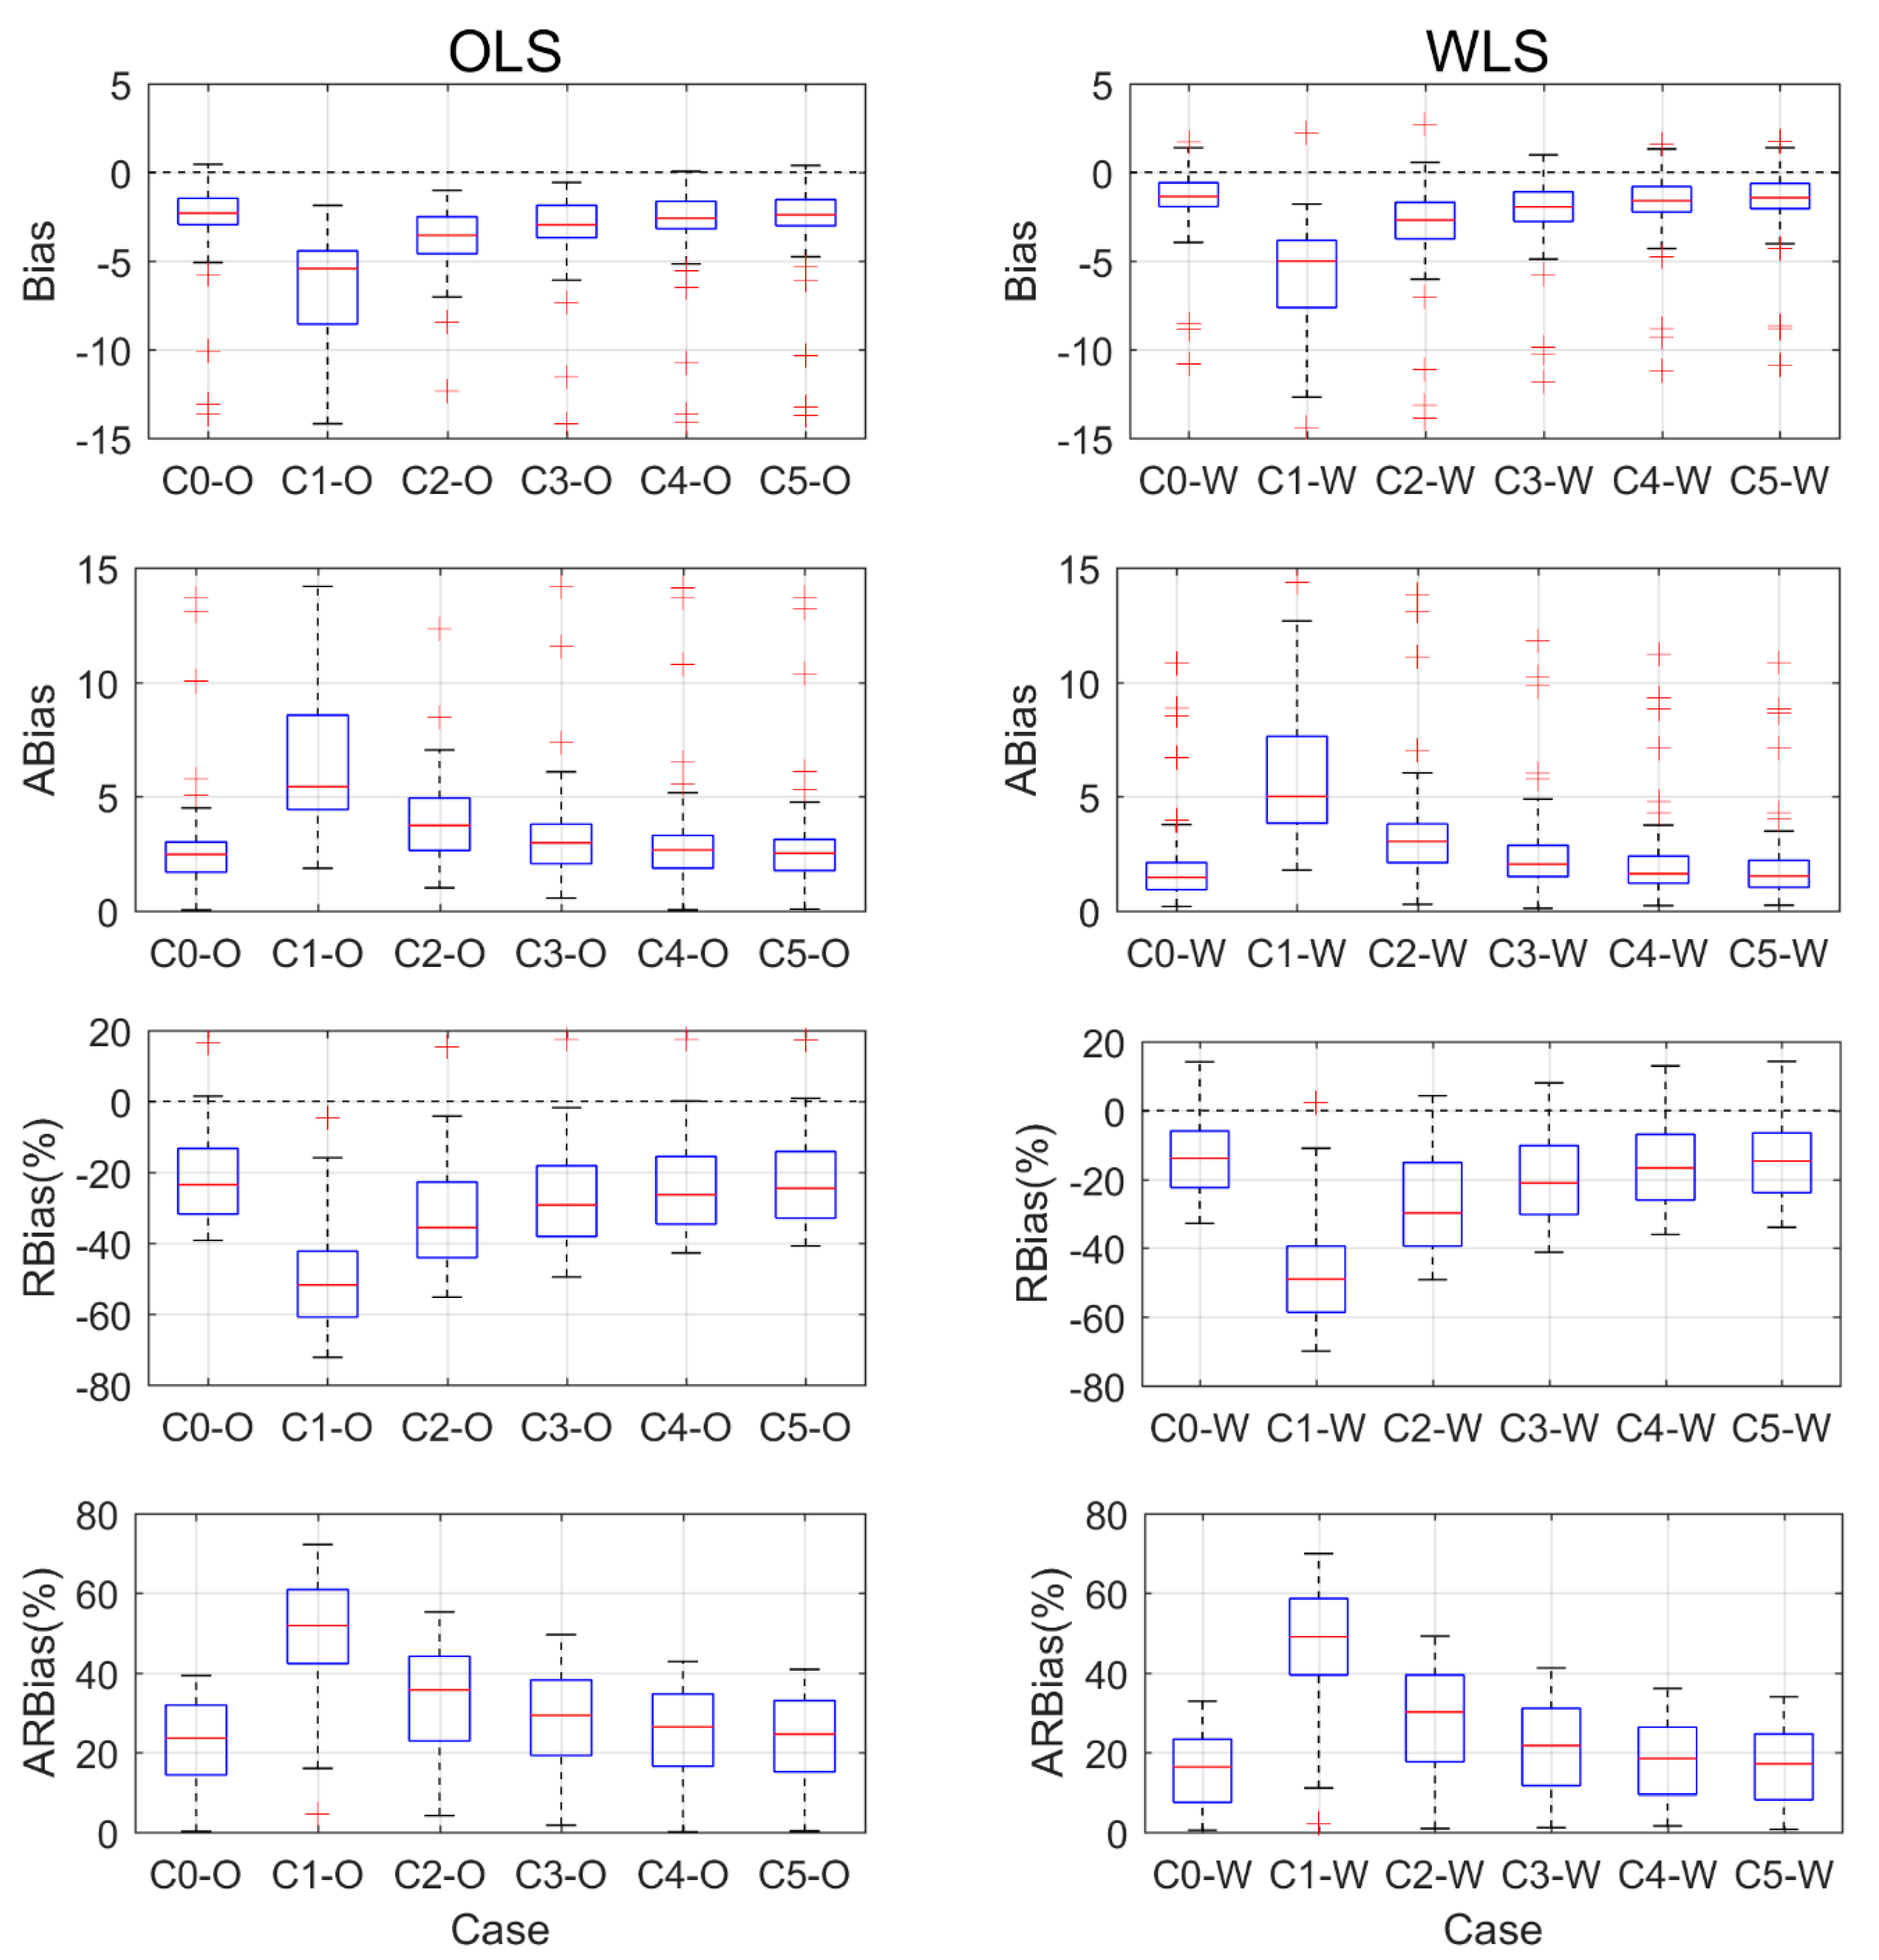
Figure 5.
Boxplots of ABias of scale (c) and shape (k) of the downscaled Weibull distribtuion with the OLS and WLS methods based on the parameter estimates from the observed Weibull distribution. Note that (a), (b), (c) and (d) presents boxplots of scale parameter estimates with OLS, scale parameter estiamtes with WLS, shape parameter estimates with OLS, and shape parameter with WLS, respectively.
Figure 6.
Boxplots of the RBias(%) of scale (c) and shape (k) parameters of the downscaled Weibull distribution with the OLS and WLS methods based on the parameter estimates from the observed Weibull distribution. Note that (a–d) presents boxplots of scale parameter estimates with OLS, scale parameter estiamtes with WLS, shape parameter estimates with OLS, and shape parameter with WLS, respectively.
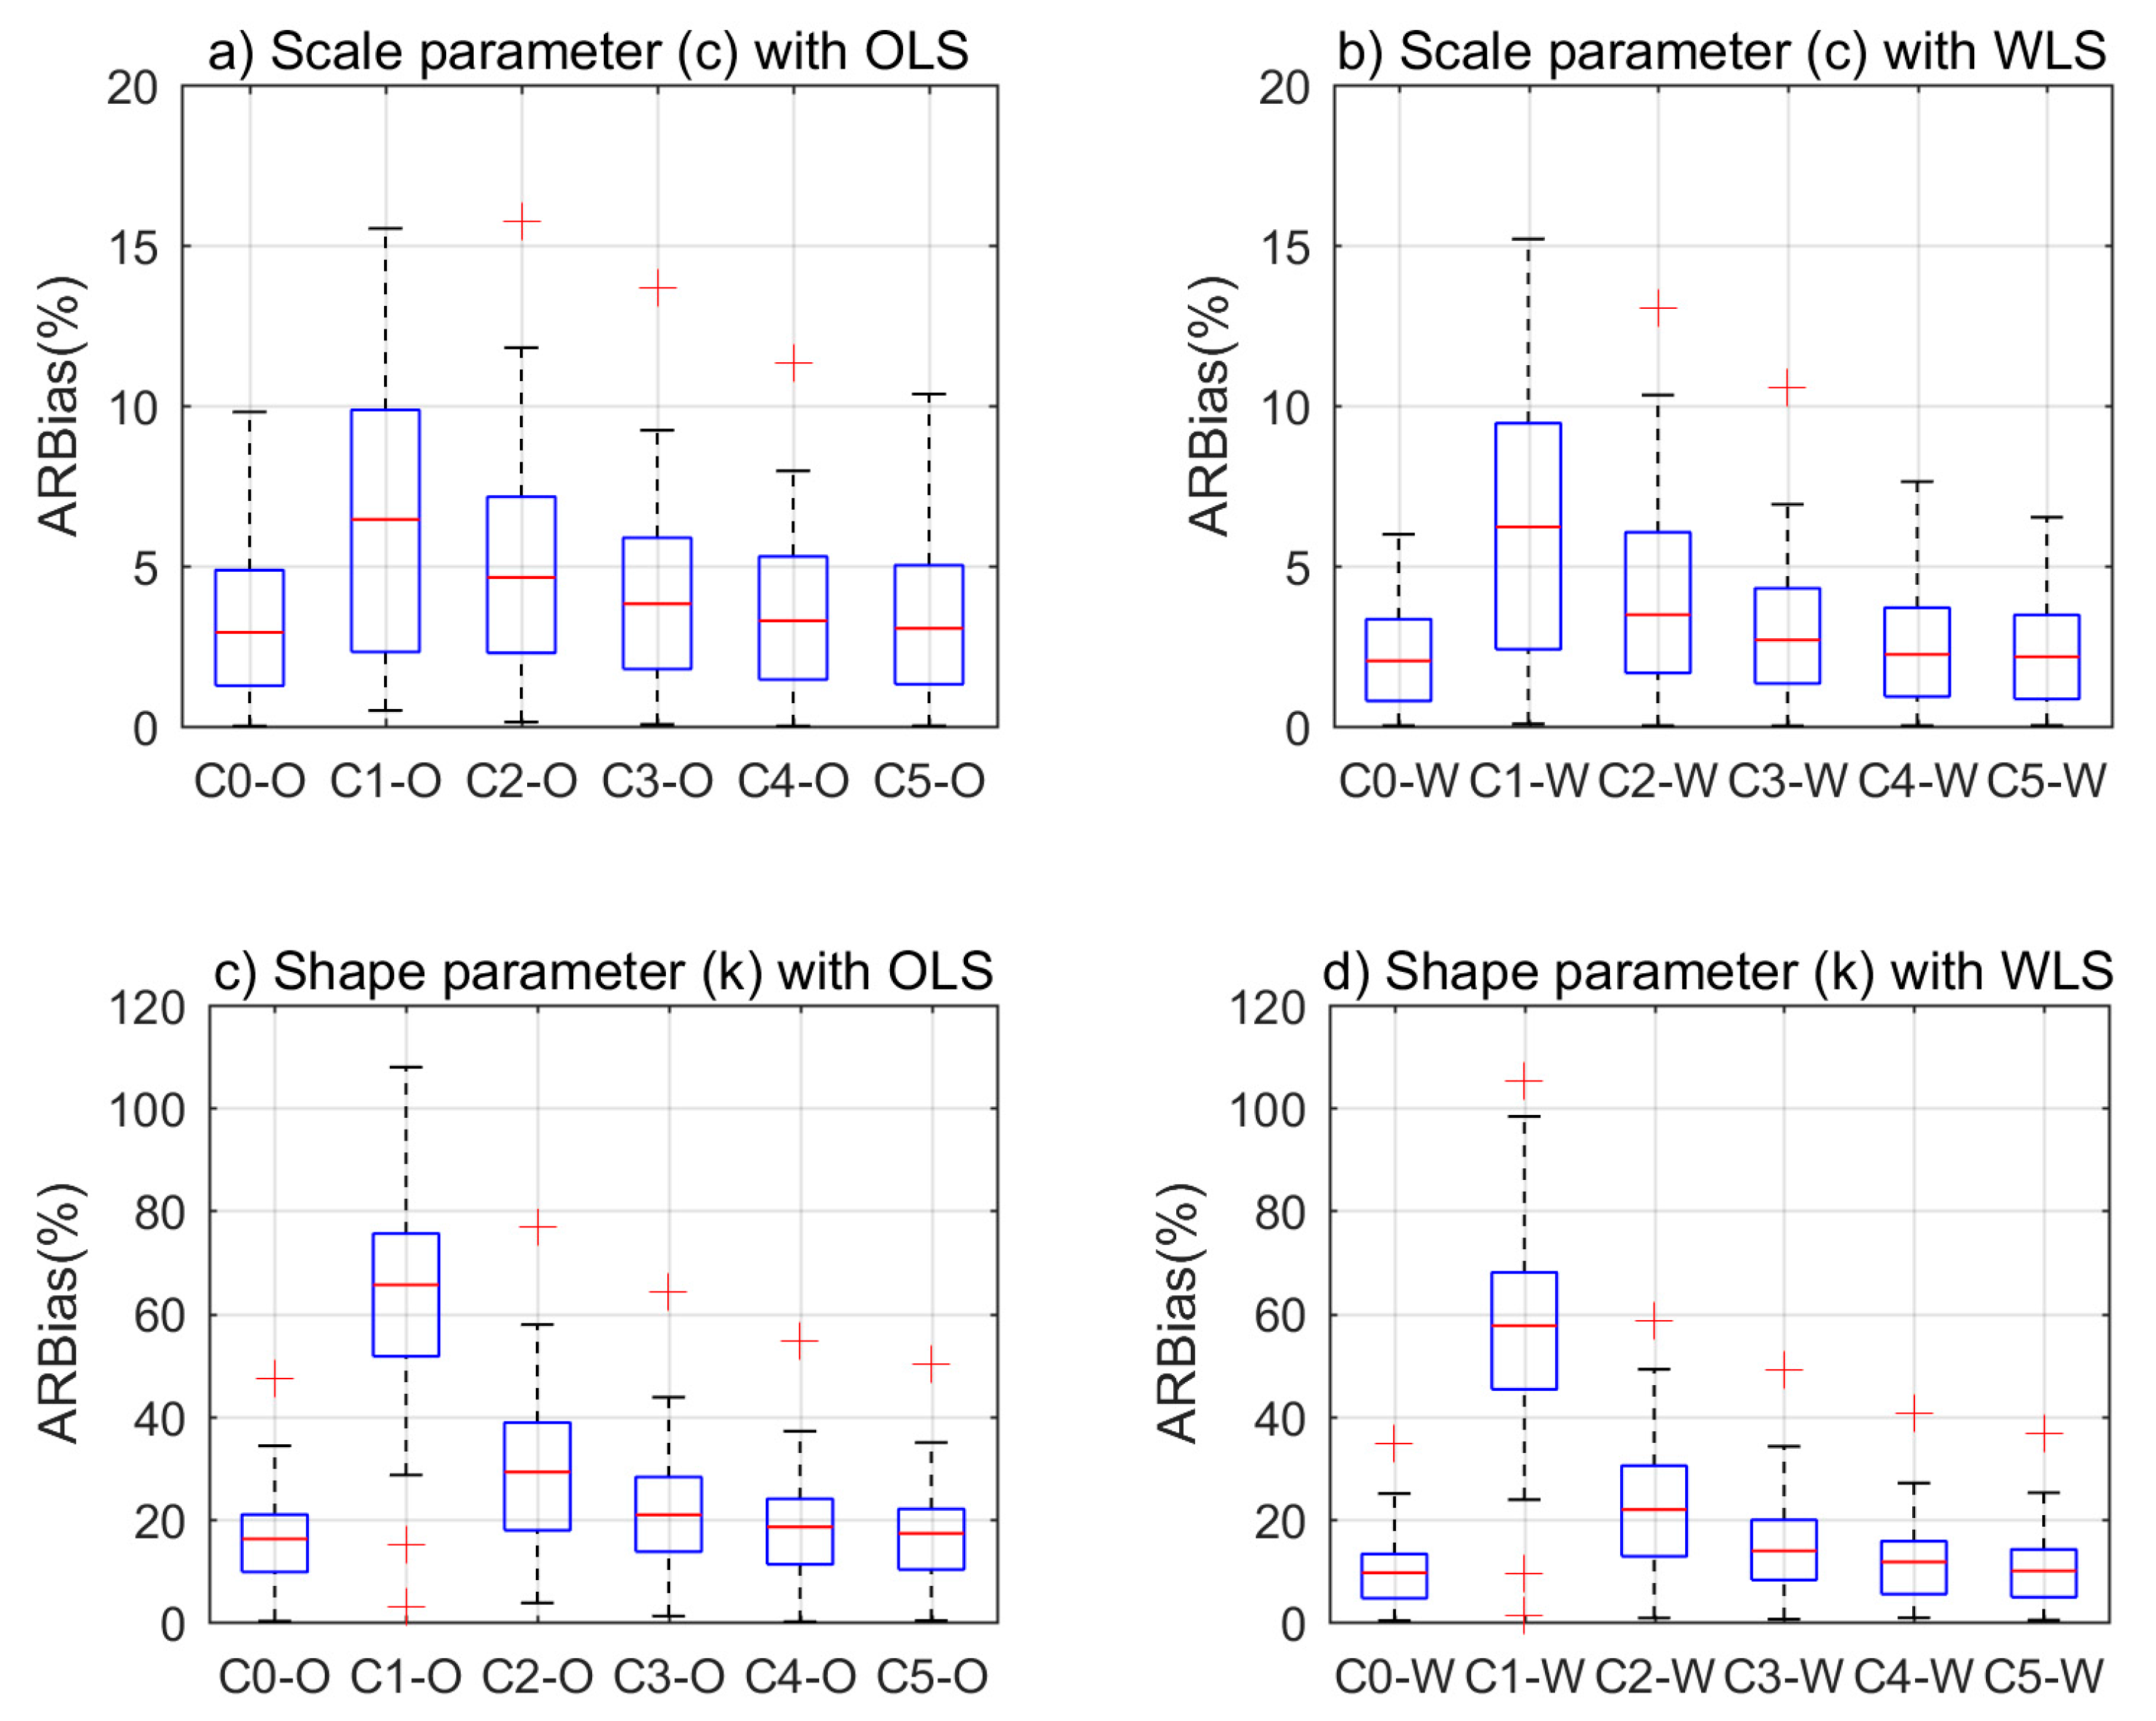
Figure 7.
Boxplots of the ARBias (%) of scale (c) and shape (k) parameters of the downscaled Weibull distribution with the OLS and WLS methods based on the parameter estimates from the observed Weibull distribution. Note that (a–d) presents boxplots of scale parameter estimates with OLS, scale parameter estiamtes with WLS, shape parameter estimates with OLS, and shape parameter with WLS, respectively.
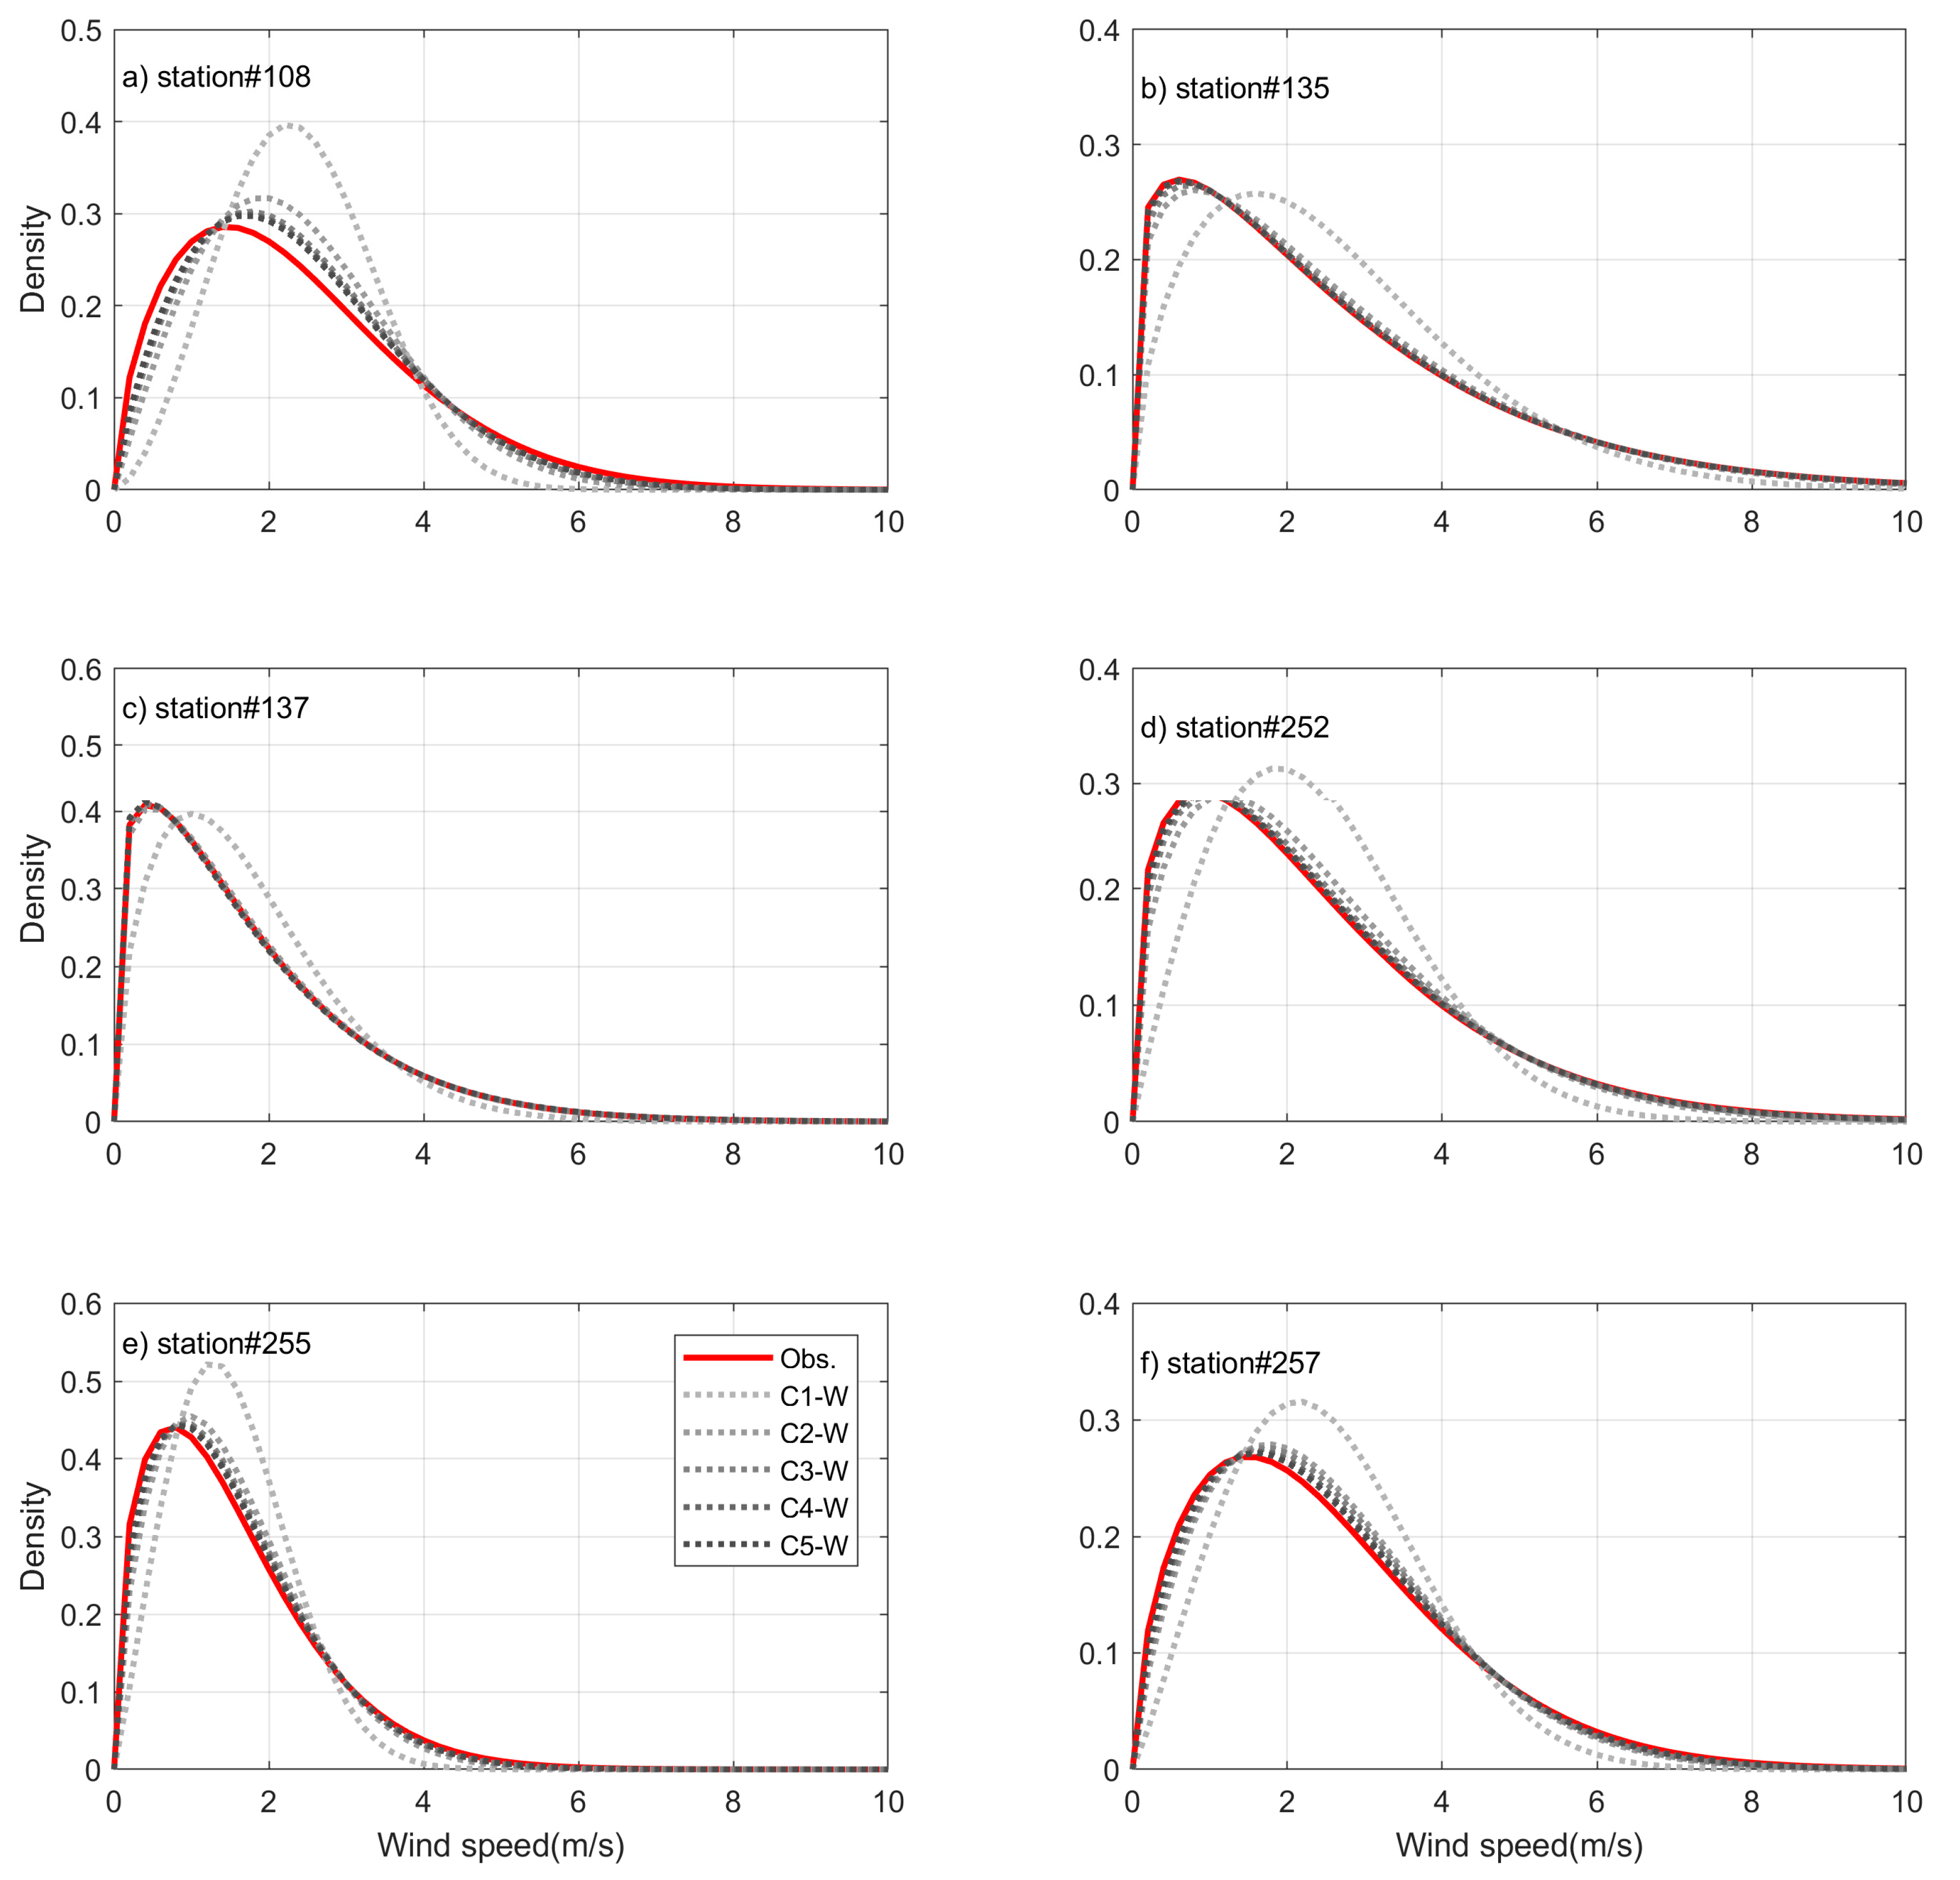
Figure 8.
Probability density functions of the downscaled Weibull distributions with the WLS method for all the cases of stations (a) #108, (b) #135, (c) #137, (d) #252, (e) #255, and (f) #257. The red line indicates the Weibull PDF fitted by the method of moments for the hourly mean wind speed data. The observed distribution (red solid line) indicates the Weibull distribution of hourly wind speed data fitted using the method of moment.
Figure 9.
Boxplots of the bias, ABias, RBias (%), and ARBias (%) of wind potential energy estimates from the downscaled Weibull distribution with the OLS and WLS methods based on the wind potential energy from the observed Weibull distributions. Note that the wind potential energy of station #185 is not presented in bias and ABias. Because the magnitude of the wind potential energy for station #185 is approximately one hundred times the magnitude of the other stations, the boxplot does not properly represent the overall characteristics when the bias and ABias of station #185 are included.
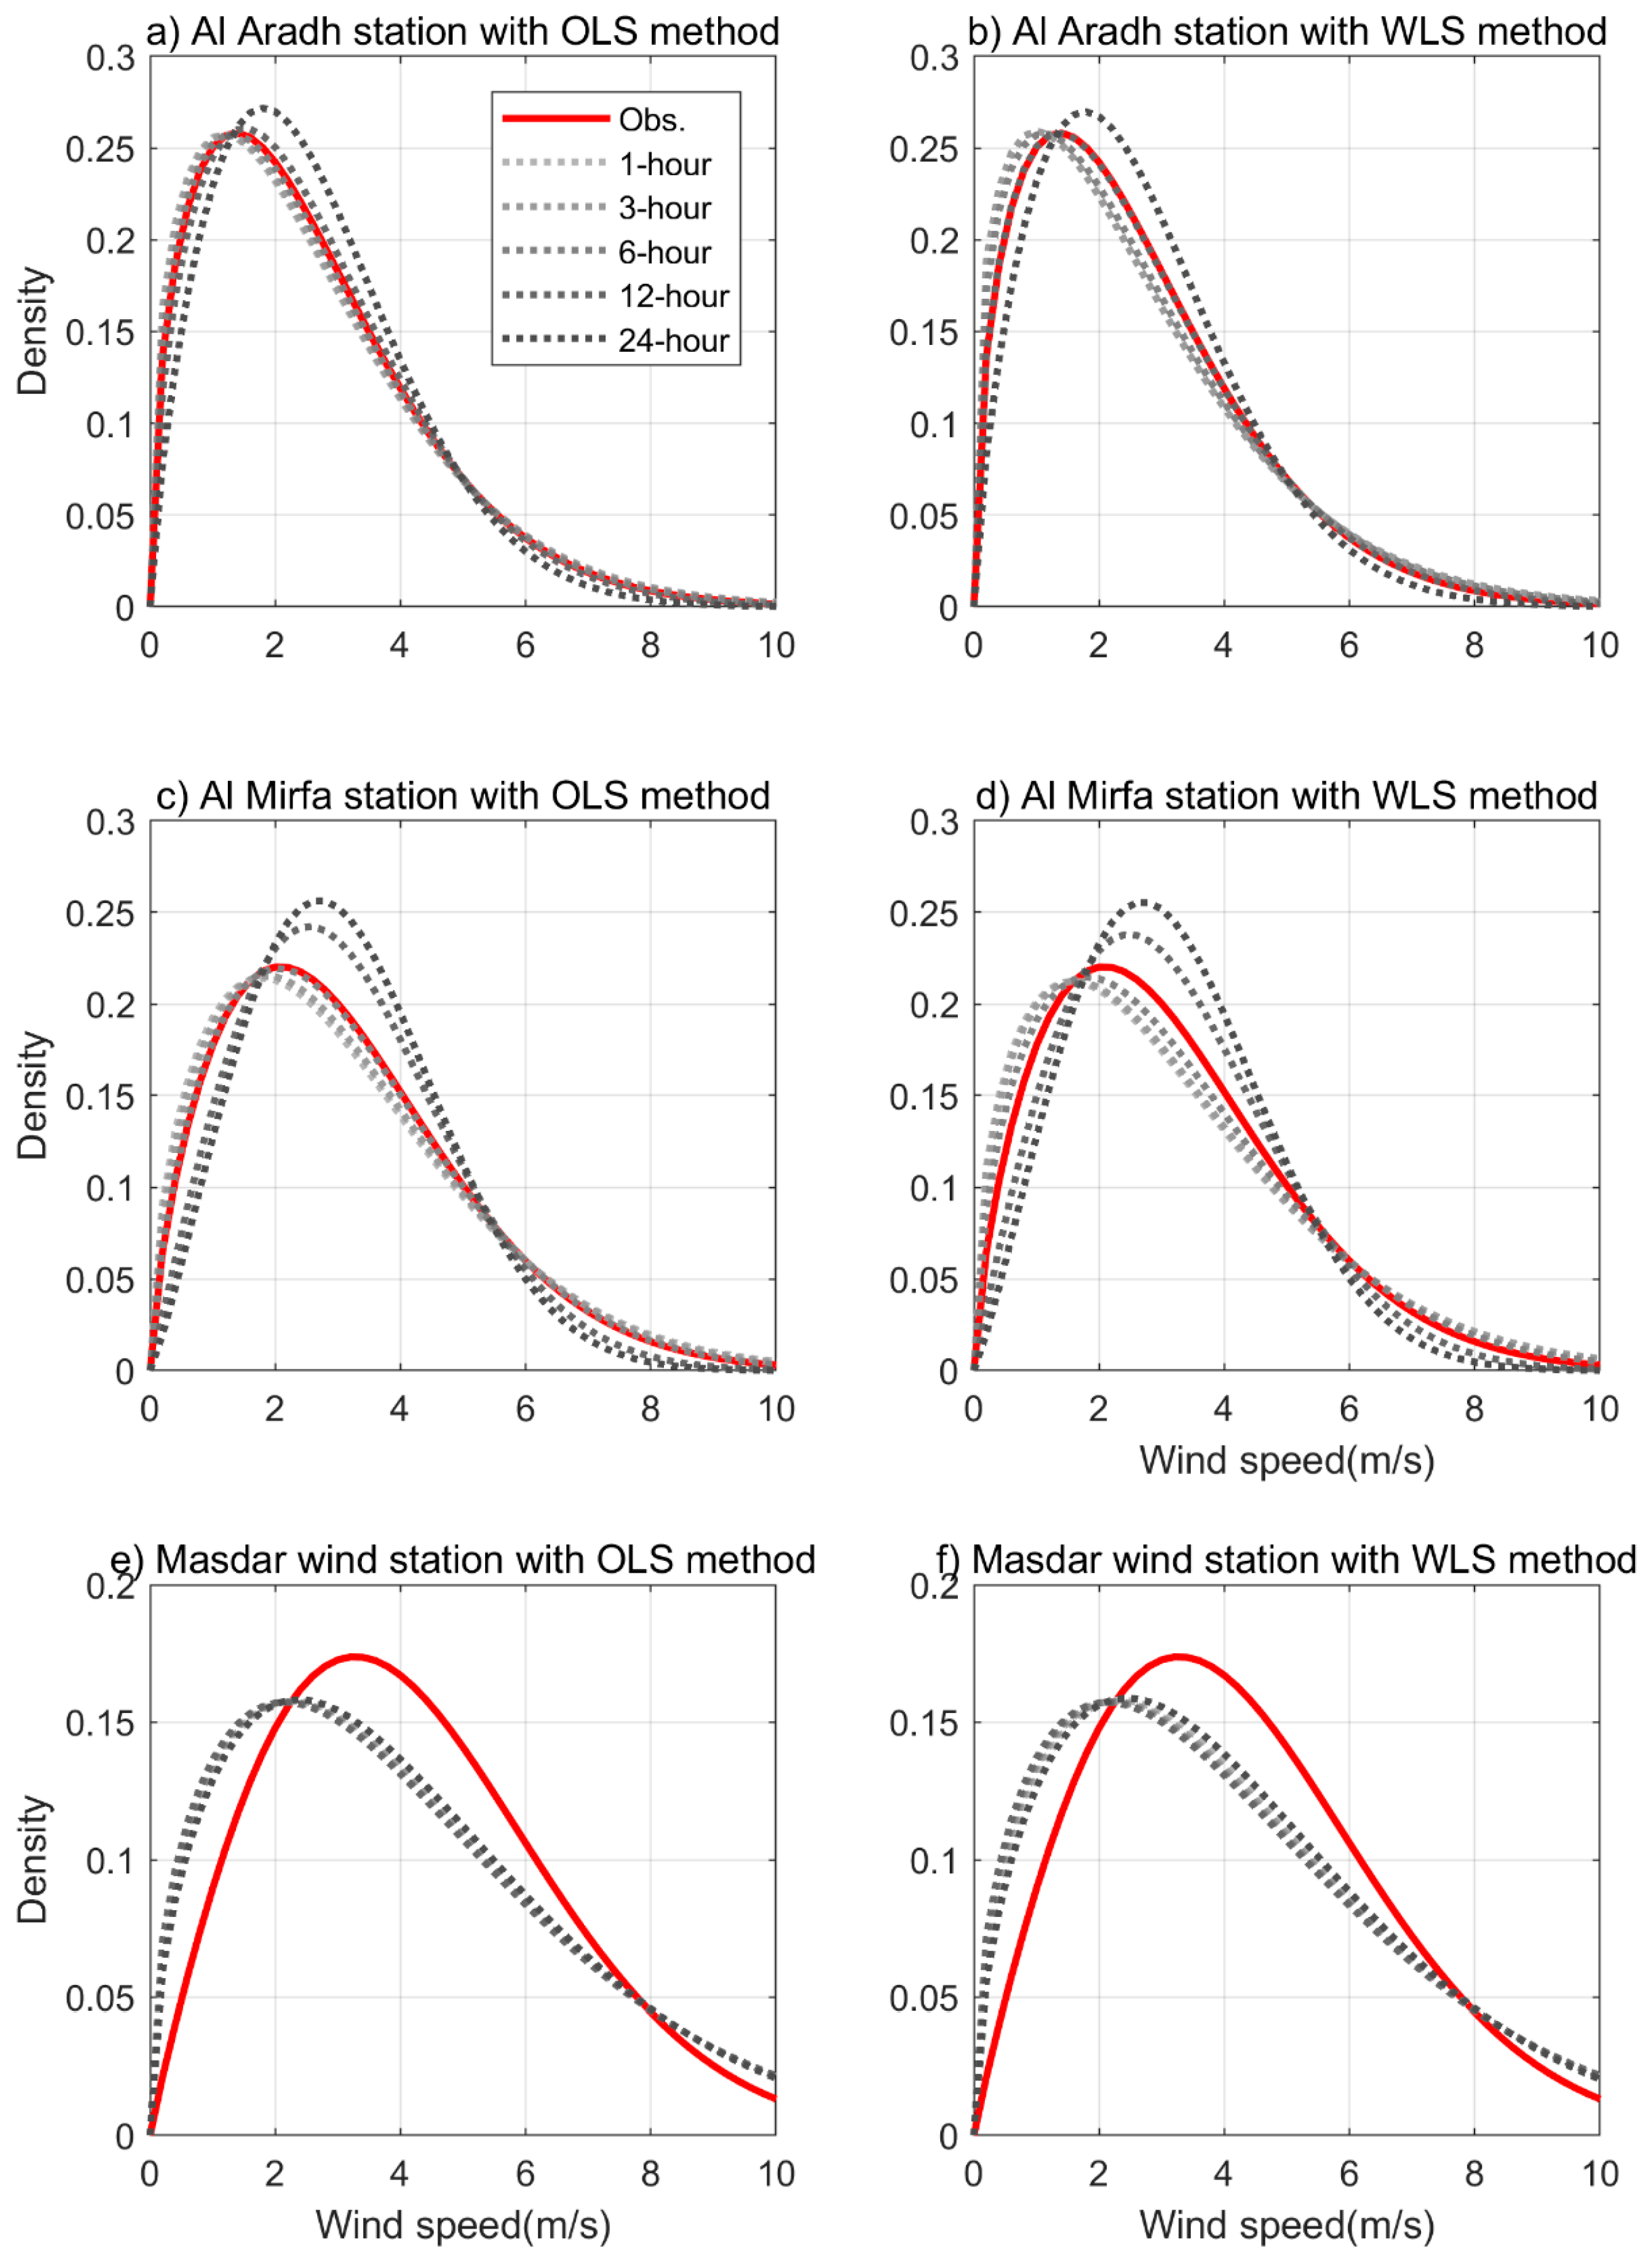
Figure 10.
Observed and downscaled Weibull PDFs with the OLS and WLS methods for six stations with Weibull PDF observations. Note that the target temporal resolution of the downscaling method is 10 min. The red line indicates the Weibull PDF that is fitted by the method of moments for 10-min mean wind speed data. The observed distribution (red solid line) indicates the Weibull distribution of 10-min wind speed data fitted using the method of moment. Note that (a), (b), (c), (d), (e), and (f) present the pdfs of Al Aradh with OLS, Al Aradh with WLS, Al Mirfa with OLS, Al Mirfa with WLS, Masdar wind station with OLS, and Masdar wind station with WLS, respectively.
Table 1.
Information on the weather stations.
Table 1.
Information on the weather stations.
| Station No. | Name | Altitude (m) | Record Length (year) | Station No. | Name | Altitude (m) | Record Length (Year) |
|---|
| 90 | Sockcho | 18.1 | 37 | 243 | Buan | 12.0 | 37 |
| 98 | Dongducheon | 109.1 | 19 | 244 | Imsil | 247.9 | 37 |
| 100 | Daegwallyeong | 842.5 | 37 | 245 | Jeongeup | 44.6 | 37 |
| 101 | Chuncheon | 77.71 | 37 | 247 | Namwon | 127.5 | 37 |
| 106 | Donghae | 39.91 | 25 | 248 | Jangsu | 406.5 | 29 |
| 108 | Seoul | 85.8 | 37 | 251 | Gochanggun | 54.0 | 10 |
| 112 | Incheon | 71.4 | 37 | 252 | Youngwang | 37.2 | 9 |
| 114 | Wonju | 148.6 | 37 | 253 | Gimhae | 59.3 | 9 |
| 115 | Ulleungdo | 222.8 | 37 | 255 | Bukchangwon | 46.8 | 8 |
| 121 | Yeongwol | 240.6 | 23 | 257 | Yangsan | 14.9 | 8 |
| 127 | Chungju | 115.1 | 37 | 259 | Bosung | 2.8 | 8 |
| 131 | Cheongju | 57.2 | 37 | 261 | Haenam | 13.01 | 37 |
| 135 | Chupungnyeong | 244.7 | 37 | 262 | Goheung | 53.1 | 37 |
| 136 | Andong | 140.1 | 36 | 271 | Bonghwa | 322.0 | 29 |
| 137 | Sangju | 96.2 | 15 | 272 | Yeongju | 210.8 | 37 |
| 146 | Jeonju | 61.4 | 37 | 273 | Mungyeong | 170.6 | 37 |
| 155 | Changwon | 37.2 | 33 | 277 | Yeongduck | 42.1 | 37 |
| 172 | Gochang | 52.0 | 7 | 278 | Uiseong | 81.8 | 37 |
| 175 | Jindo | 476.5 | 16 | 279 | Gumi | 48.9 | 37 |
| 185 | Gosan | 74.3 | 29 | 281 | Yeongchen | 93.6 | 37 |
| 188 | Seongsan | 17.8 | 37 | 284 | Geochang | 226.0 | 37 |
| 189 | Seogwipo | 50.4 | 37 | 285 | Hapcheon | 33.1 | 37 |
| 192 | Jinju | 30.2 | 37 | 288 | Milyang | 11.2 | 37 |
| 202 | Yangpyeong | 48.0 | 37 | 289 | Sancheong | 138.1 | 37 |
| 203 | Icheon | 78.0 | 37 | 294 | Geoje | 46.3 | 37 |
| 211 | Inje | 200.2 | 37 | 295 | Namhae | 45.0 | 37 |
| 226 | Boeun | 175.0 | 37 | | | | |
Table 2.
Information on the stations used to obtain 10-min mean wind speed data.
Table 2.
Information on the stations used to obtain 10-min mean wind speed data.
| Station | Altitude (m) | Period (year/month) |
|---|
| Al Aradh | 178 | 2007/06–2010/08 |
| Al Mirfa | 6 | 2007/06–2009/07 |
| Masdar Wind Station | 0.6 | 2008/08–2011/02 |
Table 3.
Description of the test cases for the hourly mean wind speed data.
Table 3.
Description of the test cases for the hourly mean wind speed data.
| No. | Case | Temporal Scale of the Used Wind Speed Data (hour) | Fitting Method for the Linear Model |
|---|
| 1 | Case 0-O | 1 | OLS |
| 2 | Case 0-W | 1 | WLS |
| 3 | Case 1-O | 168 (weakly) | OLS |
| 4 | Case 1-W | 168 (weakly) | WLS |
| 5 | Case 2-O | 24 (daily) | OLS |
| 6 | Case 2-W | 24 (daily) | WLS |
| 7 | Case 3-O | 12 | OLS |
| 8 | Case 3-W | 12 | WLS |
| 9 | Case 4-O | 6 | OLS |
| 10 | Case 4-W | 6 | WLS |
| 11 | Case 5-O | 3 | OLS |
| 12 | Case 5-W | 3 | WLS |
Table 4.
Means of the evaluation criteria for the downscaled Weibull parameter estimates based on parameter estimates of the observed Weibull distribution of all the stations.
Table 4.
Means of the evaluation criteria for the downscaled Weibull parameter estimates based on parameter estimates of the observed Weibull distribution of all the stations.
| Case | Scale Parameter c | Shape Parameter k |
|---|
| Bias | ABias | RBias (%) | ARBias (%) | RMSE | Bias | ABias | RBias (%) | ARBias (%) | RMSE |
|---|
| C0-O | 0.047 | 0.055 | 3.1 | 3.3 | 0.062 | 0.176 | 0.188 | 14.8 | 15.5 | 0.223 |
| C0-W | 0.026 | 0.040 | 1.9 | 2.2 | 0.049 | 0.095 | 0.121 | 8.1 | 9.9 | 0.149 |
| C1-O | 0.107 | 0.110 | 6.7 | 6.8 | 0.122 | 0.819 | 0.819 | 67.3 | 67.3 | 0.986 |
| C1-W | 0.104 | 0.106 | 6.5 | 6.5 | 0.117 | 0.708 | 0.709 | 58.4 | 58.4 | 0.818 |
| C2-O | 0.073 | 0.080 | 4.7 | 4.9 | 0.089 | 0.331 | 0.342 | 27.8 | 28.5 | 0.392 |
| C2-W | 0.056 | 0.068 | 3.8 | 4.1 | 0.079 | 0.238 | 0.256 | 20.2 | 21.4 | 0.304 |
| C3-O | 0.060 | 0.068 | 3.9 | 4.1 | 0.075 | 0.245 | 0.256 | 20.5 | 21.3 | 0.300 |
| C3-W | 0.039 | 0.053 | 2.8 | 3.1 | 0.063 | 0.153 | 0.177 | 13.0 | 14.6 | 0.215 |
| C4-O | 0.052 | 0.060 | 3.4 | 3.6 | 0.068 | 0.204 | 0.216 | 17.1 | 17.9 | 0.255 |
| C4-W | 0.030 | 0.046 | 2.2 | 2.6 | 0.055 | 0.116 | 0.143 | 9.8 | 11.7 | 0.175 |
| C5-O | 0.049 | 0.057 | 3.2 | 3.4 | 0.064 | 0.186 | 0.198 | 15.6 | 16.4 | 0.235 |
| C5-W | 0.027 | 0.042 | 2.0 | 2.4 | 0.051 | 0.102 | 0.129 | 8.7 | 10.5 | 0.159 |
Table 5.
Means of the evaluation criteria for the wind potential energy of the downscaled Weibull distributions based on the wind potential energy of the observed Weibull distributions of all the stations. Note that the biases of C3-W, C4-W, and C5-W are positive because the value of the wind potential energy for station #185 is a large positive number. Because the magnitude of the wind potential energy for station #185 is approximately one hundred times the magnitude of the other stations, the mean biases of these cases are shifted. The numbers in brackets indicate the means of the biases without station #185.
| Case | Bias | ABias | RBias (%) | ARBias (%) | RMSE |
|---|
| C0-O | −1.038 (−2.339) | 4.411 (−3.215) | −20.7 | 22.3 | 10.4 (4.9) |
| C0-W | 0.812 (−0.992) | 4.287 (−2.549) | −12.4 | 15.8 | 13.8 (4.8) |
| C1-O | −8.423 (−7.337) | 8.423 (−7.337) | −49.5 | 49.5 | 12.8 (9.3) |
| C1-W | −7.506 (−6.790) | 7.590 (−6.875) | −46.9 | 47.0 | 10.6 (8.7) |
| C2-O | −2.571 (−3.824) | 5.792 (−4.700) | −31.6 | 33.0 | 10.6 (6.2) |
| C2-W | −0.462 (−2.558) | 5.900 (−3.926) | −25.0 | 27.6 | 16.1 (6.2) |
| C3-O | −1.624 (−3.017) | 5.213 (−3.951) | −26.0 | 27.6 | 11.2 (5.7) |
| C3-W | 0.532 (−1.612) | 5.285 (−3.232) | −18.1 | 21.3 | 16.4 (5.7) |
| C4-O | −1.201 (−2.592) | 4.796 (−3.520) | −23.0 | 24.5 | 11.1 (5.3) |
| C4-W | 0.889 (−1.156) | 4.844 (−2.875) | −14.5 | 18.1 | 15.7 (5.3) |
| C5-O | −1.058 (−2.421) | 4.588 (−3.334) | −21.6 | 23.2 | 10.8 (5.1) |
| C5-W | 0.921 (−1.019) | 4.555 (−2.685) | −13.1 | 16.7 | 14.9 (5.1) |
Table 6.
Bias, absolute bias, relative bias, and absolute relative bias of the parameter estimates and wind potential energy for the different cases. The presented Bias, ABias, RBias and ARBias values are the mean values for three employed stations. The case indicates the temporal scale of the wind speed data used to obtain the parameters of the Weibull distribution for the 10-min mean wind speed data.
| Target | Criteria | OLS | WLS |
|---|
| 1-h | 3-h | 6-h | 12-h | 24-h | 1-h | 3-h | 6-h | 12-h | 24-h |
|---|
| c | Bias | −0.0447 | −0.0435 | −0.0349 | −0.0187 | −0.0010 | −0.0597 | −0.0612 | −0.0509 | −0.0261 | 0.0008 |
| ABias | 0.0447 | 0.0435 | 0.0349 | 0.0464 | 0.0472 | 0.0597 | 0.0612 | 0.0509 | 0.0420 | 0.0437 |
| RBias | −1.1% | −1.1% | −0.8% | −0.3% | 0.2% | −1.6% | −1.6% | −1.3% | −0.5% | 0.3% |
| ARBias | 1.1% | 1.1% | 0.8% | 1.1% | 1.2% | 1.6% | 1.6% | 1.3% | 0.9% | 1.2% |
| RMSE | 0.052 | 0.055 | 0.055 | 0.059 | 0.051 | 0.061 | 0.064 | 0.060 | 0.060 | 0.046 |
| k | Bias | −0.2170 | −0.2082 | −0.1651 | −0.0175 | 0.1262 | −0.2652 | −0.2685 | −0.2320 | −0.0658 | 0.1218 |
| ABias | 0.2170 | 0.2082 | 0.1651 | 0.2864 | 0.3861 | 0.2652 | 0.2685 | 0.2320 | 0.2469 | 0.3657 |
| RBias | −12% | −11% | −9% | 0% | 9% | −15.2% | −15.3% | −13.0% | −2.8% | 8.7% |
| ARBias | 12% | 11% | 9% | 16% | 23% | 15.2% | 15.3% | 13.0% | 13.5% | 21.4% |
| RMSE | 0.259 | 0.264 | 0.260 | 0.328 | 0.398 | 0.283 | 0.293 | 0.278 | 0.309 | 0.381 |
| WPE | Bias | −8.421 | −8.452 | −8.345 | −8.099 | −3.759 | −8.615 | −8.708 | −8.585 | −8.214 | −3.509 |
| ABias | 8.421 | 8.452 | 8.345 | 8.555 | 12.330 | 8.615 | 8.708 | 8.585 | 8.515 | 12.401 |
| RBias | −12.2% | −11.9% | −11.1% | −9.5% | 18.5% | −13.6% | −13.6% | −12.6% | −10.2% | 19.8% |
| ARBias | 12.2% | 11.9% | 11.1% | 12.1% | 39.3% | 13.6% | 13.6% | 12.6% | 11.6% | 40.4% |
| RMSE | 14.1 | 14.3 | 14.4 | 14.4 | 14.9 | 14.0 | 14.2 | 14.4 | 14.5 | 14.8 |
Table 7.
Means of the evaluation criteria for the downscaled Weibull parameter estimates based on parameter estimates of the observed Weibull distribution of all the stations from the test period.
Table 7.
Means of the evaluation criteria for the downscaled Weibull parameter estimates based on parameter estimates of the observed Weibull distribution of all the stations from the test period.
| Case | Scale Parameter c | Shape Parameter k |
|---|
| Bias | ABias | RBias (%) | ARBias (%) | RMSE | Bias | ABias | RBias (%) | ARBias (%) | RMSE |
|---|
| C0-O | 0.045 | 0.055 | 3.0 | 3.3 | 0.062 | 0.168 | 0.180 | 14.2 | 15.0 | 0.215 |
| C0-W | 0.024 | 0.040 | 1.8 | 2.2 | 0.050 | 0.091 | 0.117 | 7.8 | 9.6 | 0.146 |
| C1-O | 0.088 | 0.098 | 5.7 | 5.9 | 0.111 | 0.802 | 0.812 | 67.4 | 68.0 | 1.093 |
| C1-W | 0.049 | 0.116 | 4.0 | 6.4 | 0.190 | 0.565 | 0.568 | 46.8 | 47.0 | 0.789 |
| C2-O | 0.072 | 0.079 | 4.7 | 4.8 | 0.088 | 0.332 | 0.340 | 27.8 | 28.4 | 0.392 |
| C2-W | 0.054 | 0.069 | 3.8 | 4.1 | 0.080 | 0.239 | 0.263 | 20.3 | 21.8 | 0.317 |
| C3-O | 0.058 | 0.068 | 3.9 | 4.1 | 0.076 | 0.241 | 0.253 | 20.3 | 21.1 | 0.294 |
| C3-W | 0.038 | 0.055 | 2.7 | 3.1 | 0.065 | 0.152 | 0.177 | 13.0 | 14.6 | 0.215 |
| C4-O | 0.051 | 0.062 | 3.4 | 3.6 | 0.069 | 0.196 | 0.209 | 16.6 | 17.5 | 0.245 |
| C4-W | 0.029 | 0.047 | 2.2 | 2.6 | 0.058 | 0.113 | 0.140 | 9.7 | 11.6 | 0.174 |
| C5-O | 0.047 | 0.058 | 3.2 | 3.4 | 0.065 | 0.179 | 0.192 | 15.2 | 16.0 | 0.227 |
| C5-W | 0.026 | 0.043 | 1.9 | 2.4 | 0.054 | 0.097 | 0.124 | 8.3 | 10.2 | 0.155 |
Table 8.
Means of the evaluation criteria for the Weibull parameter estimates by the raw wind speed data with different temporal scale based on the parameter estimates of the Weibull distribution for hourly wind speed data at all the stations. Note that the underline indicates that the accuracy of Weibull parameter estimates from the raw data is superior to the Weibull parameter estimates by the downscaling method.
| Temporal Scale | Scale Parameter c | Shape Parameter k |
|---|
| Bias | ABias | RBias (%) | ARBias (%) | RMSE | Bias | ABias | RBias (%) | ARBias (%) | RMSE |
|---|
| 168-h | 0.083 | 0.106 | 5.8 | 6.5 | 0.125 | 2.300 | 2.300 | 188.1 | 188.1 | 2.381 |
| 24-h | 0.113 | 0.115 | 6.9 | 6.9 | 0.126 | 0.780 | 0.780 | 64.7 | 64.7 | 0.810 |
| 12-h | 0.092 | 0.092 | 5.5 | 5.5 | 0.099 | 0.415 | 0.415 | 34.1 | 34.1 | 0.431 |
| 6-h | 0.060 | 0.060 | 3.5 | 3.5 | 0.063 | 0.207 | 0.207 | 16.9 | 16.9 | 0.214 |
| 3-h | 0.035 | 0.035 | 2.1 | 2.1 | 0.037 | 0.106 | 0.106 | 8.7 | 8.7 | 0.111 |


