5.1. Aerodynamic Analysis and Comparison
In this subsection, five different airfoils are involved, including the DU97-Flatback, DU97-Flatback-FCC, DU97-Flatback-FCC_jet-off, DU97-Flatback-PCC, DU97-Flatback-PCC_jet-off. In the following text, the last four will be referred for short as FCC-on, FCC-off, PCC-on, PCC-off, respectively. The FCC-off and PCC-off airfoils are identical to the corresponding FCC-on and PCC-on airfoils, respectively, if the high-pressure cavity is disregarded and removed in simulations when the Coanda jet is switched off. Therefore, only two grids are needed to generate, namely, a grid for FCC-on and a grid for PCC-on. The grids for FCC-off and PCC-off can be obtained by directly removing the grid in the cavity of FCC-on and PCC-on, respectively.
As mentioned in
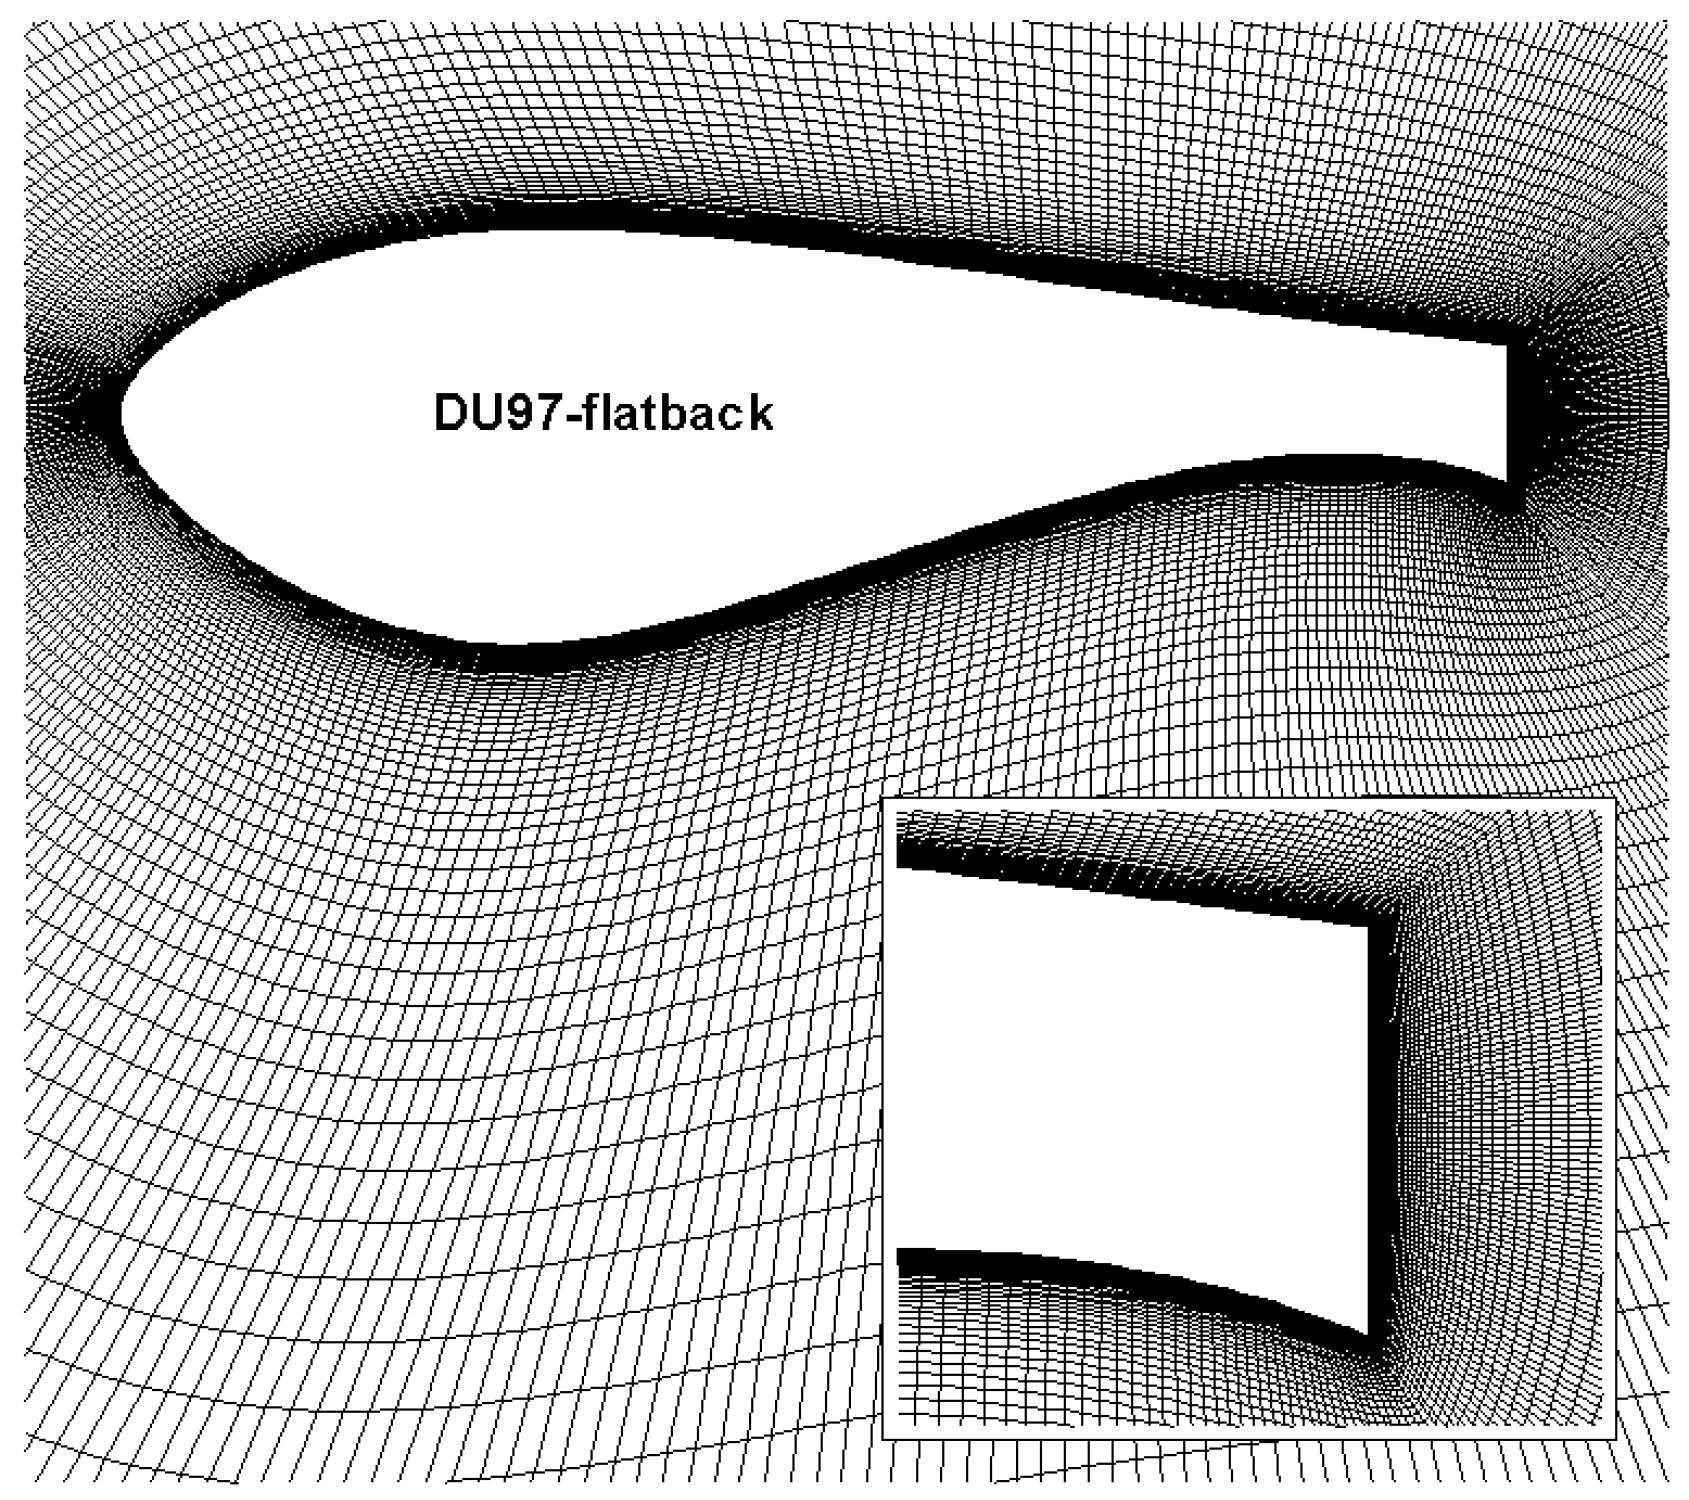
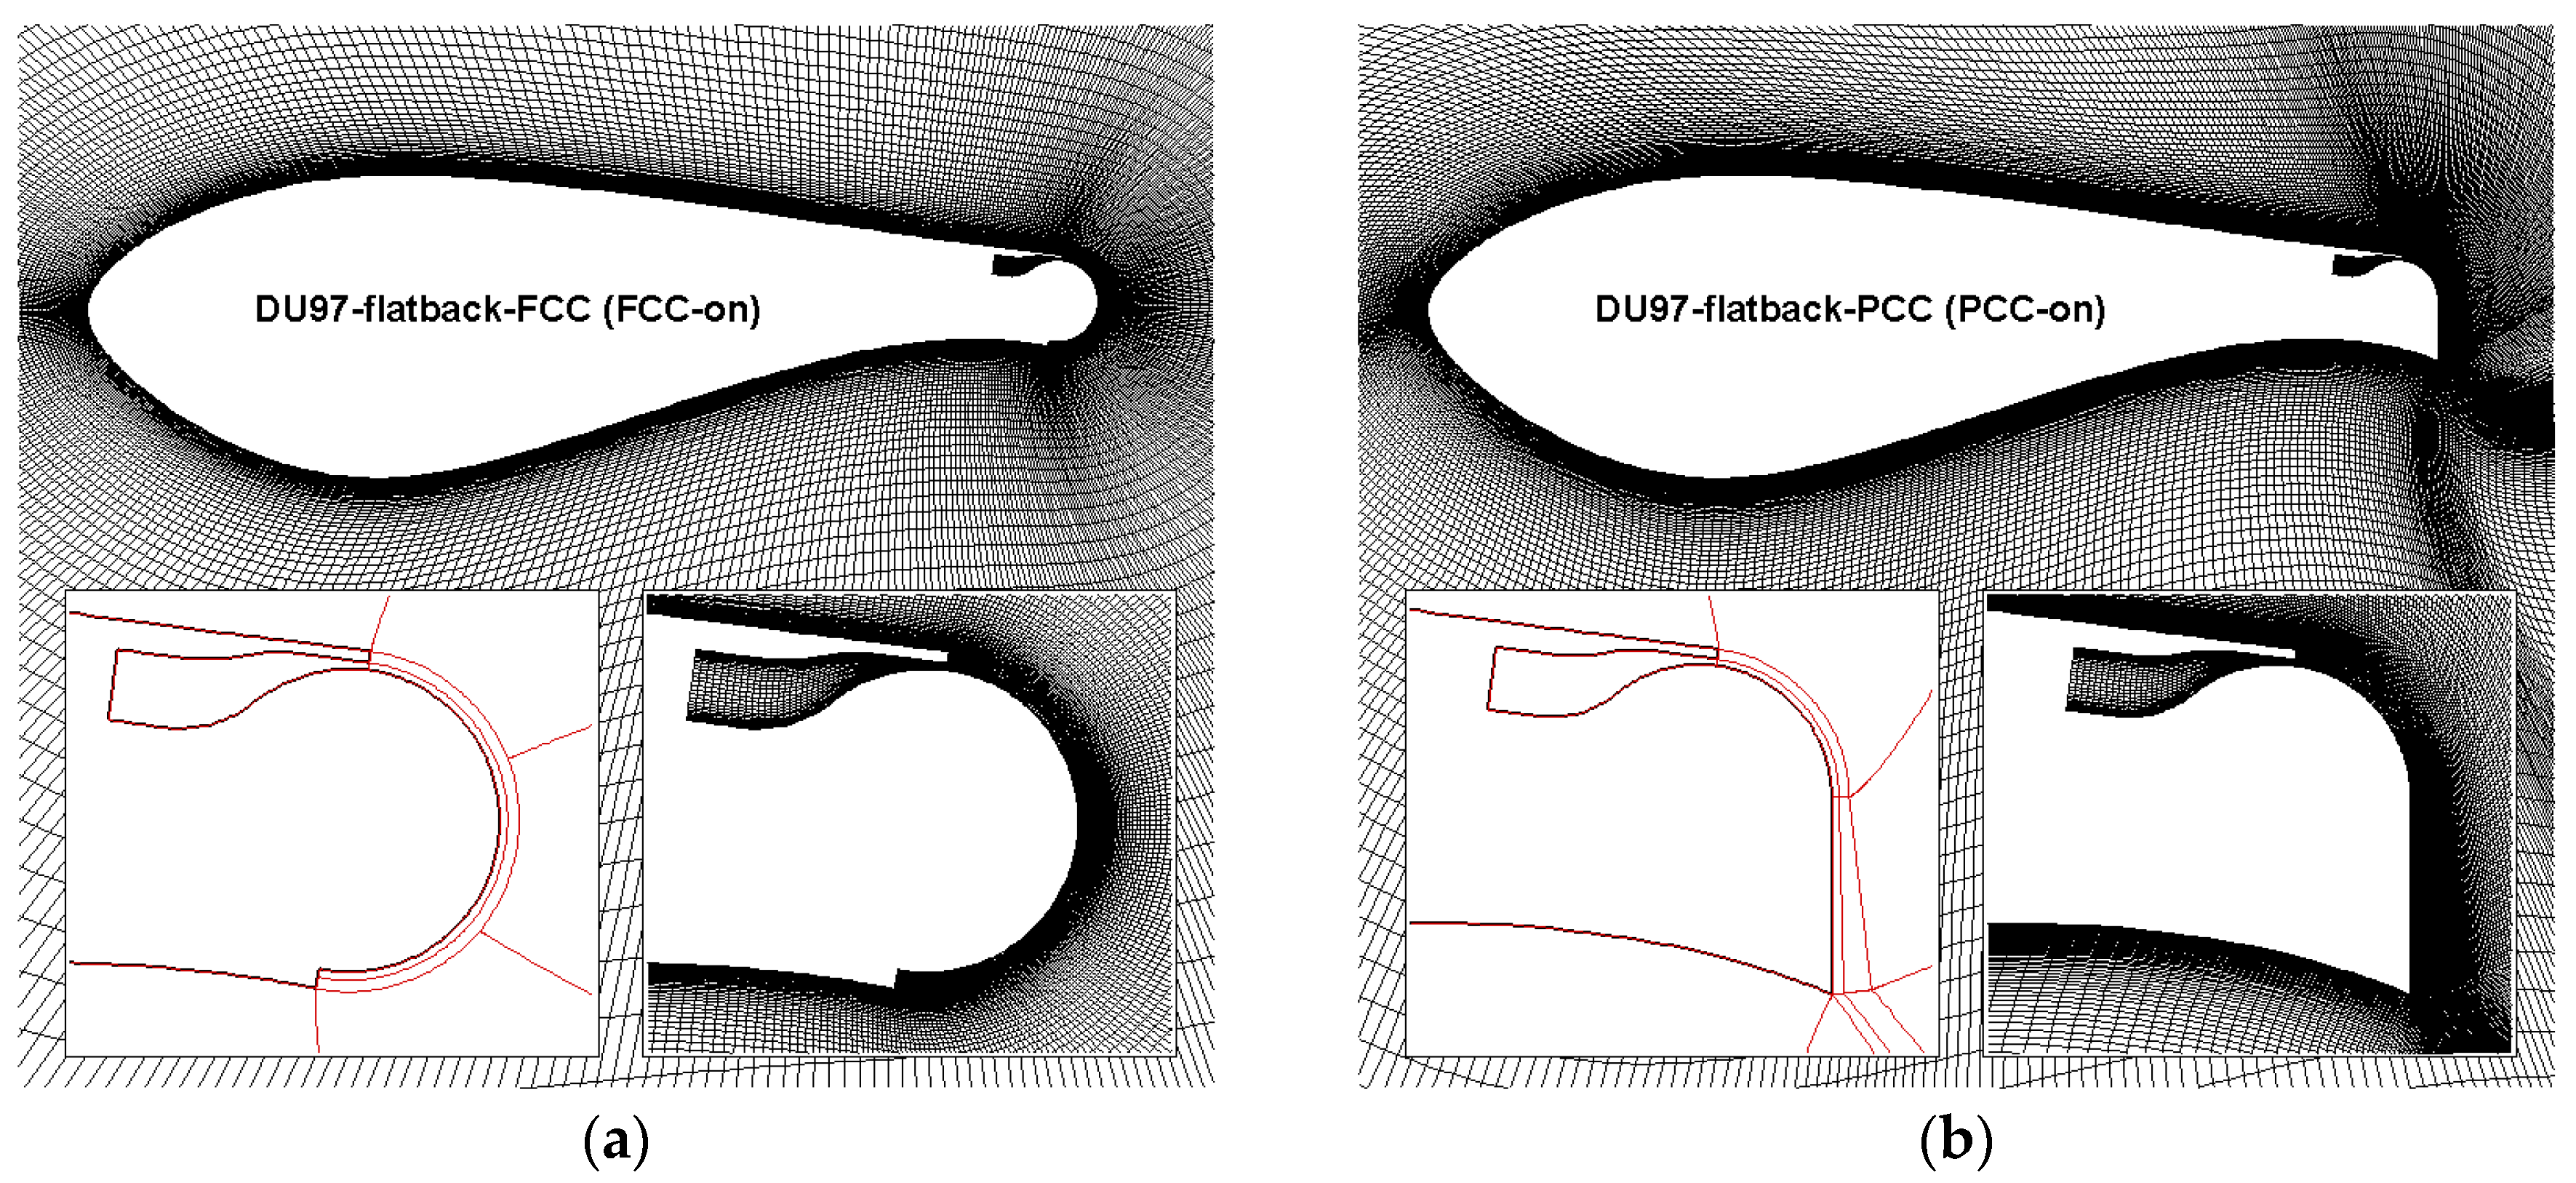
Section 4.1, the grids for CC airfoils are generated based on the scale of the medium B grid of DU97-Flatback. For the FCC-on airfoil as shown in
Figure 8a, the O-grid topology and point distribution on the surface other than the Coanda surface are the same as the DU97-Flatback, and 150 points are equally distributed on the Coanda surface to match the scale distribution and obtain a smooth grid. However, the situation is quite different for the PCC-on airfoil as shown in
Figure 8b, where the point scales and distributions on the surfaces, both non-Coanda surface and Coanda surface, are similar to the DU97-Flatback and FCC-on, but the grid topology is C-type rather than O-type. This difference is due to the different design of the Coanda surfaces. The grid boundary lines between different structured grid subzones are shown in the left enlarged views of the trailing edge areas in
Figure 8 to illustrate the grid topologies near the trailing edges. The dual-step design in FCC-on creates a bottom step, and facilitates local structured grid generation around the Coanda surface as well as in the cavity. The structured zonal grids originate from the inlet boundary in the cavity and the upper step surface, and end at the bottom step surface, forming a perfect closure. However, in the single-step design in PCC-on, no bottom step is created to act as the ending boundary for the zonal structured grids originating from the same cavity and upper step surface, causing difficulty in O-grid generation. Therefore, the C-type grid is adopted for PCC-on, and the left enlarged view in
Figure 8b illustrates the C-topology with boundary lines of zonal grids. From the right enlarged views in
Figure 8, it can be found that the grid distributions on the Coanda surfaces and in the normal directions are both fine, which is helpful in resolving the Coanda jet flow.
In general, the blunt trailing edge airfoil is located in the inboard region within 40% of the blade, and the working wind speed is usually below 15 m/s. Due to the concerns of compressibility and aero-acoustic noise, the tip speed of the conventional large wind turbine blade is usually limited below 80 m/s (the actual tip speed might be higher for modern wind turbines). Therefore, the head wind speed of the blunt trailing edge section is usually in the low subsonic regime and varies with the radial location. On the other hand, in the CFD simulation using a code without any pre-condition treatment, a Mach number much lower than 0.1 may cause the slow-convergence problem. Hence, in the present study, Ma = 0.10 is chosen for the head wind Mach number, although it might be a little higher than an actual situation. The chord Reynolds number is set as Re = 3.0 × 10
6, and AoAs = −4–20°. For the CC simulations in this subsection,
Cμ = 0.030. All the five airfoils are simulated for comparison at the same aforementioned conditions of Mach number, Reynolds number and AoAs. For the two jet-off configurations, the high-pressure cavities are removed, and the slot surfaces are defined as solid surfaces.
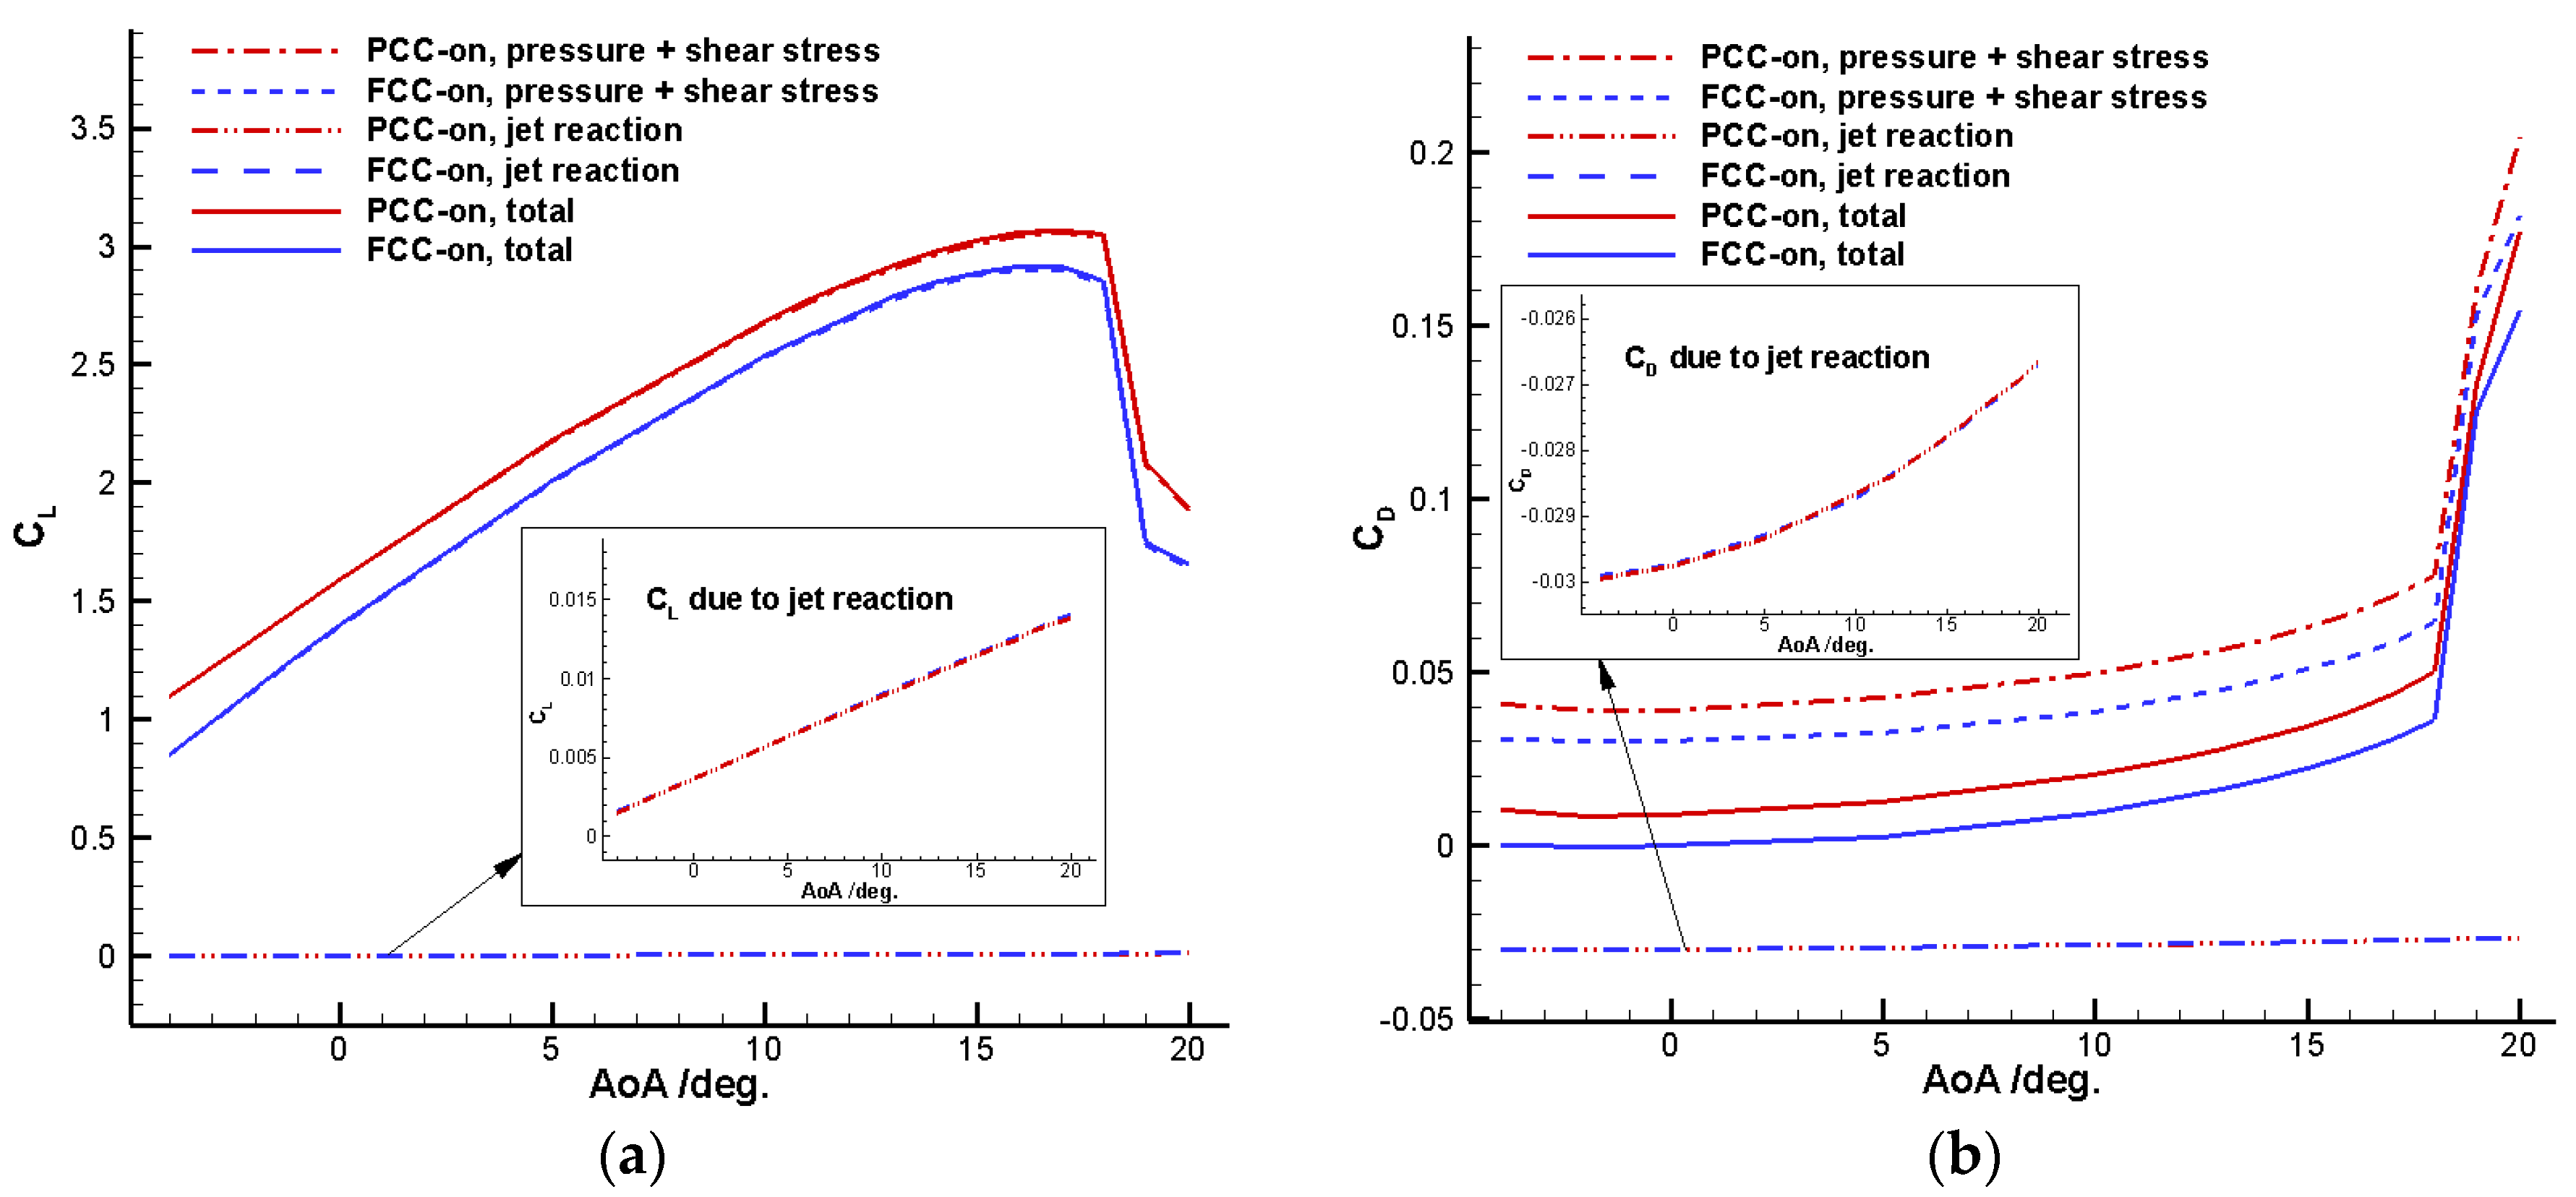
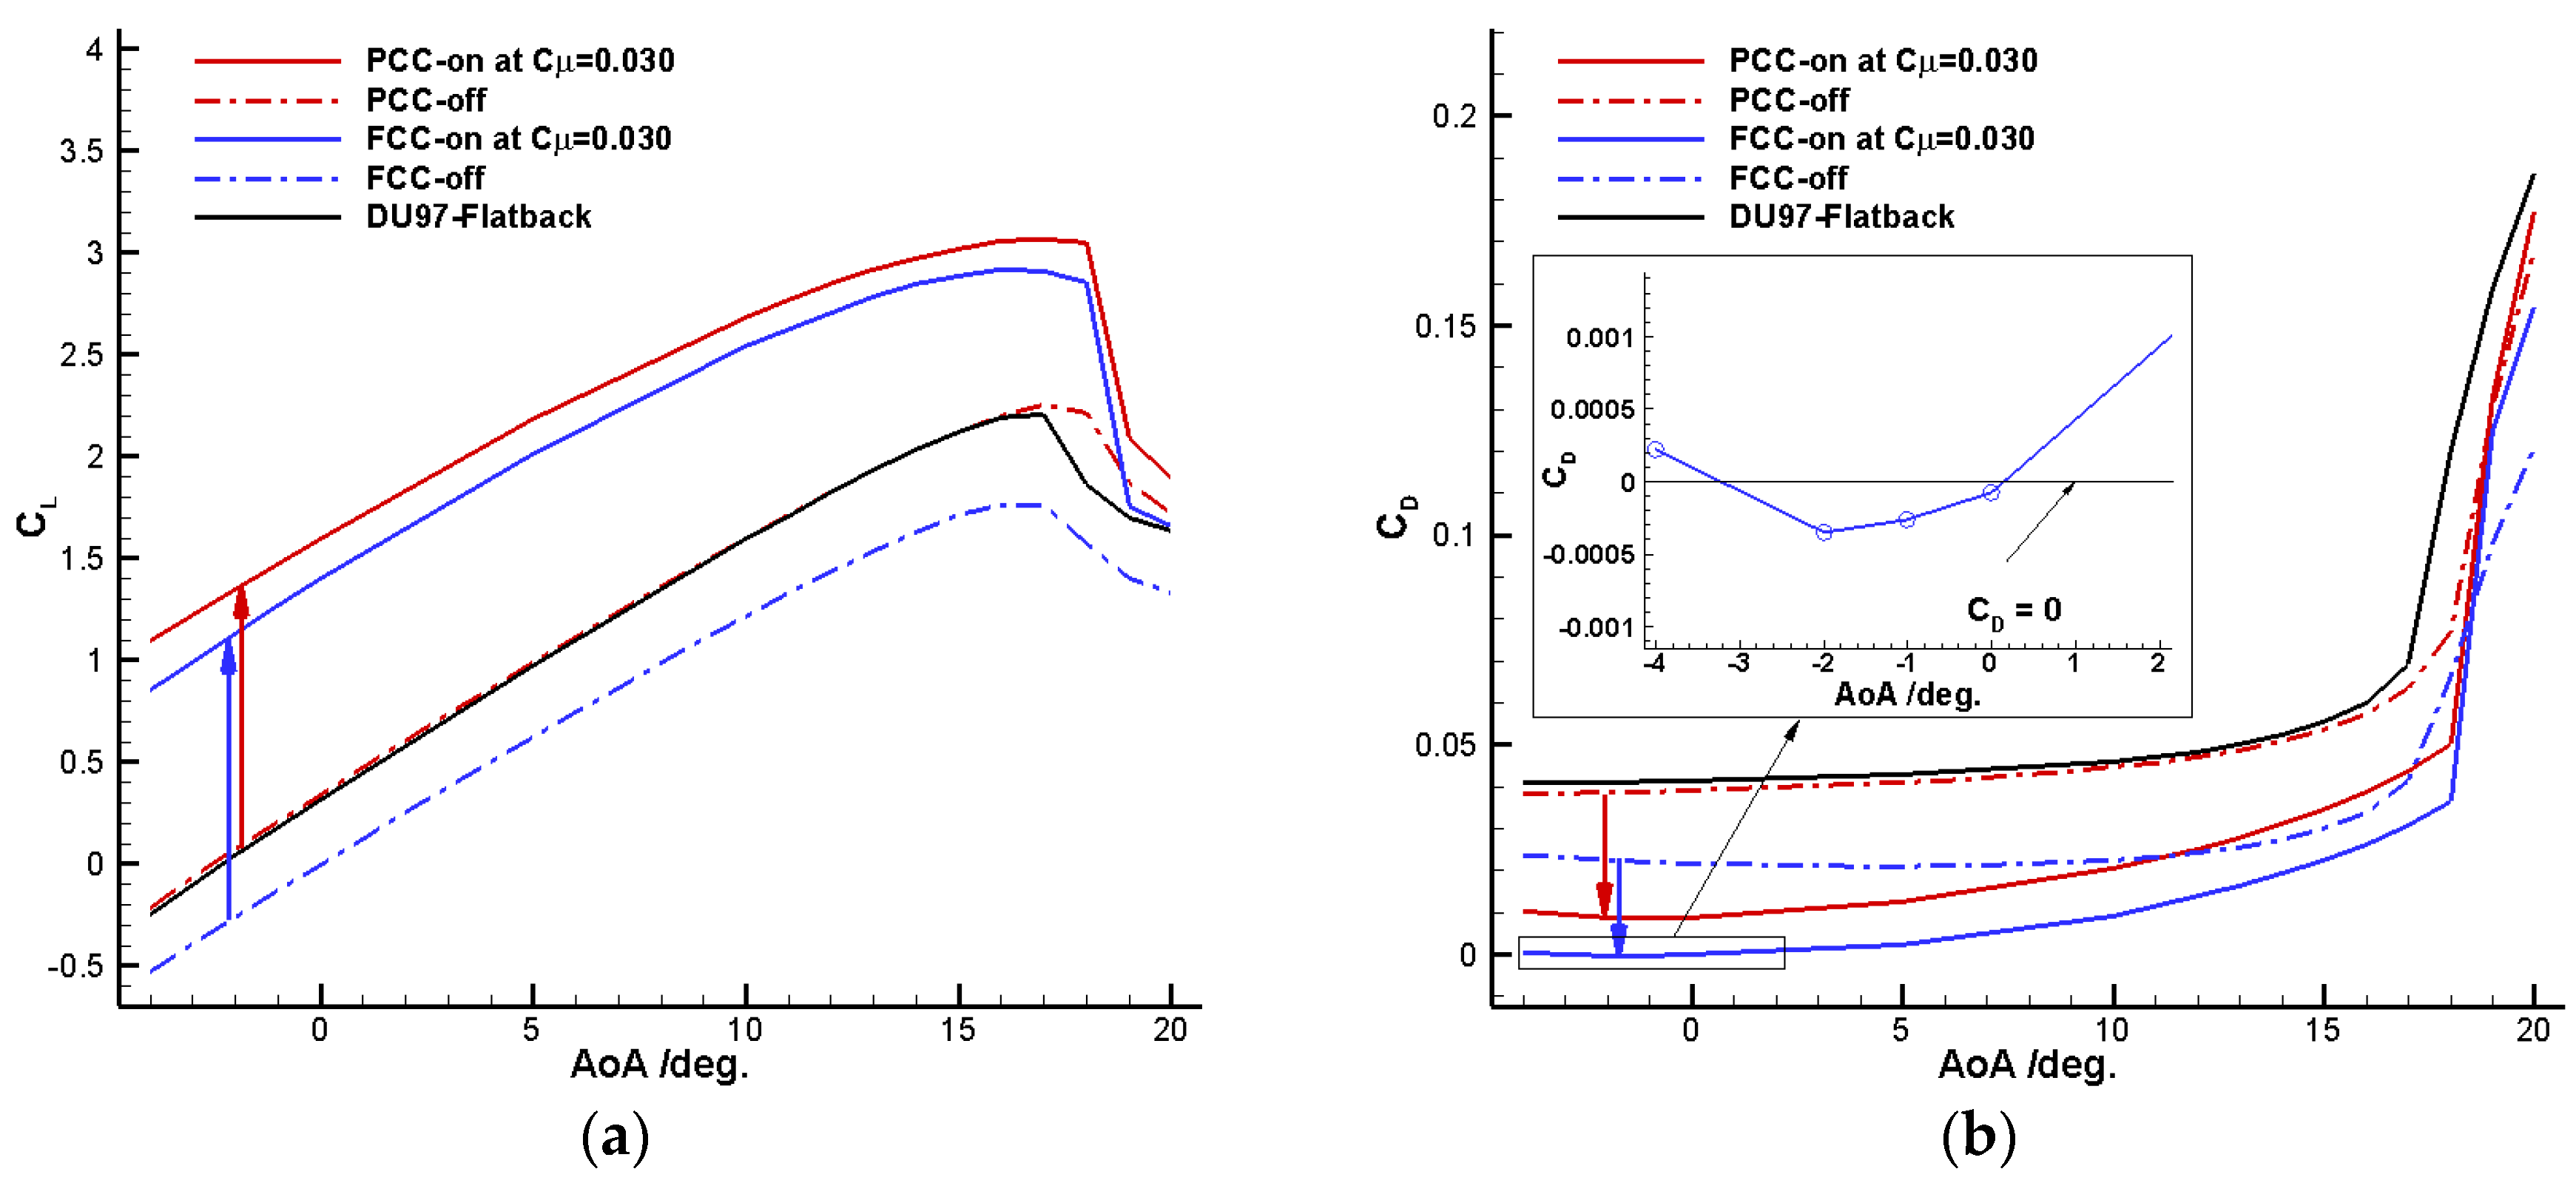
Figure 9 gives the comparison of lift and drag coefficients between different cases.
Four observations can be obtained from the comparison of lift coefficients in
Figure 9a. (1) PCC-off has the ability to maintain the lift level of the baseline DU97-Flatback, and even provide slight enhancement in lift characteristics at some AoAs. The lift coefficient is increased a little for AoAs below 10°, and the stall is delayed by about 1°. For AoAs = 10~16°, the lift coefficient line almost coincides with that of the baseline DU97-Flatback. That is to say, the PCC modification to the trailing edge can avoid any degradation in lift characteristics compared with the baseline flatback airfoil. This is a very important advantage of the newly proposed PCC design; (2) FCC-off generates significant reduced lift while remains almost unchanged stall AoA. At the typical working AoA = 15°, the lift coefficients of FCC-off and the baseline DU97-Flatback are 1.71 and 2.12, respectively. The FCC-off design causes a decrement as high as 0.41, which is detrimental to the wind turbine performance once the Coanda jet is turned off; (3) Both the PCC-on and FCC-on with
Cμ = 0.030 significantly enhance the lift coefficients and increase the stall AoA a little by about 1°, compared with the baseline DU97-Flatback. Moreover, PCC-on generates a much higher lift coefficient than FCC-on over the entire range of AoAs, which is another advantage of the present PCC design. At the typical working AoA = 15°, the lift coefficient of PCC-on reaches 3.02, while that of FCC-on is 2.89. This increment of 0.13 in lift coefficient is significant in amount in flow control; (4) It is interesting to note that the increment in lift coefficient between the jet-off and jet-on cases of FCC is larger than that of PCC, although PCC outperforms FCC in terms of total lift characteristics in both jet-off and jet-on situations. As indicated with the arrows in
Figure 9a, at AoA = −2°, the increments of PCC and FCC are 1.277 and 1.394, respectively, and FCC’s is 0.117 larger than PCC’s. This phenomenon exists over the entire range of AoAs, especially at higher AoAs, indicating that the lift-enhancement efficiency in terms of lift increment between jet-on and jet-off is better for FCC, compared with PCC. This might be one reason that the FCC design is in common use in aeronautical CC applications. This study finds that this may be misleading. The lift characteristics in terms of ultimate total value rather than just increment between jet-on and jet-off cases should be the most concerned aspect in practice. The larger increment of FCC is offset by its much lower jet-off lift coefficient value, resulting in a much lower total lift coefficient value than that of PCC. Therefore, PCC is better than FCC in terms of lift characteristics. It is noted that both PCC-on and FCC-on cause severe and abrupt stall, and only slightly favorable control are achieved, since the lift coefficients after stall are a little higher than the baseline DU97-Flatback, and the drag coefficients after stall are a little lower than the baseline DU97-Flatback. Hence, this stall behavior indicates that the present CC technique is effective only for the attached flow regime.
From the comparison of drag coefficients shown in
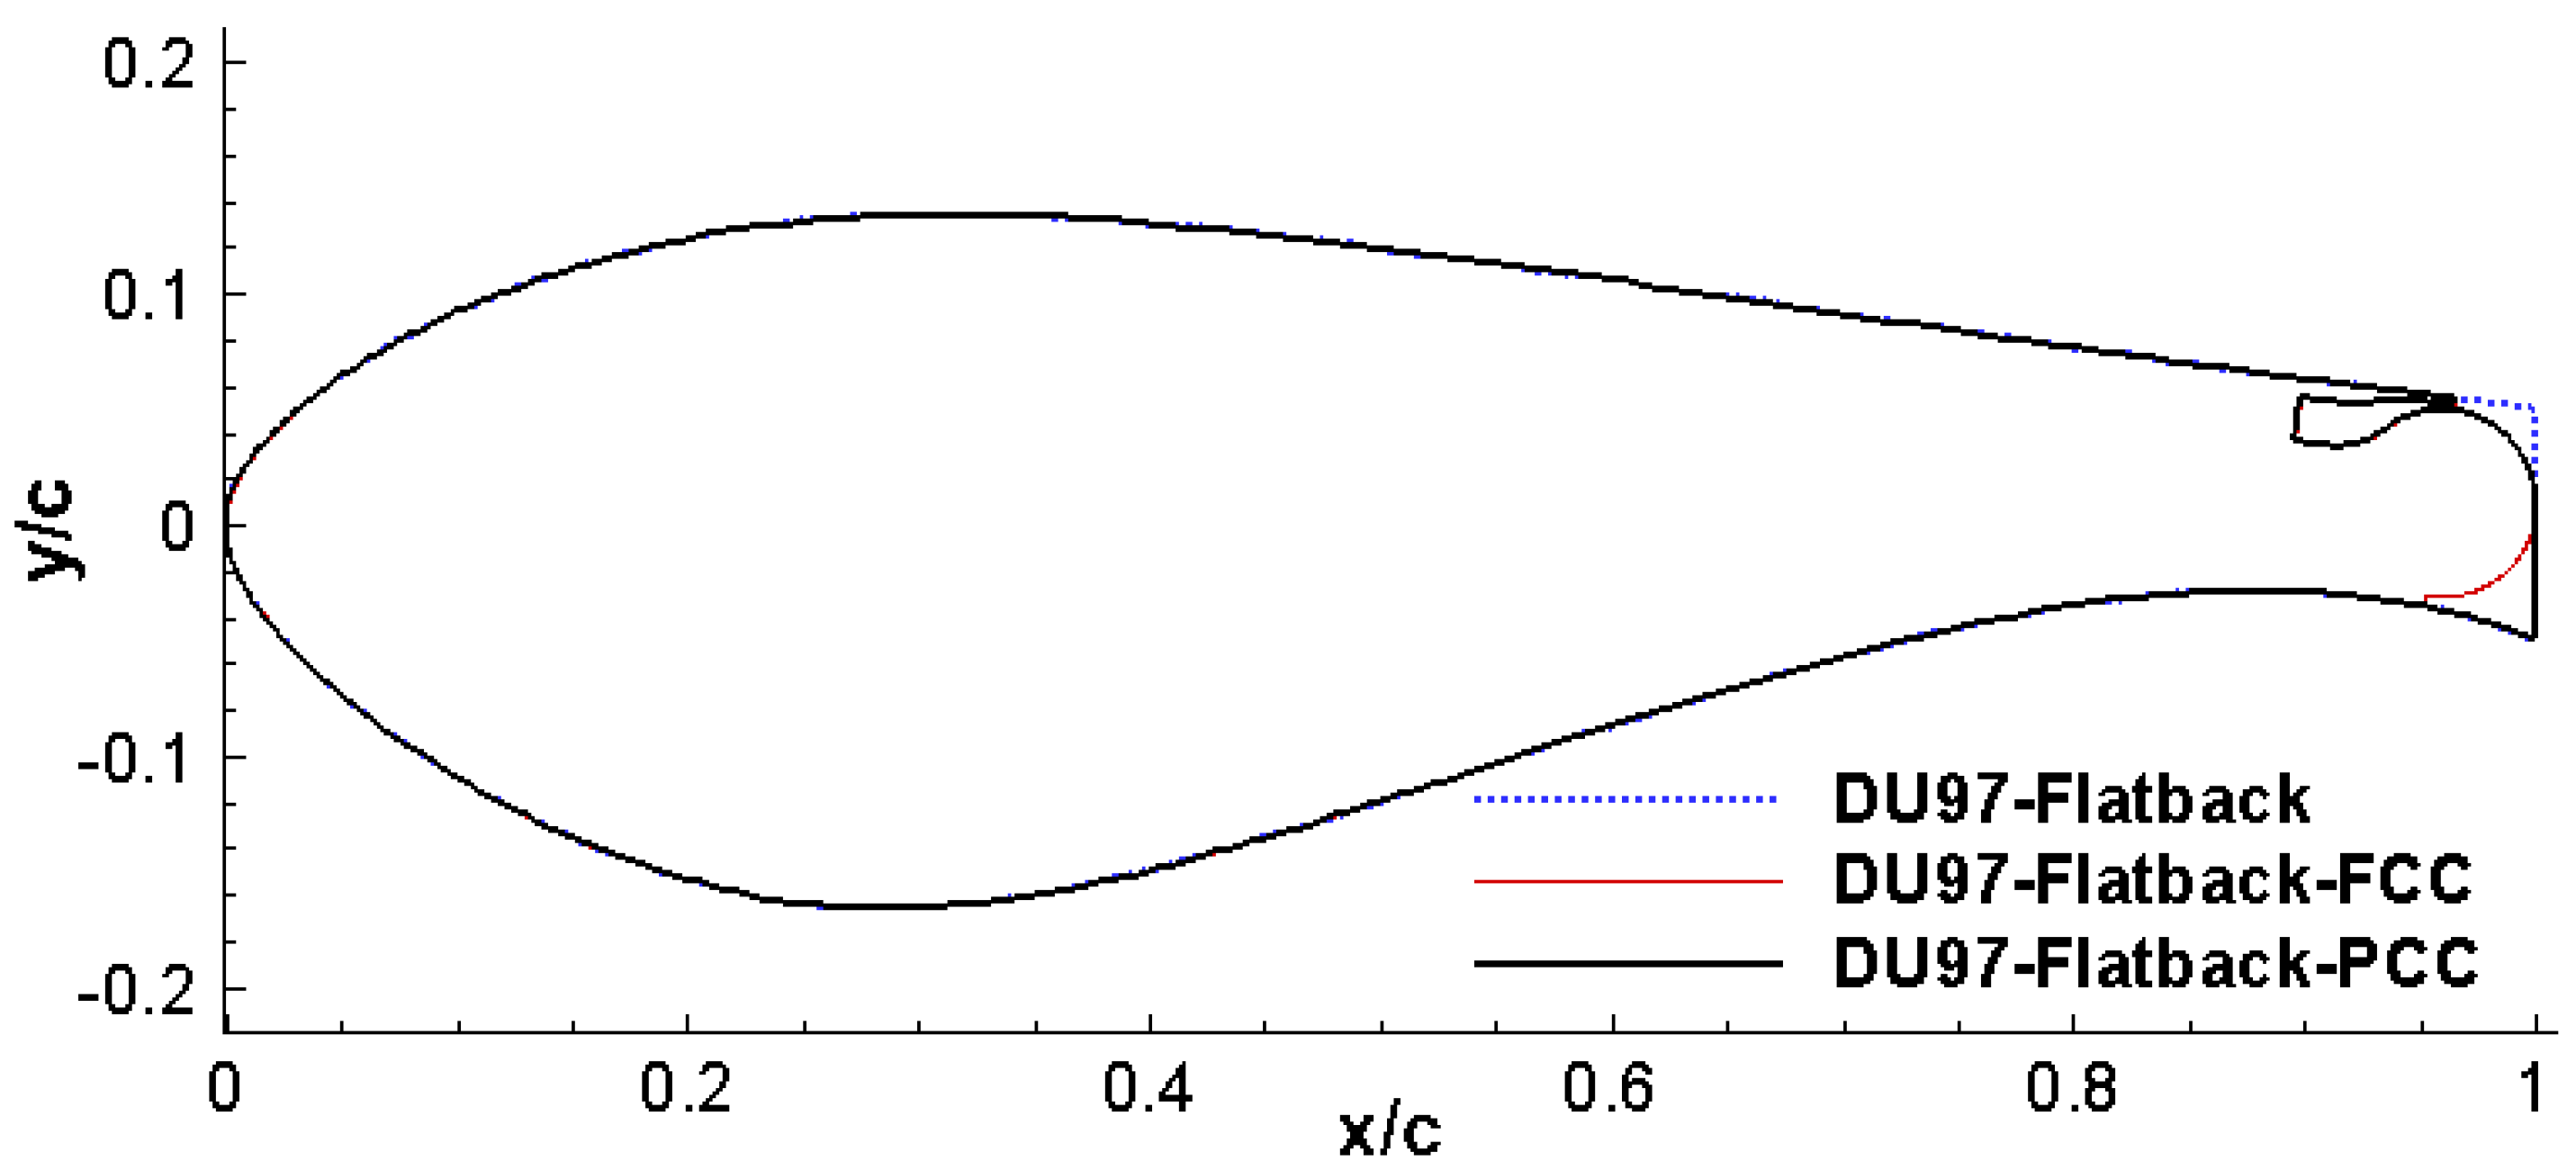
Figure 9b, three more observations can be obtained: (1) The baseline DU97-Flatback has the highest drag, which is consistent with the fact that DU97-Flatback has the bluntest trailing edge that will produce a larger base drag; (2) For the two jet-off configurations, PCC-off has a slightly lower drag and FCC-off has a significantly lower drag, compared with the baseline DU97-Flatback. This is understandable if we observe the trailing edges shown in
Figure 2. The flatback trailing edge of DU97-Flatback is modified to a smoother and streamlined shape with a full circular Coanda surface to form FCC and with a partial circular Coanda surface to form PCC. Moreover, the trailing edge thicknesses of PCC and FCC are reduced after the modification to the baseline flatback trailing edge. Because FCC loses more trailing edge thickness, its drag is reduced more significantly, nearly reaching half of the baseline; (3) When the Coada jet is activated, PCC-on and FCC-on can both reduce drag to very low levels, and FCC-on has the lowest drag over the entire range of AoAs in the attached flow regime. Just as the above comparison between FCC and PCC in terms of total lift coefficient and increment in lift coefficient, there is also a similar comparison between FCC and PCC in terms of ultimate total drag coefficient and decrement in drag coefficient. As indicated with the downward arrows in
Figure 9b, also taking AoA = −2°, for example, the drag coefficient of PCC reduces from 0.0386 to 0.0086, producing a decrement of 0.0300; the drag coefficient of FCC reduces from 0.0225 to a negative value of −0.0004, producing a decrement of 0.0229. PCC has a better ability in reducing drag than FCC in terms of drag decrement, whereas FCC-on outperforms PCC-on in terms of ultimate total drag. The advantage of reducing more drag for PCC is offset by its larger jet-off drag, resulting in a much higher ultimate total drag than that of FCC. Therefore, FCC is better than PCC in terms of drag characteristics. However, it should be noted that the difference between PCC-on and FCC-on in drag coefficient (0.0090 at AoA = −2°) is relatively small when compared with the difference in lift coefficient (0.217 at AoA = −2°). From the formula for wind power output given by Equation (8), it can be found that lift increment will contribute more to the power output than drag decrement. Therefore, in this sense, the present PCC is better than FCC based on comprehensive analysis on lift and drag characteristics.
As mentioned in the above drag characteristics analysis, it’s interesting to note that the drag coefficients at AoAs = −2°, −1° and 0° are below zero, as shown in the close-up window in
Figure 9b. This means there is a thrust rather than a drag for FCC-on at these AoAs, which is seemingly contradicting our common sense that any solid body produces an amount of drag when moving in a fluid. Actually, considering the aerodynamic analysis for CC implementation in
Section 3.3, it is possible for the drag to reach a negative value if the Coanda jet is injecting at a sufficiently high momentum coefficient. It was also found in previous studies of co-flow jet control [
37] and Coanda jet control [
21] that the jet reaction force is the main contribution to the negative drag. Here, we would highlight this phenomenon by explaining more from a different perspective rather than just repeat the finding. According to Equations (3) and (4) in
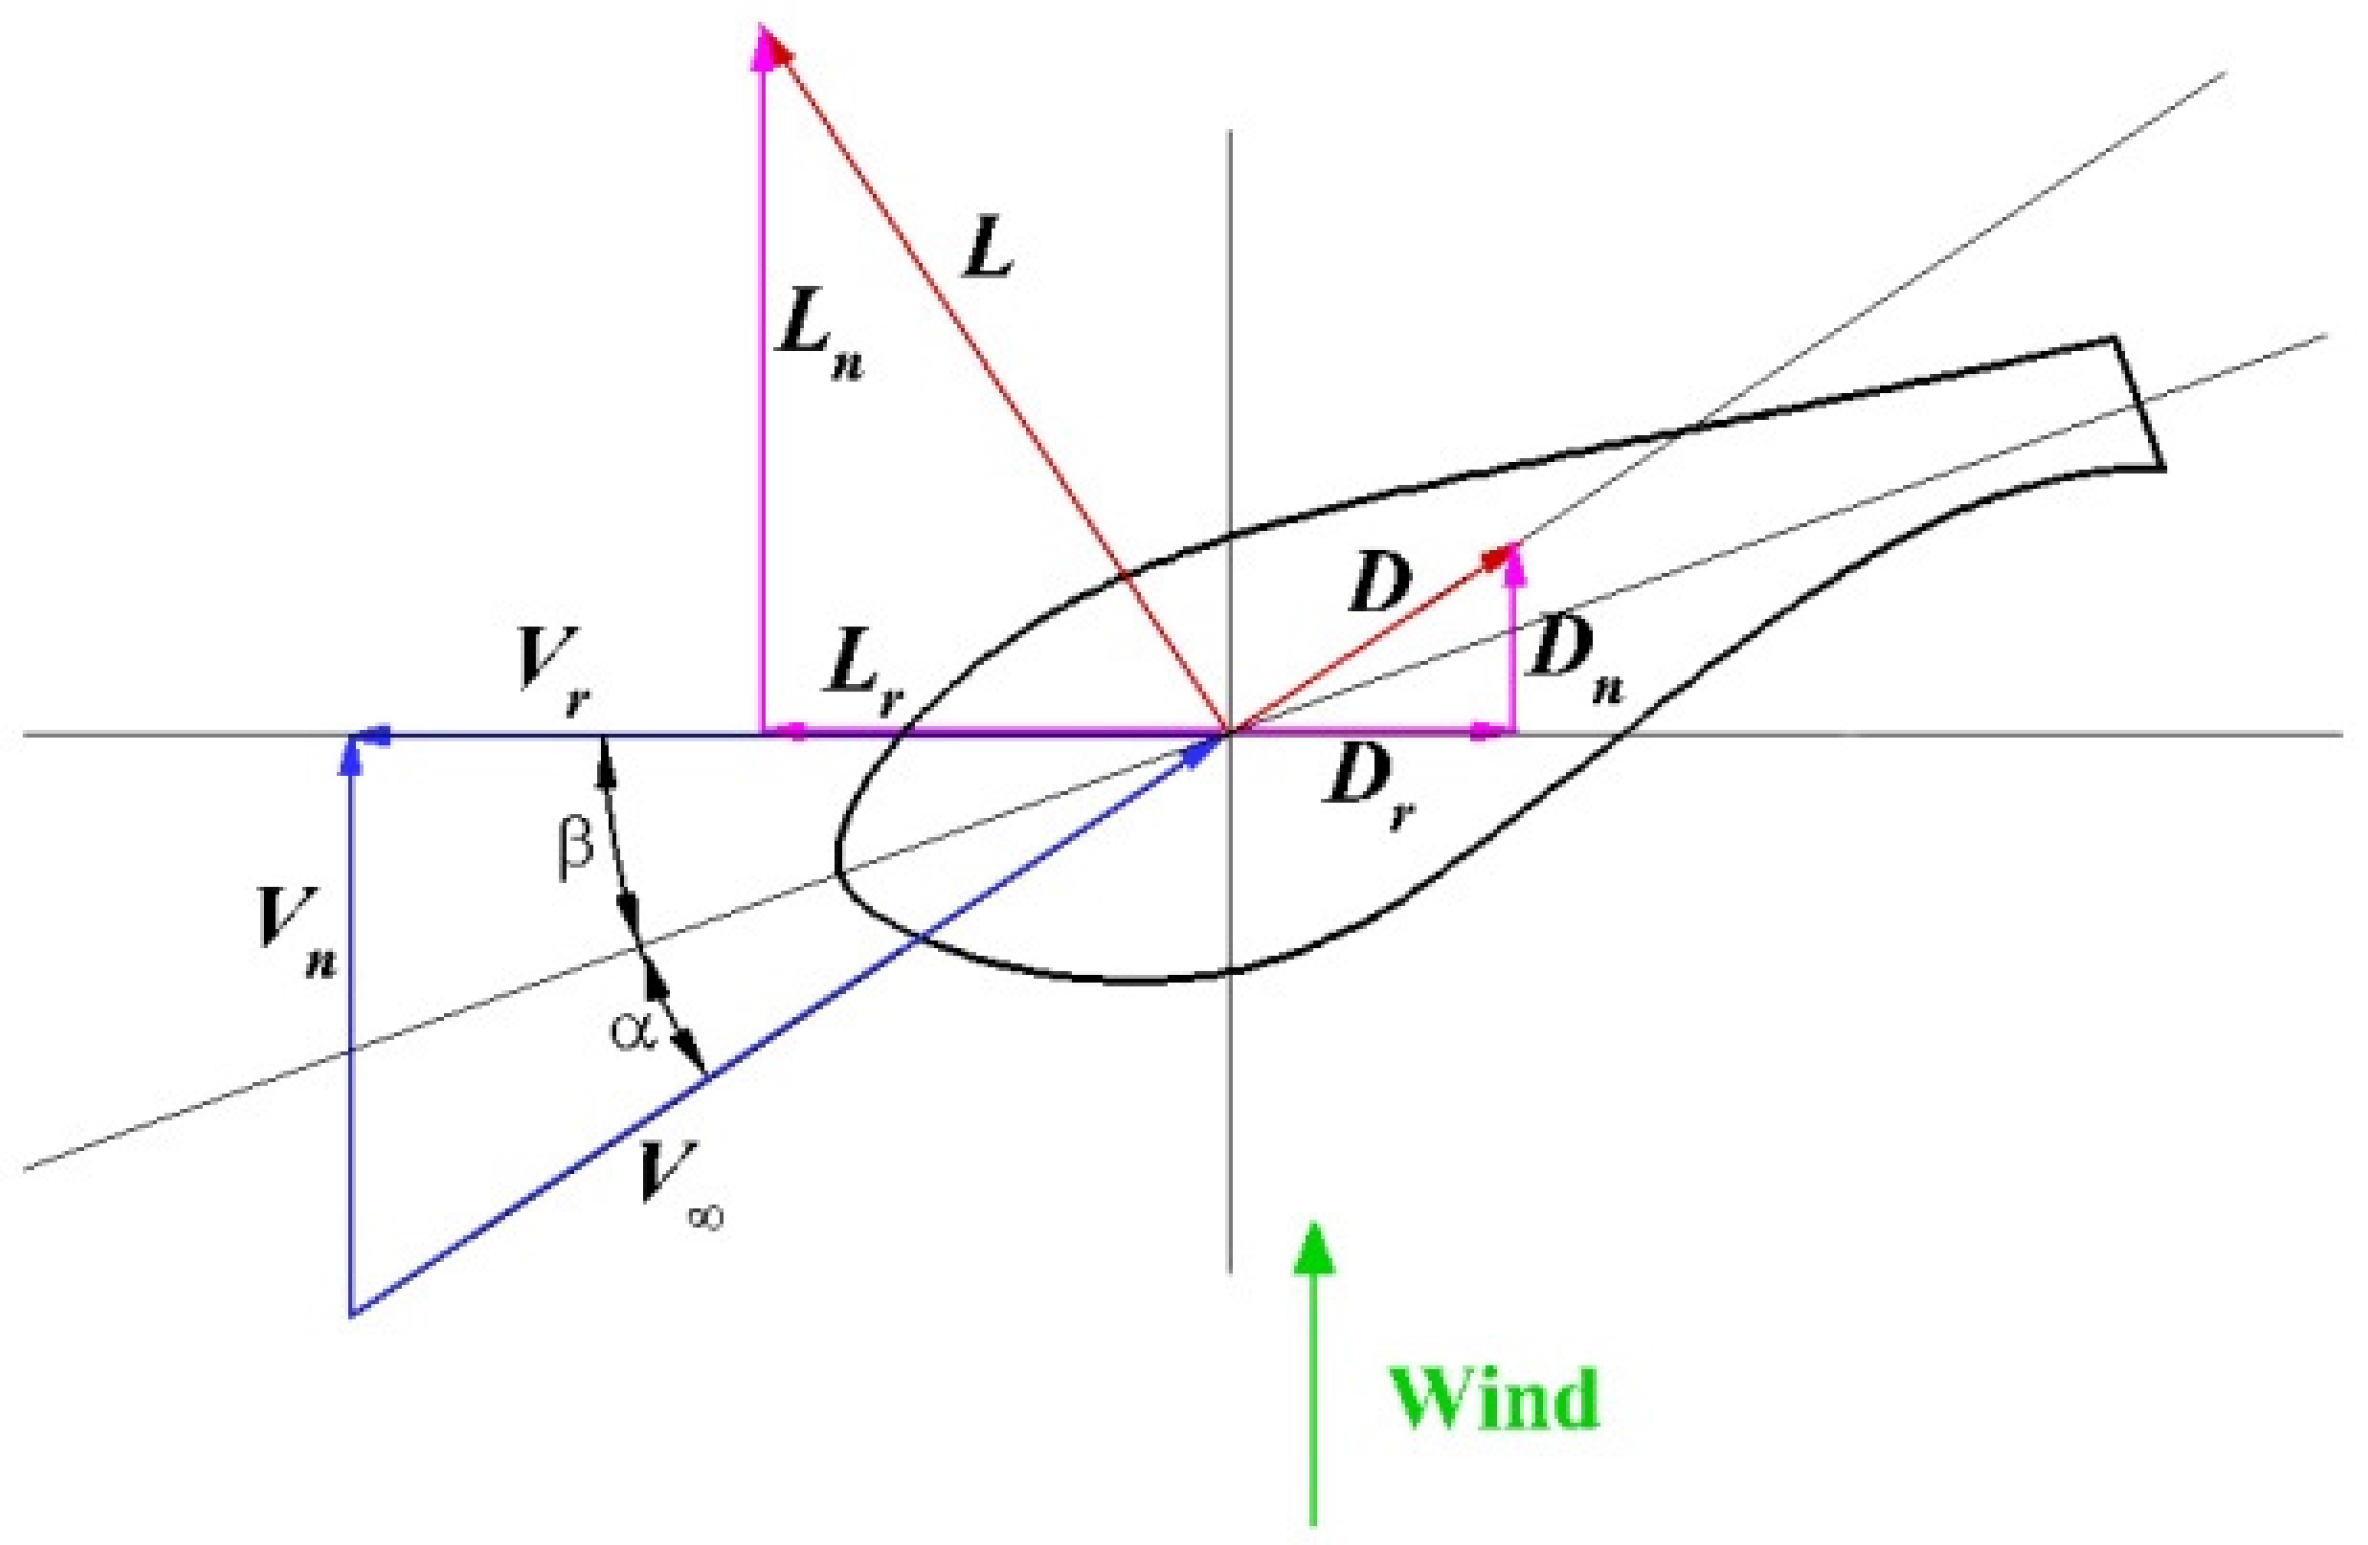
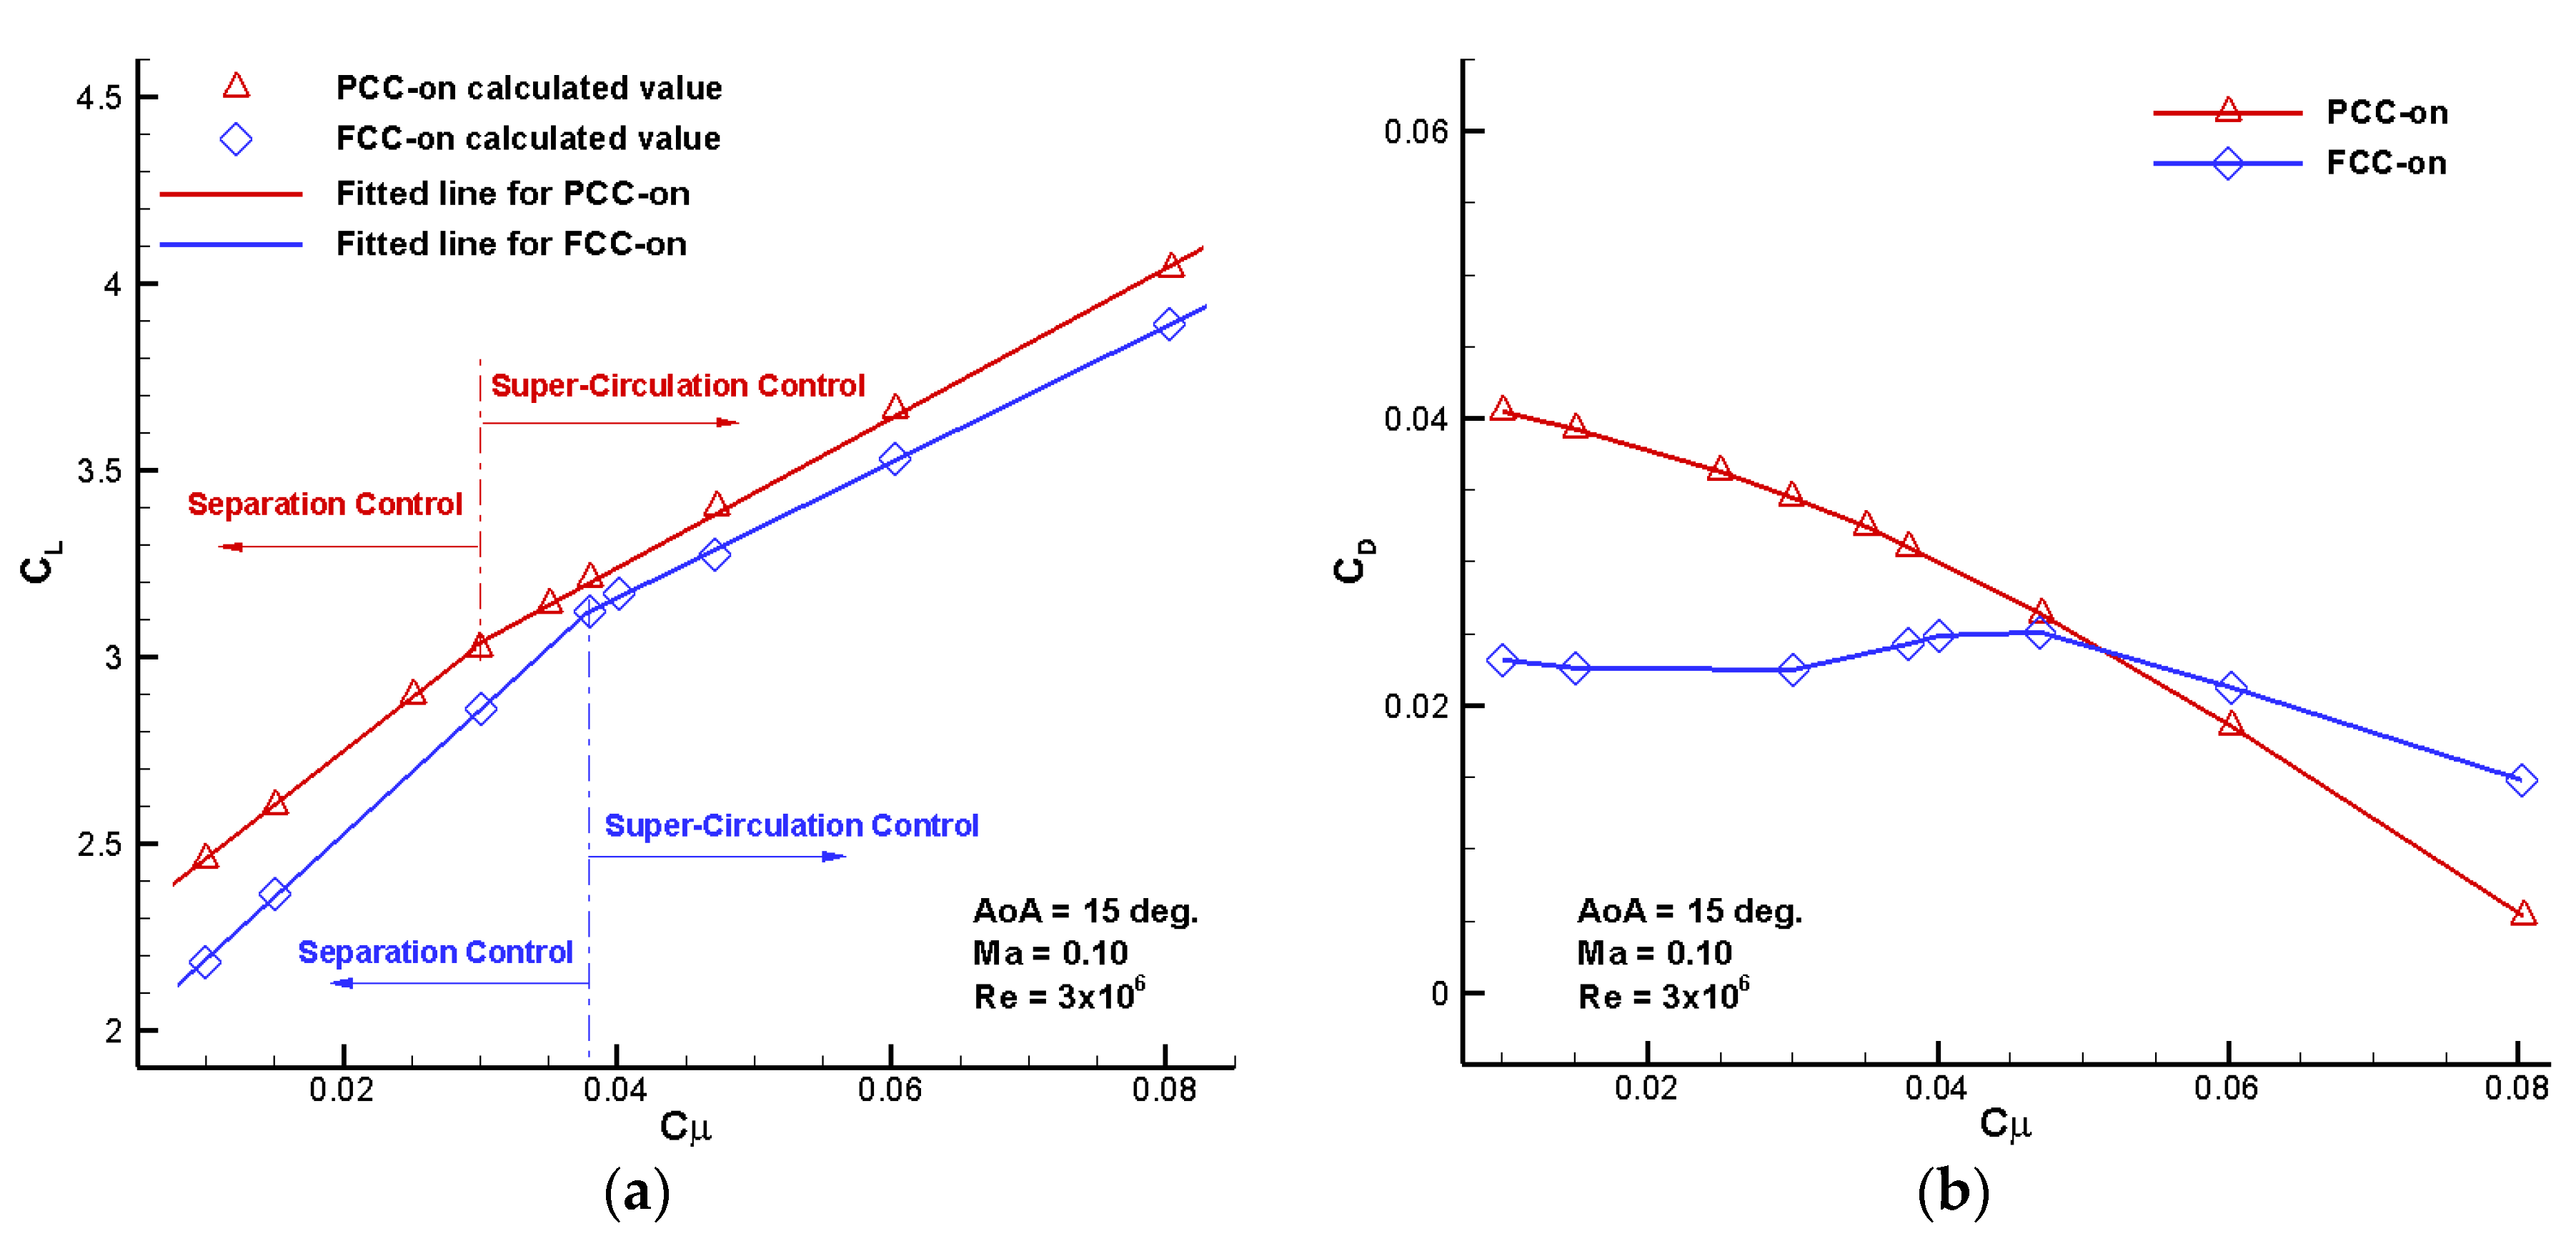
Section 3.3, the total lift and drag coefficients are decomposed into two components, respectively: lift and drag coefficients from pressure and shear stress, lift and drag coefficients from Coanda jet mass flow.
Figure 10 displays the decomposition results. Due to the jet reaction thrust, PCC-on and FCC-on both produce a very small amount of positive lift, as well as a relatively large negative drag which leads to total negative drags at AoAs = −2°, −1° and 0°. In
Figure 10,
Cμ remains 0.03 for all cases, and hence the resultant jet thrust
CThrust is kept constant. The amount that the jet thrust contributes to lift or drag is dependent on the angle between the thrust direction and the lift or drag direction. By examining the profiles of DU97-Flatback-PCC and DU97-Flatback-FCC, it can be found that the angle between the horizontal chord line and the jet thrust direction is 7.5°. As a result, the angle between the lift direction and the jet thrust direction can be expressed as 90–7.5°-AoA, and hence it is 86.5° at the starting AoA = −4°, and monotonically reduces to 62.5° at the ending AoA = 20°. Similarly, the angle between the drag direction and the jet thrust direction varies from 3.5° at AoA = −4–27.5° at AoA = 20°. Therefore, the lift component of the jet thrust has an increasing trend over AoAs = −4–20° as shown in the enlarged view in
Figure 10a, and the drag component of the jet thrust has a decreasing trend in absolute values over AoAs = −4–20° as shown in the enlarged view in
Figure 10b. The lift and drag coefficients of PCC-on and FCC-on due to the jet thrust are almost coincident, because the two configurations possess the same slot design and jet momentum coefficient.
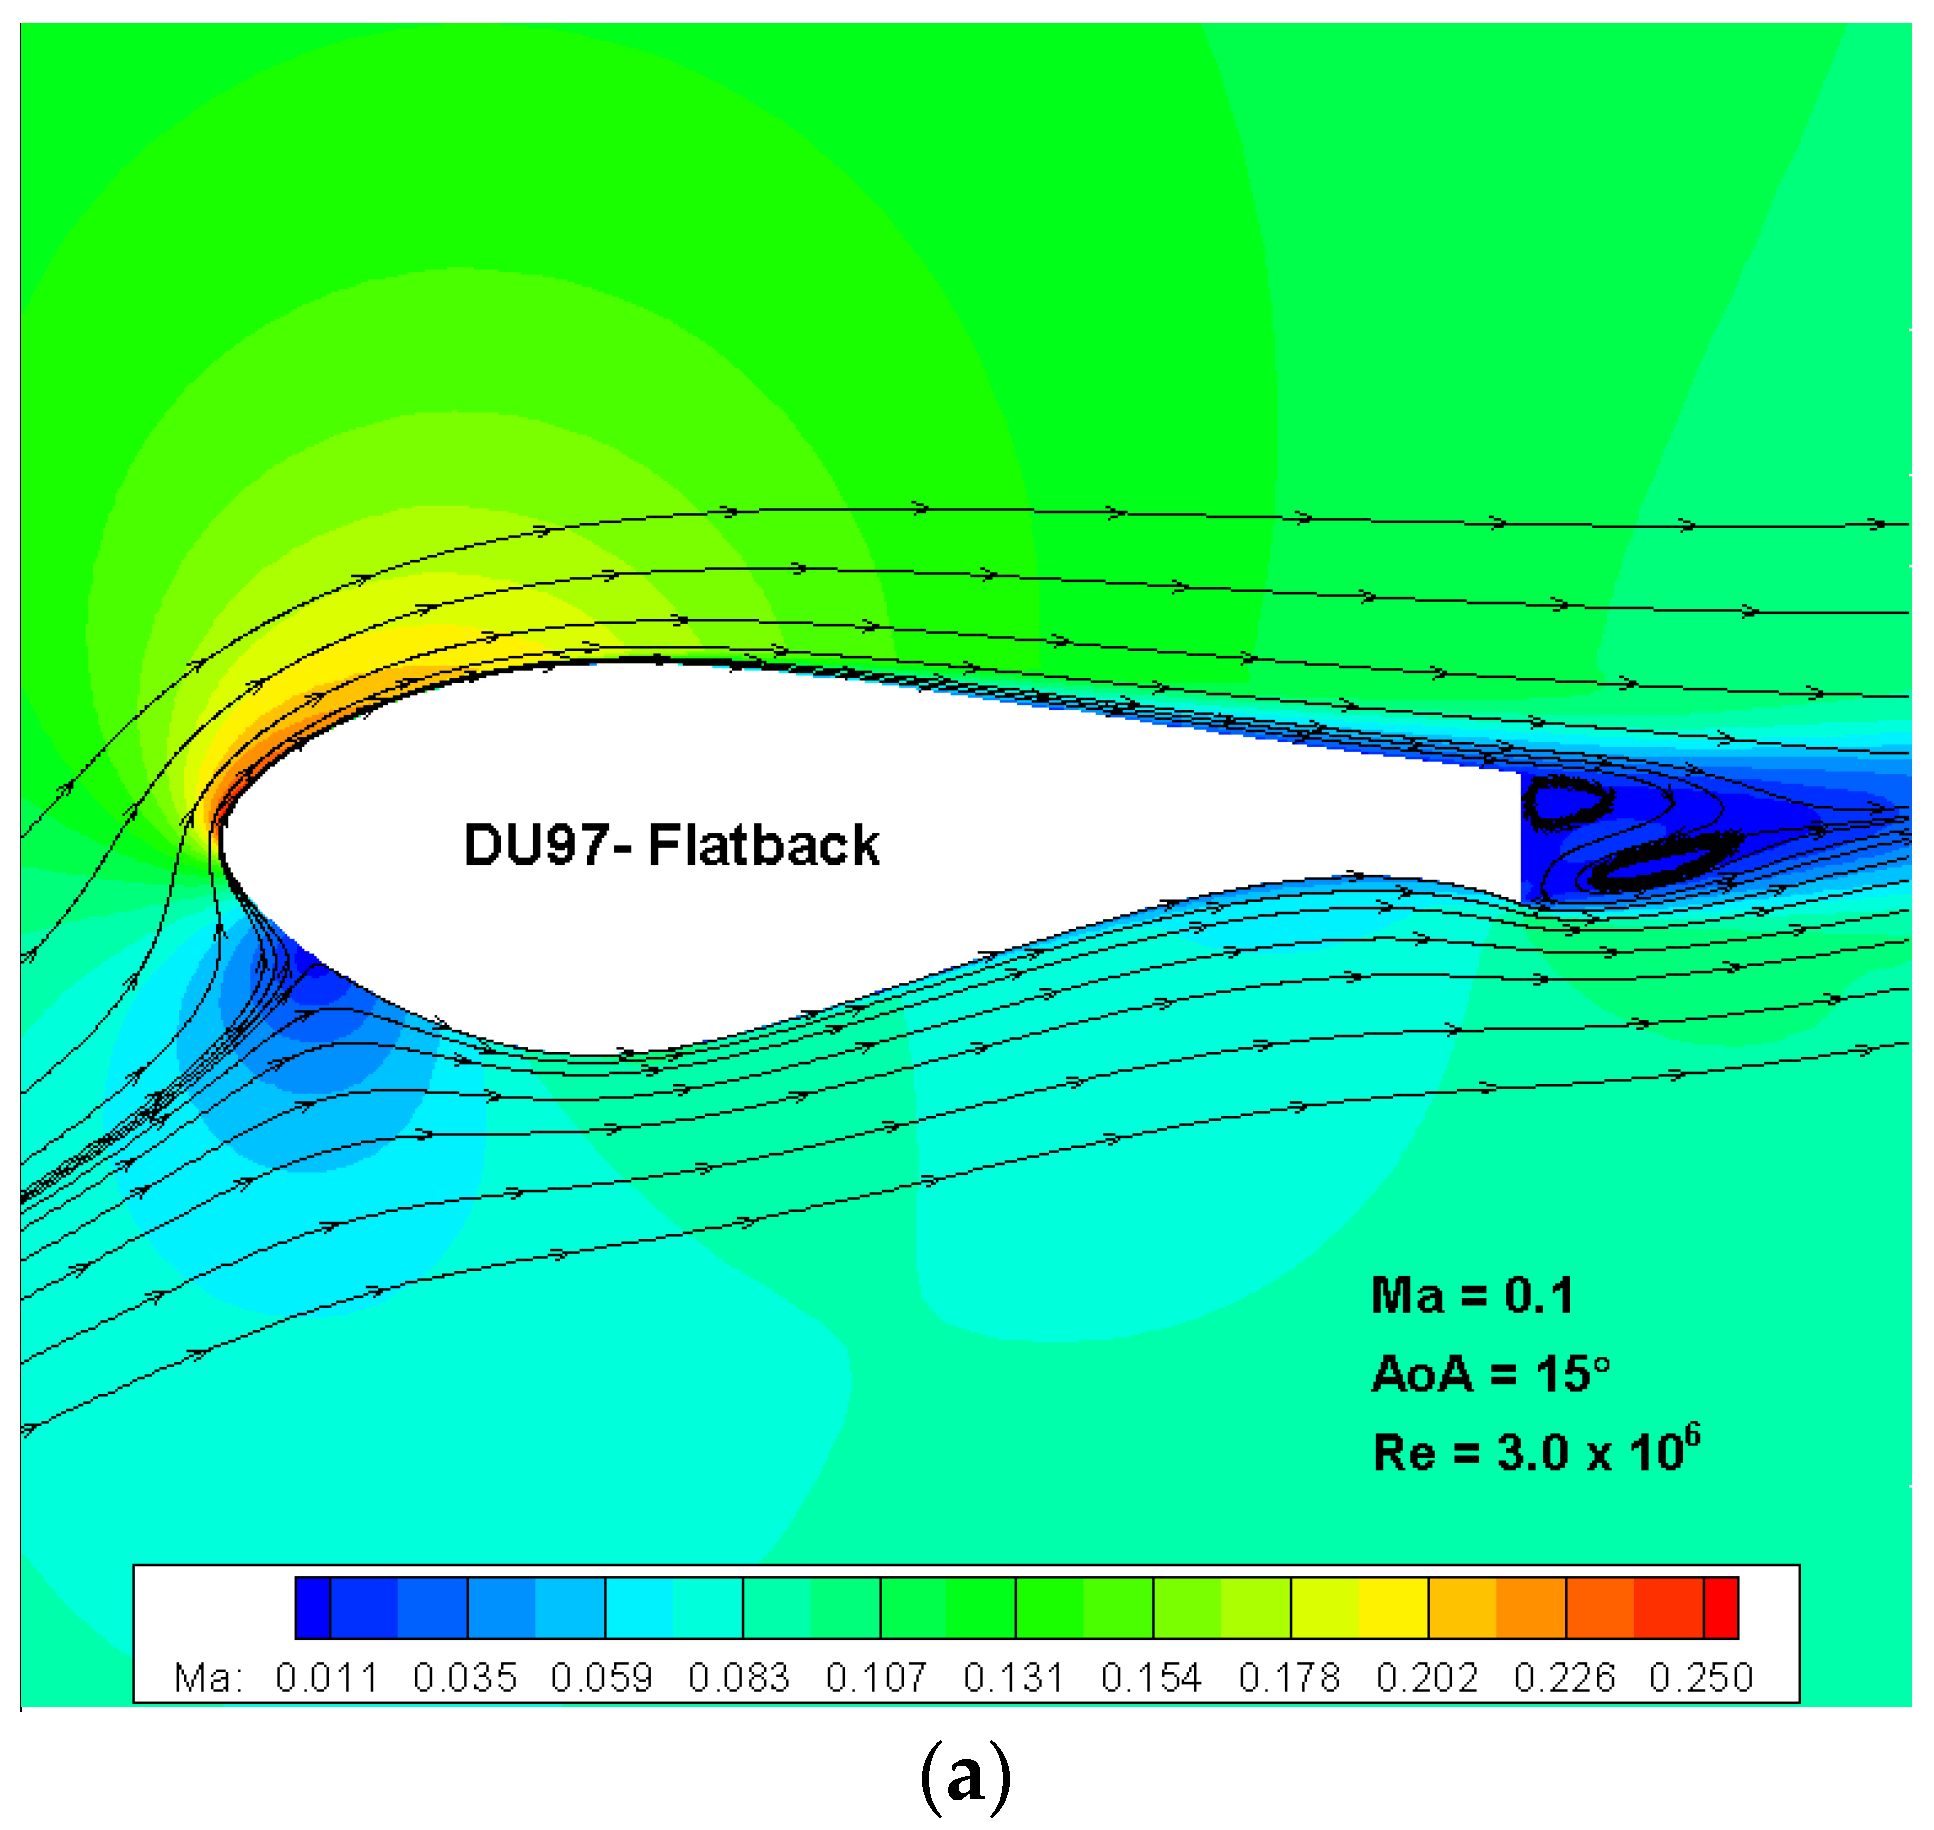
The flow fields of the five airfoils at the same AoA = 15° with streamlines and Mach number contours on the same scale are given in
Figure 11. Comparing the first three cases without jets, the baseline DU97-Flatback has the largest counter rotating wake vortex pair due to the bluntest trailing edge, thus producing the largest base drag. In addition, the comparison of streamline patterns near the bottom trailing edges in
Figure 11a–c can intuitively indicates the difference in lift. The streamlines near the bottom trailing edge of the baseline DU97-Flatback and PCC-off are both forced to bend more downward than FCC-off, due to the presence of the sharp and downward-oriented corner. The circular shape of the bottom trailing edge after the FCC modification results in a significant change to the effective camber as well as the trailing edge Kutta condition. The streamlines near the bottom trailing edge of FCC-off will not bend downward as much as the PCC-off or the baseline DU97-Flatback. Therefore, FCC-off suffers a significant degradation in lift performance, while PCC-off holds the same lift level as the baseline DU97-Flatback, as shown in
Figure 9a. For the two cases with Coanda jets activated shown in
Figure 11d,e, the streamlines bend downward significantly due to the entrainment of jets. From the discussion on circulation around a lifting circular cylinder in the classic aerodynamics textbook by Anderson [
41], a larger circulation is accompanied by a larger deflection of free stream direction and a more downstream leading edge stagnation point. Therefore, in this sense, the Coanda jets in
Figure 11d,e drastically increase the circulation and hence the lift. To compare the deflection degrees of freestream streamlines in an intuitive way, the views in
Figure 11 are all displayed in the same scale when plotting these flow fields, and the streamlines through the respective leading edge stagnation points are given. It can be seen that the streamlines of PCC-on bend downward the most, and the streamline deflection degree of FCC-on is weaker than but very close to that of PCC-on, which will be further illustrated in
Figure 12 by comparing the pressure distributions.
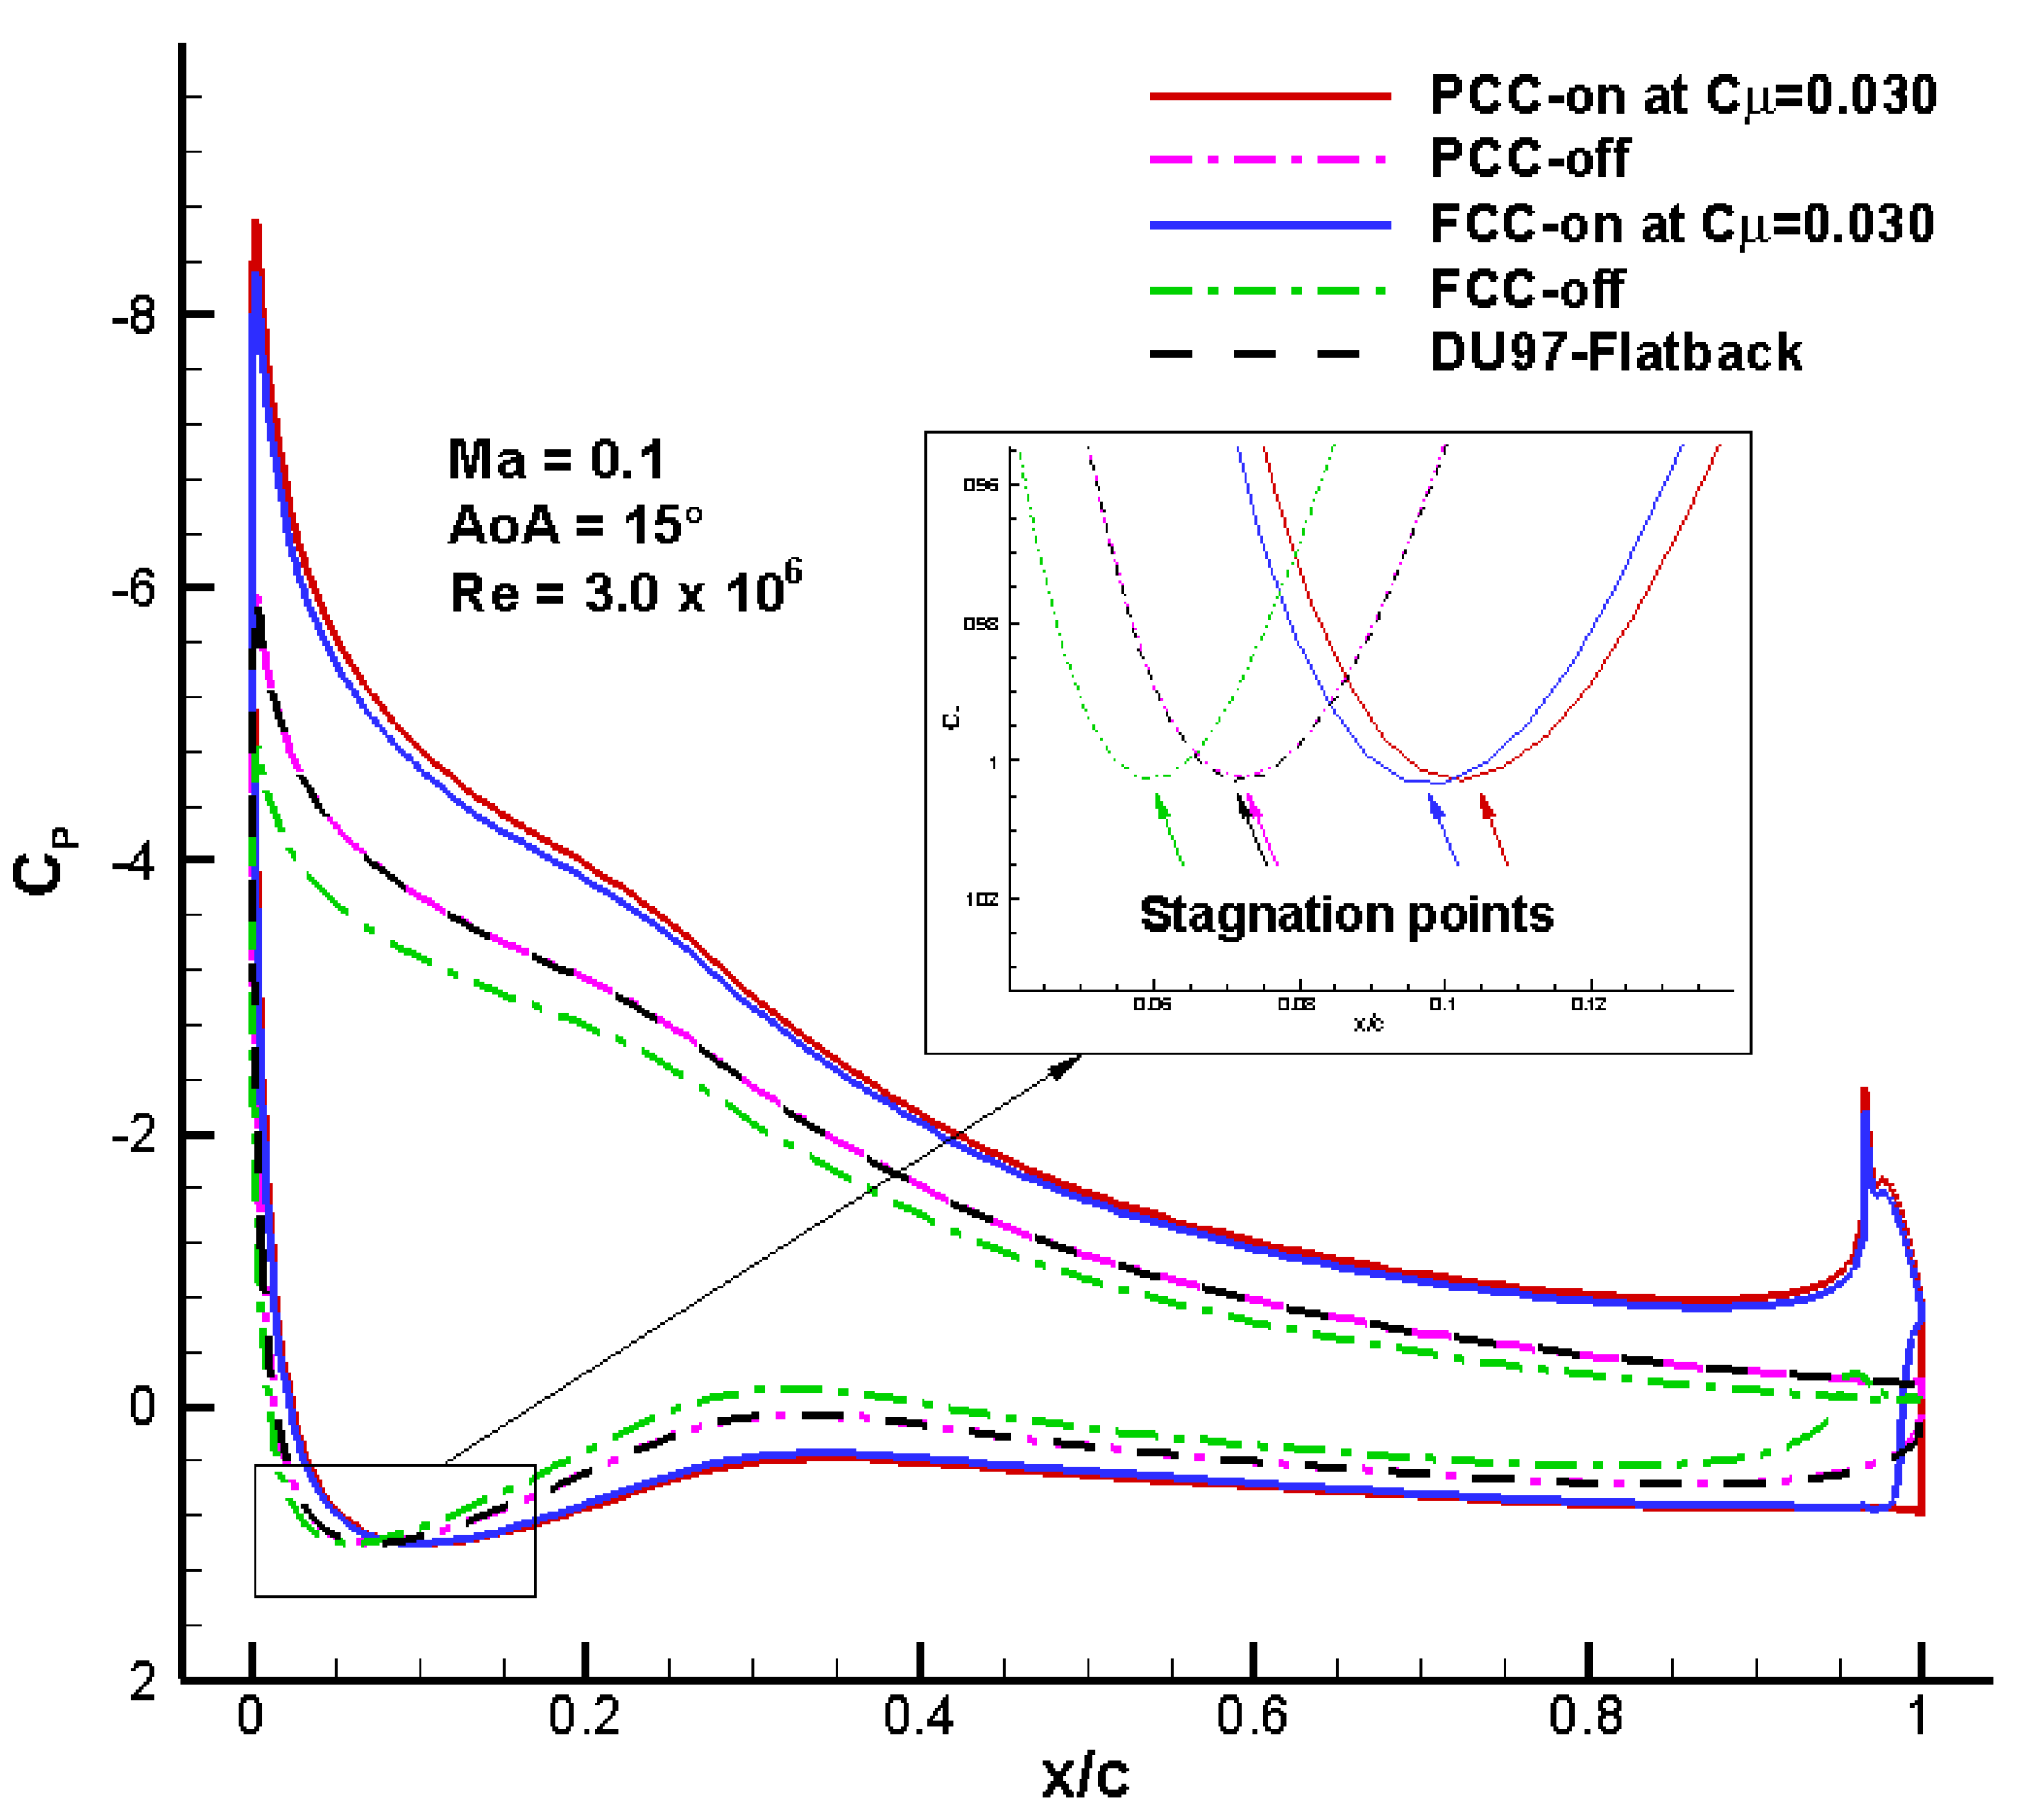
Figure 12 shows the pressure distributions of all the above five cases at the same AoA = 15° with an enlarged window indicating the locations of leading edge stagnation points. Comparing PCC-on and FCC-on, we can find that the enclosed area of PCC-on is a little larger than that of FCC-on, and the leading edge suction surface and bottom trailing edge surface contribute the most to the surplus area. The pressure distribution of PCC-off is almost coincident with that of the baseline DU97-Flatback. The enclosed area of FCC-off is significantly reduced, compared with DU97-Flatback. It is obviously noted that the FCC-off modification to the trailing edge causes significant loss of the suction on the upper surface and pressure on the bottom trailing edge area. The locations of stagnation points shown in the close-up window reflect the difference between the enclosed areas and hence lifts. The larger the enclosed area, the higher the lift generated, and the more downstream the leading edge stagnation point will move. PCC-off has a slightly more downstream stagnation point than the baseline DU97-Flatback (although seemingly coincident), indicating a slightly higher lift coefficient. PCC-on has the most downstream stagnation point since it has the highest lift coefficient. Therefore, from the pressure distribution analysis, it is further demonstrated that the PCC design is a better choice to implement CC on the flatback airfoil.
5.2. Comparison of the Jet Momentum Coefficient Effect
Just as its name implies, circulation control is to change a body’s aerodynamic characteristics, especially enhancing lift, by controlling the circulation around the body via a Coanda jet, in which the strength of a jet is characterized by the parameter of momentum coefficient
Cμ. Therefore, for the circulation control study, it is important to figure out the variation law of aerodynamic characteristics versus jet momentum coefficient, in order to guide the practical application. In practice, the large wind turbine is usually operating with variable speed. A variable speed wind turbine is regulated by collective pitch control, and the power output coefficient is often but not always constant within the region from cut-in wind speed to the rated wind speed [
42,
43]. Under normal working conditions, the angle of incidence of blade section always remains relatively large but below stall, corresponding to the maximum lift to drag ratio when at optimum. For the present study, according to
Figure 9, AoA = 15° has a relatively large lift as well as lift-to-drag ratio for DU97-Flatback, and hence it is a usable angle of attack to operate under normal working conditions. Therefore, in this study AoA = 15° is selected to perform the investigation of the jet momentum coefficient effect in this subsection as well as the aerodynamic figure of merit analysis in the next subsection.
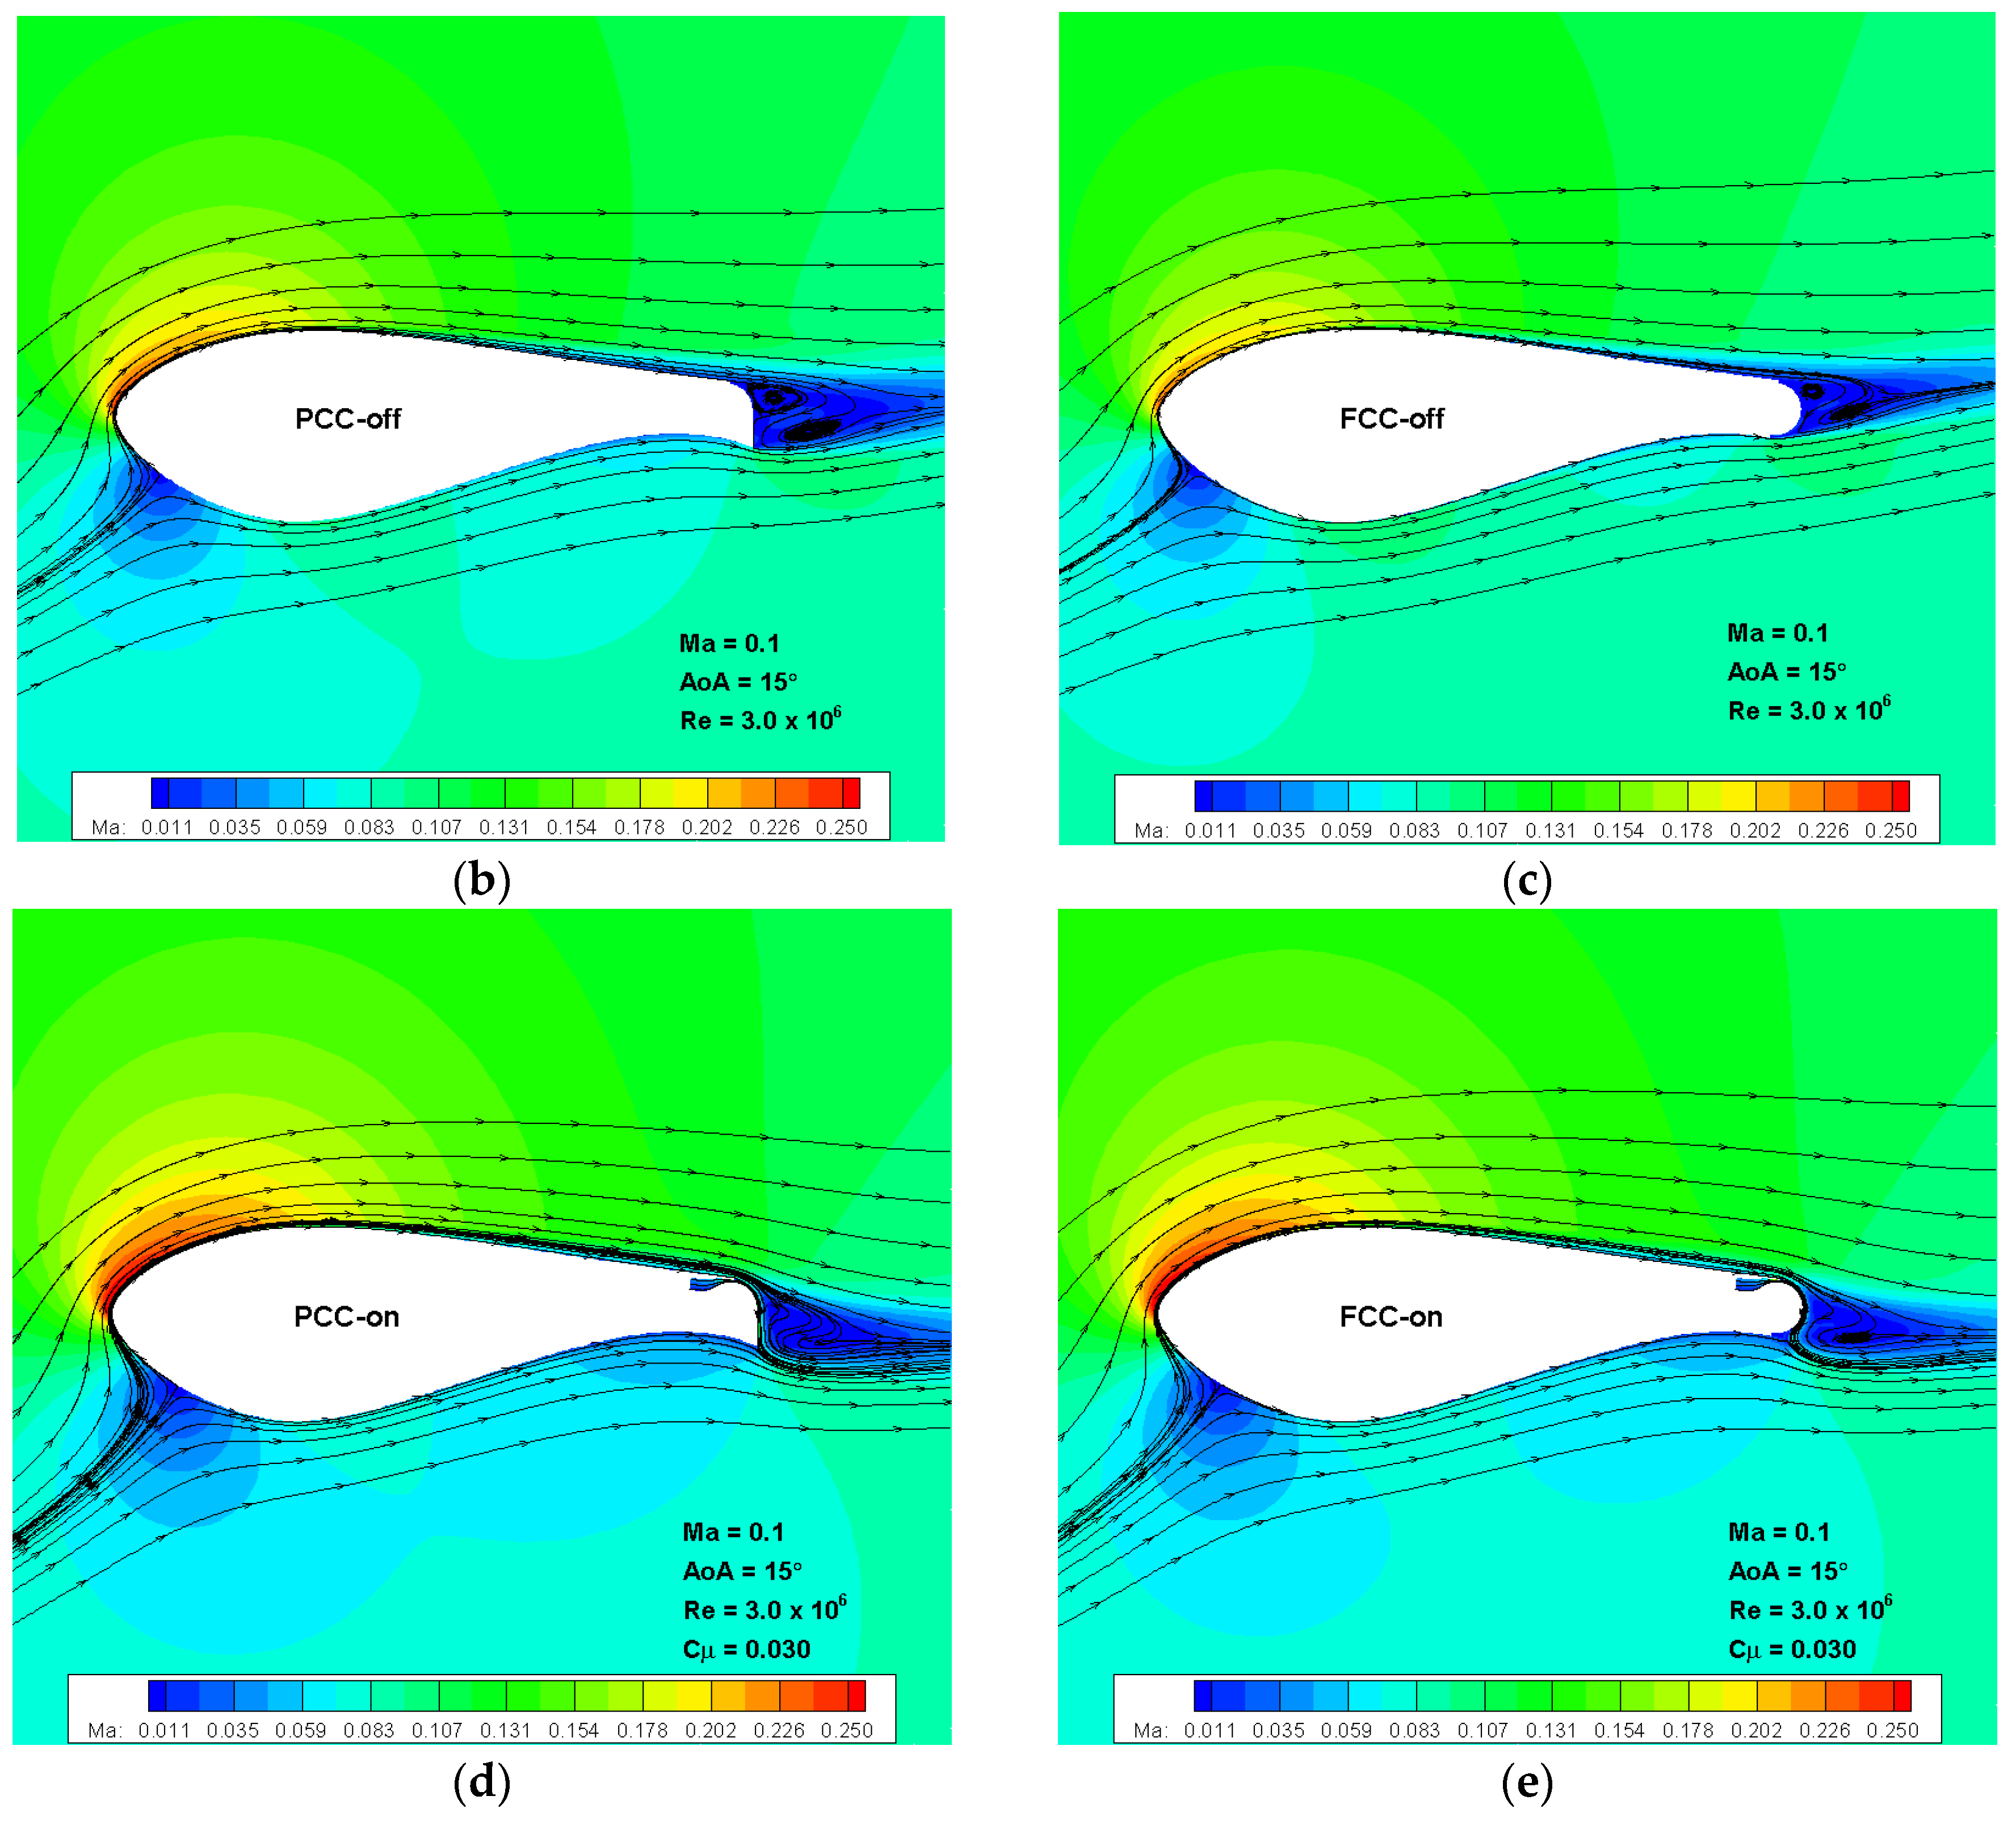
Fifteen more cases for the PCC-on and FCC-on configurations with a range of
Cμ from 0.010 to 0.080 are simulated under the same conditions: Ma = 0.10, Re = 3.0 × 10
6, AoA = 15°. The computed lift and drag coefficients are plotted versus
Cμ in
Figure 13. The discrete points of the computed lift coefficients for PCC-on and FCC-on are fitted with piecewise straight lines, respectively, to better display the variation law versus
Cμ. It is found that the common feature of PCC-on and FCC-on is that the lift coefficient varies linearly with increasing
Cμ with a fixed slope till a certain transition
Cμ, and then continues to increase with increasing
Cμ but with a lower fixed slope till beyond
Cμ = 0.080. Indeed, this feature is consistent with the previous finding in the circulation control research by the aeronautical community [
44] and in the previous work at a much lower AoA [
21]. In general, circulation control experiences two typical regimes as
Cμ increases, which are defined as separation control and super-circulation control [
44], as illustrated in
Figure 13a. The two regimes are characterized by different global lift-enhancement efficiencies which can be reflected by the slope of the lift coefficient curve versus
Cμ. All the previous findings showed that the lift-enhancement efficiency in the separation control regime is higher than the super-circulation control regime. The present results also demonstrate that PCC-on and FCC-on at the present specific condition both exhibit the same global feature. However, there are also some significant differences between PCC-on and FCC-on, such as the lift coefficient level, the value of transition
Cμ and the slope of each regime. The lift coefficient of PCC-on is much higher than that of FCC-on over the entire investigated
Cμ, demonstrating the superiority of PCC-on over FCC-on. The transition
Cμ of PCC-on is about 0.030, while the transition
Cμ of FCC-on is delayed to about 0.038, indicating that PCC-on will enter super-circulation control earlier than FCC-on. Regarding the slope, FCC-on has a higher slope in the separation control regime, while PCC-on has a slightly higher slope in the super-circulation control regime; namely, the lift-enhancement efficiency of PCC-on is lower in the separation regime, but higher in the super-circulation regime. For the drag coefficient shown in
Figure 13b, PCC-on and FCC-on have different variation trend with increasing
Cμ. The
CD of PCC-on decreases monotonically with increasing
Cμ, and the average slope in the separation control regime is lower than that in the super-circulation control regime. The
CD of FCC-on first decreases to a minimum at about
Cμ = 0.030, and then increases to a maximum at about
Cμ = 0.047, and then decreases again nearly linearly with a much lower slope than PCC-on. Overall, the drag variation of PCC-on is much more drastic than that of FCC-on.
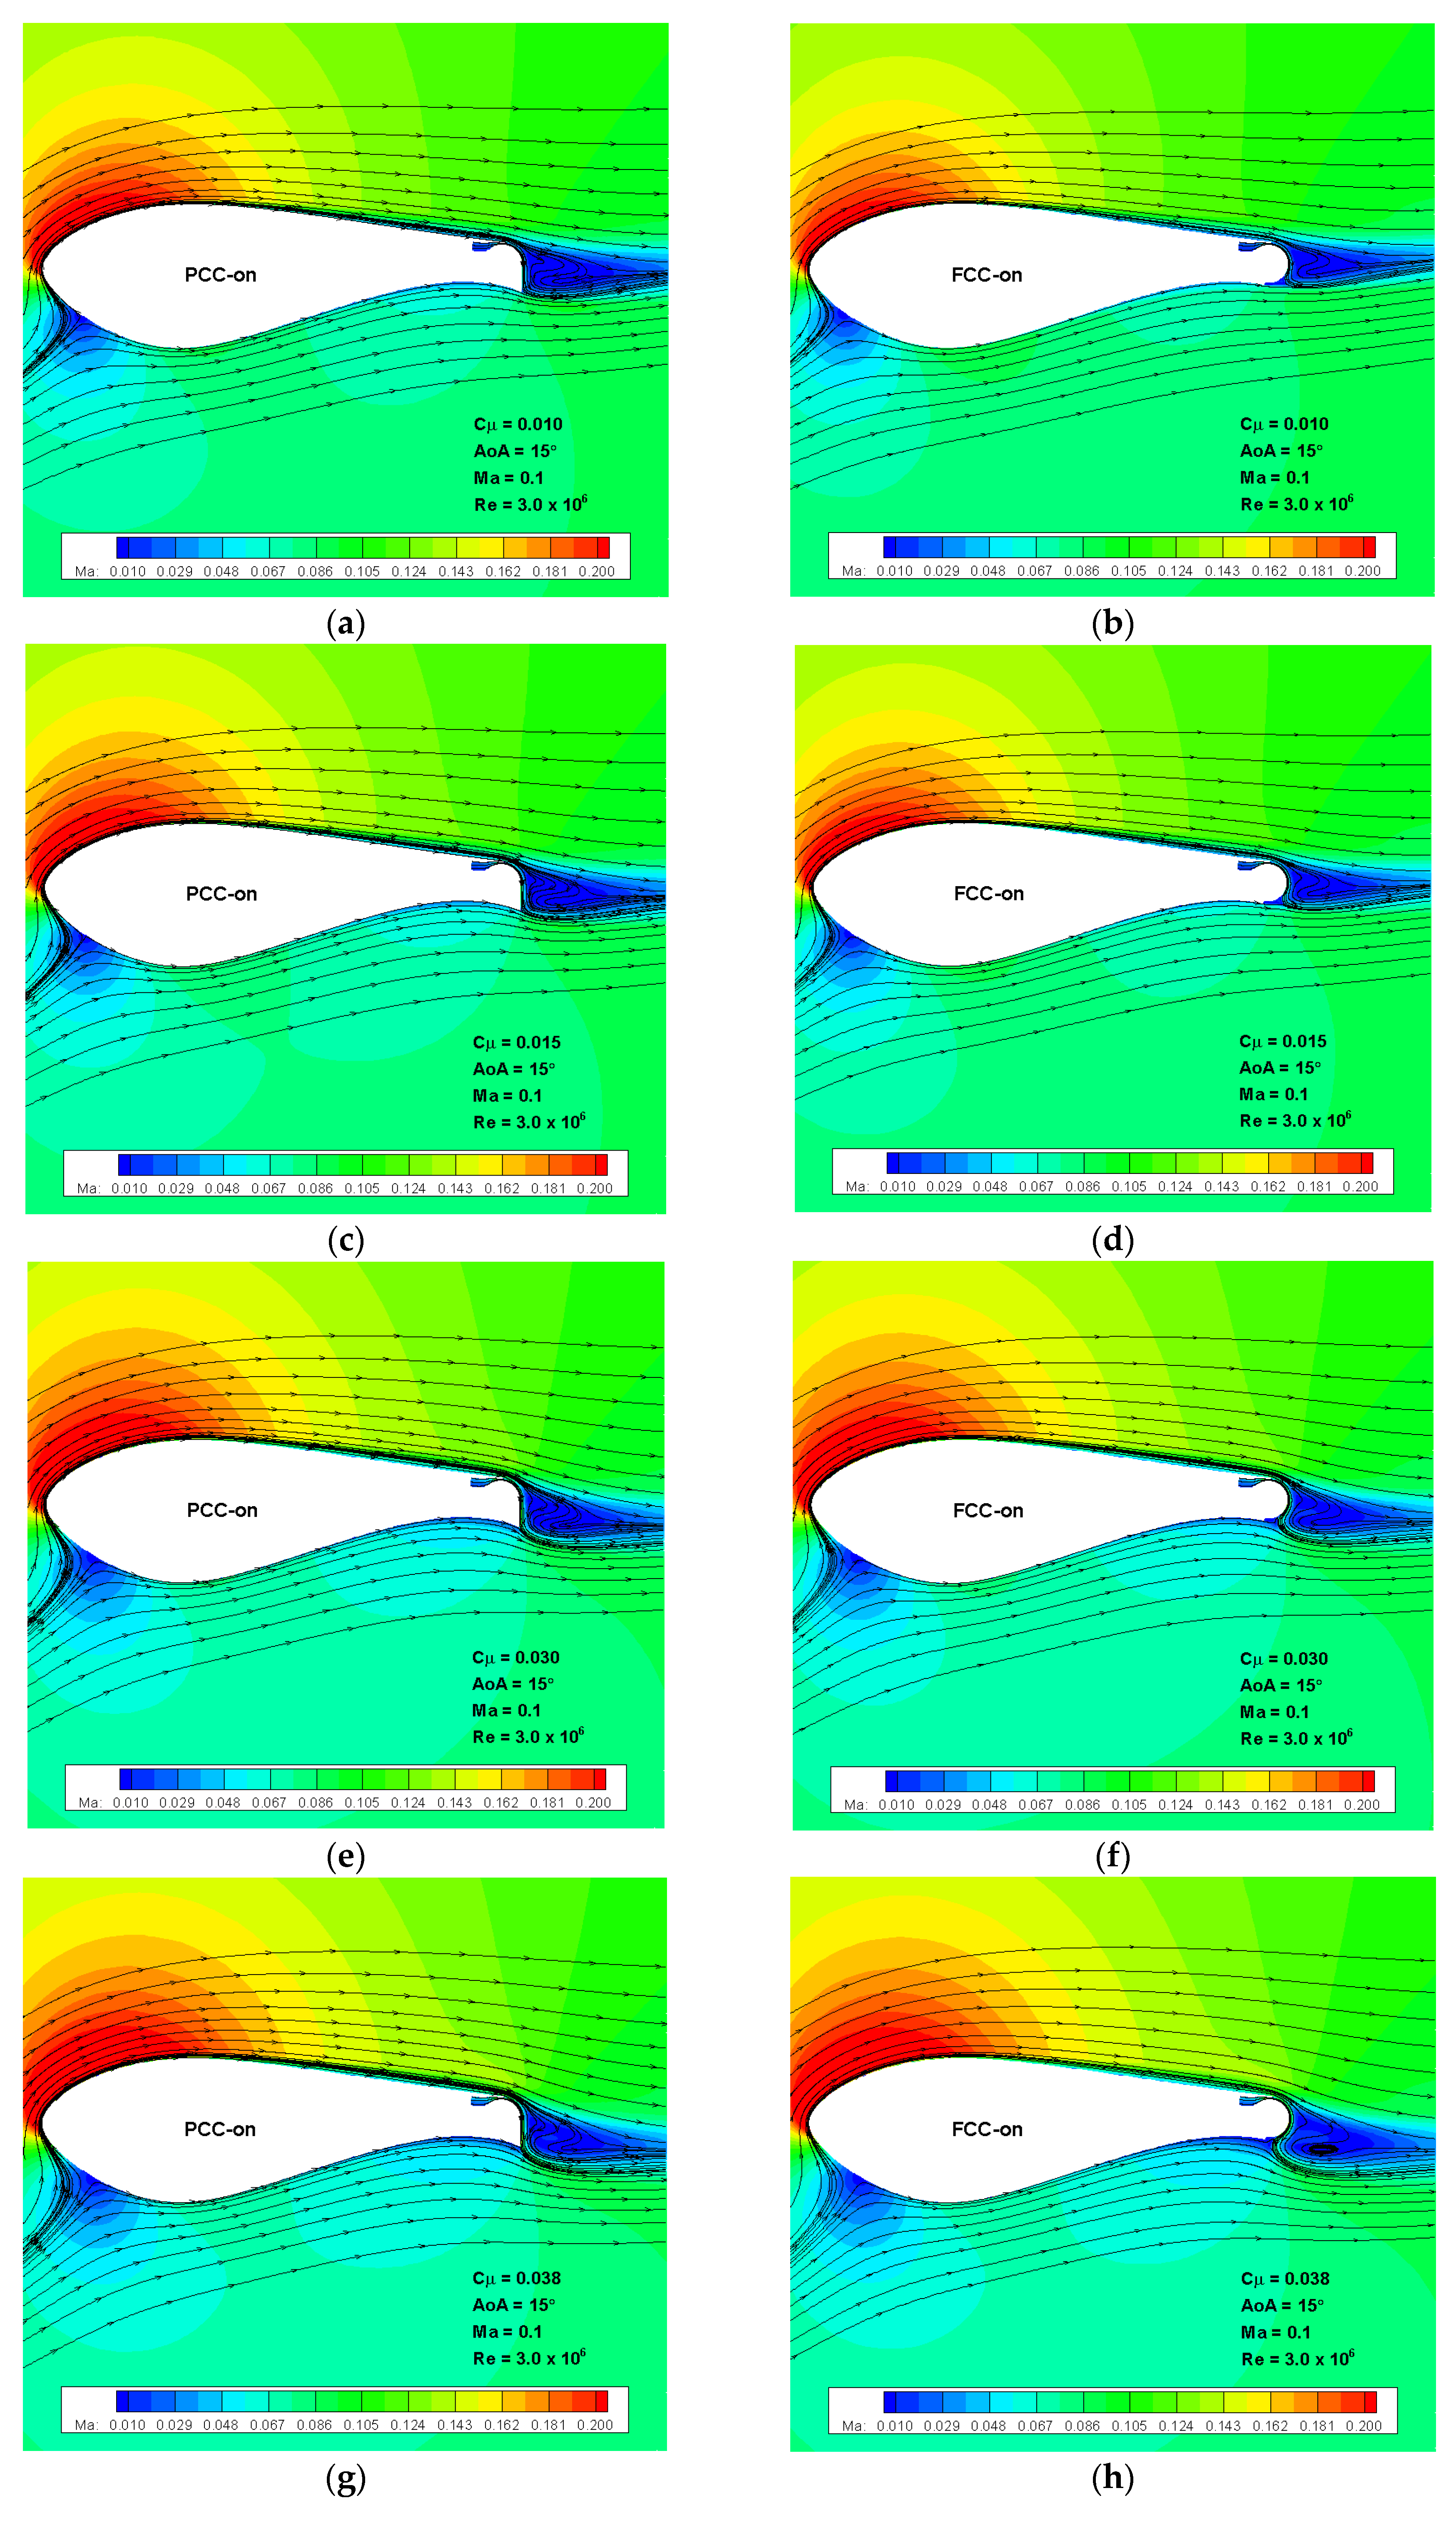
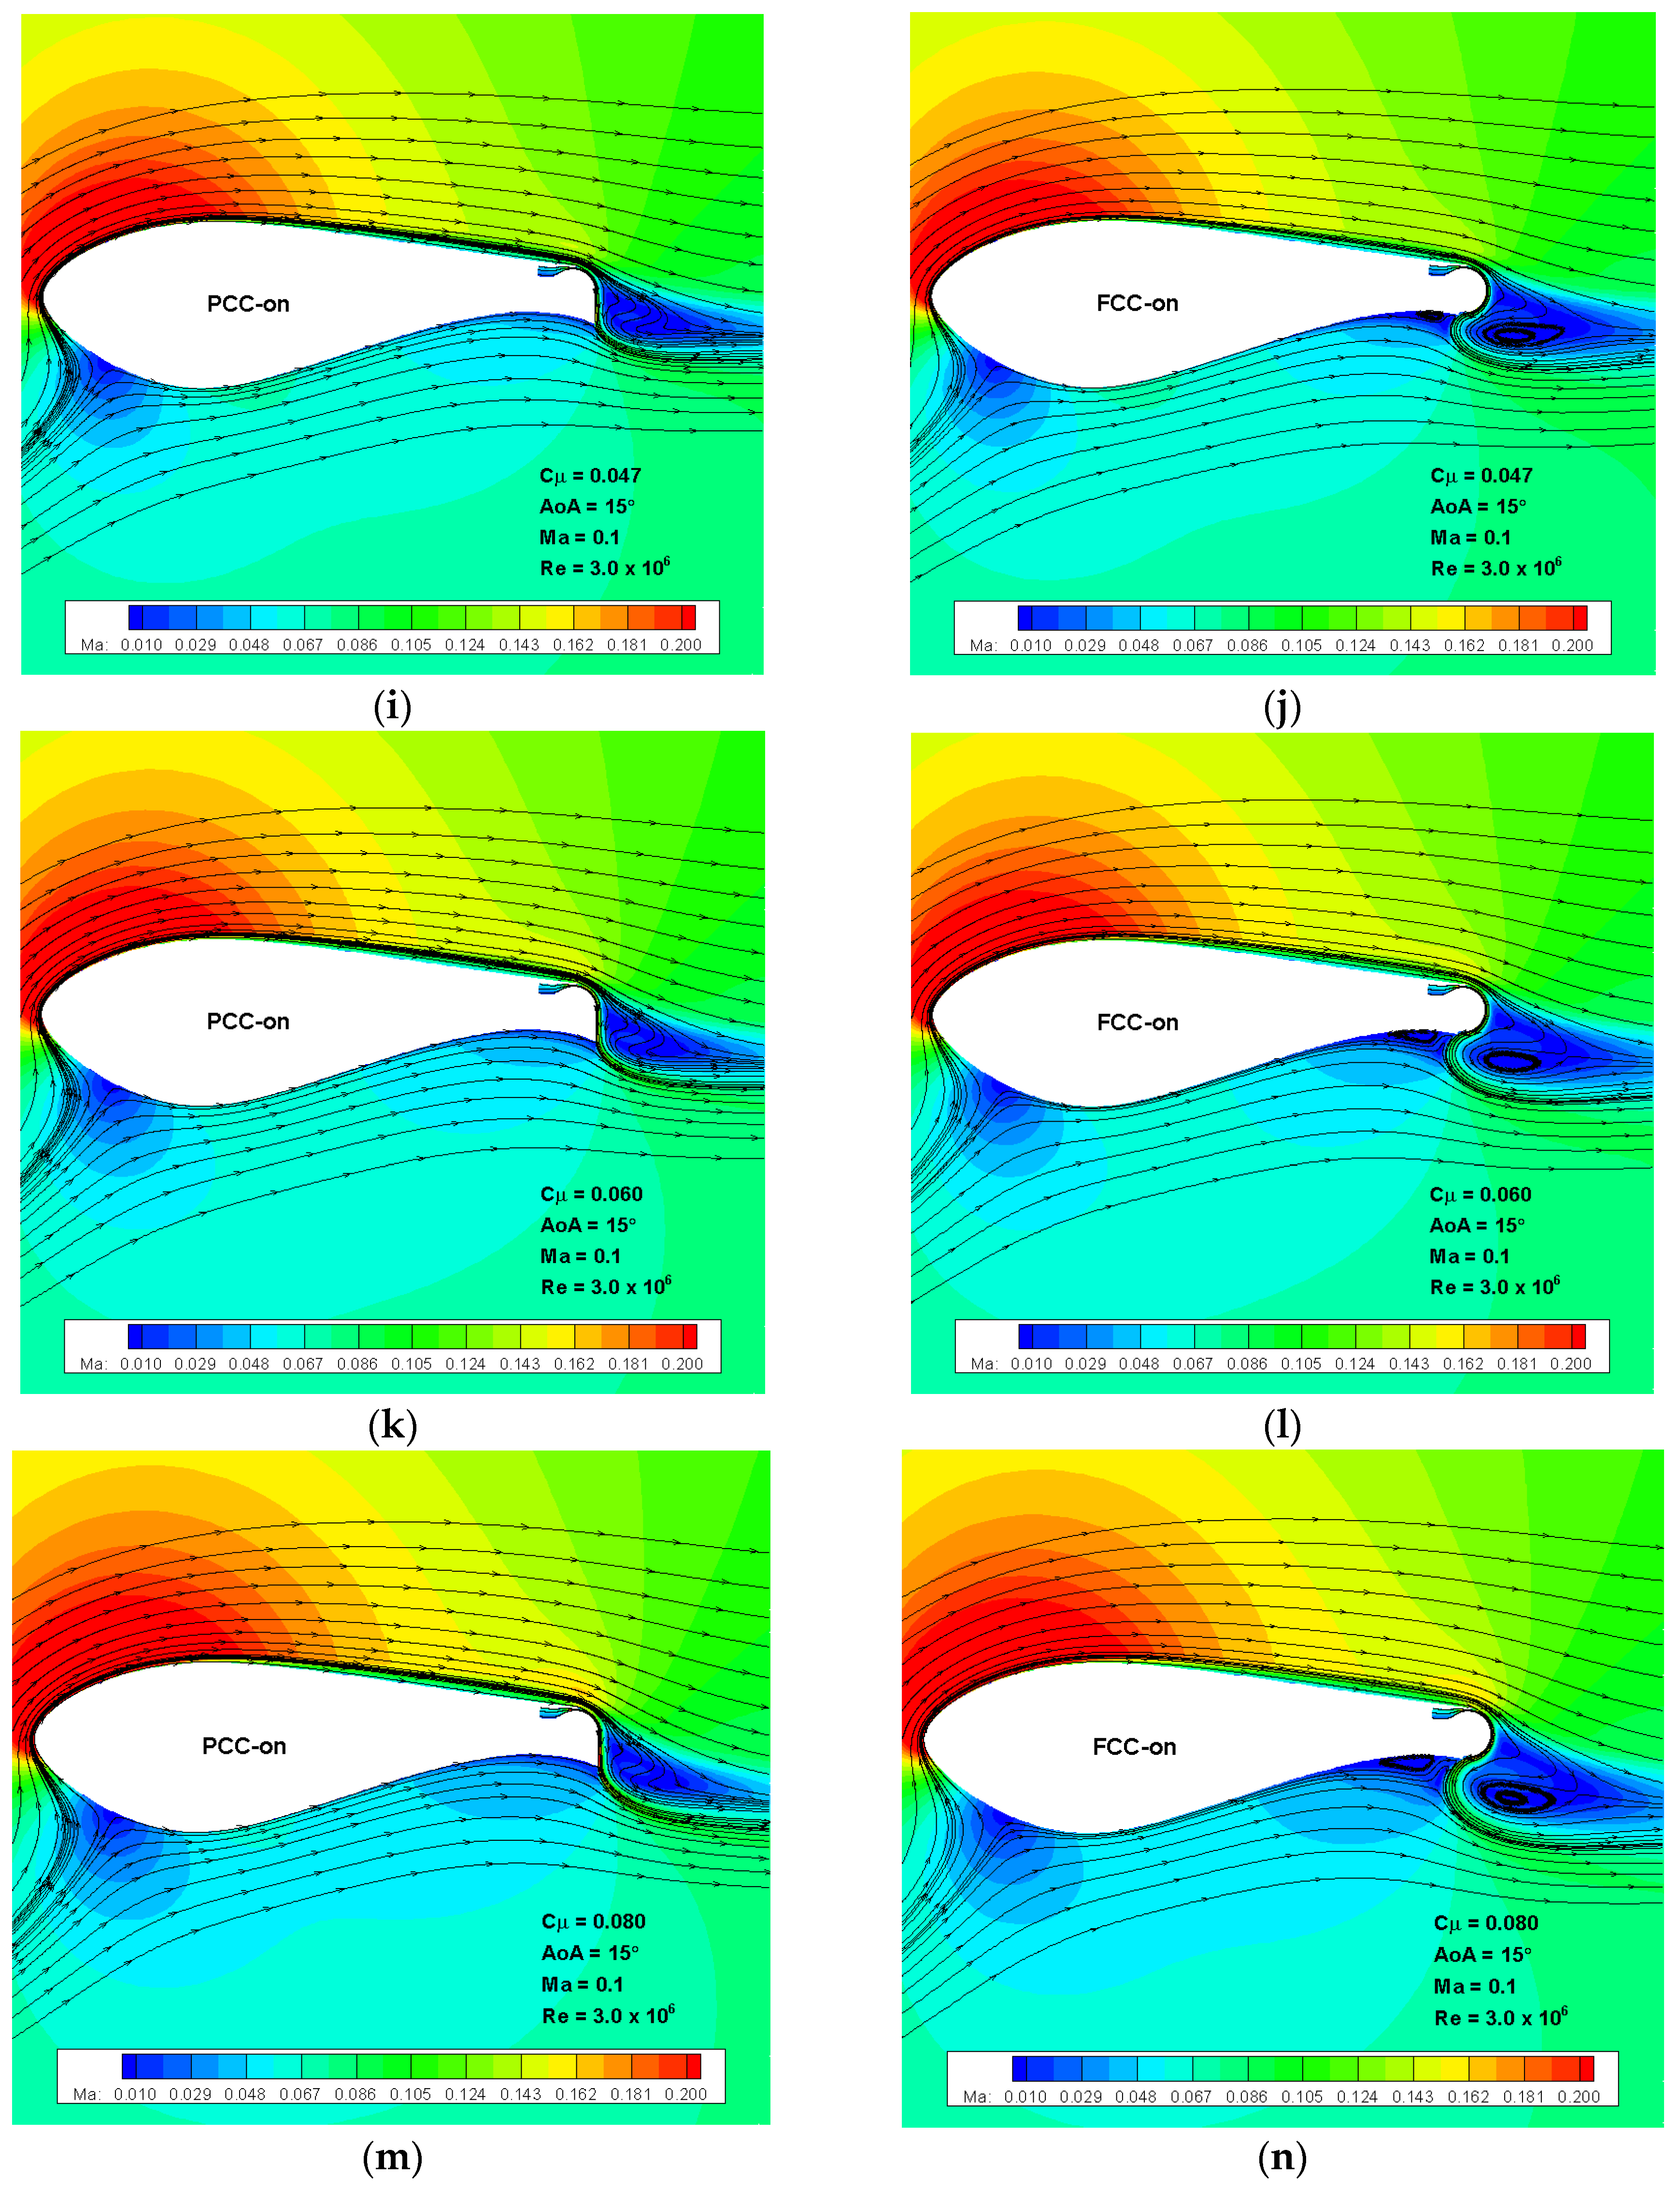
Figure 14 shows the flow fields of both PCC-on and FCC-on at different
Cμ levels with streamlines and Mach number contours. The plotted views as well as Mach number legends of all figures are in the same scale, respectively, in order to make comparison easier and more intuitive. Comparing the contours of different configurations at the same
Cμ, we can easily see that the flow speed of PCC-on at the leading edge suction area is higher than that of FCC-on. Taking
Cμ = 0.010 for example, the range of the same legend red color in
Figure 14a near the leading edge is obviously larger than that in
Figure 14b, indicating that a stronger suction is generated for PCC-on. Similarly, comparing the contours of the same configuration at different
Cμ, we can also easily see the difference in lift generated. Taking PCC-on at the lowest
Cμ = 0.010 and the highest
Cμ = 0.080 for example, the red color area in
Figure 14m is much larger than that in
Figure 14a, indicating that the lift generated at
Cμ = 0.080 is much higher than that at
Cμ = 0.010. The comparison can also be performed using the deflection of the freestream streamlines.
For the traditional CC, the separation location of the jet on the Coanda surface determines whether the jet is performing a separation control or a super-circulation control [
21]. The present FCC-on also exhibits the same feature. For the cases with
Cμ = 0.010~0.038, as shown in
Figure 14b,d,f,h, which correspond to the separation control regime, the separation locations are all on the Coanda surface, and the separation location of the case with
Cμ = 0.038 is very close to the bottom end of the Coanda surface. For the cases with
Cμ = 0.047~0.080 which correspond to the super-circulation control regime, as shown in
Figure 14j,l,n, the separation locations are all at the bottom end of the Coanda surface; that is to say, the bottom step forces the jet to separate in the super-circulation control regime. From
Figure 14b,d,f,h, it can be seen that the flow separation in the wake of the trailing edge is well controlled by implementing the Coanda jet. Thus, this observation explains the reason why the control type is defined as “separation control”. As can be seen in
Figure 14j,l,n, the attached Coanda jet injects into the main flow below the trailing edge at a large angle relative to the main flow, acting as a jet-type Gurney flap. There appears a gradually increasing standing vortex just before the jet plume, and a large vortex region behind the jet plume. Therefore, in this sense, the super-circulation control for FCC-on can be viewed as a kind of pneumatic flap, the effect of which on the lift enhancement is proportional to the jet strength
Cμ. This could explain why the slope in the super-circulation control regime is nearly a constant. It is noteworthy that the standing vortex existing before the pneumatic flap changes the aerodynamic effective shape of FCC-on by significantly increasing the thickness of the aft part, and this could be one reason why the slope of FCC-on is a little lower than that of PCC-on in the super-circulation control regime, as shown in
Figure 13a.
For the PCC-on cases shown in
Figure 14, the flow fields are not as complex as those of FCC-on, mainly because the jet travels the entire Coanda surface without separation in every case, regardless of the jet strength
Cμ. As shown in
Figure 14a,c,e, the jet is not strong enough to affect the bottom main flow, although it attaches the Coanda surface all the time before reaching the bottom corner. The influence of this weak jet on the entire flow field can be viewed as separation control, and the wake vortex structure is even like that of the corresponding FCC-on case. After the jet strength exceeds
Cμ = 0.030, the jet is sufficiently strong to affect the bottom main flow, acting as a pneumatic flap. Hence, the super-circulation control starts. However, the flow structures behind and before the jet plume are quite different from those of FCC-on. There is neither a standing vortex before the jet plume nor a large separation vortex behind the jet plume. For PCC-on, the larger the
Cμ, the smoother the flow behind the jet plume; whereas for FCC-on, the larger the
Cμ, the larger the separation vortex behind the jet plume will grow. This phenomenon is the most significant difference in the flow field comparison between PCC-on and FCC-on. To say the least, from the viewpoint of energy conservation, less aerodynamic force will be generated if more flow energy is dissipated. Taking the comparison between
Figure 14m,n for example, the vortices before and behind the jet plume in the FCC-on case will definitely dissipate an amount of flow energy, consequently resulting in a lower lift generated on the airfoil. Therefore, this is one reason why PCC-on has a much higher lift coefficient as well as a slightly larger increasing slope than FCC-on, as shown in
Figure 13a.
5.3. Comparison of Power Consumption, AFM and Control Efficiency
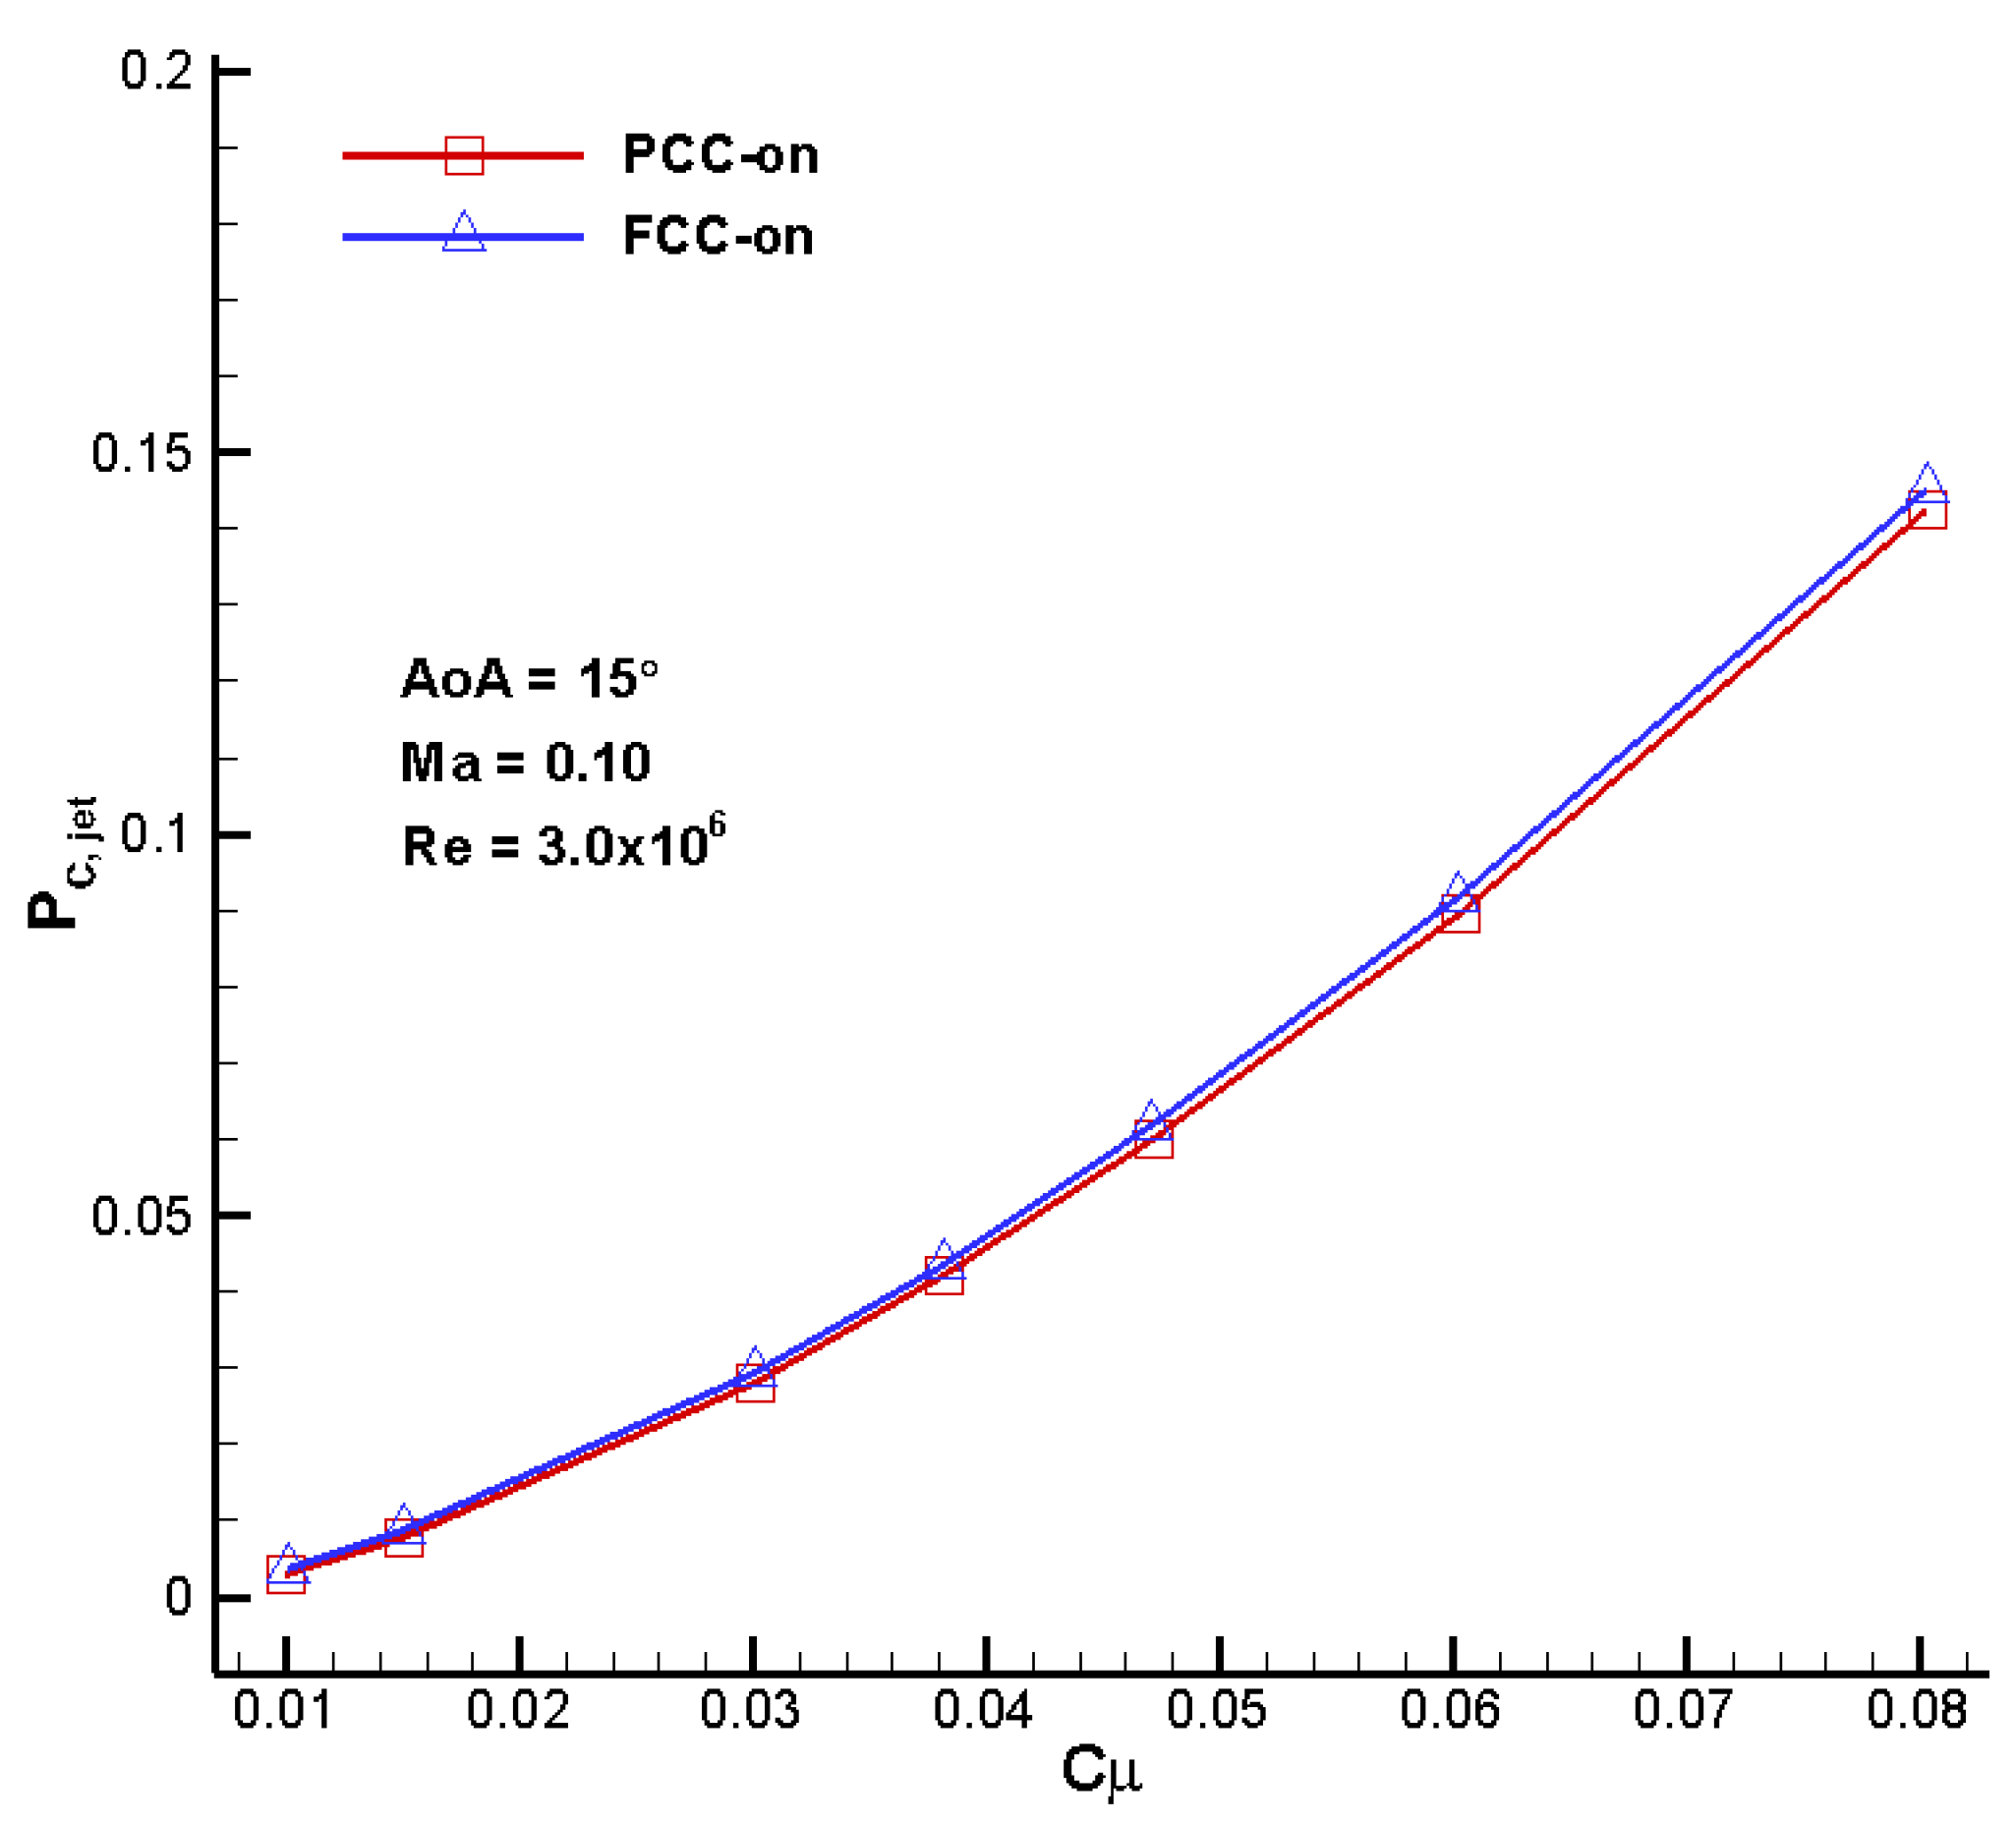
The power consumed by the pump to generate the Coanda jet is given in
Figure 15. The power coefficient of PCC-on is very close to but slightly lower than that of FCC-on over the entire range of jet momentum coefficients. The discrepancy seems to increase gradually with increasing
Cμ, although it is still very small in value. This observation can be explained by comparing the flow fields shown in
Figure 14. From the above analysis, the base drag of PCC-off is larger than that of FCC-off, as shown in the drag coefficient comparison in
Figure 9b as well as in the flow field comparison in
Figure 11b,c. A higher base drag indicates a lower base pressure due to the separation vortices. Hence, the pressure behind the trailing edge of PCC-off is lower than that of FCC-off. It is a common sense that it will feel easier for the pump to drive the jet flow to a lower pressure area, and hence save power expenditure. Therefore, once the Coanda jet is activated with a same momentum coefficient, the power coefficient of PCC-on will be a little lower than that of FCC-on. Regarding the increasing variation trend of the difference, there is more explanation. Looking at the jet plumes of PCC-on and FCC-on in
Figure 14, especially at larger jet momentum coefficients, we can find that the injection directions of the jet into the main flow in PCC-on cases are always perpendicular to the chord line, whereas the jet in FCC-on cases will flow upstream for some distance before it is forced to deflect downstream by the main flow. In the present specific study, the angle between the jet plume direction and local main flow near the bottom trailing edge is an acute angle for PCC-on, but a larger obtuse angle for FCC-on. The influence of the main flow to the jet injection is obviously weaker in PCC-on cases than in FCC-on cases. Therefore, the jet of FCC-on needs to resist more head wind than PCC-on, thus consuming more power. Moreover, the obtuse angle for FCC-on becomes even larger when
Cμ increases, while the acute angle for PCC-on remains unchanged. This is why the difference in power coefficient grows with increasing
Cμ.
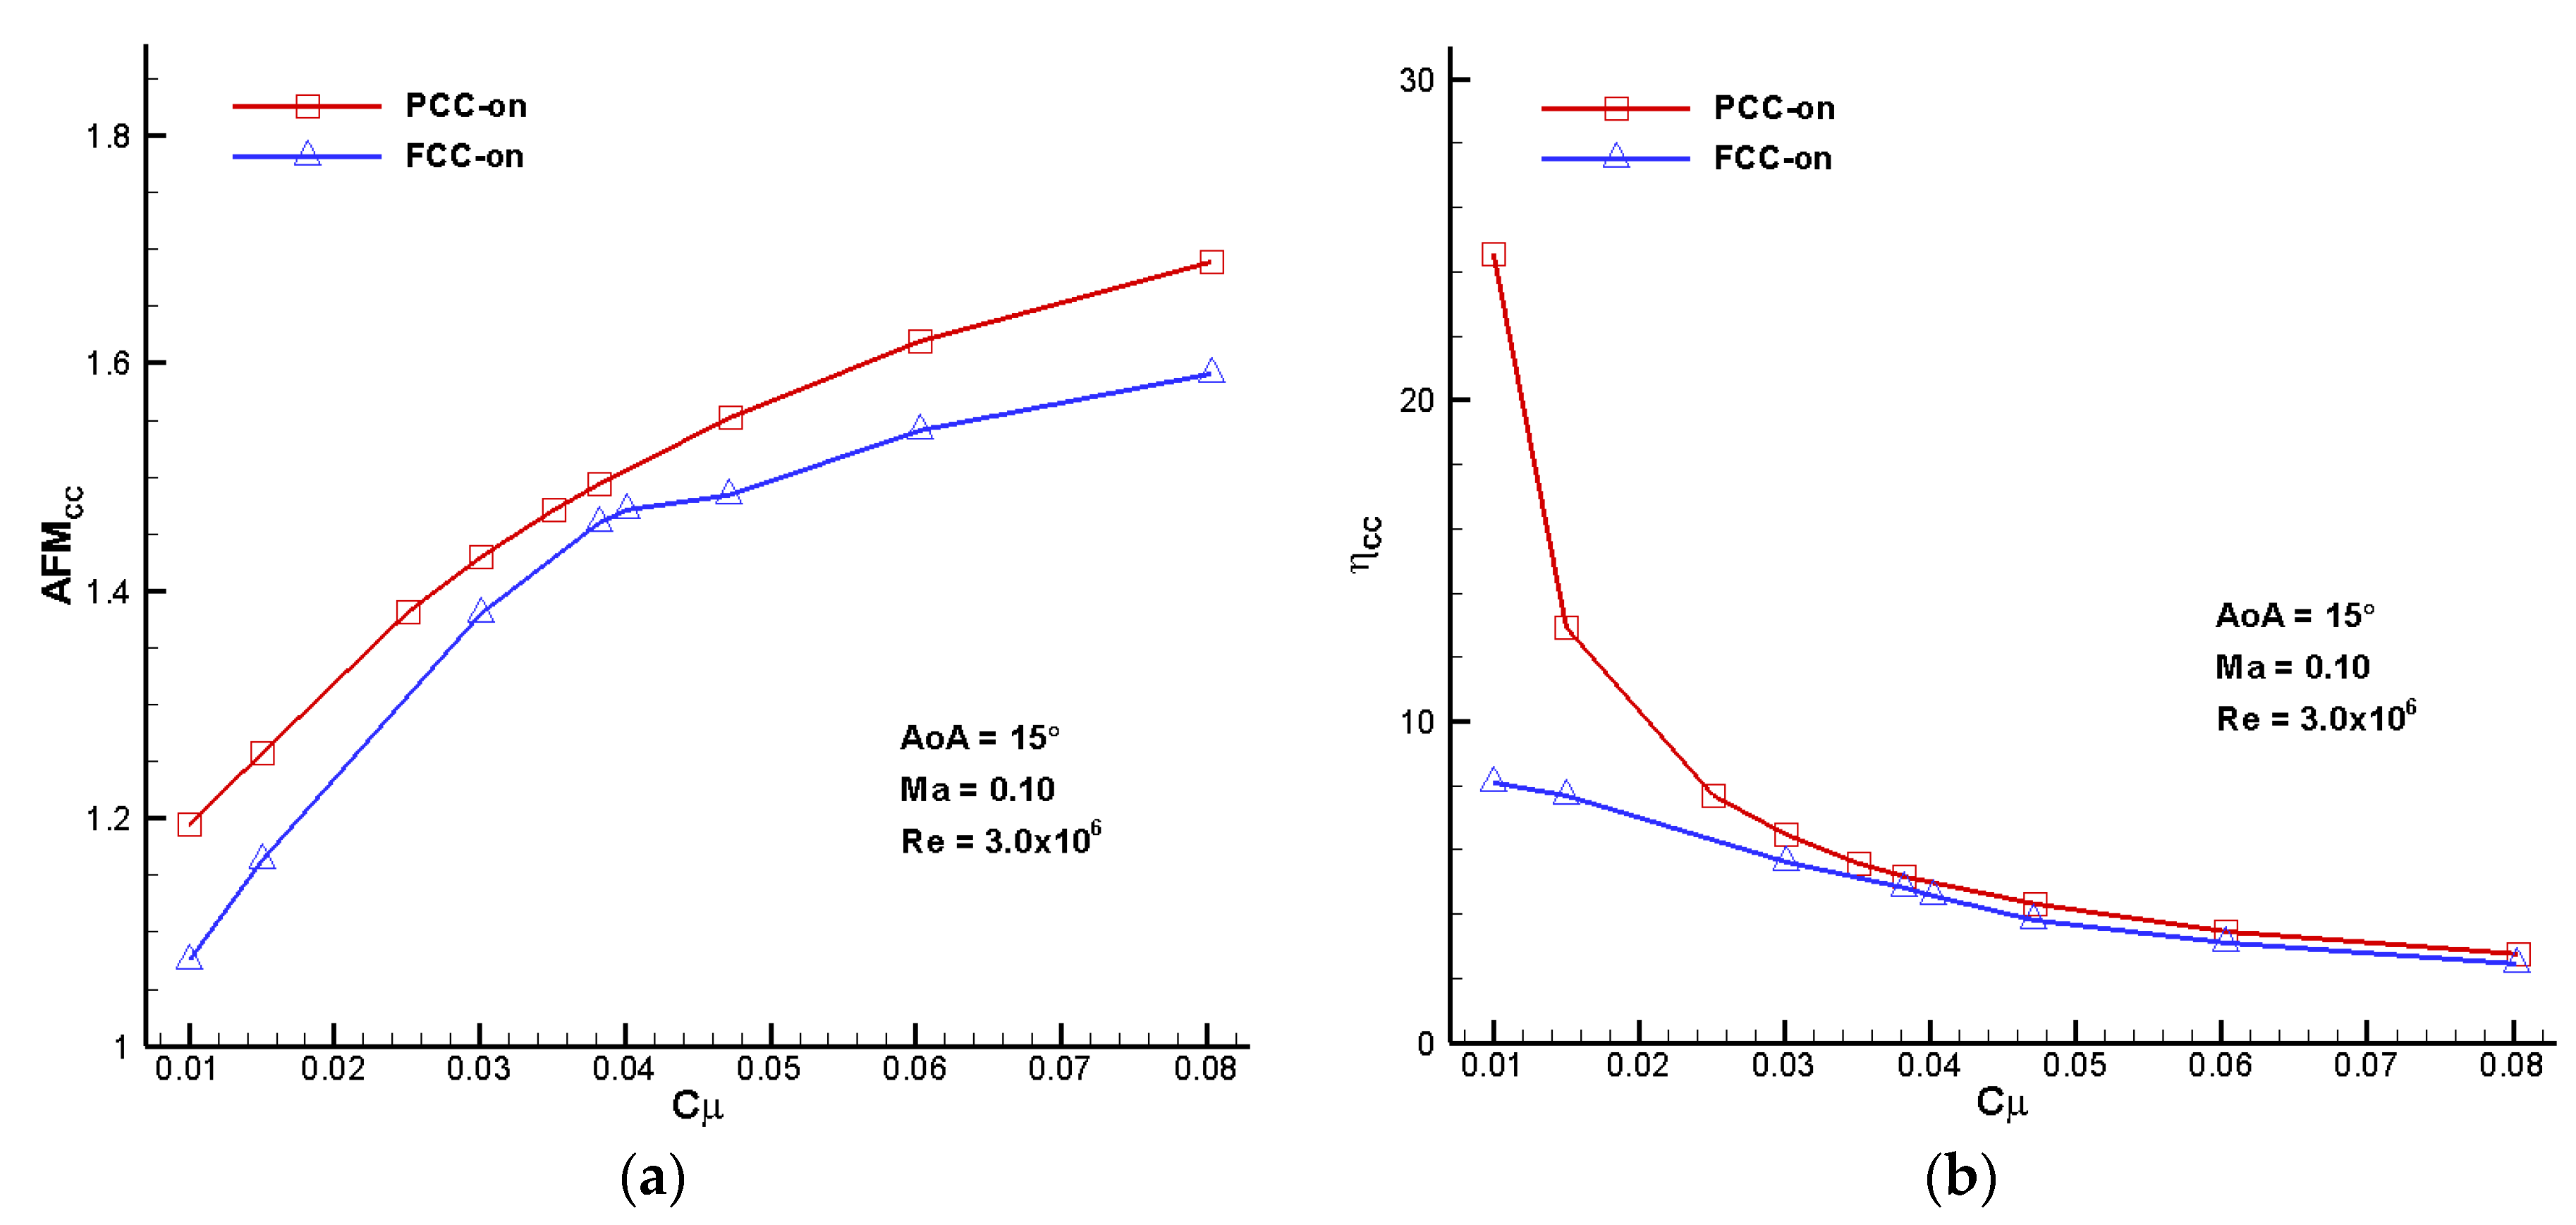
The comparison of aerodynamic figures of merit and circulation control efficiencies is given in
Figure 16. As defined in
Section 3.4, the
AFMCC in the present study is the ratio between the power output gain with circulation control and the power output of the baseline flatback section without control. Therefore, it is desired to obtain an
AFMCC greater than unit with circulation control, and the larger the better. From
Figure 16a, all the
AFMCC of both PCC-on and FCC-on are larger than 1, and the
AFMCC of PCC-on is much higher than that of FCC-on over the entire range of
Cμ, demonstrating that PCC-on significantly outperforms FCC-on in terms of
AFMCC. For example, PCC-on will provide a power output gain of nearly 10% of the total power output of the baseline DU97-Flatback when
Cμ = 0.080, compared with FCC-on, which is a relatively large increment in power output. The control efficiency shown in
Figure 16b is the ratio of the power output gain with control and the pump power expenditure, hence indicating the ratio between reward and cost. It describes the ability of the circulation control to amplify the consumed power by Coanda jet implementation in terms of rewarded wind power gain. Therefore,
ηCC can be essentially viewed as a kind of figure of merit related to power transformation. At first sight, it is a little confusing that the
ηCC shown in
Figure 16b has an opposite variation trend to that of
AFMCC shown in
Figure 16a, since they are both ratios between powers. The
ηCC monotonically decreases with increasing
Cμ, whereas
AFMCC monotonically increases with increasing
Cμ. To explain more,
AFMCC is a figure of merit relative to the power output by the baseline DU97-Flatback which is a fixed quantity in a specific condition, while
ηCC is another figure of merit relative to the power input to the circulation control system which is a variable quantity varying with the law shown in
Figure 15. Just due to the quite different reference quantities when evaluating
AFMCC and
ηCC, opposite variation trends are obtained as shown in
Figure 16a,b. Clearly, the control efficiency of PCC is much higher in the separation control regime before
Cμ = 0.030, and a little higher in the super-circulation control regime, demonstrating that PCC outperforms FCC in terms of control efficiency.


