Economic Impact Evaluation of a Biomass Power Plant Using a Technical Coefficient Pre-Adjustment in Hybrid Input-Output Analysis


School of Economics and Management, Kochi University of Technology, 2-22 Eikokuji, Kochi City, Kochi 782-8502, Japan
*
Author to whom correspondence should be addressed.
Energies 2018, 11(3), 598; https://doi.org/10.3390/en11030598
Submission received: 16 January 2018
/
Revised: 11 February 2018
/
Accepted: 5 March 2018
/
Published: 8 March 2018
(This article belongs to the Section A: Sustainable Energy)
Abstract
:This paper presents a new and improved method of hybrid input-output (I-O) to evaluate the economic impact of a biomass power plant’s resource production and consumption. The effect of resource consumption induces a change in an economy’s production structure and alters the technical coefficient of the hybrid I-O table, which should not be changed. Our study examines this problem based on two cases: a small cut-off ratio from the existing industry, in which the change in the technical coefficient can be ignored, and a large cut-off ratio from the existing industry, in which the technical coefficient is amended using the pre-adjustment method. Consequently, the biomass power plant using the large cut-off ratio from the existing industry case contributes about 1114 million yen to the local economy. A comparison of these two cases shows that the error caused by ignorance of the technical coefficient adjustment could result in 291.78 million yen less in total economic production, which is about 36% of the total additional production using the small cut-off ratio from the existing industry case. The losses in total economic production clearly increase in economic sectors that are related to the resource consumption of the biomass power plant.
1. Introduction
The introduction of a new industry directly impacts the allocation of resources in a local economy. New consumption and production patterns are added to the local resource supply chain. If all the resources in a local economy are limited, the new industry consumes the resources, which already belong to or are used by some of the existing economic sectors, resulting in decreased production in those sectors. This phenomenon can be described, and its impact on the economy can be evaluated, using a hybrid input-output (I-O) analysis, where the relationship between the new industry and the local economy is presented as a matrix. The resource that is transferred from the current local economy to the new industry is defined as the cut-off resource. Cut-off resources are the inputs that are required by the new industry in order to produce its product. These inputs are obtained from the existing products in the market. In our case, the cut-off resources refer to consumable resources (mainly timber resources) that are required for biomass power plant operation in order to generate electricity. By reallocating these resources with the cut-off, the technical coefficient from one sector to another is inevitably changed. The technical coefficient represents the resource consumption ratio or resource distribution pattern for each industry or sector, which illustrates the structure of the local economy in a matrix formation, and this ratio should remain constant at any given period of time. Previous hybrid I-O studies have overlooked the fact that using the cut-off function could coincidentally induce the modification of the technical coefficient and might result in an inaccurate calculation. The modification of the technical coefficient could be neglected if the resource consumption of new technology is much smaller than the current economy, where the cut-off does not significantly modify the technical coefficient of each sector (small cut-off ratio from the existing industry case). However, in cases where the resource consumption of the new industry is large and has a significant impact on the local economy, this change of technical coefficient cannot be ignored (large cut-off ratio from the existing industry case). In our case study, Kochi Prefecture is at the bottom of Japan’s gross domestic product (GDP) ranking [1], so the biomass power plant industry could have a significant effect on the modification of the technical coefficient in this prefecture’s local economy. Therefore, the technical coefficient should be adjusted in order to properly investigate the biomass power plant industry’s economic impact on the local economy.
In this paper, we propose a technical coefficient pre-adjustment method to optimize the evaluation of the hybrid I-O analysis of the large cut-off ratio from the existing industry case in order to identify the magnitude of the impact on the local economy. The results from the large cut-off ratio from the existing industry case and the small cut-off ratio from the existing industry case are compared in order to determine how the adjustment of the technical coefficient affects the evaluation of the hybrid I-O analysis. Finally, we sought to determine if using the technical coefficient pre-adjustment method enhances the calculation accuracy of the hybrid I-O analysis.
2. Calculation Results and Discussion
In this section, we present first the results of the economic impacts of the biomass power plant after the pre-adjustment in the large cut-off ratio from the existing industry case. We then identify variations in the economic impacts by comparing the large cut-off ratio from the existing industry case with the small cut-off ratio from the existing industry case.
2.1. Economic Value of the Large Cut-Off Ratio from the Existing Industry Case
Based on the assumption that the cut-off resource of a biomass power plant is significantly different from the technical coefficient among the economic sectors, the resource allocation in the local economy must be adjusted in advance.
Table 1 and Table 2 show the main economic sectors that have a significant impact on the total production caused by the intervention of the biomass power plant’s resource consumption. The total economic production value of each sector is the value difference between the large cut-off ratio from the existing industry case and the base case (Kochi Prefecture’s I-O table) presented in Japanese Yen (¥). The result shows that the economic contribution from the lumber, wood product and furniture sectors is large (almost 22% of the additional total economic production). The economic production in the transportation sector is about 12% while the economic production of the forestry, mining, petroleum and coal sectors is less than 2%. In order to satisfy the electricity demand of a biomass power plant, the economic production of the electricity, gas and heat sectors decreases to about 809 million ¥. This reduction is substituted by the electricity sales of the biomass power plant, at 813 million ¥. This price is calculated based on the average conventional power generation at 16 ¥/kWh; however, the actual price for renewable energy, including the Feed-in-Tariff, is 32 ¥/kWh. Thus, the biomass power plant contributes 1626 million ¥ to the local economy from selling its electricity. Moreover, the power plant also produces by-products, such as ash, which is sold at 2000 ¥/ton to the forestry and construction sectors, and CO2, which is sold at 100 ¥/ton to the agricultural sector. All the losses in unrelated sectors are initiated by the coefficient adjustment process due to the cut-off resources, where the economic sectors allocate their resources to the biomass power plant.
2.2. A Comparison of the Large Cut-Off Ratio from the Existing Industry Case and the Small Cut-Off Ratio from the Existing Industry Case
As seen for the large and small cut-off ratio, respectively, the economic impacts from biomass power plant are evaluated based on different points of view. The small cut-off ratio from the existing industry case shows the impact that the biomass power plant has on small-scale industry, while the large cut-off ratio from the existing industry case illustrates the effect that the biomass power plant has on large-scale industry, where the resource cut-off could affect the resource exchange in the local economy. Table 3 presents the total production of the biomass power plant and some related sectors in Japanese yen. Certainly, the biomass power plant produces and sells its products, including electricity, ash and CO2, evenly in both cases, accounting for 1631 million ¥ or 0.04% of the total economic production in Kochi Prefecture. From the pre-adjustment process, the loss caused by the cut-off resources is allocated to all the economic sectors. In total, the large cut-off ratio from the existing industry case could subsidize the loss by 291.78 million ¥, in comparison to the small cut-off ratio from the existing industry case. Moreover, the economic gains from their profits account for 36% of the additional total production. Consequently, the results show that the pre-adjustment of the technical coefficient could optimize the resource allocation in the local economy.
3. Input-Output (I-O) Analysis
I-O analysis was first developed by Wassily Leontief, and it became known as a crucial economic tool [2,3]. I-O analysis is a system of linear equations that describes the distribution of each industry’s products to the other industries or sectors in an economy. The purchase transactions among the economic sectors are recorded in one matrix table where the economic structure of one area is summarized. In brief, the fundamental I-O analysis is expressed using the following algebraic equations:
where the technical coefficient (A) is derived by the transaction from the production sector (i) to the consumption sector (j) Zij divided by the total production Xj [4]. The technical coefficient is a ratio that presents the exact requirements of each sector. Total production (X) is the summation of the transaction from sector-to-sector (Z) in the inter-industry and the other non-sector consumption. The final demand (f) includes the consumption of households, private investments, the government, exports and imports. Additionally, the value-added factor, including employee compensation and business owner and capital, is also required for each sector to produce goods and services.
Aij = Zij/Xj
XA + f = X
(I − A)−1 f = X
XA + f = X
(I − A)−1 f = X
3.1. Development of I-O Analysis
Over the course of several decades, a variety of extensions and improvements of the model have been implemented for I-O analysis [5]. One important factor in the development of I-O analysis is the use of a multiplier coefficient. Bullard et al. utilized the multiplier coefficient to identify the energy embodied in each economic sector [6]. With a similar energy intensity purpose, Casler and Wilbur proposed the patterns of I-O coefficients in a matrix, which is likely to be the hybrid of physical and monetary units [7]. From there on, many studies have been conducted based on the energy embodied in the coefficient method [8,9,10,11]. When approaching environmental issues, I-O analysis plays an important role in determining carbon dioxide (CO2) and greenhouse gas emissions. The carbon footprint, water footprint and ecological footprint are integrated into a multi-regional I-O analysis to indicate the effect on global warming [12]. Moreover, embodied emissions could be modeled based on the consumption of goods and services [13,14,15,16,17]. Recently, Garrett-Peltier created new synthetic industries of energy efficiency and renewable energy in order to analyze the increasing job opportunities from renewable technology [18]. The multiplier coefficient raises the idea of whether it is possible to convert the I-O analysis of monetary value to a specific itemized physical value. Thus far, some problems have arisen that cannot be identified by using I-O analysis. First, the influence of the process inside the individual industry on the local economy cannot be analyzed. Second, the effect of resource unit price fluctuation cannot be verified and modeled because I-O analysis only presents a summation of the monetary value. Lastly, the resource allocation utilization in relation to a new industry is not traceable.
3.2. Development of Hybrid I-O Analysis
While new I-O analysis methodologies are gradually being developed, our interest is in the hybrid method of physical and monetary I-O analysis. The hybrid I-O analysis methodology is inspired by the idea of life-cycle assessment (LCA) associated with the I-O analysis. LCA is usually used to identify the environmental impacts of materials and products through different stages ranging from production, usage and disposal [19,20,21,22]. A number of studies have shown how the hybrid I-O analysis identifies useful directions by applying LCA [23]. In 2004, Suh presented a model integrating LCA and I-O analysis, and defined upstream and downstream cut-offs as functions of unit operation time [24,25,26]. Furthermore, Hawkins et al. addressed the technical coefficient of a mixed unit as direct requirements, which is illustrated by the calculation of lead flows and cadmium flows [27]. Recently, Nakashima et al. (2016) evaluated the economic effects of constructing a wind power generation system [28]. The hybrid I-O analysis represents the integration of physical units and monetary units in one hybrid table. This integration designates the transfer of resources from the local economy to the new industry production process and from the new industry production process back to the economy in equilibrium. These transferred resources are defined as the cut-off. The resources from the local economy consumed by the process are denoted by the upstream cut-off, while the products of the production process consumed by the local economy are denoted by the downstream cut-off. Therefore, the new industry and the entirety of economic production can be demonstrated in the hybrid I-O analysis.
Unlike other models, this study aims to identify a problem of the change in the technical coefficient due to the cut-off, which has never been identified before. As discussed earlier, if the industry is large enough that the amount of cut-off resources is significant, the sector-to-sector technical coefficients are inevitably modified. In this case, these coefficients must be pre-adjusted to ensure that the technical coefficient remains constant. This coefficient pre-adjustment method will be comprehensively discussed in the next section.
4. Structure of the Hybrid I-O Analysis
In this paper, hybrid I-O analysis is used to evaluate the resource transfer among sectors for physical and monetary units. The hybrid I-O analysis consists of four main submatrices: the physical (P) submatrix, the monetary (M) submatrix, the upstream cut-off (Cu) submatrix and the downstream cut-off (Cd) submatrix. The relationships between these submatrices are presented in the following equation:
where X is the total production and f is the final demand of the physical unit (P) and the monetary unit (M).
- P submatrix is the commodity-to-commodity matrix addressed in the mixed physical units. In this case, it presents each resource utilization process of a biomass power plant in a 5 × 5 matrix. The data were collected from the existing operation of a biomass power plant in Sukumo in the Kochi Prefecture, Japan.
- M submatrix is the monetary-to-monetary matrix addressed in the monetary unit. The I-O table for Kochi Prefecture is a 40 × 40 matrix where the biomass power plant is used in the hybrid I-O model [29].
- Cu submatrix is the monetary-to-commodity matrix that represents the monetary value. This submatrix is the resource requirement of a biomass power plant (40 × 5 matrix), including wood resources from the forestry sector, wood products and furniture sectors, as well as the transportation sector and trading sector.
- Cd submatrix is the commodity-to-monetary matrix that represents the physical value in 5 × 40 matrix. For a biomass power plant, the electricity, ash and CO2 produced from the electricity generation process are recorded in this submatrix. It is important to note that electricity demand does not increase, although the biomass power plant has recently been introduced to the local community. Therefore, this electricity represents a cut-off demand from conventional electricity generation to the biomass power plant.
Due to the assumption that resources in the local economy are limited, the resources required by the biomass power plant are obtained from the demands experienced by the other sectors. The cut-off demands of each economic sector are equal to the cut-off portion (Cp) derived by:
where Aij is the technical coefficient of each economic sector and Ct is the total cut-off resource. It could be implied that each economic sector gives away its own demanded resource to the biomass power plant equivalent to its own consumption ratio (technical coefficient). This is the best possible explanation of the scenario, because it is very difficult to address all production and consumption activities in the real market. Therefore, we let the market determine the resource distribution by using the existing consumption ratio.
Cp = Aij × Ct
Cu and Cd are achieved using the same principal. A material cut-off basis is introduced to overcome the boundary of different units, in which Cu represents the monetary unit and Cd represents the physical unit. The material cut-off is created based on each unit of material without regard to price; for example, the cut-off electricity demands of each economic sector is determined by the demand from the conventional electricity sector in relation to the electricity generation process of a biomass power plant. If the total electricity demand of Kochi Prefecture is about 100 times greater than the demand of the biomass power plant, then the electricity demand is cut-off at a ratio of 1:100. Thus, each sector’s electricity demand is reduced to conform to the cut-off portion of each sector.
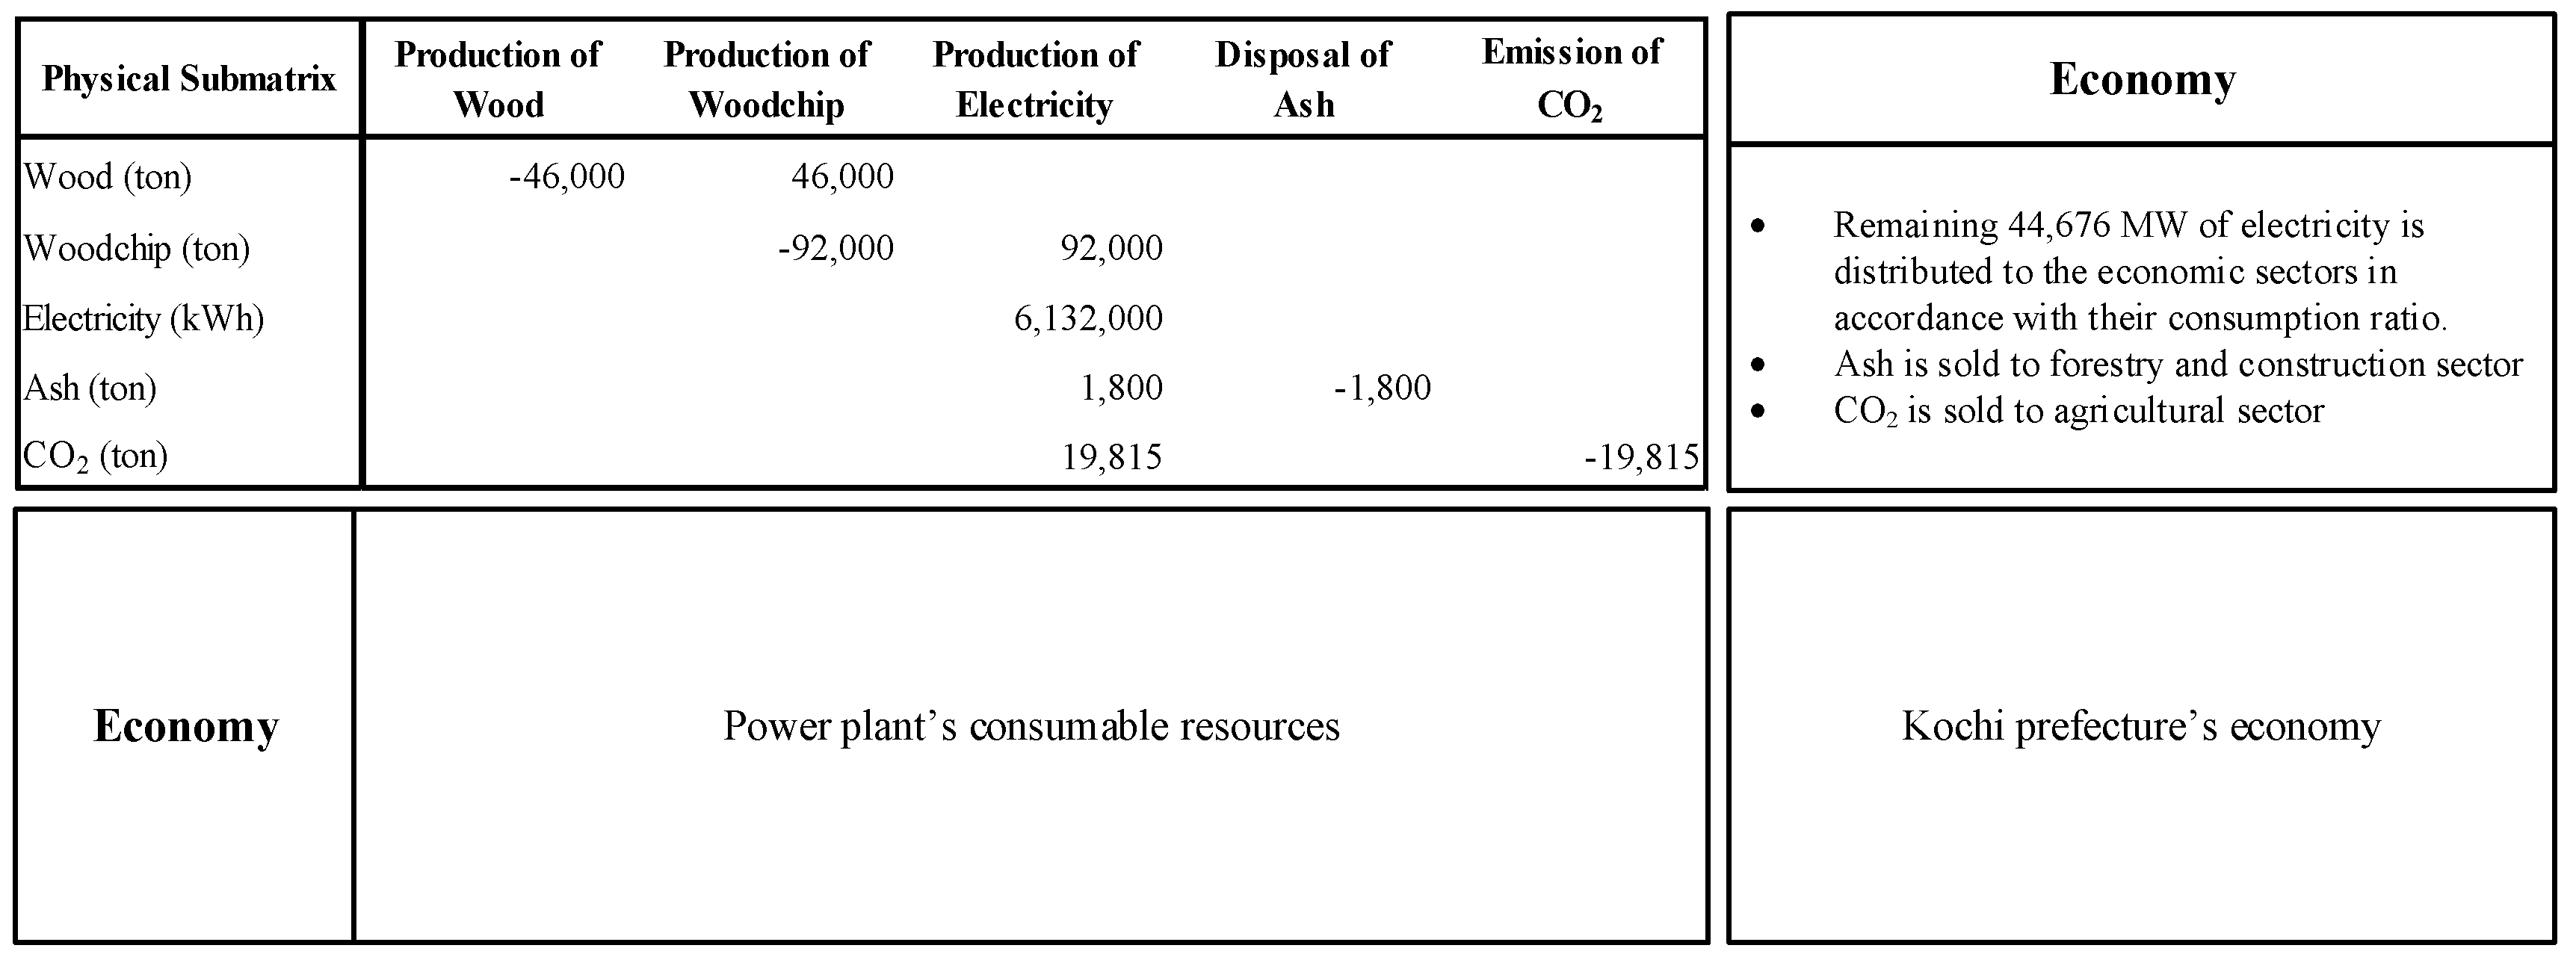
In addition, it is important to address the characteristic of the P submatrix, which determines each of the process resource uses of the biomass power plant, as seen in Figure 1. The P submatrix presents the transfer of resources from one process to another, where positive and negative indicators are used to specify the provider and the receiver. The biomass power plant gathers 46,000 tons in form of wood or lumber and another 46,000 tons in form of woodchip. The wood is reformed into woodchip by the production of woodchip process. Therefore, −46,000 tons of wood in production of wood process acts as the provider and 46,000 tons of wood presented in the production of woodchip is the receiver. In total, 92,000 tons of woodchip is fed to the production of electricity process by the same principal. The biomass power plant generates a total of 50,808 MW of electricity, of which 6132 MW is used to operate the machines and the site office, and 44,676 MW of the remaining electricity is supplied to the other economic sectors. Moreover, 1800 tons of ash and 19,815 tons of CO2 are produced from the electricity generation process. It is inevitable that the electricity could be generated without these by-products; so in the production of electricity process, they are assigned in positive indicator. Instead of disposal of the by-products, they can be sold to the designated economic sectors.
4.1. Small Cut-Off Ratio from the Existing Industry
This case exhibits how the small cut-off ratio could influence the economic effects on the local economy. When the resources in the economy are cut in accordance with the biomass power plant’s consumption, some specific products are subsequently deducted from the consumption of the economic sectors. Once the products distributed to each economic sector are deducted, the technical coefficient is certainly changed. If these changes in technical coefficient are relatively minimal, such that they do not affect the resource distribution pattern in the economy, such changes can be ignored. Therefore, the cut-off resource can be achieved directly through each economic sector cut-off portion as shown in Table 4. The green up arrow presents the transferred resources in relation to the biomass power plant consumption, while the red down arrow indicates the reduction of those resources in the economy. Both changes in resource allocation are induced by the cut-off. Additionally, the cut-off electricity from existing electricity sector to be the product of the biomass power plant is highlighted by the yellow square border.
4.2. Large Cut-Off Ratio from the Existing Industry
In contrast, the large cut-off ratio presents the economic effect from a different view point, whereby the cut-off resources are considerably large compared to the total economic production. The technical coefficient or the resource distribution pattern is significantly changed by the cut-off resources. In reality, the additional consumption of the biomass power plant alone could not change the ratio of resource distribution. Thus, the deduction of products distributed to the economic sector should be reallocated according to the existing market distribution ratio. Table 5 shows an example of the change in the product distribution regarding to the technical coefficient pre-adjustment method, the procedure for which will be demonstrated in the next section.
5. Technical Coefficient Pre-Adjustment Method
The economic structure of one area can be illustrated by its technical coefficient using I-O analysis because all the transactions purchased from one economic sector to another are recorded in one matrix. Typically, the technical coefficient that represents the economic structure does not change suddenly. This coefficient might be slightly changed over a period of time in accordance with advancements in technology. However, if we prefer to cautiously evaluate the economic impacts of a new industry, the introduction of one industry cannot notably change the local economic structure. For example, the furniture industry requires 10 kg of wood to produce one chair. Although the biomass power plant takes half of the wood consumption away from the furniture industry, this does not change the fact that 10 kg of wood is still required to produce one chair. Therefore, the technical coefficient should be unchanged; the ratio should be the same before and after the cut-off is introduced.
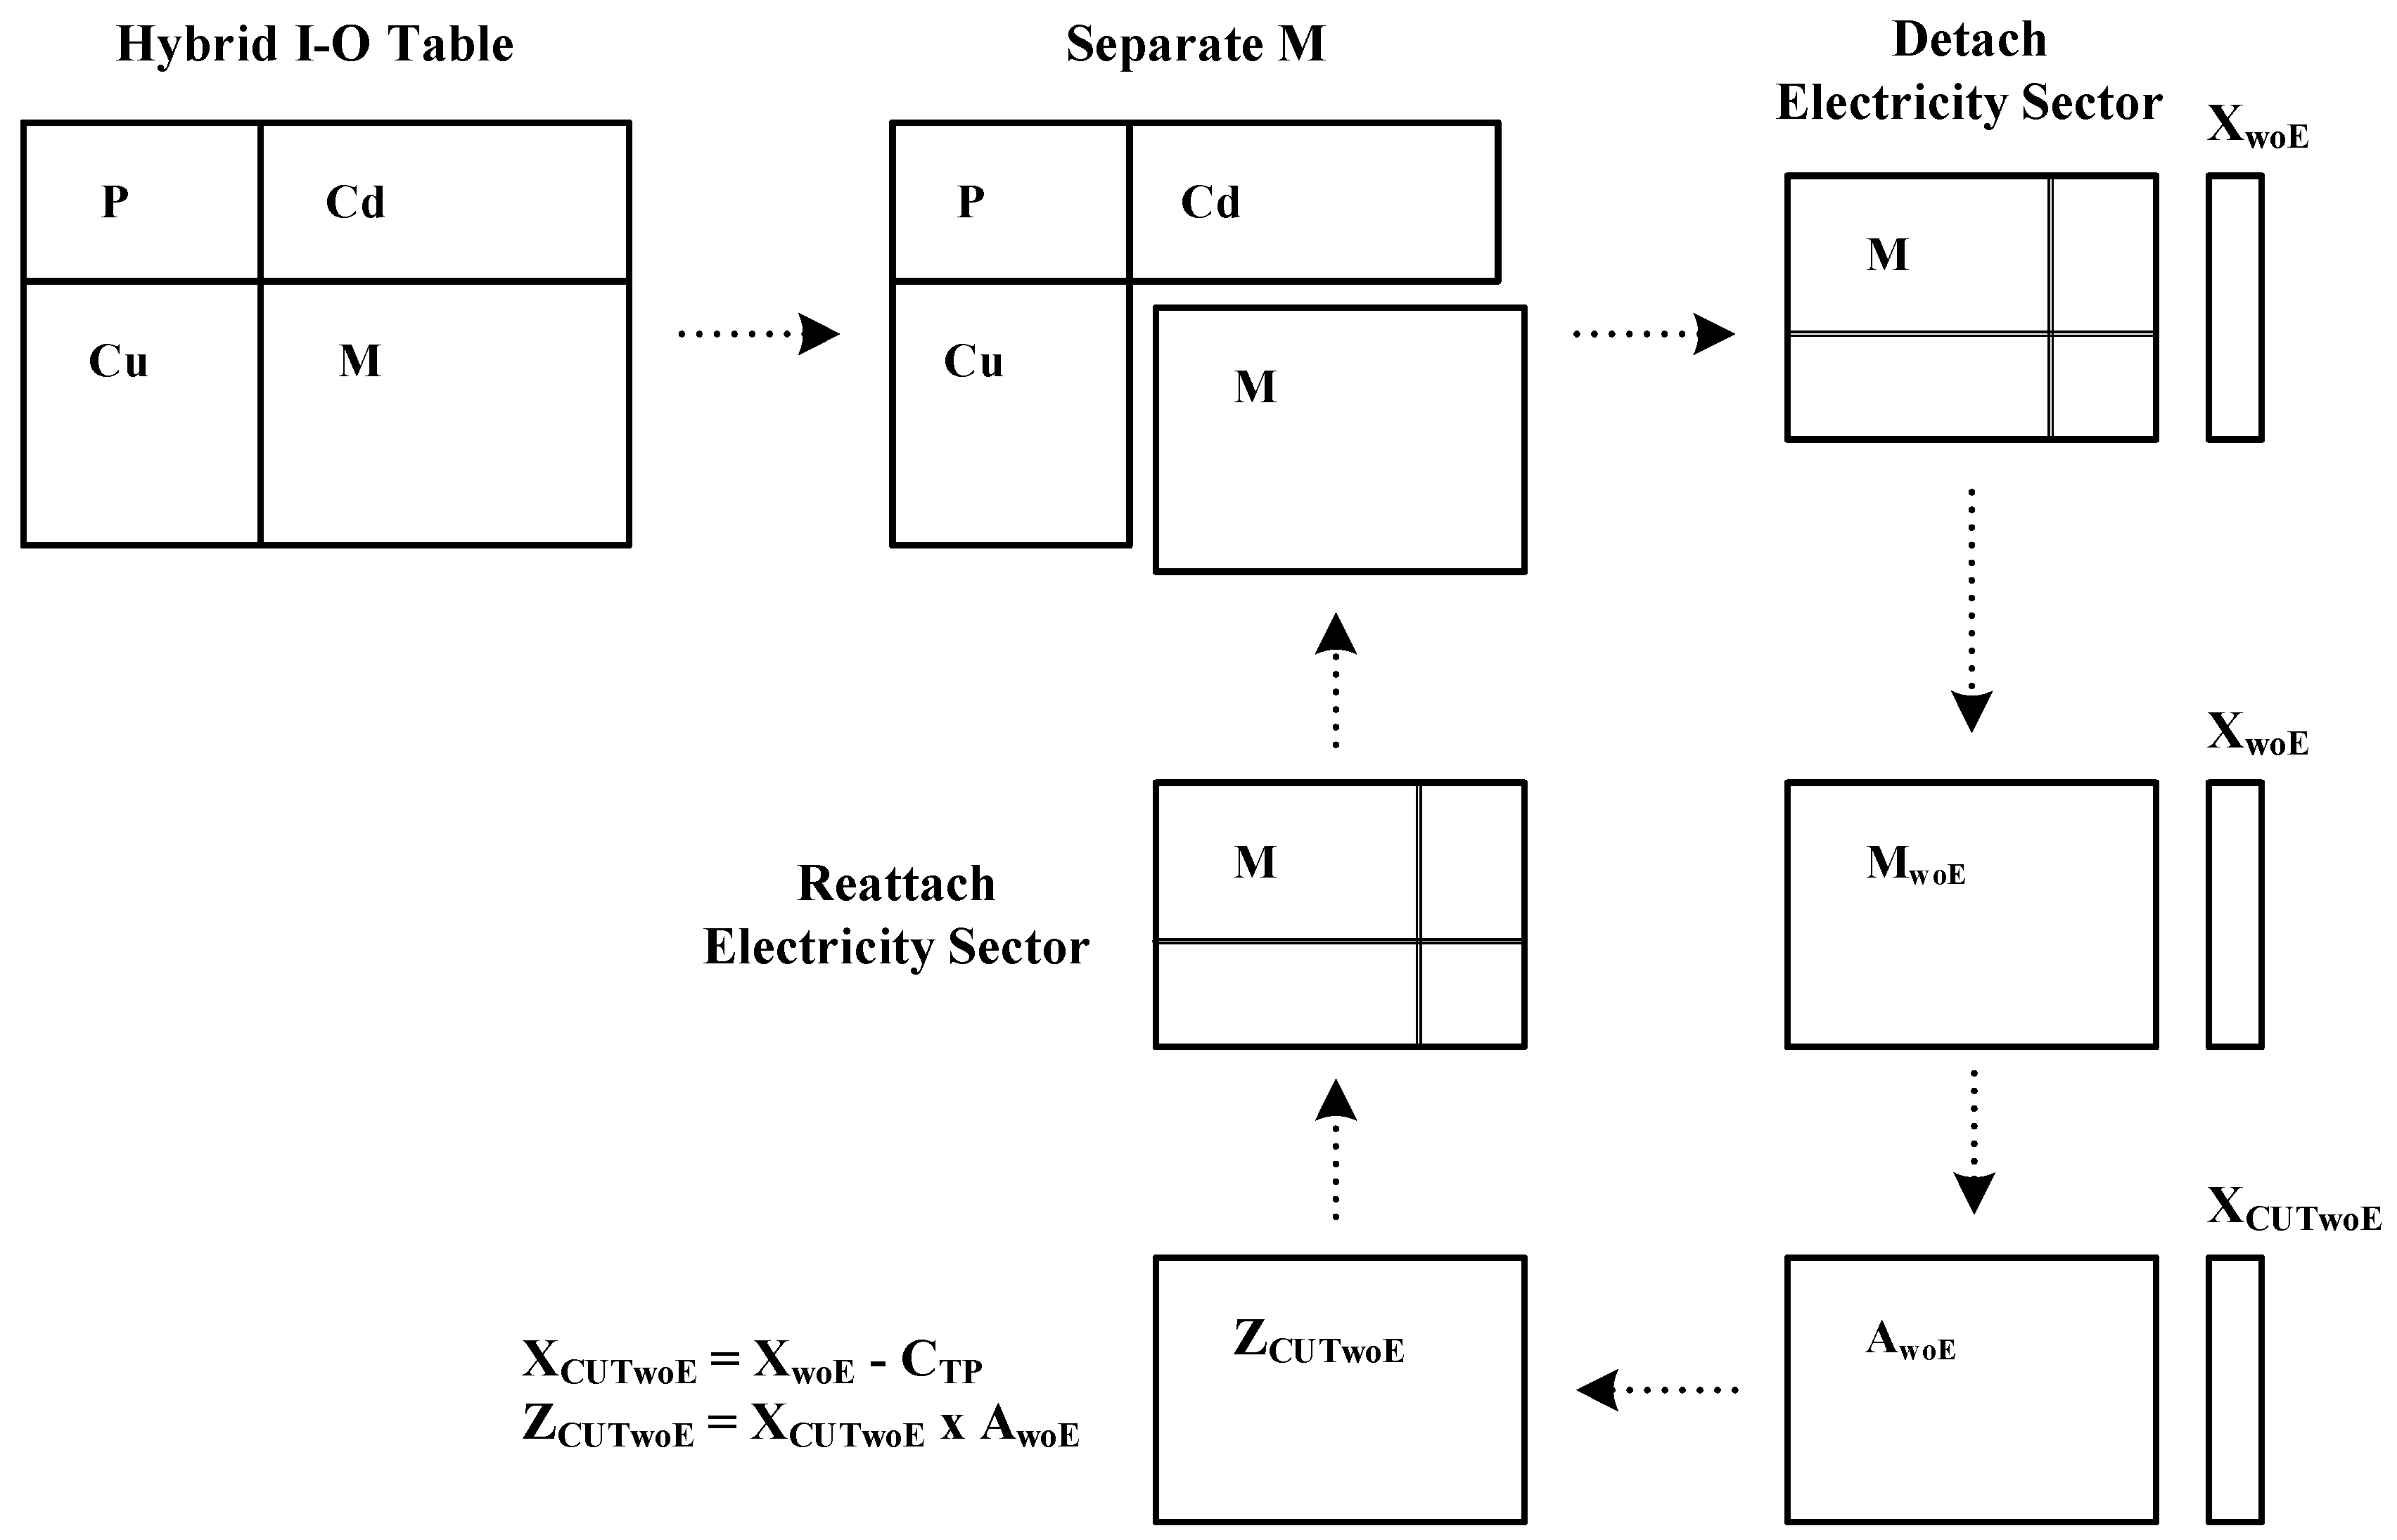
Once the cut-off is applied to create the hybrid I-O matrix consisting of P, M, Cu and Cd submatrices, it is obvious that the cut-off of related sectors is lost; each sector’s own resource demands are funneled to the biomass power plant production process. Consequently, the technical coefficient presented in the M are dissimilar from those presented in the I-O table. The method proposed in this study is to temporarily separate the M submatrix from the hybrid I-O matrix. Additionally, the electricity sector should remain constant, because the electricity demand is not changed by the influence of the biomass power plant. Therefore, we attempted to eliminate the presence of the electricity sector from the M submatrix (Figure 2), as follows
where XM is the total production of M, XwoE is the total production without the electricity sector, Ê is the vector of the electricity sector and CTP is the total cut-off portion. Noticeably, there are two total productions: XwoE and XCUTwoE. In this case, the technical coefficient (AwoE) is calculated by dividing the M submatrix without the electricity sector (ZwoE) with XwoE. Then, the recalculation of the new value of the M submatrix without the electricity sector (ZCUTwoE) can be expressed as:
XwoE = XM − Ê
XCUTwoE = XwoE − CTP
XCUTwoE = XwoE − CTP
ZCUTwoE = XCUTwoE × AwoE
Consequently, the transaction from sector-to-sector (ZCUTwoE) is now responsible for the influence of the biomass power plant’s resource consumption without the involvement of the electricity sector. Hereafter, reattaching Ê to the ZCUTwoE gives the adjusted M submatrix. By all these pre-adjustment processes, the adjusted M submatrix is ready to be combined with the rest of the submatrices shown in the hybrid I-O table.
6. Conclusions
The present study determined the effect of pre-adjusting the technical coefficient to evaluate the positive and negative economic impacts of a biomass power plant’s resource production and consumption on the total economic production of the local economy in Kochi Prefecture, Japan. There are two reasons why the pre-adjustment process has been proven to be necessary to the hybrid I-O analysis. First, it is a fact that when the economic sectors lose their supply of resources to the biomass power plant, these losses affect their production process. Second, the technical coefficient should be constant at one period of time so that the pre-adjustment method could preserve the economic structure of the local economy. Therefore, the technical coefficient should be pre-adjusted in order to improve the precision of the resulting calculation.
Input-output analysis is an extensive and remarkable method that is widely used in many countries to indicate the actual and theoretical economic effects on their economy. The method is able to address a wide range of economies, from very small-scale economies (city or province) up to the multi-regional scale. Our findings could serve as an inspiration for the extension of using hybrid I-O analysis in future. The extension of this model could result in the new application of hybrid I-O analysis for verifying the economic effect of other type of individual industries, groups of similar industries, or larger industrial estates. Moreover, not limited to industrial issues, the extension could also mean the economic impacts from non-industrial issues such as environmental issues and natural disaster issues. If data is made available and the structure of an issue can be established, the hybrid I-O analysis will be able to analyze cross-disciplinary issues in the areas of science, technology, and economics.
Author Contributions
C.J. and S.N. conceived and designed the experiment; C.J. performed the data collection; C.J. and S.N. analyzed the data and results; C.J. wrote the paper.
Conflicts of Interest
The authors declare no conflict of interest.
References
- Ministry of International Affairs and Communications. Japan Statistical Yearbook 2018. Available online: http://www.stat.go.jp/english/data/nenkan/pdf/yhyou03.pdf (accessed on 25 January 2018).
- Leontief, W. Input-Output Economics; Oxford University Press: New York, NY, USA, 1986. [Google Scholar]
- Leontief, W. Environmental repercussions and the economic structure: An input-output approach. Rev. Econ. Stat. 1970, 52, 262–271. [Google Scholar] [CrossRef]
- Miller, R.E.; Blair, P.D. Foundations of input-output analysis. In Input-Output Analysis: Foundations and Extensions, 2nd ed.; Cambridge University Press: New York, NY, USA, 2009; pp. 10–66. ISBN 978-0-521-51713-3. [Google Scholar]
- Suh, S. Handbook of Input-Output Economics in Industrial Ecology; Springer: Dordrecht, The Netherlands, 2009; ISBN 978-1-4020-4083-2. [Google Scholar]
- Bullard, W.; Penner, S.; Pilati, A. net energy analysis: Handbook for combining process and input-output analysis. Resour. Energy 1978, 1, 267–313. [Google Scholar] [CrossRef]
- Casler, S.; Wilbur, S. Energy input-output analysis: A simple guide. Resour. Energy 1984, 6, 187–201. [Google Scholar] [CrossRef]
- Ali, H.; Yasmin, T. Assessment of the global financial crisis effects on energy consumption and economic growth in Malaysia: An input-output analysis. Int. Econ. 2014, 140, 49–70. [Google Scholar] [CrossRef]
- Cui, L.; Peng, P.; Zhu, L. Embodied energy, export policy adjustment and China’s sustainable development: A multi-regional input-output analysis. Energy 2015, 82, 457–467. [Google Scholar] [CrossRef]
- Cortes-Borda, D.; Guillen-Gosalbez, G.; Jimenez, L. Solar energy embodied in international trade of goods and services: A multi-regional input-output approach. Energy 2015, 82, 578–588. [Google Scholar] [CrossRef]
- Chen, S.; Chen, B. Urban energy consumption: Different insights from energy flow analysis, input-output analysis and ecological network analysis. Appl. Energy 2015, 138, 99–107. [Google Scholar] [CrossRef]
- Ewing, B.R.; Hawkins, T.R.; Wiedmann, T.O.; Galli, A.; Ercin, A.E.; Weinzettel, J.; Steen-Olsen, K. Integrating ecological and water footprint accounting in a multi-regional input-output framework. Ecol. Indic. 2012, 23, 1–8. [Google Scholar] [CrossRef] [Green Version]
- Lopes, A.; Carvalho, D.; Henggeler, C.; Freire, F.; Oliveira, C. A hybrid input-output multi-objective model to assess economic-energy-environment trade-offs in Brazil. Energy 2015, 82, 769–785. [Google Scholar] [CrossRef] [Green Version]
- Onat, N.C.; Kucukvar, M.; Tatari, O. Scope-based carbon footprint analysis of U.S. residential and commercial buildings: An input-output hybrid life cycle assessment approach. Build. Environ. 2014, 72, 53–62. [Google Scholar] [CrossRef]
- Zhang, W.; Peng, S.; Sun, C. CO2 emissions in the global supply chains of services: An analysis based on a multi-regional input-output model. Energy Policy 2015, 86, 93–103. [Google Scholar] [CrossRef]
- Liu, Q.; Wang, Q. Reexamine SO2 emissions embodied in China exports using multiregional input-output analysis. Ecol. Econ. 2015, 113, 39–50. [Google Scholar] [CrossRef]
- Cláudia, A.; Lemos, D.; Gabarrell, X.; Arroja, L. Environmentally extended input-output analysis on a city scale-application to Aveiro (Portugal). J. Clean. Prod. 2014, 75, 118–129. [Google Scholar] [CrossRef]
- Garrett-peltier, H. Green versus brown: Comparing the employment impacts of energy efficiency, renewable energy, and fossil fuels using an input-output model. Econ. Model. 2017, 61, 439–477. [Google Scholar] [CrossRef]
- Heijungs, R.; Frischknecht, R. A special view on the nature of the allocation problem. Analysis 1998, 3, 321–322. [Google Scholar] [CrossRef]
- Science, E. A generic method for the identification of options for cleaner products. Ecol. Econ. 1994, 10, 69–81. [Google Scholar] [CrossRef]
- Hendrickson, C.; Horvath, A.; Joshi, S.; Lave, L. Economic input-output models for environmental life-cycle assessment. Environ. Sci. Technol. 1998, 32, 184a–191a. [Google Scholar] [CrossRef]
- Joshi, S.; College, J.M. Product environmental life-cycle assessment using input-output techniques. J. Ind. Ecol. 1999, 3, 95–120. [Google Scholar] [CrossRef]
- Suh, S.; Huppes, G. Missing inventory estimation tool using extended input-output analysis. Int. J. Life Cycle Assess. 2002, 7, 134–140. [Google Scholar] [CrossRef]
- Suh, S. Functions, commodities and environmental impacts in an ecological economic model. Ecol. Econ. 2004, 48, 451–467. [Google Scholar] [CrossRef]
- Peters, G.P.; Hertwich, E.G. A comment on “Functions, commodities and environmental impacts in an ecological-economic model”. Ecol. Econ. 2006, 59, 1–6. [Google Scholar] [CrossRef]
- Suh, S. Reply: Downstream cut-offs in integrated hybrid life-cycle assessment. Ecol. Econ. 2006, 59, 7–12. [Google Scholar] [CrossRef]
- Hawkins, T.R.; Hendrickson, C.; Higgins, C.; Matthews, H.S.; Suh, S. A mixed-unit input-output model for environmental life-cycle assessment and material flow analysis. Environ. Sci. Technol. 2007, 41, 1024–1031. [Google Scholar] [CrossRef] [PubMed]
- Nagashima, S.; Uchiyama, Y.; Okajima, K. Hybrid input-output table method for socioeconomic and environmental assessment of a wind power generation system. Appl. Energy 2017, 185, 1067–1075. [Google Scholar] [CrossRef]
- Statistics Division Kochi Prefecture. Available online: http://www.pref.kochi.lg.jp/soshiki/111901/2014061400035.html (accessed on 24 January 2016).
Figure 1.
Resource utilization of biomass power plant in relation to the economy.

Figure 2.
The technical co-efficient pre-adjustment process.

Table 1.
Variation in total production for the large cut-off ratio from the existing industry case and the base case.
Table 1.
Variation in total production for the large cut-off ratio from the existing industry case and the base case.
| Economic Sectors | Additional Total Production (¥) |
|---|---|
| Forestry | 22,097,114 |
| Mining | 7,636,581 |
| Lumber, Wood Product and Furniture | 239,777,150 |
| Chemical Product | −14,287,967 |
| Petroleum and Coal | 4,181,482 |
| Iron, Steel and Non-Ferrous | −3,431,955 |
| Metal Product | −4,081,460 |
| General Machinery | −421,572 |
| Construction | −1,411,288 |
| Electricity, Gas and Heat | −809,250,000 |
| Trading | −19,144,996 |
| Financial and Insurance | −10,721,416 |
| Transportation | 133,256,207 |
| Private Transport | −9,003,699 |
| Business Services | −18,719,199 |
Table 2.
Total production for the local economic sectors and the biomass power plant.
| Economic Sectors | Additional Total Production (¥) |
|---|---|
| Wood | 0 |
| Woodchip | 0 |
| Electricity | 1,625,856,000 |
| Ash | 3,600,000 |
| Carbondioxide | 1,981,512 |
| Total Economic Sectors * | −517,464,846 |
| Additional Total Production | 1,113,972,666 |
* The additional economic value of Large Cut-Off Ration from the Existing Industry Case compared to the ordinary I-O table.
Table 3.
Comparison of the total production of the large cut-off ratio from the existing industry case and the small cut-off ratio from the existing industry case.
Table 3.
Comparison of the total production of the large cut-off ratio from the existing industry case and the small cut-off ratio from the existing industry case.
| Economic Sectors | Large Cut-Off Ratio Case (¥) | Small Cut-Off Ratio Case (¥) |
|---|---|---|
| Electricity | 1,625,856,000 | 1,625,856,000 |
| Ash | 3,600,000 | 3,600,000 |
| CO2 | 1,981,512 | 1,981,512 |
| Forestry | 22,097,114 | 0 |
| Lumber, Wood Product and Furniture | 239,777,150 | 0 |
| Petroleum and Coal | 4,181,482 | 0 |
| General Machinery | −421,572 | 0 |
| Construction | −1,411,288 | 0 |
| Electricity, Gas and Heat | −809,250,000 | −809,250,000 |
| Transportation | 133,256,207 | 0 |
| Other | −105,693,938 | 0 |
| Additional Total Production | 1,113,972,666 | 822,187,512 |
Table 4.
Small cut-off ratio from the existing industry case.

Table 5.
Large cut-off ratio from the existing industry case with technical coefficient pre-adjustment method.
Table 5.
Large cut-off ratio from the existing industry case with technical coefficient pre-adjustment method.

© 2018 by the authors. Licensee MDPI, Basel, Switzerland. This article is an open access article distributed under the terms and conditions of the Creative Commons Attribution (CC BY) license (http://creativecommons.org/licenses/by/4.0/).
Share and Cite
MDPI and ACS Style
Jongdeepaisal, C.; Nasu, S. Economic Impact Evaluation of a Biomass Power Plant Using a Technical Coefficient Pre-Adjustment in Hybrid Input-Output Analysis. Energies 2018, 11, 598. https://doi.org/10.3390/en11030598
AMA Style
Jongdeepaisal C, Nasu S. Economic Impact Evaluation of a Biomass Power Plant Using a Technical Coefficient Pre-Adjustment in Hybrid Input-Output Analysis. Energies. 2018; 11(3):598. https://doi.org/10.3390/en11030598
Chicago/Turabian StyleJongdeepaisal, Cholapat, and Seigo Nasu. 2018. "Economic Impact Evaluation of a Biomass Power Plant Using a Technical Coefficient Pre-Adjustment in Hybrid Input-Output Analysis" Energies 11, no. 3: 598. https://doi.org/10.3390/en11030598
Note that from the first issue of 2016, this journal uses article numbers instead of page numbers. See further details here.