A Gas–Solid–Liquid Coupling Model of Coal Seams and the Optimization of Gas Drainage Boreholes

1
State Key Laboratory of Coal Mine Disaster Dynamics and Control, Chongqing University, Chongqing 400030, China
2
State and Local Joint Engineering Laboratory of Methane Drainage in Complex Coal Gas Seam, Chongqing University, Chongqing 400030, China
3
College of Mining, Liaoning Technical University, Fuxin 123009, China
4
Energy and Mineral Engineering, Pennsylvania State University, University Park, State College, PA 16801, USA
*
Authors to whom correspondence should be addressed.
Energies 2018, 11(3), 560; https://doi.org/10.3390/en11030560
Submission received: 28 January 2018
/
Revised: 23 February 2018
/
Accepted: 26 February 2018
/
Published: 6 March 2018
Abstract
:For a gas–solid–liquid coupling model of coal seams, previous permeability models basically supposed uniaxial strains as the boundary condition for coal reservoirs without considering the deformation caused by changes in humidity. The permeability model varies under different boundary conditions. According to the true triaxial stress state of coal reservoirs, a permeability model considering the effective stress, sorption and desorption, and wet strain was established. Based on the permeability model, the continuity equation of gas and water and the stress field equation were coupled. Then, the model was incorporated in the COMSOL suite to simulate gas drainage from boreholes in floor roadways passing through seams in a coal mine. By comparing with the measured gas flow on site, the model was verified as being reliable. Moreover, the spacing and layout shape of boreholes in floor roadways were simulated. To achieve the aim of eliminating regional outburst within 180 days and decreasing the number of boreholes so as to reduce the cost, the spacing and shape of boreholes were optimized. When the superimposed effect of the boreholes was not considered, the optimal spacing of boreholes was r; if the superimposed effect was taken into account, the spacing could be set to within r ≤ L ≤ R, where r and R represent the effective gas drainage radius and the influence radius of gas drainage, respectively. The borehole spacing could be appropriately increased when the boreholes were arranged in rhomboidal form. To achieve the same range of outburst elimination, the rhomboidal layout can decrease the number of boreholes to reduce cost, thus realizing the objective of this optimization process.
1. Introduction
Coalbed methane (CBM), a kind of clean energy resource, has a wide range of applications. However, the presence of CBM in coal mines can lead to various hazards, such as coal and gas outbursts and gas explosion [1,2,3,4,5,6,7]. CMB, a nonconventional energy source, occurs in some coal mines with extremely low porosity and permeability (generally lower than 0.1 mD) [8]. Differing from conventional oil and natural gas reservoirs, CBM reservoirs have some unique characteristics. The first is that they contain three phases: coal, gas, and water coexist, and moisture affects adsorption and desorption of the coal seam [9,10,11]; and the second is that coal reservoirs are dual-porosity media containing matrix materials and fractures [12,13]. The coal matrix stores the majority of the gas (98%), while CBM mainly flows in fractures [14,15,16]. Meanwhile, due to the swelling and shrinkage effects of coal caused by sorption and desorption, the storage and migration mechanisms of nonconventional CBM show essential differences from those of conventional reservoirs [17,18]. The migration of CBM involves three phases [19]: desorption from the internal surfaces, diffusion from the matrix, and flow in the fracture network. Under pressure, CBM flows from the fracture network to the borehole, and then free CBM in the matrix flows to the fractures under the effect of the pressure drop along each fracture. Finally, due to the decreasing gas pressure in the matrix, CBM is desorbed from the matrix.
Many scholars have studied the permeability model [20,21,22,23,24]. Wu et al. [25,26] established porosity and permeability models under different stress conditions. Robertson et al. [27] defined fracture porosity as:
where a represents the cubic matrix length and b represents the width of the cleats separating the matrix blocks. The variable quantity of the fracture porosity is expressed as
On the basis of the change of effective stress and the gas sorption effect, Wang et al. [28] built an anisotropic permeability evolution model. Under constant effective stress and isotropic conditions, the permeability evolution model can be expressed as:
where FI denotes the internal swelling coefficient and and PL are Langmuir constants.
Liu et al. [29] coupled the gas migration and deformation of coal reservoirs and constructed a mathematical model to study the sorption kinetics of methane. Based on the dual poroelasticity, they also built a permeability model to investigate the relationship between the balance time and the evolution of the permeability of coal reservoirs. According to poroelastic theory and the diffusion and seepage mechanism, Kong et al. [30] established evolutionary models of both porosity and permeability while taking the gas pressures in fractures and pores into account. By considering sorption and the Klinkenberg effect, Xia et al. [31] built a coupling model between the non-Darcy flow of CBM and the deformation processes in coal reservoirs. The simulation revealed that the Klinkenberg effect was able to enhance the rate of production of CBM. Lu et al. [32] believed that permeability is affected by boundary conditions and established a permeability model under different boundary conditions. By considering solid deformation, gas flow, water flow, and heat transfer, Li et al. [33] constructed a thermal-hydro-mechanical coupling model.
The layout of boreholes in CBM drainage operations influences the overall extraction performance. Ren et al. [34] studied the application of multibranched horizontal wells in the extraction of CBM. They compared the extraction performance of multibranched horizontal and vertical wells subjected to hydraulic fracturing. The data revealed that the gas extraction efficiency from vertical wells dropped significantly after a short period of time. In comparison, the multibranched horizontal wells performed favorably during the extraction of CBM. In addition, the direction, length, and spacing of multibranched wells were optimized, which can improve extraction efficiency. Liu et al. [35] analyzed the superimposed effects of multiple boreholes during gas extraction, and found that they influenced extraction efficiency and the range of influence of single boreholes. Li Bo [36] carried out experiments using the pressure drop method. He studied the influence radius R and the effective radius r of the borehole drainage scheme. By using the numerical simulation software COMSOL Multiphysics, he obtained the variation of the influence radius and the effective radius of borehole drainage schemes. He also analyzed the flow of gas surrounding the boreholes and the superimposed effect of multiple boreholes, and found that the rational space between the gas drainage boreholes along coal seams was within 2r ≤ L ≤ R.
It can be seen from the above studies that three phases (gas, solid, and liquid) coexist in coal seams; that permeability, and changes therein, in coal reservoirs during drainage is affected by the boundary conditions; and the extraction effect is related to the layout of gas drainage boreholes. Although scholars have studied the gas–solid–liquid coupling model of coal seams, the permeability model most often used assumes that the boundary condition of the coal reservoir is governed by uniaxial strain while not establishing a gas–solid–liquid coupling model under true triaxial conditions. Aiming at this problem, the current research considered a coal seam as a three-phase porous medium composed of solid phase (skeleton), liquid phase (water), and gaseous phase (gas), according to a true triaxial stress state in the coal reservoir. Then, based on the theory of porous media, a three-phase coupling mathematical model was constructed that considered the effective stress, sorption and desorption, strain under wet conditions caused by the changing saturation ratio, water flow, and gas transport, and the correctness of the model was then verified. During gas extraction from floor roadway in the coal mine, the borehole spacing and layout influence borehole drainage efficiency, therefore determining the key borehole parameters is a way to improve the efficiency of gas drainage. The spacing of boreholes for gas drainage in many coal mines in China is determined by empirical estimation, and the parameter design lacks a theoretical basis. If the borehole spacing is too large, the number of boreholes is too low, leading to unsatisfactory gas drainage; if the borehole spacing is too small, too many boreholes are needed, causing a waste of manpower and material resources. The layout of boreholes also affects borehole drainage efficiency. Therefore, rationally selecting the layout parameters of gas predrainage boreholes is important. By using the established model, gas drainage from floor roadway in a coal mine in Henan Province, China, was simulated. By comparing the outburst elimination areas on the inclined plane, and outburst elimination volumes when the spacing and layout of boreholes are different, the optimal borehole spacing and layout were determined, while the superimposed effect of boreholes was considered. Use of the optimized layout can reduce the number of boreholes, thus saving money.
2. Gas–Solid–Liquid Coupling Model
2.1. Stress Field Equation
A Navier-type equation for the dual-porosity model can be expressed as [37]:
When the effective stress, sorption and desorption, and deformation induced by saturation change are taken into account, the total strain of the solid skeleton can be expressed as:
where ui (i = x, y, z) are displacements in the i-direction.
where G is the shear stiffness, E is the elastic modulus, is the mean stress component, K is the bulk modulus, D is the effective elastic modulus (Pa), is the skeleton elastic modulus, is the component of the body force, is the normal stiffness of the individual fractures, is the component of the body force, and is the strain induced by gas sorption. In addition, and are the CH4 Langmuir matrix swelling and pressure constants, respectively.
2.2. Seepage Field Equation
In the first stages of such research, many have studied the properties of rocks under uniaxial strain conditions. In later stages, however, physical characteristics measured under conditions extremely close to natural ones became more widely accepted [38]. Feng et al. [39] proposed that when underground rock masses are in a true triaxial state, the three principal stresses are such that . The underground coal seam and surrounding rocks are also subjected to a true triaxial stress state due to tectonic stress. Alexeev et al. [40] suggested that a true triaxial stress state is similar to natural conditions.
2.2.1. The Permeability Model of the Matrix
Permeability is one of the most important physical and mechanical parameters of a porous medium. Classical seepage mechanics holds that the solid skeleton does not undergo any elastic or plastic deformation, so traditional liquid–solid coupling theory regards the porosity of coal seams as a constant, while evidently this point of view does not conform to real conditions. Compression, sorption, swelling, and deformation due to factors such as ground stress, gas pressure change, and wet expansion can lead to primary deformation of the coal skeleton to different extents. As the ground stress and gas pressure change by different amounts, the permeability also changes. The concept diagram for such a dual-porosity medium is provided in Figure 1.
According to the definition of porosity :
where represent the pore volume, volume of matrix blocks, change of pore volume, change of skeleton volume, initial pore volume, initial volume of matrix blocks, initial skeleton volume, and volumetric strain, respectively. The primary deformation of unsaturated porous coal particles is constituted by the following components:
(1) Strain caused by the gas pressure:
The strain due to sorption and desorption can be expressed as , where refers to the coefficient of volumetric strain caused by sorption and desorption (kg·m−3) and Vs represents the gas content adsorbed under nonisothermal conditions (m3·kg−1):
where VL and PL are the Langmuir volume constant (m3·kg−1) and Langmuir pressure constant (Pa), respectively.
(3) Wet strain
Under the linear assumption, the wet strain can be expressed as:
The total deformation of grain skeletons in the matrix is:
where are the bulk modulus of the matrix, the variation of gas pressure, wet expansion coefficient, and saturation, respectively.
By substituting Equations (10) and (11) into (6), the dynamic evolution model of the permeability of the matrix in a water–air two-phase flow under compression conditions (before dilatation) is given by:
2.2.2. Fracture Permeability Model
Fracture porosity can be expressed using the fracture width and the length of matrix blocks as [25]:
That is,
For a water-bearing coal seam, the factors influencing its deformation include deformation caused by (1) the effective stress, (2) the sorption and desorption, and (3) the strain under wet conditions; then
The following equation can be obtained by substituting Equations (16) and (17) into (15):
Integrating Equation (20), we get:
where , in which represents the external compressive stress and are the Biot coefficients of the matrix and fractures, respectively.
According to previous research [25]:
Integrating Equation (20), we get:
In a triaxial stress state, the external forces remain unchanged, namely . Then, Equation (25) can be rewritten as:
According to Fick’s law, the mass balance equation for gas in a coal matrix is [43,44]:
where mm, Mg, R = 8.314, T, and represent the gas content per unit volume of the matrix (kg·m−3), the molar mass of the gas (kg·mol−1), the molar gas constant (J·mol−1·K−1), the time, and the desorption-diffusion time, respectively.
where Vs, , pn = 101, Tn = 273.5, and denote the amount of adsorbed gas, the skeleton density (kg·m−3), standard atmospheric pressure (kPa), the temperature under standard conditions (K), and the porosity of the matrix, respectively. The adsorbed gas content can be expressed as:
where c1 is the pressure coefficient (MPa−1), c2 is the temperature coefficient (K−1), VL is the Langmuir volume constant (m3·kg−1), pL is the Langmuir pressure constant (Pa), T is the temperature of the coal seam (K), and Tt is the reference temperature in the sorption-desorption experiment (K).
The migration equation of CBM in the coal matrix can be attained by substituting Equation (28) into the matrix balance given by Equation (27):
The continuity equation for water and gas in the fractures is:
The water and gas have the following densities, respectively:
The flow velocities of the water and gas are:
The relative permeabilities of water and gas are [45]:
where k is absolute permeability of gas (m2), krg is the relative permeability of gas (dimensionless), krw is the relative permeability of water (dimensionless), krg is the relative permeability of gas (dimensionless), sw is the water saturation fraction (dimensionless), swr is the irreducible water saturation fraction (dimensionless), sgr is the residual gas saturation fraction, and pc is the capillary force (Pa).
By substituting Equations (32)–(35) into (31), the flow Equations (37) and (38) for gas and water in the seepage field can be obtained as:
Equations (2), (37), and (38) constitute the gas–solid–liquid coupling model, and the coupling phases are represented by Equations (13) and (26).
3. Model Verification
A coal mine in a city of Henan Province was taken as the research object. Stretching along the northeast-southwest direction, the mine field is 10 km long in the northeast-southwest direction and 1.15 to 2.4 km wide in the northwest-southeast direction, covering an area of 17.1219 km2. Vertical shaft development with a single mining level has been adopted across the entire mine field and retreating longwall slicing on the strike is used to mine the coal. The roof is managed using the fully caving coal mining method.
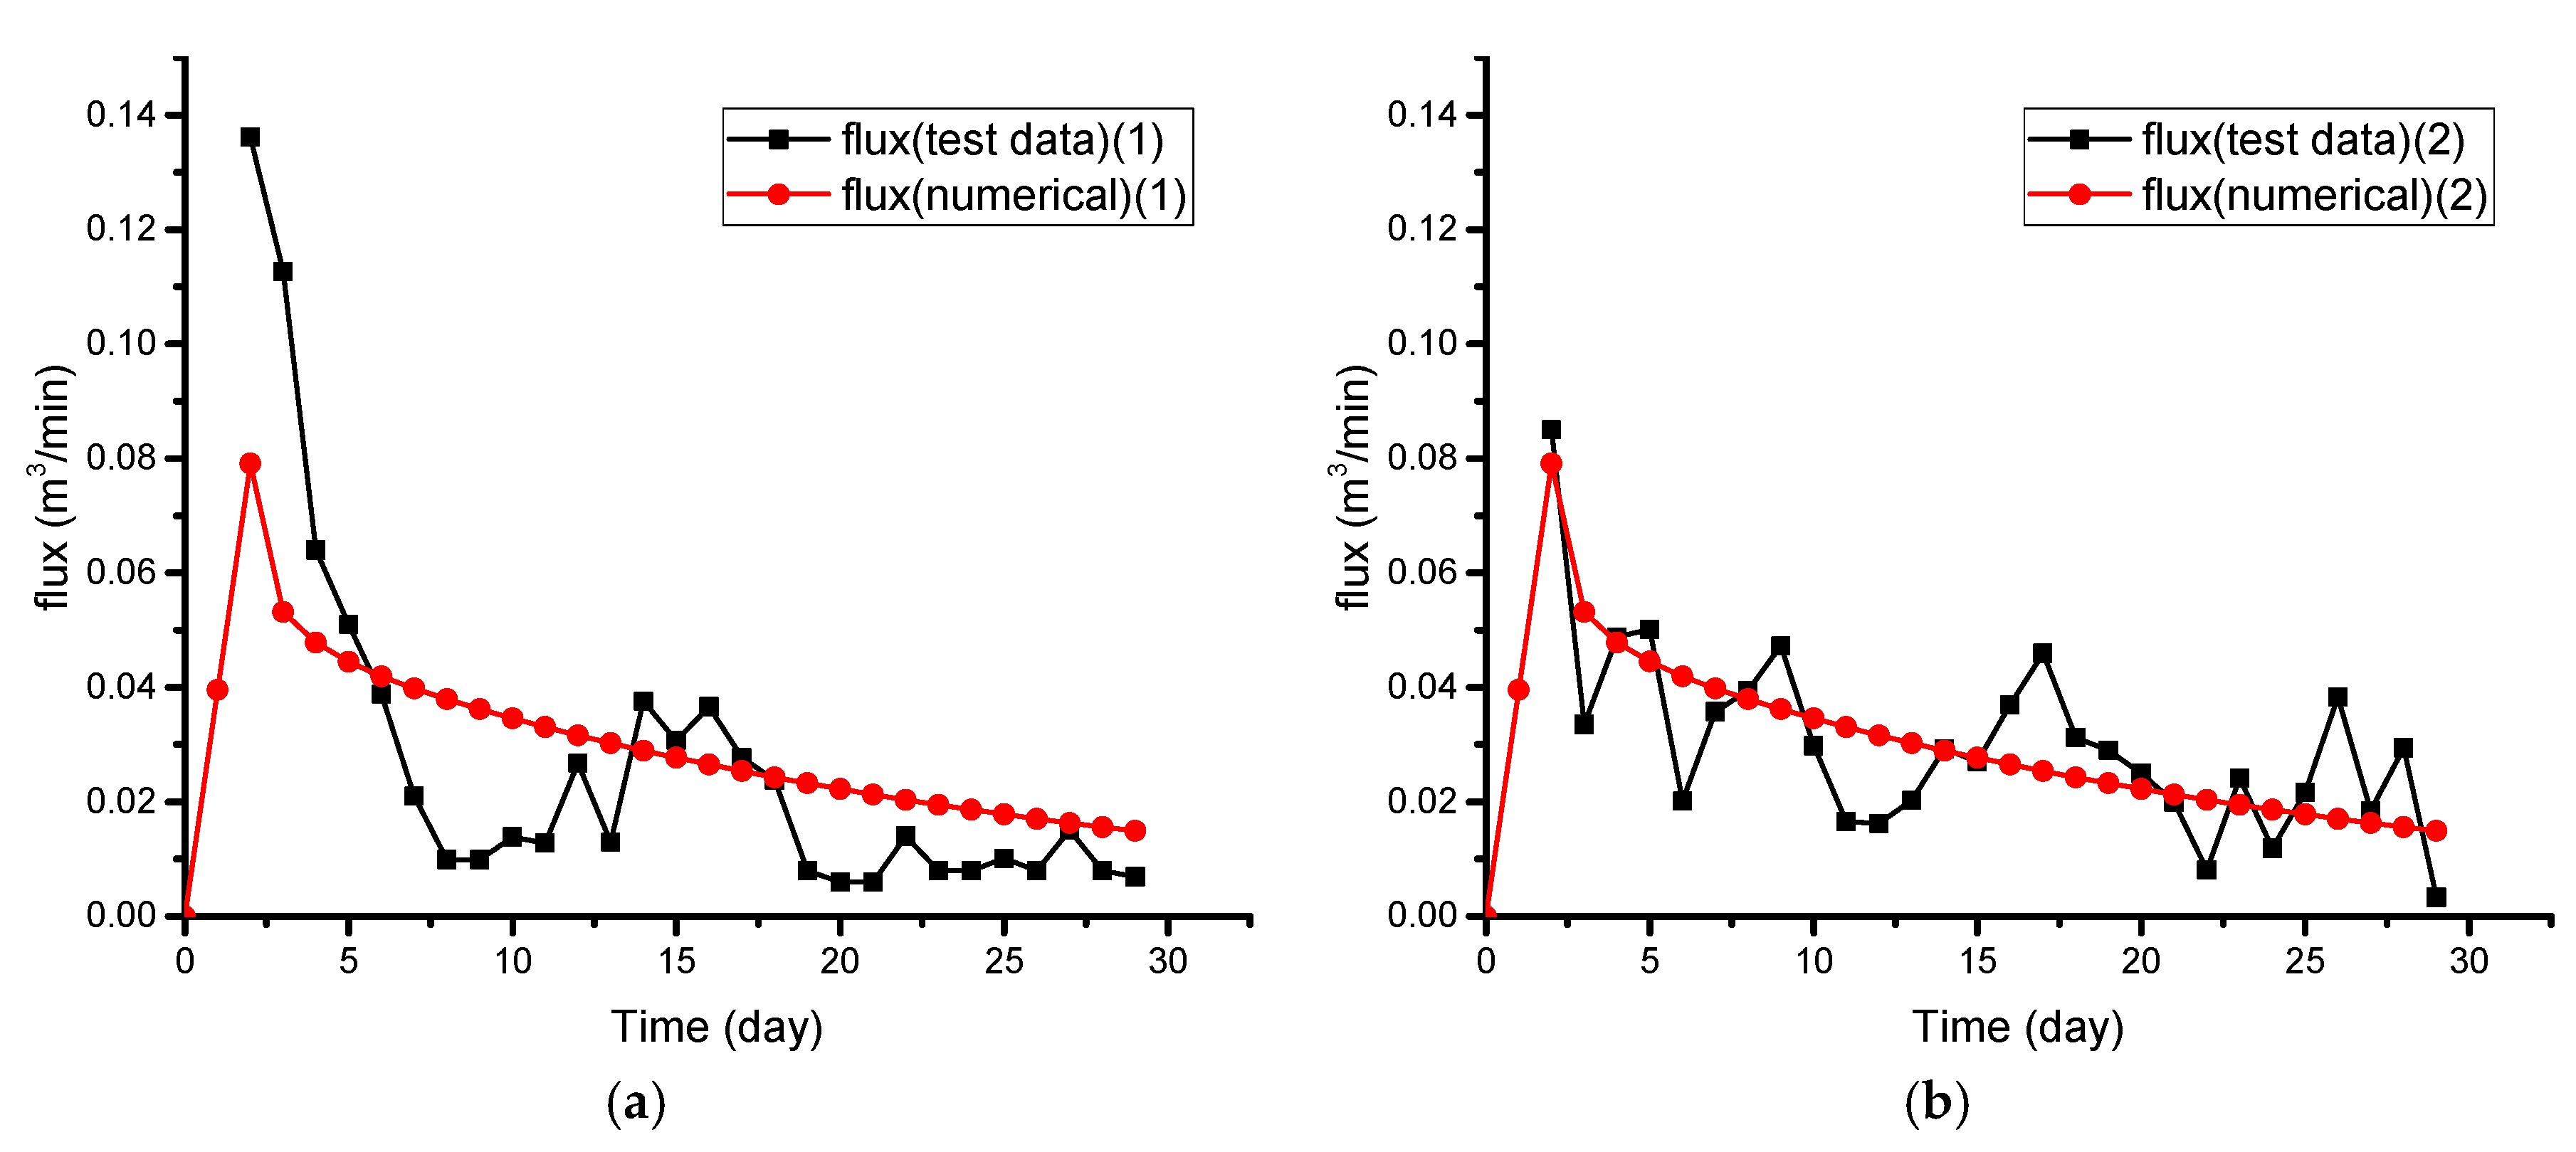
The 27001 longwall panel is located at the upper part of the west wing in the No. 27 mining area. The II1 coal seam in the No. 27 mining area presents high gas content and is therefore prone to outburst. The 27001 longwall panel is 747 m long in the strike direction and 171 m long in the dip direction, presenting an elevation of −128 m to −90 m. The coal seam has a thickness of 1.3 to 6.3 m (3 m on average) and a dip angle of 6 to 17°. The gas content, gas pressure, gas permeability coefficient, sturdiness coefficient, and water saturation are 13.26 to 36.65 m3/t, 1.2 MPa, 1.09 m2/MPa2·d, 0.5, and 0.4, respectively. Owing to variations in gas flow with time, data were collected from only one borehole on site; the corresponding geometrical model was established according to the gas drainage from boreholes in the longwall panel, as shown in Figure 2a. In the model, the coal seam is 178 m wide, 90 m long in the strike direction, and 3 m thick with a dip angle of 6°. The ground surfaces to the left- and right-hand sides are 1 m and 19 m from the coal seam, respectively. The two boreholes where data were collected are vertical to the coal seam, and the geometrical model is basically consistent with the coal seam in the field. After hiding the rock strata, the gas drainage from the borehole was computed. The geometrical models and boundary conditions of the coal seam and the borehole are shown in Figure 2b, and the salient parameters are listed in Table 1. Freely generated tetrahedra were used for mesh generation, then the simulated data were compared with data obtained in the field. As illustrated in Figure 3, due to the anisotropy of the coal seam in the field, engineering factors affecting the accuracy of borehole drilling, and instrumentation, or other experimental errors in the data collected, the simulated data do not completely coincide with the field data. They do, however, have consistent trends, thus validating the correctness of the established model. To eliminate the outburst risk after about 180 days of gas drainage, COMSOL software was used for numerical simulation and optimization of the borehole layout. The PDE (partial differential equations) equation is:
We implemented a gas–solid–liquid coupling model into solid mechanics and PDE modules of COMSOL to obtain numerical solutions via the discrete and finite-element methods.
4. Numerical Simulation Analysis of the Optimization of Gas Drainage Boreholes
It is stipulated in the Provisions on Prevention and Control of Coal and Gas Outbursts of China that regional outburst elimination shall be conducted in outburst-prone coal seams. Moreover, it is regulated in Article 53 that predrained regions, where the residual gas pressure is less than 0.74 MPa or the residual gas content is lower than 8 m3/t, are regarded as areas free from risk of outburst. To achieve the aim of regional outburst elimination, the prevention measure of gas drainage from boreholes in floor roadways passing through coal seams is mainly used. Borehole spacing and layout influence borehole drainage efficiency, so determining the key borehole parameters is a way to improve the efficiency of gas drainage. The spacing of boreholes for gas drainage in many coal mines in China is determined by empirical estimation, and the parameter design lacks a theoretical basis. If the borehole spacing is too large, the number of boreholes is too low, thereby leading to unsatisfactory gas drainage; if the borehole spacing is too small, too many boreholes are needed, thus causing a waste of manpower and material resources. Therefore, rationally selecting the layout parameters of gas predrainage boreholes is important. The results of this numerical simulation are used to optimize and analyze the layout of the boreholes.
4.1. Optimization of Gas Drainage Boreholes When the Mutual Influences of Gas Drainage Boreholes Are Not Considered
With regard to when the mutual influences of gas drainage boreholes are not considered, suppose that the effective drainage range of a borehole is a sphere whose radius is the effective drainage radius r. Then we need to determine the borehole spacing so that no blanking zone appears in a given borehole layout and the boreholes are not too closely packed, leading to waste. When the boreholes are arranged in such a pattern that lines connecting their centers form a rectangle (Figure 4a), the spacing between two adjacent boreholes is 2r. It can be seen that large areas exist between boreholes where the outburst risk is not eliminated. If the borehole spacing is reduced to eliminate those areas still at risk of an outburst (Figure 4b), three boreholes can be connected to form an isosceles right triangle with a hypotenuse of 2r and right-angle side of r; that is, the spacing between adjacent boreholes is r. In the case that the boreholes are arranged to form a rhombus (Figure 4c), an equilateral triangle can be obtained by connecting three adjacent boreholes; when connecting three boreholes (A, B, and C) with the intersection point (O) of the circles formed by the effective gas drainage radii of the three boreholes, the length of the connecting lines is the effective gas drainage radius r. The triangle formed by two radii and the line between two boreholes is isosceles. Then, a vertical line is drawn from the intersection point O to the other side of the triangle; that is, the median or the angular bisector of the isosceles triangle. In the isosceles triangle ABO, the angle BAO is 30°. Since AO is r, AD is in right triangle ADO and AB is r. In other words, the spacing between adjacent boreholes is r. Therefore, when the mutual influences of boreholes during gas drainage are not considered, on the premise that all areas with outburst risk are eliminated in the borehole range, r is the optimal borehole spacing.
4.2. The Effective Drainage Radius and Influence Radius of a Single Borehole
It is stipulated in the Coal Mine Safety Regulations and the Provisions for the Prevention and Control of Coal and Gas Outbursts that the standard for determining the influence radius and effective gas drainage radius of boreholes is the gas extraction rate reaching 10% and 30%, respectively. Suppose that the initial and residual gas contents are X and XC, respectively: when , that is, the gas extraction rate reaches 10%, it can be found that by using the relationship between the gas content and gas pressure in coal seams proposed by Zhou Shining [46]. After dividing the two sides of by and squaring both sides, it can be found that . This indicates that when the residual gas pressure is less than 0.81 times the initial gas pressure, the radius of the area covered is the influence radius of gas drainage boreholes. As for the effective gas drainage radius, the radius of the area where the residual gas pressure is less than 0.74 MPa is calculated according to the Provisions for the Prevention and Control of Coal and Gas Outbursts.
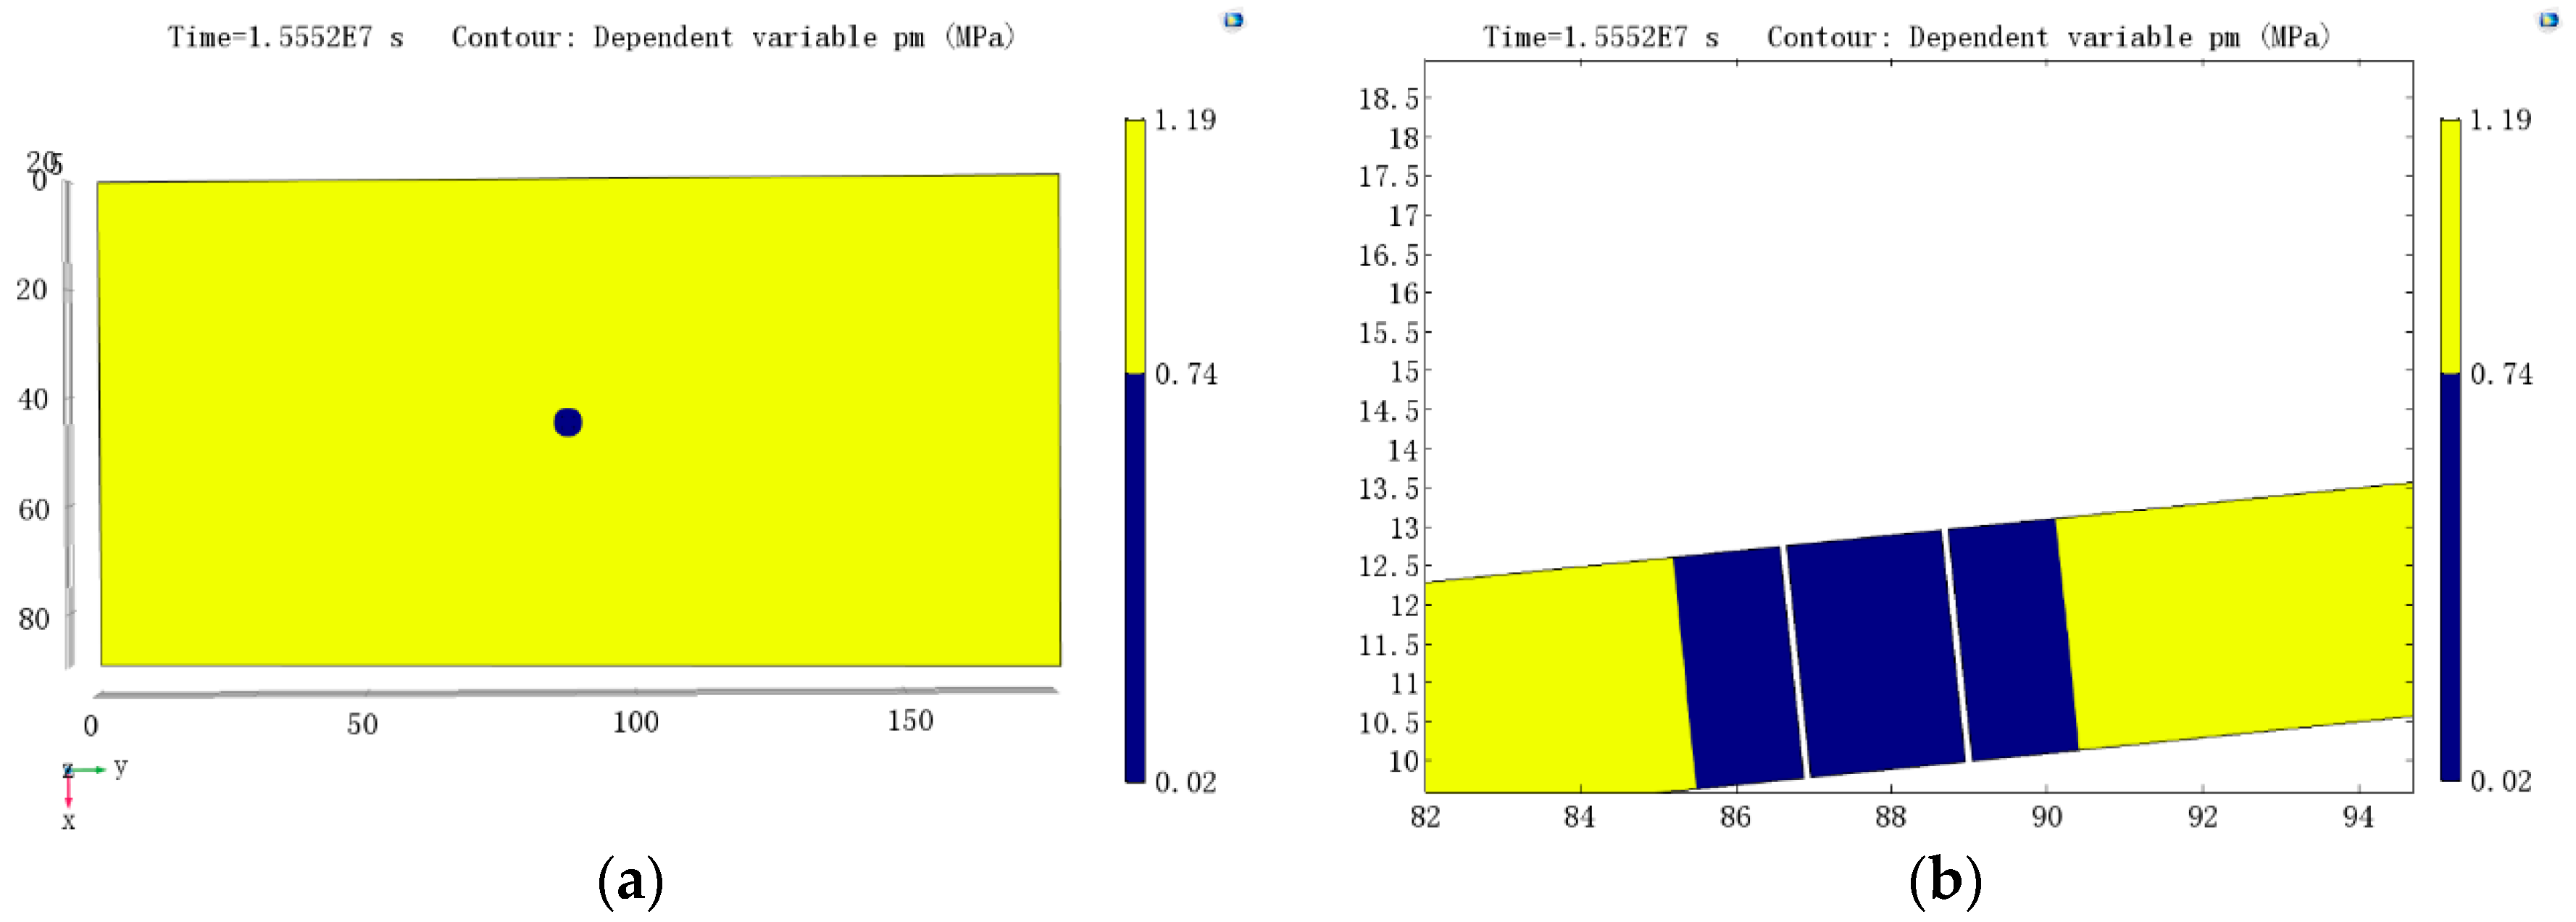
By incorporating the established coupling model in COMSOL, the influence radius and the effective radius of a single borehole (vertical to the coal reservoir) after undergoing gas drainage for half a year were calculated, and the results are shown in Figure 5. The figure illustrates the isobaric surface on the inclined plane of the coal reservoir at the borehole bottom. The area inside the circle of the 0.97 MPa contour with the borehole at the center is the area influenced by the gas drainage, and its radius is the influence radius thereof. Taking the 0.74 MPa contour as the circle, the area inside is the effective gas drainage range and its radius is the effective gas drainage radius. With the 0.97 MPa and 0.74 MPa contours as dividing lines, the isobaric surface of the inclined plane forms rings with the borehole at its center. In the figure, the blue area is the effective influence range and the yellow area is the influence range. Figure 5b shows the isobaric surface on the tangent plane passing the borehole at X = 45 m. By enlarging the figure to read the scale, it can be seen that the effective gas drainage radius and the influence radius of boreholes are 1.2 and 5 m, respectively. However, gas drainage is conducted in multiple boreholes in practical conditions, so the mutual influence of boreholes cannot be ignored. As early as 1998, Zhang et al. studied the superposition and interaction of multiple boreholes in oil reservoirs. They believed that the pressure drop at a point is the combined effect of drilling boreholes surrounding the point.
4.3. The Mutual Influence of Gas Drainage Boreholes
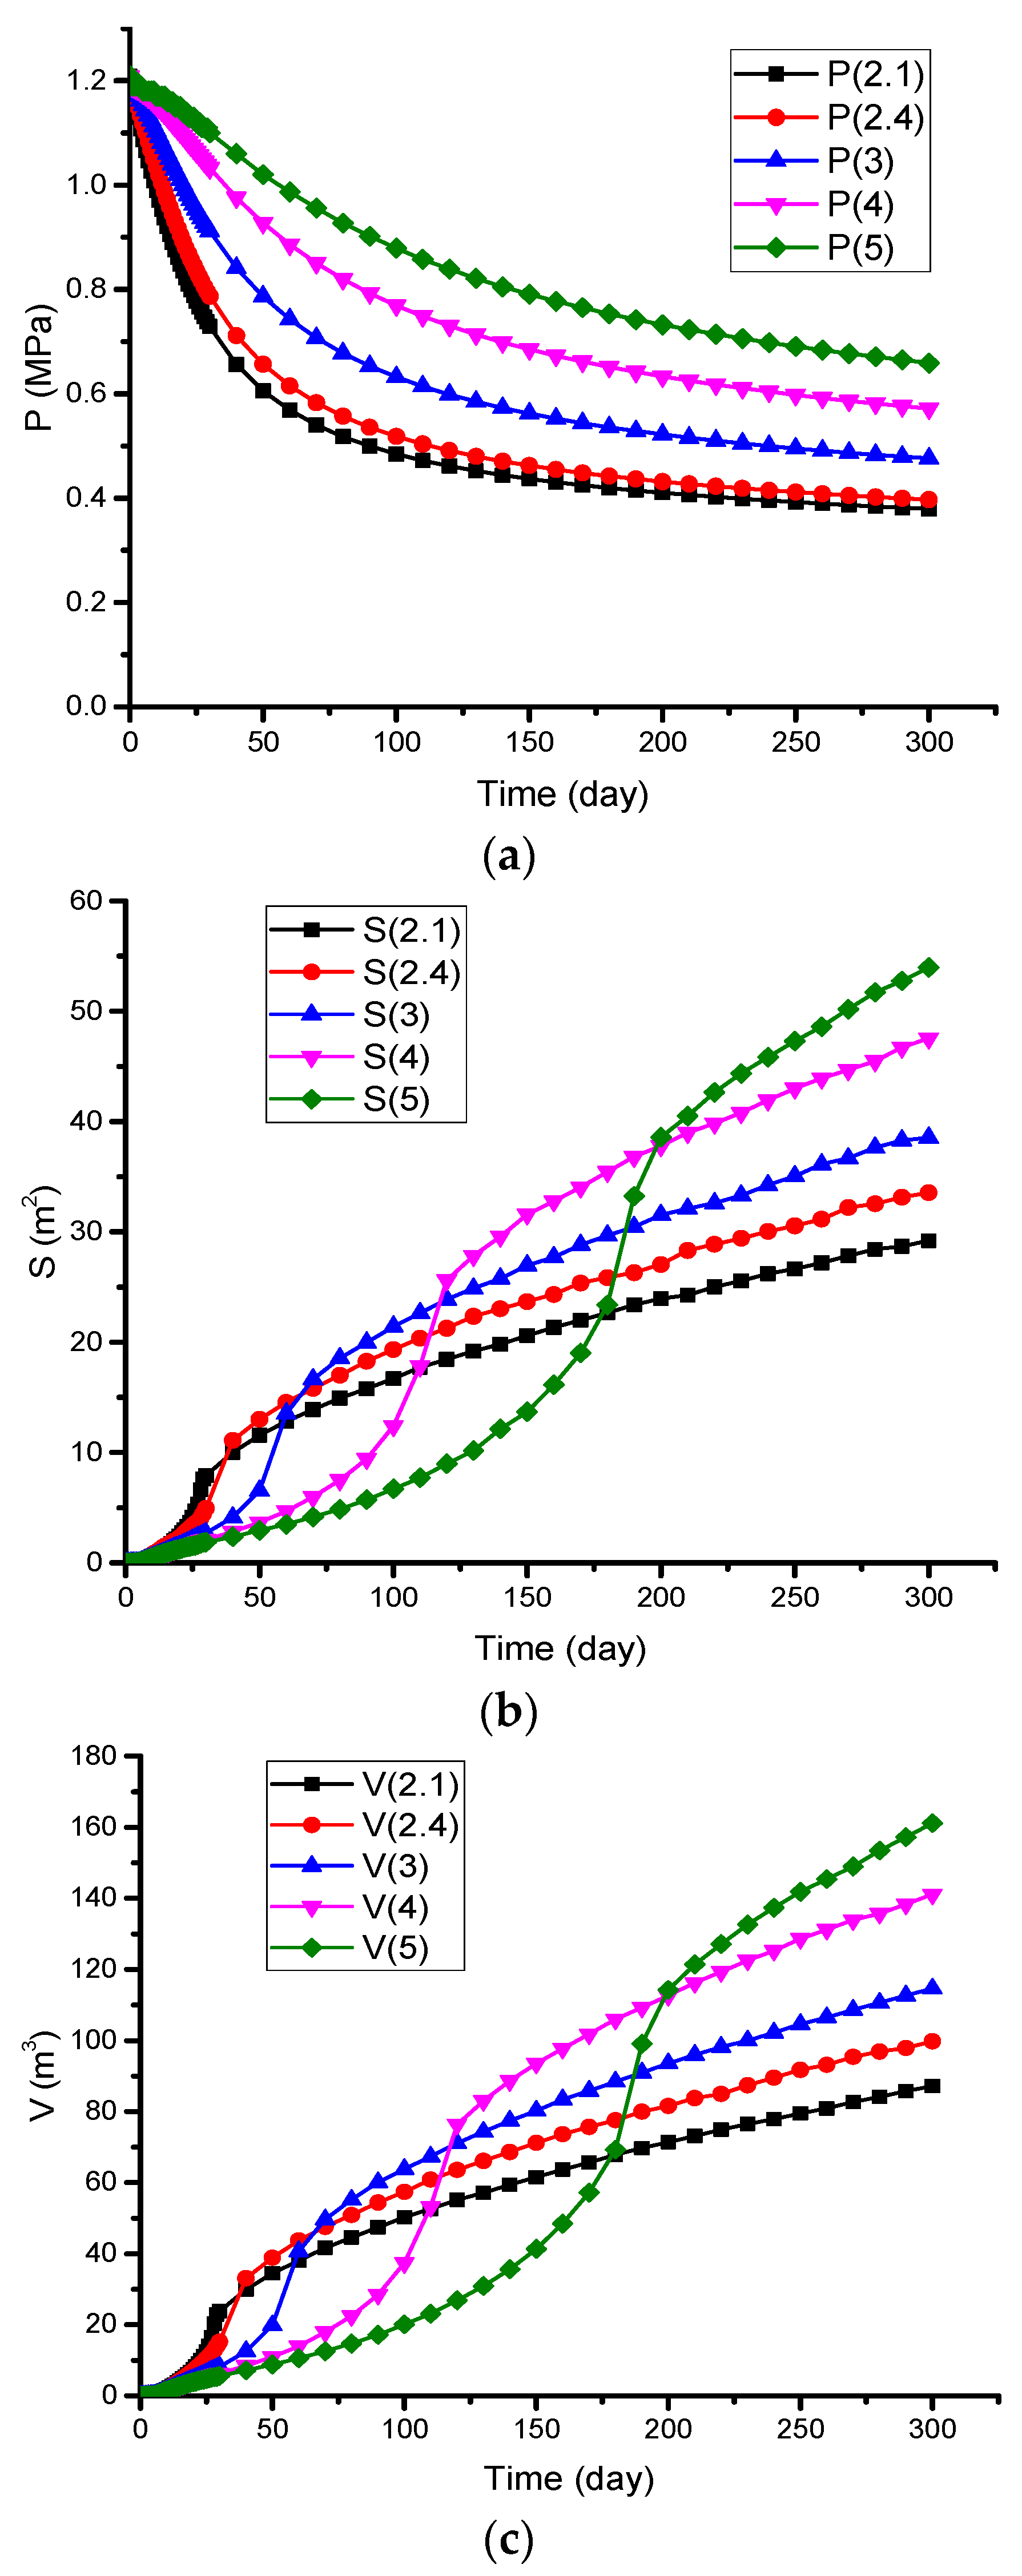
Four boreholes vertical to the coal seam were set in a square shape, with borehole spacings R = 2.1, 2R = 2.4, 3, 4, and 5 m, and a point P was set at the center of the four boreholes. The change in gas pressure at P for different borehole spacings during gas drainage is shown in Figure 6a. When the spacing was 2.1 m, the gas pressure at P declined to 0.4 MPa after approximately 50 days under the influence of the negative pressure due to gas drainage from the four boreholes. The larger the borehole spacing, the slower the decline of the gas pressure at P. For different values of borehole spacing, the gas pressure at P decreased quickly in the first 50 days, and at a slower rate thereafter.
The outburst elimination areas on the inclined plane of the borehole bottom and the calculated outburst elimination volumes in the coal reservoir for different borehole spacings are shown in Figure 6b,c: the larger the borehole spacing, the smaller the outburst elimination area in the first 25 days of gas drainage. After about 30 days, the outburst elimination area caused by gas drainage from boreholes at a spacing of 2.4 m began to exceed that formed by gas drainage from boreholes at a spacing of 2.1 m. After approximately 60 days, the outburst elimination area due to gas drainage from boreholes at a spacing of 3 m began to exceed that generated by gas drainage from boreholes at a spacing of 2.4 m. The outburst elimination area formed by gas drainage from boreholes at a spacing of 4 m started to exceed that formed by gas drainage from boreholes at a spacing of 3 m after 110 days. After about 200 days, the outburst elimination area generated by gas drainage from boreholes at a spacing of 5 m began to exceed that formed by gas drainage from boreholes at a spacing of 4 m.
In the initial stages of gas drainage, the influence radius was small, so the boreholes had a little mutual influence when the borehole spacing was large. The gas pressure drop was mainly caused by negative pressure in the nearest borehole and the pressure gradient across the coal reservoir, so there was a small outburst elimination area. With smaller borehole spacing, the gas in the coal reservoir migrated to the borehole and was then discharged under the influence of the negative pressure in the nearest borehole and the pressure gradient across the reservoir. The gas was also subjected to the superimposed effect of gas drainage from multiple boreholes, so the area of eliminated outburst risk was relatively large. As the gas drainage time increased, the range of influence of single boreholes increased. Under these conditions, if the boreholes were widely spaced, multiple boreholes had a larger range of influence. The evolution of the curve of outburst elimination area on the inclined plane of borehole bottom for different spacings was consistent with that of the outburst elimination volume in the coal reservoir.
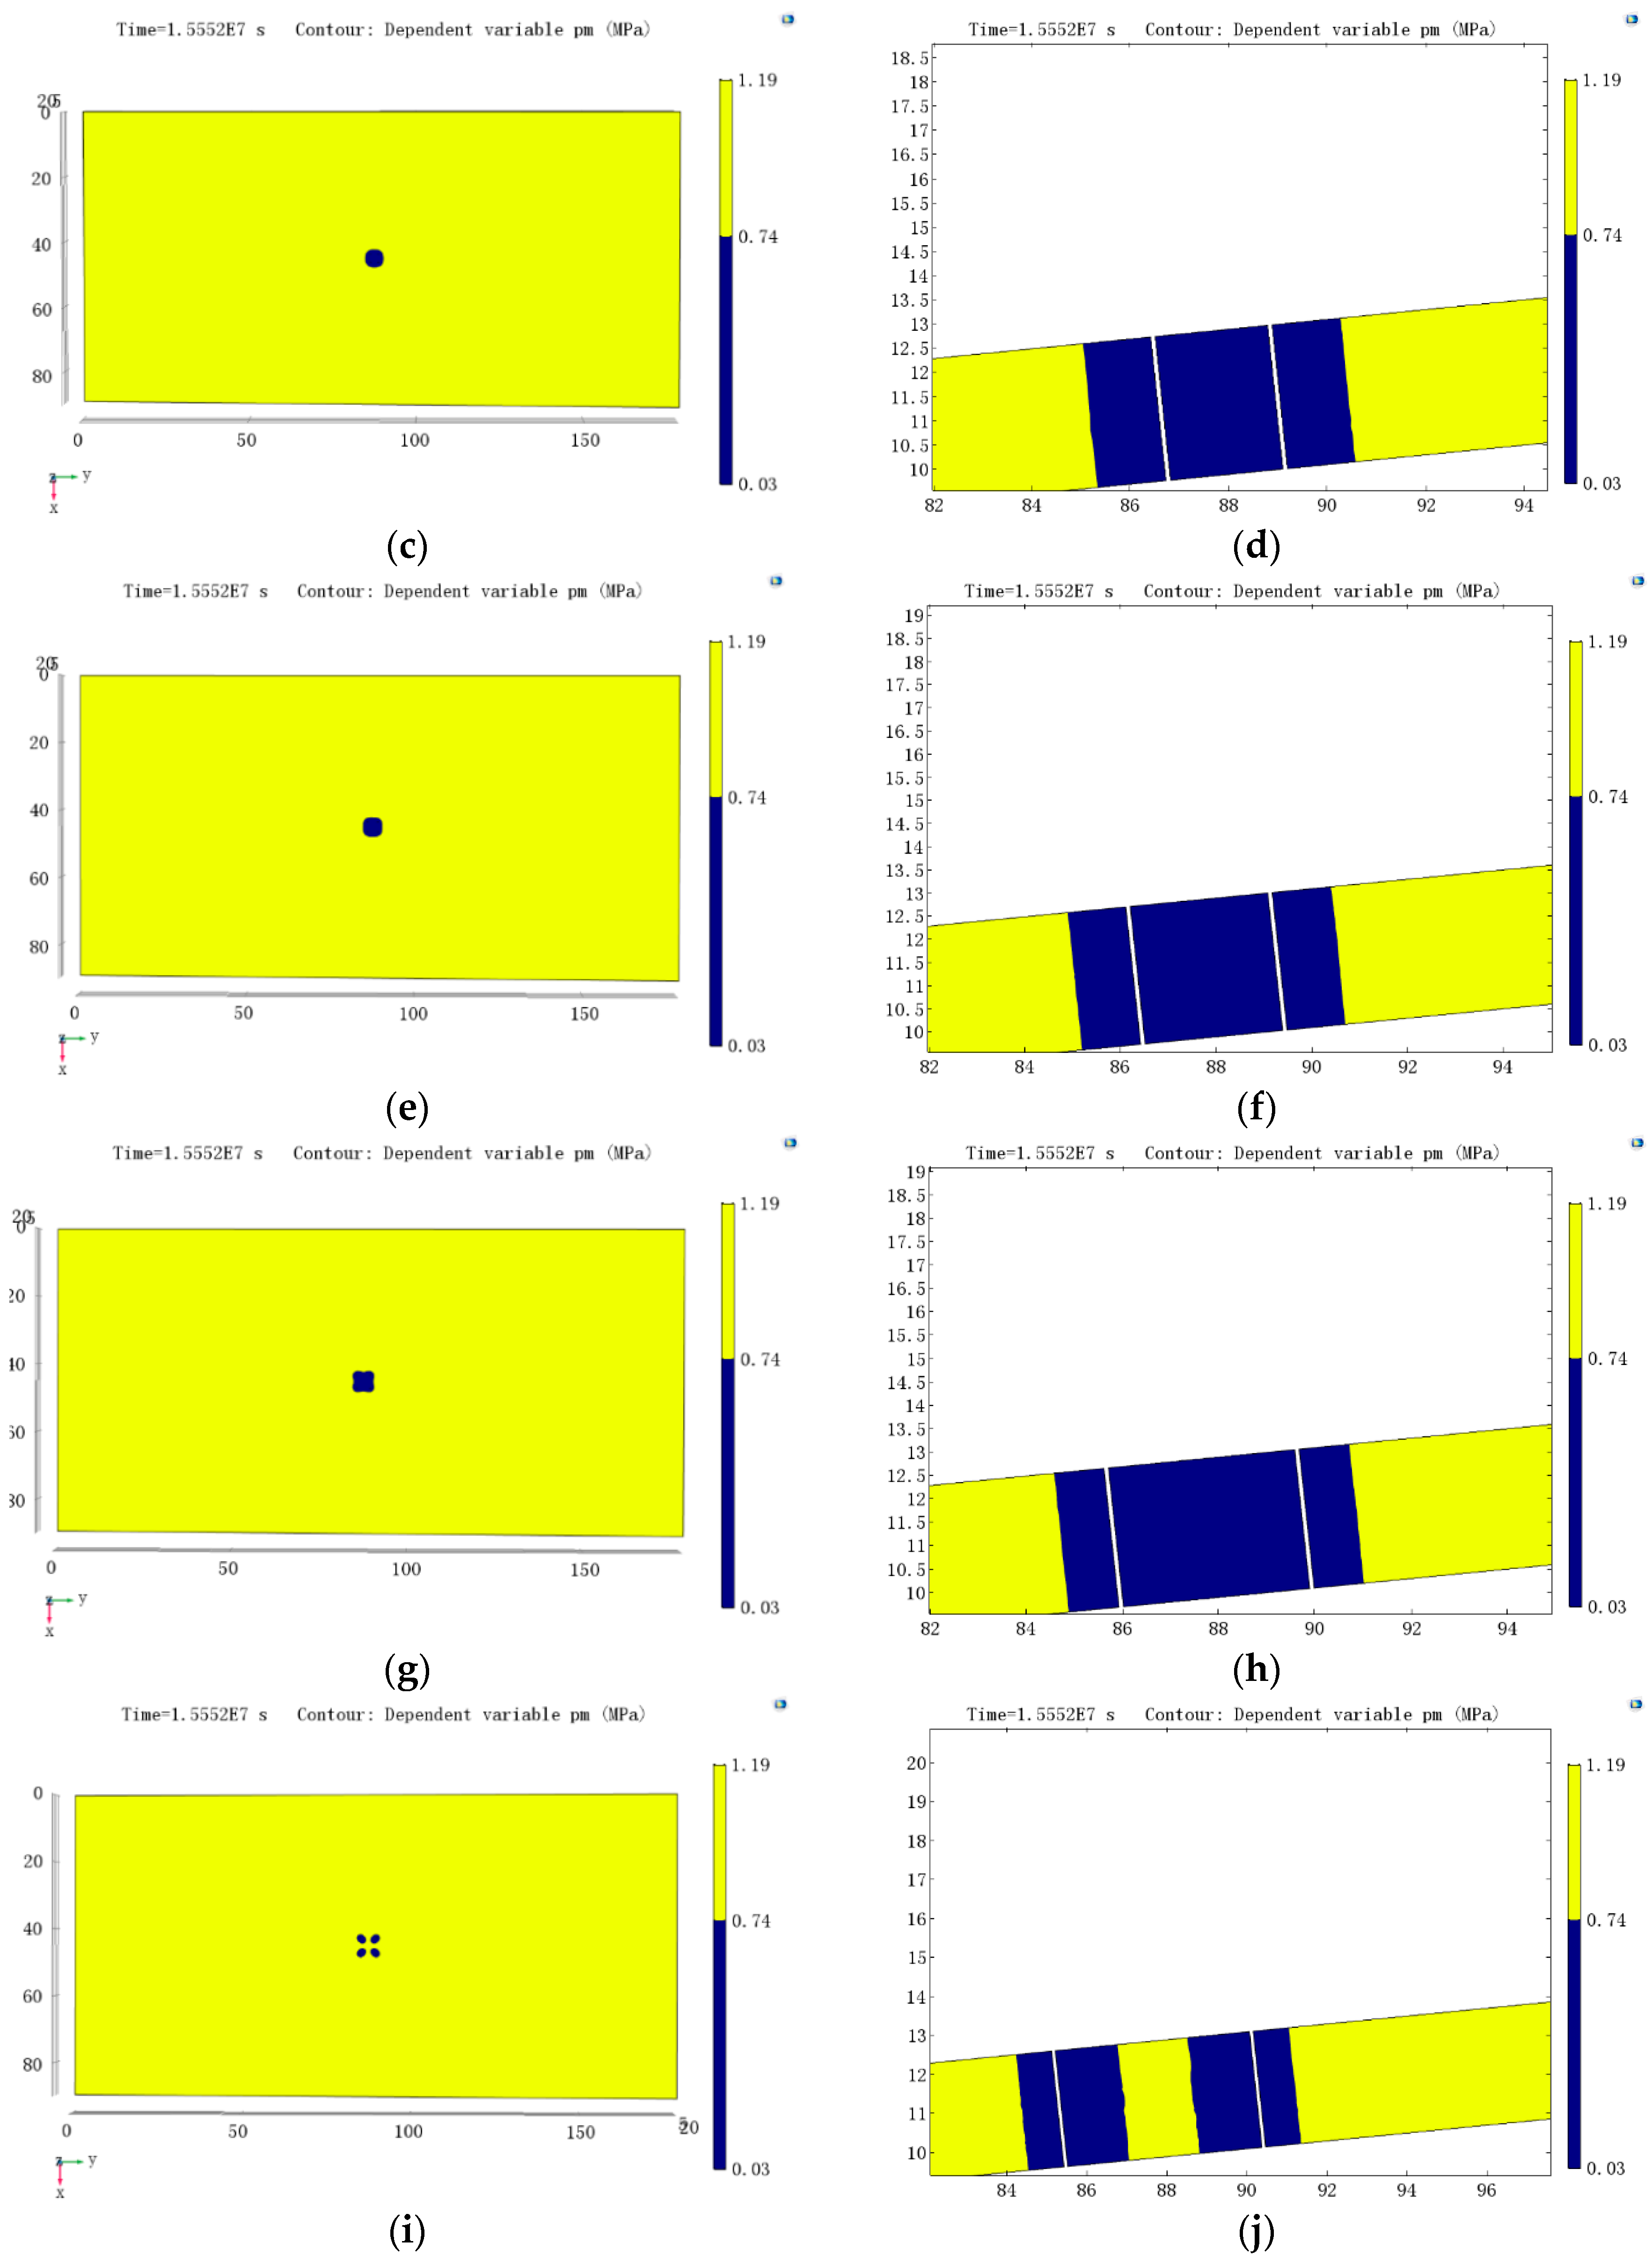
Figure 7 shows the isobar maps when gas was extracted from four boreholes at different spacings during extraction at 180 days. The residual gas pressure as the key parameter was analyzed. Taking 0.74 MPa, which is a critical value, as a dividing pressure, the pressures below 0.74 MPa are shown in blue, and those above 0.74 MPa are shown in yellow. According to the Provisions for the Prevention and Control of Coal and Gas Outbursts, the blue area where the gas pressure was below 0.74 MPa was an outburst elimination area, therefore the blue area represents the outburst elimination area. As can be seen from the isobaric surfaces in the outburst elimination area on the inclined plane of borehole bottom and the tangent plane passing the boreholes in Figure 7, the gas pressure inside the range of the boreholes was below 0.74 MPa after 180 days of gas drainage when the borehole spacing was less than 4 m. For the 180th day of gas drainage, the outburst elimination areas are listed, in descending order, as those formed by gas drainage from four boreholes at spacings of 4 m, 3 m, 2.4 m, and 2.1 m. When the borehole spacing was 5 m, the area in which the gas pressure was greater than 0.74 MPa, that is, there was still a risk of outburst. When the boreholes were set in a square shape, the appropriate borehole spacing was 4 m. If the superimposed effect of boreholes is taken into account, the borehole spacing was in the range of r < L < R, where r is the effective gas drainage radius and R is the influence radius.
4.4. Optimization of Gas Drainage Boreholes When the Mutual Influence of Gas Drainage Boreholes is Considered
The spacing and layout of boreholes in floor roadways passing through coal seams were optimized. Conventionally, boreholes are arranged in rectangular form: as observed in the borehole layouts in Figure 4, the optimal borehole spacing is R or R when the boreholes are arranged in a rectangle or a rhombus without considering the superimposed effect of boreholes or having an area with outburst risk remaining. So the optimal spacing of boreholes arranged in a rhombus is times that of boreholes set in a rectangle. When the superimposed effect of boreholes is taken into consideration, all outburst risk can be eliminated from the layout range of boreholes arranged in a rectangle with a spacing of less than 4 m. Gas drainage from boreholes arranged with the same spacing in a rhombus can also eliminate outburst risk within the range of that borehole layout. Thereafter, the gas drainage process and outburst elimination area are calculated and compared under conditions whereby boreholes are arranged at a spacing of 5 m in a rectangle or a rhombus.
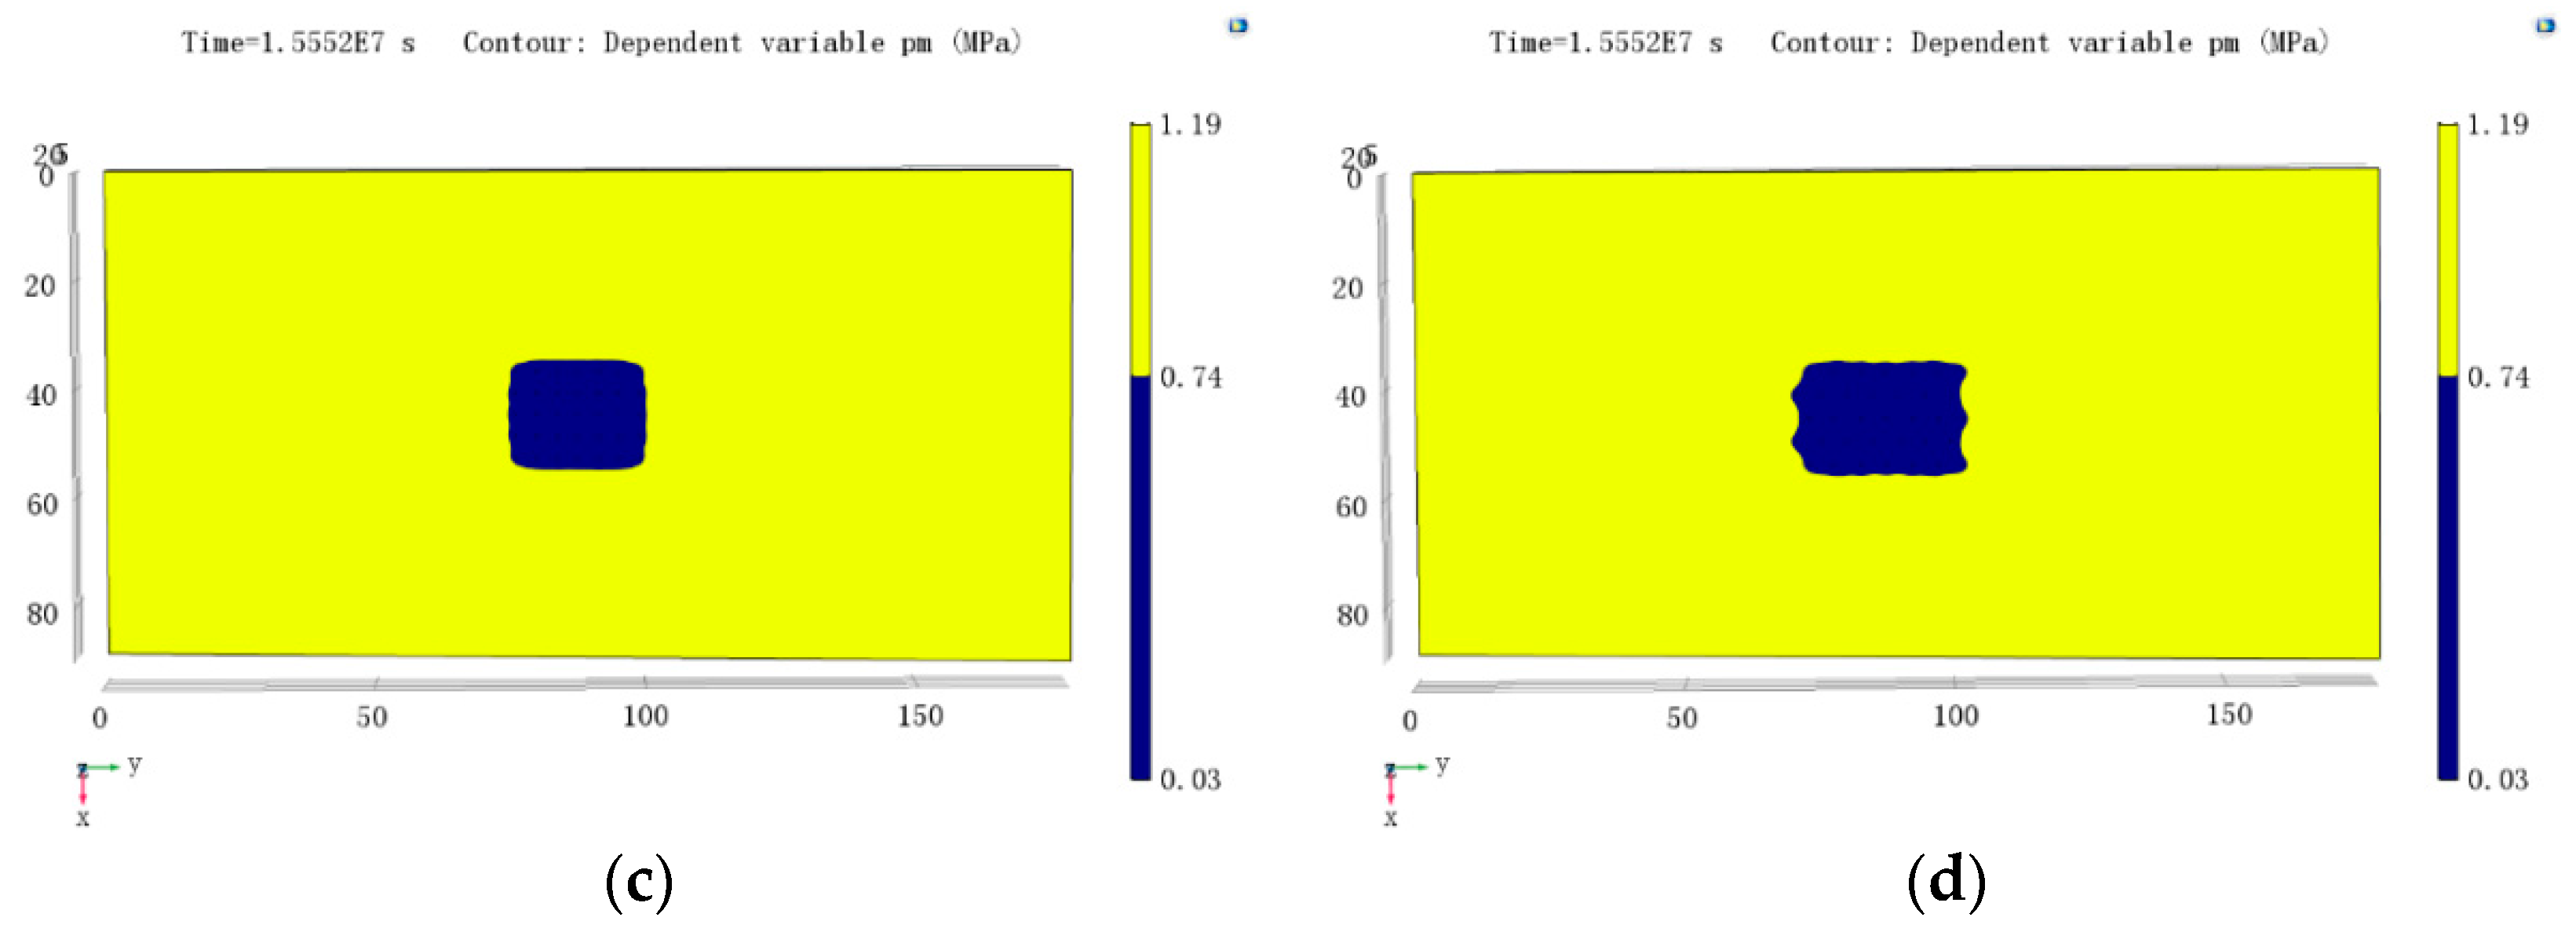
Figure 8 shows the isobaric lines with outburst elimination areas color-filled on the inclined plane of borehole bottom for the two layout modes. In the figure, blue denotes the outburst elimination range and yellow the area where gas pressure is greater than 0.74 MPa. When the four boreholes were set in a rectangle, their mutual influence failed to eliminate the outburst risk in the center of the four boreholes. In contrast, the gas pressure located in the center and farthest from the four boreholes arranged in a rhombus decreased to below 0.74 MPa; that is, the outburst risk in the range could be fully eliminated when multiple boreholes were arranged in a rhombus within a coal reservoir. Therefore, it is optimal to set boreholes in a rhomboidal layout at a spacing of 5 m.
The dip angle of boreholes is calculated according to the spacing of the borehole bottom, the dip angle of the coal seam, and the specific location of the bottom drainage roadway. Seven boreholes were set in a drilling site, and five drilling sites were simulated (giving a total of 35 boreholes). According to the aforementioned optimization results, the first mode involved arranging the 35 boreholes in a rectangular grid at a spacing of 4 m using the conventional layout, and the optimized layout involved setting the 35 boreholes in a rhomboidal configuration at a spacing of 5 m. Figure 9 shows the plan and elevation of the geometrical models for the coal seam and boreholes when the boreholes are arranged in rectangular and rhomboidal configurations.
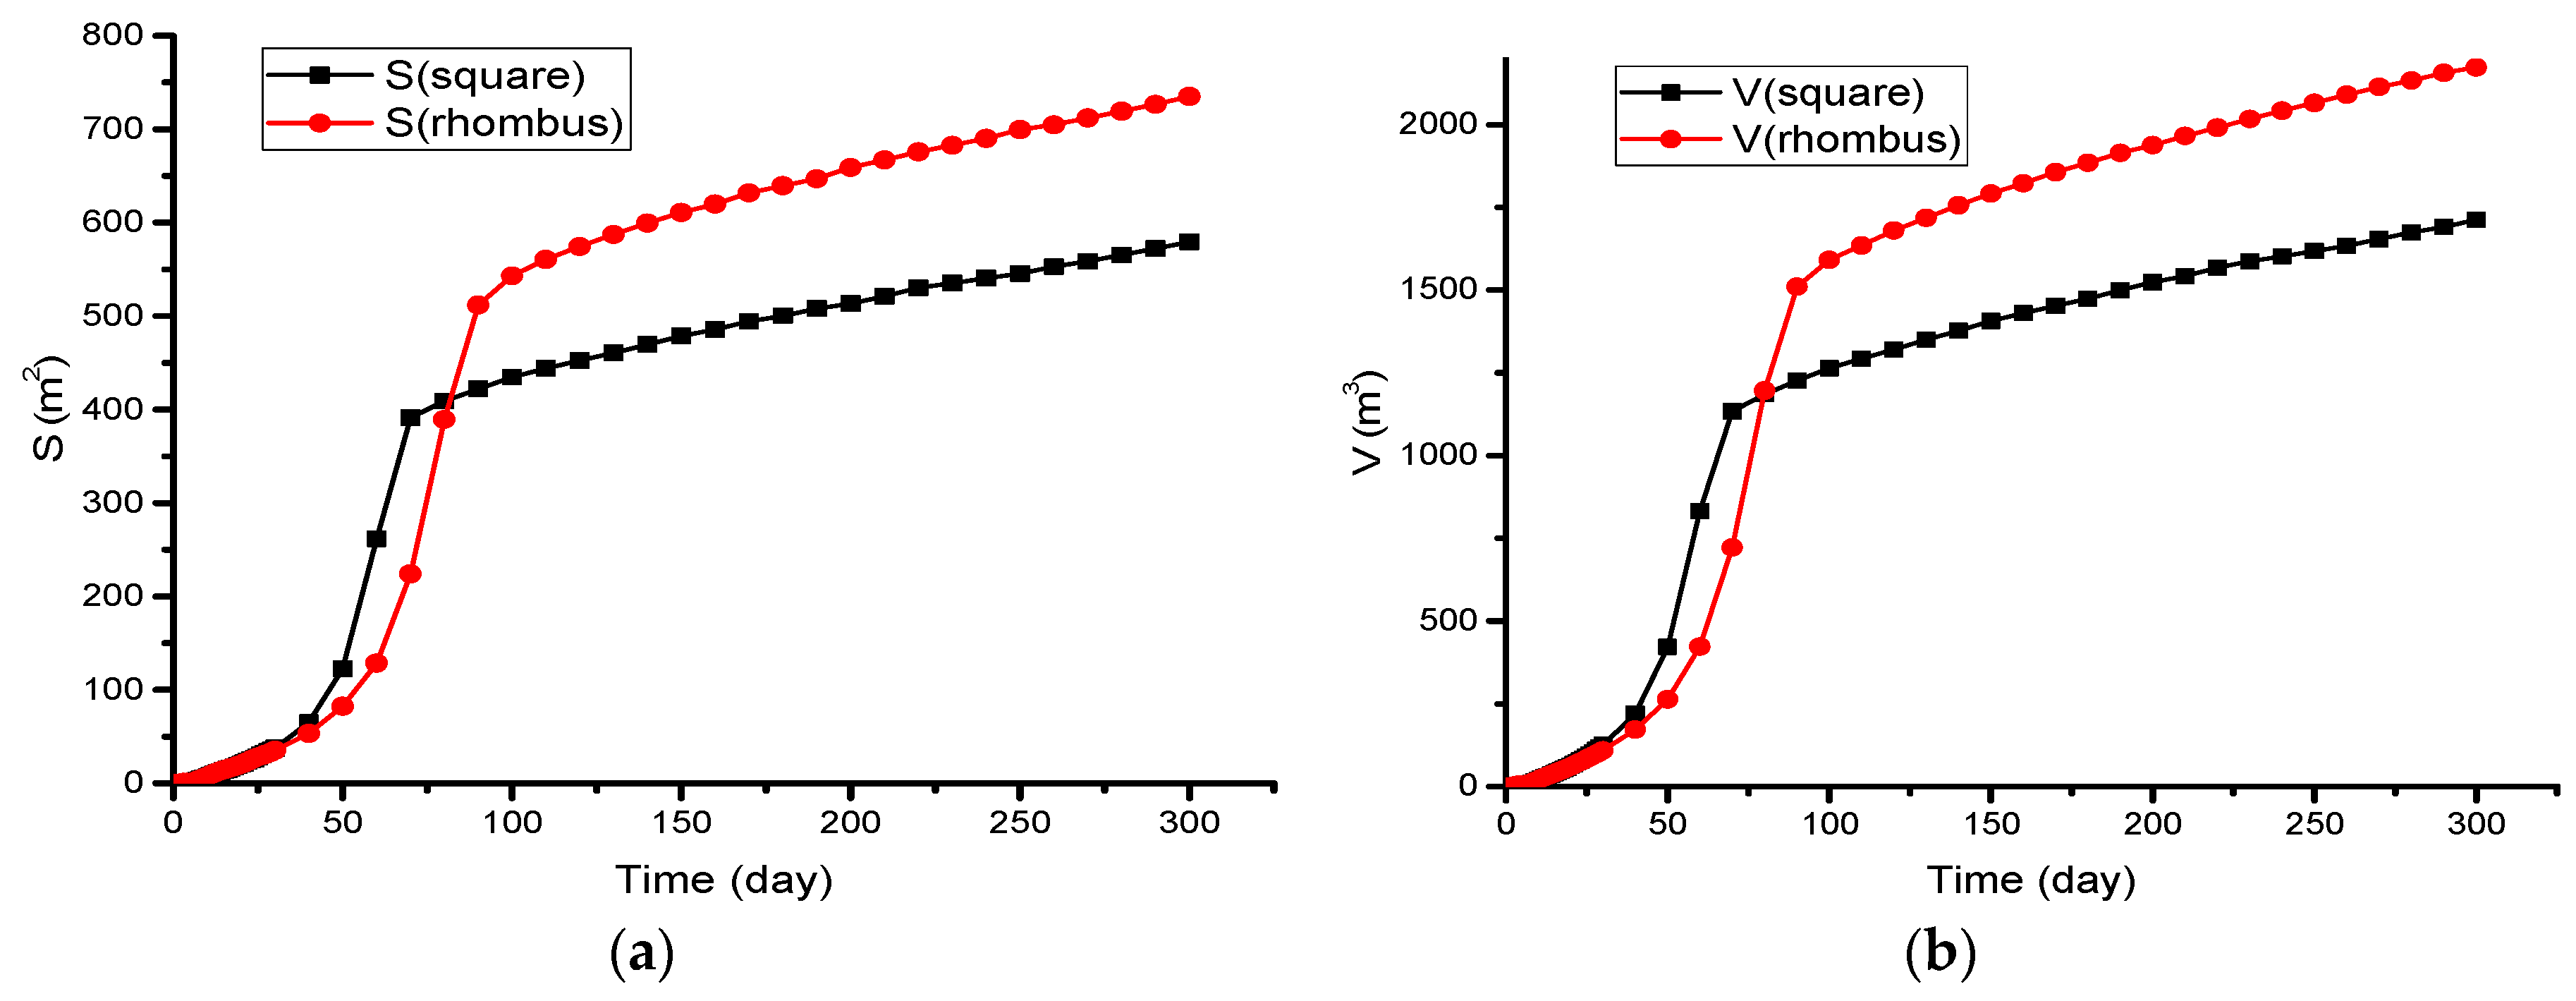
The coal mine expected to realize regional outburst risk elimination within 180 days. The simulation results for these two layouts are displayed in Figure 10, which shows the changes in outburst elimination areas on the inclined plane and in outburst elimination volume, with time before and after optimization. Since the boreholes were arranged in rectangles with small spacing, the outburst elimination area in the coal reservoir formed by gas drainage was slightly larger than that formed by gas drainage from boreholes set in the rhomboidal configuration. However, as the gas drainage time increased, the influence radius of single boreholes also gradually increased. On the 75th day of gas drainage, the outburst elimination area formed by gas drainage from boreholes set in a rhomboidal configuration began to exceed that formed by gas drainage from boreholes arranged in a rectangular configuration. Moreover, this difference increased with time. On the 180th day of gas drainage, the former was significantly larger than the latter. The change curves of the outburst elimination volume in the coal seam are consistent with those of the outburst elimination areas.
Figure 11a,b show the isobaric lines (color-filled) at X = 37 m, where it is nearest to the boundary of boreholes arranged in rectangular and rhomboidal configurations. The blue area also represents the outburst elimination area, and the gas pressure in the yellow area is greater than 0.74 MPa. It can be seen that the outburst elimination area increased after optimizing the borehole layout. Figure 11c,d separately illustrate the isobaric lines (again, color-filled) on the inclined plane of the borehole bottom arranged in rectangular and rhomboidal configurations. Regional outburst elimination was realized after 180 days of gas drainage when the boreholes were arranged on a rectangular grid at a spacing of 4 m and in a rhomboidal configuration at a spacing of 5 m. In comparison, the boreholes arranged in a rhomboidal configuration resulted in a larger outburst elimination area.
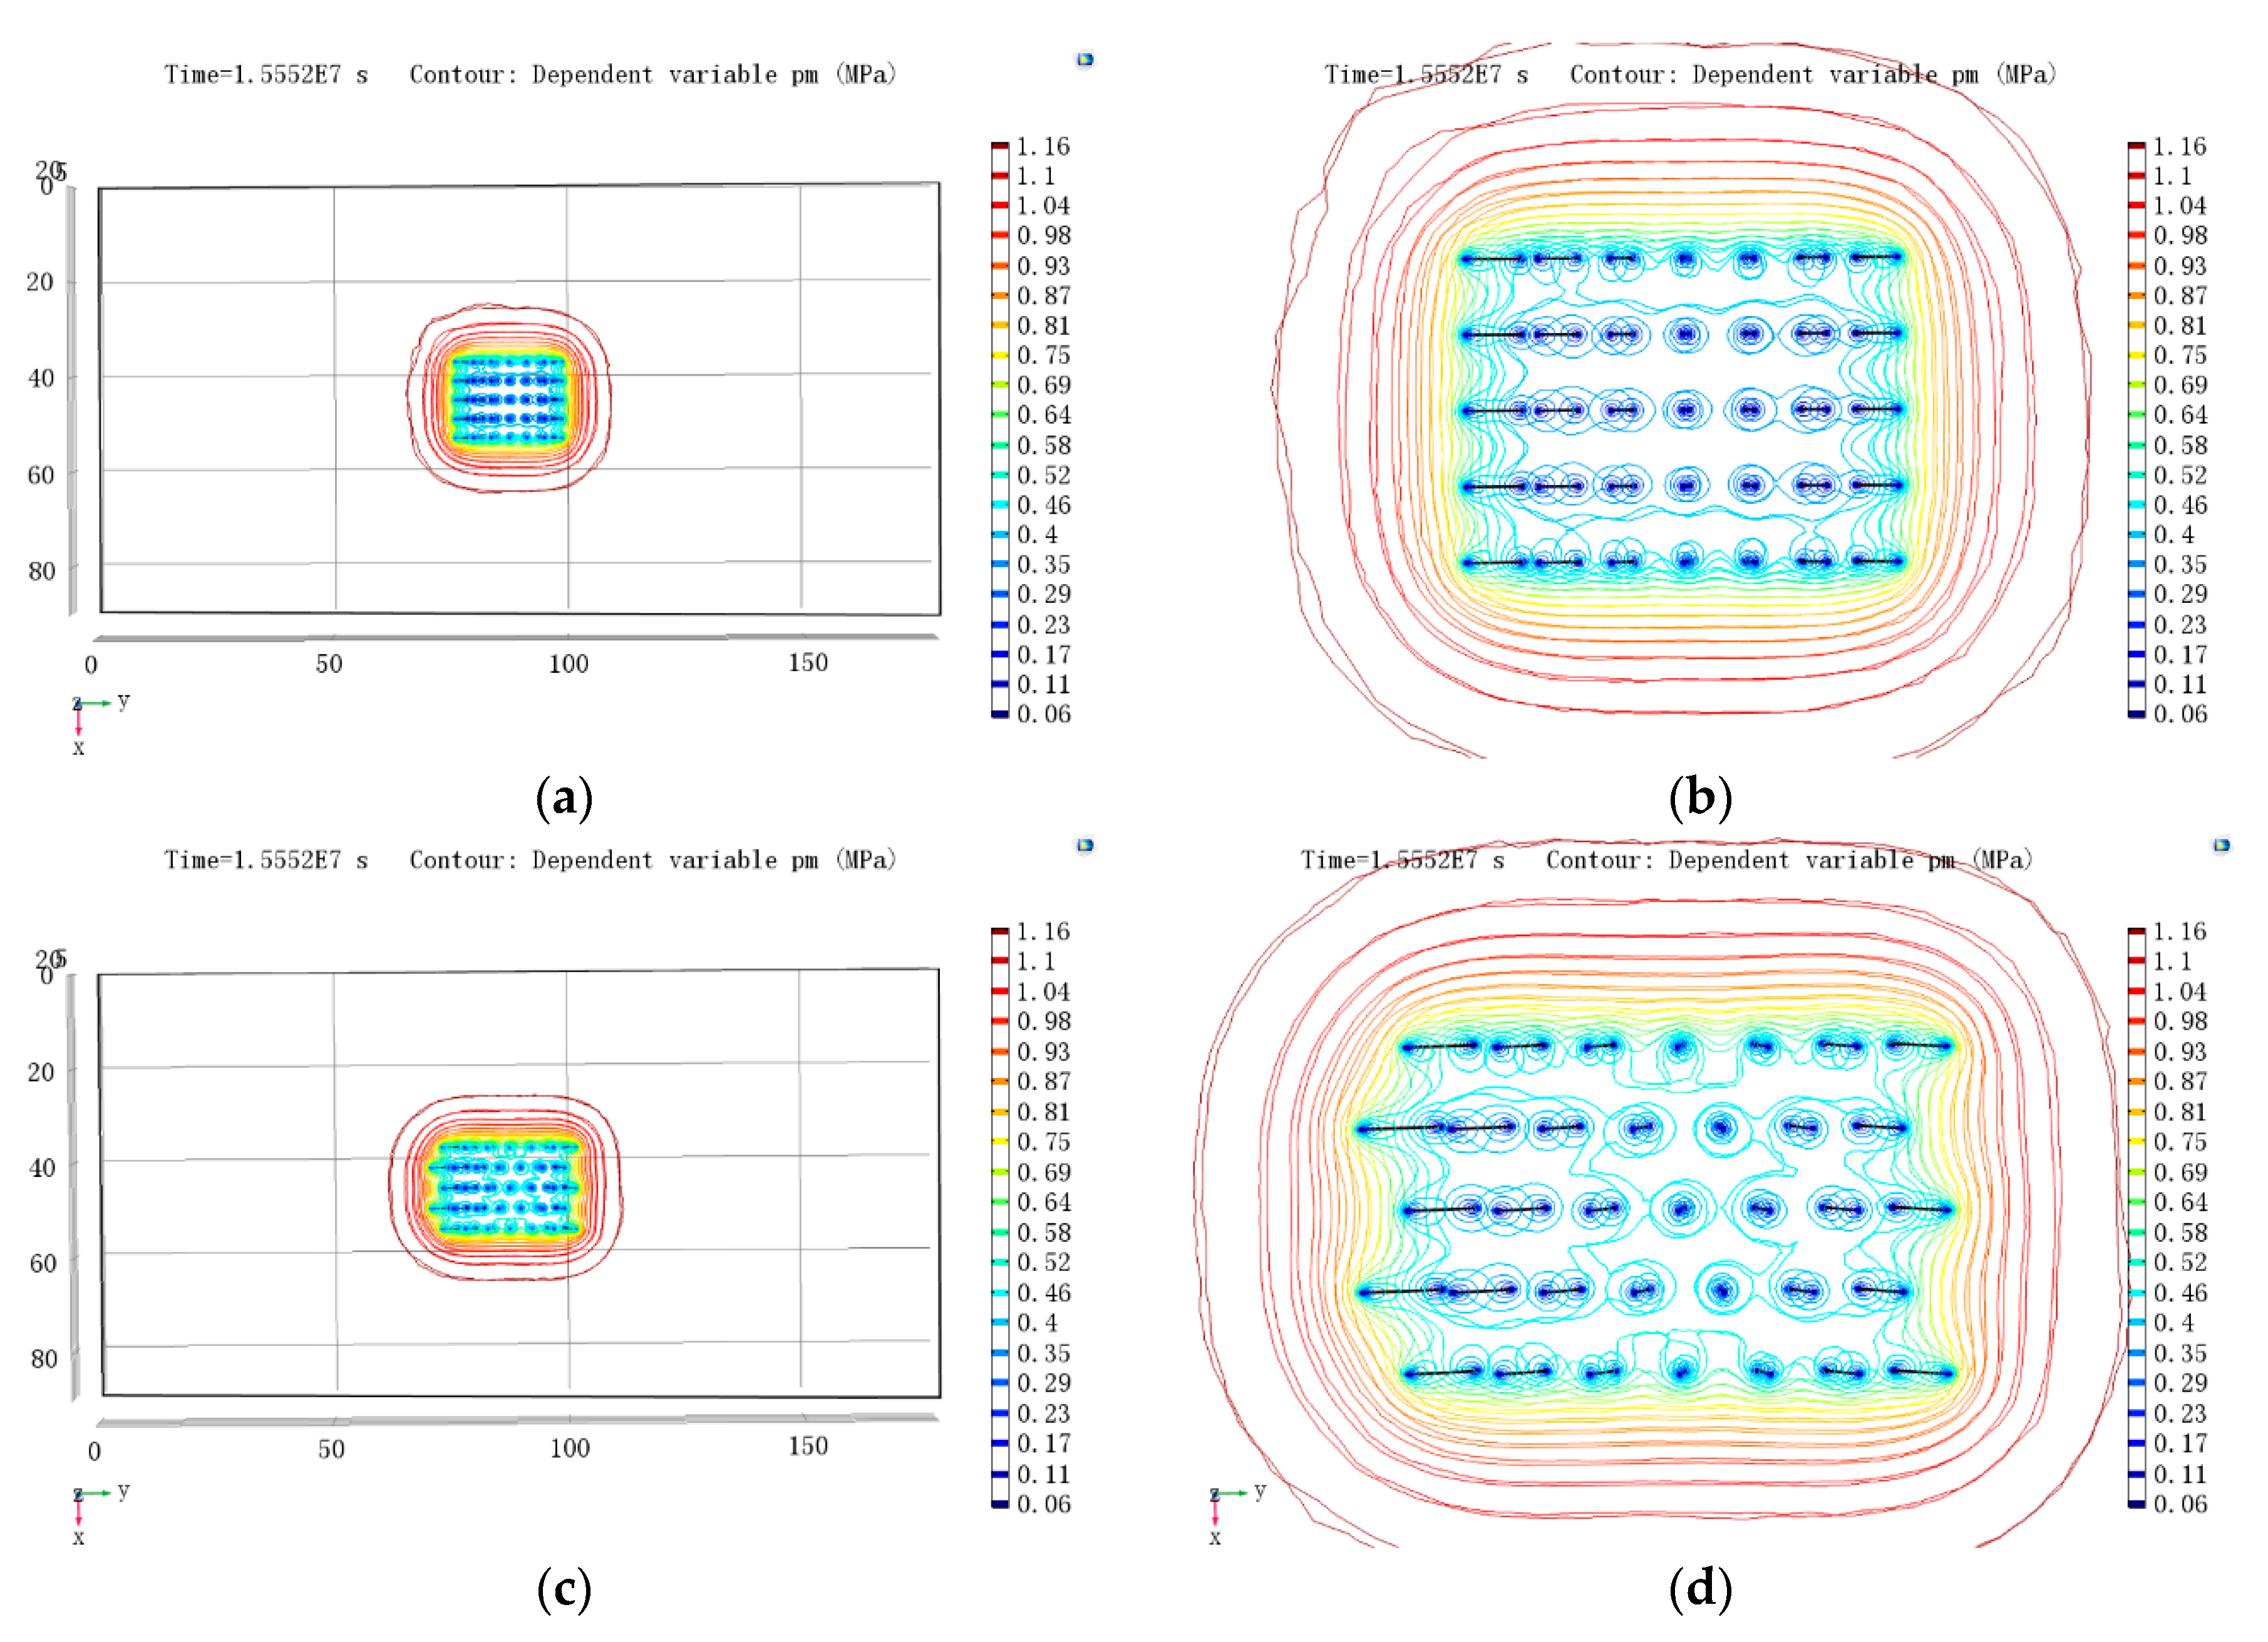
Figure 12 shows the isobaric lines on the inclined plane of borehole bottom before and after optimization; the left-hand figure shows the overall layout, while the right-hand figure shows an enlarged view. It can be seen that the isobaric lines are approximately annular with the boreholes at their center. Under the influence of multiple boreholes, the isobaric lines between boreholes are disturbed and connected. The isobaric lines between boreholes are more complex when the rhomboidal layout is used. The isobaric lines surrounding all boreholes are circles. It can also be observed from the values of the isobaric lines that the areal range with a gas pressure of less than 0.74 MPa was larger after optimization of the layout. This suggests that to realize the same region of outburst risk elimination in this coal reservoir, adopting the optimized borehole layout required fewer boreholes, thus reducing both workload and cost.
5. Conclusions
- A gas–solid–liquid coupling model was established for a coal seam based on elasticity and seepage mechanics, which considered the effective stress, sorption and desorption, and wet strain. In addition, the model was verified to be correct.
- The established model was incorporated in COMSOL to simulate the gas drainage process from boreholes in a coal mine. To achieve the aim of regional outburst risk elimination within 180 days of gas drainage and reduce the number of boreholes as much as possible to save cost, the spacing of boreholes was optimized. Considering the superimposed effect of boreholes, the borehole spacing could be set within r ≤ L ≤ R, where r and R represent the effective gas drainage radius and the influence radius of gas drainage, respectively.
- For gas drainage from boreholes in a floor roadway running upwards and passing through coal seams, when the boreholes were arranged in a rectangular configuration, regional outburst risk elimination could not be realized within 180 days at a borehole spacing of 5 m; however, arranging the boreholes in a rhomboidal configuration under the same conditions resulted in regional outburst risk elimination. Furthermore, the 35 boreholes arranged on a rectangular grid at a spacing of 4 m and those set in a rhomboidal configuration at a spacing of 5 m were simulated and compared. The results indicated that after 180 days of gas drainage, both layouts could realize regional outburst risk elimination; however, using the rhomboidal configuration resulted in greater outburst risk elimination areas on the borehole bottom plane and larger outburst elimination volumes in the coal seam. To achieve the same outburst elimination area, the rhomboidal configuration required fewer boreholes and was thus cheaper. When the corresponding parameters are input into COMSOL Multiphysics software, the method can also be applied for other coal mines.
Acknowledgments
This study was financially supported by the National Science and Technology Major Project (grant no. 2016ZX05044002) and National Natural Science Foundation of China (grant nos. 51474040, 51304255, and 51434003).
Author Contributions
Yuexia Chen, Jiang Xu and Fazhi Yan established the coupling Model, Yuexia Chen, Chaojun Fan simulated the optimization of gas drainage boreholes. Yuexia Chen and Shoujian Peng wrote the paper.
Conflicts of Interest
The authors declare no conflict of interest.
References
- Bao, Q.; Fang, Q.; Zhang, Y.; Chen, L.; Yang, S.; Li, Z. Effects of gas concentration and venting pressure on overpressure transients during vented explosion of methane air mixtures. Fuel 2016, 175, 40–48. [Google Scholar] [CrossRef]
- Skoczylas, N.; Dutka, B.; Sobczyk, J. Mechanical and gaseous properties of coal briquettes in terms of outburst risk. Fuel 2014, 134, 45–52. [Google Scholar] [CrossRef]
- Xie, Z.C.; Zhang, D.M.; Song, Z.L.; Li, M.H.; Liu, C.; Sun, D.L. Optimization of Drilling Layouts Based on Controlled Presplitting Blasting through Strata for Gas Drainage in Coal Roadway Strips. Energies 2017, 10, 1228. [Google Scholar] [CrossRef]
- Yan, F.Z.; Lin, B.Q.; Zhu, C.J.; Shen, C.M.; Zou, Q.L.; Guo, C.; Liu, T. A novel ECBM extraction technology based on the integration of hydraulic slotting and hydraulic fracturing. J. Nat. Gas Sci. Eng. 2015, 22, 571–579. [Google Scholar] [CrossRef]
- Yan, F.Z.; Lin, B.Q.; Zhu, C.J.; Zhou, Y.; Liu, X.; Guo, C.; Zou, Q.L. Experimental investigation on anthracite coal fragmentation by high-voltage electrical pulses in the air condition: Effect of breakdown voltage. Fuel 2016, 183, 583–592. [Google Scholar] [CrossRef]
- Yang, C.; Li, X.; Ren, Y.; Zhao, Y.; Zhu, F. Statistical analysis and countermeasures of gas explosion accident in coal mines. Procedia Eng. 2014, 84, 166–171. [Google Scholar]
- Karacan, C.Ö.; Ruiz, F.A.; Cote, M.; Phipps, S. Coal mine methane: a review of capture and utilization practices with benefits to mining safety and to greenhouse gas reduction. Int. J. Coal Geol. 2011, 86, 121–156. [Google Scholar] [CrossRef]
- Hou, Z.; Xie, H.; Zhou, H.; Were, P.; Kolditz, O. Unconventional gas resources in China. Environ. Earth Sci. 2015, 73, 5785–5789. [Google Scholar] [CrossRef]
- Gensterblum, Y.; Merkel, A.; Busck, A.; Krooss, B.M. High-pressure CH4 and CO2 sorption isotherms as a function of coal maturity and the influence of moisture. Int. J. Coal Geol. 2013, 118, 45–57. [Google Scholar] [CrossRef]
- Joubert, J.I.; Grein, C.T.; Bienstock, D. Sorpion of methane in moist coal. Fuel 1973, 52, 181–185. [Google Scholar] [CrossRef]
- Yee, D.; Seidle, J.P.; Hanson, W.B. Gas sorption on coal and measurement of gas content. AAPG Stud. Geol. 1993, 38, 203–218. [Google Scholar]
- Zhu, W.C.; Wei, C.H.; Liu, J.; Xu, T.; Elsworth, D. Impact of gas adsorption induced coal matrix damage on the evolution of coal permeability. Rock Mech. Rock Eng. 2013, 46, 1353–1366. [Google Scholar] [CrossRef]
- Pan, Z.; Connell, L.D. Modelling of anisotropic coal swelling and its impact on permeability behaviour for primary and enhanced coalbed methane recovery. Int. J. Coal Geol. 2011, 85, 257–267. [Google Scholar] [CrossRef]
- Lu, M.; Connell, L.D. A model for the flow of gas mixtures in adsorption dominated dual porosity reservoirs incorporating multi-component matrix diffusion: Part I. Theoretical development. J. Petrol. Sci. Eng. 2007, 59, 17–26. [Google Scholar] [CrossRef]
- Xue, D.J.; Zhou, H.W.; Chen, C.F.; Jiang, D.Y. A combined method for evaluation and prediction on permeability in coal seams during enhanced methane recovery by pressure-relieved method. Environ. Earth Sci. 2015, 73, 5963–5974. [Google Scholar] [CrossRef]
- Gilman, A.; Beckie, R. Flow of coal-bed methane to a gallery. Transp. Porous Media 2000, 41, 1–16. [Google Scholar] [CrossRef]
- Wang, S.; Elsworth, D.; Liu, J. Permeability evolution in fractured coal: The roles of fracture geometry and water-content. Int. J. Coal Geol. 2011, 87, 13–25. [Google Scholar] [CrossRef]
- Wang, S.; Elsworth, D.; Liu, J. Permeability evolution during progressive deformation of intact coal and implications for instability in underground coal seams. Int. J. Rock Mech. Min. 2013, 58, 34–45. [Google Scholar] [CrossRef]
- Zuber, M.D.; Williamson, J.R.; Hill, D.G.; Sawyer, W.K.; Frantz, J.H. A comprehensive reservoir evaluation of a shale reservoir—The new Albany shale. In Proceedings of the SPE 77469, SPE Annual Technical Conference and Exhibition, San Antonio, TX, USA, 29 September–2 October 2002. [Google Scholar]
- McKee, C.R.; Bumb, A.C.; Koeing, R.A. Stress-dependent Permeability and Porosity of Coal. In Proceedings of the 1987 Coalbed Methane Symposium, University of Alabama, Tuscaloosa, AL, USA, 16–19 November 1987. [Google Scholar]
- Cui, X.; Bustin, R.M. Volumetric strain associated with methane desorption and its impact on coalbed gas production from deep coal seams. AAPG Bull. 2005, 89, 1181–1202. [Google Scholar] [CrossRef]
- Palmer, I.; Mansoori, J. How permeability depends on stress and pore pressure in coalbeds, a new model. In Proceedings of the SPE Annual Technical Conference and Exhibition, Denver, CO, USA, 6–9 October 1996. [Google Scholar]
- Palmer, I.; Mansoori, J. Permeability depends on stress and pore pressure in coalbeds, a new model. SPE Reserv. Eval. Eng. 1998, 1, 539–544. [Google Scholar] [CrossRef]
- Seidle, J.P.; Huitt, L.G. Experimental measurement of coal matrix shrinkage due to gas desorption and implications for cleat permeability increases. In Proceedings of the 1995 SPE International Meeting on Petroleum Engineering, Beijing, China, 14–17 November 1995. Paper SPE 30010. [Google Scholar]
- Wu, Y.; Liu, J.S.; Elsworth, D.; Chen, Z.W.; Connell, L.; Pan, Z.J. Dual poroelastic response of a coal seam to CO2 injection. Int. J. Greenh. Gas Control 2010, 4, 668–678. [Google Scholar] [CrossRef]
- Wu, Y.; Liu, J.; Elsworth, D.; Miao, X.; Mao, X. Development of anisotropic permeability during coal bed methane production. J. Nat. Gas Sci. Eng. 2010, 2, 197–210. [Google Scholar] [CrossRef]
- Robertson, E.P.; Christiansen, R.L. A permeability model for coal and other fractured, sorptive-elastic media. In Proceedings of the 2006 SPE Eastern Regional Meeting, Canton, OH, USA, 11–13 October 2006. Paper SPE 104380. [Google Scholar]
- Wang, K.; Zang, J.; Wang, G.; Zhou, A. Anisotropic permeability evolution of coal with effective stress variation and gas sorption: Model development and analysis. Int. J. Coal Geol. 2014, 130, 53–65. [Google Scholar] [CrossRef]
- Liu, Q.Q.; Cheng, Y.P.; Wang, H.F.; Zhou, H.X.; Wang, L.; Li, W.; Liu, H.Y. Numerical assessment of the effect of equilibration time on coal permeability evolution characteristics. Fuel 2015, 140, 81–89. [Google Scholar] [CrossRef]
- Kong, X.G.; Wang, E.Y.; Liu, Q.L.; Li, Z.H.; Li, D.X.; Cao, Z.Y.; Niu, Y. Dynamic permeability and porosity evolution of coal seam rich in CBM based on the flow-solid coupling theory. J. Nat. Gas Sci. Eng. 2017, 40, 61–71. [Google Scholar] [CrossRef]
- Xia, T.Q.; Gao, F.; Kang, J.H.; Wang, X.X. A fully coupling coal–gas model associated with inertia and slip effects for CBM migration. Environ. Earth Sci. 2016, 75, 582. [Google Scholar] [CrossRef]
- Lu, S.Q.; Cheng, Y.P.; Li, W. Model development and analysis of the evolution of coal permeability under different boundary conditions. J. Nat. Gas Sci. Eng. 2016, 31, 129–138. [Google Scholar] [CrossRef]
- Li, S.; Fan, C.J.; Han, J.; Luo, M.K.; Yang, Z.H.; Bi, H.J. A fully coupled thermal-hydraulic-mechanical model with two-phase flow for coalbed methane extraction. J. Nat. Gas Sci. Eng. 2016, 33, 324–336. [Google Scholar] [CrossRef]
- Ren, J.; Zhang, L.; Ren, S.; Lin, J.D.; Meng, S.Z.; Ren, G.J.; Gentzis, T. Multi-branched horizontal wells for coalbed methane production: Field performance and well structure analysis. Int. J. Coal Geol. 2014, 131, 52–64. [Google Scholar] [CrossRef]
- Liu, Z.D.; Cheng, Y.P.; Jiang, J.Y.; Li, W.; Jin, K. Interactions between coal seam gas drainage boreholes and the impact of such on borehole patterns. J. Nat. Gas Sci. Eng. 2017, 38, 597–607. [Google Scholar] [CrossRef]
- Li, B.; Sun, D.H.; Zhang, L.L. Study on rational space between gas drainage boreholes passing through seam in coal mine. Coal Sci. Technol. 2016, 44, 121–126. [Google Scholar] [CrossRef]
- Xia, T.; Zhou, F.; Liu, J.; Hu, S.; Liu, Y. A fully coupled coal deformation and compositional flow model for the control of the pre-mining coal seam gas extraction. Int. J. Rock Mech. Min. Sci. 2014, 72, 138–148. [Google Scholar] [CrossRef]
- Alexeev, A.D.; Nedodayev, N.V.; Alexeev, A.D.; Nedodayev, N.V. Ultimate State of Rocks; Naukova Dumka: Kiev, Russian, 1982. [Google Scholar]
- Feng, X.T.; Zhang, X.W.; Kong, R.; Wang, G. A Novel Mogi Type True Triaxial Testing Apparatus and Its Use to Obtain Complete Stress–Strain Curves of Hard Rocks. Rock Mech. Rock Eng. 2016, 49, 1649–1662. [Google Scholar] [CrossRef]
- Alexeev, A.D.; Revva, V.N.; Alyshev, N.A.; Zhitlyonok, D.M. True triaxial loading apparatus and its application to coal outburst prediction. Int. J. Coal Geol. 2004, 58, 245–250. [Google Scholar] [CrossRef]
- Zhu, W.C.; Wei, C.H.; Liu, J.; Qu, H.Y.; Elsworth, D. A model of coalegas interaction under variable temperatures. Int. J. Coal Geol. 2011, 86, 213–221. [Google Scholar] [CrossRef]
- Tao, Y.Q.; Xu, J.; Cheng, M.J.; Li, S.C.; Peng, S.J. Theoretical analysis and experimental study on permeability of gas-bearing coal. Chin. J. Rock Mech. Eng. 2009, 28, 3364–3370. [Google Scholar]
- An, F.H.; Cheng, Y.P.; Wang, L.; Li, W. A numerical model for outburst including the effect of adsorbed gas on coal deformation and mechanical properties. Comput. Geotech. 2013, 54, 222–231. [Google Scholar] [CrossRef]
- Xia, T.; Zhou, F.; Gao, F.; Kang, J.; Liu, J.; Wang, J. Simulation of coal self-heating processes in underground methane-rich coal seams. Int. J. Coal Geol. 2015, 141, 1–12. [Google Scholar] [CrossRef]
- Xu, H.; Tang, D.Z.; Tang, S.H.; Zhao, J.L.; Meng, Y.J.; Tao, S. A dynamic prediction model for gasewater effective permeability based on coalbed methane production data. Int. J. Coal Geol. 2014, 121, 44–52. [Google Scholar] [CrossRef]
- Liu, S.J.; Ma, G.; Lu, J.; Lin, B.Q. Relative pressure determination technology for effective radius found on gas content. J. China Coal Soc. 2011, 36, 1715–1719. [Google Scholar]
Figure 1.
Dual-porosity medium [26] (a, b, Kn, and represent the cubic matrix length, the width of the cleats separating the matrix blocks, facture stiffness, and effective stress, respectively).
Figure 1.
Dual-porosity medium [26] (a, b, Kn, and represent the cubic matrix length, the width of the cleats separating the matrix blocks, facture stiffness, and effective stress, respectively).
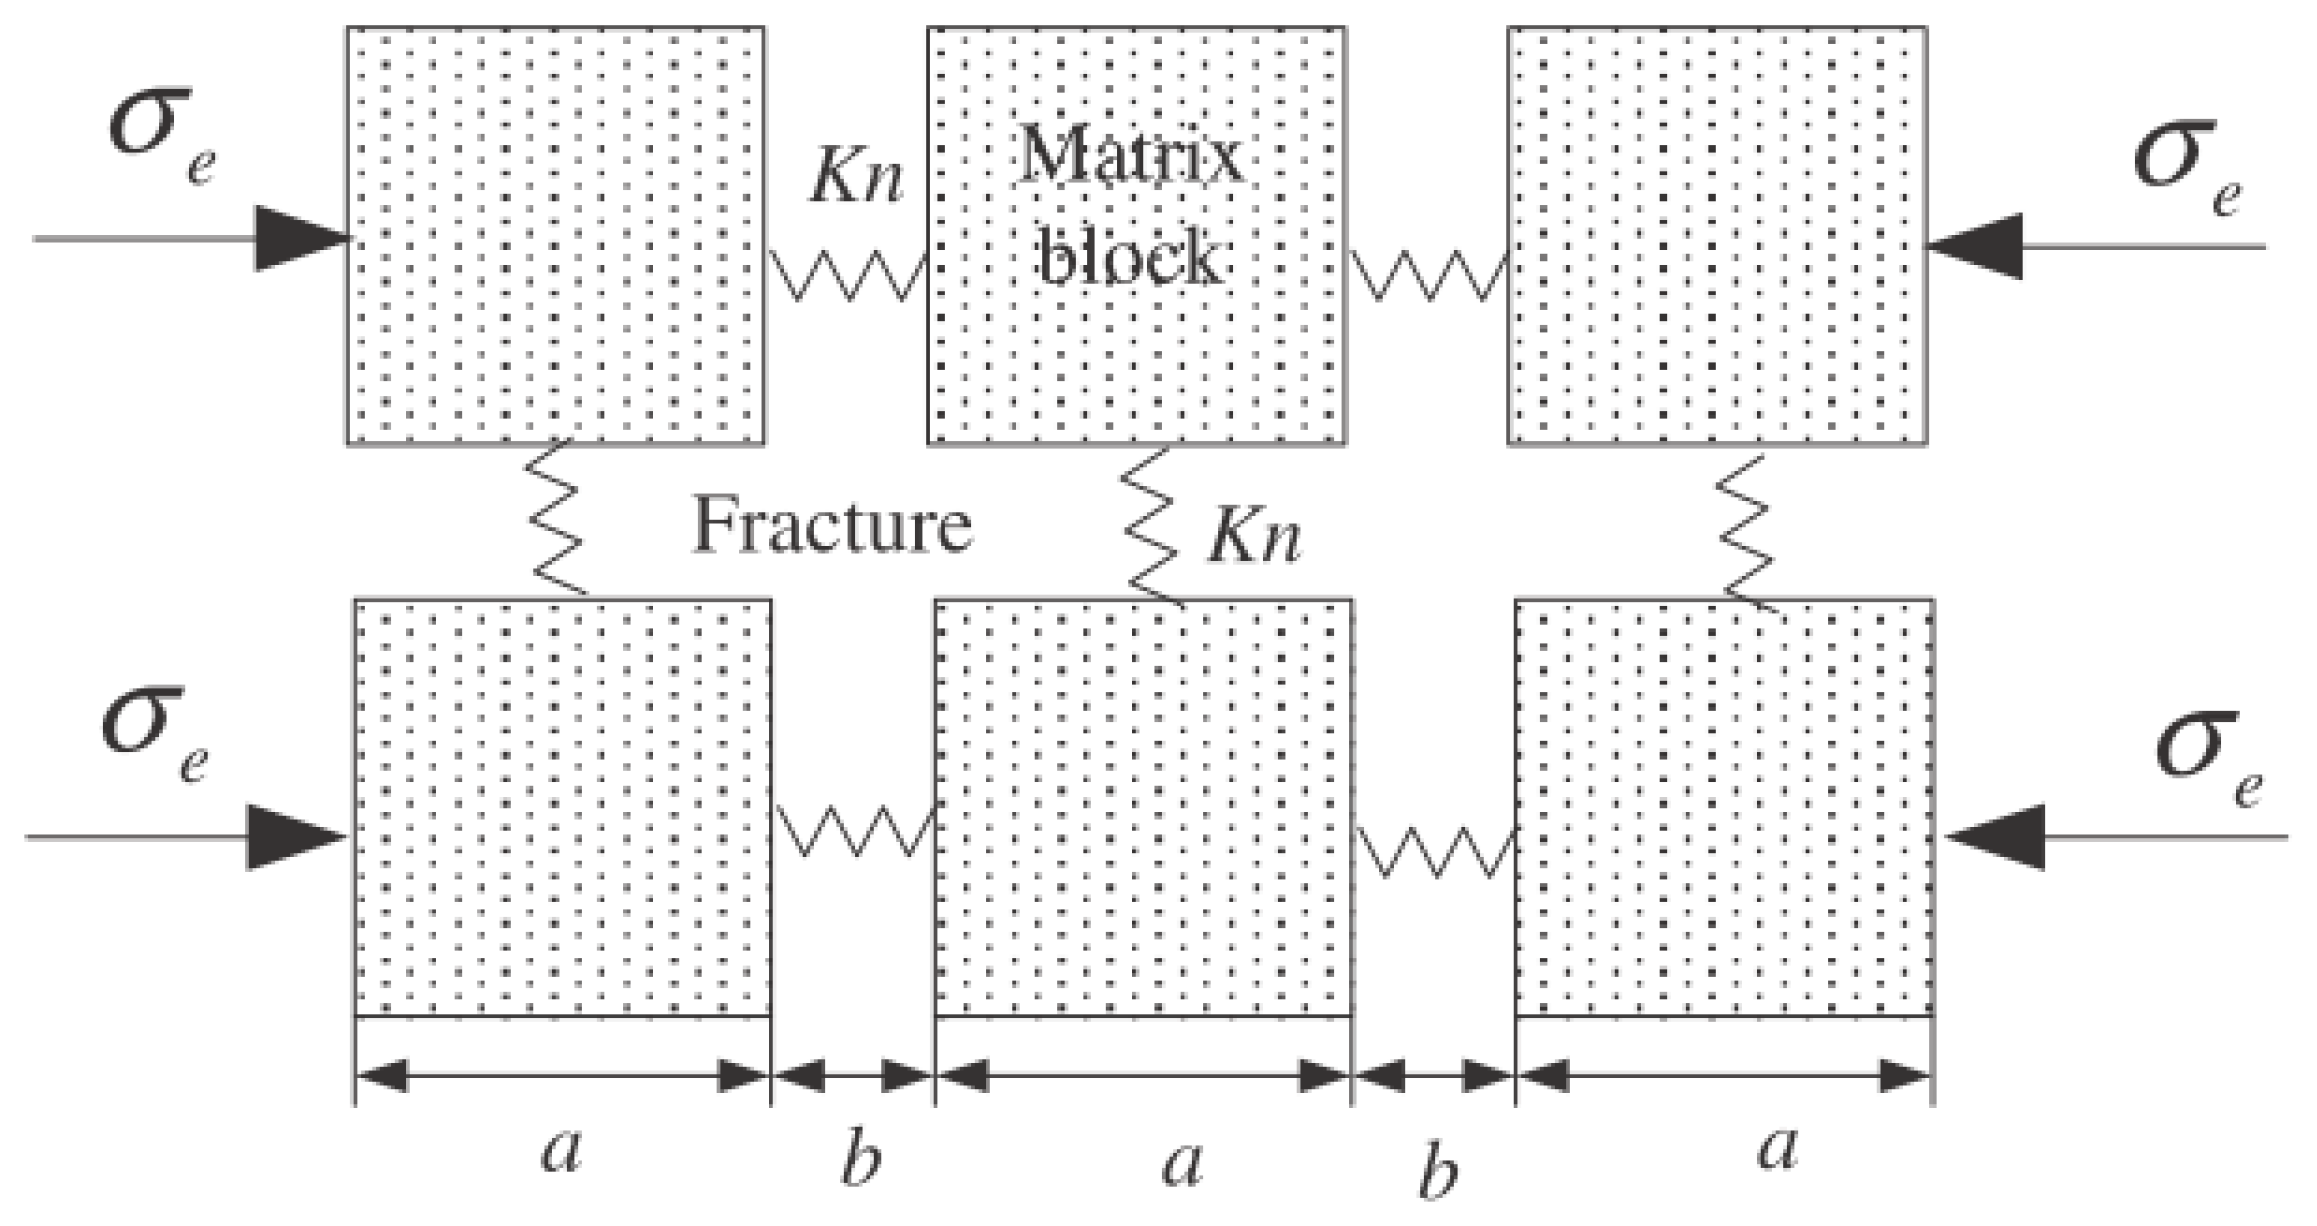
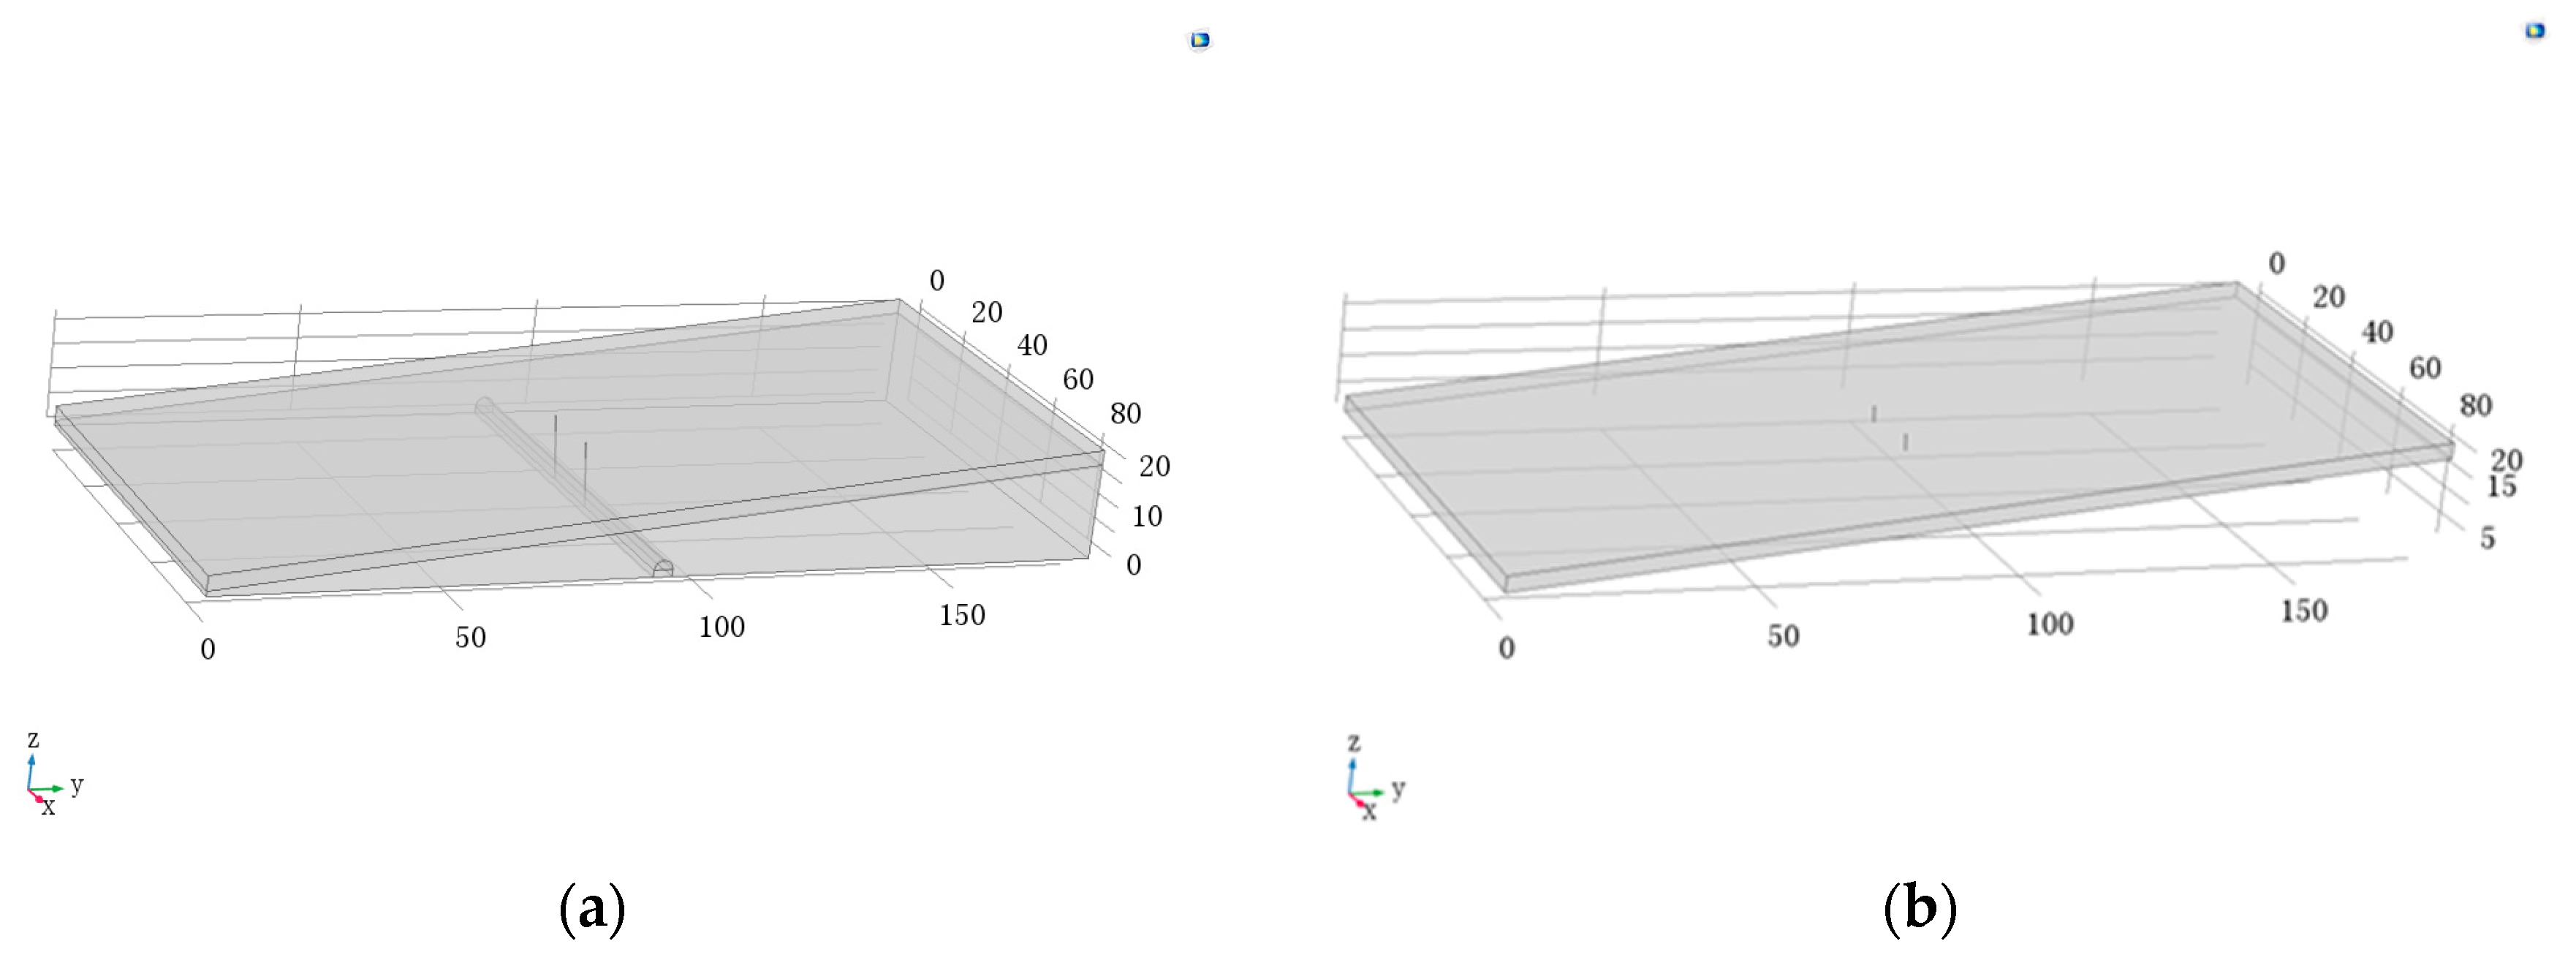
Figure 2.
(a) Geometrical models of the coal seam, rock strata, and borehole; (b) geometrical models of the coal seam and the borehole.
Figure 2.
(a) Geometrical models of the coal seam, rock strata, and borehole; (b) geometrical models of the coal seam and the borehole.
Figure 3.
Comparison curves of the gas flows obtained through numerical simulation and field collection of borehole 1 (a) and borehole 2 (b).
Figure 3.
Comparison curves of the gas flows obtained through numerical simulation and field collection of borehole 1 (a) and borehole 2 (b).

Figure 4.
Borehole layouts of rectangle which spacing between two adjacent boreholes is 2r (a), (b) and rhombus which spacing between two adjacent boreholes is (c).
Figure 4.
Borehole layouts of rectangle which spacing between two adjacent boreholes is 2r (a), (b) and rhombus which spacing between two adjacent boreholes is (c).
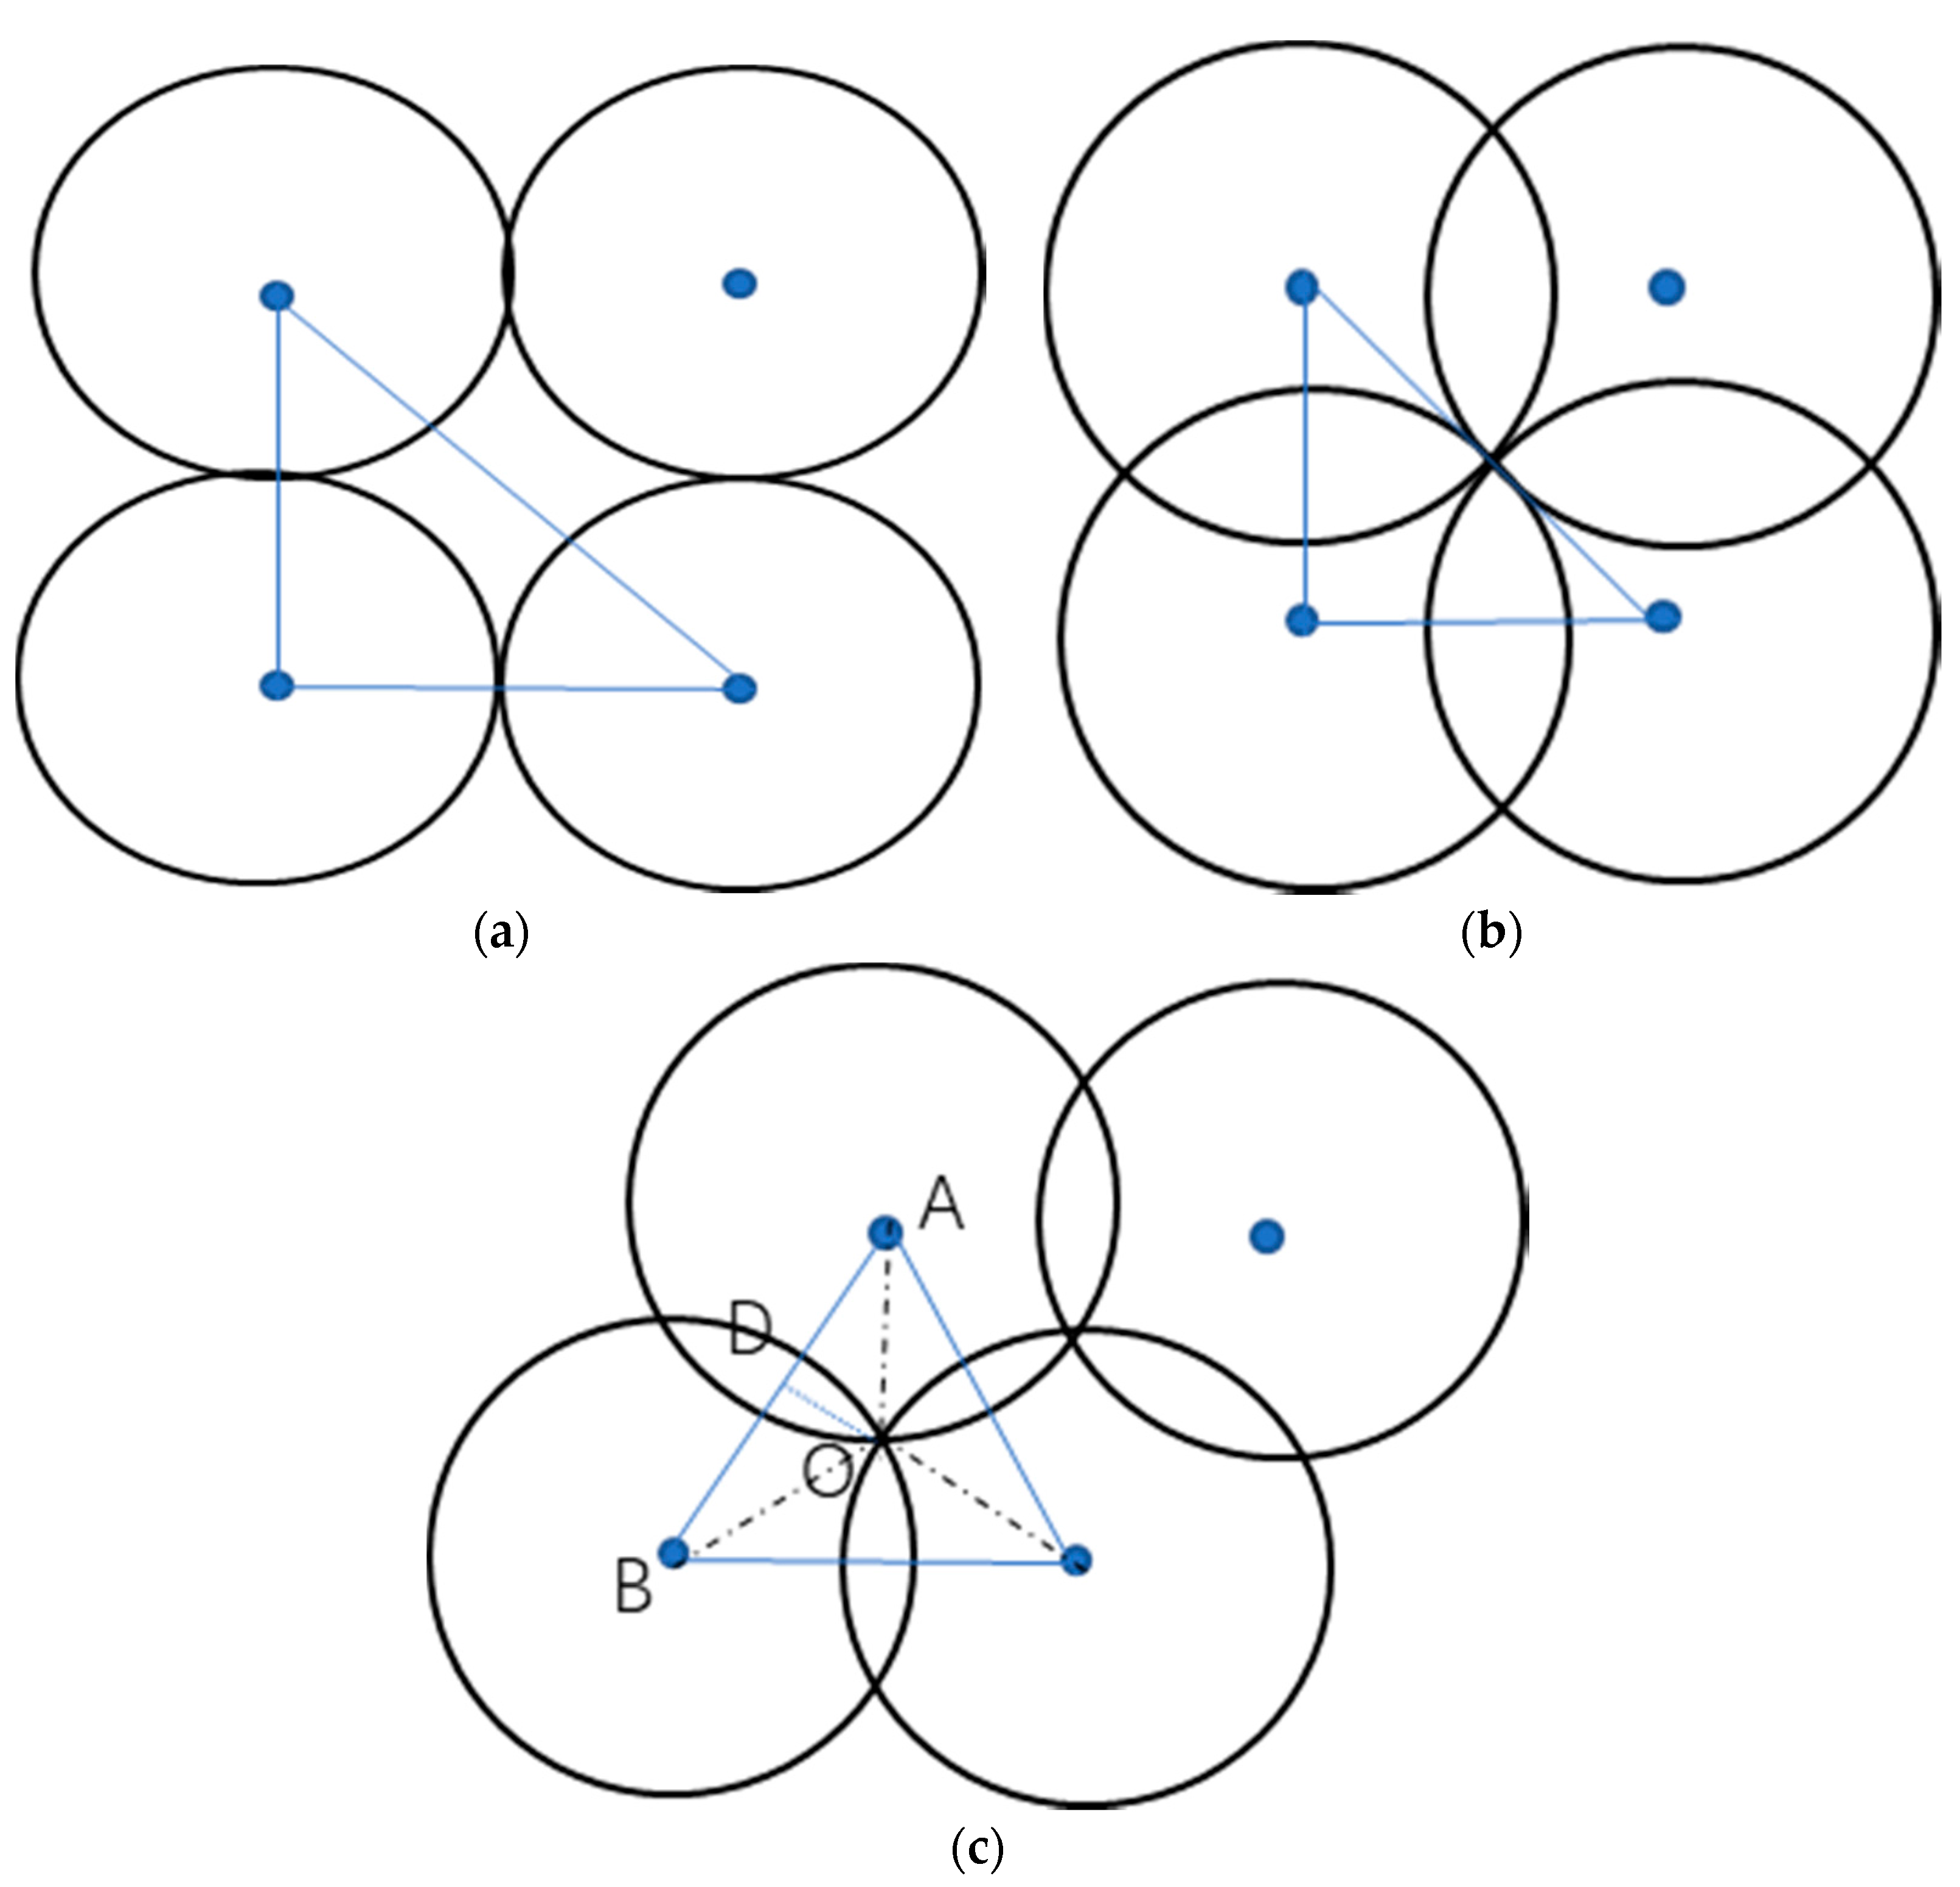
Figure 5.
The effective drainage radius and influence radius of a single borehole: (a) inclined plane, (b) tangent plane.
Figure 5.
The effective drainage radius and influence radius of a single borehole: (a) inclined plane, (b) tangent plane.
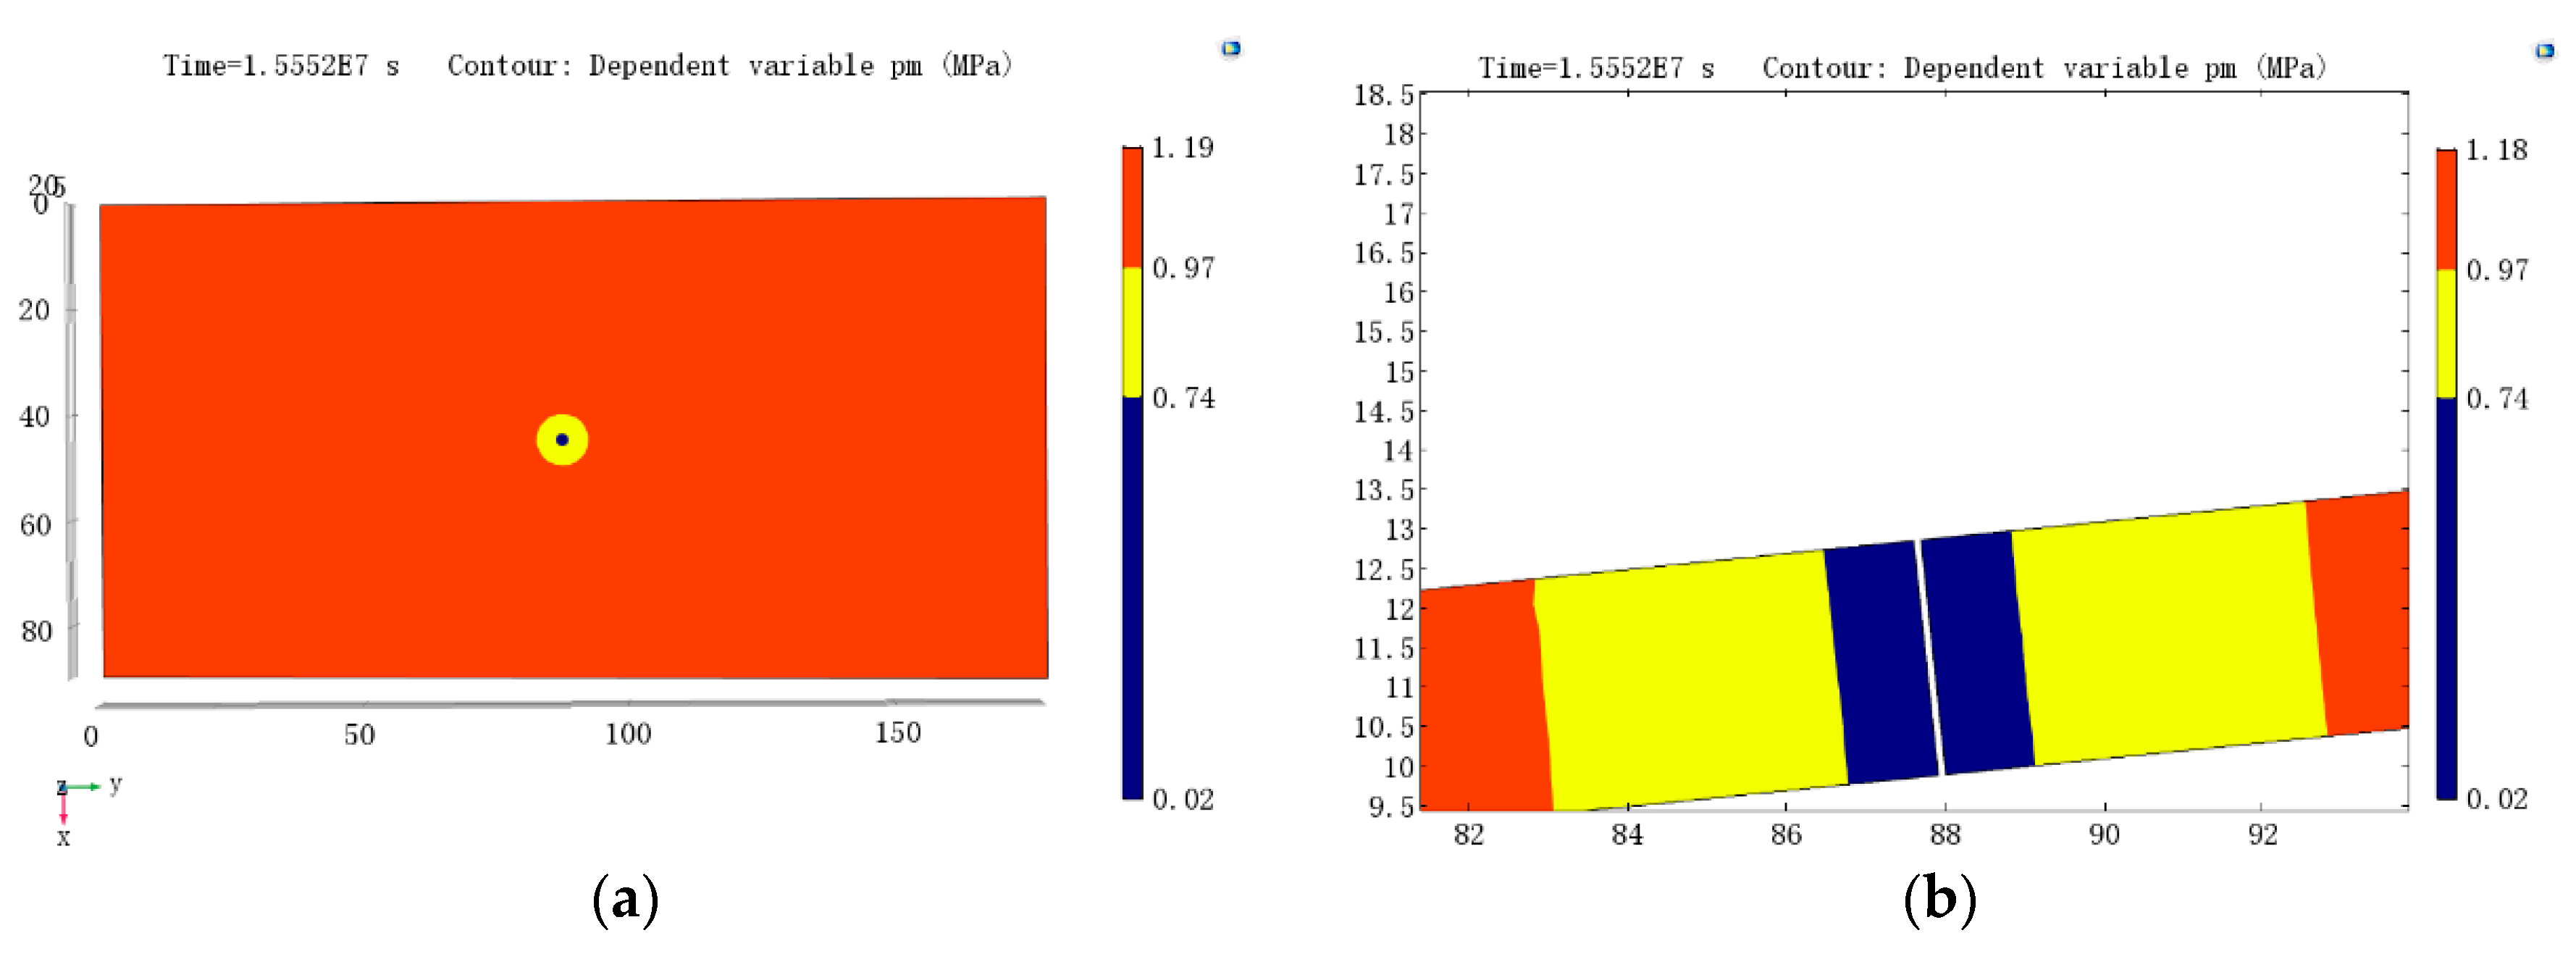
Figure 6.
(a) Gas pressure at P, (b) outburst elimination areas, and (c) outburst elimination volume for different borehole spacings.
Figure 6.
(a) Gas pressure at P, (b) outburst elimination areas, and (c) outburst elimination volume for different borehole spacings.

Figure 7.
Outburst elimination areas formed by gas drainage from four boreholes at different spacings. Outburst elimination area formed by gas drainage from four boreholes at a spacing of 2.1 m: (a) inclined plane, (b) tangent plane. Outburst elimination area formed by gas drainage from four boreholes at a spacing of 2.4 m: (c) inclined plane, (d) tangent plane. Outburst elimination area formed by gas drainage from four boreholes at a spacing of 3 m: (e) inclined plane, (f) tangent plane. Outburst elimination area formed by gas drainage from four boreholes at a spacing of 4 m: (g) inclined plane, (h) tangent plane. Outburst elimination area formed by gas drainage from four boreholes at a spacing of 5 m: (i) inclined plane, (j) tangent plane.
Figure 8.
Areas with outburst risk eliminated on the inclined plane when boreholes are arranged in (a) a rectangle and (b) a rhombus at a spacing of 5 m.
Figure 8.
Areas with outburst risk eliminated on the inclined plane when boreholes are arranged in (a) a rectangle and (b) a rhombus at a spacing of 5 m.
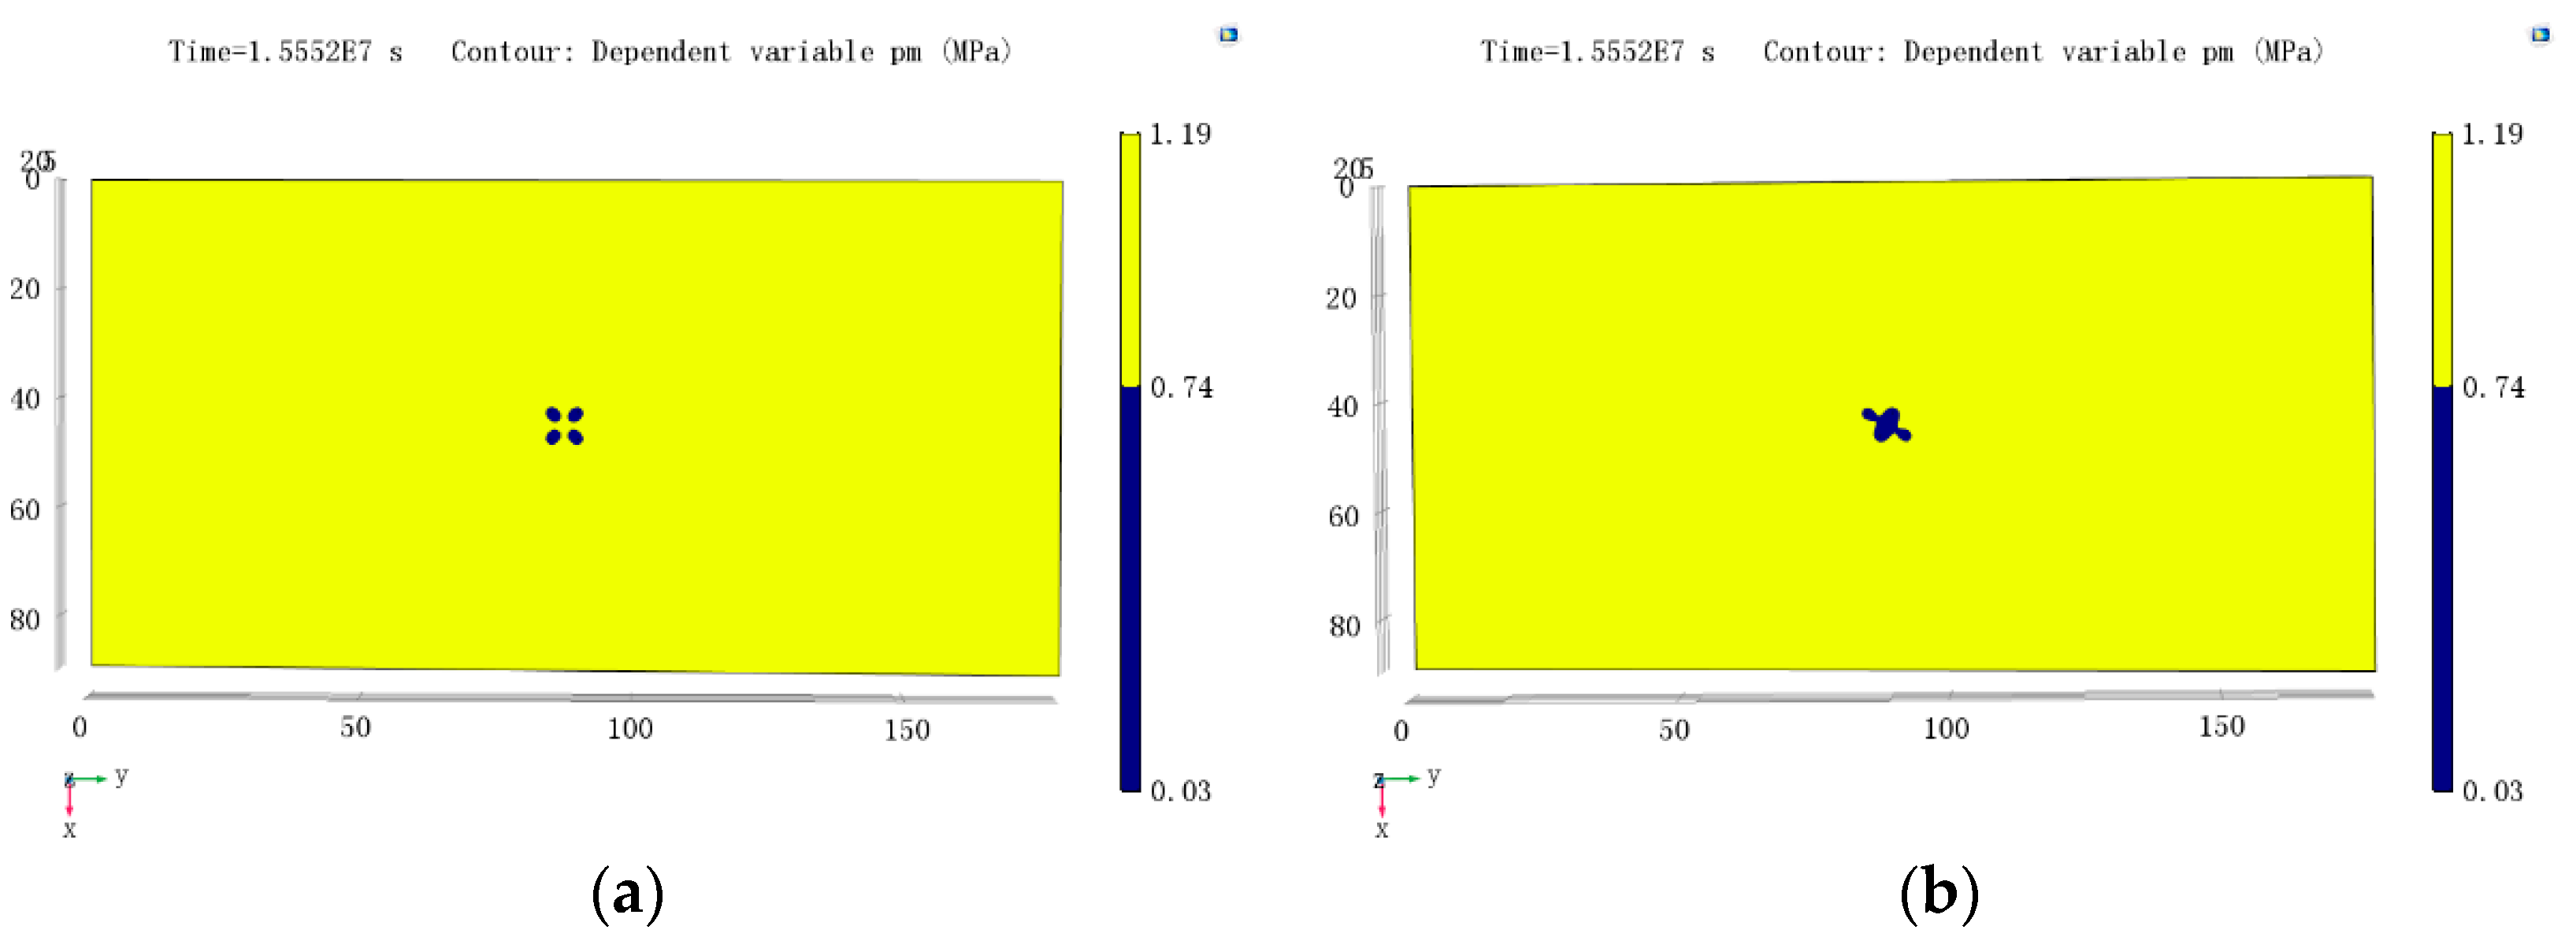
Figure 9.
Geometrical models of rectangular configuration: (a) plan, (b) elevation and rhomboidal configuration, (c) plan, (d) elevation.
Figure 9.
Geometrical models of rectangular configuration: (a) plan, (b) elevation and rhomboidal configuration, (c) plan, (d) elevation.
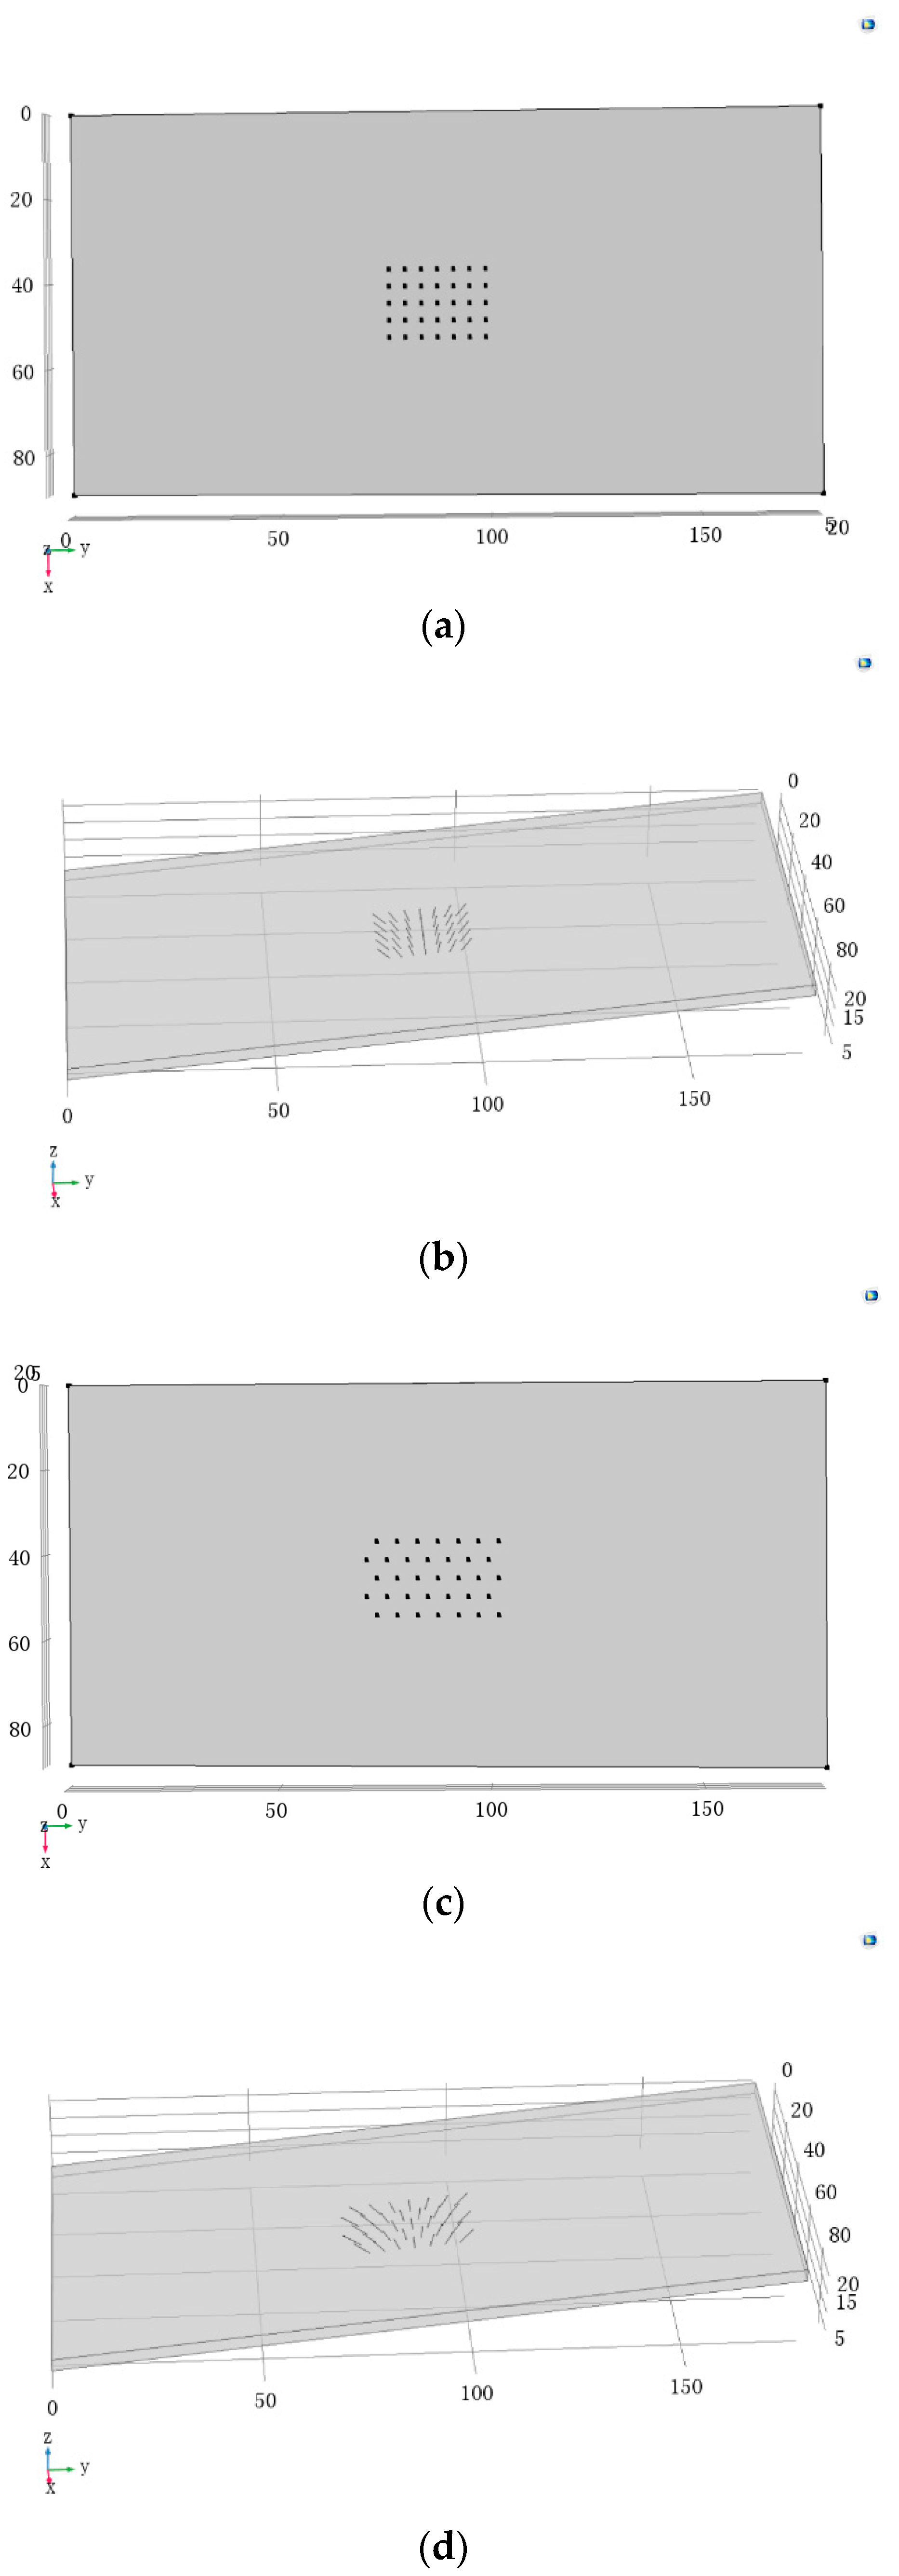
Figure 10.
(a) Outburst elimination area and (b) volume before and after optimization.

Figure 11.
Outburst elimination areas before and after optimization. Outburst elimination areas on the tangent plane at X = 37 m (a) before and (b) after optimization. Outburst elimination areas on the inclined plane of the borehole bottom (c) before and (d) after optimization.
Figure 11.
Outburst elimination areas before and after optimization. Outburst elimination areas on the tangent plane at X = 37 m (a) before and (b) after optimization. Outburst elimination areas on the inclined plane of the borehole bottom (c) before and (d) after optimization.
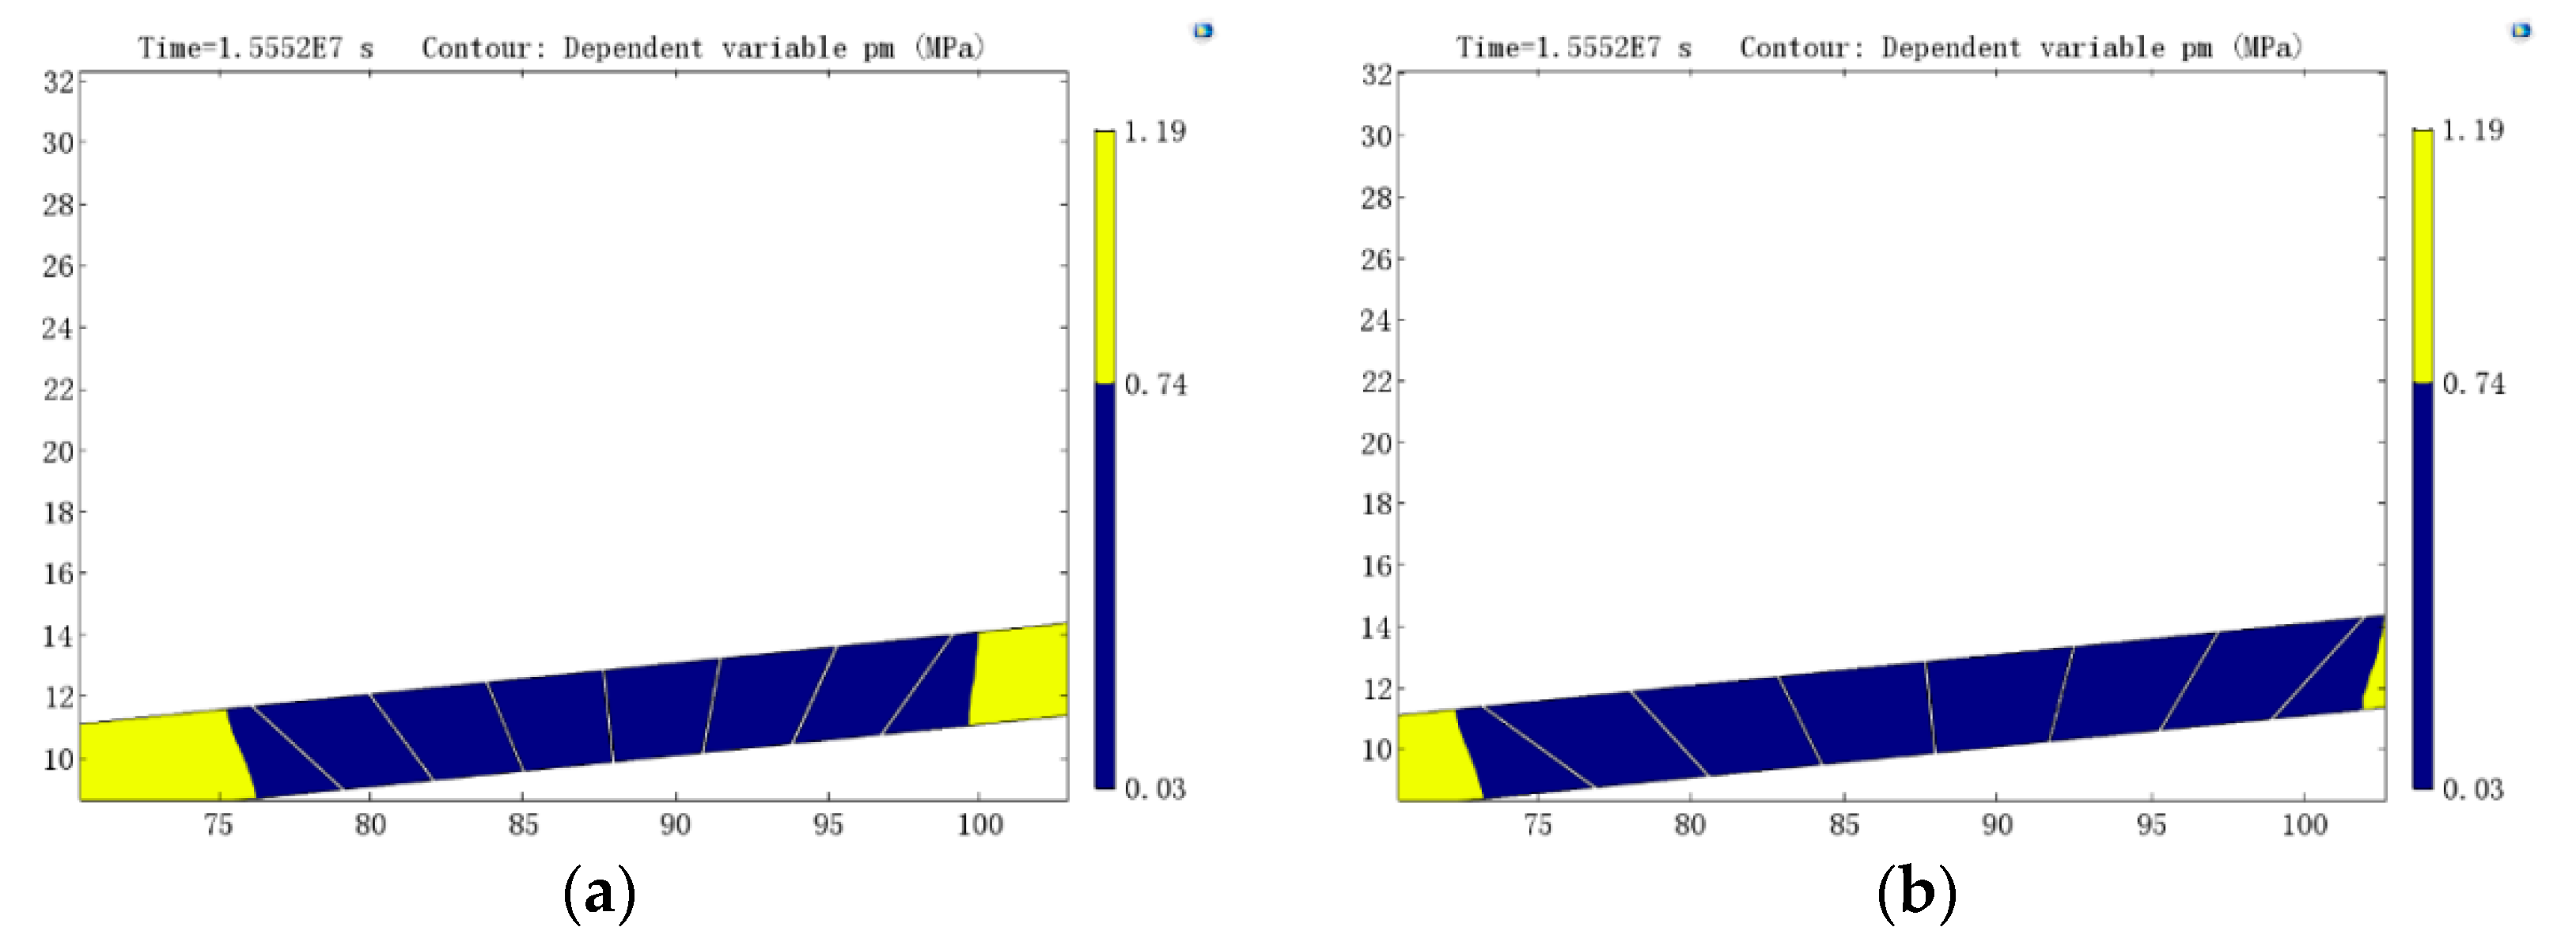
Figure 12.
Isobaric lines of gas pressure before and after optimization. Isobaric lines of gas pressure on the inclined plane of borehole bottom (rectangular configuration, at a spacing of 4 m): (a) overall map, (b) enlarged view. Isobaric lines of gas pressure on the inclined plane of borehole bottom (rhomboidal configuration, at a spacing of 5 m): (c) overall map, (d) enlarged view.


Table 1.
The parameters for computational model.
| Parameter | Symbol | Value | Unit |
|---|---|---|---|
| Elastic modulus of coal | E | 2.8 × 10⁹ | Pa |
| Elastic modulus of coal skeleton | ES | 8.4 × 10⁹ | Pa |
| Fracture stiffness | Kn | 4.8 × 10⁹ | Pa |
| Poisson’s ratio of coal | 0.33 | ||
| Density of coal skeleton | 1.35 × 10³ | kg/m3 | |
| Density of water at standard condition | 1000 | kg/m3 | |
| Initial porosity for coal matrix | 0.07 | ||
| Initial porosity for fracture | 0.02 | ||
| Initial permeability for fracture | kf0 | 0.26 × 10⁻¹⁶ | m2 |
| Gas dynamic viscosity | 1.03 × 10⁻⁵ | Pa·s | |
| Water dynamic viscosity | 1.01 × 10⁻³ | Pa·s | |
| Initial gas pressure in fracture | pmg0 | 1.2 × 10⁶ | Pa |
| Initial gas pressure in matrix | pfg0 | 1.2 × 10⁻⁶ | Pa |
| Coefficient for sorption-induced volumetric strain | 0.043 | kg/m3 | |
| Initial water saturation | sw0 | 0.4 | |
| Endpoint relative permeability of water | krw0 | 1 | |
| Endpoint relative permeability of gas | krg0 | 0.756 | |
| Irreducible water saturation | swr | 0.2 | |
| Residual gas saturation | sgr | 0.05 | |
| Adsorption time | 153,360 | s | |
| Langmuir pressure constant | PL | 2.45 | MPa |
| Langmuir volume constant | VL | 0.016 | m3/kg |
| Initial fracture aperture | b0 | 1 × 10⁻⁴ | m |
| Initial matrix size | a0 | 1 × 10⁻² | m |
| Capillary pressure | pcgw | 0.05 | MPa |
| Wet swell coefficient | 0.1 × 10⁻⁴ |
© 2018 by the authors. Licensee MDPI, Basel, Switzerland. This article is an open access article distributed under the terms and conditions of the Creative Commons Attribution (CC BY) license (http://creativecommons.org/licenses/by/4.0/).
Share and Cite
MDPI and ACS Style
Chen, Y.; Xu, J.; Peng, S.; Yan, F.; Fan, C. A Gas–Solid–Liquid Coupling Model of Coal Seams and the Optimization of Gas Drainage Boreholes. Energies 2018, 11, 560. https://doi.org/10.3390/en11030560
AMA Style
Chen Y, Xu J, Peng S, Yan F, Fan C. A Gas–Solid–Liquid Coupling Model of Coal Seams and the Optimization of Gas Drainage Boreholes. Energies. 2018; 11(3):560. https://doi.org/10.3390/en11030560
Chicago/Turabian StyleChen, Yuexia, Jiang Xu, Shoujian Peng, Fazhi Yan, and Chaojun Fan. 2018. "A Gas–Solid–Liquid Coupling Model of Coal Seams and the Optimization of Gas Drainage Boreholes" Energies 11, no. 3: 560. https://doi.org/10.3390/en11030560
Note that from the first issue of 2016, this journal uses article numbers instead of page numbers. See further details here.