A Review of Electric Vehicle Lifecycle Emissions and Policy Recommendations to Increase EV Penetration in India

Harvard Extension School. Harvard University, Cambridge, MA 02138, USA
*
Author to whom correspondence should be addressed.
Energies 2018, 11(3), 483; https://doi.org/10.3390/en11030483
Submission received: 17 January 2018
/
Revised: 15 February 2018
/
Accepted: 22 February 2018
/
Published: 25 February 2018
Abstract
:Electric vehicles reduce pollution only if a high percentage of the electricity mix comes from renewable sources and if the battery manufacturing takes place at a site far from the vehicle use region. Industries developed due to increased electric vehicle adoption may also cause additional air pollution. The Indian government has committed to solving New Delhi’s air pollution issues through an ambitious policy of switching 100% of the light duty consumer vehicles to electric vehicles by 2030. This policy is based on vehicle grid interaction and relies on shared mobility through the electric vehicle fleet. There are several human behavioral changes necessary to achieve 100% adoption of electric vehicles. This paper reviews different steps in the lifecycle of an electric vehicle (EV), their impact on environmental emissions, and recommends policies suitable for different socio-economic group that are relevant to the Indian market. To reduce air pollution through adoption of electric vehicles, the Indian government needs to adopt policies that increase sale of electric vehicles, increase percentage of renewable energy in the electricity mix, and prevent air pollution caused from battery manufacturing. The recommended policies can be customized for any market globally for reducing air pollution through increased adoption of electric vehicles.
1. Introduction
Air pollutants, including particulate matter (PM), sulfur dioxide (SO2), nitrogen oxides (NOx), carbon monoxide (CO), and ozone (O3) often exceed the National Ambient Air Quality Standards (NAAQS) in Indian cities [1]. The World Health Organization (WHO) has listed New Delhi amongst top 10 world cities with the worst PM10 pollution in its 2014 assessment [1]. Vehicles, manufacturing and industry, construction activities, road dust, and solid biomass combustion are the most commonly identified sources of air pollution [1]. Vehicular emissions from internal combustion engine vehicles is one of the major contributors of air pollutants [2,3].
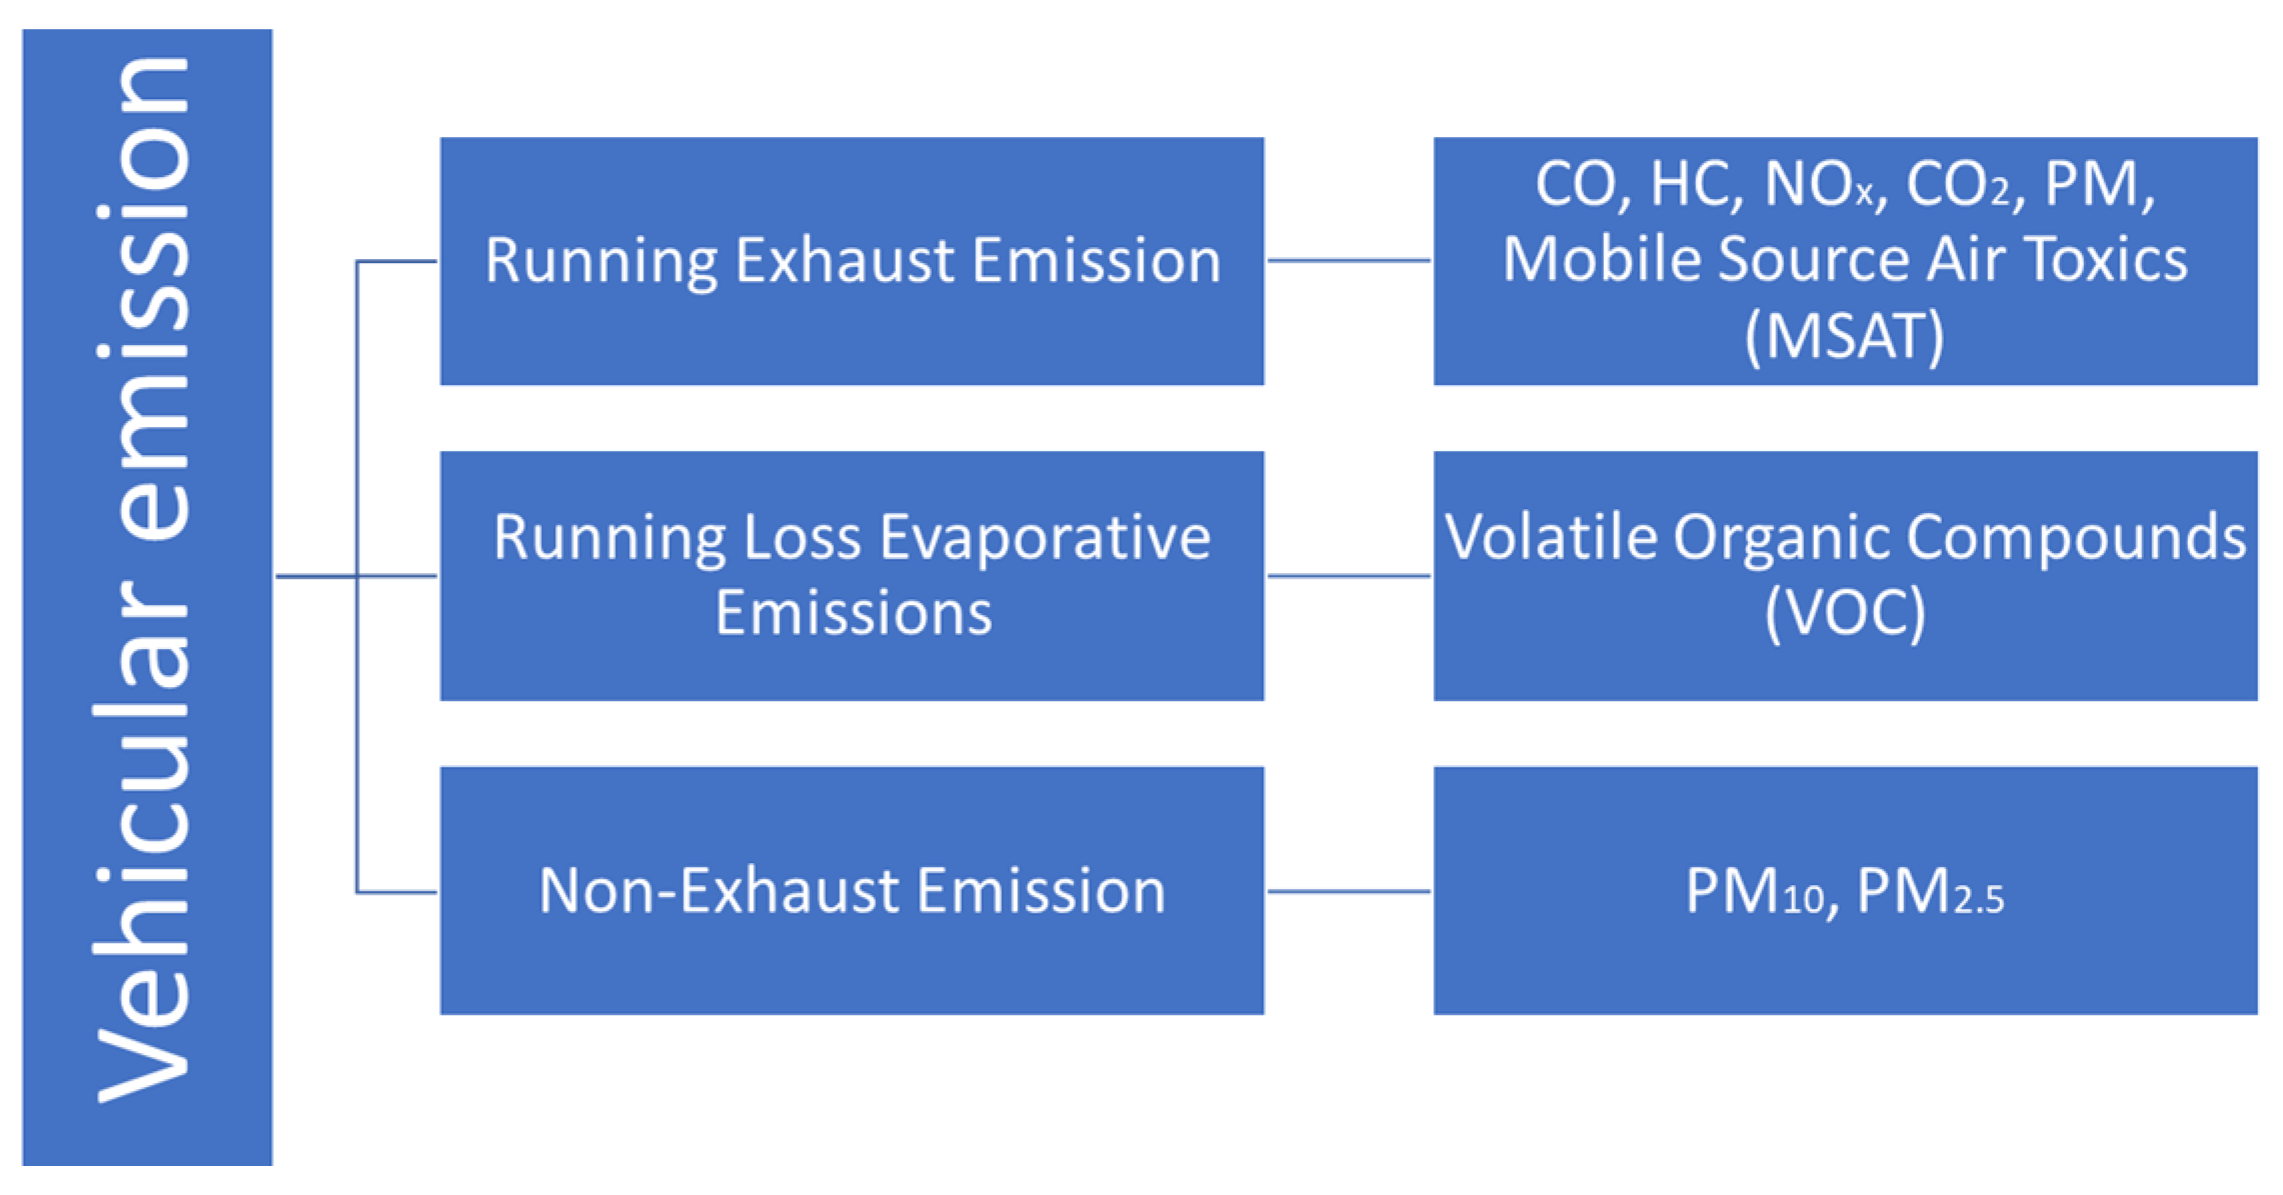
Vehicular emission can be from running exhaust emissions, running loss evaporative emissions, or non-exhaust emissions (Figure 1). These emission types have been described in more detail later in the article. The emission type determines the type of gaseous and particulate matter (PM) suspended into the atmosphere [4]. The particulate matter and gaseous suspensions in the atmosphere cause various health hazards [2]. Mobile Source Air Toxics (MSAT) released during running exhaust emission (Figure 1) can cause a wide range of health hazards including birth defects and negative effects on kidney, lungs and nervous system [4]. PM10 emission from running exhaust emission and non-exhaust emissions is a major cause of breathing and respiratory diseases, lung tissue related issues, cancer and premature death [2].
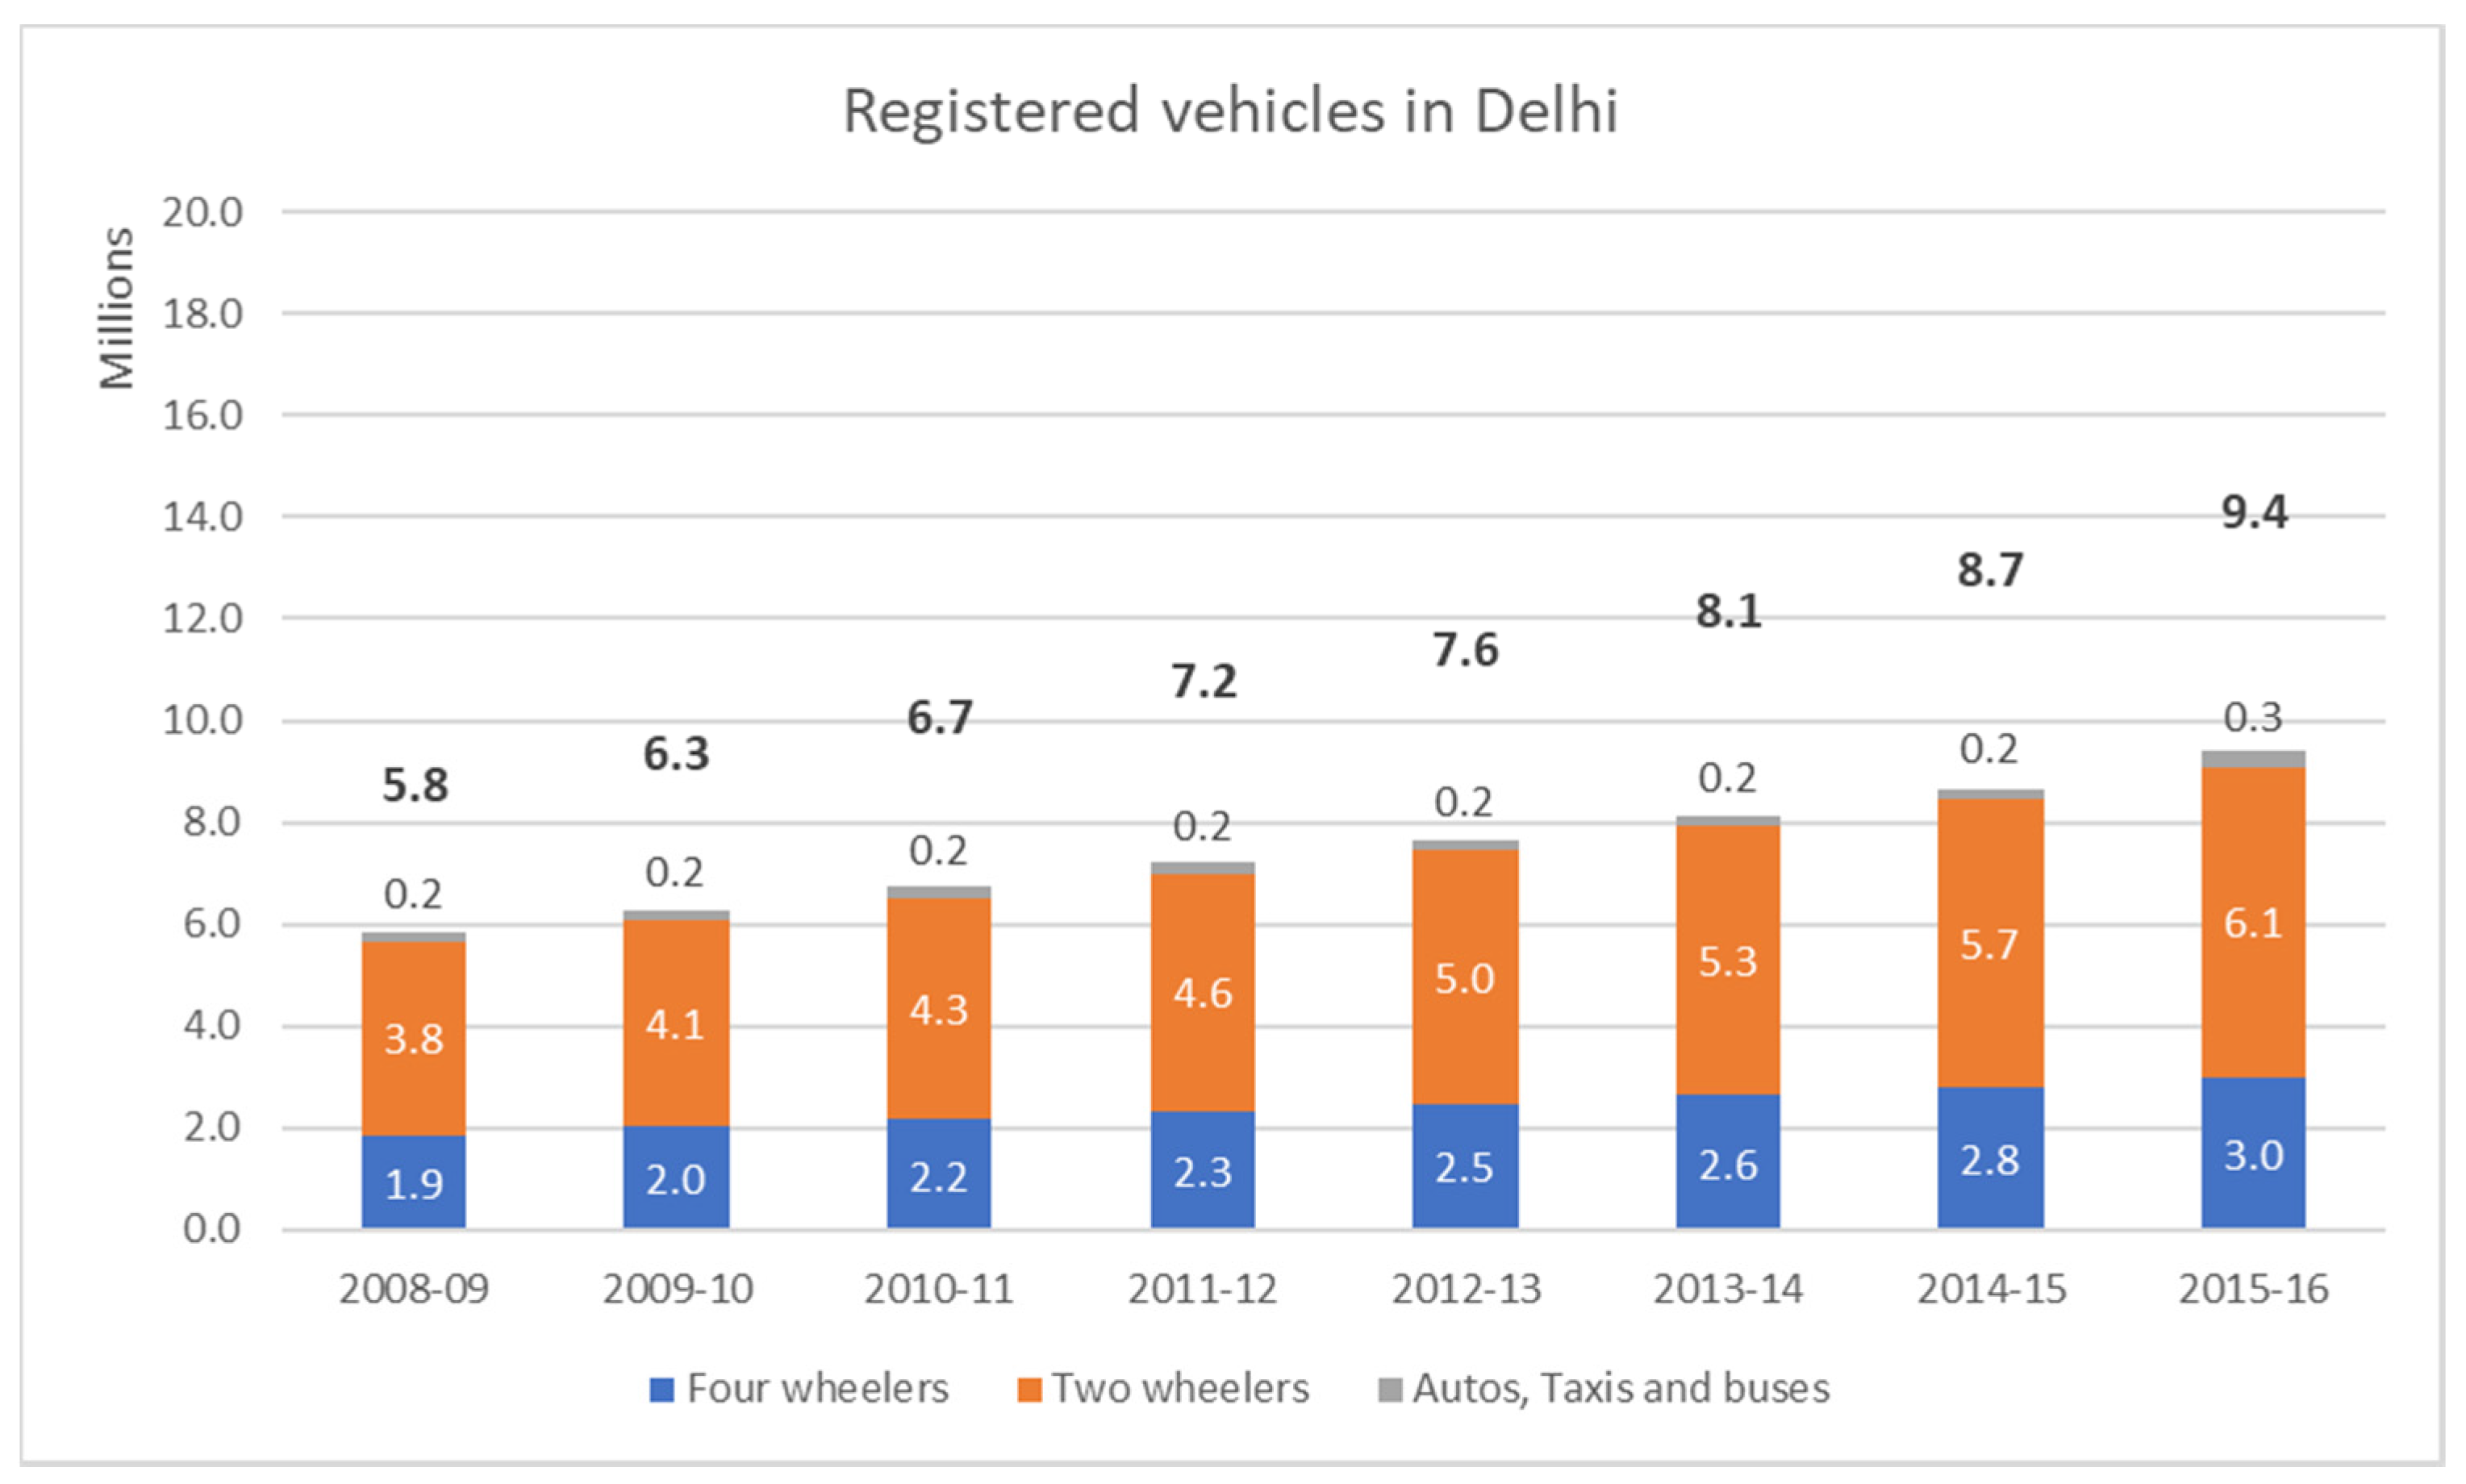
The New Delhi region today has a population of 22 million and has one of the highest population densities (260 persons per hectare, 12 times denser than New York) in the world [5,6]. With New Delhi’s economic development and population increase, number of registered automobiles in the city has been increasing in the last several years (Figure 2). Means of public road transport—buses, taxis and shared autos—constitute a small percentage of registered automobiles [6]. Most of the automobiles in the city are owned by individual owners, used for non-commercial purposes [6], and their increase is driven by population growth in the region. India’s per capita mobility is highly correlated with per capita income [7]. Because of the increasing industrialization [6] in New Delhi area, the city’s mobility is expected to grow further in near future. As the demand for non-commercial vehicular use increases, the per hectare vehicle density in New Delhi area is only expected to increase.
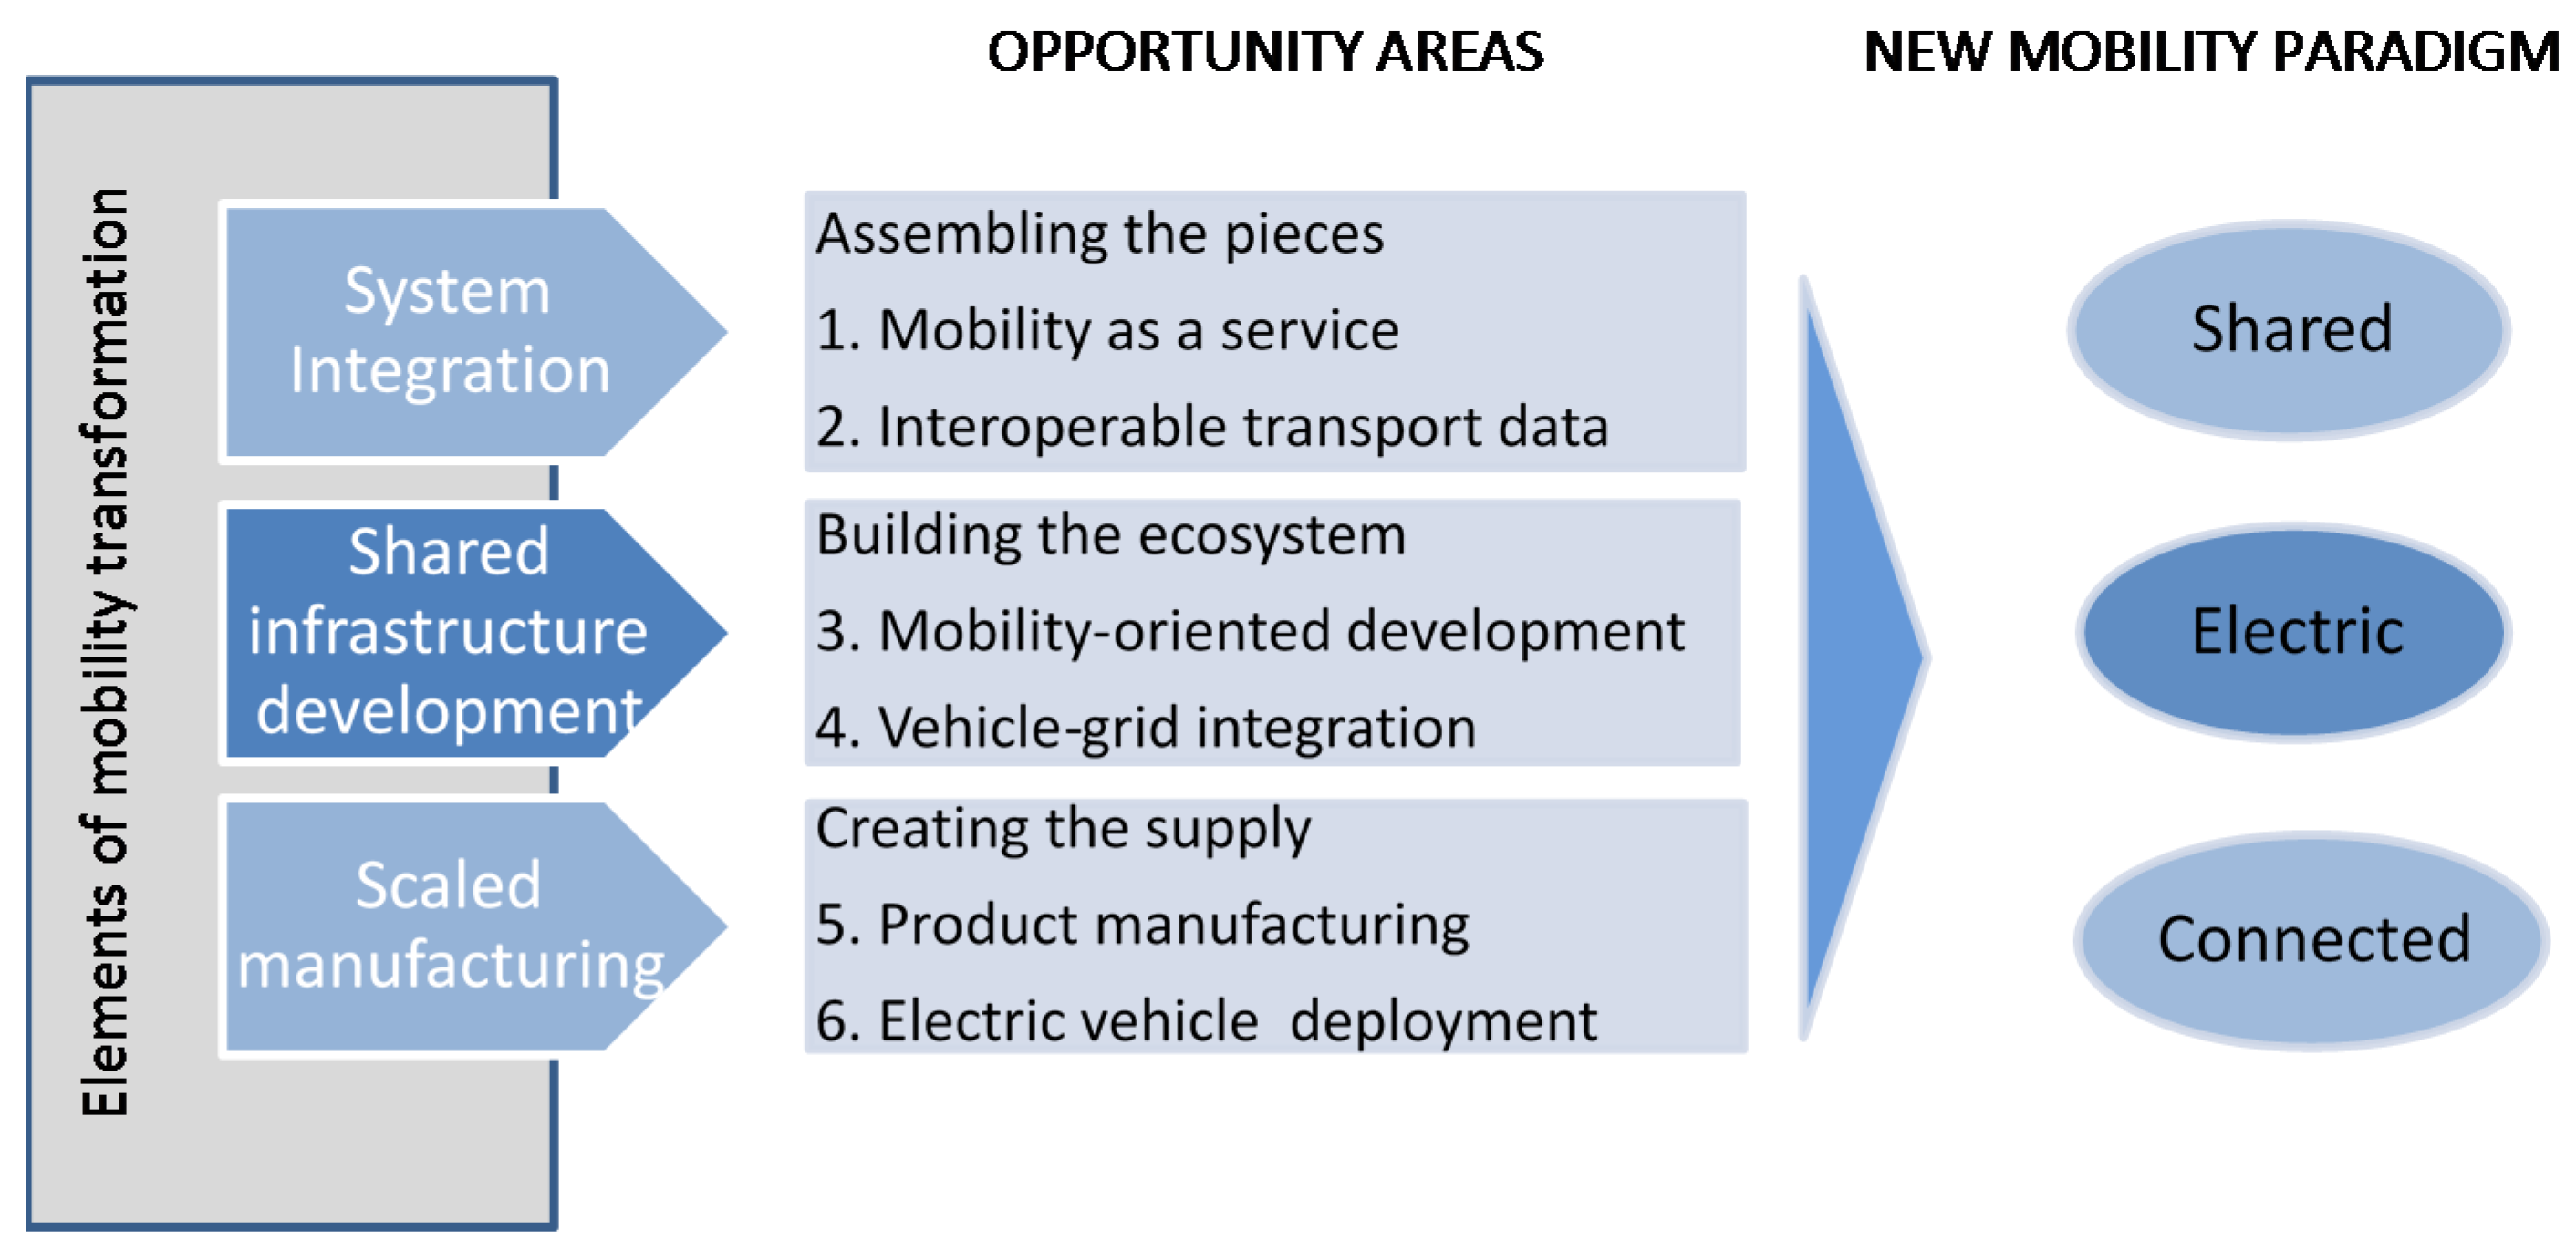
Several of Indian government’s policies that focused on using a cleaner fuel did reduce vehicular emissions during the 2000s [8]. Electric vehicles is one such technology that the Indian government is relying on to reduce Delhi’s vehicular emissions [9]. The Government of India recently announced its intention to sell only electric vehicles by 2030 [10]. India’s minister of Power and Renewable energy believes that shifting from petrol and diesel to electric will reduce air pollution and will address climate change [10]. Niti Aayog, the strategy arm of the Indian government, has prepared the roadmap shown in Figure 3 [10] for the same. They have identified three critical elements for causing a paradigm shift in the Indian mobility structure. Different opportunity areas have been discussed that include mobility as a service, big data, vehicle-grid interaction, and domestic manufacturing. The proposed connected mobility strategy involves creating a fleet of electric vehicles that can transport people when needed and can support the grid at other times [9].
The strategy combines two of India’s biggest challenges—mobility and electricity availability—and aims to solve both by achieving technological advancements, business model innovation and by bringing a behavioral change in the way people commute [9]. Adopting electric vehicles also presents unique challenges such as disposing used Li-ion batteries [11]. Also with increased demand for lithium, price of lithium will also go up which may make electric cars more expensive [12]. Battery production process for lithium batteries as well emits several air pollutants including sulfur dioxide, nitrogen oxide and carbon dioxide [11,13]. These emissions are largely caused as byproduct of raw material processing, and energy required during the manufacturing and assembly of the battery cells [13,14,15,16,17]. Air quality impact of electric vehicles also depends a lot on the source of electricity [18].The objective of this paper is to review case studies of electric vehicle adoption in various countries, analyze the feasibility of environmental, sociological, and environmental changes needed based on various policies that have been successful in India’s context, and estimate overall impact of these changes on air pollution in New Delhi. The paper also recommends policies to make adoption of the connected mobility strategy more sustainable.
2. India’s Roadmap to Sell Only Electric Vehicles by 2030
Integrating transportation with electricity, developing the shared ecosystem platform, and scaling up the manufacturing are the key parts of India’s roadmap to sell only electric vehicles by 2030 [9]. The implementation has been divided into three phases.
- In phase 1, the goal is to capture opportunities that are already economic, while preparing for strategic options that will be viable in near future [9]. This involves building the infrastructure for transportation [9]. This infrastructure includes both software platform and the physical on-demand transport vehicles [9].
- The third phase integrates electricity with the transportation system and enables electric vehicles to discharge electricity to the grid [9]. All the government incentives too will be phased out at this stage [9]. Currently, the government is working towards policies for various incentives for owners of the two and four wheelers, and for the cities that have higher EV penetration [19,20,21]. In the past, government has provided subsidies up to Rs. 150,000 for cars and SUVs, and up to Rs. 30,000 for electric two-wheelers [22].
As shown in Figure 4, EV adoption is driven by customer incentives (economic and convenience), regulatory incentives and technology readiness [23]. The proposed policy framework introduces several action items to promote technological innovation in the field of mobility transformation, recommends several government initiatives to consolidate the fragmented database, and claims that a fleet of electric vehicles can be easily adopted in India as a high percentage of the population does not own a car [9].
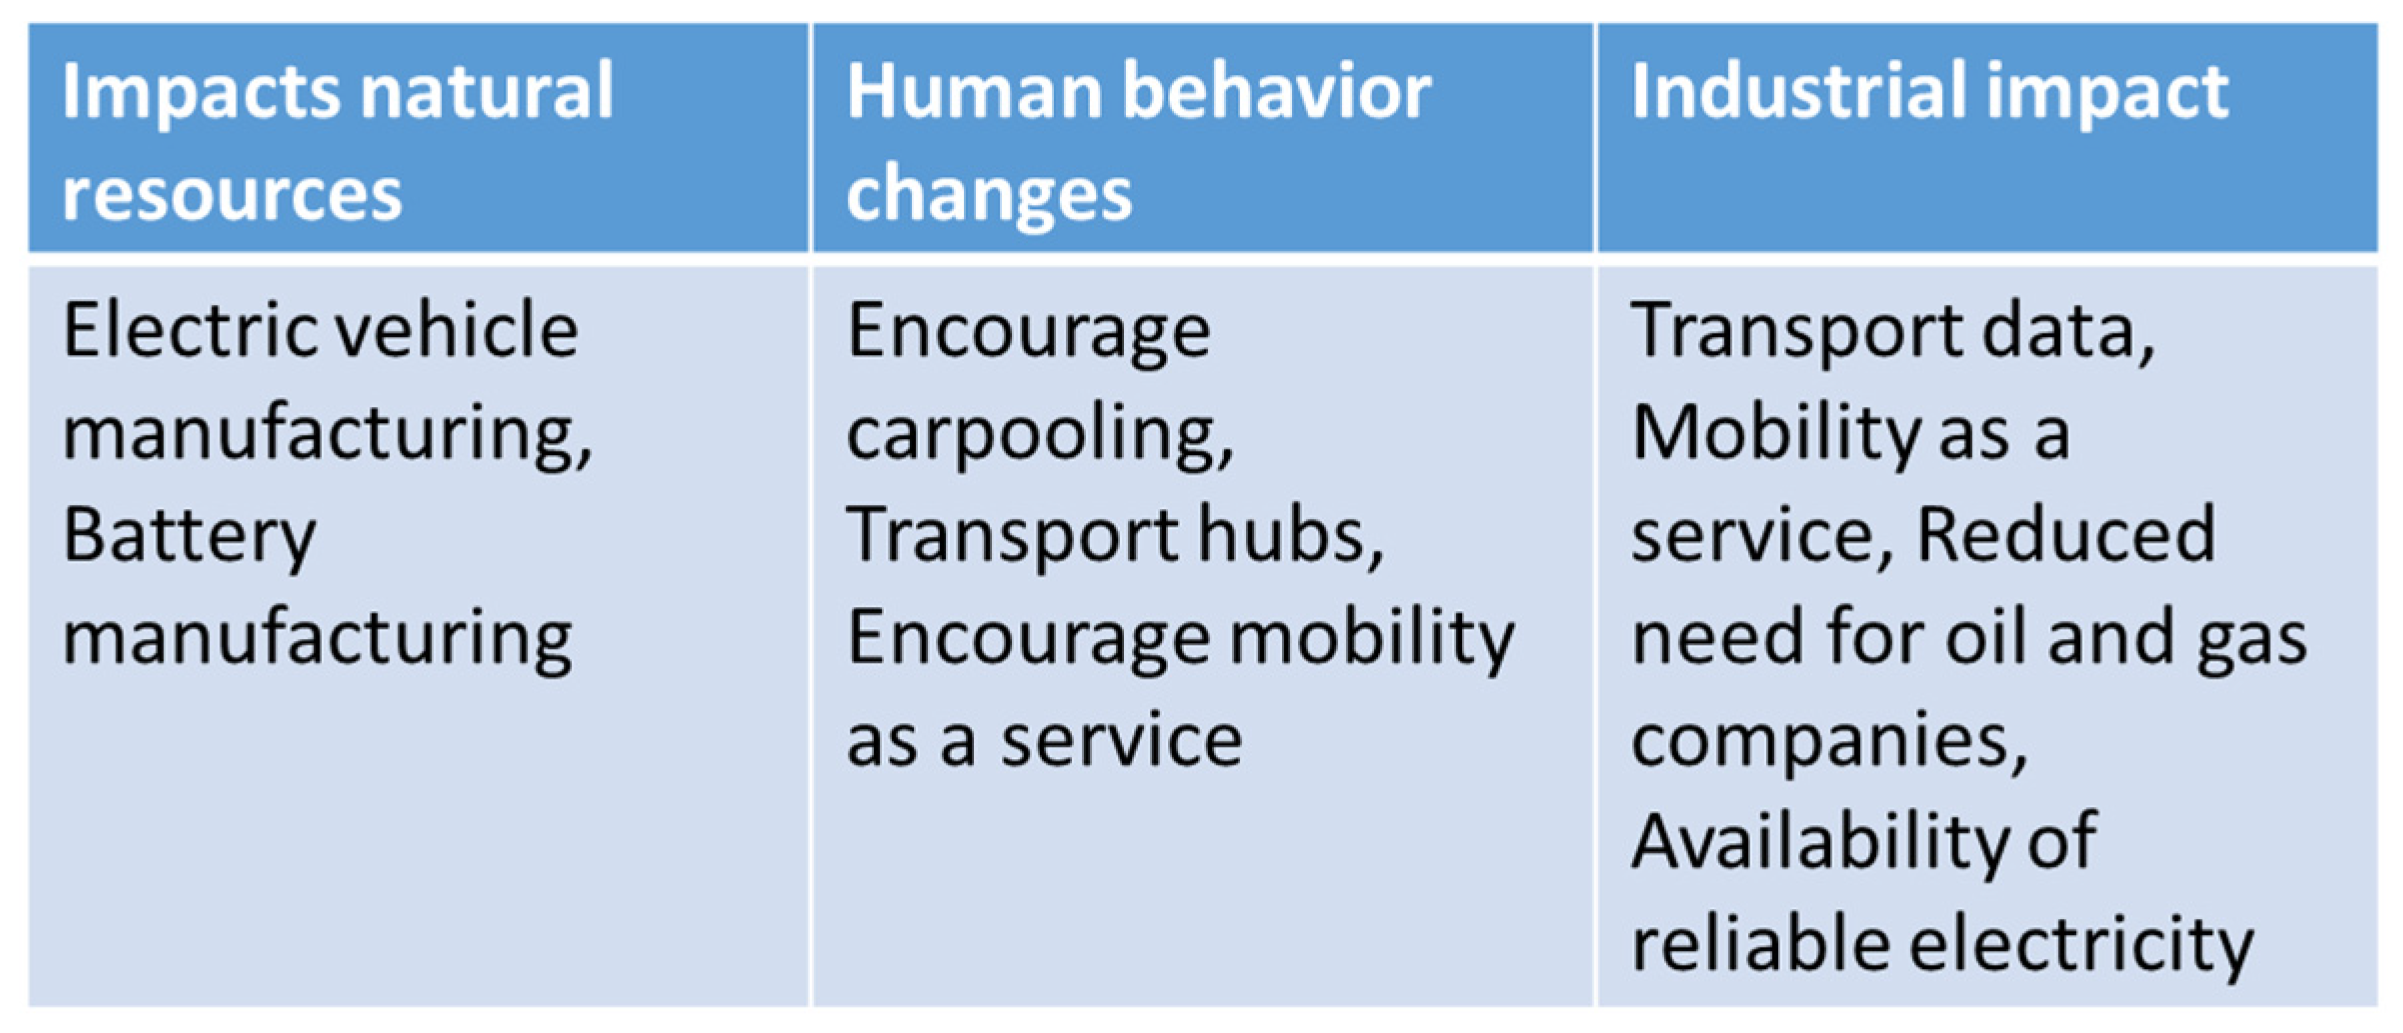
Several potential roadblocks for this implementation have been identified in Figure 5 These roadblocks are related to inherent technological, behavioral, and industry related changes [9]. The ecosystem is impacted due to all the new steps added in the supply chain, such as the electric vehicle, and the battery manufacturing processes [11]. Human behavior changes will involve changes to the way humans perceive travel as vehicle ownership is a sign of prosperity [9] in Indian culture. The government today subsidizes diesel prices as most of the farm equipment is diesel based [9]. Any subsidy that goes away from farm equipment directly impacts food prices. Several existing industries, including oil and gas and energy, will be disrupted and new industries such as transportation price optimizers and mobility service will be created because of this disruption [9].
3. Natural System Influences
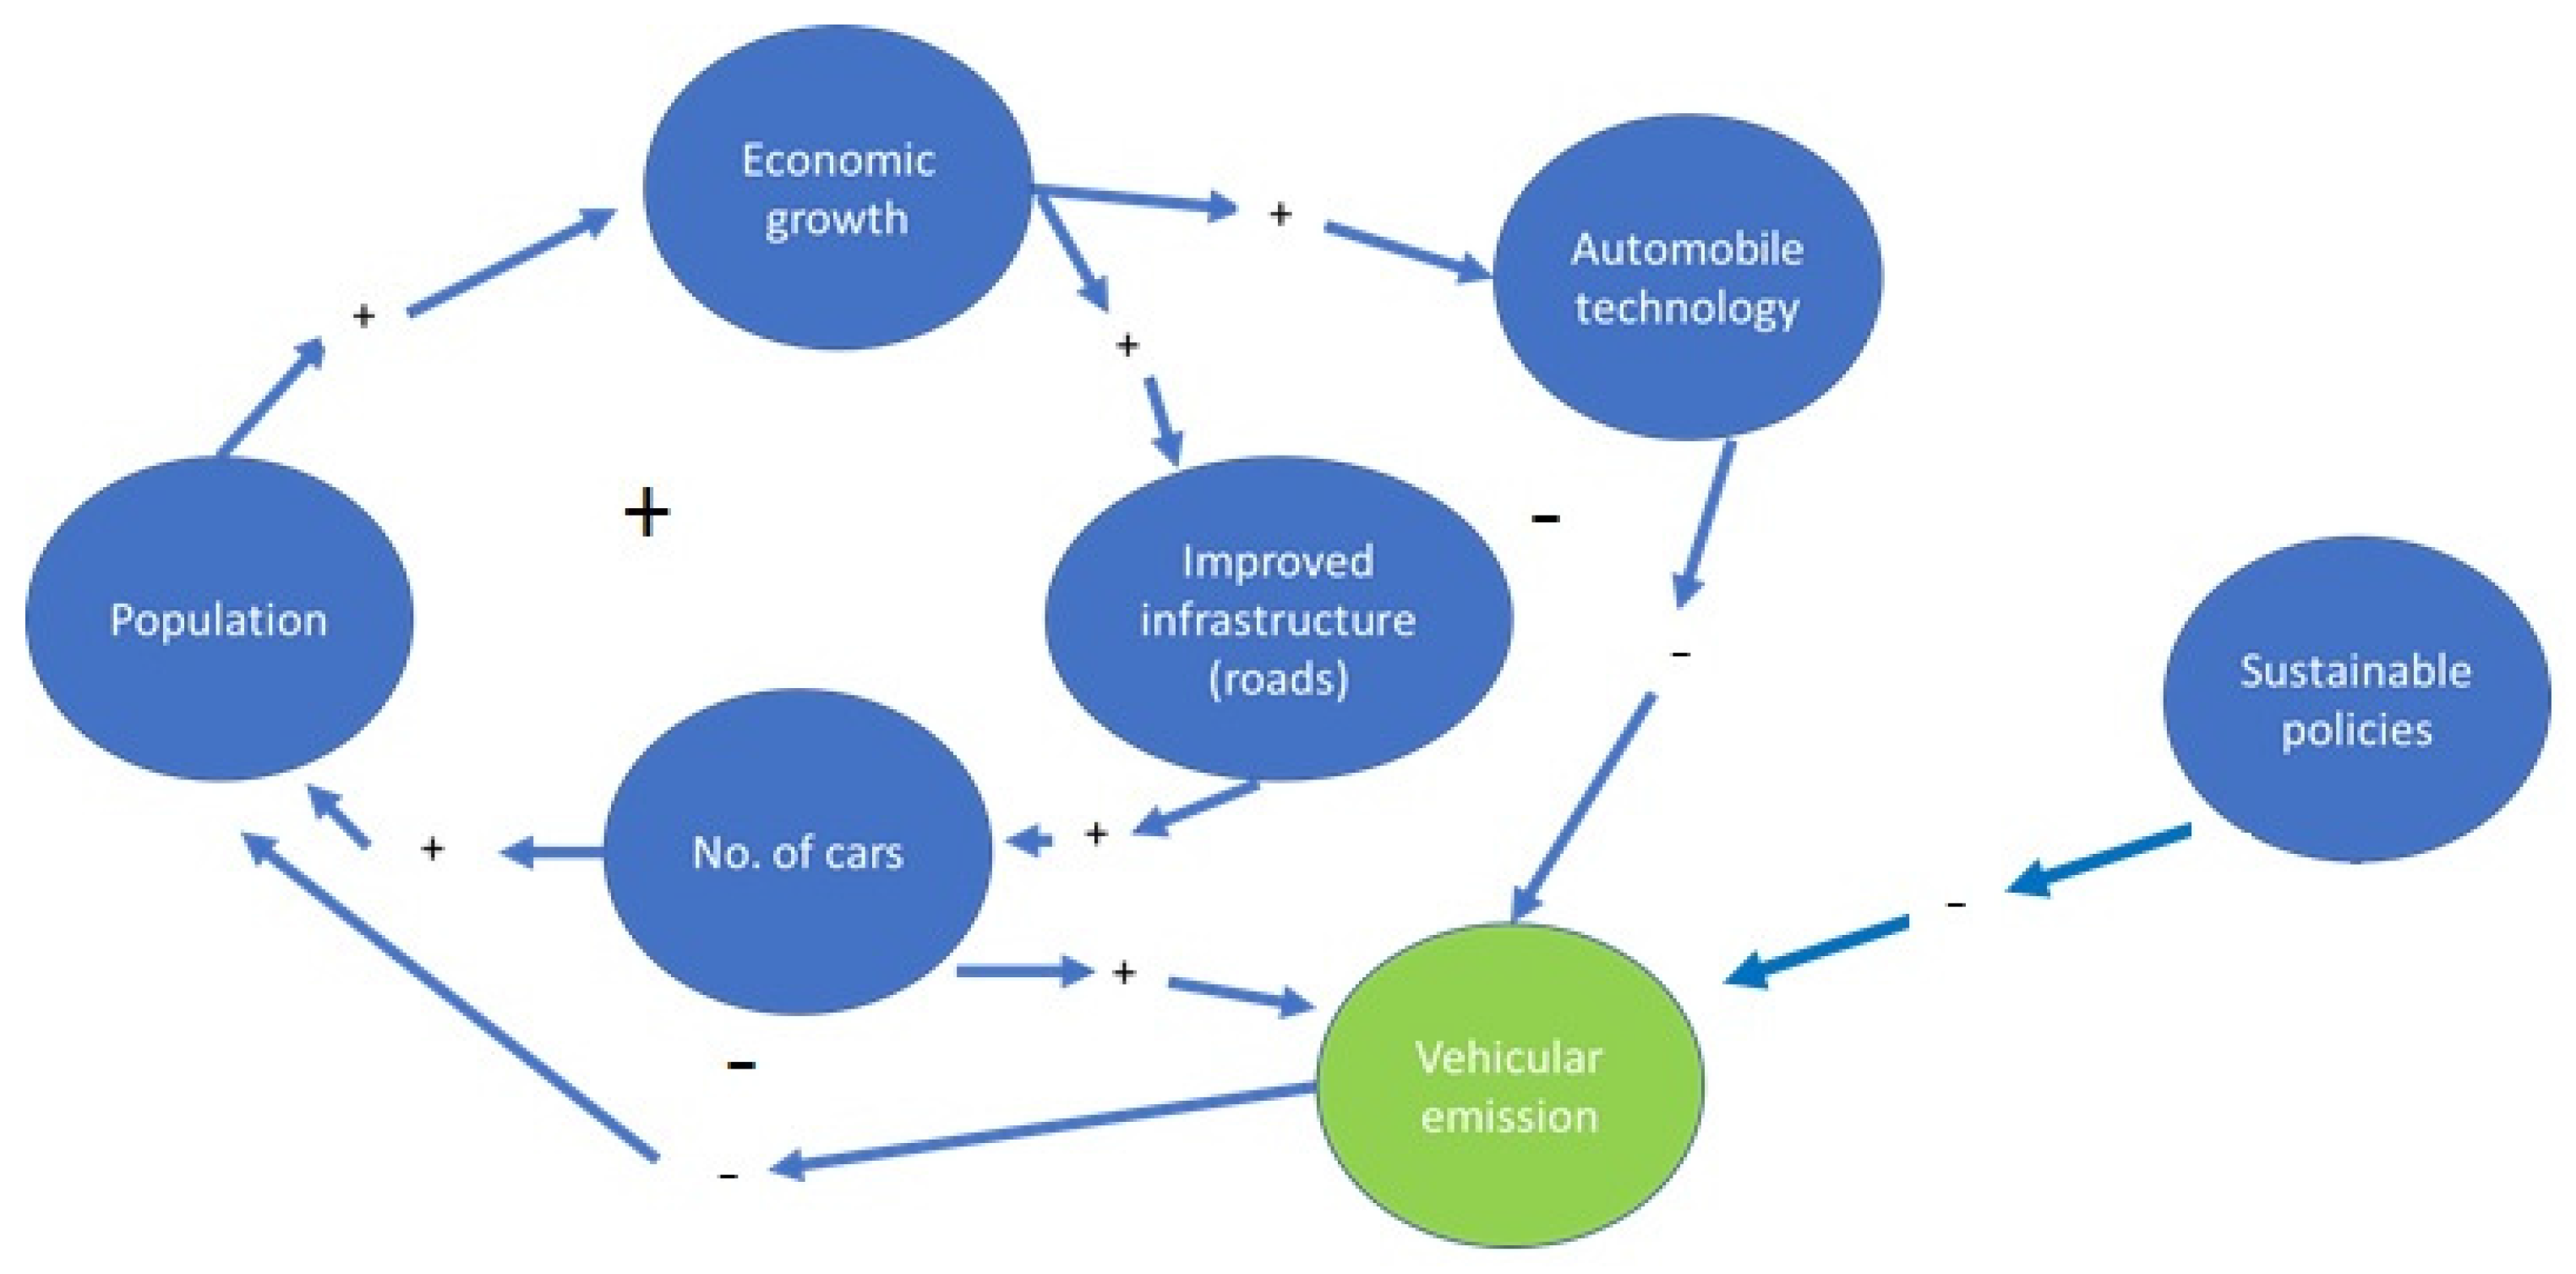
Figure 6 shows the causal loop diagram for vehicular emissions. In this figure, the nodes are the various parameters that contribute to vehicular emissions, and the sign shown on a link represents the correlation between the nodes that it connects. Vehicular emissions is directly linked to the number of vehicles and the emission per vehicle [24]. As seen in Figure 6 an increase in human population increases economic activity, which increases the buying power of people living in the area and the public infrastructure, which in turn, increases the number of vehicles on the road. More economic growth and more vehicles on the road leads more people to relocate to the area. This results in a closed loop that is reinforcing loop, as indicated by the “+” sign in the middle of the loop. The number of vehicles and the quantity of emission from the fuel determine net vehicular pollution in the area [24]. Increased vehicular emission causes several diseases and decreases life expectancy in the area (Figure 6) [25,26,27]. This results in a negative loop, or a balancing loop, as indicated by the “−” sign in the middle of the loop. If no technical or policy measures are taken, vehicular emissions will continue to increase until the rate of fatalities due to vehicular emission or air pollution increases to a value equal to the population growth in the area (Figure 6), which will result in balancing of the loop. Such a high fatality rate will discourage people from living in the area, thus decreasing the region’s population. Decreased population reduces economic activity. Therefore, adopting policies and technologies that reduce vehicular emission not only improve immediate quality of life, but are also essential for long term growth of the region.
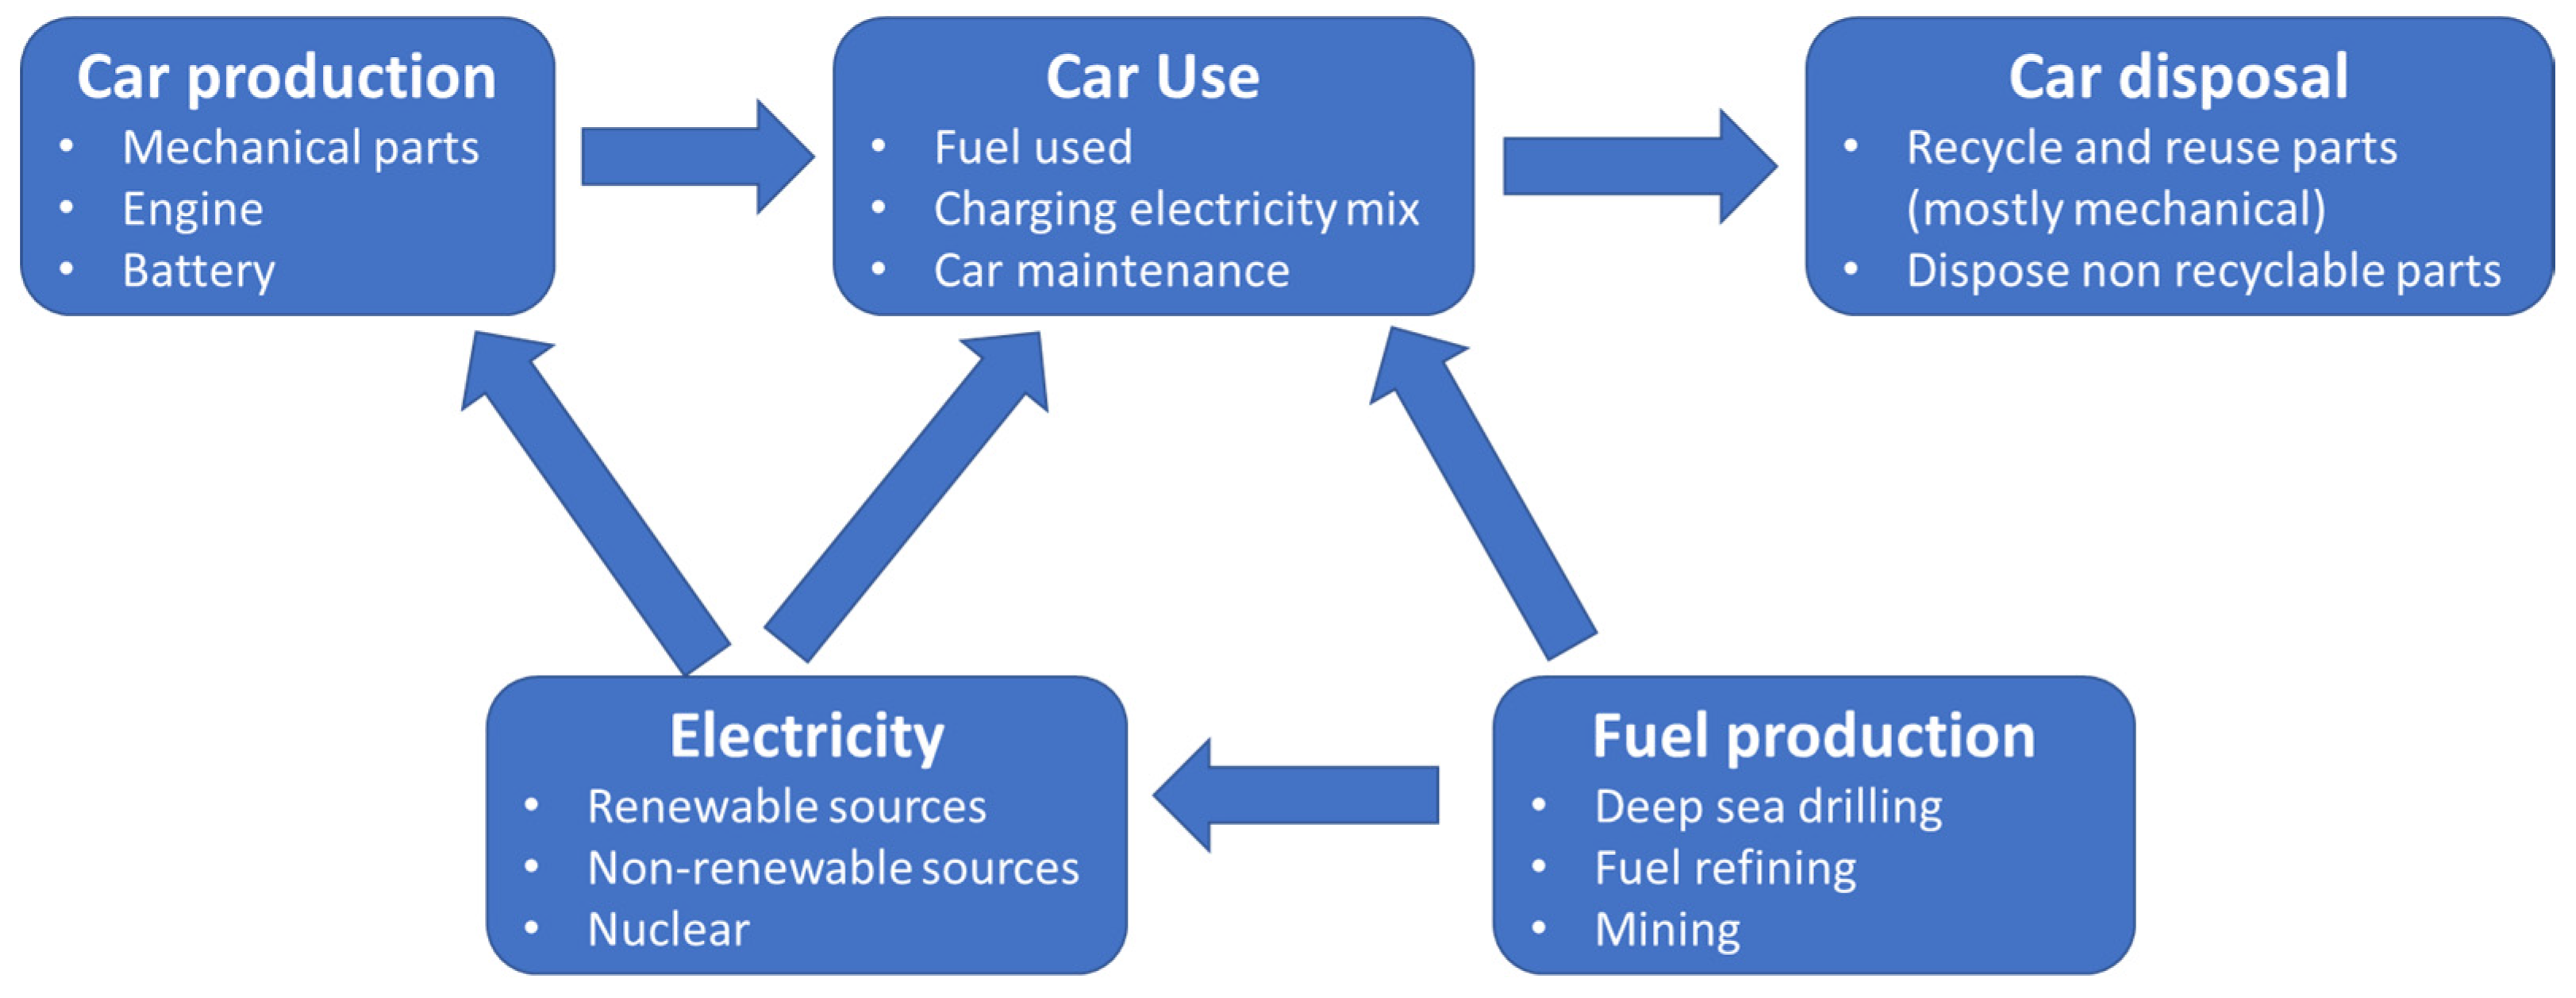
During its lifetime, a vehicle or a car can cause pollution at various stages. Figure 7 shows the interaction between the five stages. The five stages are as follows:
- Production: Emissions released during car manufacturing process. Emissions in this stage include emissions from manufacturing mechanical parts such as gears and engine, and chemical based parts such as batteries [28]. Both electric vehicles and hydrocarbon-based vehicles cause equal emissions at this stage [28]. In electric vehicles, although additional processes of mining of rare earth elements such as lithium and the lithium-based battery manufacturing process are involved. While lithium mining does not contribute to air pollution, the battery manufacturing process does cause air pollution [28]. However, the air pollution caused due to battery manufacturing process is usually far from the areas where lithium-based batteries will be used and the pollutants are released through a very tall stack, thereby having minimal impact in the area where cars are being used [28].
- Car use: When a car is being used, it can produce vehicular emissions through burning of hydrocarbon or through periodic maintenance work. In hydrocarbon-based vehicles, emissions are dependent on the quality of the hydrocarbon used as fuel, and of any electricity used during periodic maintenance work [28]. Three major types of hydrocarbon-based fuels used in Indian vehicles are diesel, petrol and Compressed Natural Gas (CNG) [29]. Among these, diesel and petrol vehicles have higher emissions than CNG cars. In a study published by Baidya et al. diesel cars emitted 2.72 g/km of CO, 1 g/km of NOx, and 0.19 g/km of PM [29]. The corresponding emissions from petrol cars were 2.72 g/km, 0.69 g/km and 0.06 g/km, while the CNG emissions were only 1.71 g/km, 0.3 g/km, and 0.01 g/km respectively. A similar study by Goel and Guttikunda suggested that these values have improved in the recent years, resulting in lower emissions from all vehicles [30]. The relative trend, however, was the same. SO2 emissions have been negligible in the over the past 15 years [30]. Electric vehicles do not have emissions in this stage [28].
- Car disposal: Mechanical parts of a hydrocarbon vehicle and an electrical vehicle cause equal recycling residues and emissions at end-of-life, mainly through municipal and hazardous waste incineration [28]. In an electric vehicle, disposal of its Li-ion battery causes additional concerns [28,31]. Today, a very small percentage of the lithium can be recycled [12].
- Fuel production: Fuels used in hydrocarbon vehicles and thermal power plants come from on shore or offshore oil drilling [28], but as these are located far from the urban area, the air pollution caused by the refineries does not contribute to the city’s air quality [32]. For hydrocarbon vehicles, the fuel refining process further causes air pollution [32].
- Electricity generation: Electricity can come from nuclear energy, renewable sources such as the Sun or wind, and non-renewable sources such as natural gas or coal [31]. An increase in electric vehicles will increase the demand for electricity, thereby increasing electricity generation. Depending on whether the incremental electricity is being produced from renewable resources or non-renewable resources, this additional electricity generation may result in additional air pollution [31].
From above discussion, it can be concluded that stage 2 (car use) and stage 5 (electricity generation) of vehicle lifecycle (Figure 7) are main levers that decrease and increase air pollution, respectively.
3.1. Types of Emissions
Depending on the type of vehicle (electric or hydrocarbon based), the emissions caused over the lifetime of the vehicle is different. In general, most common emissions can be classified in the following categories as shown in Figure 1.
- Non-exhaust emissions: These are the particulate emissions due to various road traffic-related processes due to abrasion, driving style and road surface dust [38,39,40]. The most important abrasion processes that result in direct PM emission are tire, brake, clutch and road surface wear [41,42]. In recent years, after the introduction of cleaner technology, non-exhaust emissions have been emitting almost the same amount of PM10 emissions as the exhaust emissions [4,43].
3.2. Electric Vehicle Adoption and Air Pollution
This section presents a review of case studies and simulations on net air quality impact of increasing electric vehicles and electricity generation in various parts of the world. Studies in the U.S. and India have shown that electric vehicles help in reducing air pollutant emissions and CO2 emissions in the long term [7,44] if the incremental load is supplied through non-emitting generation [44]. Largest PM reduction due to switching to electric vehicles occurs in urban areas [44]. Switching all passenger vehicles to electric vehicles without changing the energy mix in Yangtze River Delta region of China would reduce NOx, PM2.5 and volatile organic compound (VOC) by 10%, 0.2% and 7.8% respectively, but increase SO2 by 3.5% [18]. A change in the energy mix towards less carbon intensive power generation sources will further reduce air pollution [18]. In Madrid and Barcelona 40% EV conversion could result in more than 10% reduction in NOx, but will have limited impact on PM10 and PM2.5, and no increase in electric generation emissions [32]. In Taiwan, 100% EV penetration along with all additional power coming from thermal power plants can reduce CO, VOCs, NOx, O3 and PM2.5 pollution by 85%, 79%, 7% (net), 39% and 7.2% respectively, while increasing SO2 by 11% [45]. In Belgium, where nuclear energy is a large share of electricity mix, EVs will have a lower life cycle emissions of CO2, SO2, NOx and PM compared to petrol and diesel vehicles [31].
Based on the above, it can be concluded that adoption of electric vehicles reduces air pollution for most of the emissions. Greater the percentage of renewable energy in the electricity mix, greater is the reduction in air pollution. Thus, a region’s energy mix determines the intensity of air pollution reduction due to switching to electric vehicles in a region. However, as seen above, in case of fossil fuel based generation systems, SO2 is one of the emissions that increases with increased adoption of electric vehicles.
3.3. India’s Energy Mix
India’s currently installed capacity of 260 GW is primarily based on fossil fuel based [46] and even though India’s peak demand is only 140 GW, several parts of the country do not have access to electricity or face frequent outages [46]. India also has 10,000 GW and 2000 GW of solar and wind potential respectively [46]. The current Indian government has set an ambitious renewable energy development goal of installing 100 GW of solar power and 40 GW of wind power, respectively, by 2022 [46]. If successfully executed, India’s energy mix will be transformed with more than 25% of the energy coming from renewable sources by 2022 [46]. By 2030, 50% of India’s electricity could be coming from renewable sources [47]. In such a future, air quality impact of switching to electric vehicles will increase immensely as the electricity for charging the batteries will be coming from non-fossil fuel based sources.
4. Human Behavior Influences
India is one of the oldest countries in the world [48]. The joint family structure is the prevalent culture [49]. Dedicating one’s life to fulfilling responsibility for others (elders, children, other relatives, priests in society etc.) over individualistic pleasures has been an integral part of the Indian culture [50]. Traditional Indian culture is defined by strict social hierarchies and maintaining family’s status in the society is an important part of people’s lives [49]. Any policy that is implemented for vehicle options and usage should align with the social structure in India. A policy can only be successful if the duties of individual members of the family are not restricted.
New Delhi’s vehicular mix is unique because almost two-third of the vehicles on road are two-wheelers (Figure 2); while goods vehicles, that usually contribute much more to air pollution [24], constitute a small percentage of registered vehicles in New Delhi [6]. Table 1 summarizes sources of different types of vehicular emission, and the type of contributing vehicles in New Delhi [24].
As seen in Table 1, two wheelers are major contributors of most of the vehicular emission types in the New Delhi, followed by goods vehicles and four wheelers. Buses are responsible for most of the NOx and SO2 emissions [24], whereas autos and taxis are not contributing much to air pollution [24] because most of them have been converted to CNG, and the older taxis have been replaced by newer and more efficient ones [51]. As described in the previous sections, CNG vehicles have much lower emissions compared to diesel and petrol vehicles [29]. Although very few goods vehicles are registered in New Delhi [6], they are heavy contributors in several emission types. Moreover, commercial vehicles registered in the New Delhi area have to follow strict emission requirements and cause limited air pollution [24]. One reason for this anomaly is the high number of goods vehicles that travel to New Delhi from other states [24]. These trucks from other states do not use cleaner fuels as other states have more lenient emission regulations [24], and have a much lower operational cost. Low range of an EV and its higher cost are two of the main barriers of EV adoption in the world [52]. In New Delhi single charge driving range is less of a concern as the average daily driving distances of consumer owned four-wheelers and two-wheelers [3,8,24] are much less than the single charge driving range of today’s average electric vehicles [52]. Due to the high population density in New Delhi, carpooling is both feasible and acceptable in the society [9,23]. Several companies already offer daily cab services as employee benefit [9]. Therefore, switching to shared car services is not a behavior change for non-vehicle owners in New Delhi. The bigger challenge will be to incentivize existing four-wheeler and two-wheeler owners to carpool.
4.1. Suitability of Existing Two-Wheeler Owners to Electric Vehicles
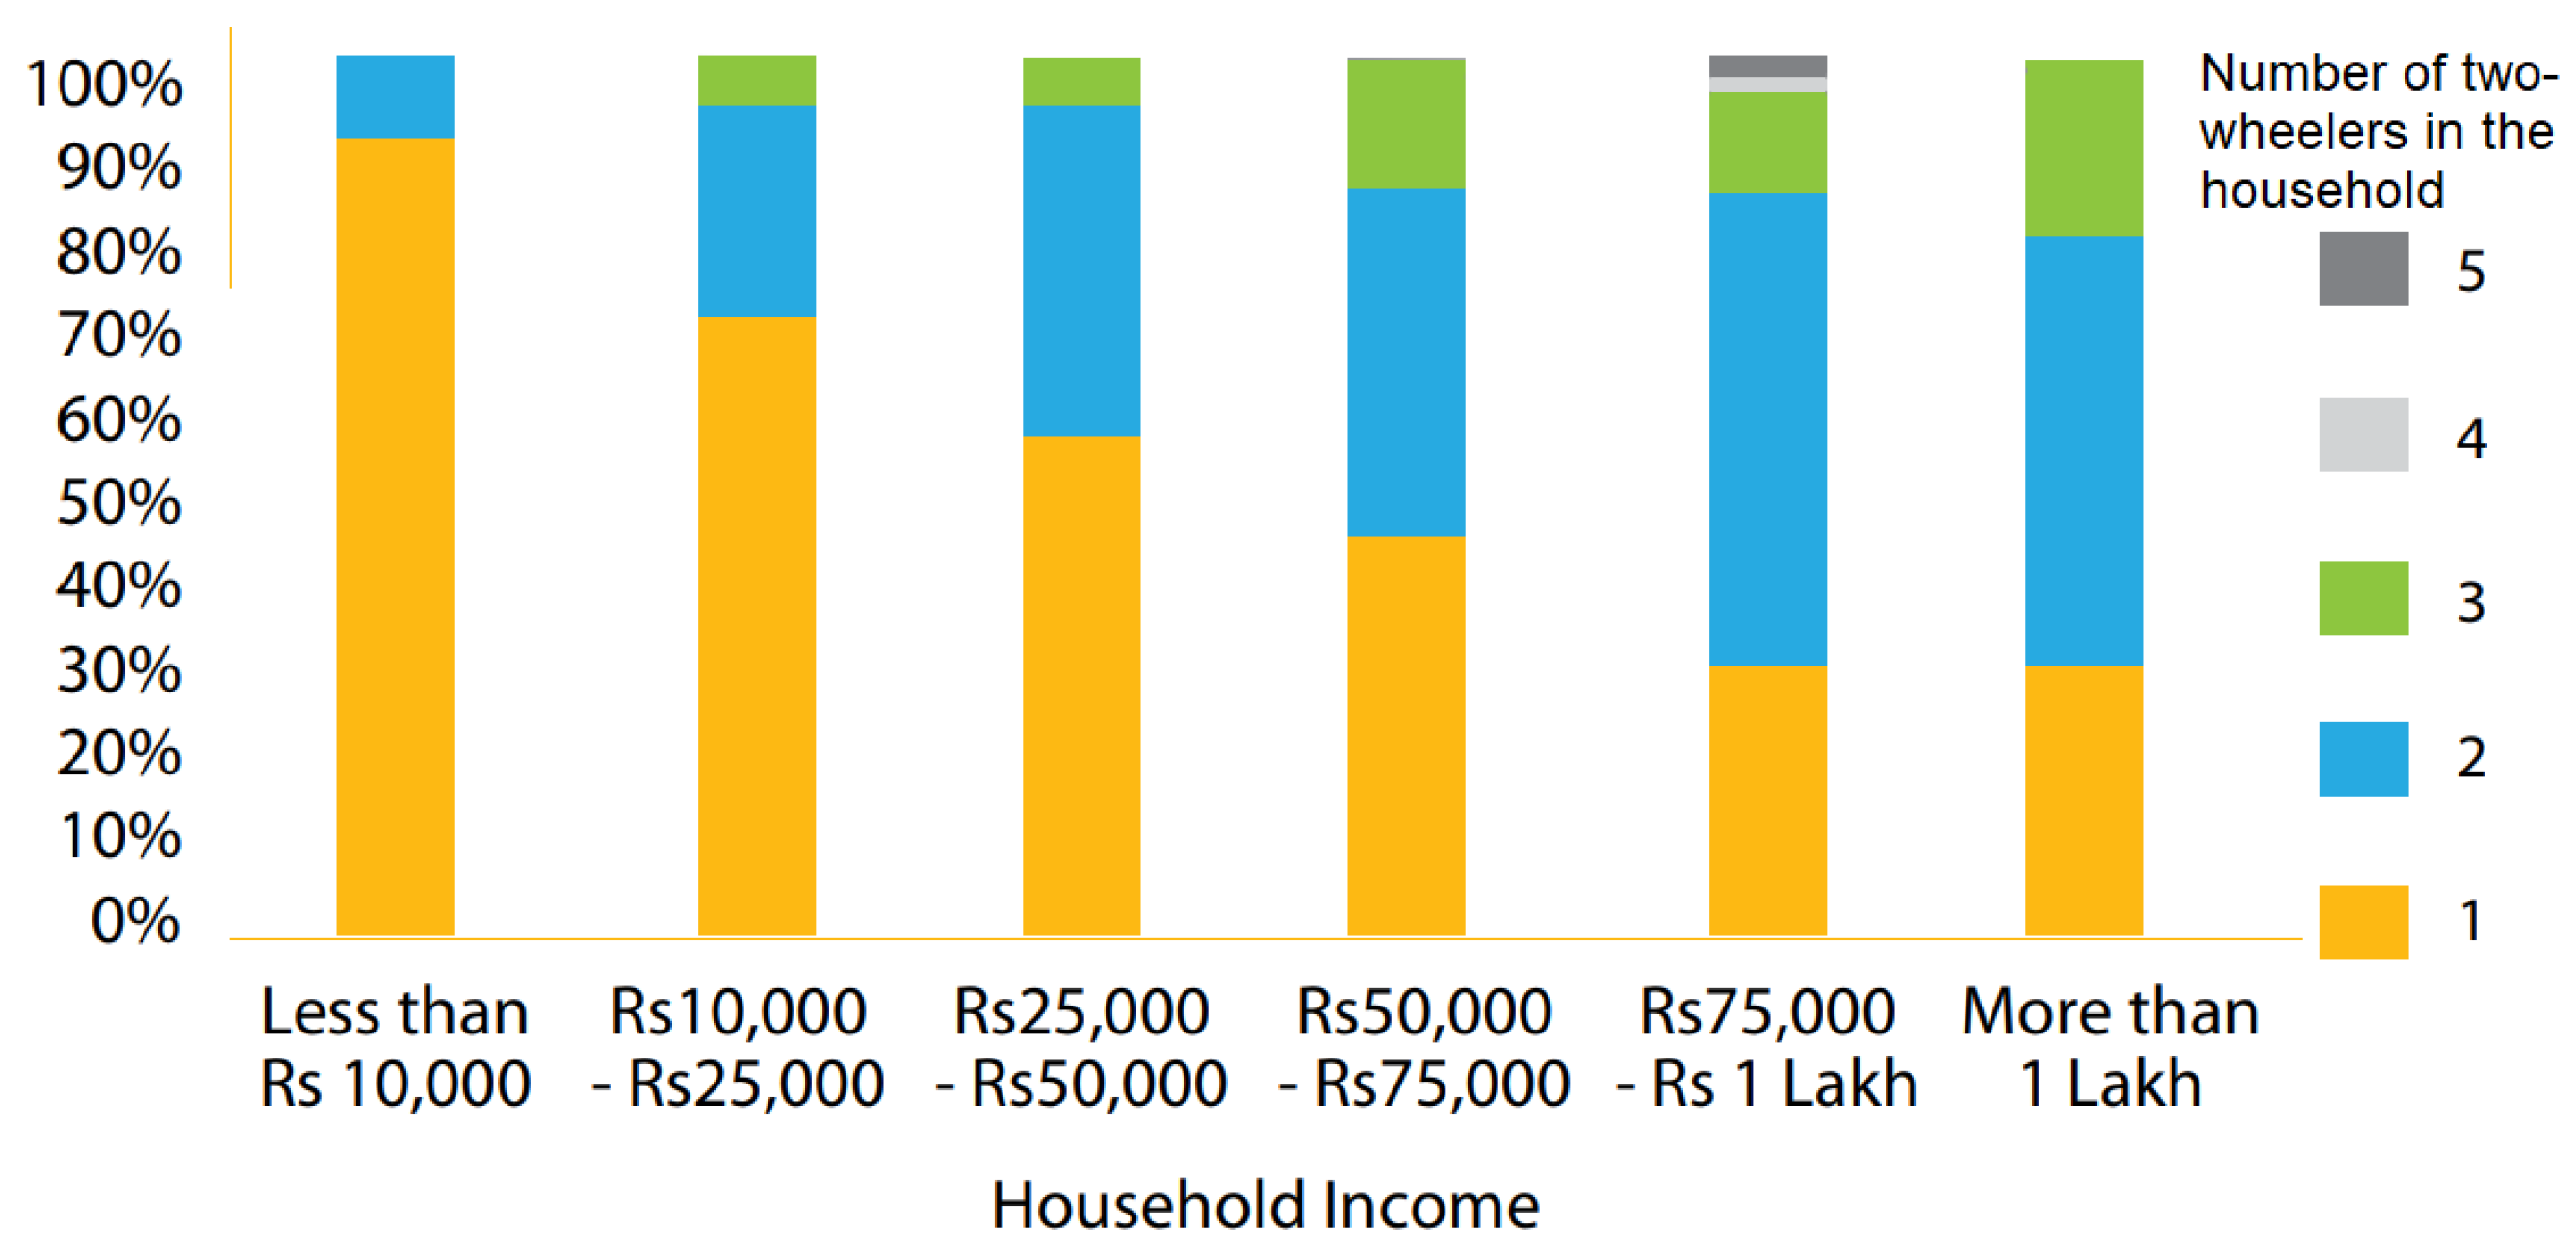
Typical owners of two-wheelers in India are from the lower socio-economic group [53]. Figure 8 shows the variation of household income and the number of two wheelers owned per household. It can be observed that the even very low monthly income households own at least one two-wheeler. They are mostly younger individuals with employment, and use the vehicle mostly for commuting to work or educational institute [53]. Most of the owners have one or two members in the household, who belong to a nuclear family, and not a traditional joint family. Also, the average monthly household income for two-wheeler owners is between Rs. 25,000 ($400) to Rs. 50,000 ($800), and most of the two-wheeler owners are first time vehicle buyers [53]. Additionally, prior to owning the two-wheeler, 81% of the owners used public transport or bicycle for their commute [53], and bought a two-wheeler to make their commute more comfortable [53]. These customers are also sensitive to fuel prices and will switch to lower cost modes of transport if fuel prices increase beyond a threshold [53].Therefore, primary users of two-wheelers are lower income group small households that have recently shifted from public transport because they feel using two-wheelers is making their lives more convenient. Hence, these customers would have continued using public transport if the public transportation was cheaper and convenient.
A major portion of New Delhi’s population relies on public transport such as Delhi Metro and local railways for their commute [54]. This is the part of the population that typically buys new two-wheelers when their household income increases [53]. As part of reducing air pollution through 100% EV adoption, the Indian government will need to incentivize this section of population to continue using public transport.
This socio-economic group, that mostly commutes through two-wheelers, is also the group that is most impacted by air pollution [55]. People who drive a car are mostly insulated from the air pollution but people who travel in buses or underground systems come in direct contact with polluted air [55]. Even if the people from this socio-economic group switch to electric two-wheelers, they will continue to be exposed to the pollutants emitted by other hydrocarbon-based vehicles. Based on the above discussion, the following characteristics of this socio-economic group makes it most suitable for being the first target segment of mobility as a service:
- This group is adversely affected by air pollution
- This group is likely to contribute to air pollution by switching to two-wheelers
- This group is cost sensitive and prefers lower cost options to commute to work
Due to the above reasons, health benefits of air pollution reduction through 100% EV adoption will only be realized, if this socio-economic group of population adopts mobility as a service.
4.2. Suitability of Existing Four-Wheeler Owners to Electric Vehicles
The second group that must be focused on is owners of four-wheelers as they are 32% of all vehicles on road (Figure 2), and are the second major cause in most of the emission types (Table 1). Some 46% of the carbon monoxide and 21% of NOx is released by these cars [3,56]. Owning a car and owning a house are considered status symbols [50] in India. The brand of the car owned determines people’s position in the social hierarchy [50]. Thus, one of the major behavior changes that needs to happen for conversion of this group to 100% EVs involves changing this mindset and encouraging people to use shared transportation services rather than buying a vehicle (Figure 5). Car-owners are more affluent people in society who are less impacted by air pollution [55]. These consumers are also habitual to more convenience and are less likely to use public transport [53]. Hence, this group of population will need more incentives to switch to mobility as a service. Several of these incentives will need to be social incentives rather than economic incentives as by giving up the ownership of their cars, these customers will be giving up a part of their social status.
5. Industrial Systems Dynamic Influences
Industries will play a big role in implementing India’s vision of 100% EVs by 2030 (Figure 4 and Figure 5). While several new industries will be created, several influential industries, such as oil and gas, will suffer [9]. Transport optimization algorithms, technology advancements and demand for lower battery prices will drive most of the innovation while implementing mobility as a service. Industries for mining Lithium, and manufacturing batteries will have to mature to ensure cheap supply of batteries [12].
Electricity demand will increase due to increased number of electric vehicles on the road [9]. Right now petrol and diesel are conveniently available at pumping stations, but in a country where power outages are common [46], electric vehicle may be deemed an unreliable source of transportation. Hence reliable electricity is essential for ensuring satisfactory service from electric vehicle. India does have ambitious goals for installing new electricity generation capacity [46], mostly renewable. Right now, renewable energy generation companies are being given several subsidies but renewable energy will need to be profitable for sustainable and reliable supply of electricity [9]. With increase in windfarm and photovoltaic (PV) installations, local ecosystem may suffer adversely causing further ecological imbalance [57].
Vehicle range is considered one of the biggest barriers preventing adoption of electric vehicles [9,23,58]. Thus, electric vehicle charging stations will need to be installed at several locations.
The biggest impact of electric vehicle though, will be due to increase in lithium mining and increased battery manufacturing [28].
Environmental Impact of Increasing Use of Lithium Batteries
Lithium ion batteries are the most common types of batteries currently being used for electric cars [28]. Increasing demand for electric cars will increase demand for lithium, and manufacturing of lithium-based batteries. An increase in demand for lithium will increase lithium mining, as less than 1% of lithium can be recycled today [12]. It is estimated that close to 40% lithium will be recyclable in 2050 [12] but the non-recyclable lithium will have detrimental impact on the environment. Lithium mining may also be limited in certain areas due to social or environmental issues surrounding the process of lithium extraction [12].
The manufacturing process for lithium based batteries too causes air pollution but as this pollution is caused at manufacturing sites, which are usually located farther from the densely populated areas where hydrocarbon based cars cause pollution today, the net air pollution in the populated location decreases [28]. A less polluting battery manufacturing process may be invented in future, further reducing air pollution [28]. But if a pollution reducing battery manufacturing process is not invented in future, air pollution due to this process may become an environmental concern [28]. Also, as the exhaust from this process is emitted through high stacks, these gases may cause an impact that is different from what we are used to seeing today [28].
6. Policy Recommendations
Based on natural system influences, adoption of electric vehicles reduces air pollution in a densely populated area like New Delhi. Hence, the policies focus on increasing electric vehicle adoption while minimizing the negative air pollution impact of increased electric vehicle adoption. Following are some of the policy recommendations:
- Reduce petrol and diesel based two-wheeler on the road: Two wheelers are a high percentage of vehicles on road (Figure 2) in number, and are major emitters of several air pollutants (Table 1). Most two-wheelers are sold to consumers who were earlier using public transport and want to make their daily commute easier [53]. These customers belong to a price sensitive socio-economic group [53]. Following two policies are recommended to achieve this goal:
- a)
- Offer subsidized shared mobility electric fleet service to this target segment: As this target segment is price sensitive, if subsidized and convenient shared mobility services are offered, these customers are very likely to switch to shared mobility [53]. As the shared mobility fleet is electric, air pollutants released in the ecosystem will be reduced.
- b)
- Sell two-wheeler electric vehicles to this target segment: As the target segment is price sensitive [53], this target segment will prefer electric two-wheelers over traditional two-wheelers if cheaper electric two wheelers are offered in the market. The government can subsidize the two-wheeler price to accelerate adoption.
- Reduce petrol or diesel based four-wheel vehicles on road: Four-wheeler owners belong to a relatively affluent society and are not as sensitive to price as the two-wheeler owners [55]. These customers must be incentivized by providing them with more convenience in their daily lives. Following two policies are recommended to achieve this goal:
- a)
- Dedicated roads for electric vehicles: Traffic jam is one of the biggest issues on Indian roads [23]. To attract four-wheeler owners, government should introduce a policy to dedicate certain roads only to electric-vehicle owners. This non-financial incentive will add to the four-wheeler owners’ convenience and will increase electric vehicle adoption in four-wheeler owners [58].
- b)
- Marketing campaign to make shared mobility socially acceptable in four-wheeler owner community: Government encourages existing four-wheeler owners to switch to shared mobility by incentivizing them with benefits such as recognition in local media. Awareness about benefits of electric vehicles increases adoption in the community [59]. Hence, people will switch to shared-mobility if they are aware of its benefits, and are being recognized in the society for adopting shared-mobility.
- Create warehouses outside cities and allow only EV-transported goods vehicles to enter the city. One of the major causes of air pollution in New Delhi is goods vehicles that travel [24] from cities outside New Delhi (Table 1). As part of this policy, government creates warehouses outside the city limits of New Delhi, where the population density is much higher, and allows only electric goods vehicles—that cause no air pollution—to enter the city. This will reduce the number of polluting vehicles entering New Delhi.
- Continue subsidizing renewable energy generation projects: Based on the discussion in sections above, electric vehicles produce less emissions only if the fuel mix is inclined towards renewable energy [31]. Therefore, to ensure that EV adoption reduces air pollution, more and more renewable energy generation sources should be set up. India has huge wind and solar resource availability [46] but the existing policy defines renewable goals only until 2022. The policy of promoting renewable resources must be continued beyond 2022 to attain a much higher contribution from renewable energy in India’s electricity mix as until 2022, only 25% of energy will be coming from renewable sources. Additionally, to accelerate the growth of these renewable resources, scalable energy storage solutions will be required along with smart grids.
- Ban battery manufacturing near New Delhi area: The increase in battery manufacturing sites is one of the major downsides of increasing electric vehicle adoption in the New Delhi area as the battery manufacturing process releases high amounts of air pollutants [11]. As the area around the New Delhi is an industrial area in close proximity to a region with high automobile demand [6], companies prefer to set up automobile related factories in this area. To ensure that air pollution is reduced in the New Delhi area, no battery manufacturing plants should be allowed to be set up in the area surrounding New Delhi until a cleaner battery manufacturing process is invented. This policy will still allow ecosystem to be polluted. The pollution will be in an area far from New Delhi. Measures may need to be taken to treat emissions in the area surrounding the manufacturing facility.
- Fund innovation in battery technology: To truly make electric vehicles non-polluting, innovations need to happen in battery manufacturing process [11]. Innovations and research also need to happen in other fields related to batteries—e.g., bi-directional charging and battery life—as these features are important for customer satisfaction and adoption of electric vehicles [60]. Government should fund research and organize conferences in this field as improved battery life will increase adoption of electric vehicles and reduced emission from battery manufacturing process will reduce total emissions into the ecosystem [58].
- Create grid discharging system to encourage businesses to work towards shared mobility vision: To encourage the businesses to start thinking about grid integration and to show the commitment towards the connected grid future, the government of India should allow electric vehicles to sell electricity back to the grid [9]. Availability of this option will encourage technological and business model innovations in the field, that will ultimately increase electric vehicle adoption [9]. Electric vehicle adoption also reduces the total energy required for mobility, thus reducing the amount of fuel used in the country [23]. Hence, this policy will ultimately lead to more sustainable growth of the mobility and the grid system by requiring future power plants to generate less energy than that needed today [23]. Enabling grid integration in a smart grid can also make the overall grid + transportation system more efficient [61]. Vehicles can charge using renewable generation at a location different from where they discharge. The time of charge and discharge can be controlled by a smart grid operator.
These seven policies complement each other in such a way that the whole system produces lower air pollution. Policies 1, 2 and 3 increase the number of electric vehicles by replacing the most polluting fleet of vehicles (Table 1) currently on the road. Policies 1 and 2 also encourage shared mobility, which reduces air pollution by reducing the number of vehicles on the road (Figure 6). Policy 4 ensures that the benefit of replacing hydrocarbon vehicles with electric vehicles is actually materialized by making sure that most of the energy for battery charging comes from renewable sources [31]. Policy 5 is more of a stop-gap arrangement that ensures that in the short term, air quality in the New Delhi area is improved. Policy 5 causes air pollution at a location farther from New Delhi area. Policy 6 fixes the short-term nature of Policy 5 by intensifying research to find ways to make battery manufacturing process less polluting. Policy 7 then attempts to enhance the impact of Policies 1 through 6 by accelerating integration of the grid and the shared mobility, which reduces the overall demand for energy [23]. Reducing overall energy generation results in further lowering air pollution. The caveat in these policies though is that they assume net automobile usage to stay at or below the current utilization level. This may change with changed public preferences or cheaper transportation options, because of which the policies recommended may not achieve their goals.
7. Conclusions
In this paper, we have discussed India’s policy of adopting 100% electric vehicle by 2030 and evaluated its impact on air pollution. We established that vehicular emission is one of the major contributors to air pollution in New Delhi and that the number of vehicles, along with vehicular pollution will continue to increase if no measures were taken. As the government has announced the goal to sell 100% EVs by 2030, multiple aspects including policy and behavioral changes that will be required are discussed in the paper. Based on the review, the following conclusions can be made
- Case studies on impact of EVs on air pollution in several countries showed an overall reduction in emissions
- It was found that the NOx emissions caused by vehicles can be reduced by 7–25%, depending on charging energy source, while CO and CO2 can be reduced by up to 85%, if the charging energy were to come from renewables
- If the charging energy comes from fossil fuels, SO2 emissions can increase by 11%
- Causal loop diagram of vehicular emission and an EV’s lifecycle emission suggested that emission during battery manufacturing process can negate any savings achieved by EVs, unless a better electricity generation source is used
- Two-wheelers, four-wheelers, and goods vehicles cause most of the air pollution in New Delhi area
- The incentives for vehicle owners need to be customized to suit their socio-economic needs
- Policies were recommended for different socio-economic classes, that increase electric vehicle adoption while minimizing the air pollution impact of new industries developed due to increased electric vehicle demand. These policies complement each other and are designed to work as a system.
The review and recommendations of this paper were developed for implementation in the Indian market, but are relevant for global acceptance of EVs.
Author Contributions
Rachana Vidhi and Prasanna Shrivastava reviewed the literature. Rachana Vidhi reviewed and wrote the portions specific to technology and emissions. Prasanna Shrivastava reviewed and wrote the portions specific to policy.
Conflicts of Interest
The authors declare no conflict of interest.
References
- Guttikunda, S.K.; Goel, R.; Pant, P. Nature of air pollution, emission sources, and management in the Indian cities. Atmos. Environ. 2014, 95, 501–510. [Google Scholar] [CrossRef]
- Rizwan, S.; Nongkynrih, B.; Gupta, S. Air pollution in Delhi: Its Magnitude and Effects on Health. Indian J. Community Med. 2013, 38, 4–8. [Google Scholar] [PubMed]
- Nagpure, A.S.; Gurjar, B.R. Development and evaluation of Vehicular Air Pollution Inventory model. Atmos. Environ. 2012, 59, 160–169. [Google Scholar] [CrossRef]
- Nagpure, A.S.; Gurjar, B.R.; Kumar, V.; Kumar, P. Estimation of exhaust and non-exhaust gaseous, particulate matter and air toxics emissions from on-road vehicles in Delhi. Atmos. Environ. 2016, 127, 118–124. [Google Scholar] [CrossRef]
- Goel, R.; Guttikunda, S.K. Role of urban growth, technology, and judicial interventions on vehicle exhaust emissions in Delhi for 1991–2014 and 2014–2030 periods. Environ. Dev. 2015, 14, 6–21. [Google Scholar] [CrossRef]
- Government of National Capital Territory of Delhi. Directorate of Economics and Statistics, DSH (Delhi Statistical Handbook). 2016. Available online: http://www.delhi.gov.in/ (accessed on 30 November 2017).
- Dhar, S.; Pathak, M.; Shukla, P.R. Electric vehicles and India’s low carbon passenger transport: A long-term co-benefits assessment. J. Clean. Prod. 2017, 146, 139–148. [Google Scholar] [CrossRef]
- Mishra, D.; Goyal, P. Estimation of vehicular emissions using dynamic emission factors: A case study of Delhi, India. Atmos. Environ. 2014, 98, 1–7. [Google Scholar] [CrossRef]
- NITI Aayog and Rocky Mountain Institute. India Leaps Ahead: Transformative Mobility Solutions for All. 2017. Available online: https://www.rmi.org/insights/reports/transformative_mobility_solutions_india (accessed on 30 November 2017).
- The Hindu. India to Sell only Electric Cars by 2030: Piyush Goyal. 18 August 2017. Available online: http://www.thehindu.com/news/national/karnataka/india-to-sell-only-electric-vehicles-by-2030-piyush-goyal/article19516175.ece (accessed on 3 December 2017).
- Notter, D.A.; Gauch, M.; Widmer, R.; Wager, P.; Stamp, A.; Zah, R.; Althaus, H.J. Contribution of Li-Ion Batteries to the Environmental Impact of Electric Vehicles. Environ. Sci. Technol. 2010, 44, 6550–6556. [Google Scholar] [CrossRef] [PubMed]
- Mohr, S.H.; Mudd, G.M.; Giurco, D. Lithium Resources and Production: Critical Assessment and Global Projections. Minerals 2012, 2, 65–84. [Google Scholar] [CrossRef]
- Wang, Q.; Liu, W.; Yuan, X.; Tang, H.; Tang, Y.; Wang, M.; Zuo, J.; Song, Z.; Sun, J. Environmental impact analysis and process optimization of batteries based on life cycle assessment. J. Clean. Prod. 2018, 174, 1262–1273. [Google Scholar] [CrossRef]
- Deng, Y.; Li, J.; Li, T.; Gao, X.; Yuan, C. Life cycle assessment of lithium sulfur battery for electric vehicles. J. Power Sources 2017, 343, 284–295. [Google Scholar] [CrossRef]
- Huo, H.; Cai, H.; Zhang, Q.; Liu, F.; He, K. Life-cycle assessment of greenhouse gas and air emissions of electric vehicles: A comparison between China and the U.S. Atmos. Environ. 2015, 108, 107–116. [Google Scholar] [CrossRef]
- Liang, Y.; Su, J.; Xi, B.; Yu, Y.; Ji, D.; Sun, Y.; Cui, C.; Zhu, J. Life cycle assessment of lithium-ion batteries for greenhouse gas emissions. Resour. Conserv. Recycl. 2017, 117, 285–293. [Google Scholar] [CrossRef]
- Peters, J.F.; Baumann, M.; Zimmermann, B.; Braun, J.; Weil, M. The environmental impact of Li-Ion batteries and the role of key parameters—A review. Renew. Sustain. Energy Rev. 2017, 67, 491–506. [Google Scholar] [CrossRef]
- Ke, W.; Zhang, S.; Wu, Y.; Zhao, B.; Wang, S.; Hao, J. Assessing the Future Vehicle Fleet Electrification: The Impacts on Regional and Urban Air Quality. Environ. Sci. Technol. 2017, 51, 1007–1016. [Google Scholar] [CrossRef] [PubMed]
- Mishra, A. Achieving Energy Security in Country: Insights Based on Consumption of Petroleum Products; Niti Aayog: New Delhi, India, 2017.
- Govt. To Grant Incentives to Cities for Faster Adoption of Electric Vehicles under FAME India Scheme. 2017; p. 42. Available online: https://inc42.com/buzz/electric-vehicles-incentives-fame-india/ (accessed on 12 December 2017).
- The Times of India. Niti Aayog to Make Policy for Electric Vehicles. 2018. Available online: https://timesofindia.indiatimes.com/business/india-business/niti-aayog-to-make-policy-for-electric-vehicles/articleshow/62422235.cms (accessed on 12 February 2018).
- Indian Express. Boost for Electric and Hybrid Cars with Rs 1.5 Lakh Subsidy. Available online: http://indianexpress.com/article/business/companies/boost-for-electric-and-hybrid-cars-with-rs-1-5-lakh-subsidy/ (accessed on 12 February 2018).
- McKinsey & Company. The Future of Mobility in India: Challenges & Opportunities for the Auto Component Industry; McKinsey & Company: New York, NY, USA, 2017. [Google Scholar]
- Nagpure, A.S.; Sharma, K.; Gurjar, B.R. Traffic induced emission estimates and trends (2000–2005) in megacity Delhi. Urban Clim. 2013, 4, 61–73. [Google Scholar] [CrossRef]
- Çapraz, Ö.; Efe, B.; Deniz, A. Study on the association between air pollution and mortality in İstanbul, 2007–2012. Atmos. Pollut. Res. 2016, 7, 147–154. [Google Scholar] [CrossRef]
- Fenger, J. Air pollution in the last 50 years—From local to global. Atmos. Environ. 2009, 43, 13–22. [Google Scholar] [CrossRef]
- Pedersen, M.; Stayner, L.; Slama, R.; Sørensen, M.; Figueras, F.; Nieuwenhuijsen, M.J.; Raaschou-Nielsen, O.; Dadvand, P. Ambient Air Pollution and Pregnancy-Induced Hypertensive Disorders. Hypertension 2014, 64, 494–500. [Google Scholar] [CrossRef] [PubMed]
- Girardi, P.; Gargiulo, A.; Brambilla, P.C. A comparative LCA of an electric vehicle and an internal combustion engine vehicle using the appropriate power mix: The Italian case study. Int. J. Life Cycle Assess. 2015, 20, 1127–1142. [Google Scholar] [CrossRef]
- Baidya, S.; Borken-Kleefeld, J. Atmospheric emissions from road transportation in India. Energy Policy 2009, 37, 3812–3822. [Google Scholar] [CrossRef]
- Goel, R.; Guttikunda, S.K. Evolution of on-road vehicle exhaust emissions in Delhi. Atmos. Environ. 2015, 105, 78–90. [Google Scholar] [CrossRef]
- Rangaraju, S.; De Vroey, L.; Messagie, M.; Mertens, J.; Van Mierlo, J. Impacts of electricity mix, charging profile, and driving behavior on the emissions performance of battery electric vehicles: A Belgian case study. Appl. Energy 2015, 148, 496–505. [Google Scholar] [CrossRef]
- Soret, A.; Guevara, M.; Baldasano, J.M. The potential impacts of electric vehicles on air quality in the urban areas of Barcelona and Madrid (Spain). Atmos. Environ. 2014, 99, 51–63. [Google Scholar] [CrossRef]
- Kota, S.H.; Zhang, H.; Chen, G.; Schade, G.W.; Ying, Q. Evaluation of on-road vehicle CO and NOx National Emission Inventories using an urban-scale source-oriented air quality model. Atmos. Environ. 2014, 85, 99–108. [Google Scholar] [CrossRef]
- Pandey, A.; Venkataraman, C. Estimating emissions from the Indian transport sector with on-road fleet composition and traffic volume. Atmos. Environ. 2014, 98, 123–133. [Google Scholar] [CrossRef]
- Environmental Protection Agency (EPA). Nonroad Evaporative Emission Rates NR-012d; EPA: Washington, DC, USA, 2010.
- Liu, H.; Man, H.; Tschantz, M.; Wu, Y.; He, K.; Hao, J. VOC from Vehicular Evaporation Emissions: Status and Control Strategy. Environ. Sci. Technol. 2015, 49, 14424–14431. [Google Scholar] [CrossRef] [PubMed]
- Srivastava, A.; Majumdar, D. Emission inventory of evaporative emissions of VOCs in four metro cities in India. Environ. Monit. Assess. 2008, 160, 315–322. [Google Scholar] [CrossRef] [PubMed]
- Penkała, M.; Ogrodnik, P.; Rogula-Kozłowska, W. Particulate Matter from the Road Surface Abrasion as a Problem of Non-Exhaust Emission Control. Environments 2018, 5, 9. [Google Scholar] [CrossRef]
- Thorpe, A.; Harrison, R.M. Sources and properties of non-exhaust particulate matter from road traffic: A review. Sci. Total Environ. 2008, 400, 270–282. [Google Scholar] [CrossRef] [PubMed]
- Gallus, J.; Kirchner, U.; Vogt, R.; Benter, T. Impact of driving style and road grade on gaseous exhaust emissions of passenger vehicles measured by a Portable Emission Measurement System (PEMS). Transp. Res. Part D Transp. Environ. 2017, 52, 215–226. [Google Scholar] [CrossRef]
- Grigoratos, T.; Martini, G. Brake wear particle emissions: A review. Environ. Sci. Pollut. Res. 2015, 22, 2491–2504. [Google Scholar] [CrossRef] [PubMed] [Green Version]
- Kim, W.-G.; Kim, C.-K.; Lee, J.-T.; Kim, J.-S.; Yun, C.-W.; Yook, S.-J. Fine particle emission characteristics of a light-duty diesel vehicle according to vehicle acceleration and road grade. Transp. Res. Part D Transp. Environ. 2017, 53, 428–439. [Google Scholar] [CrossRef]
- Pant, P.; Harrison, R.M. Estimation of the contribution of road traffic emissions to particulate matter concentrations from field measurements: A review. Atmos. Environ. 2013, 77, 78–97. [Google Scholar] [CrossRef]
- Nopmongcol, U.; Grant, J.; Knipping, E.; Alexander, M.; Schurhoff, R.; Young, D.; Jung, J.; Shah, T.; Yarwood, G. Air Quality Impacts of Electrifying Vehicles and Equipment Across the United States. Environ. Sci. Technol. 2017, 51, 2830–2837. [Google Scholar] [CrossRef] [PubMed]
- Li, N.; Chen, J.P.; Tsai, I.C.; He, Q.; Chi, S.Y.; Lin, Y.C.; Fu, T.M. Potential impacts of electric vehicles on air quality in Taiwan. Sci. Total Environ. 2016, 566–567, 919–928. [Google Scholar] [CrossRef] [PubMed]
- Niti Aayog. Toward Accelerated Renewable Electricity Deployment. 2015. Available online: http://shaktifoundation.in/wp-content/uploads/2014/02/Report-on-Indias-RE-Roadmap-2030-full-report-web2.pdf (accessed on 30 November 2017).
- Jhunjhunwala, A.; Kaur, P. Preparing for High-Mix of Renewables in India’s Power Generation. Technol. Econ. Smart Grids Sustain. Energy 2017, 2, 11. [Google Scholar] [CrossRef]
- Wikipedia. Delhi. Available online: https://en.wikipedia.org/wiki/Delhi (accessed on 13 December 2017).
- Wikipedia. Culture of India. Available online: https://en.wikipedia.org/wiki/Culture_of_India (accessed on 13 December 2017).
- Waldman, A. In Today’s India, Status Comes with Four Wheels. 2015. Available online: http://www.nytimes.com/2005/12/05/world/asia/in-todays-india-status-comes-with-four-wheels.html (accessed on 13 December 2017).
- Biswas, S.R. City Taxi Scheme 2015; Transport Department, Government of NCT of Delhi: Delhi, India, 2015.
- Langbroek, J.H.M.; Franklin, J.P.; Susilo, Y.O. The effect of policy incentives on electric vehicle adoption. Energy Policy 2016, 94, 94–103. [Google Scholar] [CrossRef]
- Embarq India. Motorized Two-Wheelers in Indian Cities: A Case Study the City of Pune. 2014. Available online: http://wricitiesindia.org/sites/default/files/MTW.pdf (accessed on 30 November 2017).
- Doll, C.N.H.; Balaban, O. A methodology for evaluating environmental co-benefits in the transport sector: Application to the Delhi metro. J. Clean. Prod. 2013, 58, 61–73. [Google Scholar] [CrossRef]
- Rivas, I.; Kumar, P.; Hagen-Zanker, A. Exposure to air pollutants during commuting in London: Are there inequalities among different socio-economic groups? Environ. Int. 2017, 101, 143–157. [Google Scholar] [CrossRef] [PubMed]
- Gurjar, B.R.; Ravindra, K.; Nagpure, A.S. Air pollution trends over Indian megacities and their local-to-global implications. Atmos. Environ. 2016, 142, 475–495. [Google Scholar] [CrossRef]
- Lintott, P.R.; Richardson, S.M.; Hosken, D.J.; Fensome, S.A.; Mathews, F. Ecological impact assessments fail to reduce risk of bat casualties at wind farms. Curr. Biol. 2016, 26, R1135–R1136. [Google Scholar] [CrossRef] [PubMed]
- Kim, S.; Lee, J.; Lee, C. Does Driving Range of Electric Vehicles Influence Electric Vehicle Adoption? Sustainability 2017, 9, 1783. [Google Scholar] [CrossRef]
- Ahmadi, L.; Croiset, E.; Elkamel, A.; Douglas, P.L.; Entchev, E.; Abdul-Wahab, S.A.; Yazdanpanah, P. Effect of socio-economic factors on EV/HEV/PHEV adoption rate in Ontario. Technol. Forecast. Soc. Chang. 2015, 98, 93–104. [Google Scholar] [CrossRef]
- Adnan, N.; Nordin, S.M.; Rahman, I.; Vasant, P.M.; Noor, A. A comprehensive review on theoretical framework-based electric vehicle consumer adoption research. Int. J. Energy Res. 2017, 41, 317–335. [Google Scholar] [CrossRef]
- Ghatikar, G.; Ahuja, A.; Pillai, R.K. Battery Electric Vehicle Global Adoption Practices and Distribution Grid Impacts. Technol. Econ. Smart Grids Sustain. Energy 2017, 2, 19. [Google Scholar] [CrossRef]

Figure 2.
Registered vehicles in New Delhi.

Figure 3.
India’s strategy to reduce vehicular emission—A whole system approach to mobility transformation [9].
Figure 3.
India’s strategy to reduce vehicular emission—A whole system approach to mobility transformation [9].

Figure 4.
Factors that determine electric vehicle (EV) adoption [9].
Figure 4.
Factors that determine electric vehicle (EV) adoption [9].
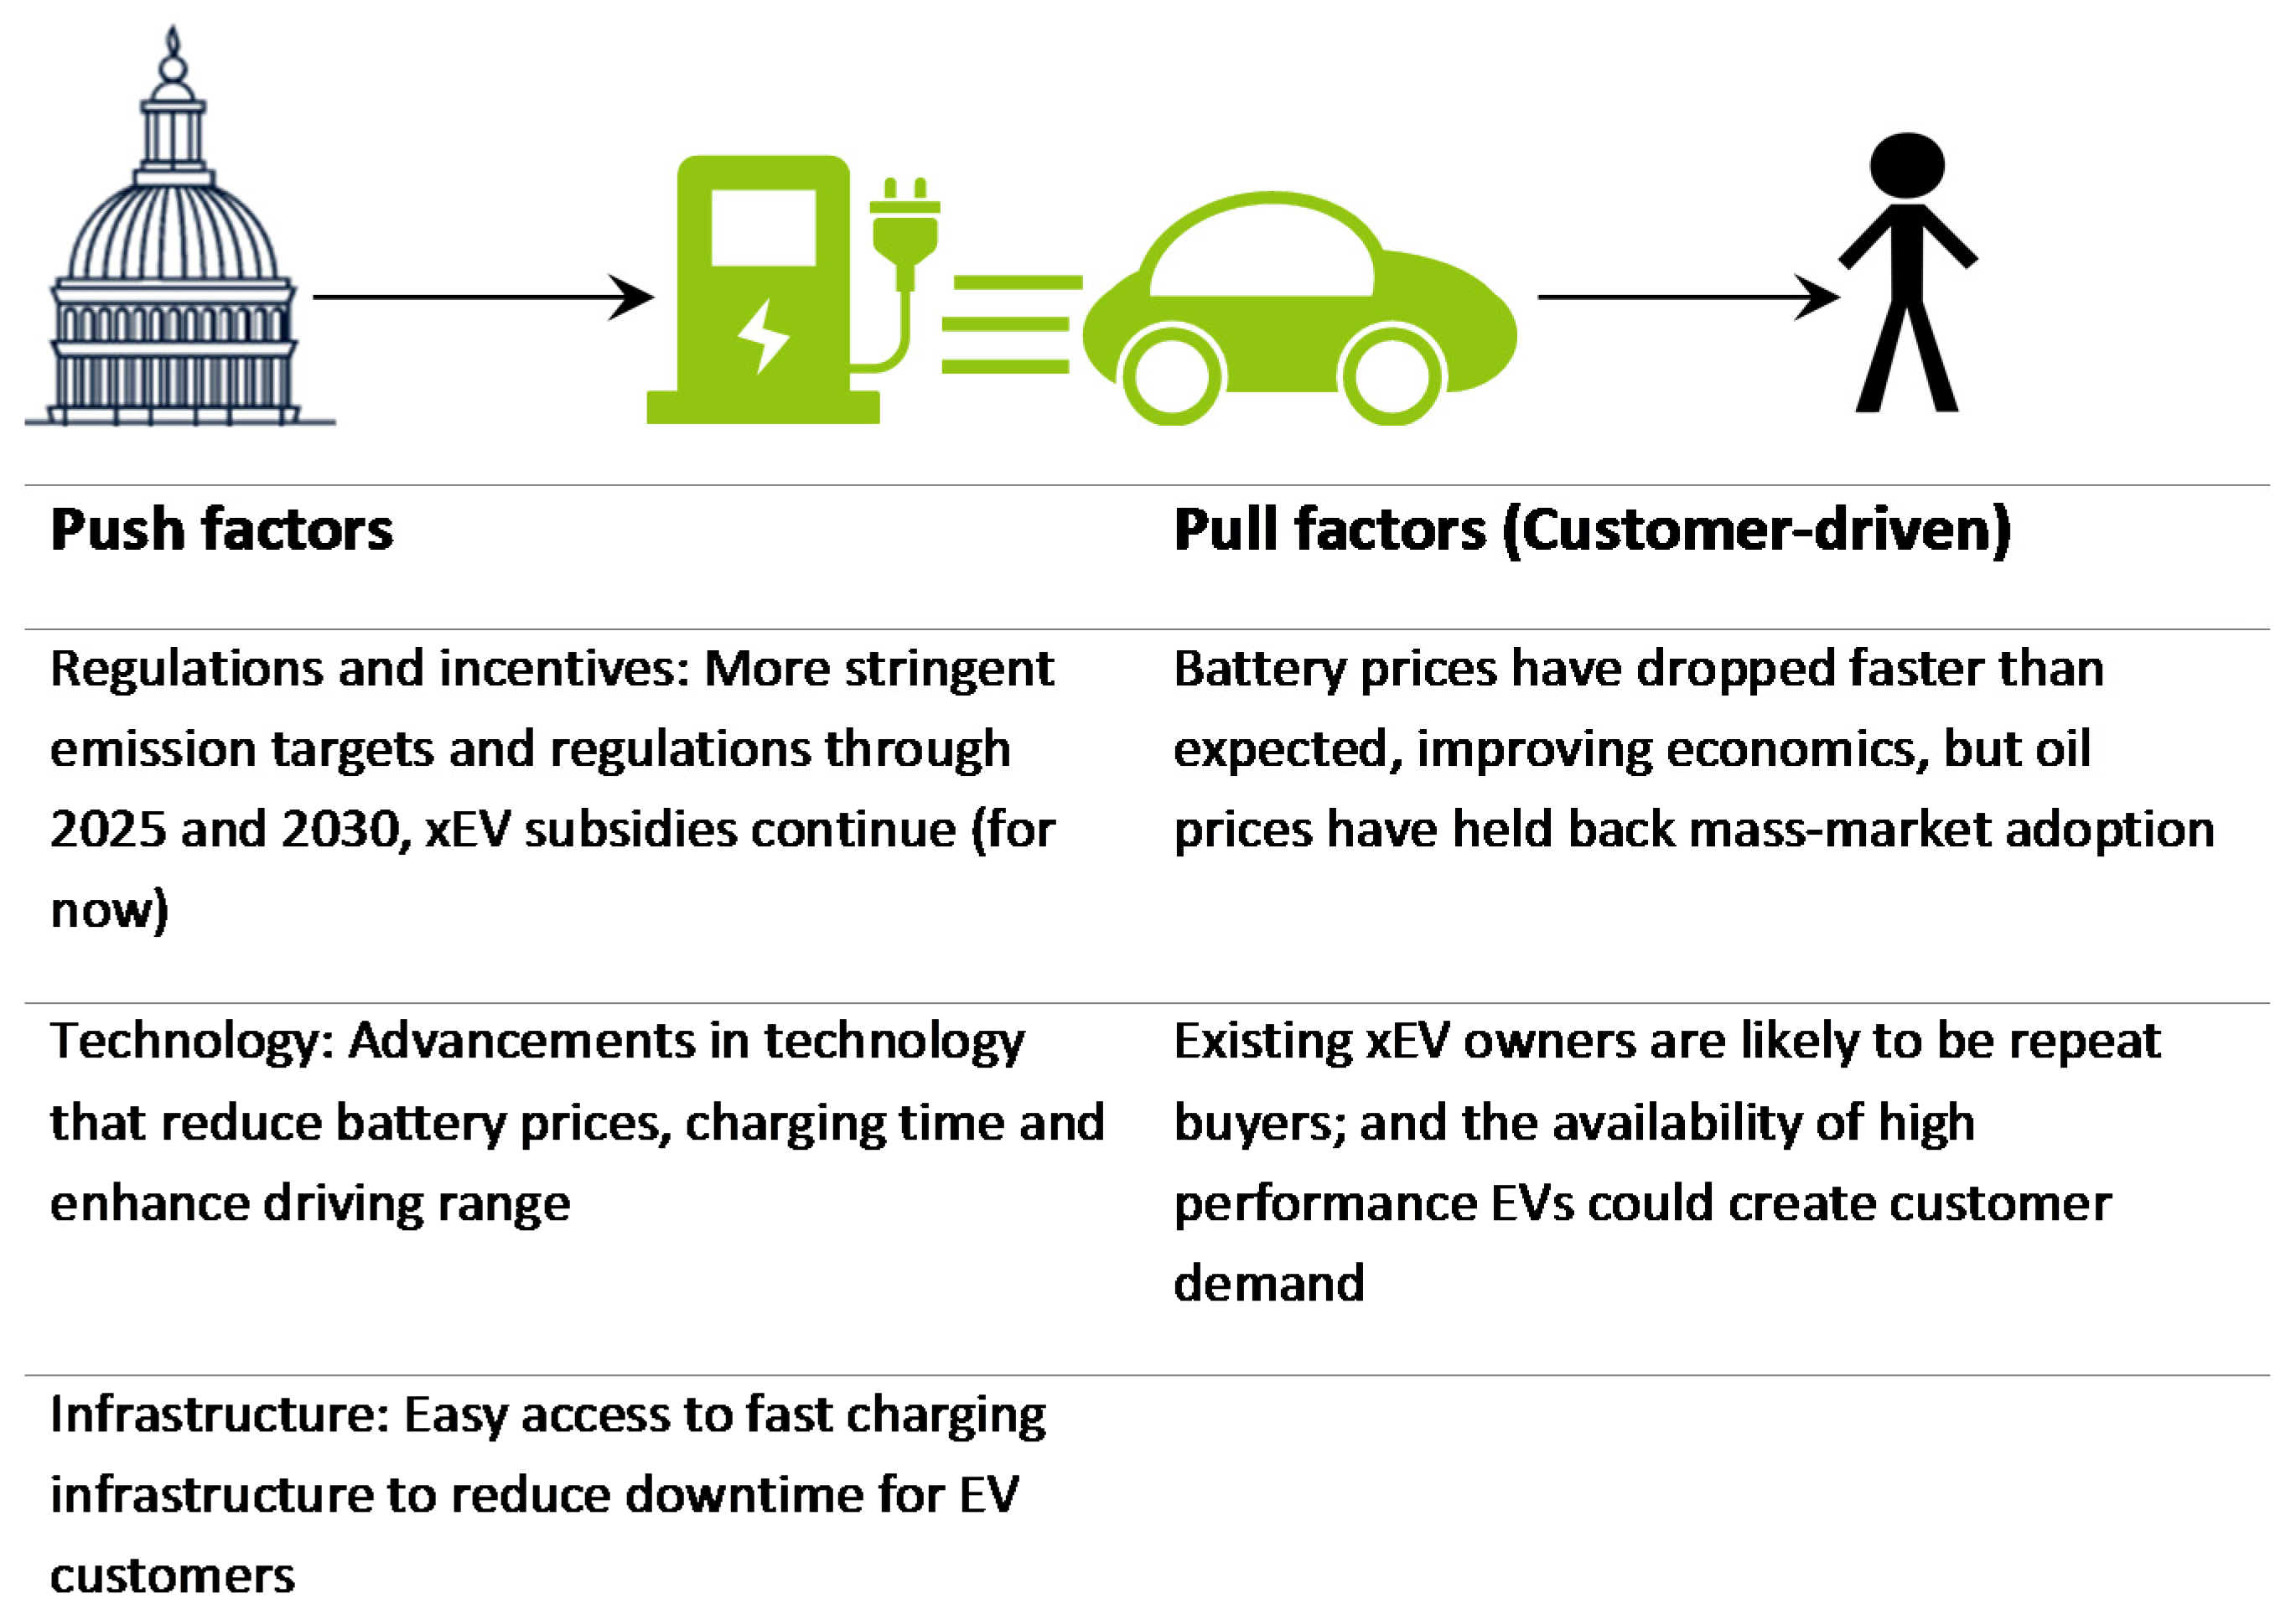
Figure 5.
Roadblocks for 100% EV adoption.

Figure 6.
Causal loop diagram for vehicular emission.

Figure 7.
Sources of emission in life cycle of a car.

Figure 8.
Two-wheeler owners’ monthly household income and household size [53].
Figure 8.
Two-wheeler owners’ monthly household income and household size [53].


Table 1.
Emissions from transport sector in New Delhi.
| Vehicle | CO2 | CO | HC | PM | NOx | SO2 | VOC | Pb |
|---|---|---|---|---|---|---|---|---|
| Four-wheeler | High | Medium | Low | Low | Low | Medium | High | High |
| Two-wheeler | Medium | High | High | High | Low | Medium | High | High |
| Autos, Taxis | Low | Low | Low | Low | Low | Low | Low | Low |
| Buses | Low | Low | Low | Low | High | High | Low | Low |
| Goods Vehicle | High | Medium | Low | Medium | High | High | Low | Low |
© 2018 by the authors. Licensee MDPI, Basel, Switzerland. This article is an open access article distributed under the terms and conditions of the Creative Commons Attribution (CC BY) license (http://creativecommons.org/licenses/by/4.0/).
Share and Cite
MDPI and ACS Style
Vidhi, R.; Shrivastava, P. A Review of Electric Vehicle Lifecycle Emissions and Policy Recommendations to Increase EV Penetration in India. Energies 2018, 11, 483. https://doi.org/10.3390/en11030483
AMA Style
Vidhi R, Shrivastava P. A Review of Electric Vehicle Lifecycle Emissions and Policy Recommendations to Increase EV Penetration in India. Energies. 2018; 11(3):483. https://doi.org/10.3390/en11030483
Chicago/Turabian StyleVidhi, Rachana, and Prasanna Shrivastava. 2018. "A Review of Electric Vehicle Lifecycle Emissions and Policy Recommendations to Increase EV Penetration in India" Energies 11, no. 3: 483. https://doi.org/10.3390/en11030483
Note that from the first issue of 2016, this journal uses article numbers instead of page numbers. See further details here.