A Load Flow Analysis for AC/DC Hybrid Distribution Network Incorporated with Distributed Energy Resources for Different Grid Scenarios


Abstract
:1. Introduction
2. VSC Station Model and Operation Modes
2.1. Types of VSC
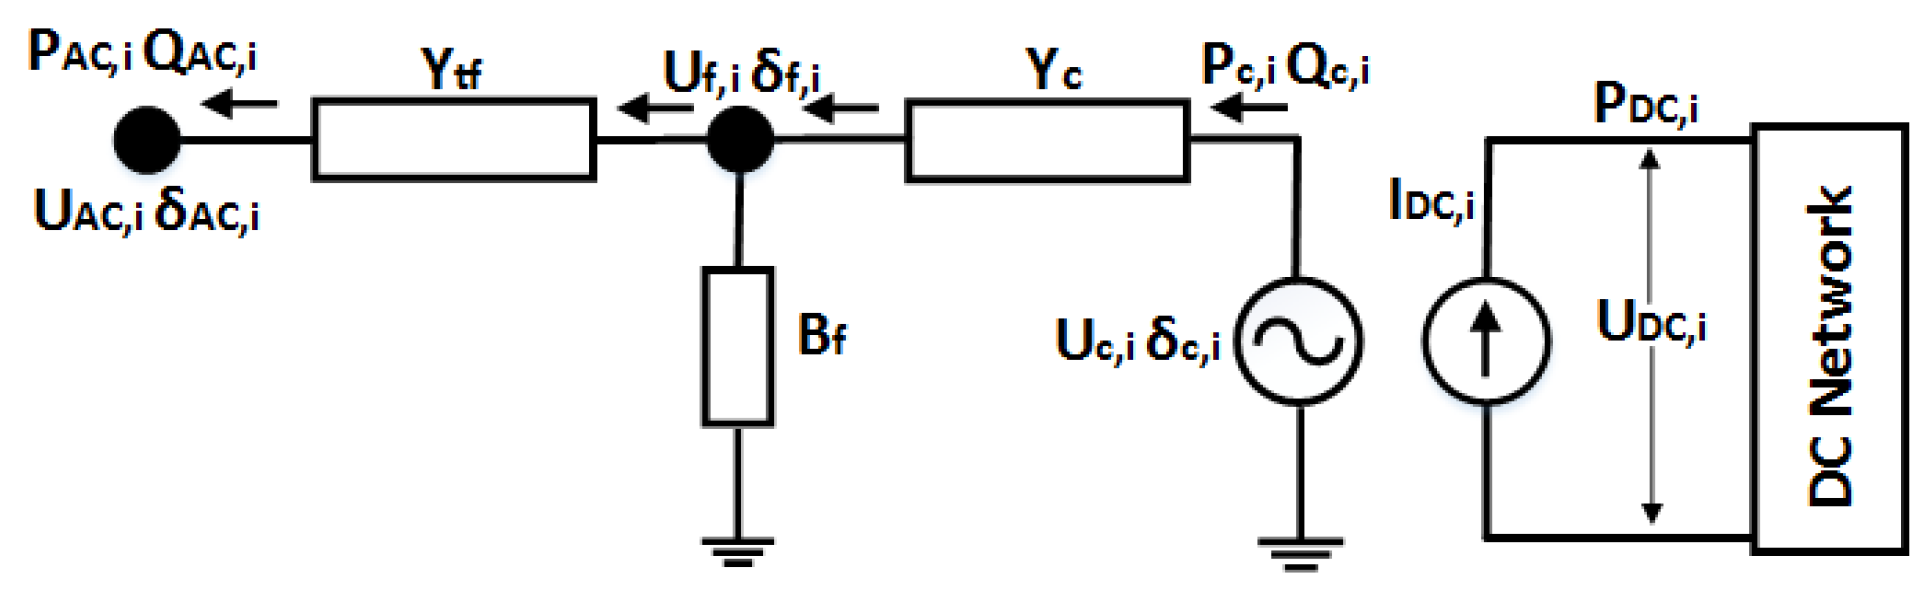
2.2. VSC-MTDC Power Injection Modeling and Operation
2.3. Modeling Converter Losses
2.4. Converter Control Modes
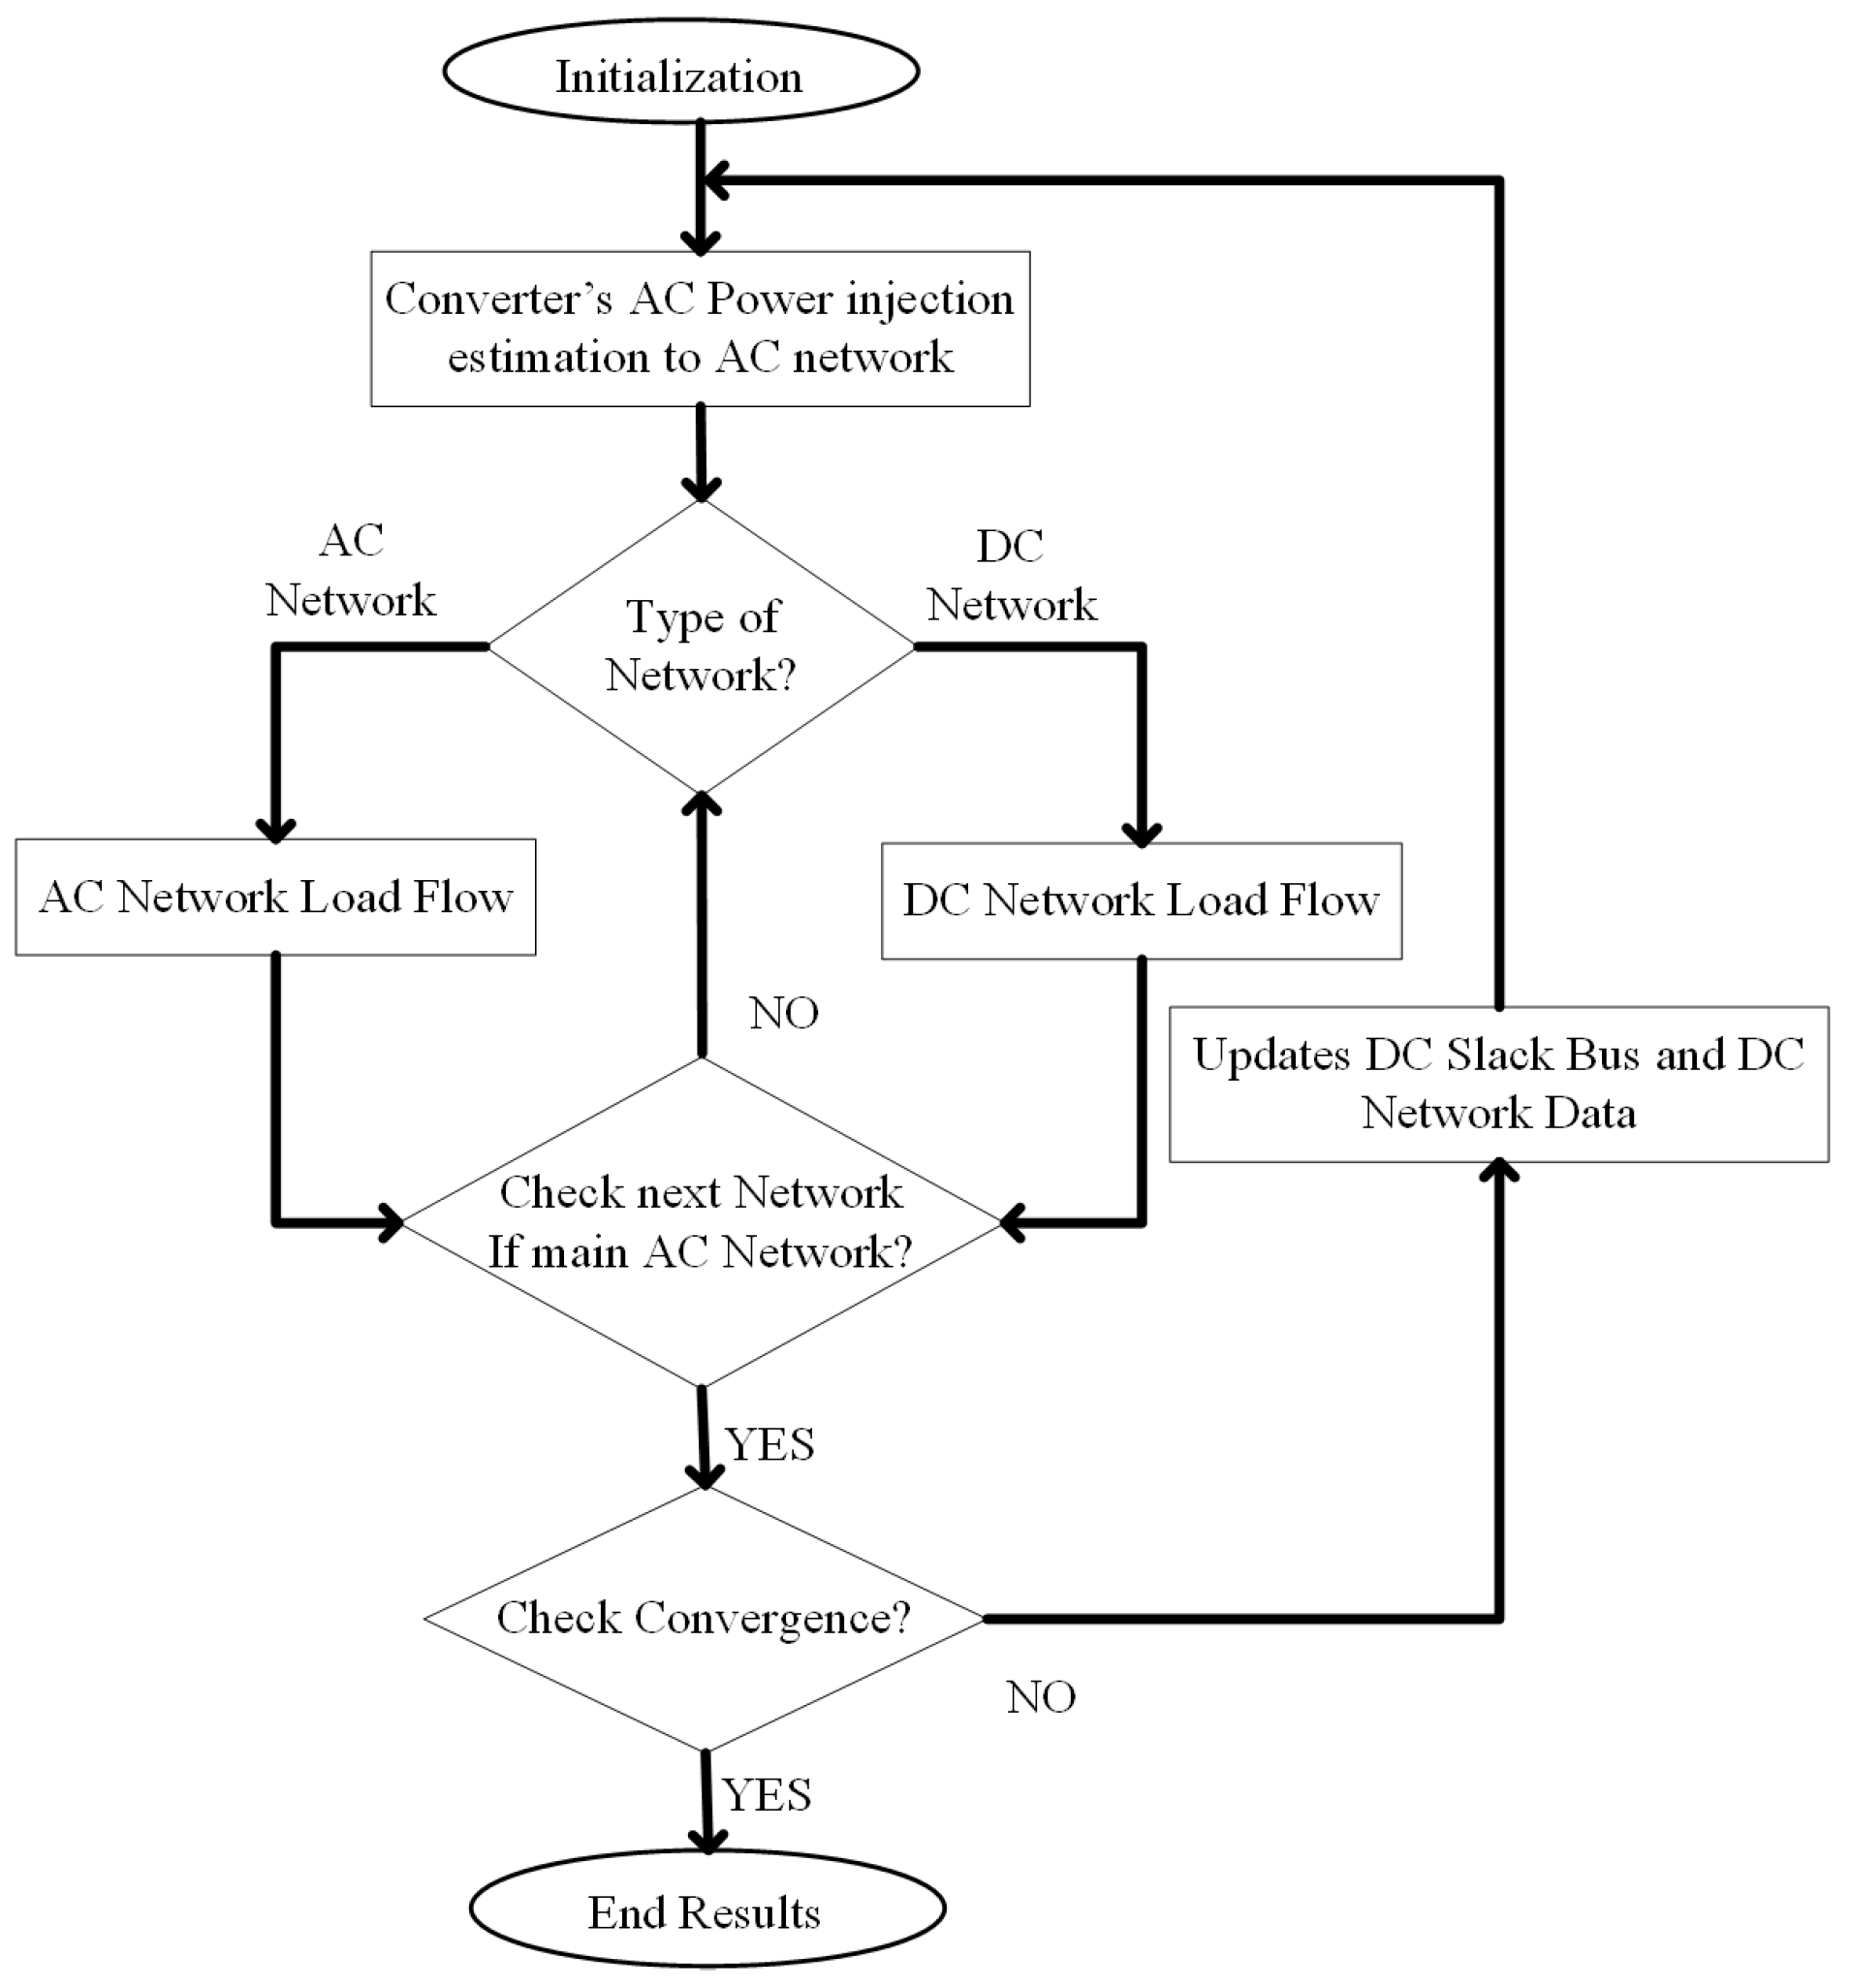
3. Sequential AC/DC Load Flow Algorithm
- Step 1:
- Data input and per unit conversion: The algorithm starts with having all converter data and the AC and DC networks data converted to per unit (p.u) on the same base value.
- Step 2:
- Determine the converter’s AC power injection for AC networks: At the start of the algorithm, the DC network and converters are assumed to be lossless. In this step, to initiate the iteration, the initial value for converter active power injection to the AC network is estimated by putting it equal to negative of the DC power reference using Equation (7).The active power injected by the converter is estimated byThe vector representation for active power injection into the AC network can be written aswhere n represents the total number of converter connected in MTDC network. The nth converter is considered to be connected with the DC slack bus and the subsequent converters buses are considered to be under the constant active power control. The remaining buses are assumed to be not connected to the AC network.
- Step 3:
- Determine the characteristic of the network: If the network is AC go to Step 4, else if the network is DC go to Step 6.
- Step 4:
- AC network load flow: During AC network load flow, all converter and DC networks data are considered to be constant. The active and reactive power equations for load flow of AC network can be written aswhere m is the total number of AC network buses. The converter power injection and are included in the power mismatch vectors and as negative loads. The mismatch vectors can be represented aswhere and represent the active and reactive power generators connected to AC network buses; and represent the load connected at AC network buses; and represent the active and reactive power injection by VSC converters; and and represent the active and reactive power of AC network buses calculated by the AC load flow.Now, the non-linear set of load flow equations are solved by using Newton–Raphson (N-R) load flow algorithm to determine the voltages and phase angles for all the AC buses using Equation (13)
- Step 5:
- Step 6:
- DC Network load flow: First the injected power to the DC network for the converter connected DC buses can be calculated asHere, represents the active part of the complex power injection at the converter side.The DC network load flow is similar to the conventional AC network load flow, while not considering the reactive power and line reactance, as it does not play any role in DC network. The conductance matrix for the DC network can be represented asHere, “p” represents the total number of DC buses. The currents injection for DC network can be written asHere, represents the DC voltage vector and represents the DC current vector.The active power injection for DC network can be calculated aswhere defines the configuration of the DC network, is used for mono-polar configuration and for bipolar configuration.The DC bus voltages are calculated using N-R algorithm as
- Step 7:
- Determine the network characteristics: If the network is grid connected AC network, go to Step 8, else, if the network is not the grid connected AC network, go to Step 4, else, if the network is DC, go to Step 5.
- Step 8:
- After calculating all the unknowns in DC and AC networks, an additional iteration is needed to calculate the active power injected into the AC network at the converter side which depend on the DC slack bus power and the converter losses , as shown in Equation (21)During this iteration, the AC network side voltage and reactive power injection into AC network are assumed to be constant.
- Step 9:
- Convergence criteria: The convergence criteria in sequential AC/DC algorithm is set by the difference of the active power injected into the AC network at the converter side, as shown in Equation (22)where “k” and “” are referred to as load flow iteration number and the tolerance value for the convergence checking, respectively.If the result converged, the calculation is complete, else return to Step 2 with updated values of AC and DC networks acquired at current iteration.
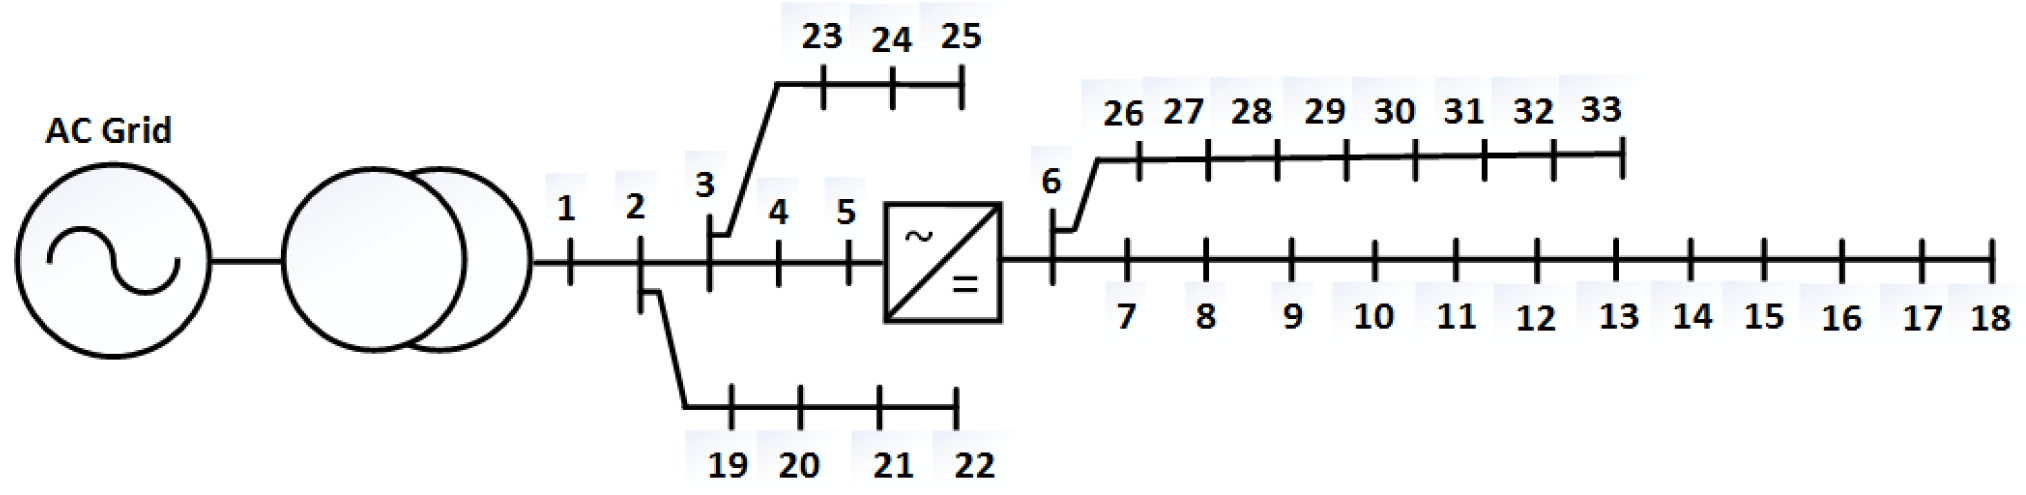
4. AC/DC Hybrid Distribution Network Models
4.1. AC/DC Hybrid Distribution System—Topology 1
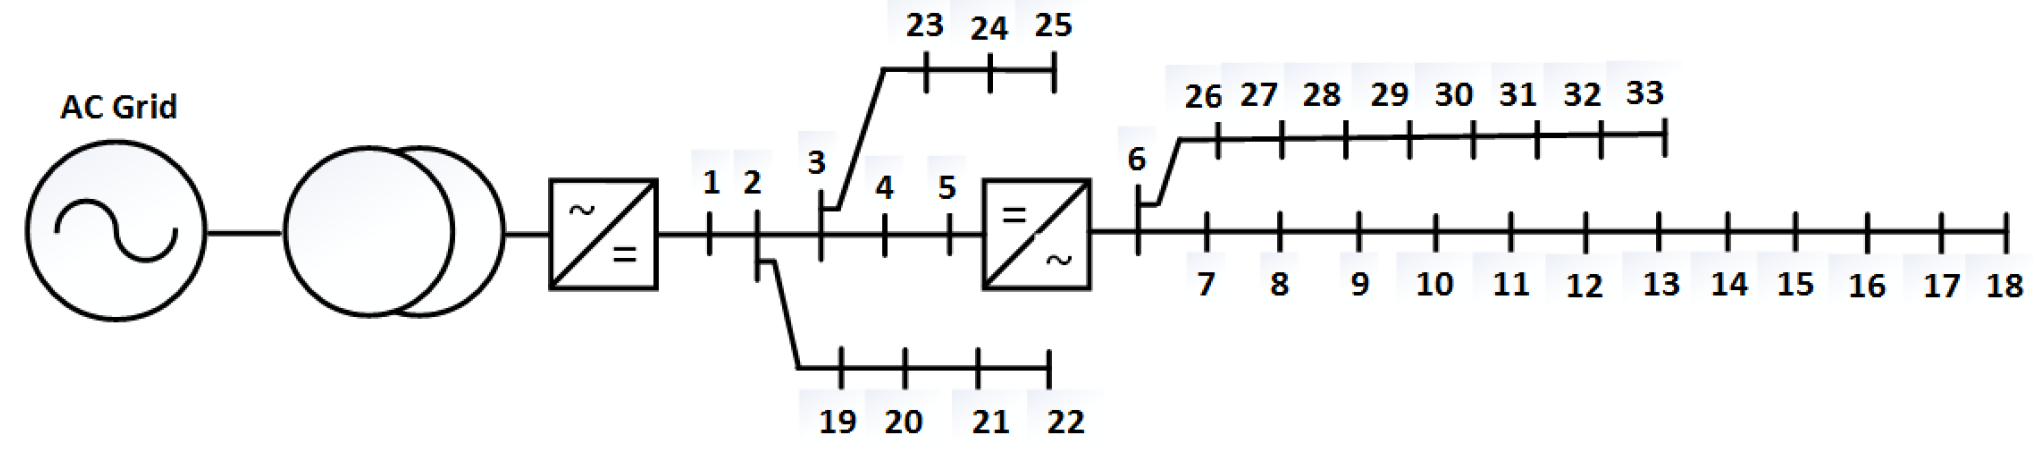
4.2. AC/DC Hybrid Distribution System—Topology 2
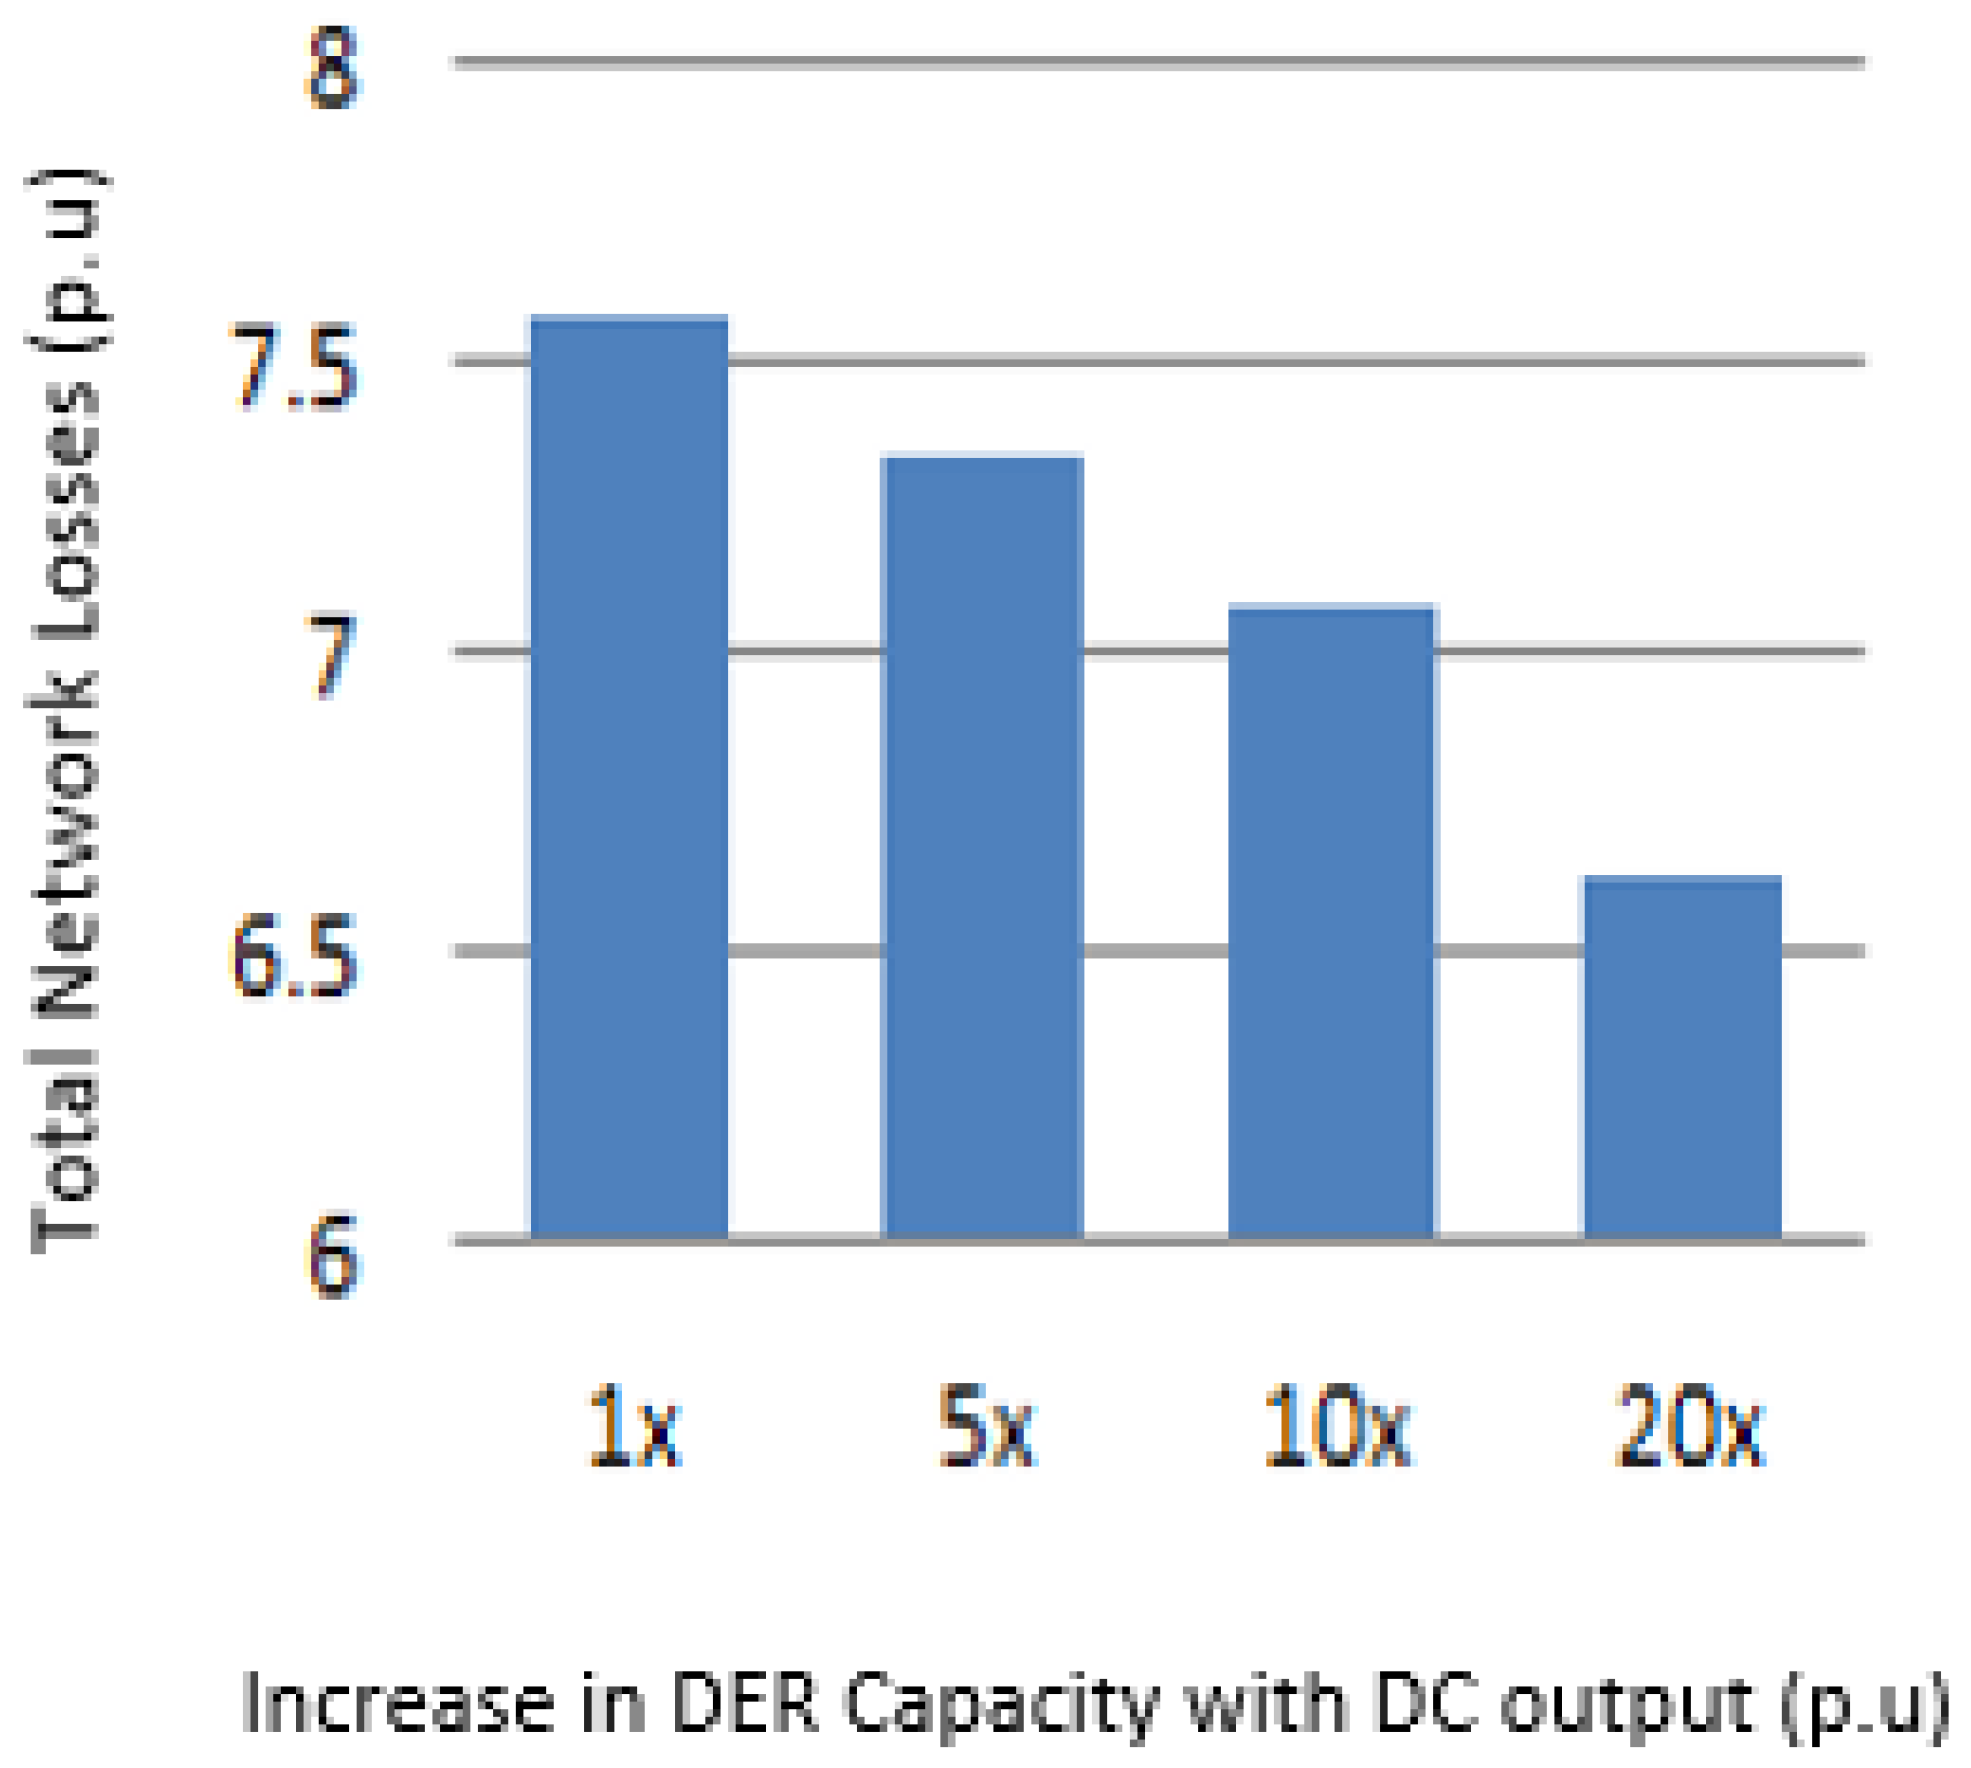
5. Load Flow Simulation and Results
5.1. Load Flow Results for Topology 1
5.2. Load Flow Results for Topology 2
6. Conclusions
Acknowledgments
Author Contributions
Conflicts of Interest
References
- Asmus, P. Microgrid, virtual power plants and our distributed energy future. Electr. J. 2010, 23, 72–82. [Google Scholar] [CrossRef]
- Ritwik, M. Aggregation of microgrids with DC system. Electr. Power Syst. Res. 2014, 108, 134–143. [Google Scholar]
- Blaabjerg, F.; Zhe, C.; Kjaer, S.B. Power electronics as efficient interface in dispersed power generation systems. IEEE Trans. Power Electron. 2004, 19, 1184–1194. [Google Scholar] [CrossRef]
- Katiraei, F.; Iravani, R.; Hatziargyriou, N.; Dimeas, A. Microgrids management. IEEE Power Energy Mag. 2008, 6, 54–65. [Google Scholar] [CrossRef]
- Hatziargyriou, N.; Asano, H.; Iravani, R.; Marnay, C. Microgrids. IEEE Power Energy Mag. 2007, 5, 78–94. [Google Scholar] [CrossRef]
- Xu, L.; Chen, D. Control and operation of a DC microgrid with variable generation and energy storage. IEEE Trans. Power Deliv. 2011, 26, 2513–2522. [Google Scholar] [CrossRef]
- Wang, P.; Goel, L.; Liu, X.; Choo, F.H. Harmonizing AC and DC: A hybrid AC/DC future grid solution. IEEE Power Energy Mag. 2013, 11, 76–83. [Google Scholar] [CrossRef]
- Kurohane, K.; Senjyu, T.; Yona, A.; Urasaki, N.; Goya, T.; Funabashi, T. A hybrid smart AC/DC power system. IEEE Trans Smart Grid 2010, 1, 199–204. [Google Scholar] [CrossRef]
- Liu, X.; Wang, P.; Loh, P.C. A hybrid AC/DC micro-grid. In Proceedings of the 2010 International Power Electronics Conference (IPEC), Singapore, 27–29 October 2010; pp. 746–751. [Google Scholar]
- Kwasinski, A. Quantitative evaluation of DC microgrids availability: Effects of system architecture and converter topology design choices. IEEE Trans. Power Electron. 2011, 26, 835–851. [Google Scholar] [CrossRef]
- Ding, G.; Gao, F.; Zhang, S. Control of hybrid AC/DC microgrid under islanding operational conditions. J. Mod. Power Syst. Clean Energy 2014, 2, 223. [Google Scholar] [CrossRef]
- Kakigano, H.; Miura, Y.; Ise, T.; Uchida, R.D.C. Micro-grid for super high quality distribution—System configuration and control of distributed generations and energy storage devices. In Proceedings of the IEEE Power Electronics Specialists Conference, Jeju, Korea, 18–22 June 2006; pp. 1–7. [Google Scholar]
- Noroozian, R.; Abedi, M.; Gharehpetian, G.B.; Hosseini, S.H. Combined operation of DC isolated distribution and PV system for supplying unbalanced AC loads. Renew. Energy 2009, 34, 899–1008. [Google Scholar] [CrossRef]
- Mohamed, A.; Carlos, F.; Ma, T.; Farhadi, M.; Mohammed, O. Operation and protection of photovoltaic systems in hybrid AC/DC smart grids. In Proceedings of the IECON 2012—38th Annual Conference on IEEE Industrial Electronics Society, Montreal, QC, Canada, 25–28 October 2012; pp. 1104–1109. [Google Scholar]
- Red, D.F.P. An Overview of the Desertec Concept. 2010. Available online: http://www.desertec.org/fileadmin/downloads/ (accessed on 08 September 2017).
- Airtricity European Offshore Supergrid Proposal. 2010. Available online: http://www.airtricity.com (accessed on 08 September 2017).
- Chaudhuri, N.; Majumder, R.; Chaudhuri, B.; Pan, J. Stability analysis of VSC MTDC grids connected to multimachine AC systems. IEEE Trans. Power Deliv. 2011, 26, 2774–2784. [Google Scholar] [CrossRef]
- Chen, H.; Wang, C.; Zhang, F.; Pan, W. Control strategy research of VSC based multiterminal HVDC system. In Proceedings of the 2006 IEEE PES Power Systems Conference and Exposition (PSCE’06), Atlanta, GA, USA, 29 October–1 November 2006; pp. 1986–1990. [Google Scholar]
- Lago, J.; Heldwein, M.L. Operation and control-oriented modeling of a power converter for current balancing and stability improvement of DC active distribution networks. IEEE Trans. Power Electron. 2011, 26, 877–885. [Google Scholar] [CrossRef]
- Guerrero, J.M.; Vasquez, J.C.; Matas, J.; Garcia de Vicuna, L.; Castilla, M. Hierarchical control of droop-controlled AC and DC microgrids—A general approach toward standardization. IEEE Trans. Ind. Electron. 2011, 58, 158–172. [Google Scholar] [CrossRef]
- Tang, L.; Ooi, B. Locating and isolating DC faults in multi-terminal DC systems. IEEE Trans. Power Deliv. 2007, 22, 1877–1884. [Google Scholar] [CrossRef]
- Tang, L.; Ooi, B.T. Protection of VSC-multi-terminal HVDC against DC faults. In Proceedings of the IEEE 33rd Annual Power Electronics Specialists Conference (PESC 02), Cairns, Australia, 23–27 June 2002; pp. 719–724. [Google Scholar]
- Chen, X.; Sun, H.S.; Wen, J.Y.; Lee, W.J.; Yuan, X.F.; Li, N.; Yao, L.Z. Integrating wind farm to the grid using hybrid multiterminal HVDC technology. IEEE Trans. Ind. Appl. 2011, 47, 965–972. [Google Scholar] [CrossRef]
- Cole, S.; Beerten, J.; Belmans, R. Generalized dynamic VSC MTDC model for power system stability studies. IEEE Trans. Power Syst. 2010, 25, 1655–1662. [Google Scholar] [CrossRef]
- Beerten, J.; Cole, S.; Belmans, R. Generalized steady-state VSC MTDC model for sequential AC/DC power flow algorithms. IEEE Trans. Power Syst. 2012, 27, 821–829. [Google Scholar] [CrossRef] [Green Version]
- Baradar, M.; Ghandhari, M. A multi-option unified power flow approach for hybrid AC/DC grids incorporating multi-terminal VSC-HVDC. IEEE Trans. Power Syst. 2013, 28, 2376–2383. [Google Scholar] [CrossRef]
- Zhang, X.P. Multiterminal voltage-sourced converter-based HVDC models for power flow analysis. IEEE Trans Power Syst. 2004, 19, 1877–1884. [Google Scholar] [CrossRef]
- Gengyin, L.; Ming, Z.; Jie, H.; Guangkai, L.; Haifeng, L. Power flow calculation of power systems incorporating VSC-HVDC. In Proceedings of the 2004 International Conference on Power System Technology (Power Con), Singapore, 21–24 November 20004; Volume 2, pp. 1562–1566. [Google Scholar]
- Acha, E.; Kazemtabrizi, B.; Castro, L.M. A new VSC HVDC model for power flows using the Newton Raphson method. IEEE Trans. Power Syst. 2013, 28, 2602–2612. [Google Scholar] [CrossRef]
- Chen, Q.; Tang, G.-Q.; Xun, W. AC–DC power flow algorithm for multi-terminal VSC-HVDC systems. Electr. Power Automot. Equip. 2005, 25, 1–6. [Google Scholar]
- Wang, W.; Barnes, M. Power flow algorithms for multi-terminal VSC-HVDC with droop control. IEEE Trans. Power Syst. 2014, 29, 1721–1730. [Google Scholar] [CrossRef]
- VSC TRANSMISSION. CIGRE Working Group B4.37. Technical Report Ref.269. April 2005. Available online: http://www.e-cigre.org/ (accessed on 22 September 2017).
- Zhao, Q.; García-González, J.; Gomis-Bellmunt, O.; Prieto-Araujo, E.; Echavarren, F.M. Impact of converter losses on the optimal power flow solution of hybrid networks based on VSC-MTDC. Electr. Power Syst. Res. 2017, 151, 395–403. [Google Scholar] [CrossRef]
- Liang, H.; Zhao, X.; Yu, X.; Gao, Y.; Yang, J. Study of power flow algorithm of AC/DC distribution system including VSC-MTDC. Energies 2015, 8, 8391–8405. [Google Scholar] [CrossRef]
- Cao, J.; Du, W.; Wang, H.; Bu, S. Minimization of transmission loss in meshed AC/DC grids with VSC-MTDC networks. IEEE Trans. Power Syst. 2013, 28, 3047–3055. [Google Scholar] [CrossRef]
- Nilsson, D.; Sannino, A. Efficiency analysis of low- and medium- voltage DC distribution systems. In Proceedings of the IEEE Power Engineering Society General Meeting, Denver, CO, USA, 6–10 June 2004; pp. 2315–2321. [Google Scholar]
- Hammerstrom, D.J. AC versus dc distribution systems—Did we get it right? In Proceedings of the Power Engineering Society General Meeting, Tampa, FL, USA, 24–28 June 2007; pp. 1–5. [Google Scholar]
- Teng, J.H. Modelling distributed generations in three-phase distribution load flow. IET Gener. Transm. Distrib. 2008, 2, 330–340. [Google Scholar] [CrossRef]
- Mousavizadeh, M.S.; Shariatkhah, M.H.; Haghifam, M.R. Load Flow Analysis for AC/DC Distribution Systems with Distributed Generations. Electr. Power Compon. Syst. 2017, 45, 1057–1067. [Google Scholar] [CrossRef]
- MATPOWER Website. Available online: http://www.pserc.cornell.edu/matpower/ (accessed on 22 November 2016).
- Siemens. HVDC PLUS-Basics and Principle of Operation. 2008. Available online: http://www.siemens.com/energy/hvdcplus (accessed on 14 March 2017).
- Bose, B.K. Power Electronics and Motor Drives: Advances and Trends; Academic Press: Cambridge, MA, USA, 2010. [Google Scholar]
- Oates, C.; Davidson, C. A comparison of two methods of estimating losses in the Modular Multi-Level Converter. In Proceedings of the 2011 14th European Conference on Power Electronics and Applications (EPE 2011), Birmingham, UK, 30 August–1 September 2011; pp. 1–10. [Google Scholar]
- Haugland, P. It’s Time to Connect—Technical Description of HVDC Light Technology; ABB, Technical Report. ABB Power Technologies, 2008. Available online: http://new.abb.com/systems/hvdc/hvdc-light (accessed on 20 November 2017).
- Guide for the Development of Models for HVDC Converters in a HVDC Grid. CIGRE Working Group B4.57. 2014. Available online: http://www.e-cigre.org/ (accessed on 10 November 2017).
- Daelemans, G. VSC HVDC in Meshed Networks. Master’s Thesis, Katholieke Universiteit Leuven, Leuven, Belgium, 2008. [Google Scholar]
- Beerten, J.; Van Hertem, D.; Belmans, R. VSC MTDC systems with a distributed DC voltage control—A power flow approach. In Proceedings of the 2011 IEEE Trondheim PowerTech, Trondheim, Norway, 19–23 June 2011. [Google Scholar]
- Rich Christie, “Power Systems Test Case Archive”. Available online: http://www.ee.washington.edu/research/pstca (accessed on 4 February 2016).


| PV | Wind | Fuel Cells | Gas Turbine | |
|---|---|---|---|---|
| AC Buses Only | 21 | 24 | 2 | 4 |
| DC Buses Only | 26 | 7 | 32 | 17 |
| Hybrid AC/DC Buses | 26 | 24 | 32 | 4 |
| Capacity (MW) | 0.5 | 0.5 | 0.3 | 0.3 |
| Source | PV | Wind | Fuel Cells | Gas Turbine |
|---|---|---|---|---|
| AC Buses Only | 26 | 7 | 32 | 17 |
| DC Buses Only | 21 | 24 | 2 | 4 |
| Hybrid AC/DC Buses | 21 | 7 | 2 | 17 |
| Capacity (MW) | 0.5 | 0.5 | 0.3 | 0.3 |
| Bus Number | Bus Type | Voltage (p.u) (DER at AC Buses) | Voltage (p.u) (DER at AC Buses) | Voltage (p.u) (DER at AC + DC Buses) |
|---|---|---|---|---|
| 1 | AC | 1.050∠0.000 | 1.050∠0.000 | 1.050∠0.000 |
| 2 | AC | 0.126 | 0.101 | 0.120 |
| 3 | AC | 0.829 | 0.656 | 0.781 |
| 4 | AC | 1.376 | 1.083 | 1.293 |
| 5 | AC | 1.970 | 1.540 | 1.849 |
| 6 | DC | 1.050 | 1.050 | 1.050 |
| 7 | DC | 1.047 | 1.048 | 1.047 |
| 8 | DC | 1.039 | 1.040 | 1.039 |
| 9 | DC | 1.025 | 1.029 | 1.025 |
| 10 | DC | 1.013 | 1.018 | 1.013 |
| 11 | DC | 1.012 | 1.017 | 1.012 |
| 12 | DC | 1.009 | 1.015 | 1.009 |
| 13 | DC | 1.000 | 1.009 | 1.000 |
| 14 | DC | 0.997 | 1.006 | 0.997 |
| 15 | DC | 0.994 | 1.004 | 0.994 |
| 16 | DC | 0.993 | 1.004 | 0.993 |
| 17 | DC | 0.989 | 1.002 | 0.989 |
| 18 | DC | 0.988 | 1.001 | 0.988 |
| 19 | AC | 1.0450.125 | 1.0460.102 | 1.0450.121 |
| 20 | AC | 1.0450.114 | 1.0460.108 | 1.0450.127 |
| 21 | AC | 1.0450.109 | 1.0460.110 | 1.0450.129 |
| 22 | AC | 1.0440.111 | 1.0460.112 | 1.0450.131 |
| 23 | AC | 1.0180.830 | 1.0250.656 | 1.0200.782 |
| 24 | AC | 1.0180.833 | 1.0240.667 | 1.0200.785 |
| 25 | AC | 1.0170.837 | 1.0240.671 | 1.0190.789 |
| 26 | DC | 1.048 | 1.048 | 1.048 |
| 27 | DC | 1.046 | 1.046 | 1.046 |
| 28 | DC | 1.039 | 1.039 | 1.039 |
| 29 | DC | 1.036 | 1.035 | 1.035 |
| 30 | DC | 1.034 | 1.032 | 1.032 |
| 31 | DC | 1.031 | 1.029 | 1.029 |
| 32 | DC | 1.031 | 1.028 | 1.028 |
| 33 | DC | 1.030 | 1.028 | 1.028 |
| Topology 1 (DER at AC) | Topology 1 (DER at DC) | Topology 1 (DER at AC + DC) | |
|---|---|---|---|
| Power absorbed at DC Slack bus (p.u) | |||
| Converter Bus Power (p.u) | |||
| AC Grid Power Injection (p.u) | |||
| Converter Bus Voltage (p.u) | 0.27 | 0.20 | 0.25 |
| Losses (p.u) (DER at AC) | Losses (p.u) (DER at DC) | Losses (p.u) (DER at AC + DC) | |
|---|---|---|---|
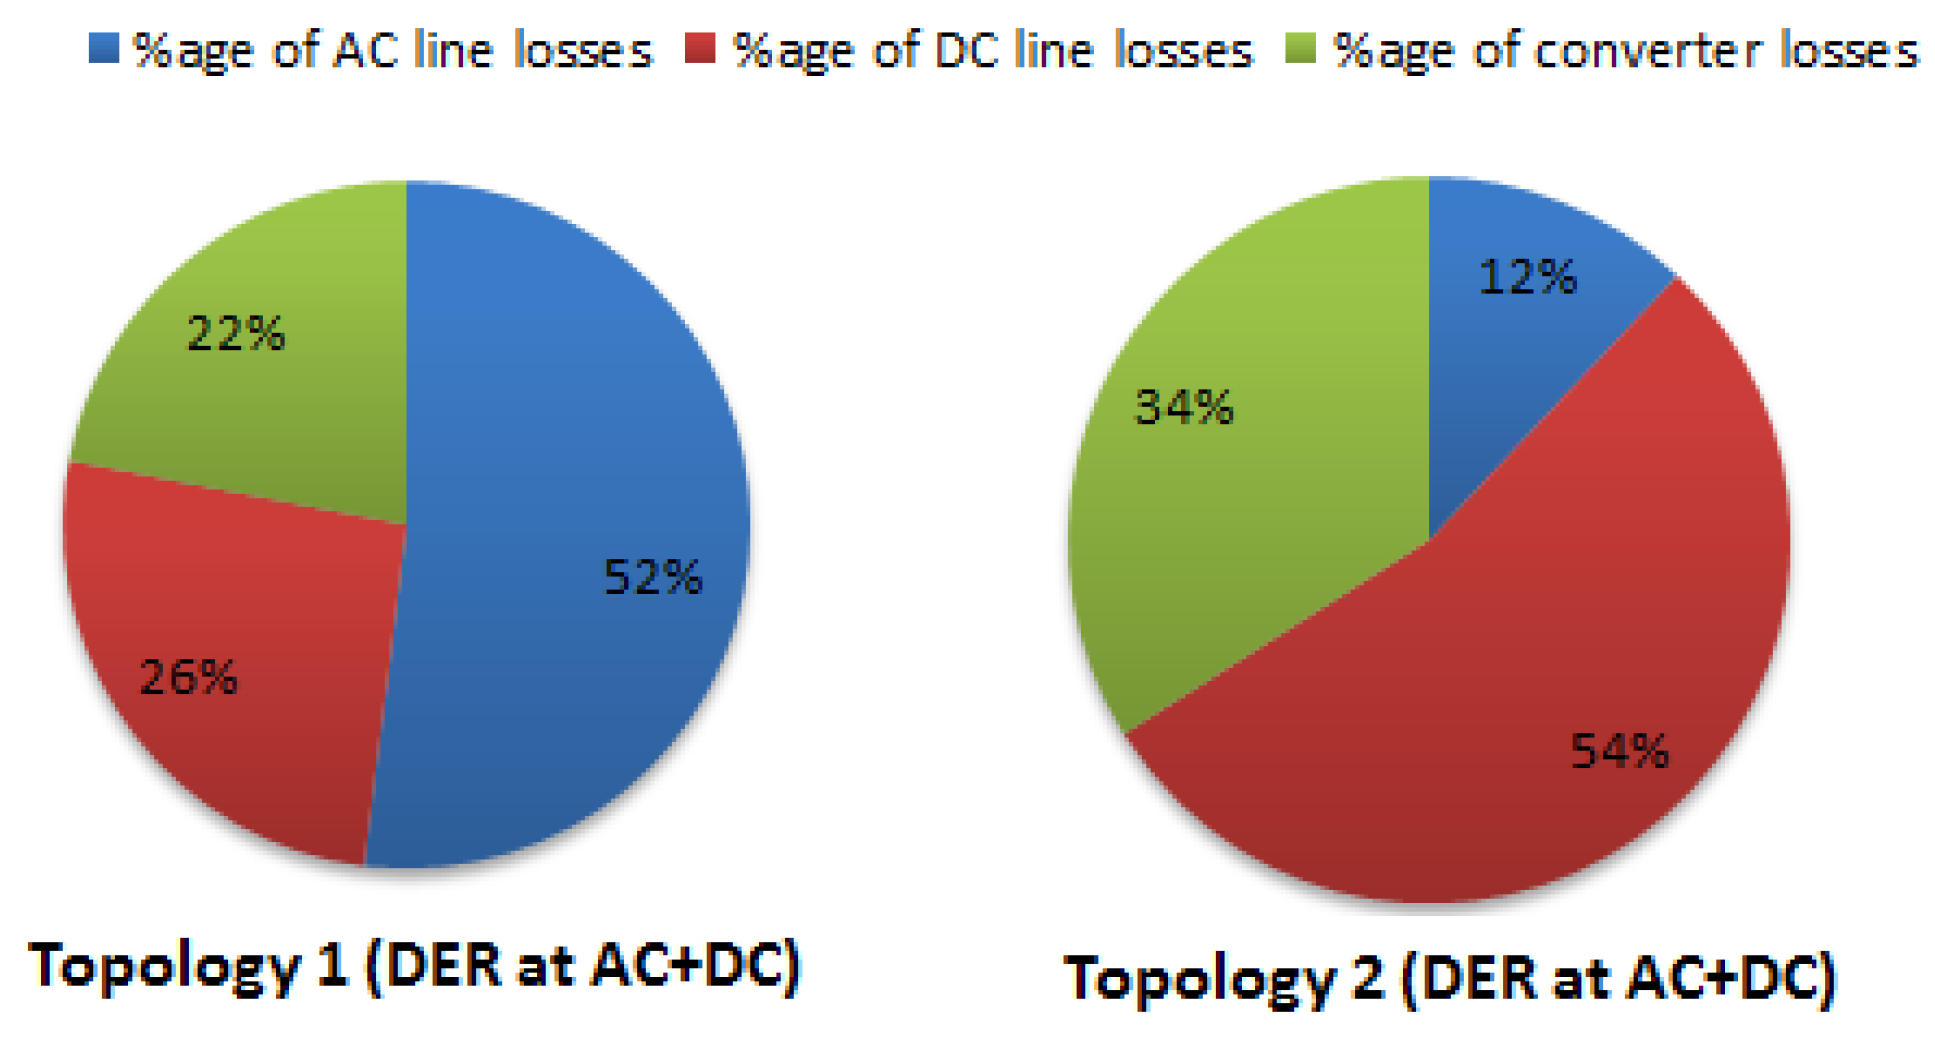
| AC Line Losses | 0.05985 + j0.0305 | 0.04653 + j0.0186 | 0.05269 + j0.0268 |
| DC Line Losses | 0.0223 | 0.0173 | 0.0230 |
| AC/DC Converter Losses | 0.0202 | 0.0172 | 0.0193 |
| DER Converter Losses | 0.0228 | 0.0229 | 0.00 |
| Total Losses (without DER Converter) | 0.1023 + j0.0305 | 0.08103 + j0.0186 | 0.09601 + j0.0268 |
| Total Losses (with DER Converter) | 0.1251 + j0.0305 | 0.10393 + j0.0186 | 0.09601 + j0.0268 |
| Bus Number | Bus Type | Voltage (p.u) (DER at AC Buses) | Voltage (p.u) (DER at AC Buses) | Voltage (p.u) (DER at AC + DC Buses) |
|---|---|---|---|---|
| 1 | DC | 1.050 | 1.050 | 1.050 |
| 2 | DC | 1.049 | 1.049 | 1.049 |
| 3 | DC | 1.046 | 1.047 | 1.046 |
| 4 | DC | 1.046 | 1.047 | 1.046 |
| 5 | DC | 1.046 | 1.048 | 1.046 |
| 6 | AC | 1.050∠0.000 | 1.050∠0.000 | 1.050∠0.000 |
| 7 | AC | 1.0500.015 | 1.0500.019 | 1.0500.013 |
| 8 | AC | 1.0500.022 | 1.0490.016 | 1.0500.019 |
| 9 | AC | 1.0500.039 | 1.0490.022 | 1.0500.037 |
| 10 | AC | 1.0490.056 | 1.0480.027 | 1.0490.053 |
| 11 | AC | 1.0490.058 | 1.0480.026 | 1.0490.055 |
| 12 | AC | 1.0490.062 | 1.0480.025 | 1.0490.060 |
| 13 | AC | 1.0490.085 | 1.0470.032 | 1.0490.082 |
| 14 | AC | 1.0490.095 | 1.0470.038 | 1.0490.092 |
| 15 | AC | 1.0490.103 | 1.0470.041 | 1.0490.101 |
| 16 | AC | 1.0500.113 | 1.0470.043 | 1.0500.111 |
| 17 | AC | 1.0500.128 | 1.0470.049 | 1.0500.126 |
| 18 | AC | 1.0500.129 | 1.0470.050 | 1.0500.127 |
| 19 | DC | 1.048 | 1.048 | 1.048 |
| 20 | DC | 1.043 | 1.042 | 1.042 |
| 21 | DC | 1.043 | 1.041 | 1.041 |
| 22 | DC | 1.041 | 1.040 | 1.040 |
| 23 | DC | 1.045 | 1.045 | 1.045 |
| 24 | DC | 1.044 | 1.044 | 1.044 |
| 25 | DC | 1.043 | 1.043 | 1.043 |
| 26 | AC | 1.0500.003 | 1.050∠0.003 | 1.050∠0.003 |
| 27 | AC | 1.0500.006 | 1.050∠0.008 | 1.050∠0.008 |
| 28 | AC | 1.0500.024 | 1.049∠0.014 | 1.049∠0.014 |
| 29 | AC | 1.0490.037 | 1.048∠0.021 | 1.048∠0.021 |
| 30 | AC | 1.0490.043 | 1.048∠0.029 | 1.048∠0.029 |
| 31 | AC | 1.0500.072 | 1.047∠0.022 | 1.047∠0.022 |
| 32 | AC | 1.0500.080 | 1.047∠0.020 | 1.047∠0.020 |
| 33 | AC | 1.0500.081 | 1.047∠0.020 | 1.047∠0.020 |
| Topology 2 (DER at AC) | Topology 2 (DER at DC) | Topology 2 (DER at AC + DC) | |
|---|---|---|---|
| Power absorbed at DC Slack bus (p.u) | |||
| Converter Bus Power (p.u) | |||
| AC Grid Power Injection (p.u) | |||
| Converter Bus Voltage (p.u) | 1.0420.10 | 1.0390.08 | 1.0400.09 |
| Losses (p.u) (DER at AC) | Losses (p.u) (DER at DC) | Losses (p.u) (DER at AC + DC) | |
|---|---|---|---|
| AC Line Losses | 0.002 + j0.0 | 0.004 + j0.0 | 0.003 + j0.0 |
| DC Line Losses | 0.019 | 0.019 | 0.021 |
| AC/DC Converter losses | 0.0141 | 0.0132 | 0.0136 |
| DER Converter Losses | 0.0229 | 0.0228 | 0.00 |
| Total Losses (without DER Converter) | 0.0351 + j0.0 | 0.0362 + j0.0 | 0.0376 + j0.0 |
| Total Losses (with DER Converter) | 0.058 + j0.0 | 0.059 + j0.0 | 0.0376 + j0.0 |
| Topology 1 (DER at AC+DC) | Topology 2 (DER at AC + DC) | |
|---|---|---|
| Max % voltage drop in AC lines | 6.38 | 0.285 |
| Max % voltage drop in DC lines | 5.90 | 0.95 |
| Max Single AC line losses | 0.0197 + j0.01 at Line 2–3 | 0.001 + j0.0 at Line 27–28 |
| Max Single DC line losses | 0.0055 at Line 8–9 | 0.008 at Line 4–5 |
© 2018 by the authors. Licensee MDPI, Basel, Switzerland. This article is an open access article distributed under the terms and conditions of the Creative Commons Attribution (CC BY) license (http://creativecommons.org/licenses/by/4.0/).
Share and Cite
Khan, M.O.; Jamali,, S.Z.; Noh, C.-H.; Gwon, G.-H.; Kim, C.-H. A Load Flow Analysis for AC/DC Hybrid Distribution Network Incorporated with Distributed Energy Resources for Different Grid Scenarios. Energies 2018, 11, 367. https://doi.org/10.3390/en11020367
Khan MO, Jamali, SZ, Noh C-H, Gwon G-H, Kim C-H. A Load Flow Analysis for AC/DC Hybrid Distribution Network Incorporated with Distributed Energy Resources for Different Grid Scenarios. Energies. 2018; 11(2):367. https://doi.org/10.3390/en11020367
Chicago/Turabian StyleKhan, Muhammad Omer, Saeed Zaman Jamali,, Chul-Ho Noh, Gi-Hyeon Gwon, and Chul-Hwan Kim. 2018. "A Load Flow Analysis for AC/DC Hybrid Distribution Network Incorporated with Distributed Energy Resources for Different Grid Scenarios" Energies 11, no. 2: 367. https://doi.org/10.3390/en11020367
APA StyleKhan, M. O., Jamali,, S. Z., Noh, C.-H., Gwon, G.-H., & Kim, C.-H. (2018). A Load Flow Analysis for AC/DC Hybrid Distribution Network Incorporated with Distributed Energy Resources for Different Grid Scenarios. Energies, 11(2), 367. https://doi.org/10.3390/en11020367