Article

Power Management of Islanded Self-Excited Induction Generator Reinforced by Energy Storage Systems

by
Nachat N. Nasser
* and
Mohamed E. A. Farrag
School of Engineering and Built Environment, Glasgow Caledonian University, 70 Cowcaddens Rd., Glasgow G4 0BA, UK
*
Author to whom correspondence should be addressed.
Energies 2018, 11(2), 359; https://doi.org/10.3390/en11020359
Submission received: 1 December 2017 / Revised: 17 January 2018 / Accepted: 1 February 2018 / Published: 3 February 2018
(This article belongs to the Section F: Electrical Engineering)

Abstract

:
Self-Excited Induction Generators (SEIGs), e.g., Small-Scale Embedded wind generation, are increasingly used in electricity distribution networks. The operational stability of stand-alone SEIG is constrained by the local load conditions: stability can be achieved by maintaining the load’s active and reactive power at optimal values. Changes in power demand are dependent on customers’ requirements, and any deviation from the pre-calculated optimum setting will affect a machine’s operating voltage and frequency. This paper presents an investigation of the operation of the SEIG in islanding mode of operation under different load conditions, with the aid of batteries as an energy storage source. In this research a current-controlled voltage-source converter is proposed to regulate the power exchange between a direct current (DC) energy storage source and an alternating current (AC) grid, the converter’s controller is driven by any variation between machine capability and load demand. In order to prolong the system stability when the battery reaches its operation constraints, it is recommended that an ancillary generator and a dummy local load be embedded in the system. The results show the robustness and operability of the proposed system in the islanding mode of the SEIG under different load conditions.

1. Introduction

The UK Government is committed to carbon reduction legislation [1] where the contribution of Fossil Fuels in future energy generation is to be drastically decreased from 53.6% in 2015 to 10.8% by 2040 according to one of the best Future Energy Scenarios [2]. Renewable sources are expected to generate 34% of the UK’s electricity by 2020 and to cover about 54% of the demand for electrical energy by 2040, while the contribution of Energy Storage Systems (ESS) is expected to increase to about 6.4% of this demand [2]. As a consequence, the Distribution Network Operators (DNOs) are taking several measures to achieve this goal, taking into consideration governmental targets, policies, plans and legislations for the energy industry [3,4,5]. Current environmental and economic conditions have created a challenging environment in which to shift to electrical generation connected to the Distribution Network (DN) rather than the Transmission System (TS), and for the fact that embedded wind capacity is expected to reach 31 TWh by 2030 [2].
Among the different types of generators applied in wind energy systems, Self-Excited Induction Generators (SEIG) have become key in the Small-Scale Embedded Generation (SSEG) sector because of the drawbacks of other widely used generators such as the Permanent Magnet Synchronous Generator (PMSG) [6], which requires the use of a full scale power converter in order to adjust the voltage and frequency of generation to the voltage and the frequency of transmission, respectively. SEIG appears to be the right candidate to generate electric power for remote area applications [7,8,9,10,11,12,13,14]. It is robust and it can operate in a self-excited mode using only the input mechanical power from the rotating wind turbine. It is simple in construction, small in size and weight, reliable, efficient, and with reduced cost of maintenance. Also, it has inherent short circuit and overloading protection. It could be the better option for energy generation in low/medium wind speed profiles [15]. As induction generators do not have separate field winding, a capacitor bank is required to build up the terminal voltage. The main difficulty of SEIG is the lack of ability to control the machine terminal voltage and frequency under unpredictable load and speed conditions. A great deal of research has been conducted into SEIG operation and control; this includes the characteristics of the operation of SEIG in islanded mode. The generators lose connection to the electricity supply grid, as studied in [16,17,18], while selection of the capacitance reactive sources has been studied in [19,20,21] for fixed capacitance, and in [22,23] for reactive compensator. Other research has focused on the control of ballast loads connected to the induction generator in order to compensate for variation of consumer loads [24,25,26]. In [27,28], focus is given to the study of SEIG dynamics during disconnection and reconnection while the impacts of wind generation on the power grid and its stability have been considered in [29,30,31]. There is a gap in the literature regarding the operation and robust control of SEIG in islanding mode including the transitional period from grid connection to isolation. In [32], the optimal operation performance of the SEIG is obtained using an optimum fixed combination of active and reactive load during the transitional status, however, a fixed load is unlikely to be maintained due to local load variation. Studies [33,34] have suggested using converter-based power electronic devices to maintain the operation of an islanded SEIG to fixed frequency and voltage, however they do not consider operational continuity under load variations.
This work is an improvement of the study in [32], in which an energy storage system is used to reinforce the operation of a SEIG through management of active and reactive power to maintain its optimal load condition operation. This paper presents a control circuit designed to be able to keep the power drawn from an induction generator at the optimal values, irrespective of load variation. A current-controlled voltage-source converter is proposed to regulate the power exchange between a DC energy storage source and an AC grid. An electro-chemical energy storage unit, such as a battery, is recommended as this can be charged/discharged during deviation in power exchange.
In addition to the cost benefit of battery storage in the distribution networks [35], reinforcing an SEIG by ESS reduces the running cost by improving the reliability during islanded operating mode. This work provides an important contribution to the operation of distribution networks under increasing penetration of Small-Scale Wind Generation and ensuring compliance with the G59 regulations, as stipulated by the UK grid code [36].

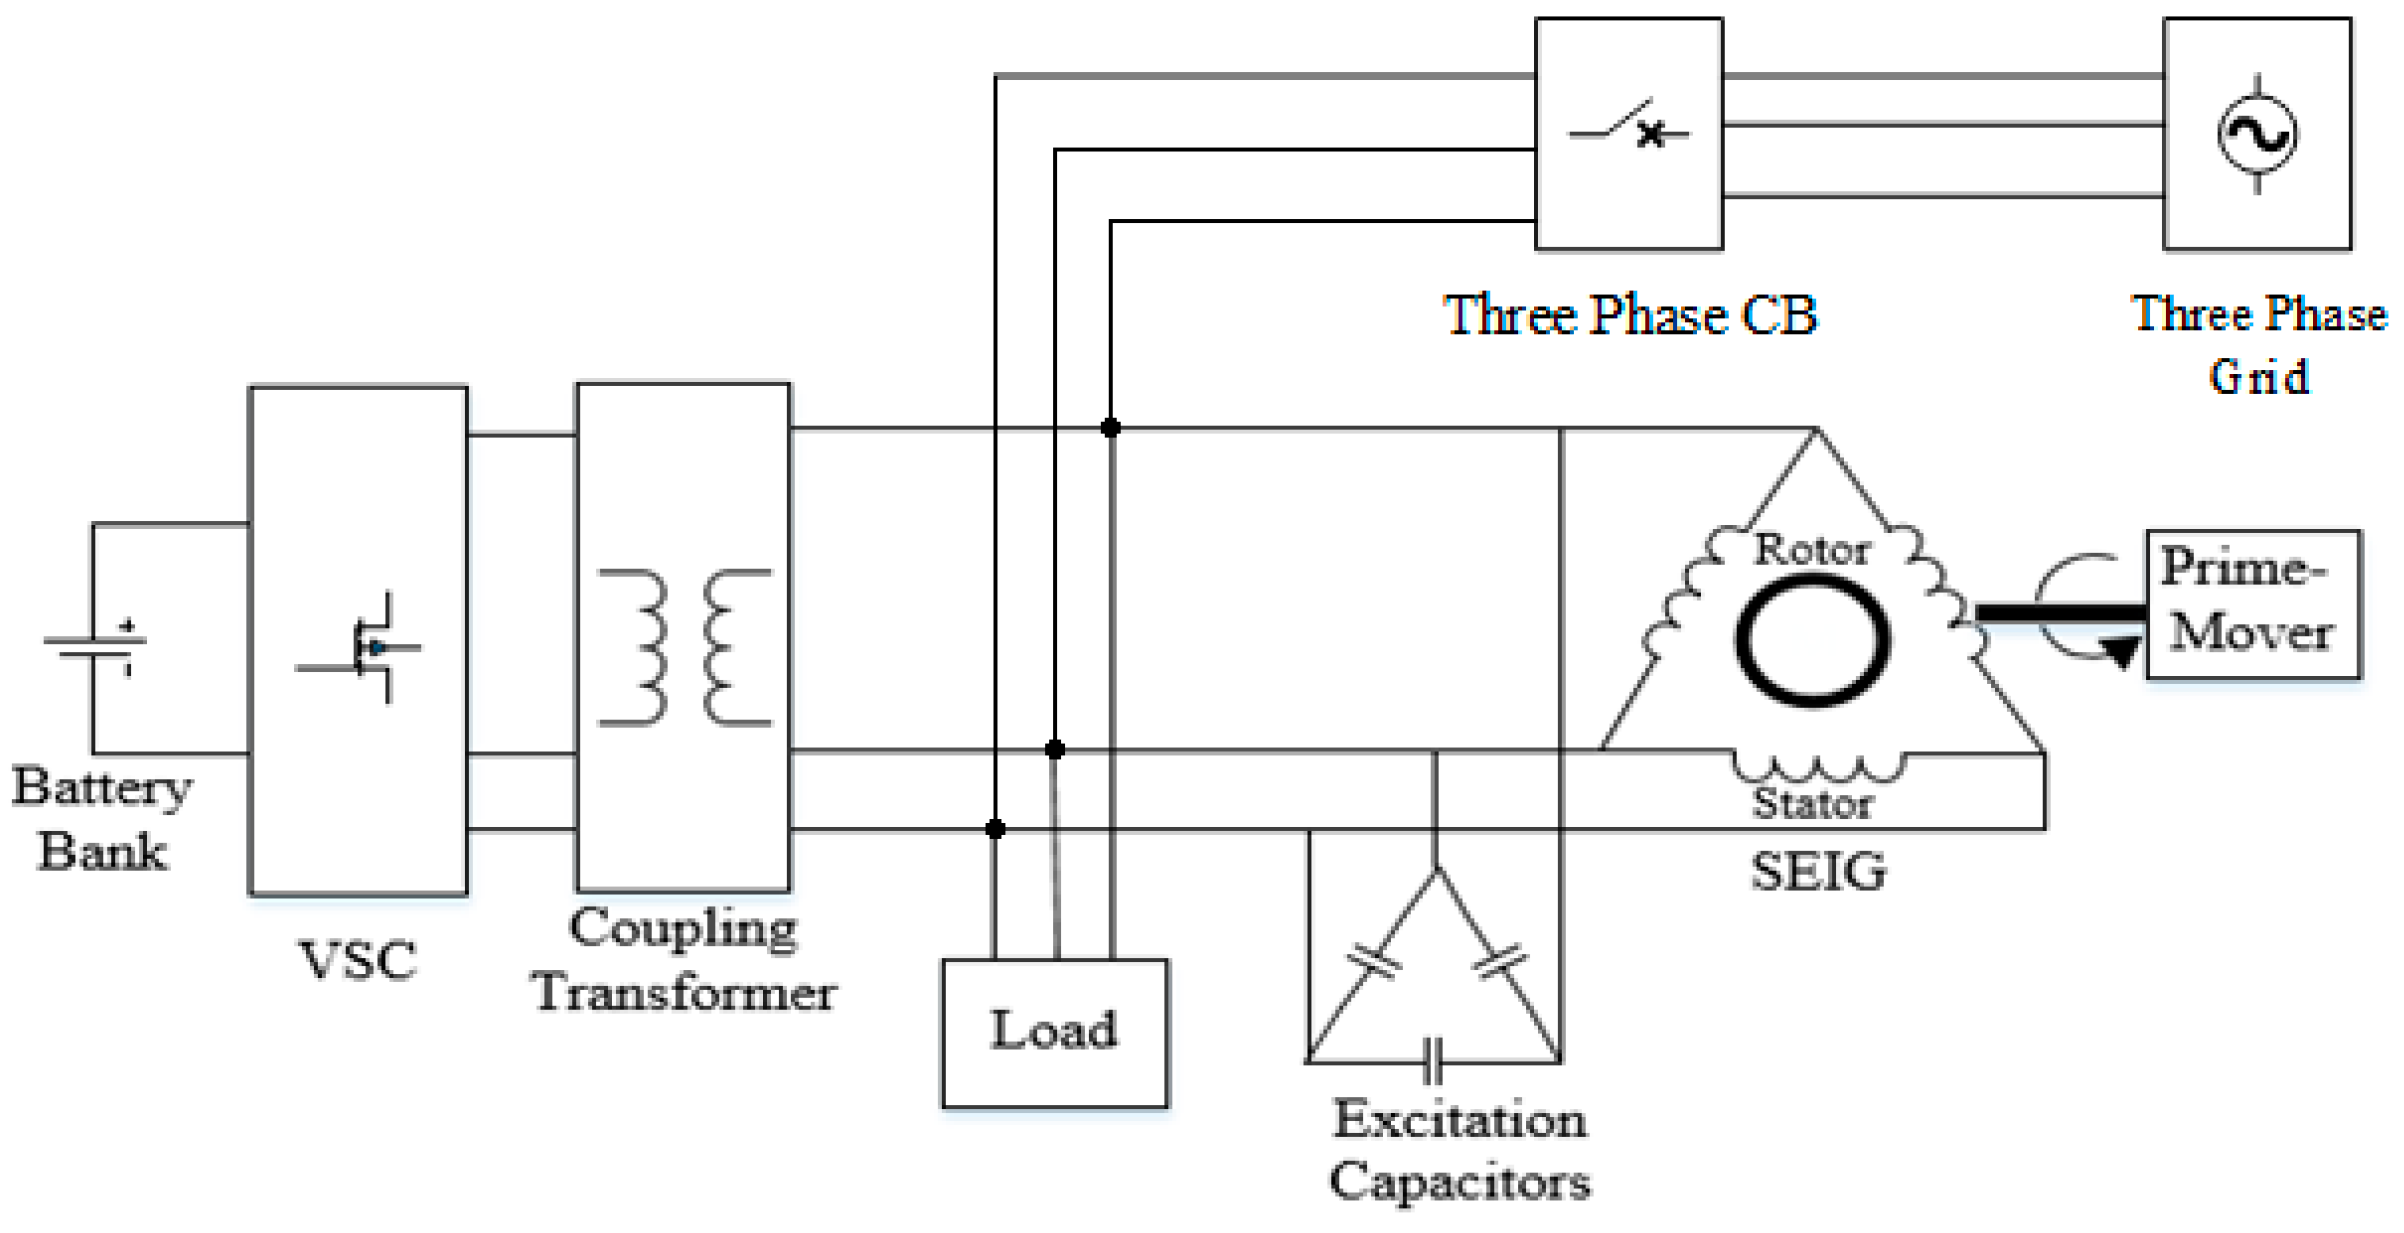
2. Islanded System Operation

The studied system consists of three-phase SEIG with a bank of fixed excitation capacitors, voltage-source converter (VSC) and variable load, as shown in Figure 1. The VSC is a pulse width modulated, current-controlled voltage source, connected with a battery bank at its DC bus and connected to the AC system through an interconnecting coupling transformer. The SEIG is a squirrel-cage delta connected induction machine.
Operation of such a system in islanded mode is stable as long as the generator is loaded by the optimal active and reactive power [32]. Initially, the SEIG should be connected to the main grid to guarantee the machine terminal induced voltage can be built up [37]. Figure 2 shows the voltage magnitude and frequency from a simulation of a 2.3 KVA SEIG loaded by an optimal combination of active and reactive power. In Figure 2, the islanded mode of operation starts at t = 1 s, after disconnecting the SEIG and its local load (as a micro-grid) from the main grid, and ends at t = 10 s, when the micro-grid is reconnected to the main grid. In this case, including during the islanded operating mode, the micro-grid supply voltage is within UK statutory limits for an LV network [38].
This optimal set of load conditions does not require a voltage-source converter or the battery system to be connected to the micro-grid, i.e., there is no need to regulate the power as long as the load is kept at the optimal values. Any change of the load parameters from the ideal pre-calculated values will require power control that cannot be achieved by the machine itself, i.e., without external support, as will be discussed in the following subsections.

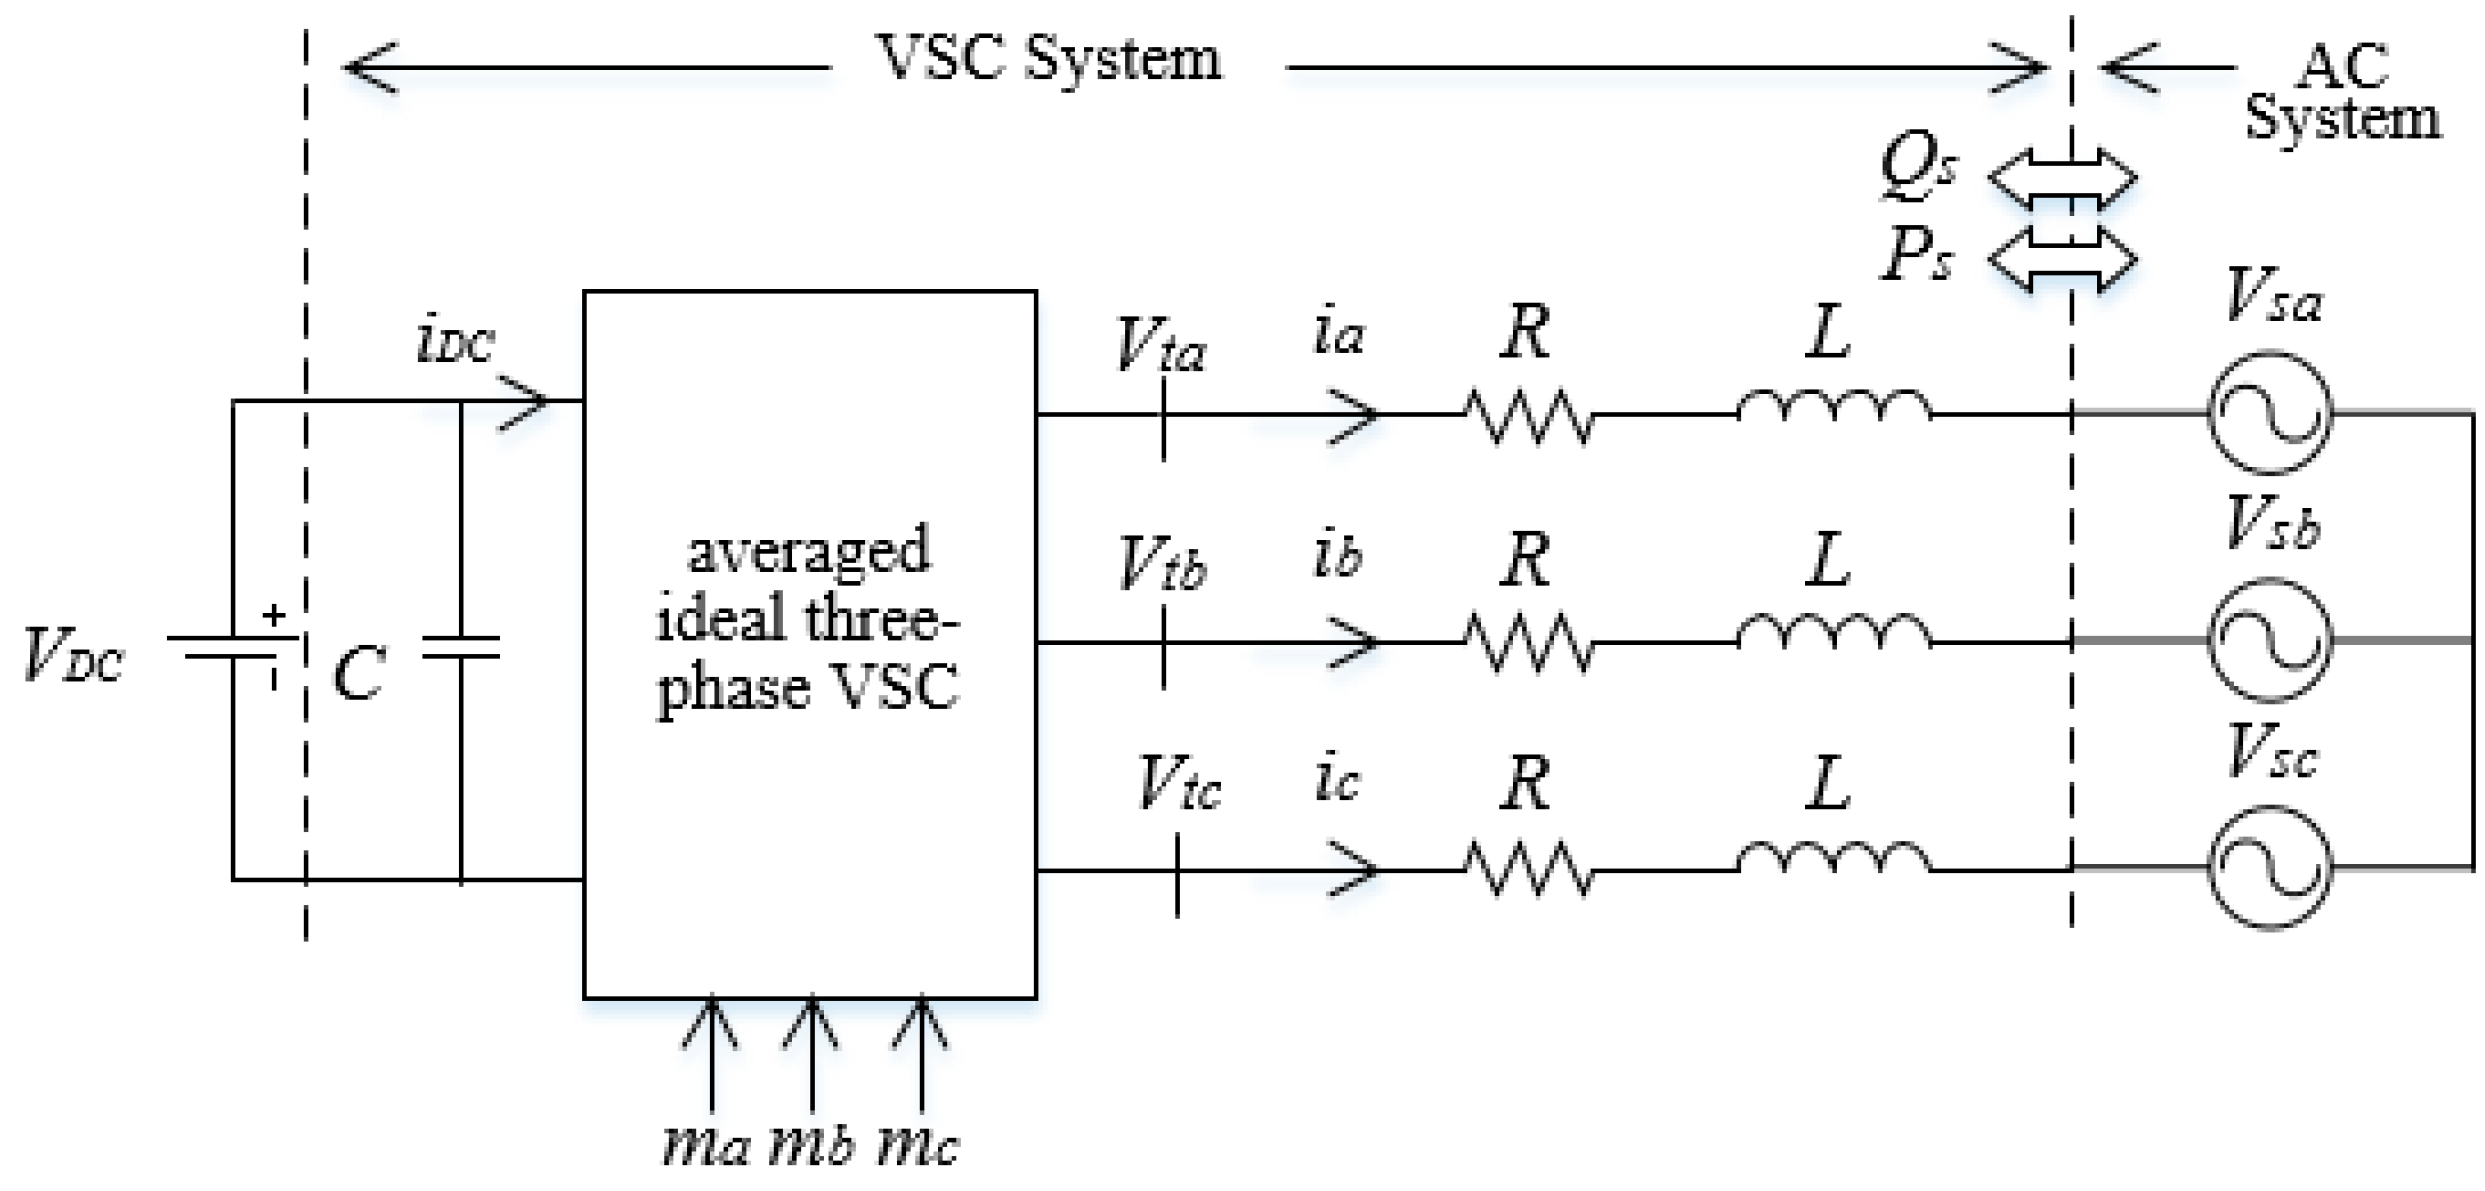
3. VSC System Modelling

Figure 3 shows a schematic diagram of the voltage source converter (VSC) model connecting DC and AC systems and controlled by three-phase modulating signals m a b c ( t ) .
As outlined in [39], the AC side dynamics of a VSC system can be described in the d-q-frame using the following two equations:
L d i d d t = L × ω 0 × i q R × i d + V t d + V s d
L d i q d t = L × ω 0 × i d R × i q + V t q + V s q
where:
  • L: the inductance between the converter and the coupling point.
  • R: the sum of the resistance between the converter and the coupling point and the VSC internal resistance.
  • ω 0 : the steady state AC source frequency.
  • i d ,   i q : the respective current components in the d-q-frame.
  • V t d ,   V t q : the respective VSC terminal voltages in the d-q-frame.
  • V s d ,   V s q : the respective AC system voltage in the d-q-frame.
Taking V t d and V t q as DC variables, then i d and i q are also DC variables in the steady state condition. As a result, the real and reactive power delivered to the AC system can be calculated from:
P s ( t ) = 3 2 [ V s d ( t ) × i d ( t ) + V s q ( t ) × i q ( t ) ]
Q s ( t ) = 3 2 [ V s d ( t ) × i q ( t ) + V s q ( t ) × i d ( t ) ]
With steady state compensator design of the Phase Locked Loop (PLL), the steady state real and reactive power delivered to the AC system can be written in the d-q-frame as Equations (5) and (6):
P s ( t ) = 3 2 × V s d ( t ) × i d ( t )
Q s ( t ) = 3 2 × V s d ( t ) × i q ( t )
Therefore, P s ( t )   and   Q s ( t ) can be controlled by i d   and   i q , respectively. Thus, the current references in the d-q-frame are given as Equations (7) and (8):
i d r e f ( t ) = 2 3 V s d × P s r e f ( t )
i q r e f ( t ) = 2 3 V s d × Q s r e f ( t )
where: P s r e f : the reference active power. Q s r e f : the reference reactive power.
If the control system can provide fast reference tracking, that is, i d i d r e f and i q i q r e f , then P s ( t ) P s r e f and Q s Q s r e f . As a result, P s ( t )   a n d   Q s ( t ) can be independently controlled by their respective reference levels. The relationship between the DC side voltage and the VSC terminal AC voltage is given in Equations (9) and (10):
V t d ( t ) = V D C 2 × m d ( t )
V t q ( t ) = V D C 2 × m q ( t )
where: m d   and   m q are, respectively, the d-q components of the modulating signals.
Based on Equations (1) and (2), where i d and i q are state variables, V t d and V t q are control inputs, and V s d and V s q are disturbance inputs, the modulating signals in the d-q-frame, m d and m q , can be determined. Taking into account the relationship between the DC side voltage and the VSC AC terminal voltage, m d and m q are calculated from the following:
m d = 2 V D C ( u d L × ω 0 × i q + V s d )
m q = 2 V D C ( u q + L × ω 0 × i d + V s q )
where: u d and u q are two new control inputs [40,41].
Figure 4 shows the control block diagram of a current-controlled VSC systems, where k d ( s )   a n d   k q ( s ) are the d-q-axis PI controllers, respectively.

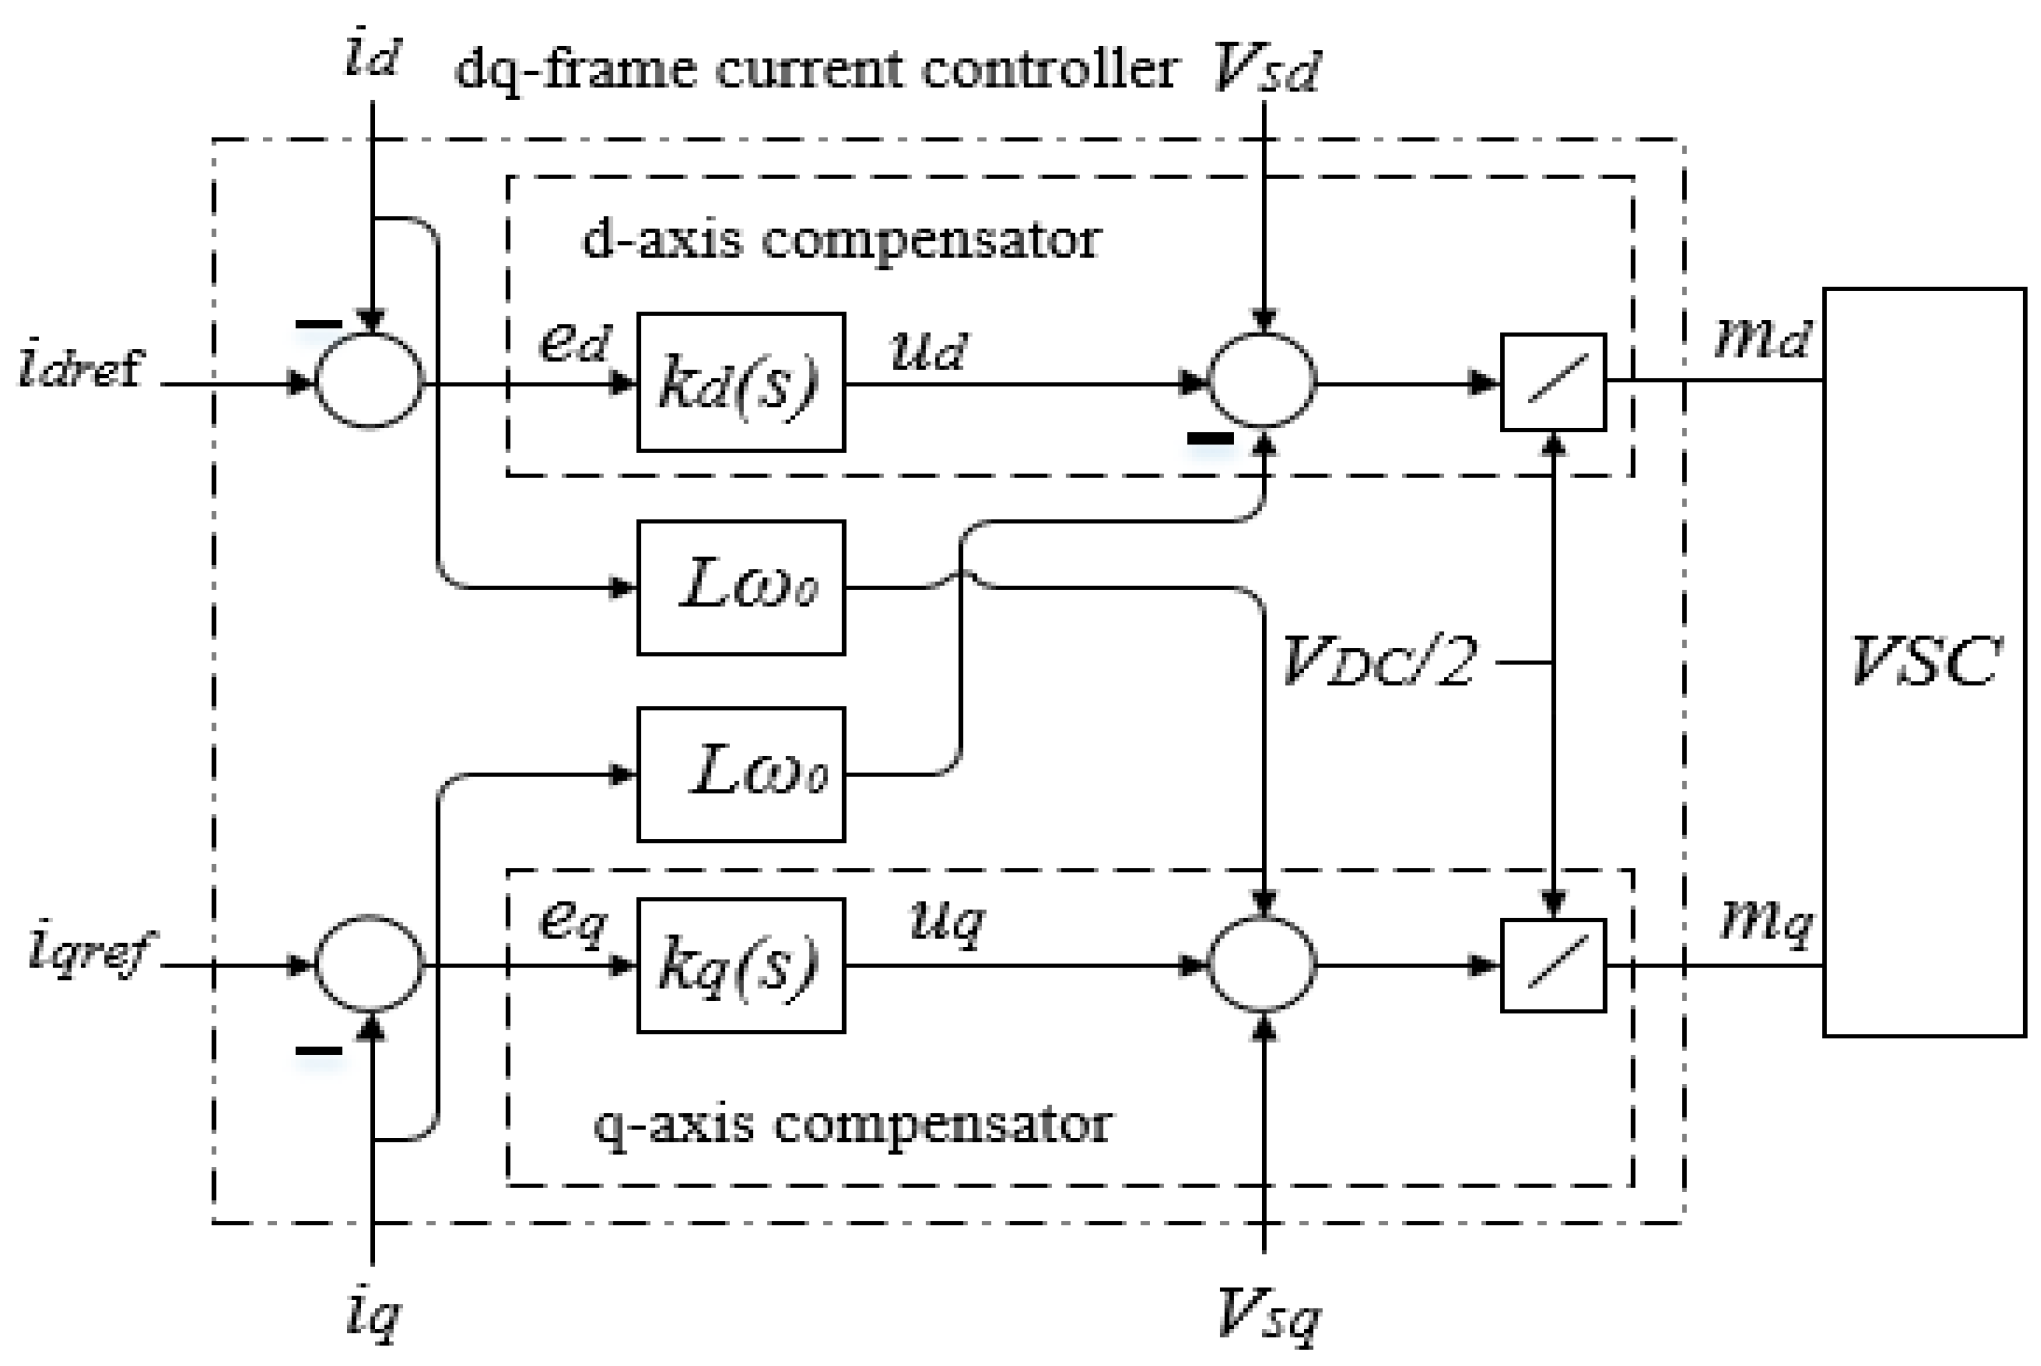
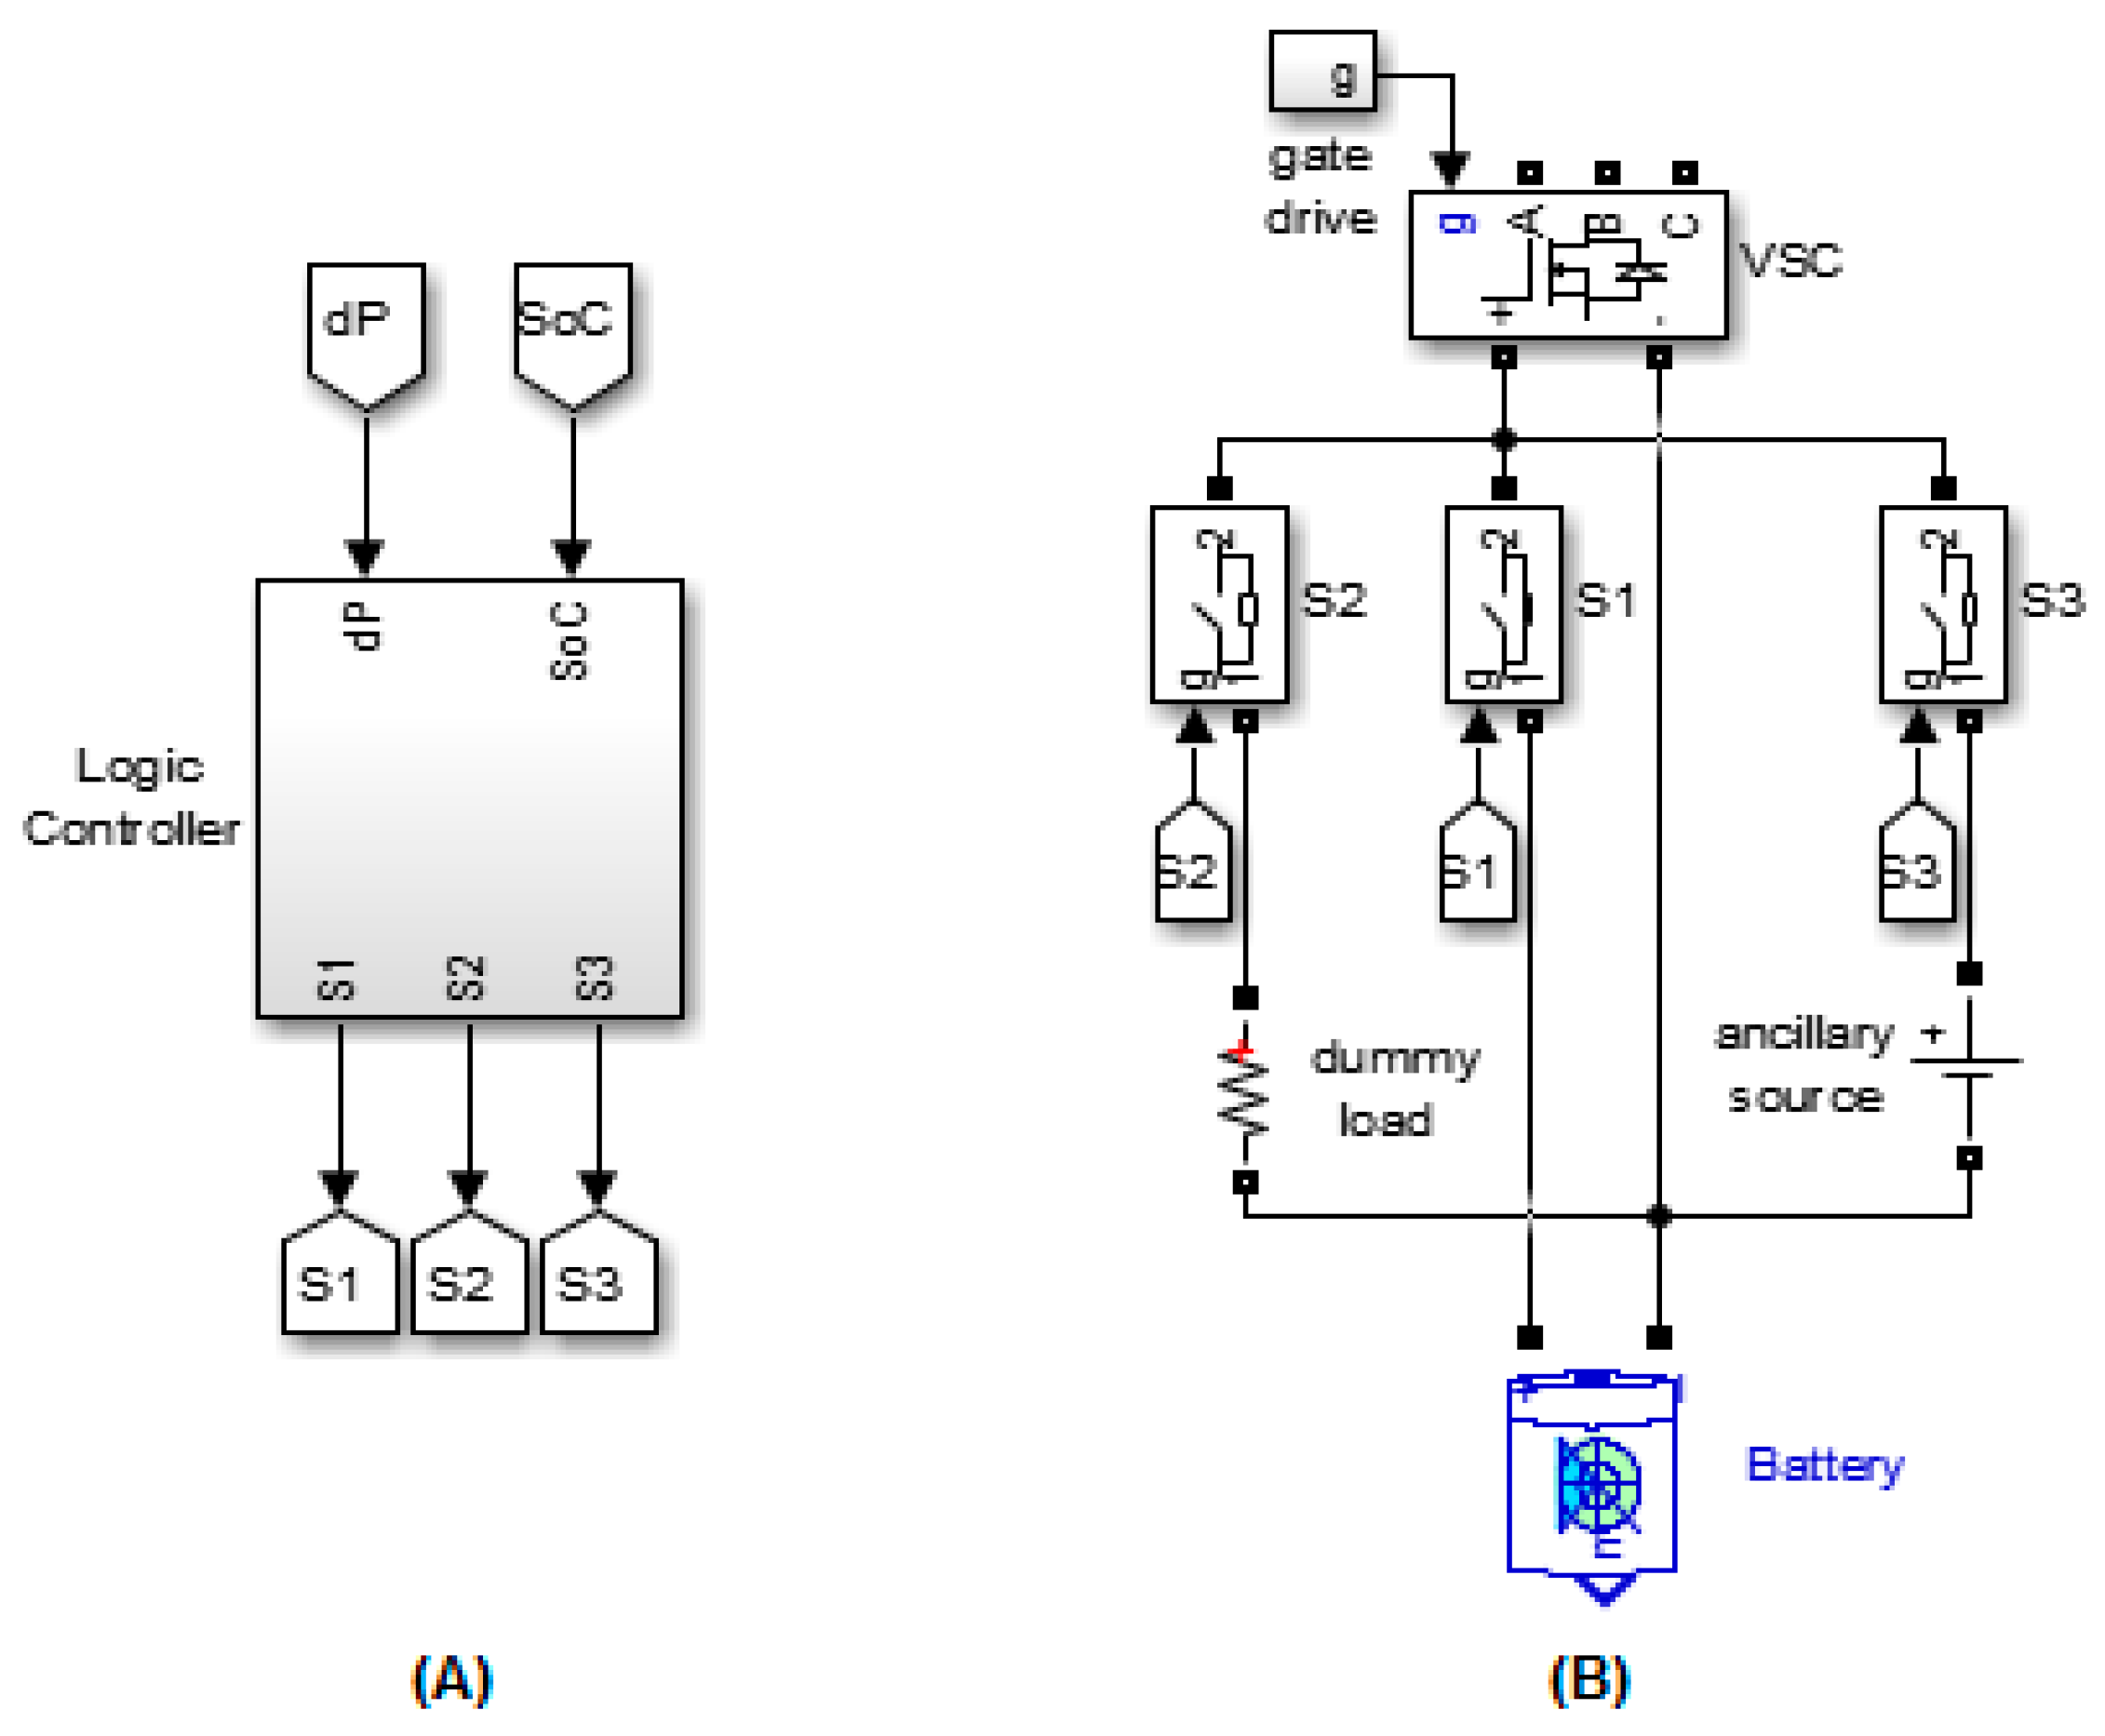
4. Control and Working Principle

In order to keep the circuit stable during islanded operation, the local active and reactive power should be maintained at their optimal values [32]:
P O = 0.8473 × S G
Q O = 0.5081 × S G
where S G is the induction generator VA rating.
The control scheme of the VSC system described above, with a battery ESS, was used to maintain the system stability. The VSC is used to absorb/inject the difference in power between the SEIG and the load, to ensure the optimal operation of the overall system.
In case of higher load power, the difference in power (dP) will be injected from the ESS as long as the battery state of charge (SoC) is higher than its minimum limit of depth of discharge, otherwise an ancillary generator will be used to supply the load. For the opposite scenario, if the load power decreases below the optimal value, the VSC system will absorb the difference in power by charging the battery until its SoC reaches the maximum level, at this point the difference in power will be dissipated into a local dummy load. The minimum and maximum (SoC) of a battery depend on its type and manufacturer. In this study, these values were set to be 30% and 99% respectively.
To achieve the method described above, three DC current paths were required and a logic controller was needed to achieve the transition from one path to the other. Figure 5A shows the logic controller designed for this purpose and Figure 5B shows the switch arrangement. For charging/discharging the ESS switch (S1) is used, dissipating the power in a dummy load occurs via switch (S2) and supplying the power from an ancillary source uses switch (S3).

5. System Simulation

A Matlab/Simulink model was built to simulate the above described system and to conduct the required study. The induction generator parameters are given below in Table 1.
Three scenarios were discussed in this study:
Scenario 1:
variation of load’s active power, battery SoC within limits;
Scenario 2:
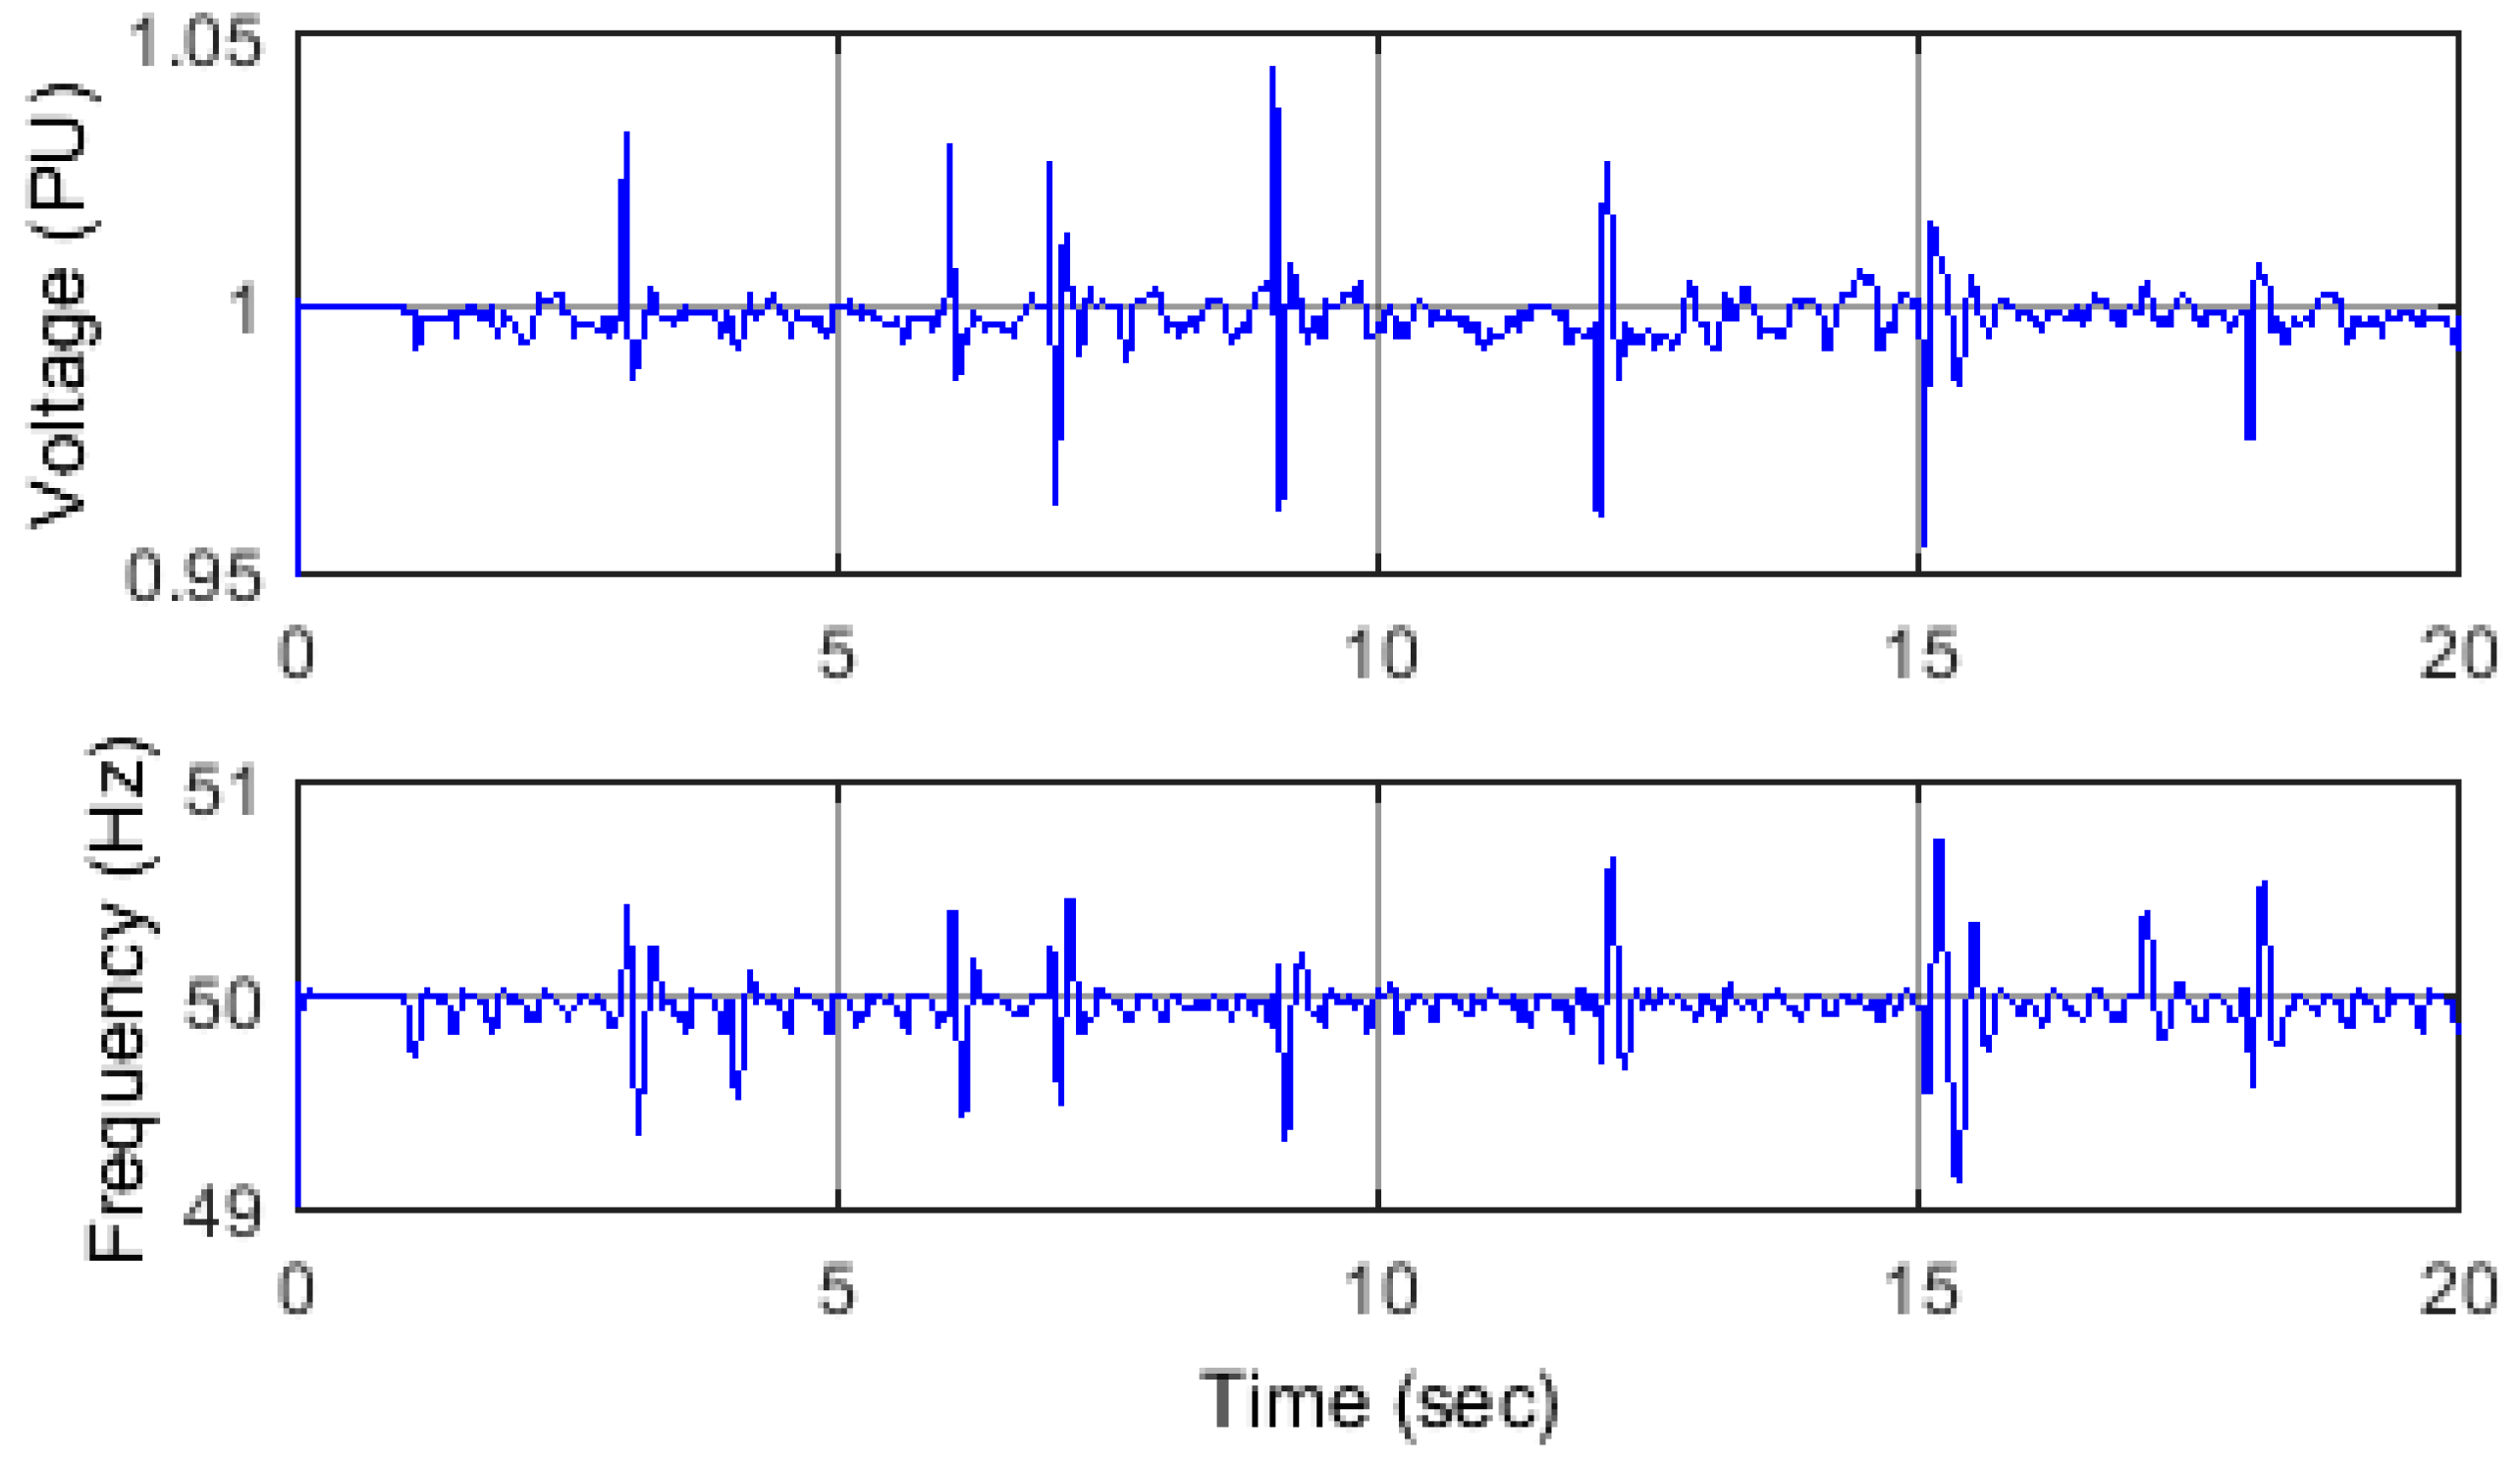
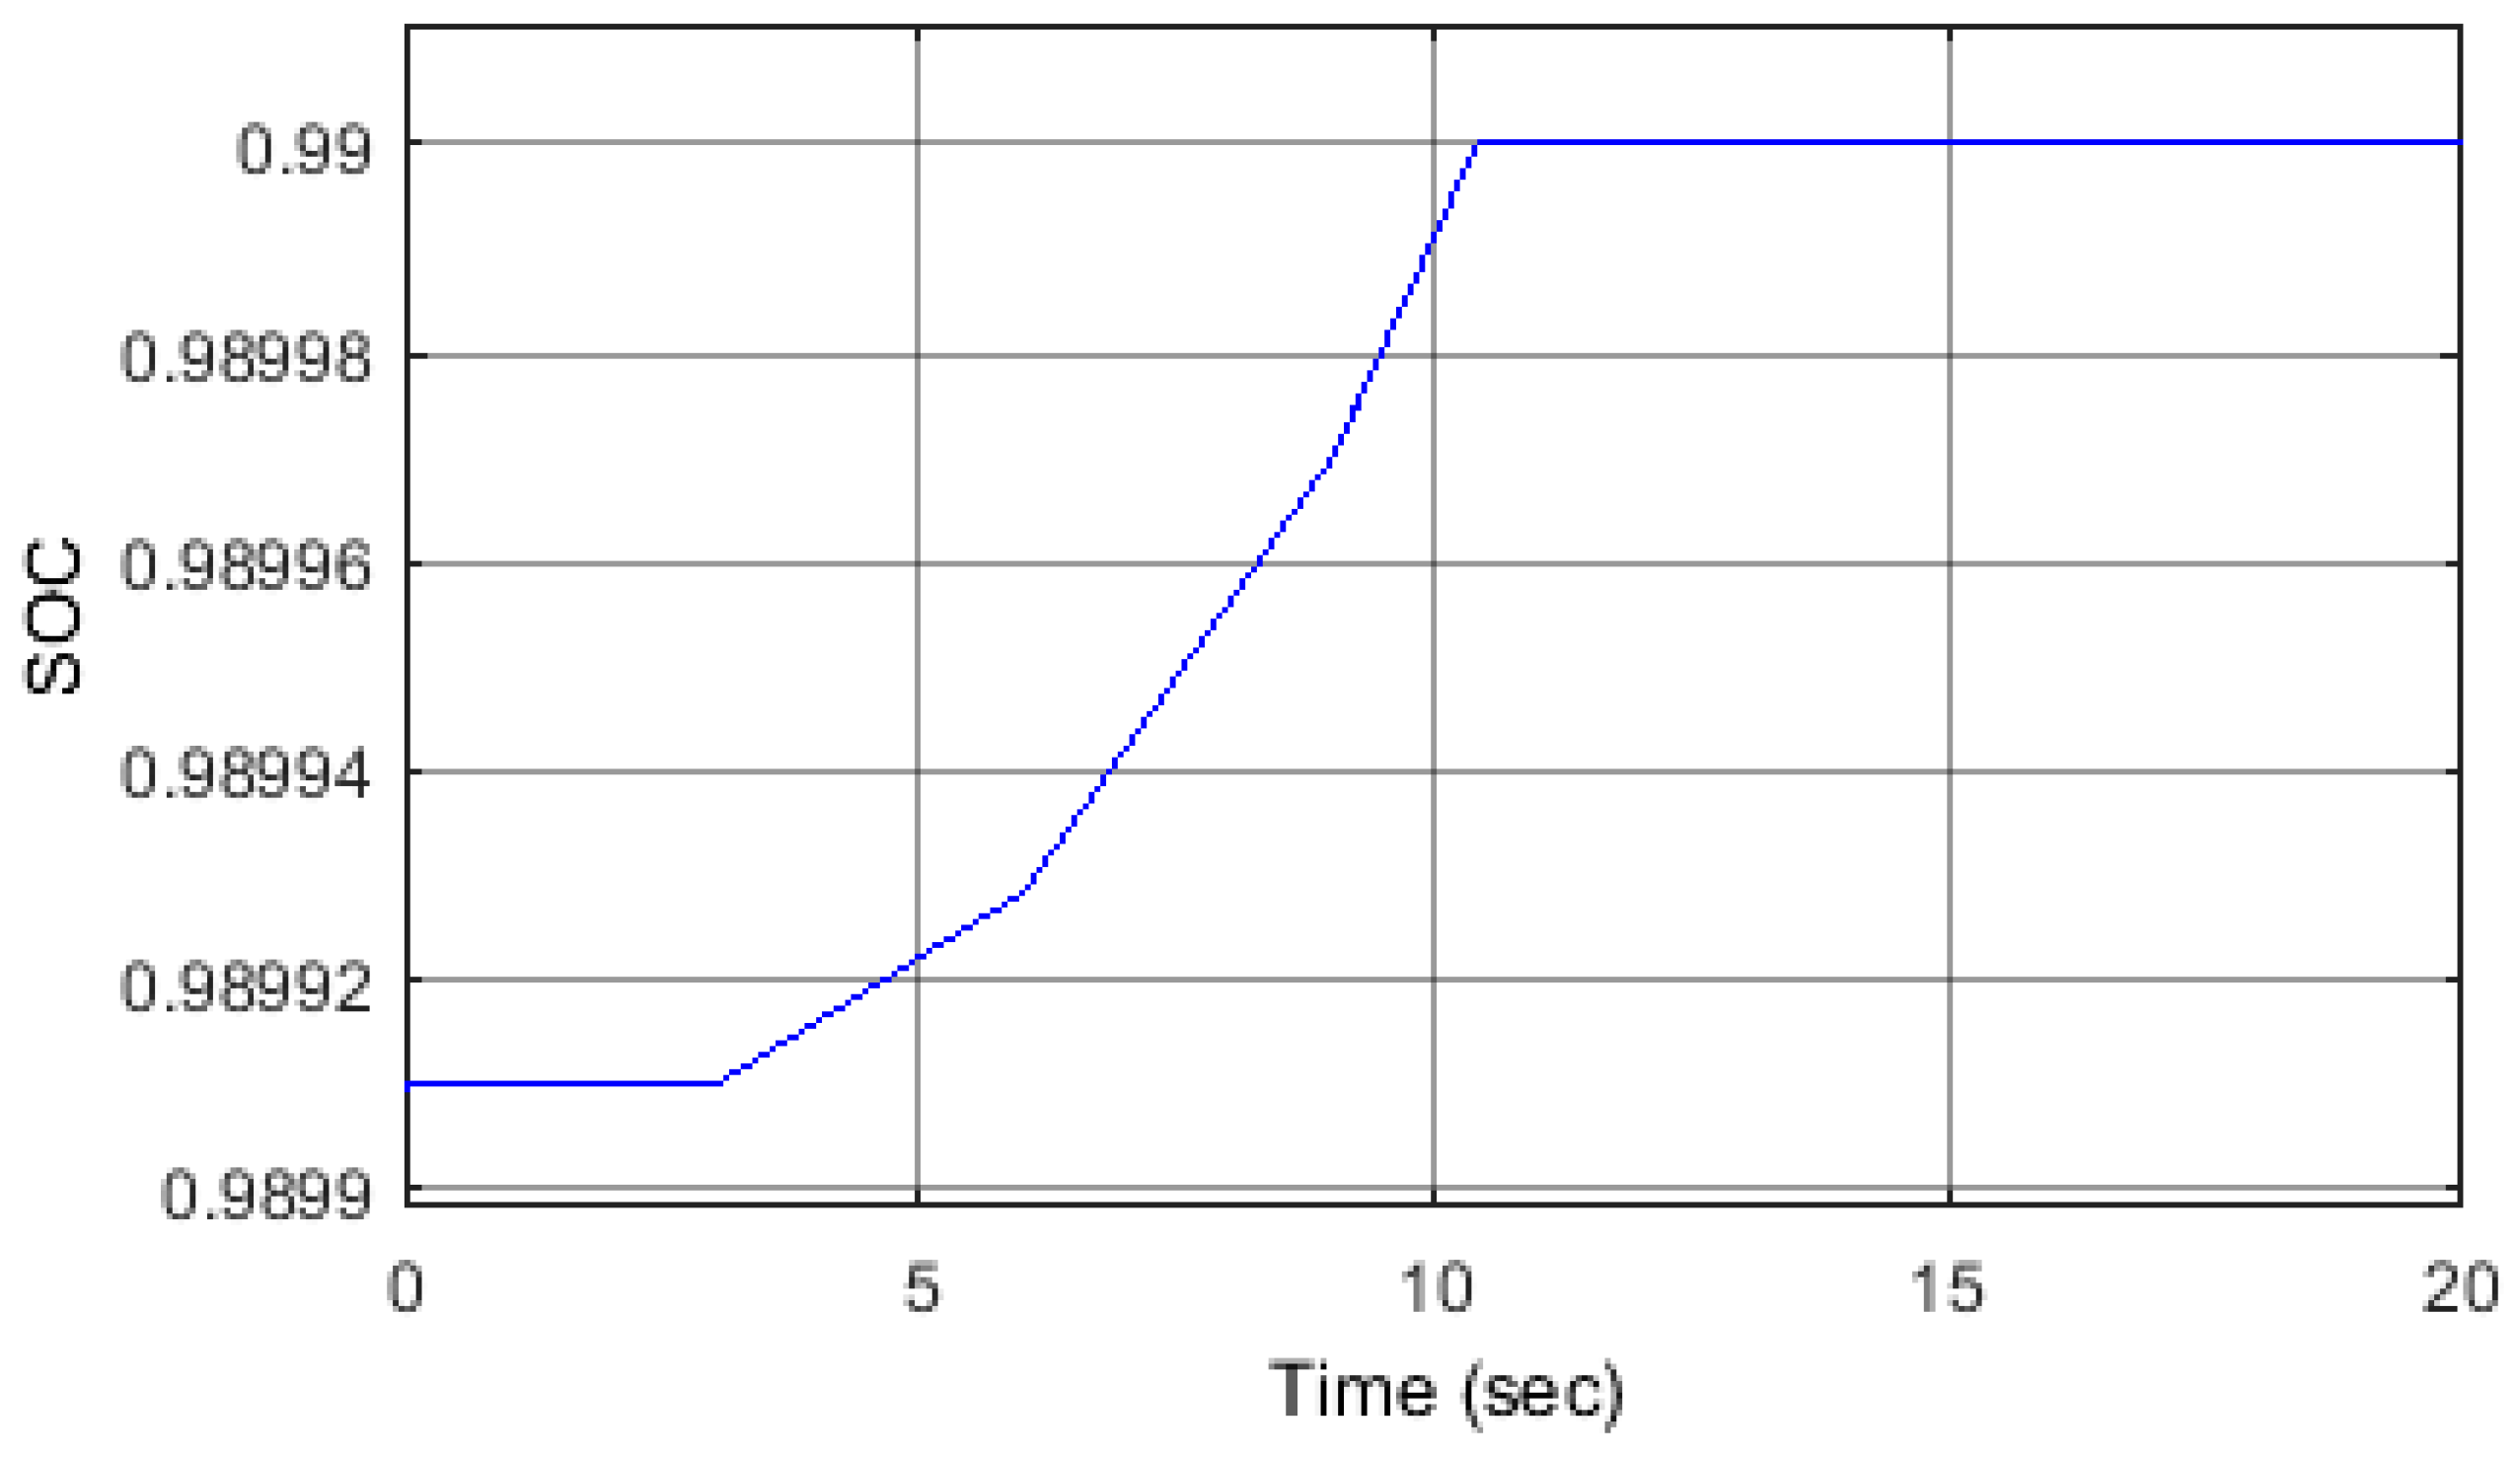
changes in load’s active and reactive power, battery SoC reaches its maximum level;
Scenario 3:
changes in load’s active and reactive power, battery SoC reaches its minimum level.

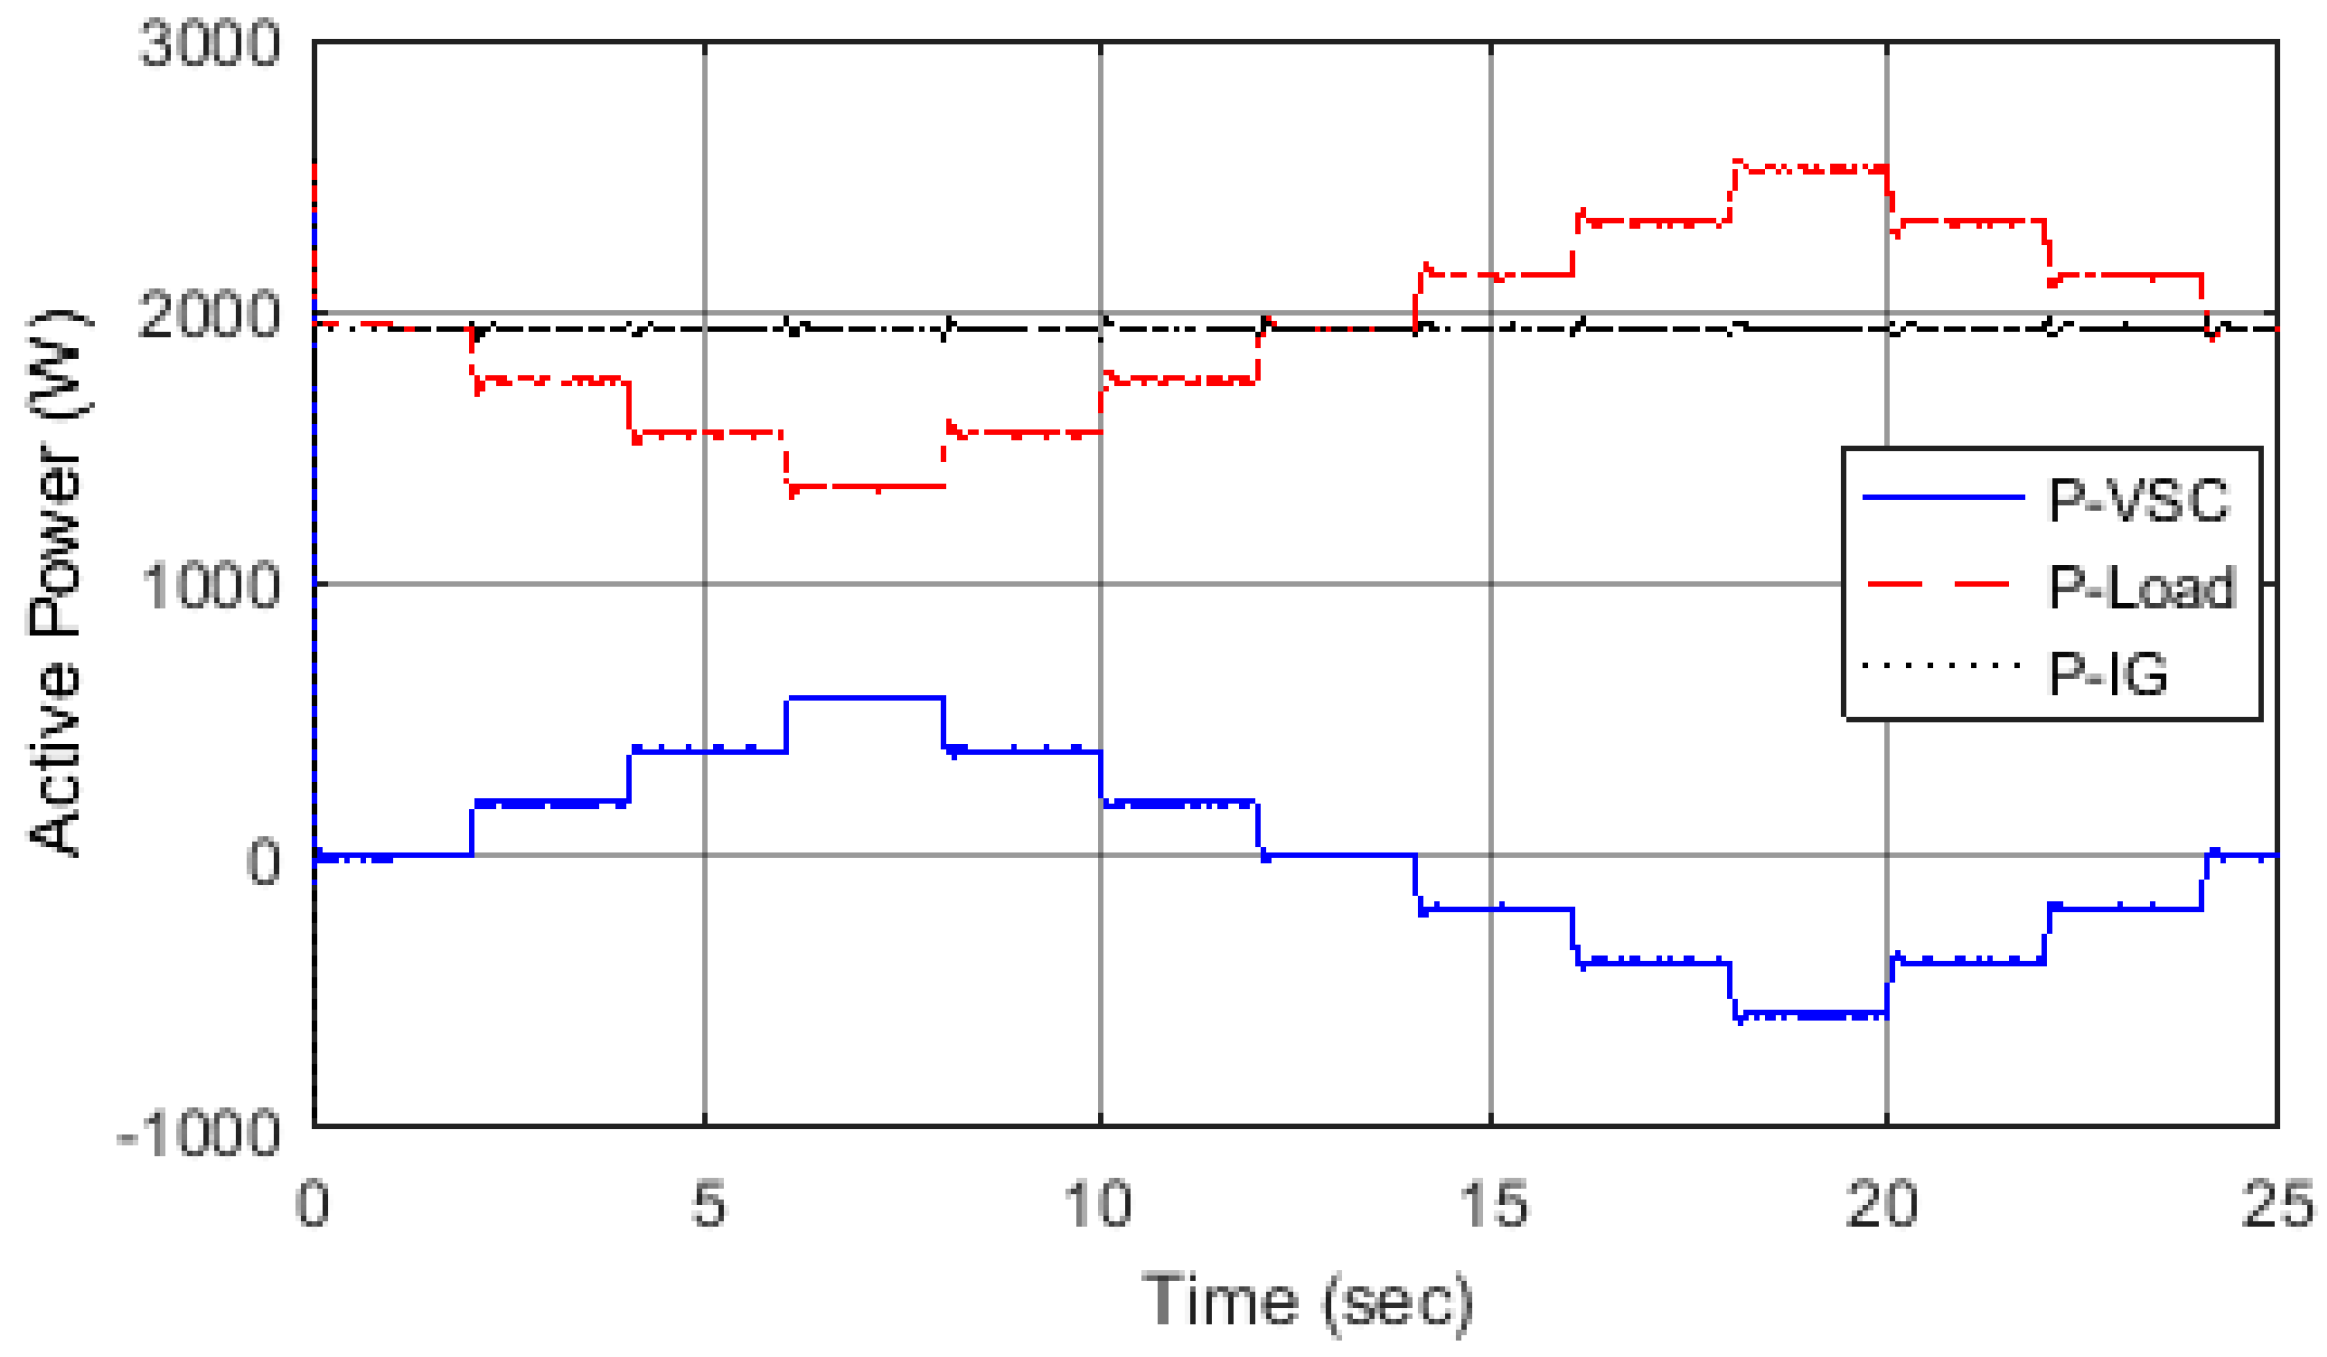
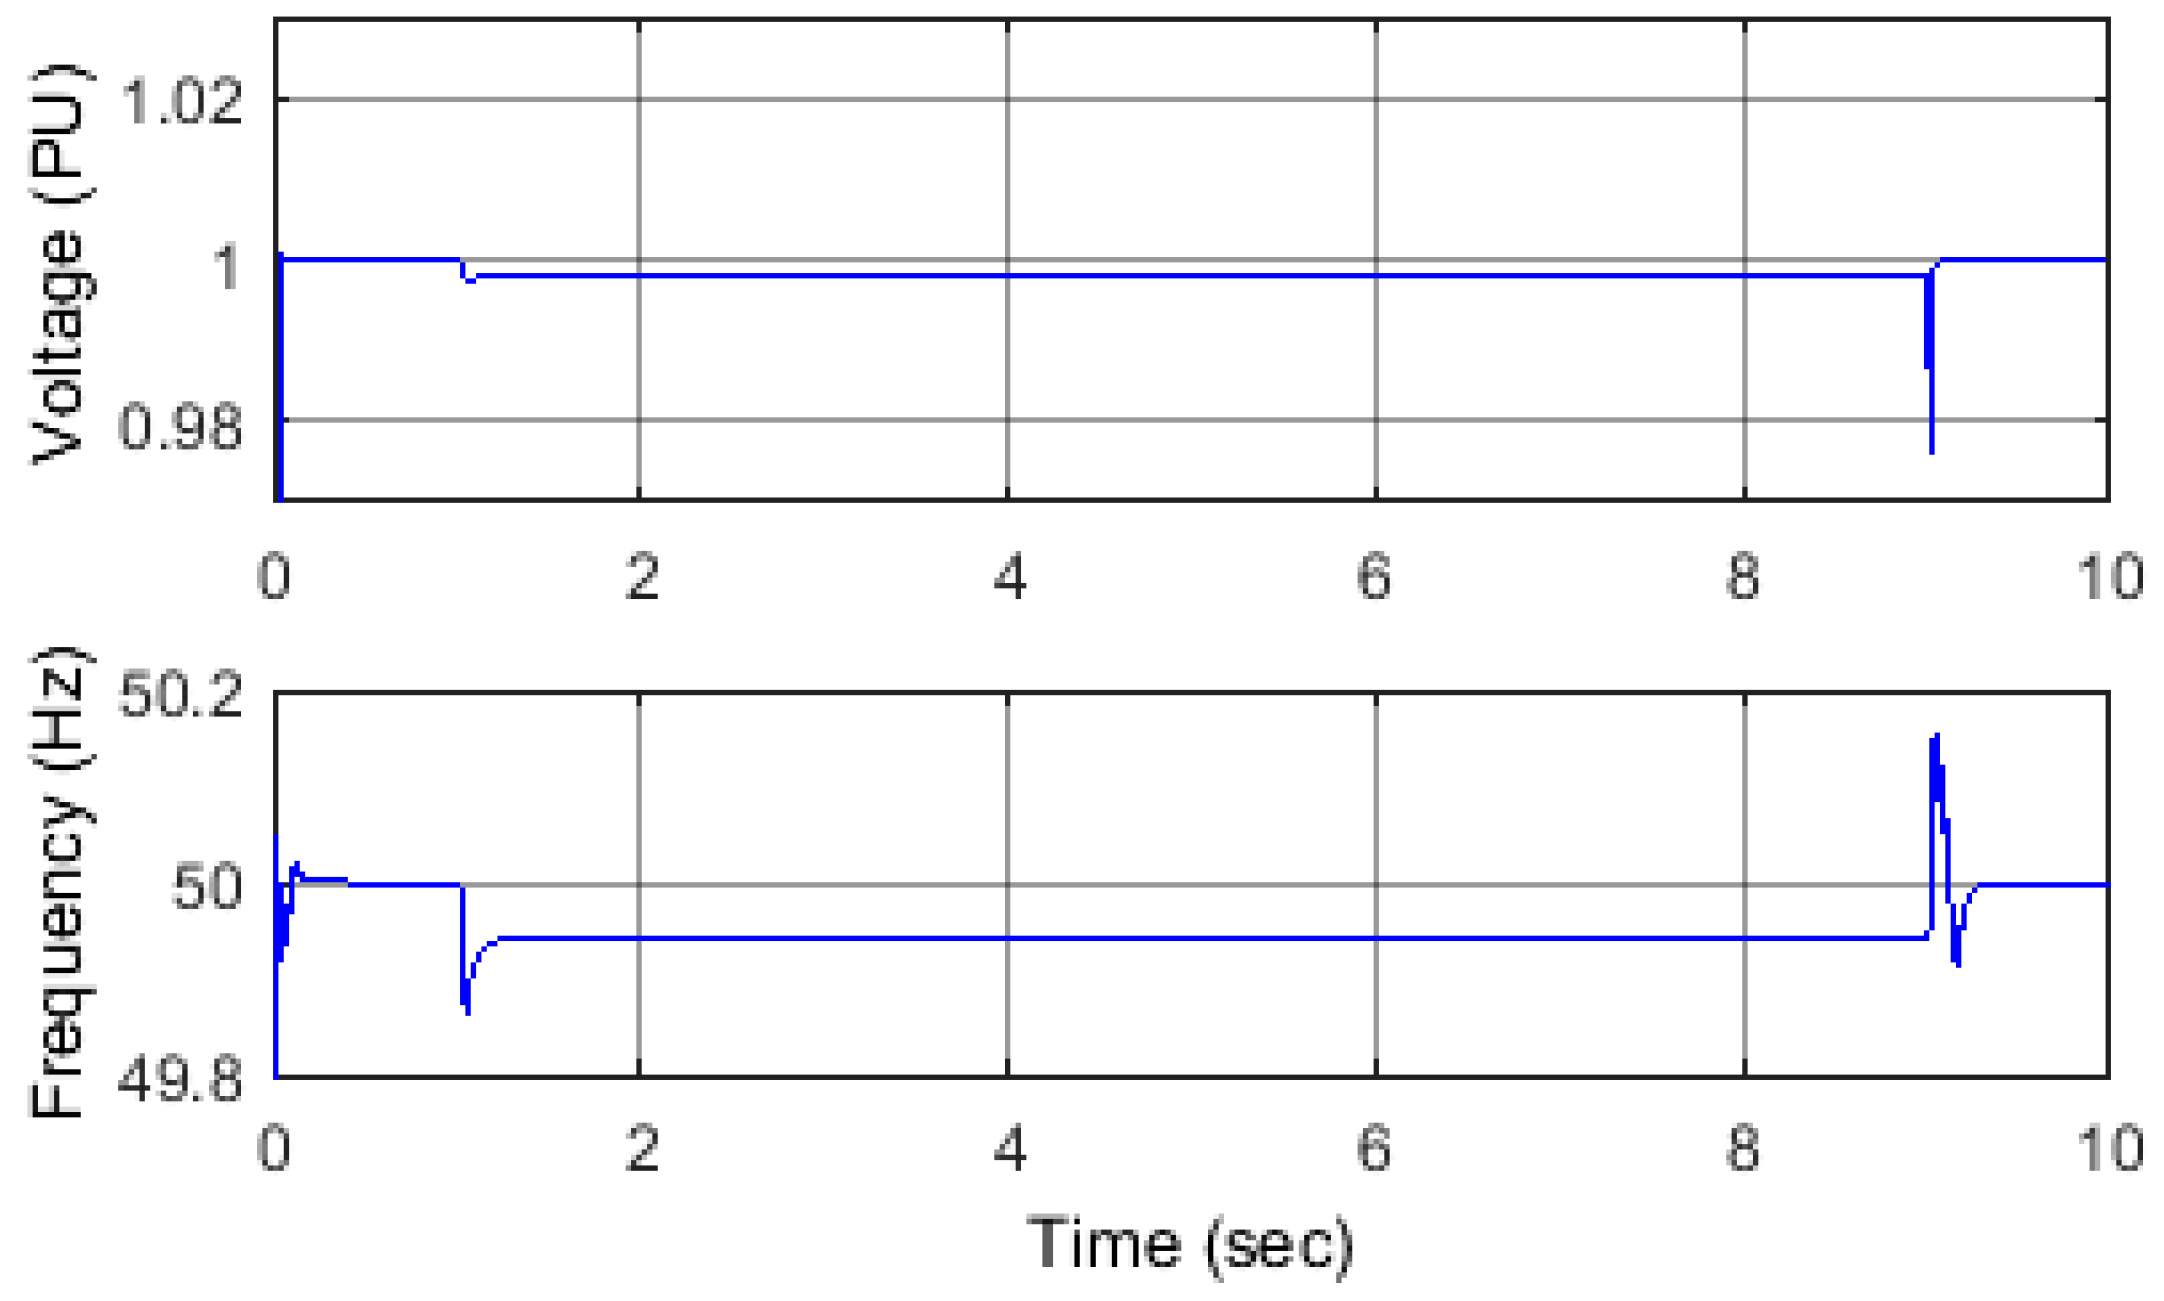
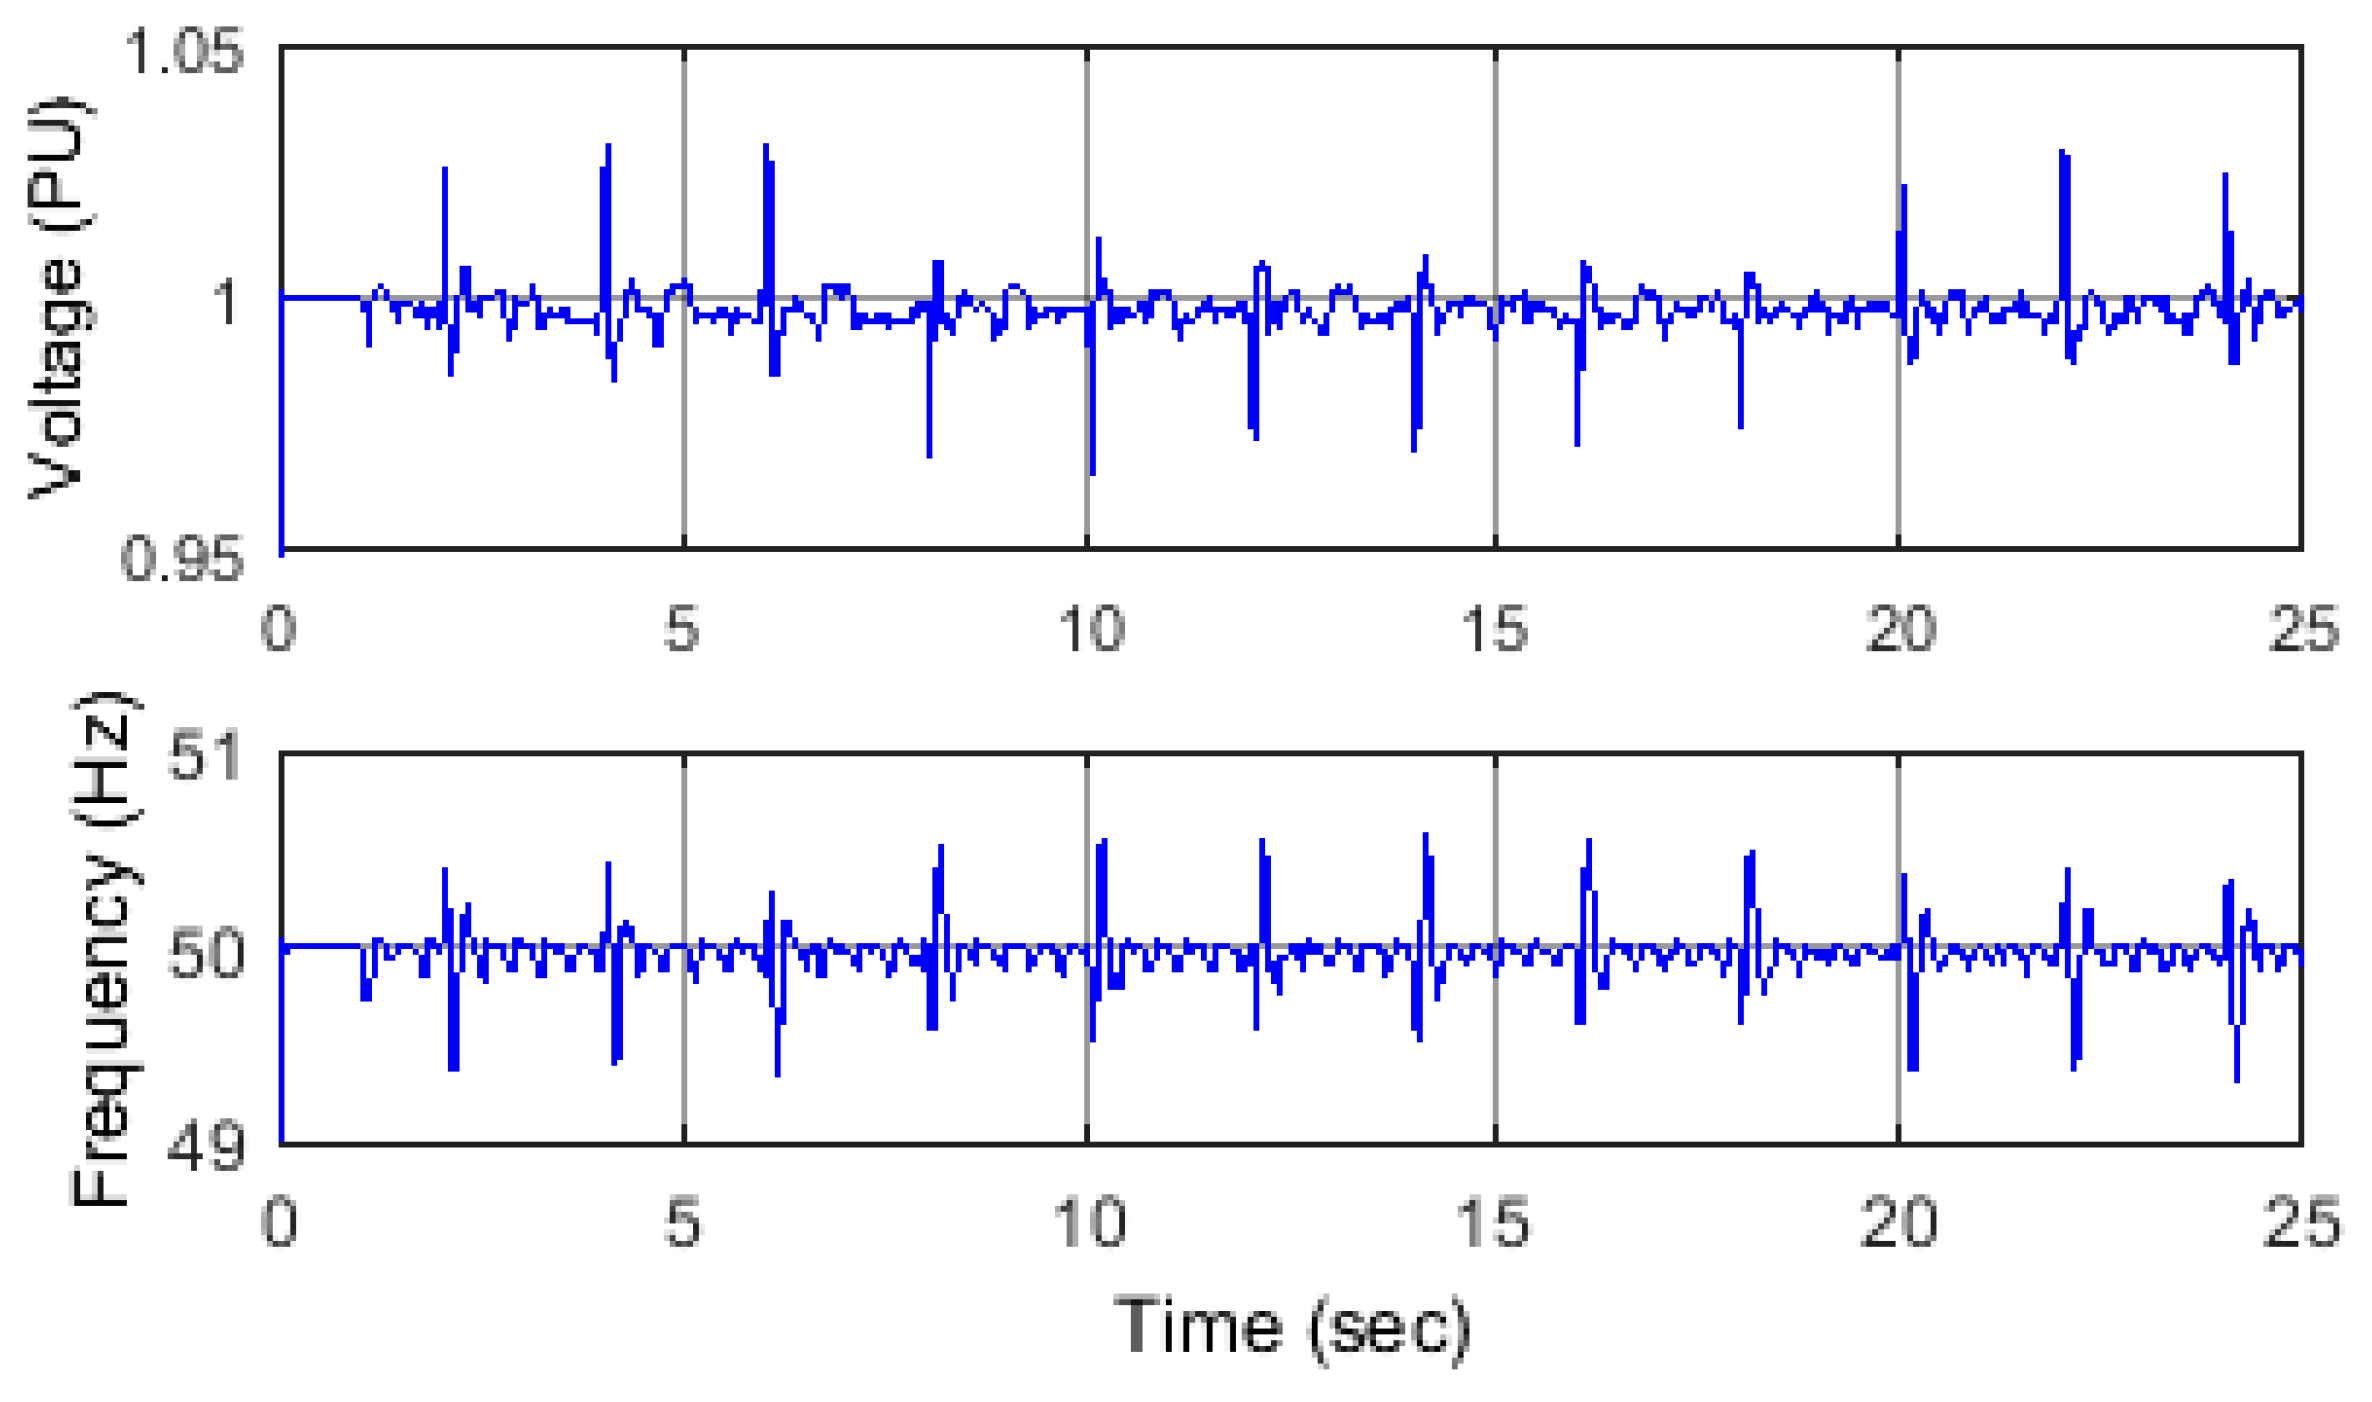
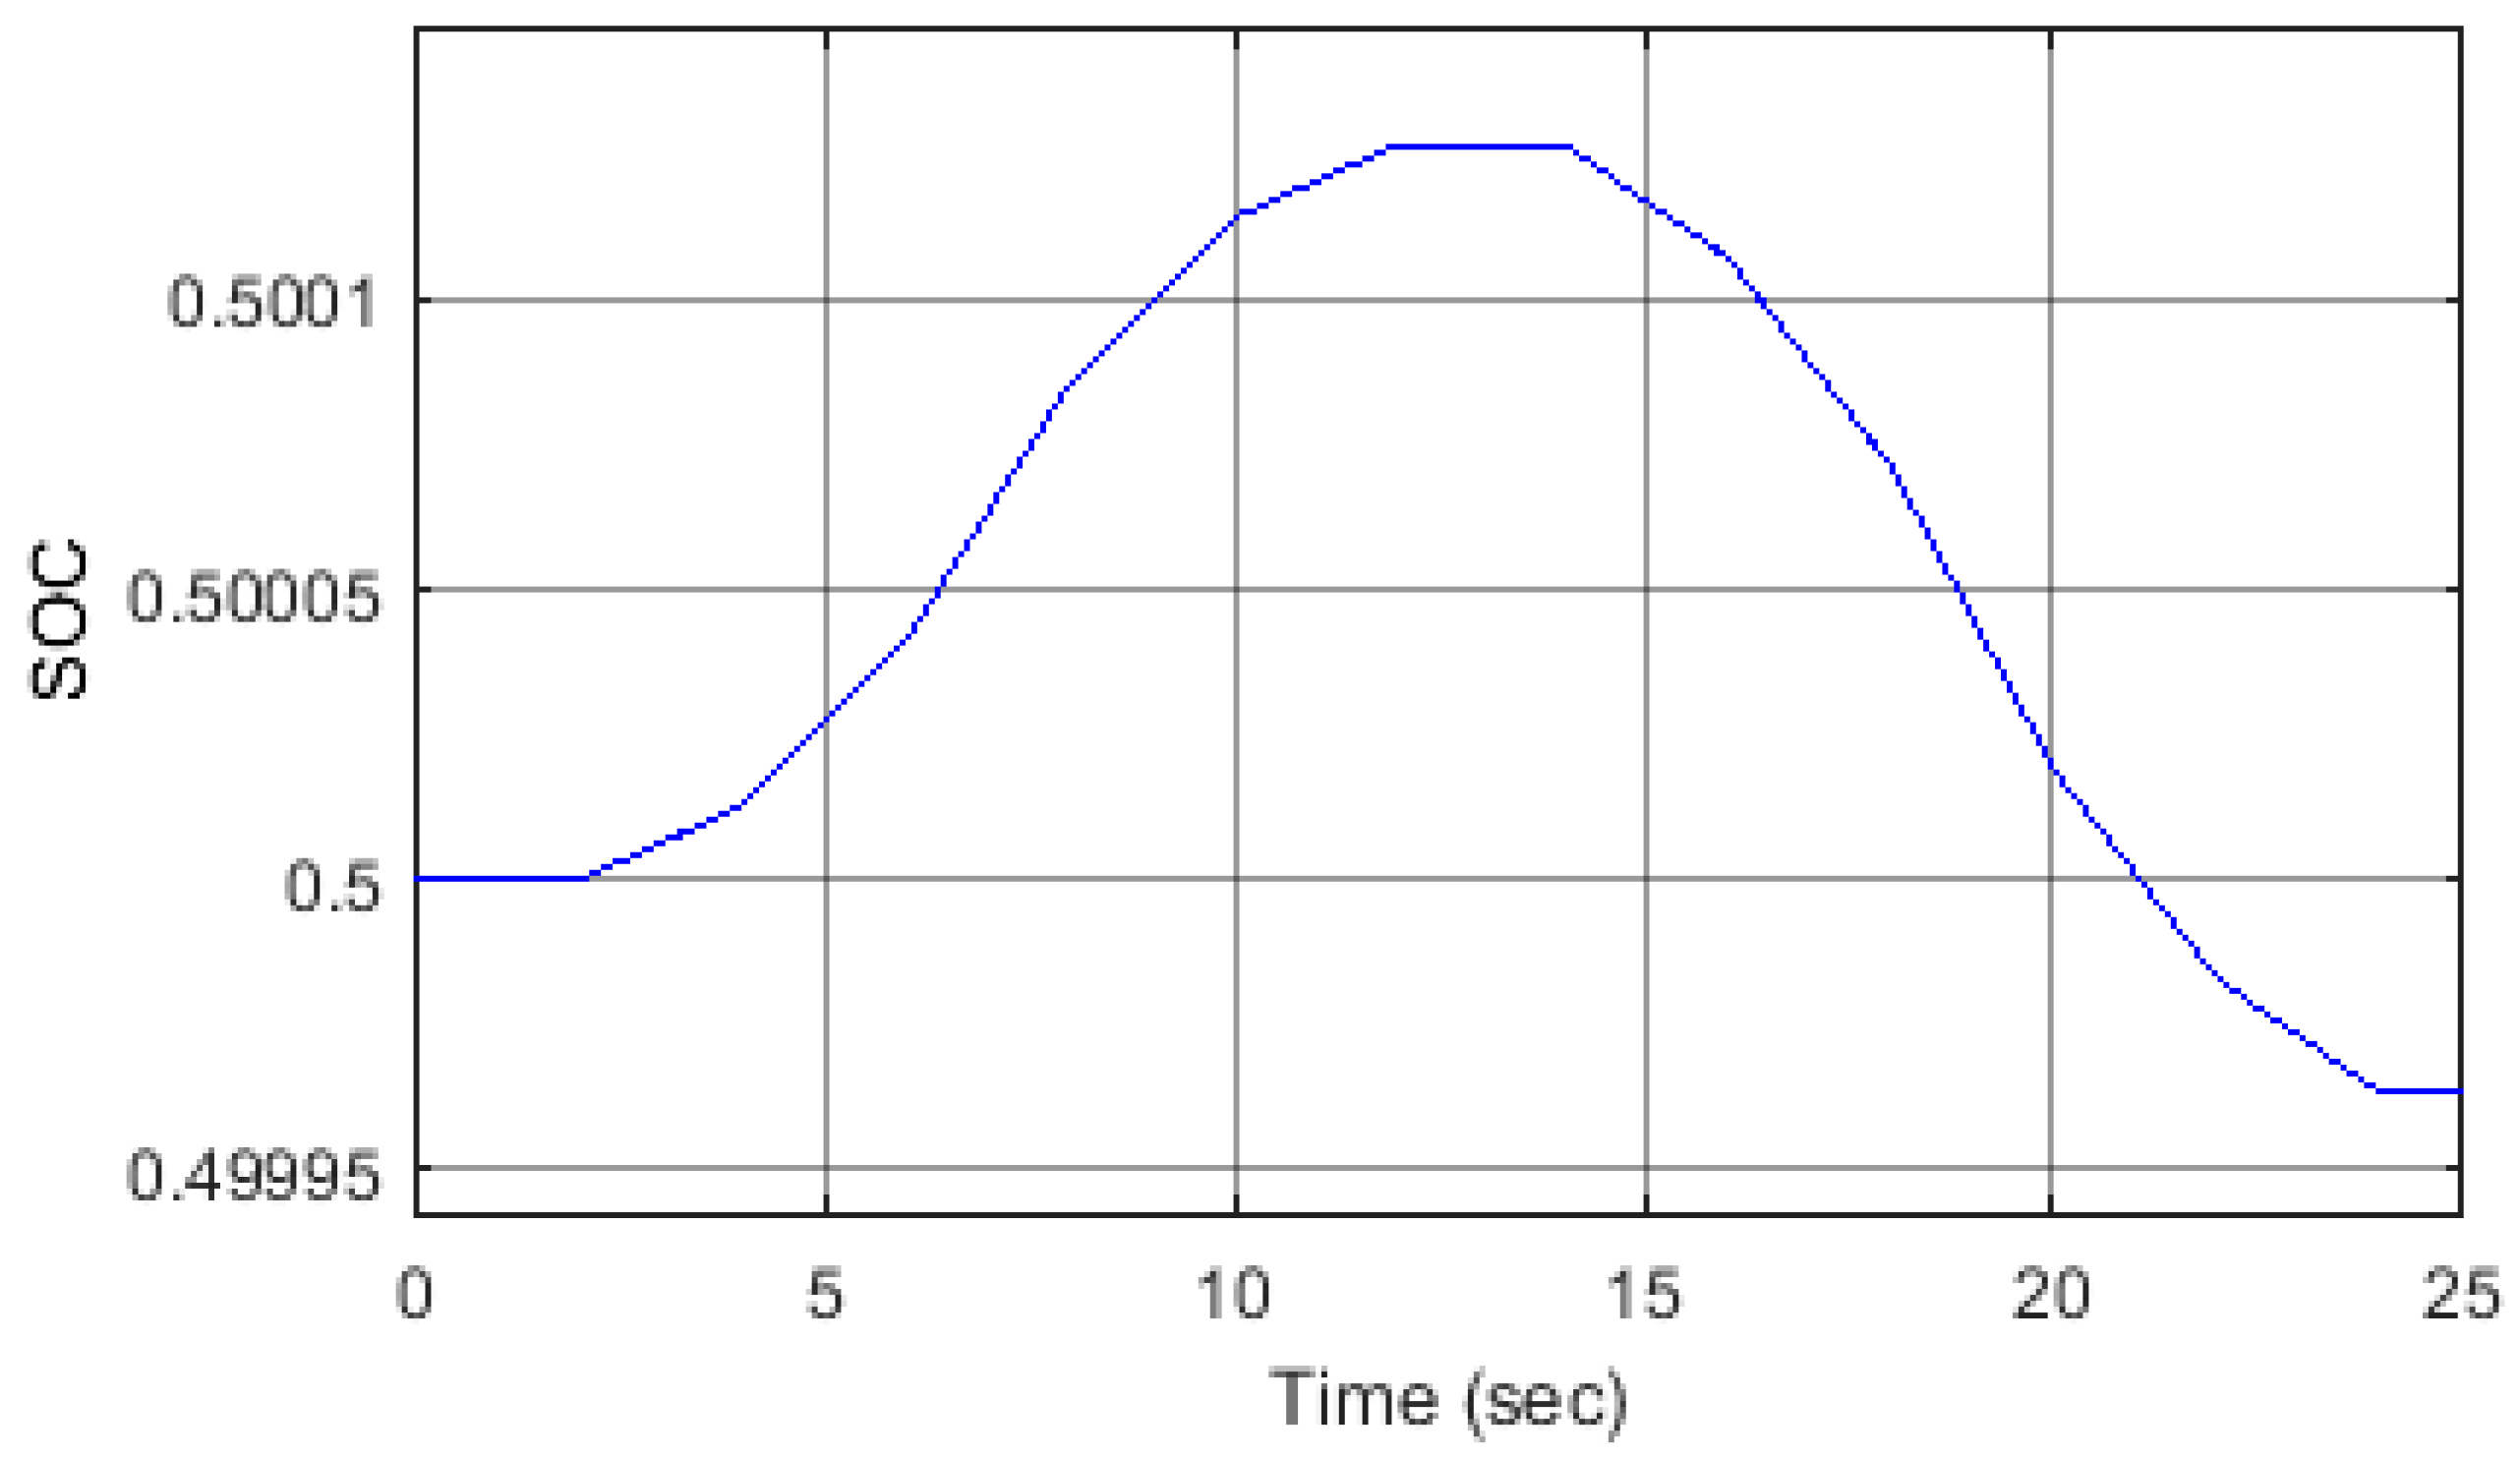
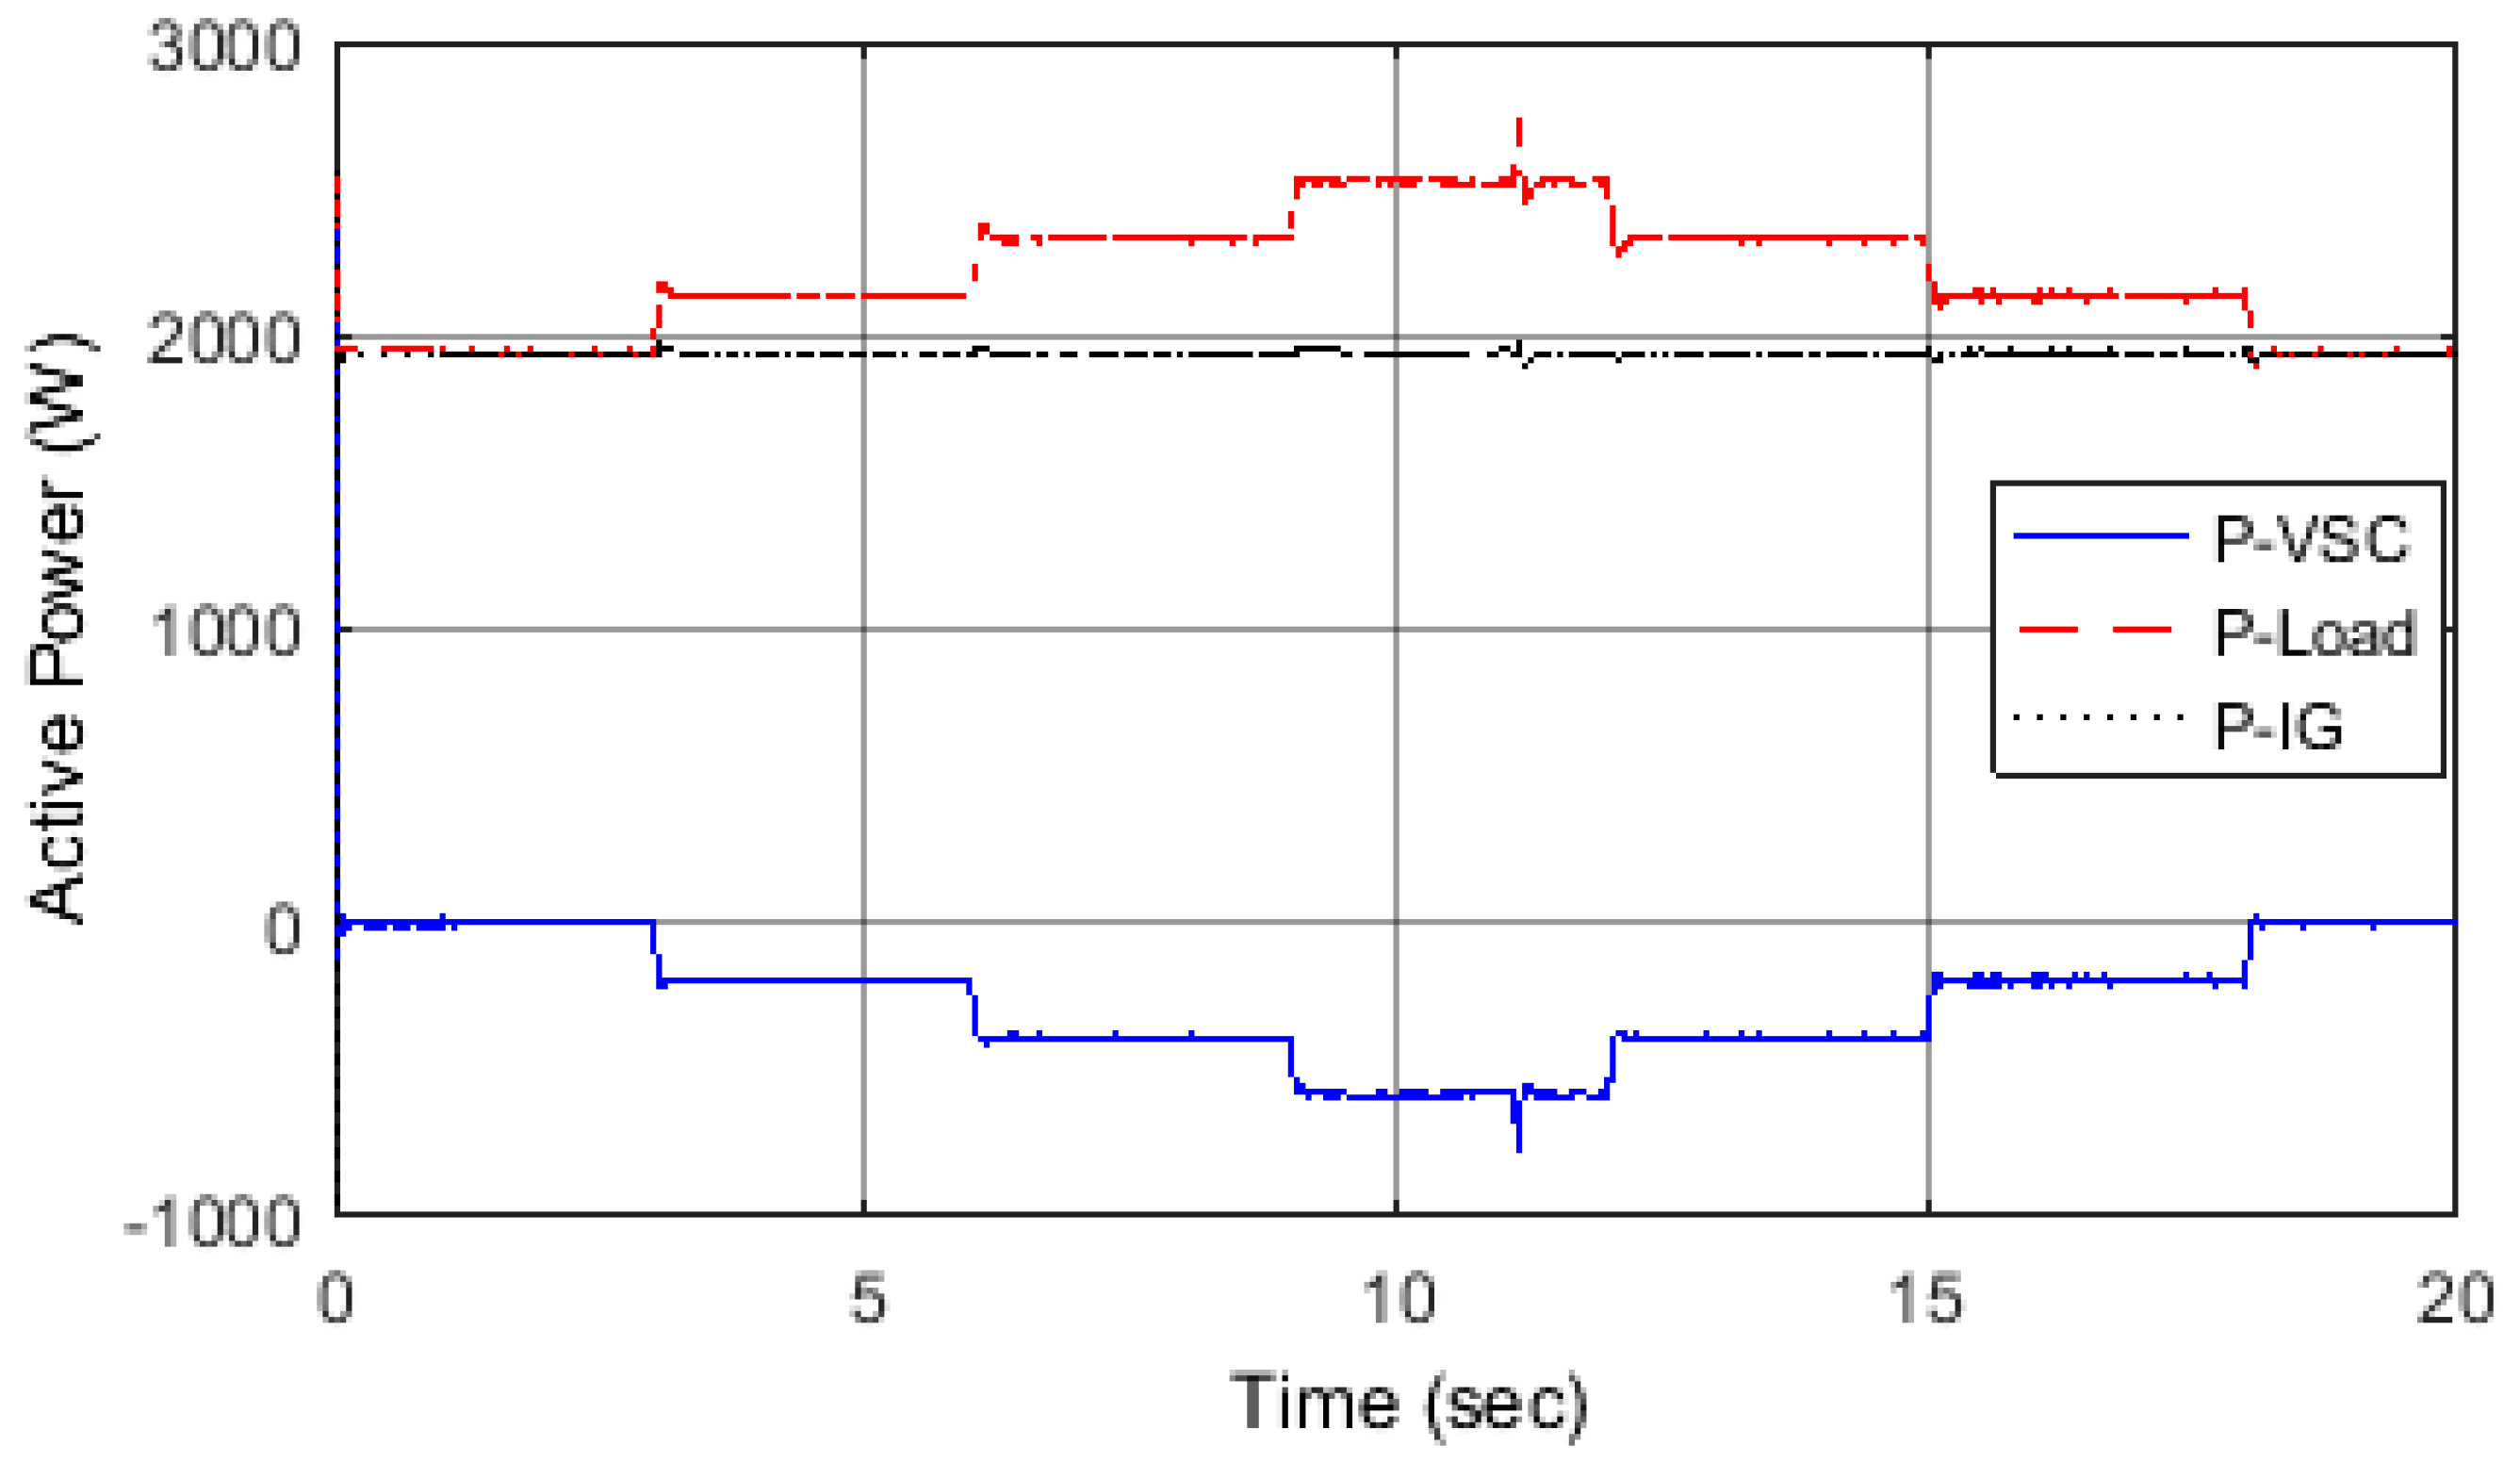
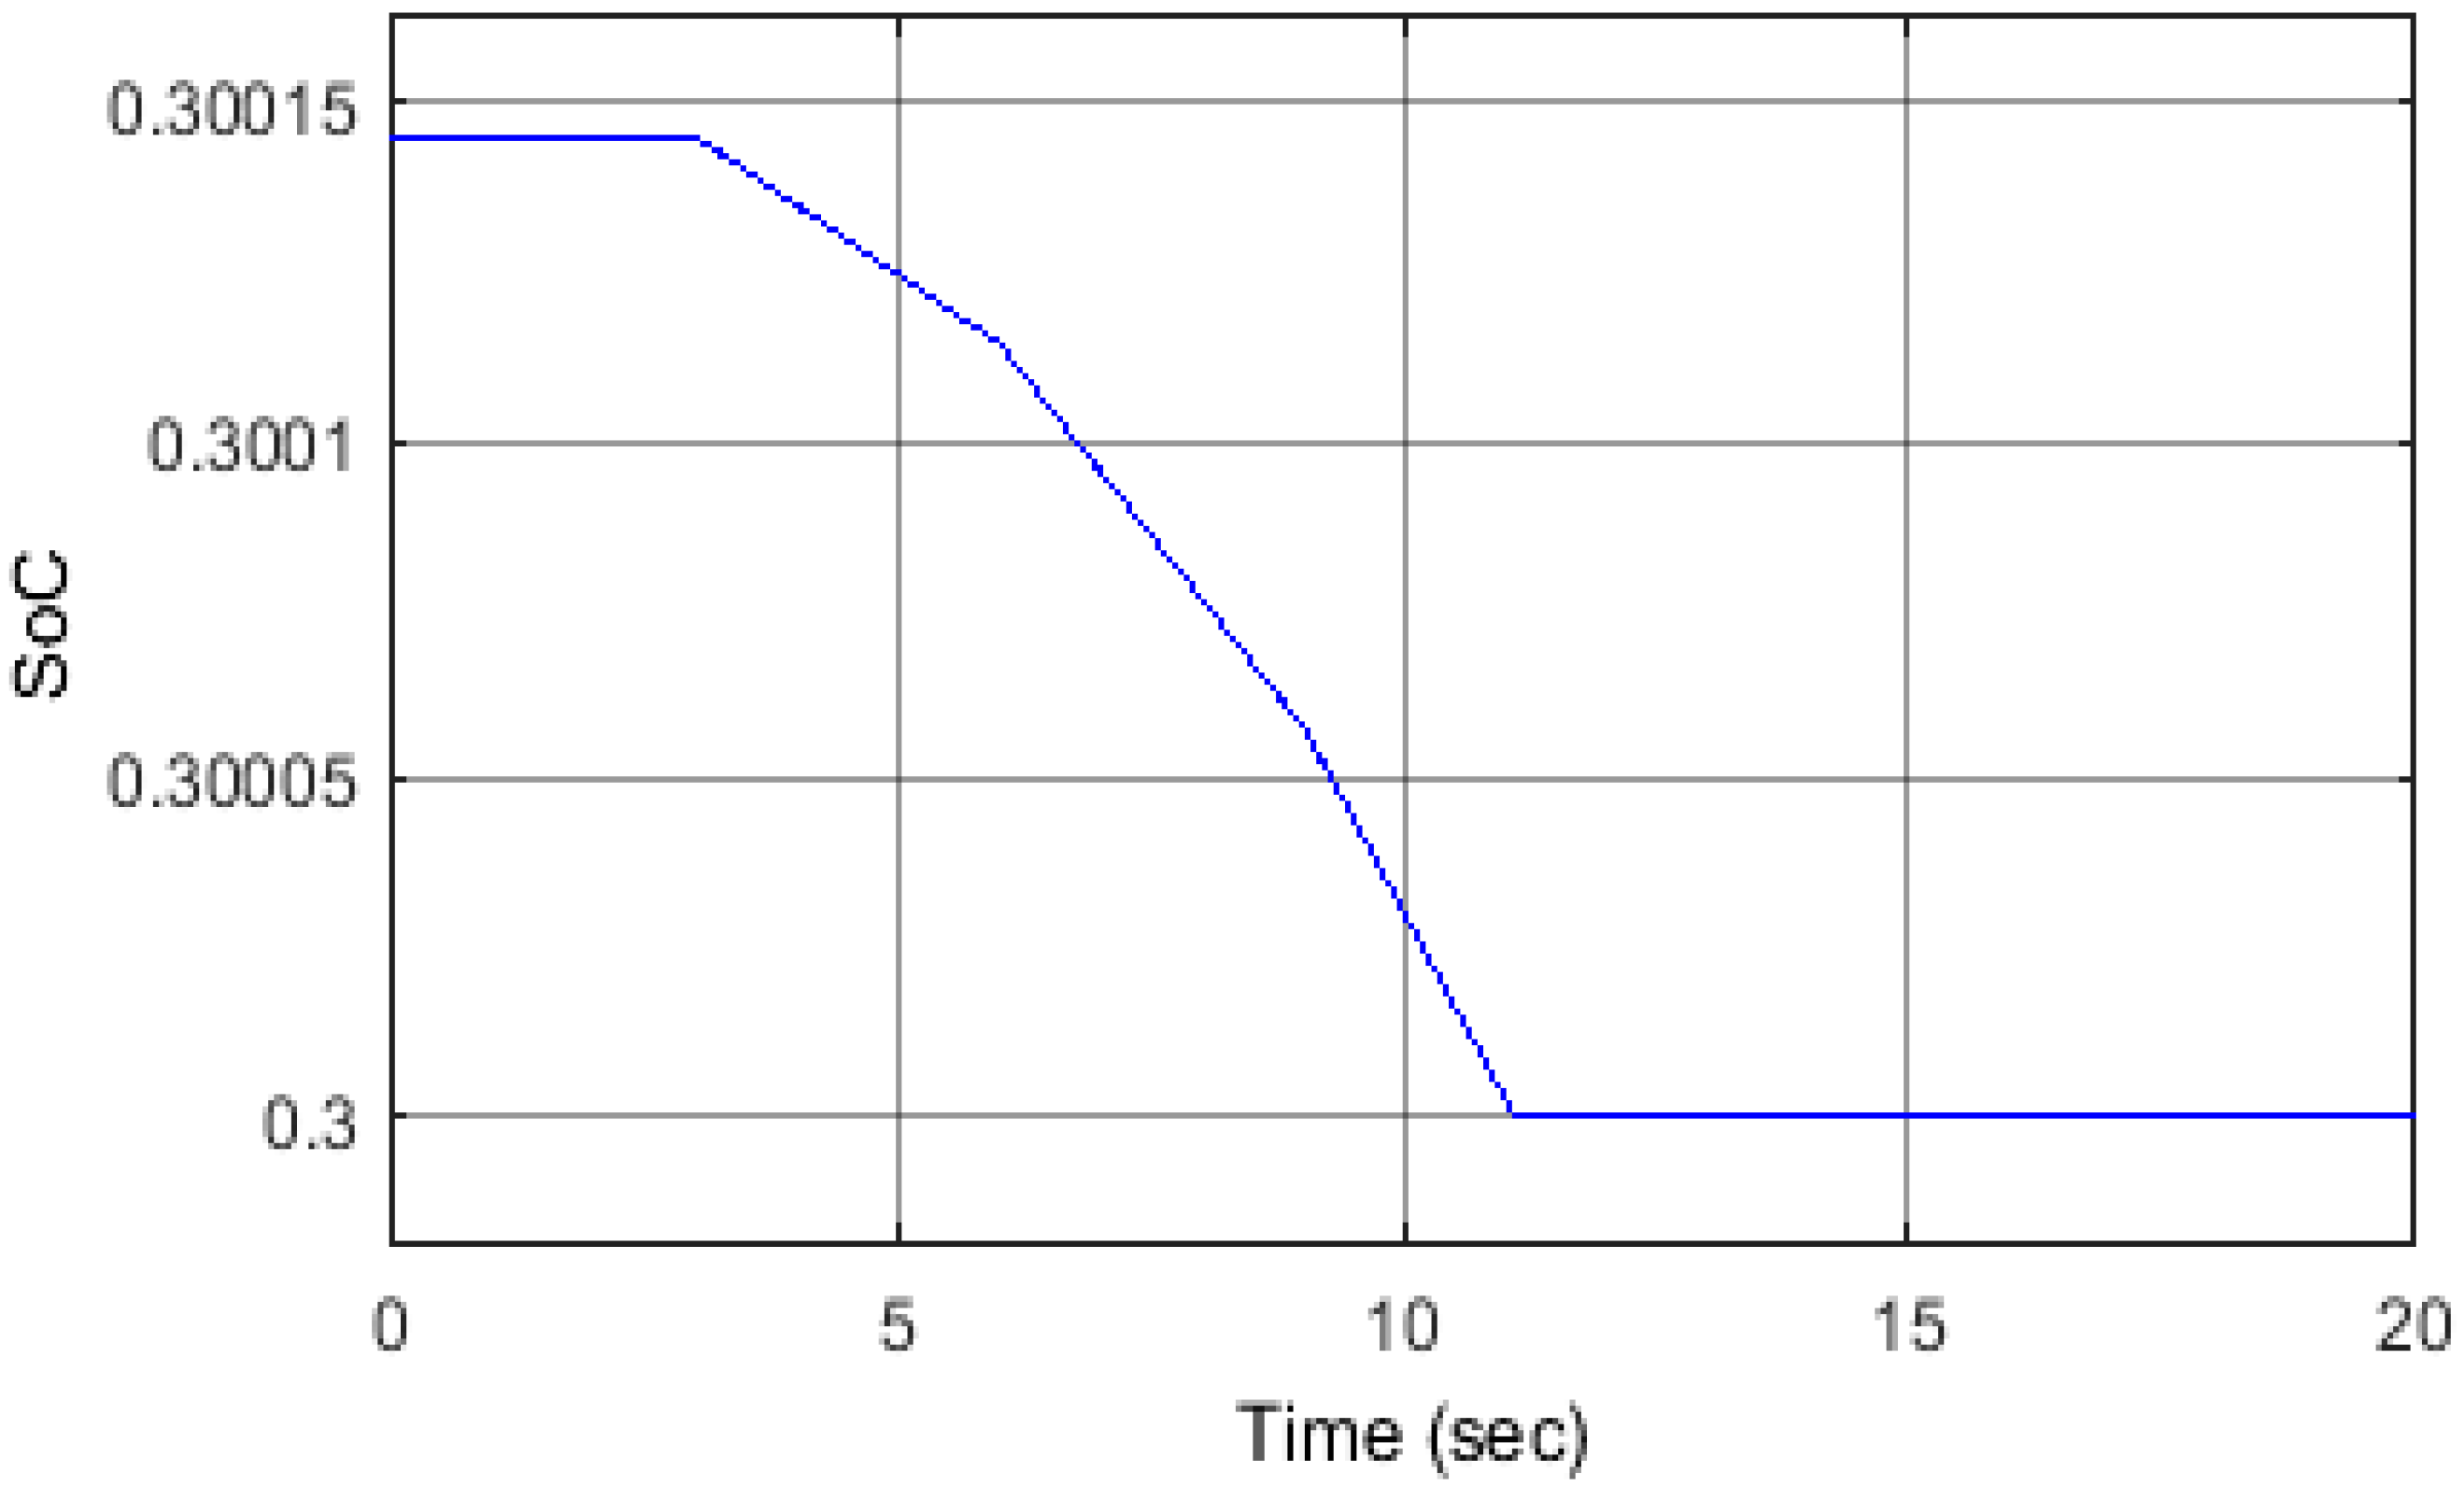
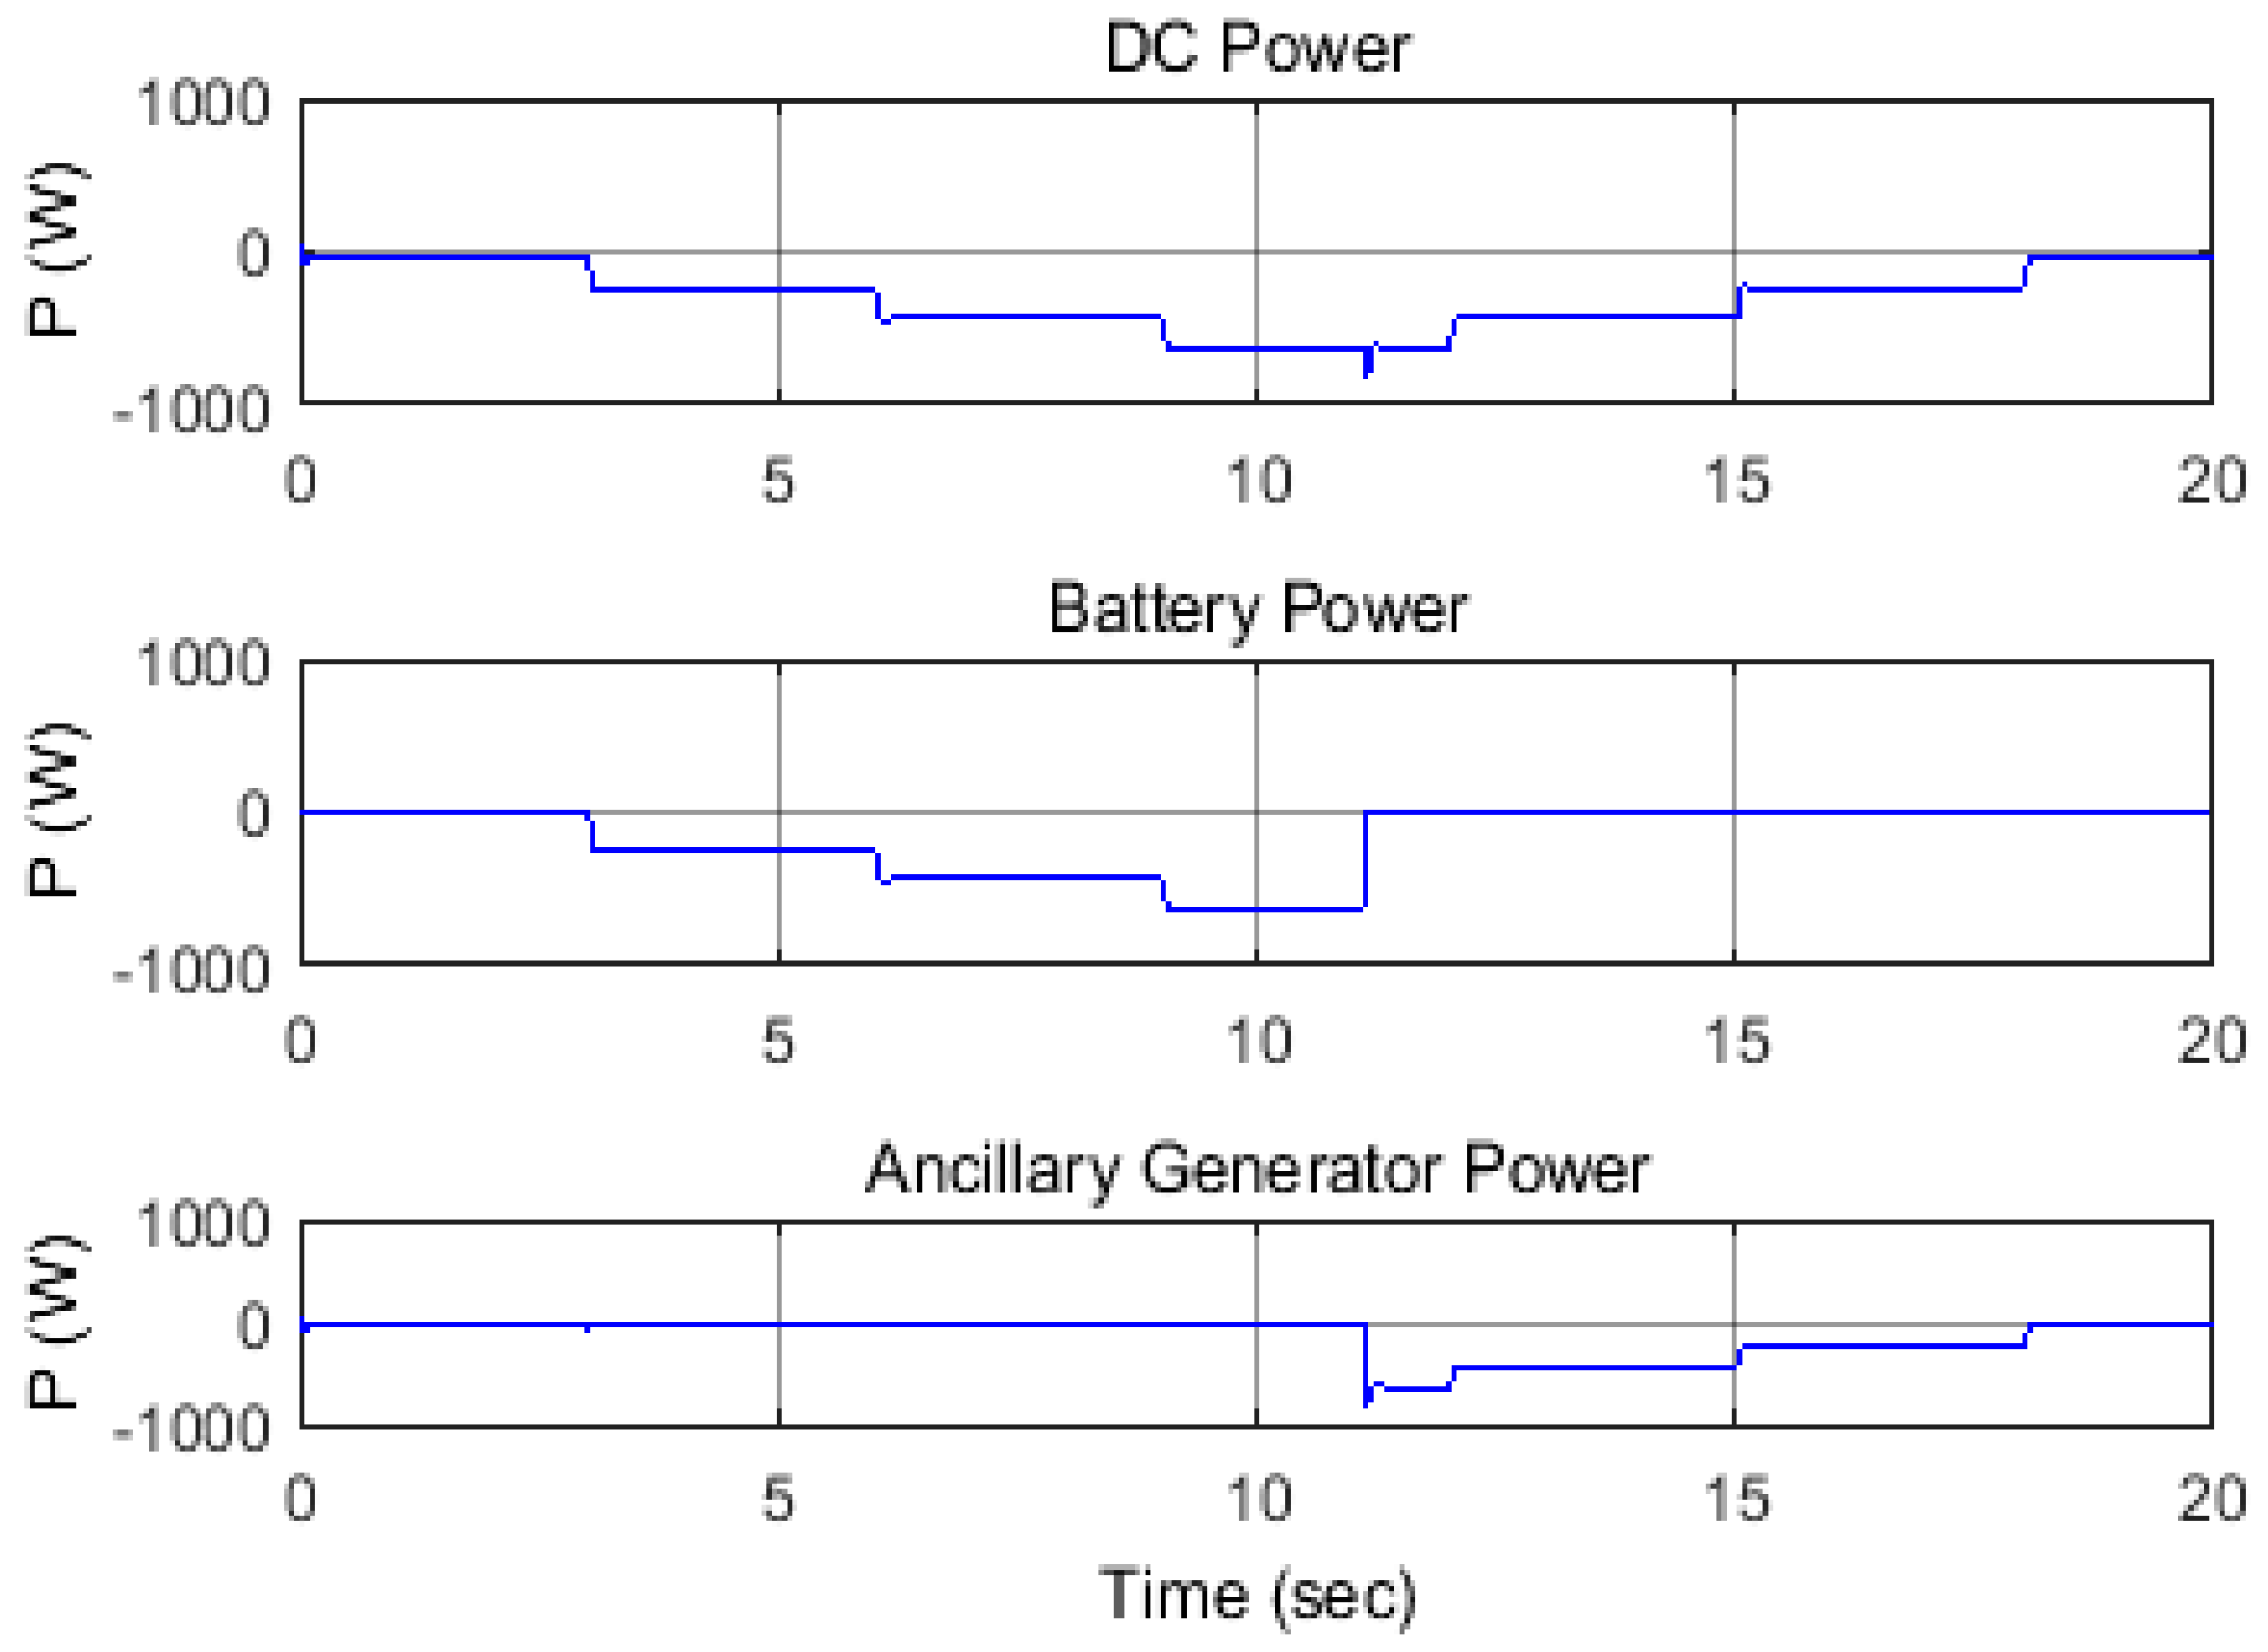
5.1. Scenario 1: Variation of Load’s Active Power

In this scenario the load’s active power was changed to below and above the optimal value. First, the load power decreases in three steps, 10% of its optimal value each time. Then the load power consumption increases in three steps, 10% each time. The SEIG was disconnected from the main grid at time t = 1 s. The duration of each of the 10% steps described above was set to be two seconds. In this scenario, the battery SoC did not reach any of its limits, and therefore the battery was able to be charged and discharged as a result of the load power variations. The change of load power is shown in Figure 6, which also illustrates the compensated power (P-VSC) to/from the ESS via the VSC. It was clear that the SEIG output power was kept constant irrespective of the load variations. A positive polarity of the VSC power indicates that power is absorbed from the micro-grid while a negative polarity indicates that power is injected into the micro-grid to compensate for the load changes. Figure 7 shows that both voltage magnitude and frequency are within their permissible values during the power variation, which were ±10%, and ±1% for the frequency [38]. The SoC of the battery for this scenario is shown in Figure 8, it was obvious that the battery was charging/discharging according to the changes in the load demand: note that the initial SoC was assumed to be 50%.

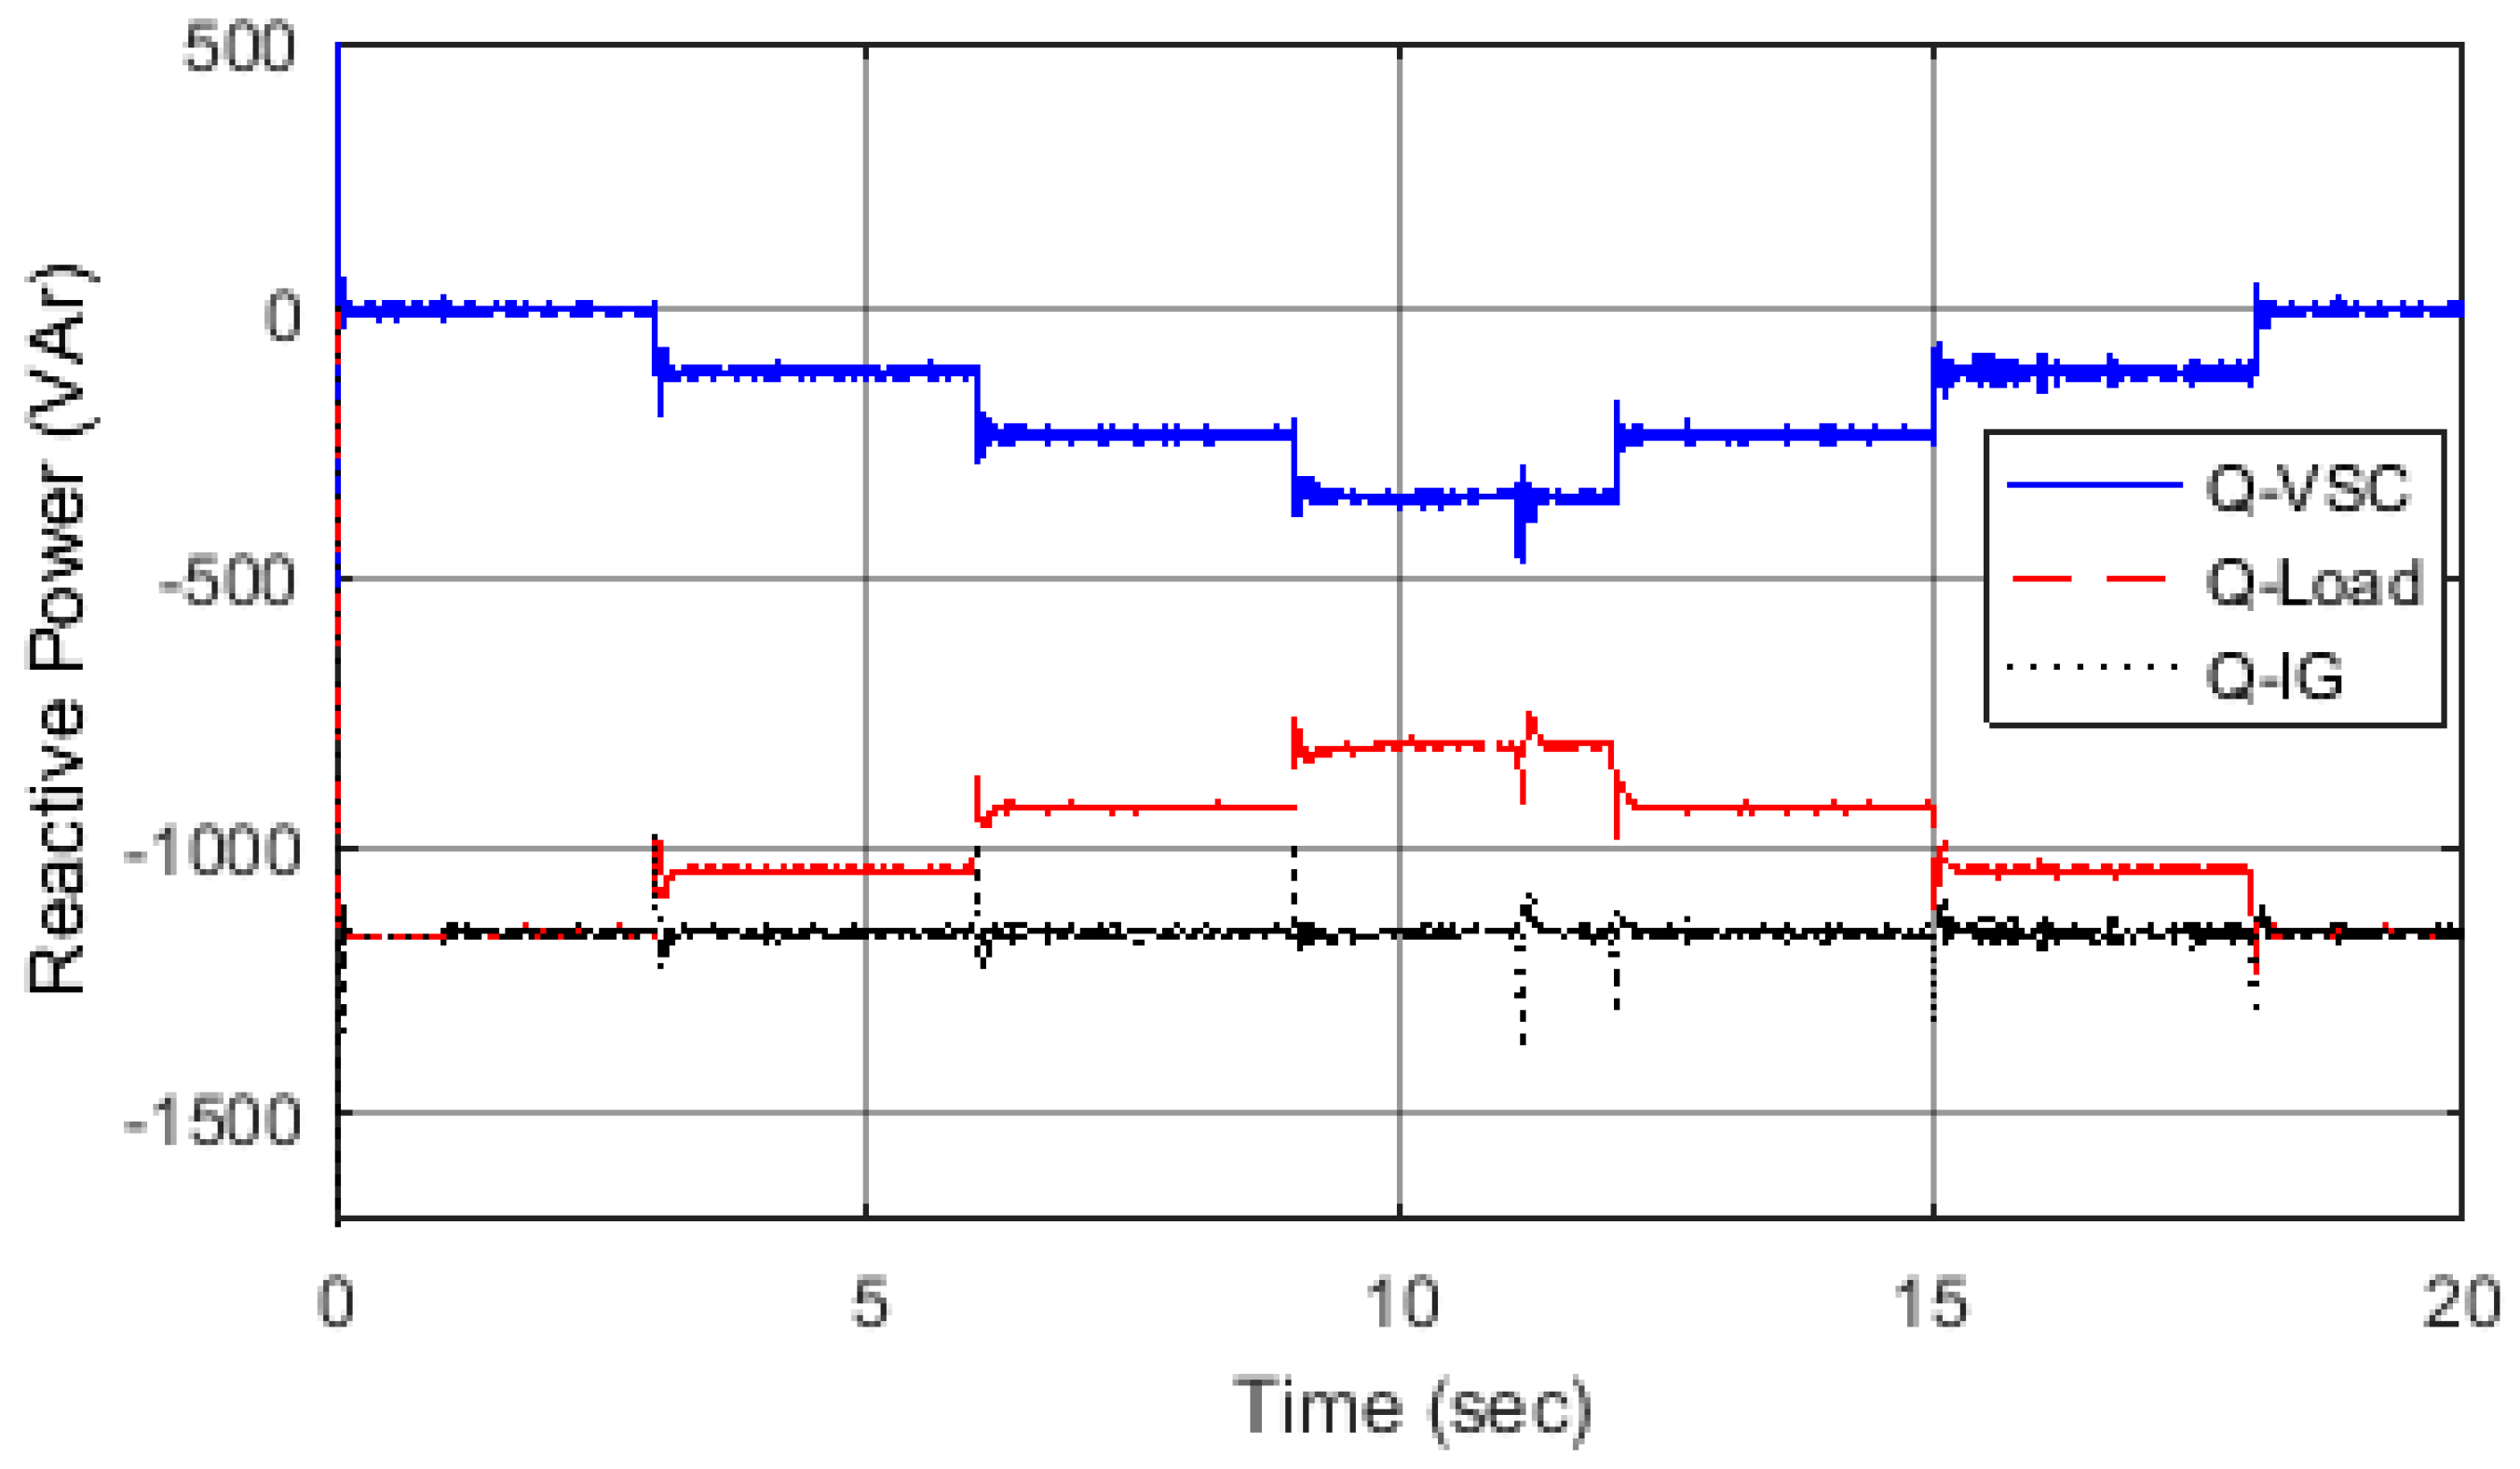
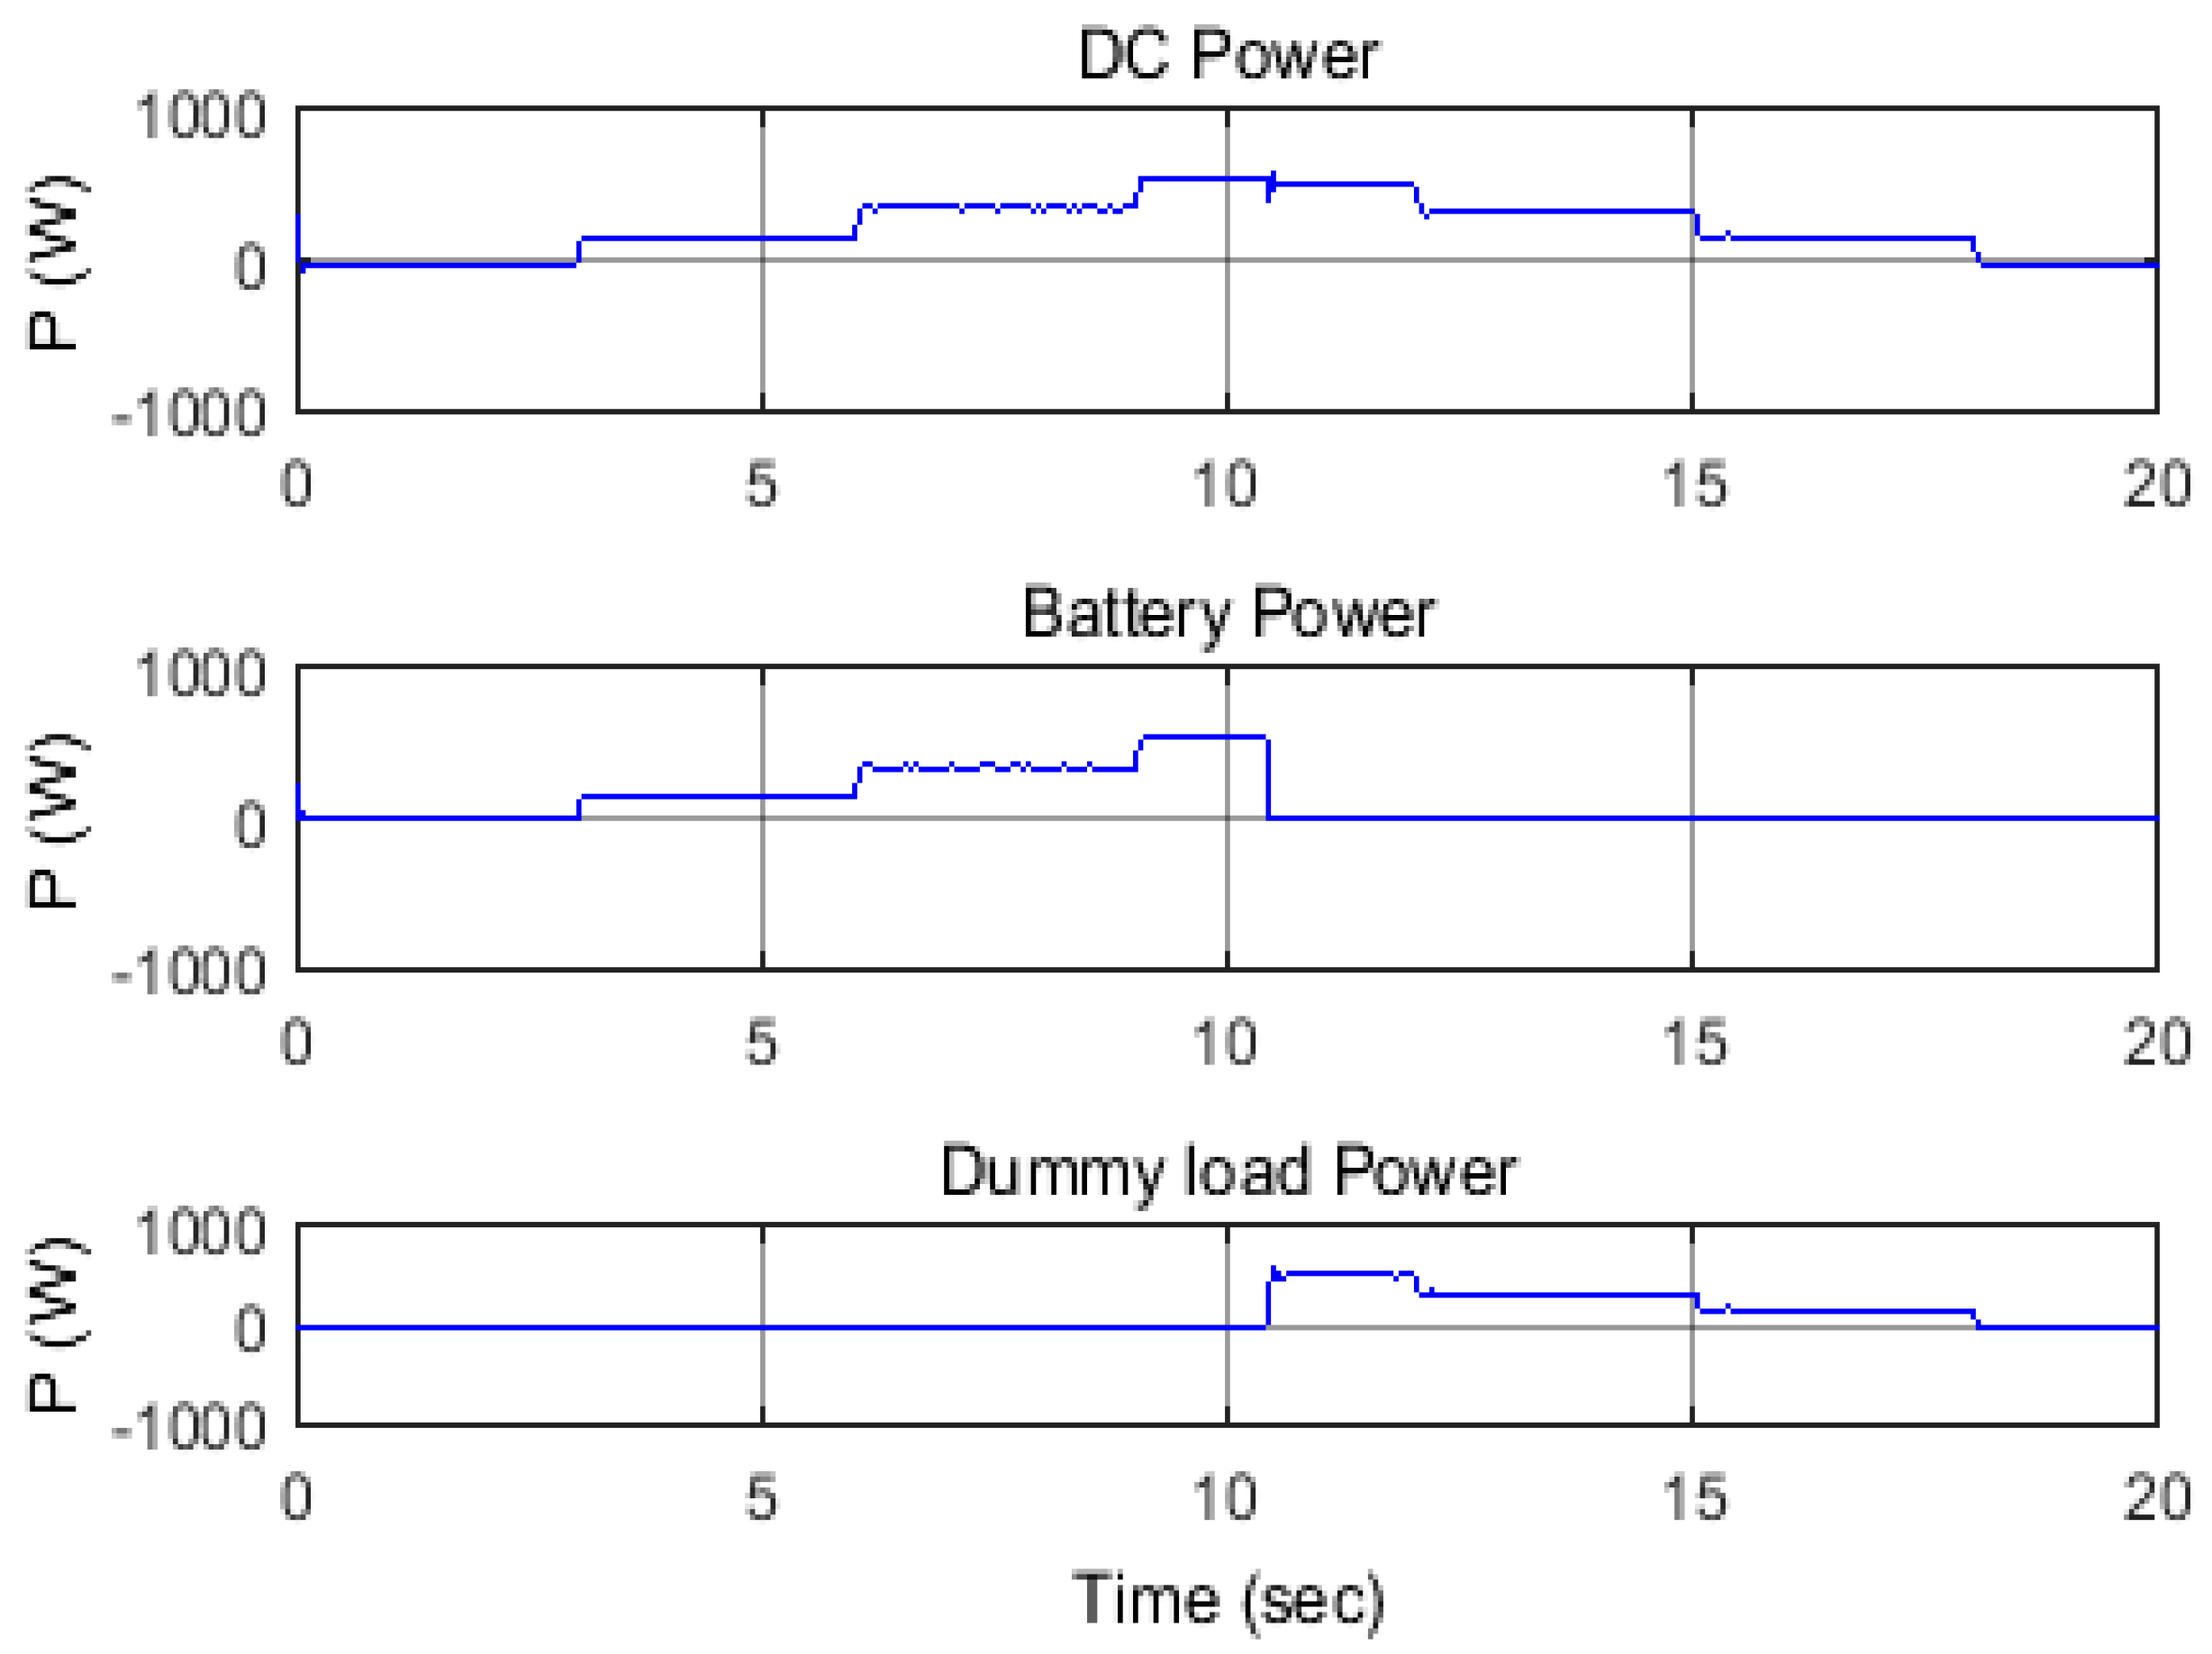
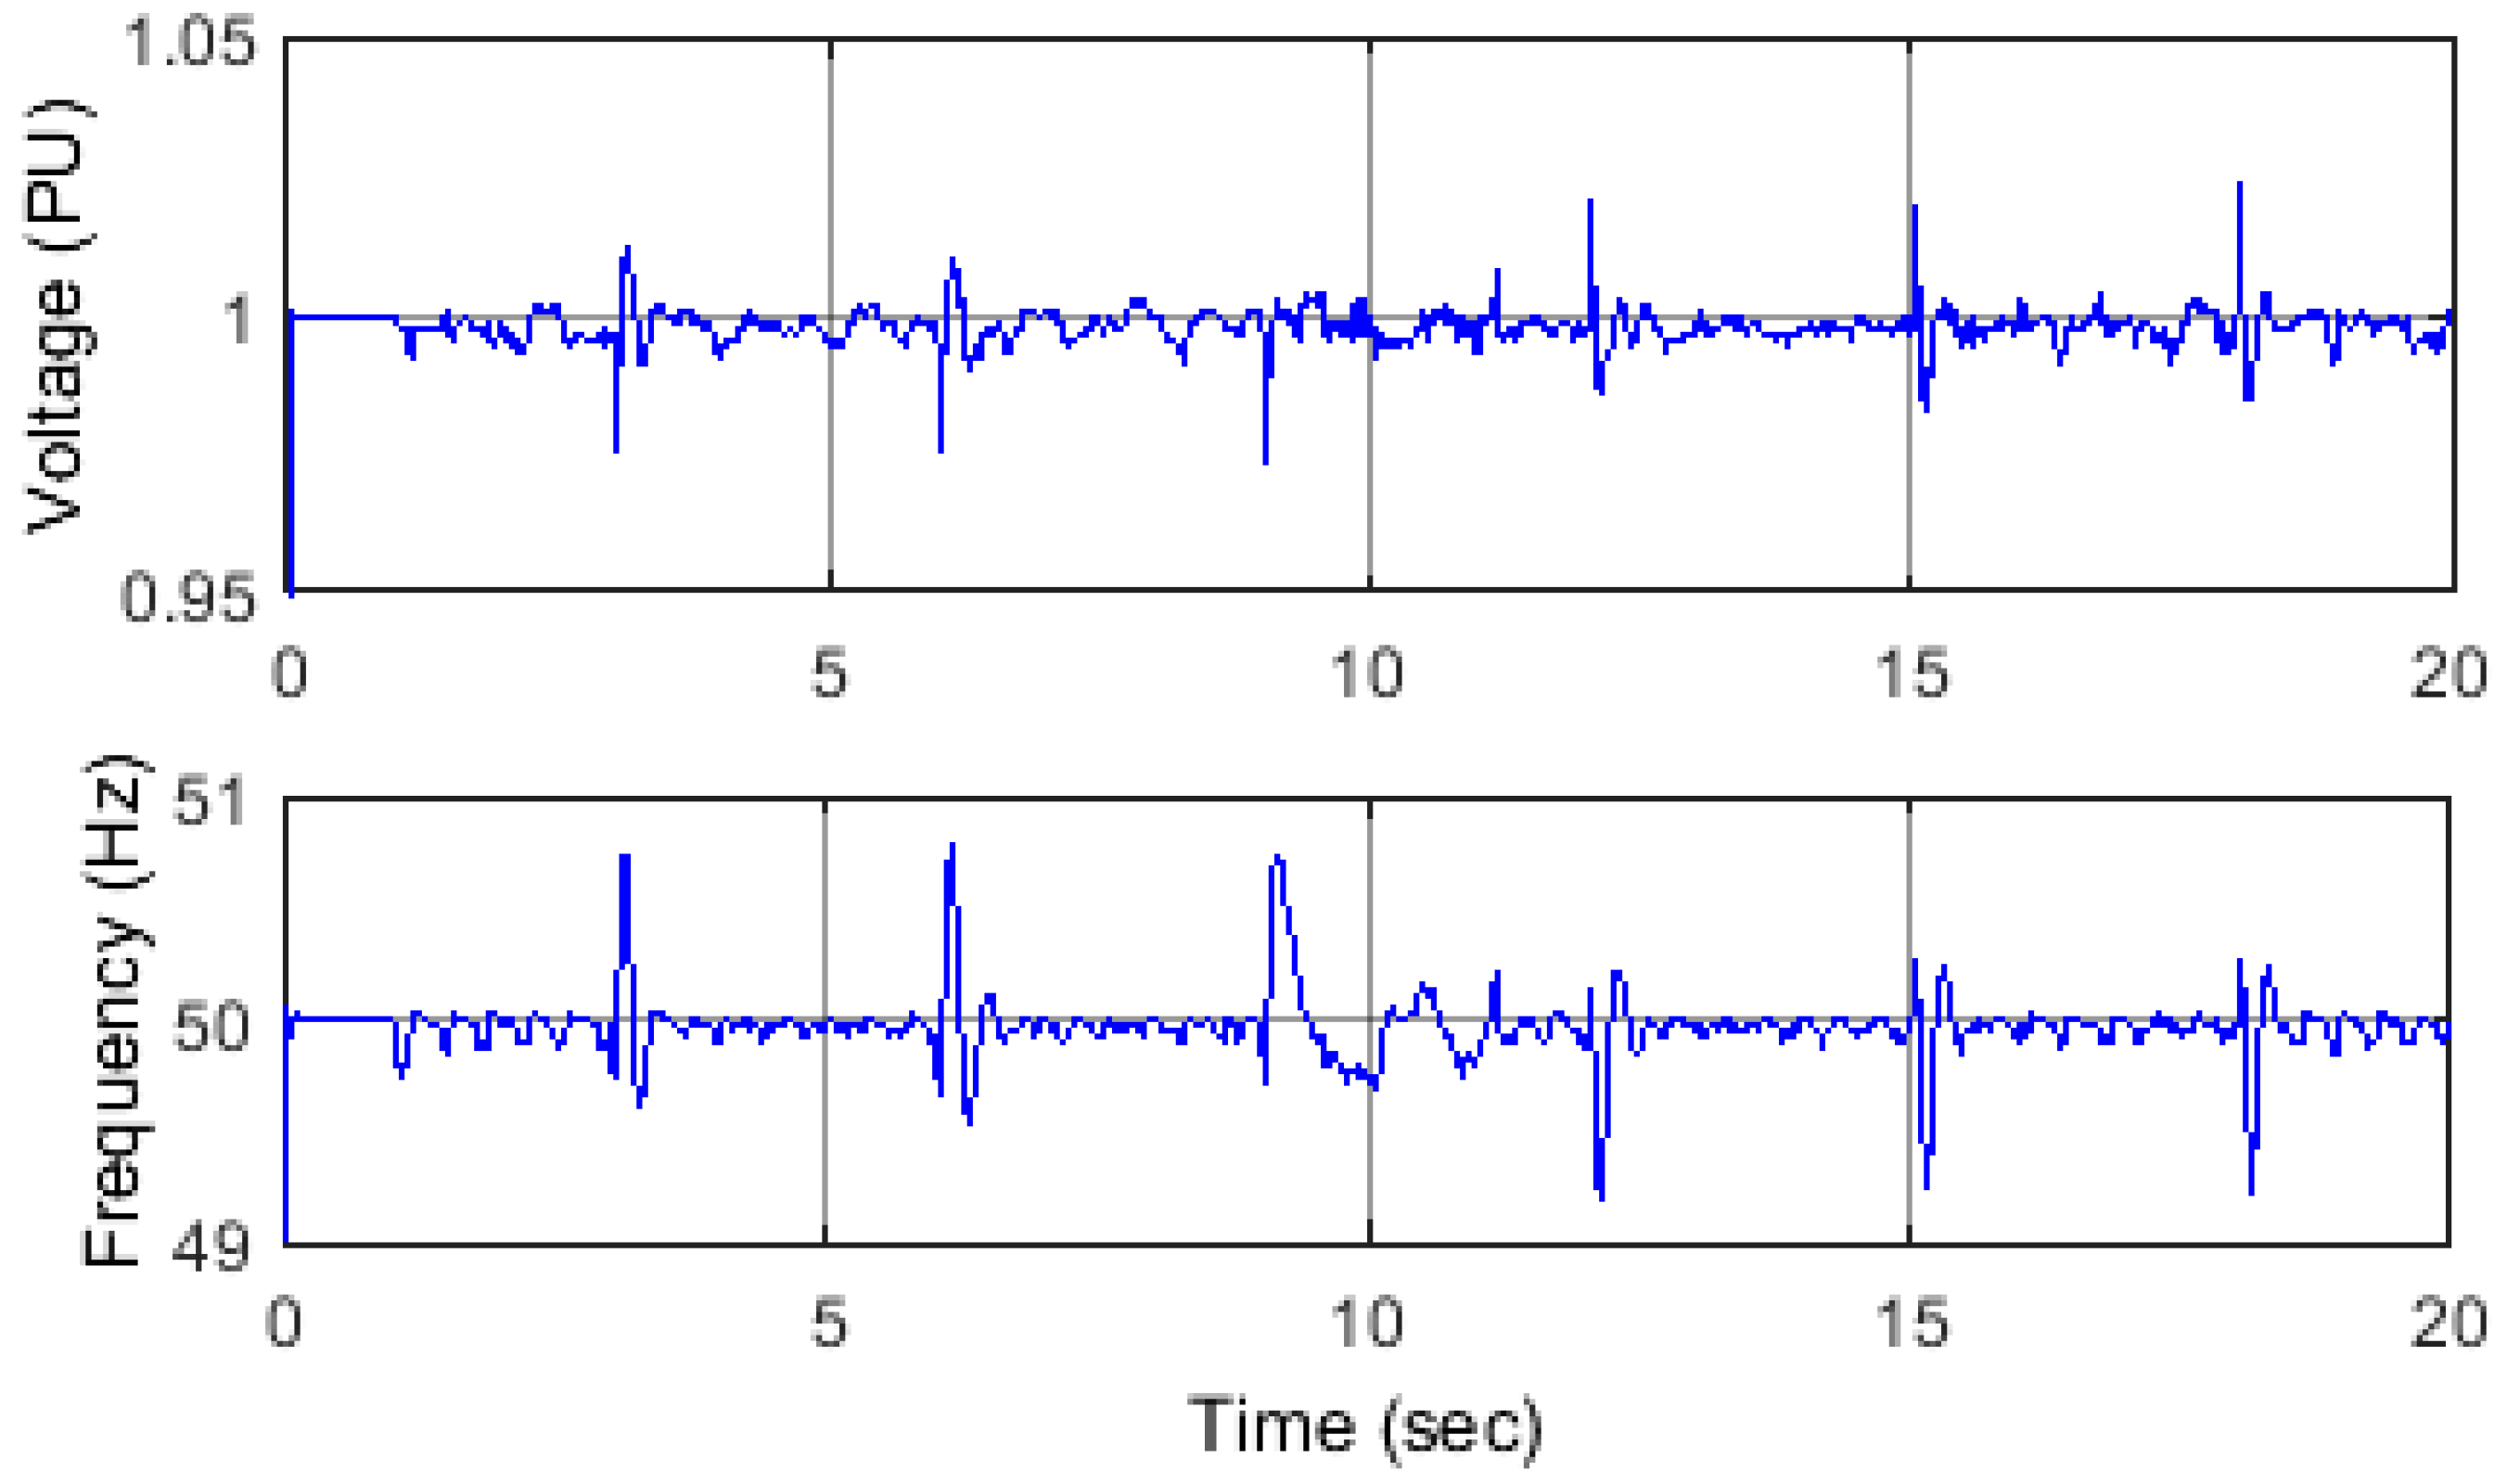
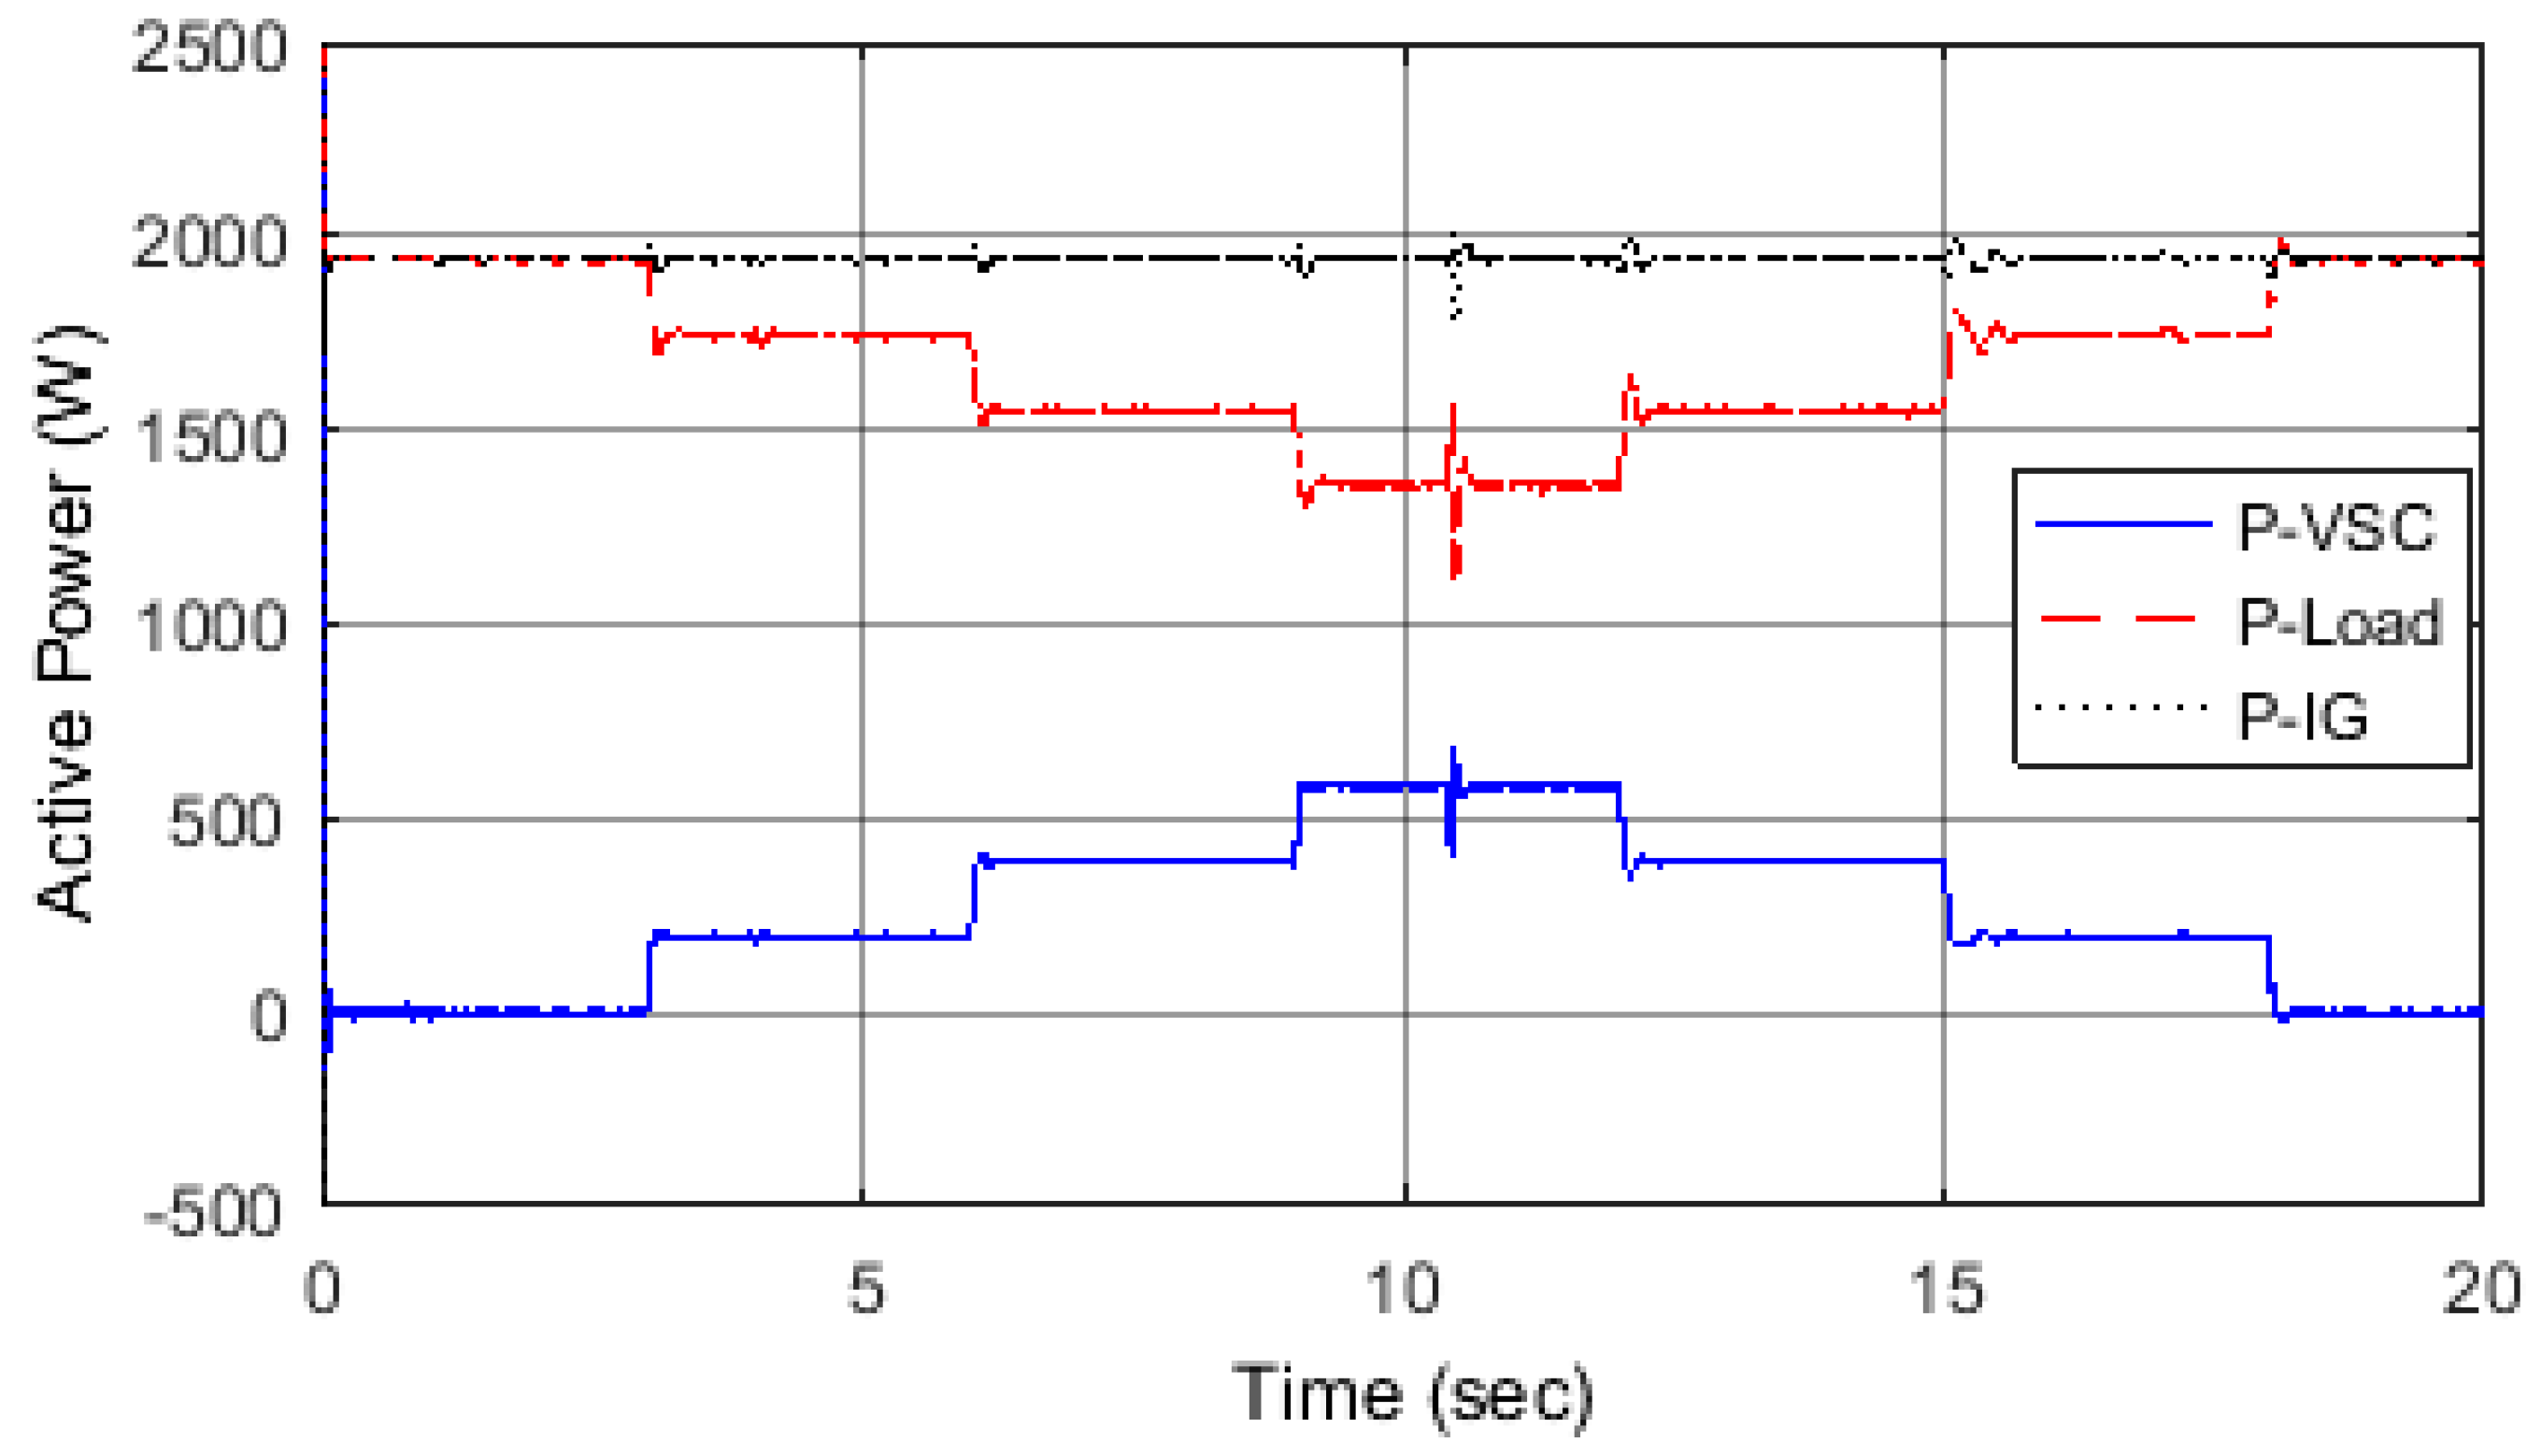
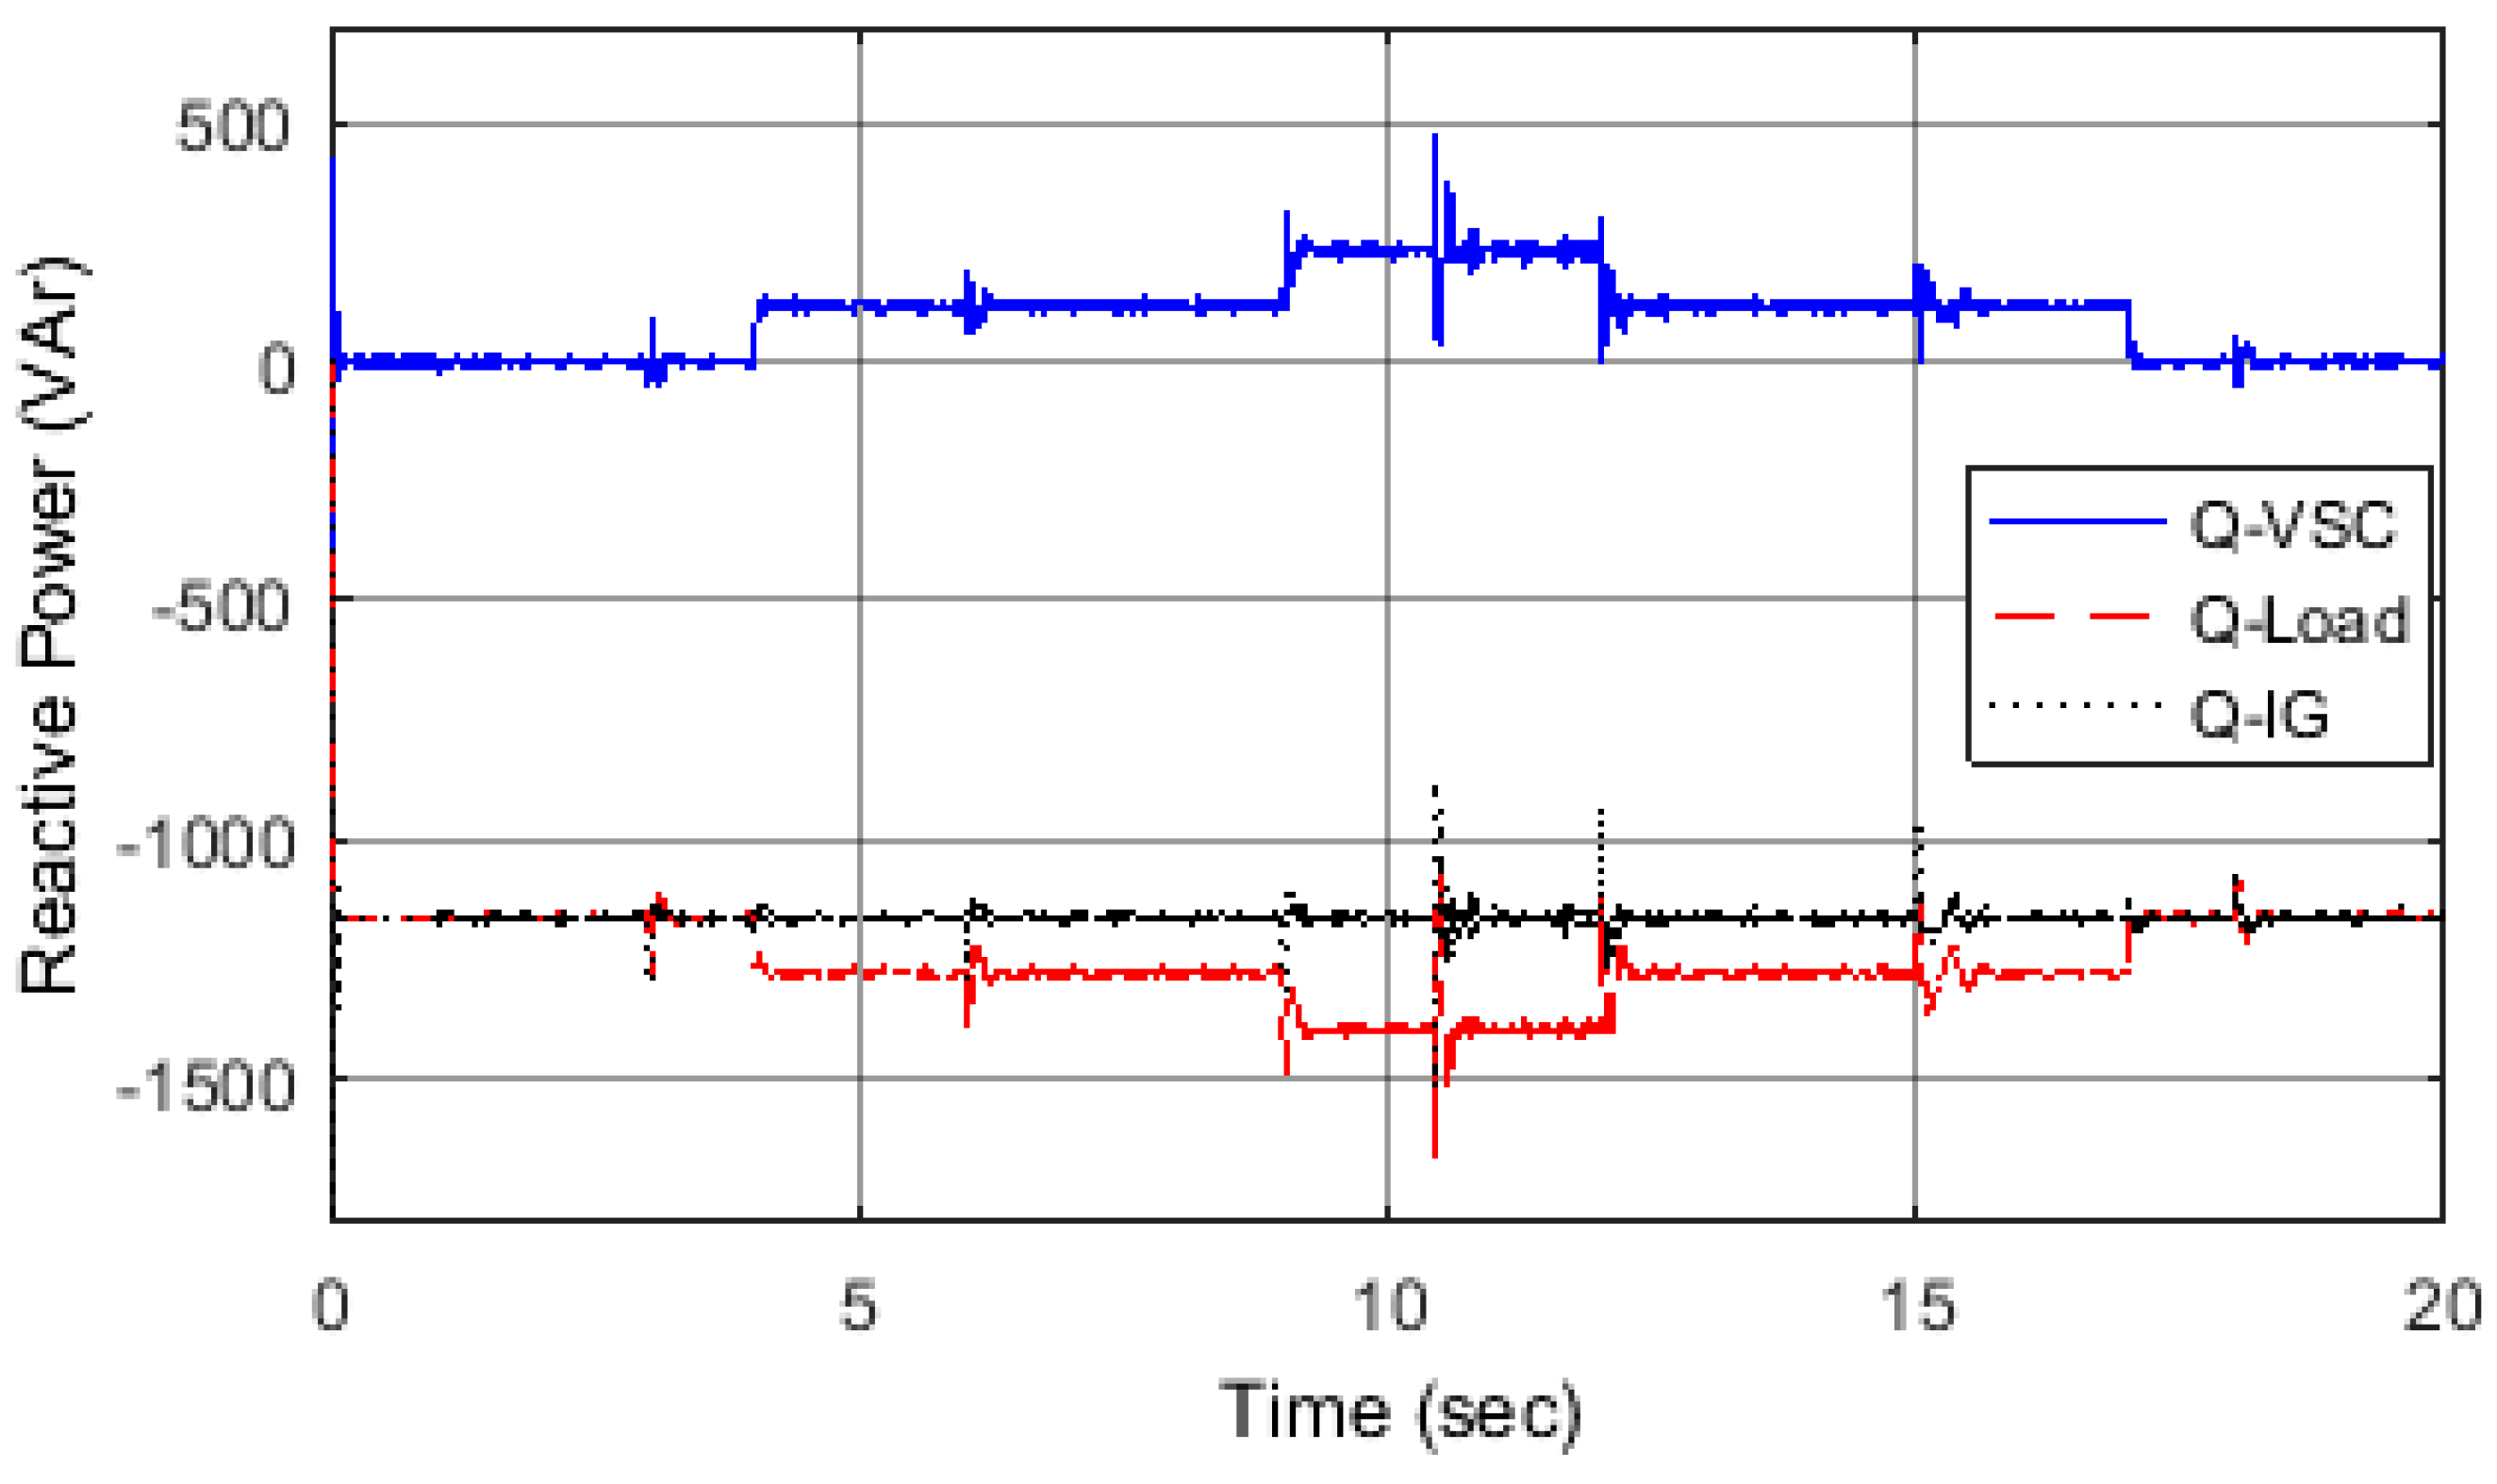
5.2. Scenario 2: Increase of Load’s Active and Reactive Power

In this scenario, after the SEIG is disconnected from the main grid at t = 1 s, both the load’s active and reactive power are increasing then decreasing in steps of 10% each time, and in time intervals of three seconds per step. The first increase took place at t = 3 s. The battery SoC is assumed to be near its minimum permissible level of 30% which is taken to be the limit of depth of discharge. Figure 9 shows that the increase in load active power is compensated from the ESS though the VSC, while the SEIG output active power remains constant. The same scenario for the reactive power is shown in Figure 10. The voltage magnitude and frequency are within their permissible limits as shown in Figure 11. As shown in Figure 12, the battery discharging process stops at t = 11.1 s, when the battery SoC reaches 30%. At this point, as outlined in Figure 5B, the logic controller circuit will open switch (S1) and close switch (S3) to provide the difference in power from the ancillary generator. The ancillary generator output is shown in Figure 13, it operates until time t = 18 s, when there is no longer any need for power exchange between the AC and DC converter sides.

5.3. Scenario 3: Decrease of Load’s Active and Reactive Power

In this scenario, the load’s active and reactive power were decreased below their optimal values and then regains its optimal original condition. However, here the active-reactive power variation was assumed to take place alternatively to show the ability of the controller to optimize the power flow. The active power change was similar to that of the Scenario 2, in both the step magnitude and duration, but in the opposite direction. The reactive power, in contrast, changed in two steps of 10% each. For the sake of this simulation, the maximum allowable battery SoC was set slightly lower than its maximum level, at 99%, and the charging process stopped when it reached this point. Figure 14 shows that the difference in active power between the optimal and the actual load value is stored in the battery via the VSC, while the optimal SEIG active output power remains constant. The same situation for the reactive power is shown in Figure 15. As shown in Figure 16, the voltage magnitude and frequency were within permitted values during these power variations. Figure 17 shows that the battery charging process stops at t = 10.4 s, when the battery SoC reaches 99%. At this point the logic controller will open switch (S1) and close switch (S2), to dissipate the difference in power into the dummy load until t = 18 s (Figure 18), when there is no power exchange between the AC and DC sides of the converter.

6. Conclusions

The study, presented in this paper, illustrates the possibility for islanding the operation of small-scale embedded generation (SSEG) based on a self-excited induction generator (SEIG) supported by an energy storage system (ESS). The study showed the design of control principles to maintain an SEIG’s active and reactive power at their optimal operating point. The difference between the demand (load) power and the optimal values is exchanged with the battery energy storage via a two-way voltage-source converter (VSC). The battery state of charge (SoC) is always monitored, and the charging/discharging process will cease when the battery reaches the predetermined maximum and minimum levels, respectively. A local dummy load and ancillary stand-by emergency generator are used to dissipate and inject the required difference in power in either of these cases, respectively. A Matlab/Simulink model has been simulated to achieve the described principle. The results show that the voltage magnitude and frequency are within the permitted values for all the simulated scenarios. With the aid of ESS, the SEIG maintains its optimum operation irrespective of the changes in the load demand.

Acknowledgment

The author would like to thank CARA (Council for At-Risk Academics) and Glasgow Caledonian University for supporting this research.

Author Contributions

Nachat N. Nasser has completed the simulation part of the study based on his experiences in using Matlab software, also, he initiated the writing of the paper. Mohamed E. A. Farrag has come up with the research idea based on his previous publications in the same field, he also verified the simulation results and proofread of the article. Both authors completed the reply to reviewers’ comments and agreed on the final submission.

Conflicts of Interest

The authors declare no conflict of interest.

References

  1. Foreign-and-Commonwealth-Office. Carbon Reduction Delivery Plan. Available online: https://www.gov.uk (accessed on 5 January 2018).
  2. Stewart, M. Future Energy Scenarios, GB Gas and Electricity Transmission; National Grid Plc: Warwick, UK, 2016. [Google Scholar]
  3. UK-Energy. Pathways for the GB Electricity Sector to 2030. London. February 2016. Available online: https://www.energy-uk.org.uk (accessed on 7 January 2018).
  4. UK-Power-Networks. DNO Guide to Future Smart Management of Distribution Networks. London, 2014. Available online: https://www.innovation.ukpowernetworks.co.uk (accessed on 7 January 2018).
  5. Western-Power-Distribution. DSO-Transition-Strategy. Bristol. July 2017. Available online: https://www.westernpower.co.uk (accessed on 8 January 2018).
  6. Verma, N.; Pachori, A. Theoretical Approach for Comparison of Various Types of Wind Generator Systems. Int. J. Recent Res. Electr. Electron. Eng. IJRREEE 2015, 2, 29–35. [Google Scholar]
  7. Varshney, L.; Saket, R.K. Reliability evaluation of SEIG rotor core magnetization with minimum capacitive excitation for unregulated renewable energy applications in remote areas. Ain Shams Eng. J. 2014, 5, 751–757. [Google Scholar] [CrossRef]
  8. Gao, S.; Murthy, S.S.; Gayathri, M.S.; Bhuvaneswari, G. Design of a Microcontroller Based Electronic Load Controller for a Self-Excited Induction Generator Supplying Single-Phase Loads. J. Power Electron. 2010, 10, 444–449. [Google Scholar] [CrossRef]
  9. Kostic, M.G. Equivalent circuit improvement method for induction motor efficiency. Electron. Energ. 2012, 25, 31–42. [Google Scholar] [CrossRef]
  10. Deraz, S.A.; Kader, F.E.A. A new control strategy for a stand-alone self-excited induction generator driven by a variable speed wind turbine. Renew. Energy 2013, 51, 263–273. [Google Scholar] [CrossRef]
  11. Lan, H.; Wen, S.; Hong, Y.Y.; Yu, D.; Zhang, L. Optimal sizing of hybrid PV/diesel/battery in ship power system. Appl. Energy 2015, 158, 26–34. [Google Scholar] [CrossRef]
  12. Bernal-Agustín, J.L.; Dufo-López, R.; Yusta-Loyo, J.M.; Domínguez-Navarro, J.A.; Ramírez-Rosado, I.J.; Lujano, J.; Aso, I. Multi-objective optimization minimizing cost and life cycle emissions of stand-alone PV– wind–diesel systems with batteries storage. Appl. Energy 2011, 88, 4033–4041. [Google Scholar]
  13. Maleki, A.; Askarzadeh, A. Optimal sizing of a PV/wind/diesel system with battery storage for electrification to an off-grid remote region: A case study of Rafsanjan, Iran. Sustain. Energy Technol. Assess. 2014, 7, 147–153. [Google Scholar] [CrossRef]
  14. Subho, U.; Sharma, M.P. A review on configurations, control and sizing methodologies of hybrid energy systems. Renew. Sustain. Energy Rev. 2014, 38, 47–63. [Google Scholar]
  15. Kumar, A.; Sharma, V.K. Implementation of self-excited induction generator (SEIG) with IGBT based electronic load controller (ELC) in wind energy system. Int. J. Res. Eng. Technol. 2013, 2, 188–193. [Google Scholar]
  16. Murthy, S.S.; Malik, P.O.; Tandon, K.A. Analysis of self-excited induction generator. IEE Proc. C Gener. Transm. Distrib. 1982, 129, 260–265. [Google Scholar] [CrossRef]
  17. Grantham, C.; Sutanto, D.; Mismail, B. Steady state and transient analysis of self-excited induction generators. IEE Proc. B Electr. Power Appl. 1989, 136, 61–68. [Google Scholar] [CrossRef]
  18. Arrillaga, J.; Watson, B.D. Static power conversion from self-excited induction generators. Proc. Inst. Electr. Eng. 1978, 125, 743–746. [Google Scholar] [CrossRef]
  19. Bim, E.; Szajner, J.; Burian, Y. Voltage compensation of an induction generator with long-shunt connection. IEEE Trans. Energy Convers. 1989, 4, 526–530. [Google Scholar] [CrossRef]
  20. Shrindhar, L.; Singh, B.; Jha, C.S.; Murthy, S.S. Selection of capacitors for the self regulated short shunt self-excited induction generator. IEEE Trans. Energy Convers. 1995, 10, 10–17. [Google Scholar] [CrossRef]
  21. Tiwary, K.; Murthy, S.S.; Singh, B.B.; Shrindhar, L. Design based performance evaluation of two-winding capacitor self-excited single-phase induction generator. Electr. Power Syst. Res. 2003, 67, 89–97. [Google Scholar] [CrossRef]
  22. Al-saffar, M.A.; Nho, E.C.; Lipo, T.A. Controlled shunt capacitor self-excited induction generator. In Proceedings of the 1998 IEEE Thirty-Third IAS Annual Meeting Industry Applications Conference, St. Louis, MO, USA, 12–15 October 1998. [Google Scholar]
  23. Wekhande, S.; Agrawal, V. A new variable speed constant voltage controller for self-excited induction generator. Electr. Power Syst. Res. 2001, 59, 157–164. [Google Scholar] [CrossRef]
  24. Ekanayake, B.J. Induction generator for small hydro schemes. Power Eng. J. 2002, 16, 61–67. [Google Scholar] [CrossRef]
  25. Bonert, R.; Rajakaruna, S. Self-excited induction generator with excellent voltage and frequency control. IEE Proc. Gener. Transm. Distrib. 1998, 145, 33–39. [Google Scholar] [CrossRef]
  26. Stein, M.W.; Manwell, F.J.; McGowan, G.J. Power electronics based power shedding control for wind diesel systems. Int. J. Ambient Energy 1992, 13, 65–74. [Google Scholar] [CrossRef]
  27. Tamura, J.; Nakamichi, R.; Nakazawa, C.; Chihara, I. Analysis of an isolated self-excited induction generator. In Proceedings of the International Conference on Electrical Machines, Espoo, Finland, 28–30 August 2000. [Google Scholar]
  28. Ramachandran, J.; Ghanim, P.A. Dynamic behavior of single phase induction generator during disconnection and reconnection to the grid. In Proceedings of the 16th Power Systems Computation Conference (PSCC), Glasgow, UK, 14–18 July 2008. [Google Scholar]
  29. Dahraie, V.M.; Najafi, R.H.; Ebadian, M. Analytical investigation of the effect of wind farm equipped with SCIG on voltage stability. In Proceedings of the 2012 Second Iranian Conference on Renewable Energy and Distributed Generation (ICREDG), Tehran, Iran, 6–8 March 2012. [Google Scholar]
  30. Srivastava, K.A.; Kumar, A.A.; Schulz, N.N. Impact of distributed generations with energy storage devices on the electric grid. IEEE Syst. J. 2010, 6, 110–117. [Google Scholar] [CrossRef]
  31. Abdulkader, S. Voltage stability assessment for systems with large wind power generation. In Proceedings of the 44th International Universities Power Engineering Conference, Glasgow, UK, 1–4 September 2009. [Google Scholar]
  32. Farrag, M.E.A.; Ghanim, P.A. Analysis of the dynamics performance of self-excited induction generators employed in renewable energy generation. Energies 2014, 7, 278–294. [Google Scholar] [CrossRef]
  33. Barrado, J.; Griñó, R. Voltage and frequency control for a self-excited induction generator using a three-phase four-wire electronic converter. In Proceedings of the 12th International Power Electronics and Motion Control Conference (EPE-PEMC 2006), Portoroz, Slovenia, 30 August–1 September 2006. [Google Scholar]
  34. Barrado, J.; Griñó, R.; Valderrama, H. Standalone self-excited induction generator with a three-phase four-wire active filter and energy storage system. In Proceedings of the 2007 IEEE International Symposium on Industrial Electronics, Vigo, Spain, 4–7 June 2007. [Google Scholar]
  35. Mateo, C.; Reneses, J.; Rodriguez-Calvo, A.; Frías, P.; Sánchez, Á. Cost-benefit analysis of battery storage in medium-voltage distribution network. IET Gener. Transm. Distrib. 2016, 10, 815–821. [Google Scholar] [CrossRef]
  36. Distributed Generation Connection Guide; Energy-Network-Association: London, UK, 2014.
  37. Basset, E.D.; Potter, F.M. Capacitive excitation of induction generators. Electr. Eng. 1935, 54, 540–545. [Google Scholar] [CrossRef]
  38. Markiewicz, H.; Klajn, A. Power Quality Application Guide, Voltage Disturbances; Standard EN 50160; Copper Development Association: Hemel Hempstead, UK, 2004; p. 4. [Google Scholar]
  39. Yazdani, A.; Iravani, R. Voltage-Sourced Converter in Power Systems, Modeling, Control and Applications; Wiley-IEEE Press: Hoboken, NJ, USA, 2010; pp. 207–220. [Google Scholar]
  40. Schauder, D.; Caddy, R. Current Control of Voltage-Source Inverters for Fast Four-Quadrant Drive Performance. IEEE Trans. Ind. Appl. 1982, 2, 163–171. [Google Scholar] [CrossRef]
  41. Schauder, D.; Mehta, H. Vector analysis and control of advanced static VAR compensators. IEE Proc. C 1993, 140, 299–306. [Google Scholar] [CrossRef]
Figure 1. Block diagram of the studied system. VSC: voltage-source converter; SEIG: Self-Excited Induction Generators.
Energies 11 00359 g001
Figure 2. Voltage and frequency in optimal load operation.
Energies 11 00359 g002
Figure 3. Dynamic model of voltage source converter (VSC).
Energies 11 00359 g003
Figure 4. Control block diagram of a current-controlled VSC system.
Energies 11 00359 g004
Figure 5. (A) The logic controller; (B) switching arrangements. SoC: state of charge.
Energies 11 00359 g005
Figure 6. Active power in the load, VSC and Self-Excited Induction Generator (SEIG) for Scenario 1.
Energies 11 00359 g006
Figure 7. Voltage and frequency for Scenario 1.
Energies 11 00359 g007
Figure 8. Battery state of charge for Scenario 1.
Energies 11 00359 g008
Figure 9. Active power for Scenario 2.
Energies 11 00359 g009
Figure 10. Reactive power for Scenario 2.
Energies 11 00359 g010
Figure 11. Voltage and frequency for Scenario 2.
Energies 11 00359 g011
Figure 12. Battery state of charge for Scenario 2.
Energies 11 00359 g012
Figure 13. D.C. Side power contribution for Scenario 2.
Energies 11 00359 g013
Figure 14. Active power of load, VSC and SEIG for Scenario 3.
Energies 11 00359 g014
Figure 15. Reactive power of load, VSC and SEIG for Scenario 3.
Energies 11 00359 g015
Figure 16. Voltage and frequency for Scenario 3.
Energies 11 00359 g016
Figure 17. Battery state of charge for Scenario 3.
Energies 11 00359 g017
Figure 18. D.C. Side power contribution for Scenario 3.
Energies 11 00359 g018
Table 1. System parameters. SoC: state of charge.
ParameterValue
Rating, voltage, frequency S G = 2.3   KVA ,   V = 230   V ,   f = 50   Hz
Resistance (stator/rotor) R s = 1.115   Ω ,   R r = 1.083   Ω
Inductance (stator/rotor) L s = L r = 0.00597   H ,   L m = 0.2037   H ,
Inertia J = 2 × 10 4   kg · m 2
Optimal active power P O = 0.8473 × S G = 1.949   KW
Optimal reactive power Q O = 0.5081 × S G = 1.168   KVAr
Battery Max. SoC99%
Battery Min. SoC30%

