NOx and SO2 Emissions during Co-Combustion of RDF and Anthracite in the Environment of Precalciner

1
State Key Laboratory of Silicate Materials for Architectures, Wuhan University of Technology, Wuhan 430070, China
2
School of Materials Science and Engineering, Wuhan University of Technology, Wuhan 430070, China
3
Research and Test Center of Materials, Wuhan University of Technology, Wuhan 430070, China
*
Author to whom correspondence should be addressed.
Energies 2018, 11(2), 337; https://doi.org/10.3390/en11020337
Submission received: 27 December 2017
/
Revised: 30 January 2018
/
Accepted: 30 January 2018
/
Published: 2 February 2018
Abstract
:Based on the temperature and O2 concentration in the cement precalciner, co-combustion of anthracite and Refuse Derived Fuel (RDF) were investigated using a thermogravimetric analyzer (TGA) and a double furnaces reactor. Both the TGA and double furnaces reactor results indicated that the co-combustion characteristics were the linear additive effect in the devolatilization stage, while it was the synergistic effect in the char combustion stage. During co-combustion, at 900 °C, NOx released rapidly during the devolatilization stage, but in the char combustion stage the NOx formation were inhibited; at 800 °C, a large amount of CO formed, which could reduce the NOx. In general, at 900 °C and 800 °C, the application of co-combustion could lower the NOx emission yield and lower the NOx conversion. By combining the combustion characteristics with the XRD results, it was indicated that during co-combustion, at 800 °C, the SO2 formation reaction was inhibited, and the SO2 yield and conversion were quite low.
1. Introduction
The coal consumption of the precalciner accounts for about 60% of the new dry process cement industry. Most of the cement industries are likely to use bituminous coal as a fuel rather than anthracite. With the depletion of conventional energy resources, shortening the burning-out time and keeping the normal ignition of anthracite combustion in the precalciner have become big technical problems. The production of Refuse Derived Fuel (RDF) contains high volatiles, can promote ignition, and can maintain the long-time stable combustion of anthracite, which is a good alternative fuel for blending with coal, theoretically.
Many investigations have been carried out on the co-combustion of RDF and bituminous coal. Some scholars found that RDF samples could lower the NOx and SO2 emission by blending with coal [1,2]. It is shown by Bai that the Ca-based materials contained in RDF could remove SO2 through sulfate reaction [3]. However, none of the above scholars have studied the co-combustion of RDF and anthracite. The anthracite in the cement industry is not used widely, since the combustion characteristics of anthracite were worse than those in bituminous coal. Since coal is a non-renewable resource, its reserves are limited. Using anthracite in cement could promote the proper use of resources. In the cement industry, the regulation of fuels is strict. The combustion characteristics of anthracite may be improved by co-combustion with RDF. Lee found that the emissions of NOx during co-combustion did not change appreciably as compared to the case when Korean anthracite was burnt alone [4]. Li compared the thermal behavior of anthracite coal, RDF, and their blends during the combustion process by means of thermogravimetric analysis, and found that the incorporation of RDF could improve the ignition and burnout characteristics compared with the separate combustion of anthracite [5]. As mentioned above, it is feasible to use the co-combustion of RDF and coal as fuel; however, none of these studies are performed in the environment of precalciner. The characteristics of the precalciner environment are special and are mainly reflected in two aspects. Firstly, the precalciner is a high temperature reactor, which includes the endothermic process of coal combustion and the exothermic process of CaCO3 decomposition, resulting in the different distributions of temperatures. The average temperature in the precalciner is about 880 °C, which is lower than the temperature in the power plant [6,7]. Many experiments about different coal combustions showed that the NOx emission concentration was connected with temperature, but the NOx emission concentration increase rates varied with the temperature [8,9,10,11,12,13]. Secondly, there were two gas flows in a precalciner, one was the tertiary air, in which the O2 concentration was 21%; the other one was the flue gas from the rotary kiln, in which the O2 concentration was from 2% to 4%. In the coal injection inlets, the O2 concentration was about 18% according to the on-site data. Lin studied the combustion of Zhehun blended coal (a bituminous coal) in a 420 t/h boiler and found the NO emissions increased significantly with the excessive air coefficient, especially when air coefficient ranged from 0.8 to 1.2 [14]. Many other scholars have demonstrated that NOx emission concentrations varied with the O2 concentration based on the circumstances of power plants [15,16,17].
As mentioned above, to date, some scholars have studied the co-combustion characteristics of RDF and coal; however, few of them chose the anthracite as the research object. In addition, their experimental conditions were quite different from the actual cement plant. Furthermore, the coal combustion processes were different in the different temperature zone, meaning that the NOx formation processes were also different. To develop efficient NOx reduction technology in the cement industry, it is important to obtain a deep understanding of the fuel NOx formation process in the environment of the precalciner. Therefore, in this study, one RDF and one kind of anthracite taken from a cement plant were selected as the research object. In this approach, the thermal characteristics and combustion patterns of RDF, anthracite, and their blends were intended to be evaluated by proximate and ultimate analysis, TGA, XRD, and a double furnaces reactor. To simulate the steady high temperature gas flow, we set two furnaces to ensure that the gas flow had been preheated effectively in the fixed-bed reactor experiments, which could prolong the residence time of the high temperature gas flow and simulate the high temperature environment in the precalciner better. Additionally, the interactions among CO, CO2, NOx, and SO2 were analyzed. The results have applications for NOx reduction in an actual cement industry. The results will provide a theoretical reference to the proper disposal of RDF, the combustion of anthracite in the precalciner, and the effective reduction of the emission of NOx and SO2.
2. Experimental Section
2.1. Preparation of Fuels
The RDF and anthracite used in this study were collected from Huaxin Cement Co. Ltd. (Huangshi, China). The fuel samples were milled and sieved to the size of <180 μm. The fuels were dried in oven at 105 °C for 10 min before analysis and experiments. During co-combustion, the mass ratio of anthracite and RDF was 1:1. Before co-combustion experiment, 0.25 g anthracite and 0.25 g RDF were taken, put into a closed container, and shocked more than 1 min to make the mixture.
2.2. Apparatus and Methods
Characterization studies of fuels were carried out by applying proximate analysis, ultimate analysis, and the calorific value. The proximate analyses of RDF were made according to the Standard Practice for the Proximate Analysis of anthracite (GB/T 212-2008). Carbon (C), hydrogen (H), oxygen (O), nitrogen (N), and sulfur (S) are the main chemical elements in a fuel. Thus, C, H, O, N, and S content of fuels were determined by ultimate analysis conducted by Vario EL cube CHNSO analyzer. Calorific values of fuels were determined according to the Standard Practice for the calorific value of coal (GB/T 213-2008). The results of proximate analysis, ultimate analysis, and the calorific value of fuels are given in Table 1.
One of the combustion experiments was conducted using a NETZSCH Instrument STA2500 thermal analyzer equipment. The fuel was heated from room temperature to 1000 °C at 10 °C/min with a flow rate of 100 mL/min, and the O2 concentration was 18%.
The other combustion experiments were performed in a double furnaces reactor, as shown in Figure 1. The tube furnace was OTF-1200X, which used the quartz tube as the heating element; the adjustable temperature range was from room temperature to 1200 °C. The temperature was electrically controlled and displayed by a device automatically. The mixed gas of N2 and O2 controlled by mass flow meters were used for combustion gas, and the O2 concentration was set as 18%. The 1# furnace and 2# furnace were preheated to the desired temperature at 5 °C/min simultaneously in each experiment. The 1# furnace could prolong the residence time of the high temperature gas flow and maintain the constant temperature in the 2# furnace. The fuel sample was placed in a ceramic boat and pushed rapidly into the 2# furnace, which was already preheated to the desired temperature. For each run, the amount of fuel sample was about 500 mg and the gas flow rate was maintained at 1000 mL/min. The combustion flue gases, O2, CO2, CO, and NOX concentrations were monitored online by MGA5 flue gas analyzer continuously. The device measured the concentrations of O2 and CO2 with an Infrared (IR) cell as volume percentages; concentrations of other gases were measured electrochemically in ppm. The time interval of sampling was 1 s.
3. Results and Discussion
3.1. Combustion Experiments with Thermogravimetric Analyzer (TGA)
The combustion TG-DTG profiles of anthracite, RDF, and mixture are presented in Figure 2. Figure 2a,b are the TG-DTG curves of separate combustion of anthracite and RDF, respectively. Figure 2c is the TG-DTG curves of predicted values and actual values during co-combustion. The predicted values are the linear additive mean values of the separate combustion of anthracite and RDF. Based on the TG-DTG curves, the combustion parameters are figured out, shown in Table 2 [3,18,19]. The followings are the main combustion parameters:
- (1)
- Rmax = (dW/dT)max is the maximum weight loss rate, Tmax is the corresponding temperature.
- (2)
- Ti is the ignition temperature.
- (3)
- C = Rmax*106/Ti2 is the flammability index, which shows the reaction capacity in the early stage of combustion.
- (4)
- Rw = 560/Ti + 650/Tmax + 0.27*(dW/dT)max is the ignition stability index.
- (5)
- t0 is the burning-out time.
As shown in Figure 2a, the anthracite combustion process can be divided into three stages. In the first stage (<133 °C), the weight loss was slight, about 2.67%, and the moisture content of anthracite was 2.7% (Table 1). This stage was the moisture evaporation. In the second stage (133–518 °C), at a temperature of 133–378 °C, the weight loss rate was steady (about 0.039%/min);this constitutes the preheating process; in the temperature of 378–518 °C, the weight loss rate increased rapidly, and some volatiles began to release. In the second stage, the accumulated weight loss was 10%. This constitutes devolatilization. The third stage (>518 °C) constitutes the ignition and combustion of combustible components. As shown in Figure 2b, the RDF combustion process can also be divided into three stages. In the first stage (30–108 °C), the weight loss rate was quick, and the weight loss was about 1.5%. The moisture content was 3.6% (Table 1), constituting the evaporation of surface water. In the second stage (108–233 °C), the accumulated weight loss was 6.46%; part of volatiles began to release. The third stage (>233 °C) was the ignition and combustion of combustible components.
Compared with Figure 2a,b, for anthracite, there were two obvious weight loss rate peaks at 573 °C and 663 °C on the DTG curve; for RDF, there were two obvious weight loss rate peaks at 283 °C and 463 °C, and a weak peak at 618 °C on the DTG curve. RDF contained a large amount of volatiles (46.9%); RDF began to burn when the temperature was above 233 °C. In contrast, anthracite contained less volatile content (<10%); the ignition temperature was 518 °C (Table 2).
Figure 2c is the TG and DTG curves, respectively, of the actual co-combustion and the predicted co-combustion curves. At temperatures below 318 °C, the actual TG-DTG curves were overlapped with the predicted curves. As mentioned above, RDF began to burn at 233 °C, and anthracite was in the drying stage before 318 °C. In conclusion, the volatiles combustion of RDF and the moisture evaporation of anthracite were independent in the initial stage of co-combustion; this constitutes the linear additive effect of the separate combustion of RDF and anthracite. At 318–543 °C, the weight loss rate of the actual co-combustion was quicker than the predicted values, which showed that the combustion of RDF could enhance the anthracite combustion. When the temperature was above 543 °C, the actual co-combustion weight loss rate was lower than the predicted values, meaning that there were less combustible components. In the predicted co-combustion DTG curve, three exothermic peaks were observed at 463 °C, 573 °C, and 663 °C, while on the actual co-combustion DTG curve, there was only a wide weight loss rate peak, at 559 °C. The later process of co-combustion (>318 °C) constitutes the synergistic effect of RDF and anthracite. Based on the actual TG-DTG curves and the predicted TG-DTG curves in Figure 2c, the thermal characteristics parameters are listed in Table 2. The actual ignition temperature of mixture was 318 °C, while the predicted ignition temperature was 398 °C. That is, the co-combustion could lower the ignition temperature. The actual flammability index and ignition stability index were 17.01 mg·min−1·°C−1 and 3.39 °C−1; both were higher than the predicted values (14.14 mg·min−1·°C−1 and 3.15 °C−1). However, the burning-out time (78.03 min) for actual co-combustion was shorter than the predicted value (80.05 min), which meant the coal combustion properties were obviously improved by adding RDF. Additionally, the actual total weight loss was 55.61%, which was slightly less than the predicted value (57.27%), constituting the coating effect of the ash in RDF on the anthracite during the co-combustion.
It was seen that both the anthracite combustion and RDF combustion consisted of three processes: the moisture evaporation, devolatilization, and char combustion based on the TG experiments. The volatiles combustion of RDF and the moisture evaporation of anthracite were independent in the initial stage of the co-combustion. The early stage of co-combustion constituted the linear additive effect of the separate combustion of RDF and anthracite. In the later co-combustion stage, the weight loss rate of the actual co-combustion was quicker than the predicted values, constituting the synergistic effect. The combustion characteristics of anthracite were improved by adding RDF.
3.2. Combustion Experiments with a Double Furnaces Reactor
3.2.1. Combustion Process
Figure 3 and Figure 4 are CO and CO2 emission curves of fuels combustion in a double furnace reactor at 900 °C and 800 °C, respectively. The gas yields can be calculated by the integration of gas curves with time according to Formula (1):
in which mj is the CO, CO2, NOx, or SO2 yield (mg), Ci is the CO, CO2, NOx, or SO2 concentration (ppm), v is the volumetric flow 1000 (mL/min), Mj is the molar mass of CO, CO2, NOx, or SO2, t is the time interval of sampling 1 (s), n is the number of being measured point, and j is CO, CO2, NOx, or SO2.
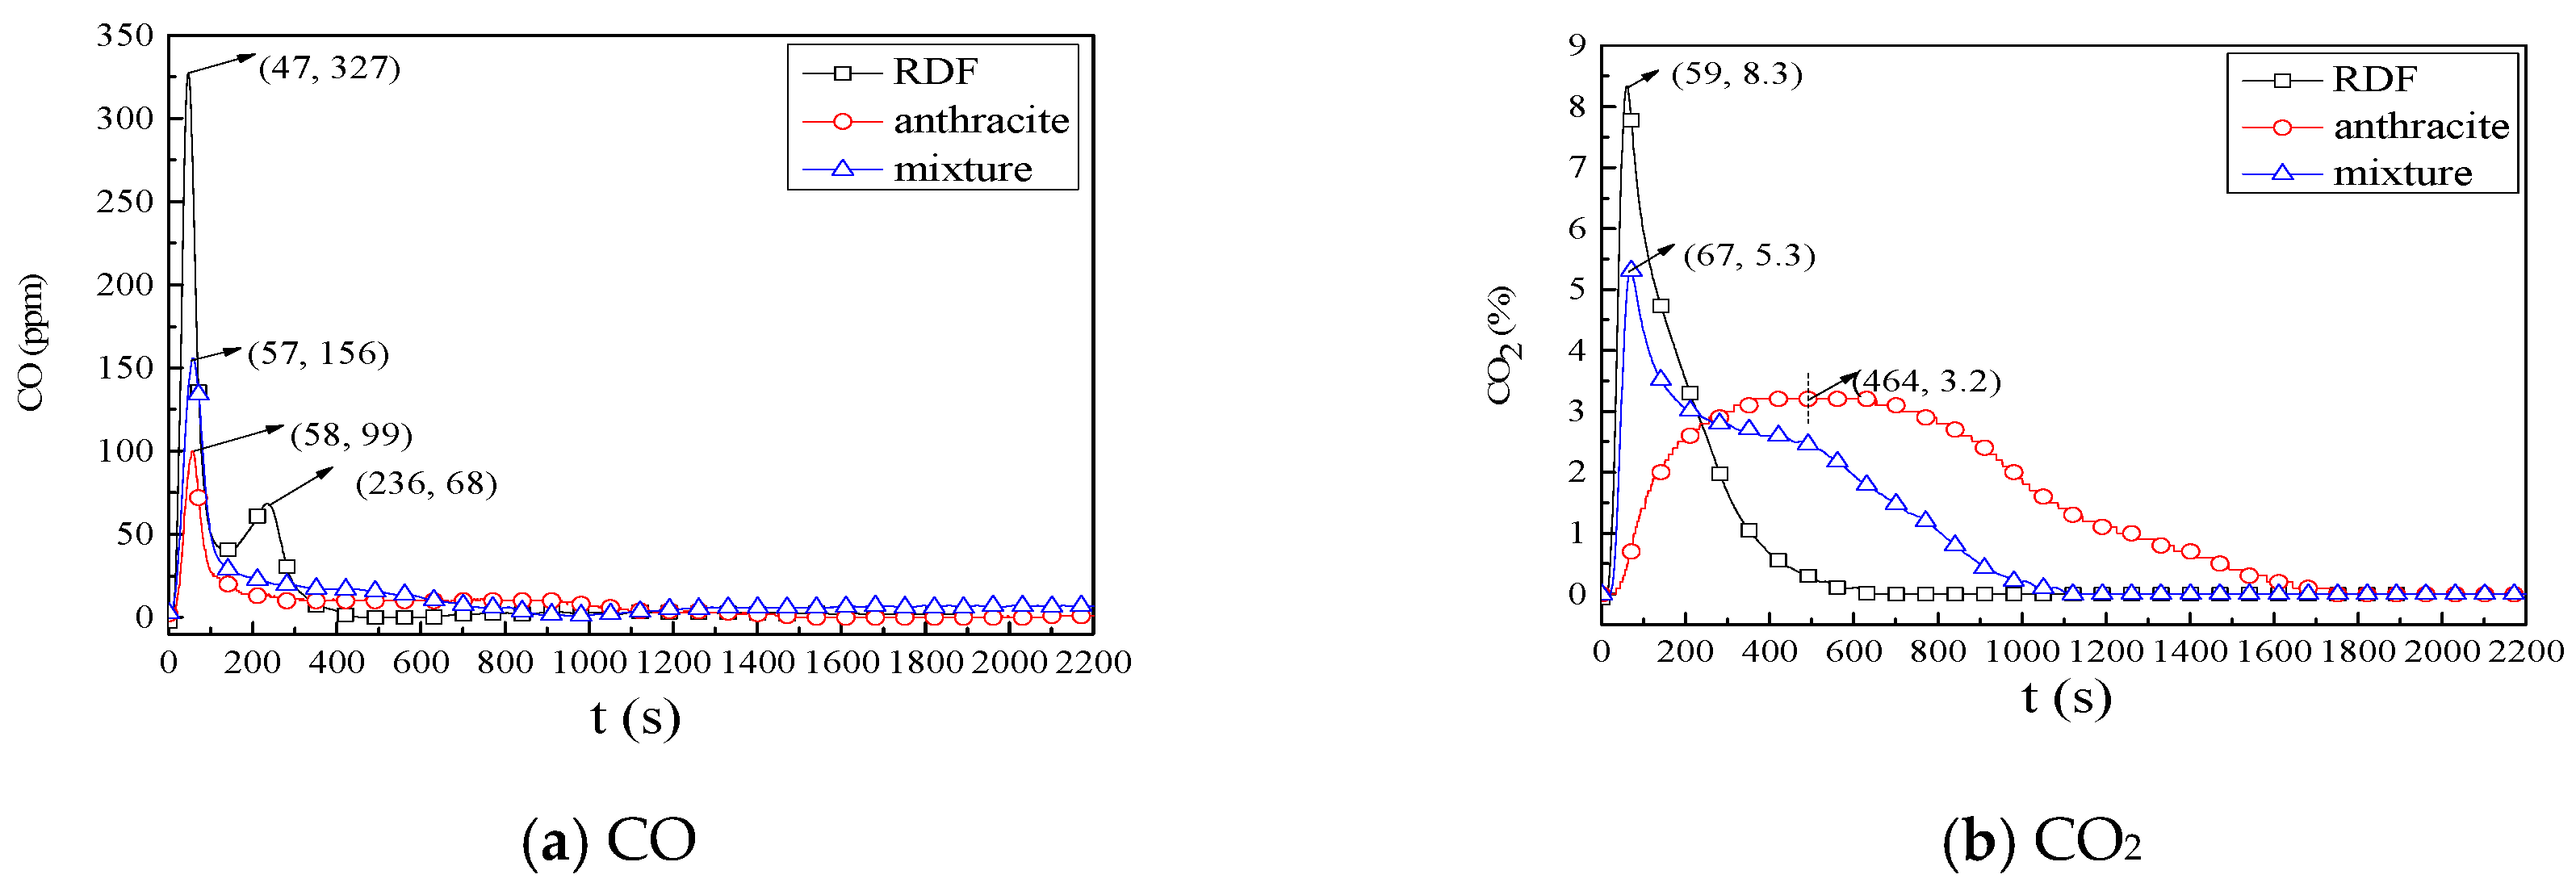
According to Figure 3, the combustion characteristics were analyzed during fuel combustion at 900 °C. Based on the CO and CO2 curves of RDF, the RDF combustion process can be divided into two stages. The first stage was the devolatilization and volatile matter content combustion, t < 200 s. In the first stage, the volatiles burned rapidly, CO and CO2 formed quickly, and the emission peaks were at t = 47 s and t = 59 s, respectively. The second stage was the char combustion, CO emission peak was at 236 s; at t = 700 s, the CO2 concentration was about 0%, which indicated that combustion process tended to be complete. It was concluded from the RDF combustion process that the devolatilization and volatile matter combustion played a dominant role in the whole combustion process, resulting in most of CO and CO2 formed in this stage. According to the CO and CO2 curves of anthracite combustion, the combustion process also included devolatilization and char combustion, but the char combustion stage played the dominant role, since most of CO2 formed in the char combustion stage. During co-combustion, in the beginning of the combustion, CO and CO2 peaks were approximately half of the separate combustion, constituting the linear additive effect of anthracite and RDF; in the char combustion stage of co-combustion, both the concentration of CO and CO2 were higher than the half of the linear addition of separate combustion, constituting the synergistic effect. Meanwhile, the co-combustion burn-out time was shorter than the separate combustion of anthracite. The results of experiments on the fixed-bed reactor were coincident with the results of TG-DTG experiment.
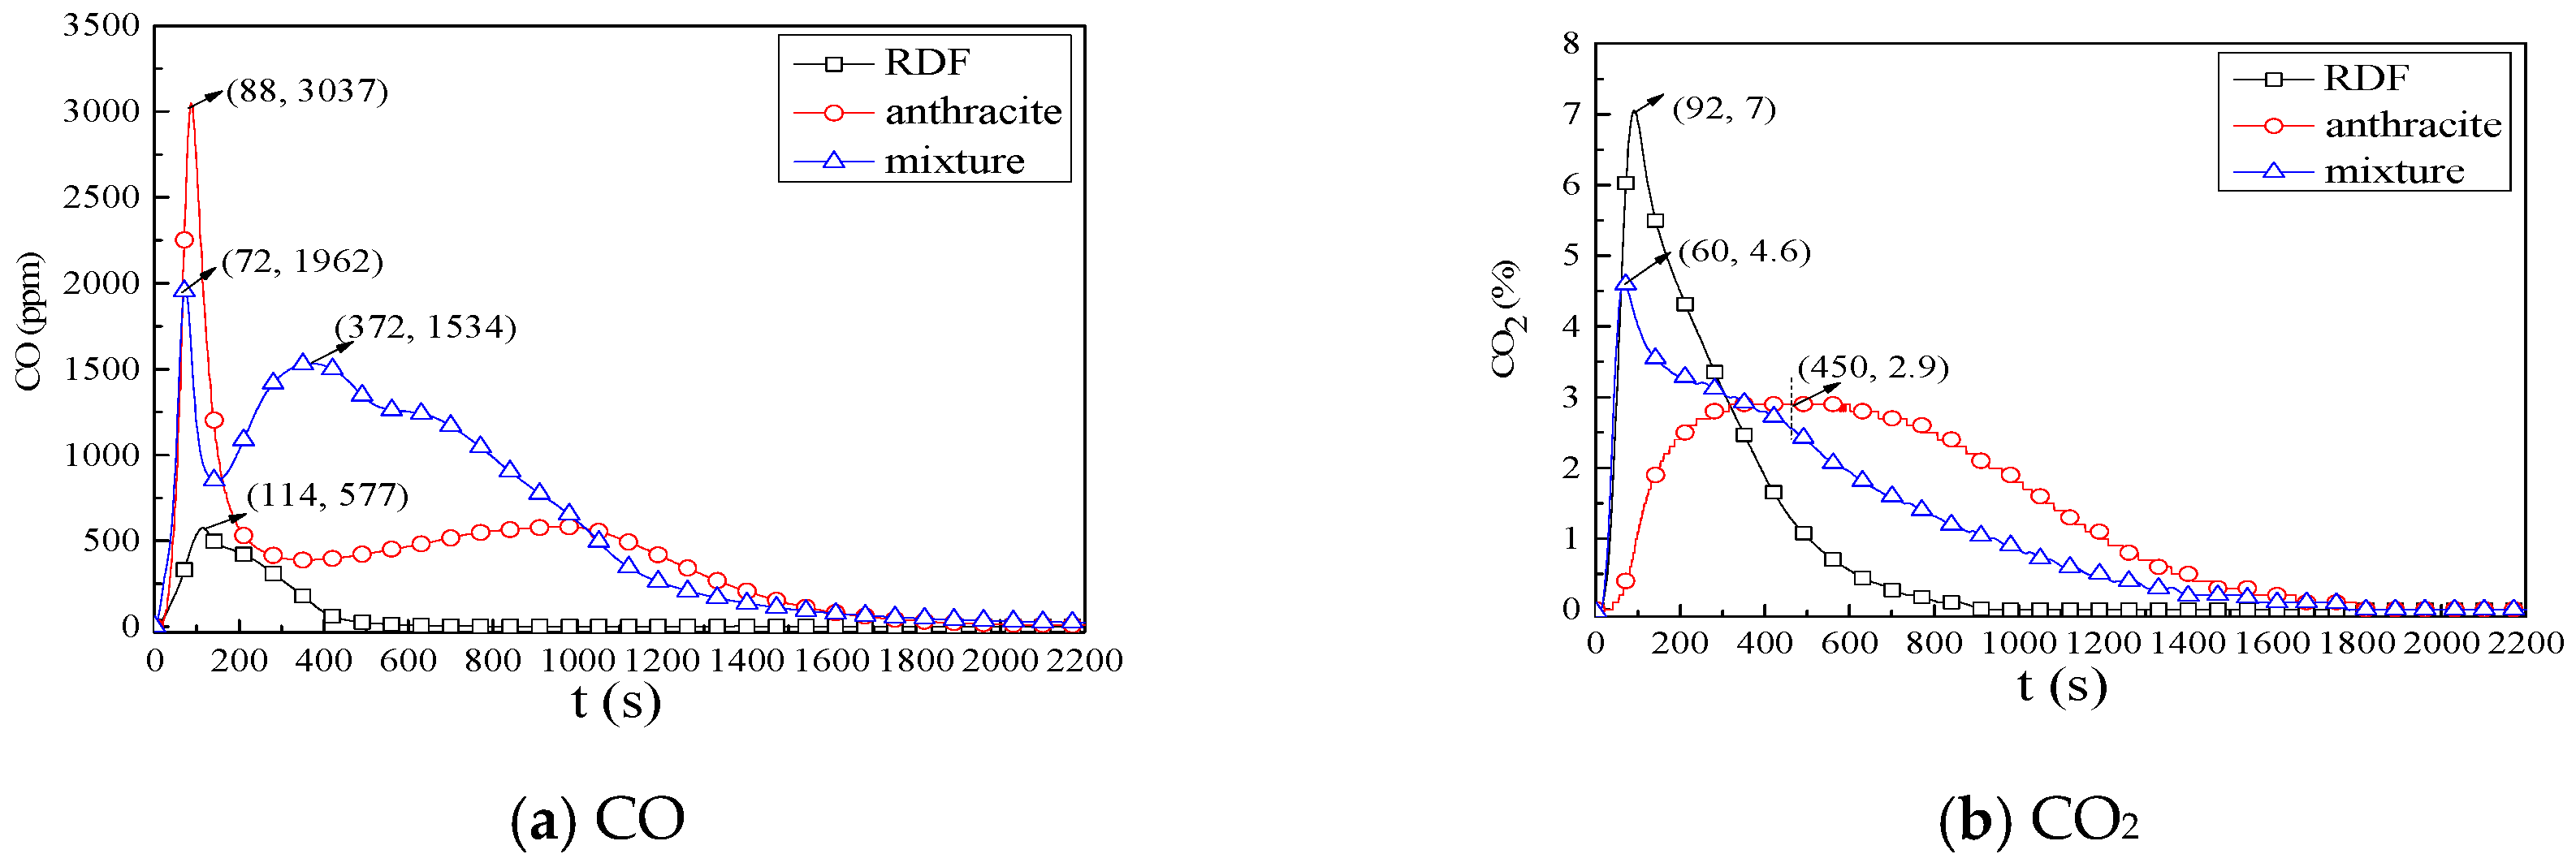
Combined with Figure 3, Figure 4 and Figure 5, the combustion characteristics of fuels at 900 °C and 800 °C were analyzed. In Figure 3a, Figure 4a and Figure 5a, the CO emission peaks and zero concentration time were later at 800 °C than at 900 °C, meaning the combustion rate was lower and the reaction time was longer at 800 °C, resulting in the high CO concentration. As shown in Figure 4, in the devolatilization stage of three kinds of fuels there was a large amount of CO, with the maximum CO concentration of 3037 ppm of anthracite combustion appearing at 800 °C, which was larger than that at 900 °C (99 ppm). During co-combustion, the maximum CO concentration was in the middle of the RDF and anthracite separate combustion, constituting the linear addition effect of RDF and anthracite. In the char combustion stage of three kinds of fuels, there weas also a large amount of CO, and the average concentration of CO at 800 °C was twenty times more than at 900 °C. The CO average concentration during co-combustion was larger than that during the combustion of RDF or anthracite separately, constituting the synergistic effect. In Figure 3b, Figure 4b and Figure 5b, the CO2 emission peaks and yields were lower at 800 °C than at 900 °C, because some fuel-C existed in the form of CO at 800 °C. Additionally, at 800 °C, the CO2 concentration in the early stage was nearly equal to the average values of the separate combustion; in the final stage, the CO2 concentration was larger than the average values of the separate combustion during co-combustion. This phenomenon was consistent with the results at 900 °C.
In general, the combustion experiments at 800 °C and 900 °C on the a double furnaces reactor also showed that the early stage of co-combustion, constituted the linear addition effect of the separate combustion of RDF and anthracite, while the later co-combustion stage constituted the synergistic effect.
3.2.2. NOx Emission Characteristics
Figure 6a,b are NOx emission curves at 900 °C and 800 °C, respectively. According to the NOx yield, the fuel N conversion can be calculated:
in which XNOx is the fuel N conversion (%), mo is the mass of the fuel sample 500 (mg), Nad is the N content in the fuel sample (wt %), and Cad is the C content in the fuel sample (wt %).
The bond energy of C-N in the coal is about 25.5–65 × 107 J/mol, which is much less than the N-N bond energy of nitrogen 94.5 × 10⁷ J/mol in the air. In the environment of precalciner (<1500 °C), the NOx mainly existed in the form of fuel NOx and the main reactions are as follows:
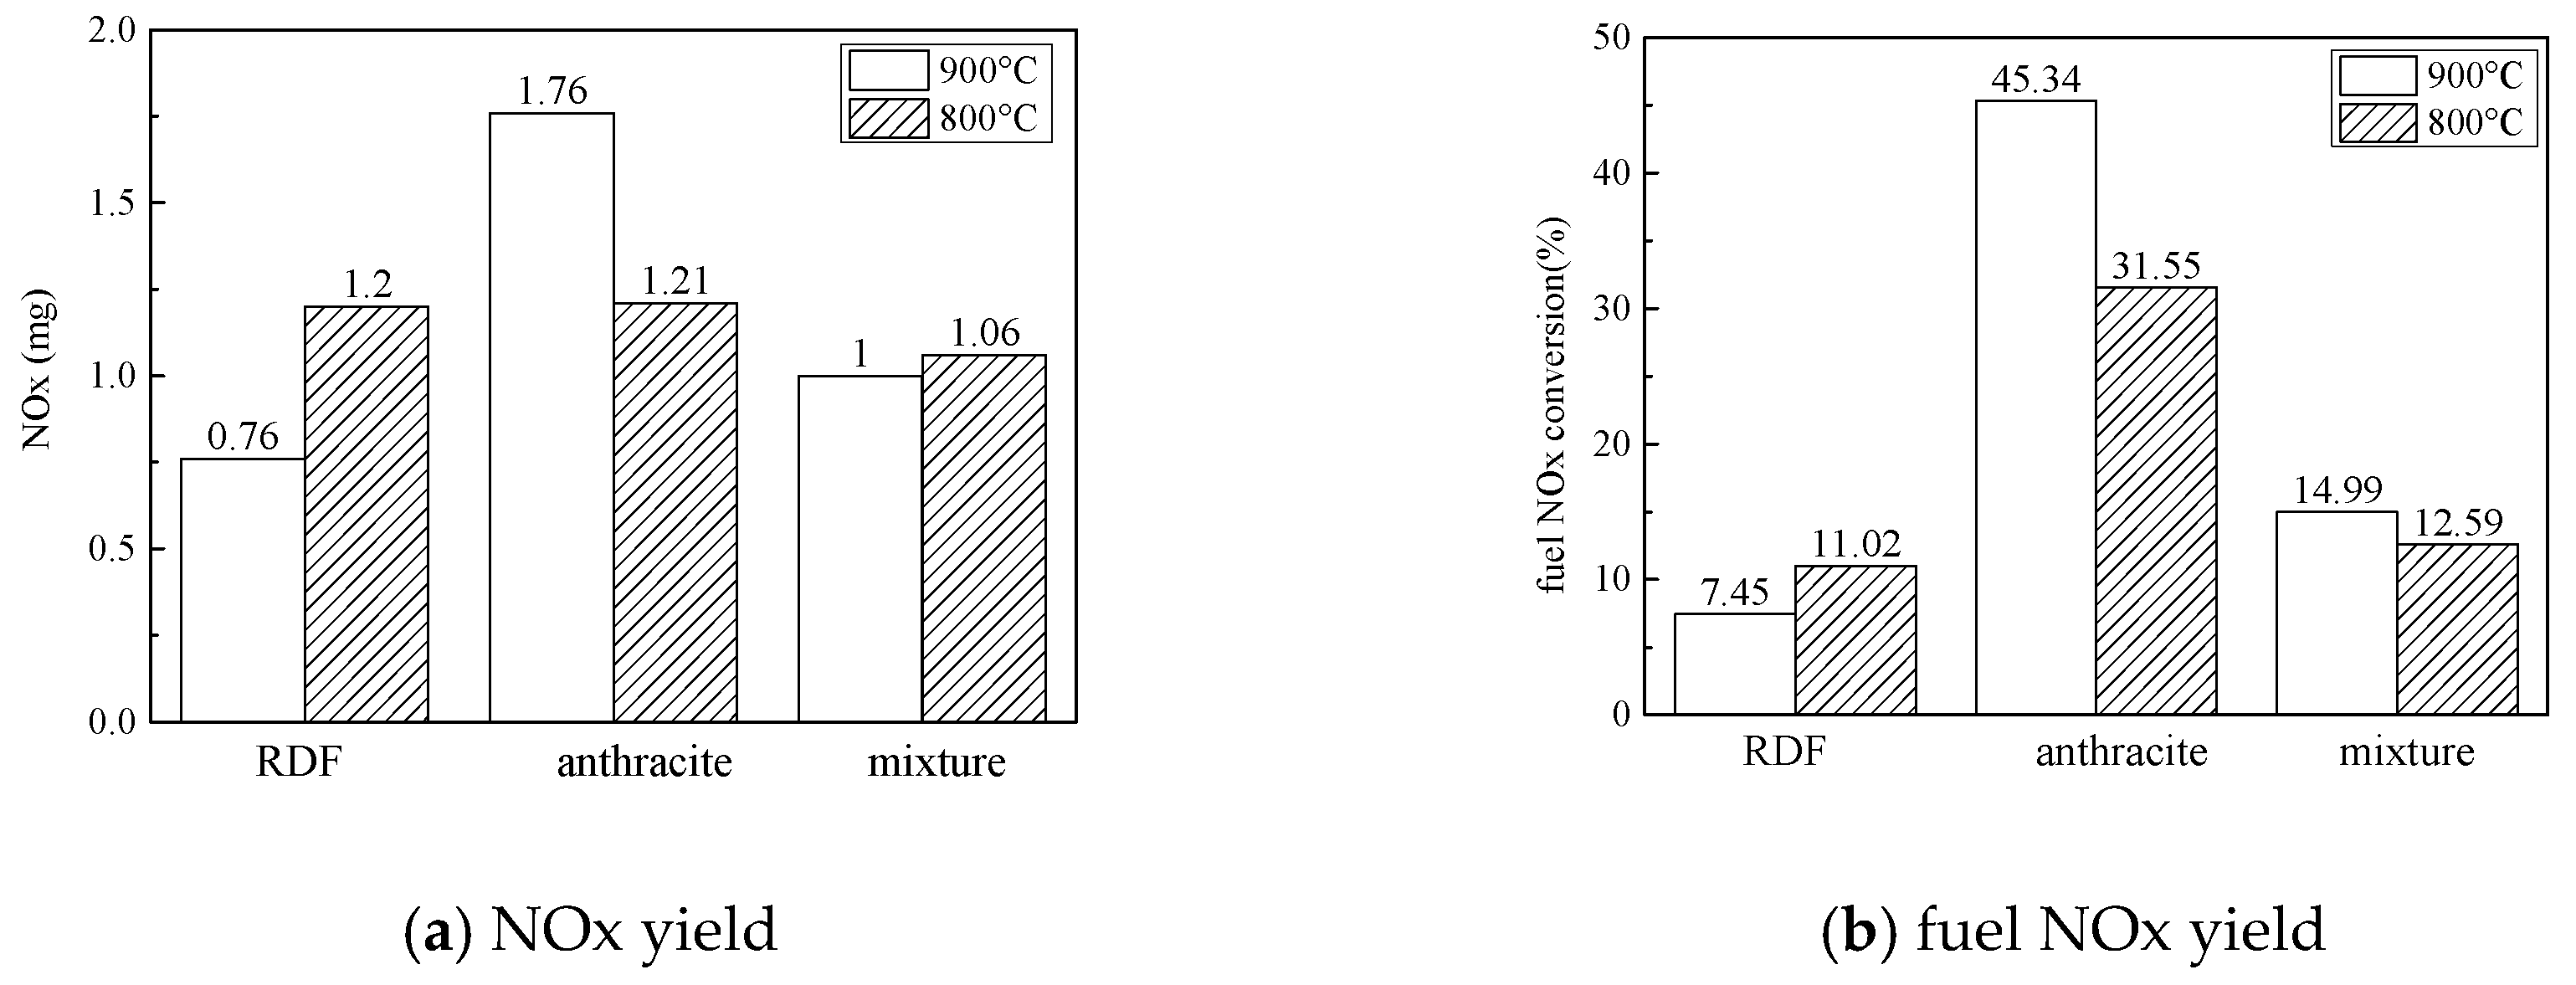
In Figure 6a, during RDF combustion at 900 °C, the NOx released quickly and the maximum NOx concentration was 238 ppm at t = 51 s, meaning that the NOx formed mainly in the devolatilization stage and the main NOx formation reaction was reaction (6); during anthracite combustion, the NOx released slowly and the maximum NOx concentration was 75 ppm at t = 221 s at 900 °C, and the NOx concentration was about 74 ppm from 211–829 s; the NOx formed mainly in char combustion stage and the main NOx formation reaction was reaction (7); during co-combustion, the NOx released quickly at first; then, the NOx concentration was kept at 35 ppm, which then decreased to 0 ppm gradually; the NOx formed in the whole combustion process. In the devolatilization stage, the NOx concentration of co-combustion was nearly the same with the NOx concentration of RDF combustion, which meant that the NOx formation reaction was enhanced during co-combustion. In the early combustion process, although the CO concentration was nearly the average of the separate combustion of RDF and anthracite during co-combustion, the reaction (8) was weak, resulting in the high NOx emission. In the char combustion stage, the NOx concentration was lower than the average values. As mentioned above, the CO concentration was high, which could inhibit the NOx formation. Combined with the two stages, during the co-combustion the NOx yield and fuel NOx conversion was lower than the average values of separate combustion of RDF and anthracite, as shown in Figure 7.
In Figure 6b, during RDF combustion the reaction rate was slow, which could prolong the time of volatiles combustion, and promote the reaction of fuel-N and O2, resulting in the increase of NOx (Figure 7) at 800 °C; during anthracite combustion at 800 °C, the rapid formation of CO inhibited the formation of NOx; during co-combustion process, in the volatiles combustion stage the NOx formation reaction was promoted, but in the char combustion stage the NOx formation reaction was inhibited, resulting in the NOx yield and fuel NOx conversion that were nearly the same as at 900 °C.
In conclusion, during the separate combustion of RDF, the volatiles combustion stage was dominant and the combustion rate was quick. Additionally, the combustion rates were nearly the same at 800 °C and at 900 °C, and the burn-out time was nearly the same. However, at 800 °C the reaction rate of NOx and CO was slow, which meant the fuel NOx being reduced was less, resulting in the NOx yield being higher at 800 °C. During the separate combustion of anthracite, the char combustion stage was dominant, and the process was long. Additionally, at 800 °C, there was no obvious peak in NOx release curve in the first stage; on the one hand, the NOx formation reaction was slow; on the other hand, the large amount of existing CO could promote the reduction reaction of NOx. In addition, at low temperature the char could form easily, which could also reduce the NOx. During the co-combustion, the temperature had little effect on the release of NOx, but both the NOx yield and the fuel NOx conversion were lower than the separate combustion. According the combustion process, during the co-combustion, much more CO was formed, since the synthetic effect was in the second combustion stage, which could inhibit the NOx formation and promote the reduction of NOx. What is more, the NOx release curves were consistent with the CO2 release curves for three kinds of fuels.
3.2.3. SO2 Emission Characteristics
Figure 8a,b are SO2 emission curves at 900 °C and 800 °C, respectively. According to the SO2 yield, the fuel S conversion can be calculated:
in which XSO2 is the fuel S conversion (%), mo is the mass of the fuel sample 500 (mg), Sad is the S content in the fuel sample (wt %), and Cad is the C content in the fuel sample (wt %).
There are organic sulfur and inorganic sulfur in coal, and the organic sulfur is the main part. Compared with N in coal, the release of S is mainly affected by the thermal decomposition of salt, which is not directly related to the existence form of C. The transformation process is as follows:
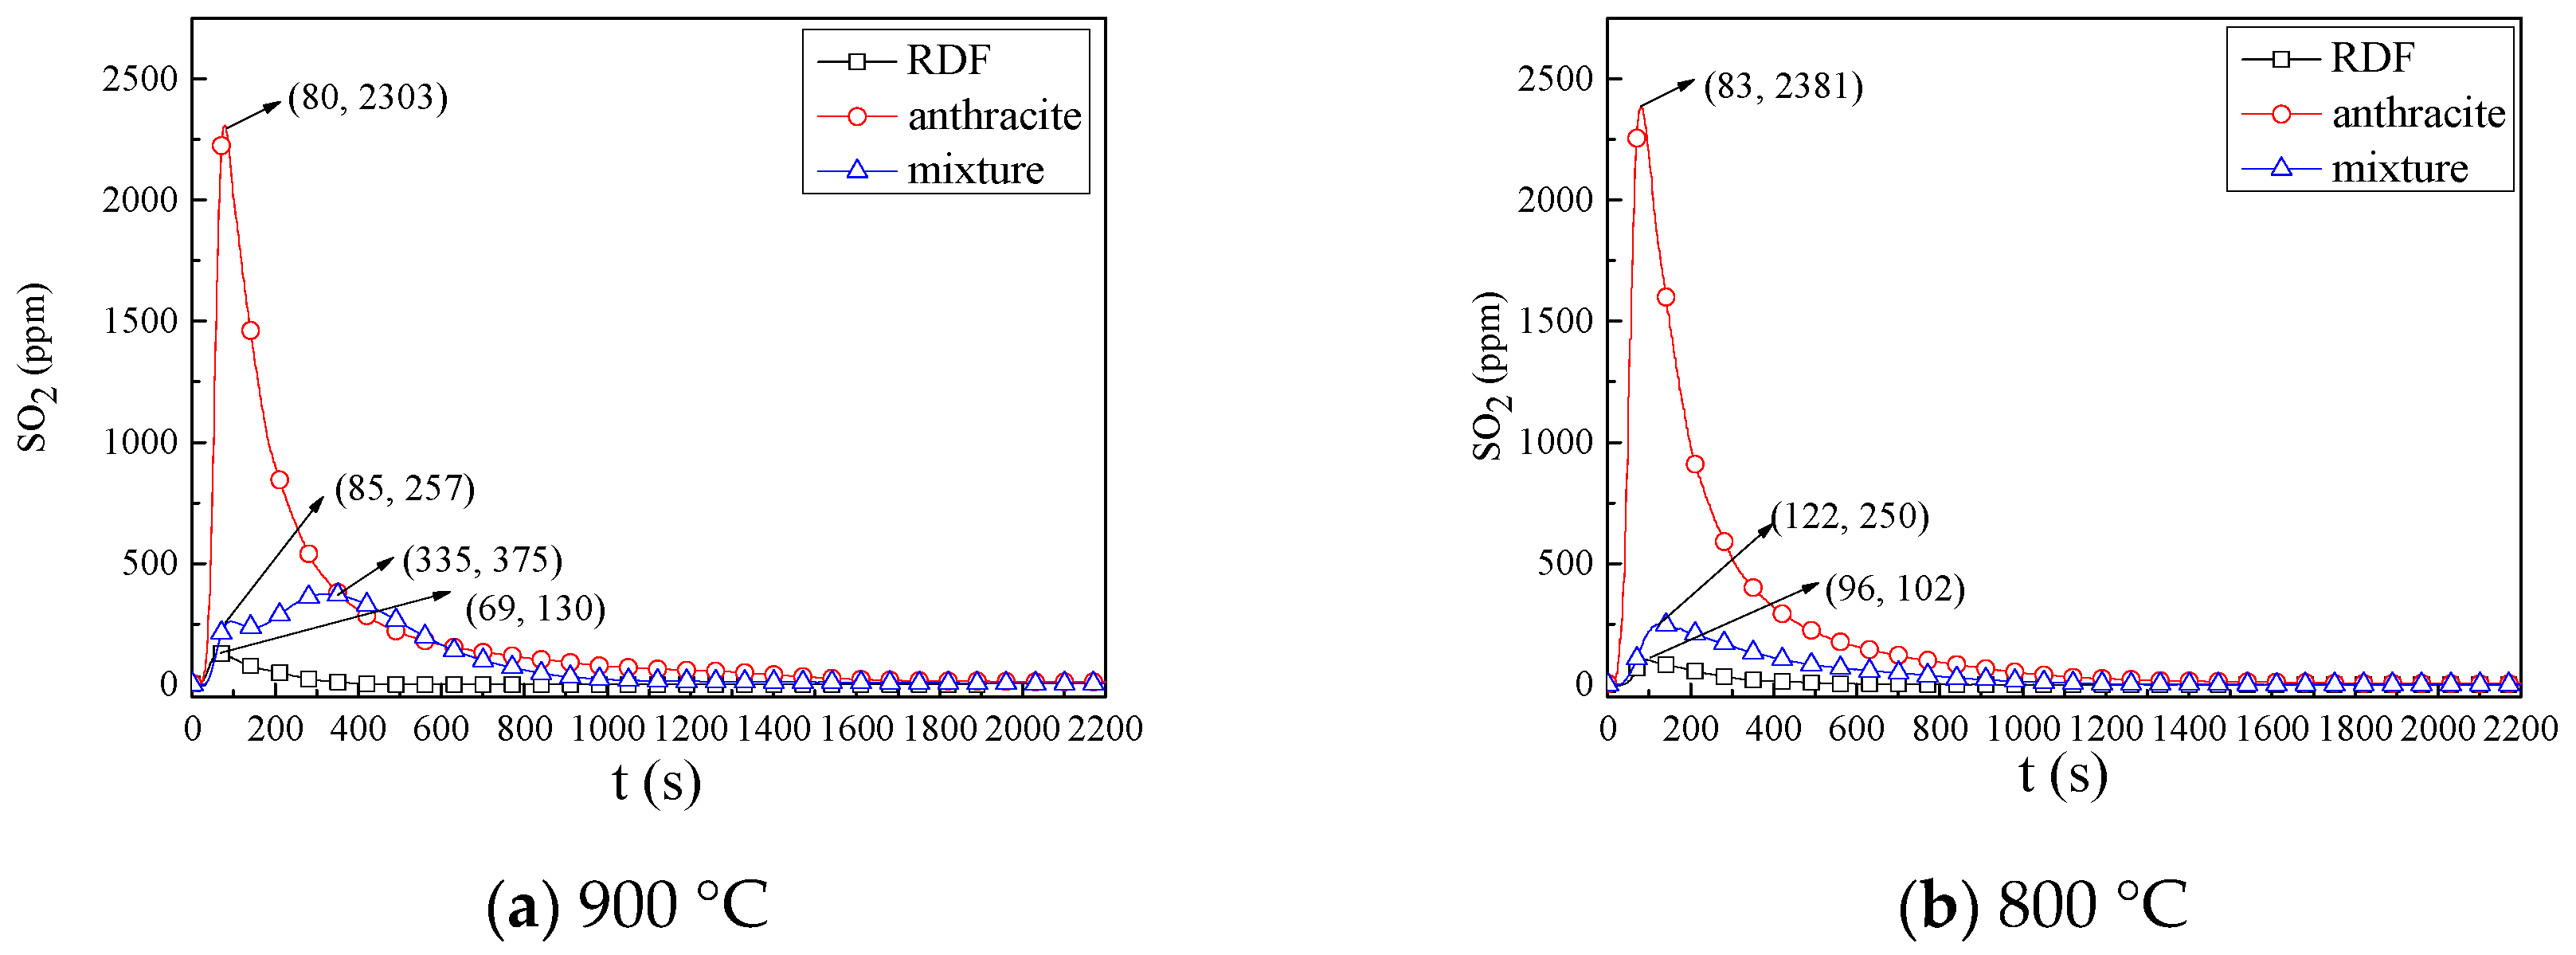
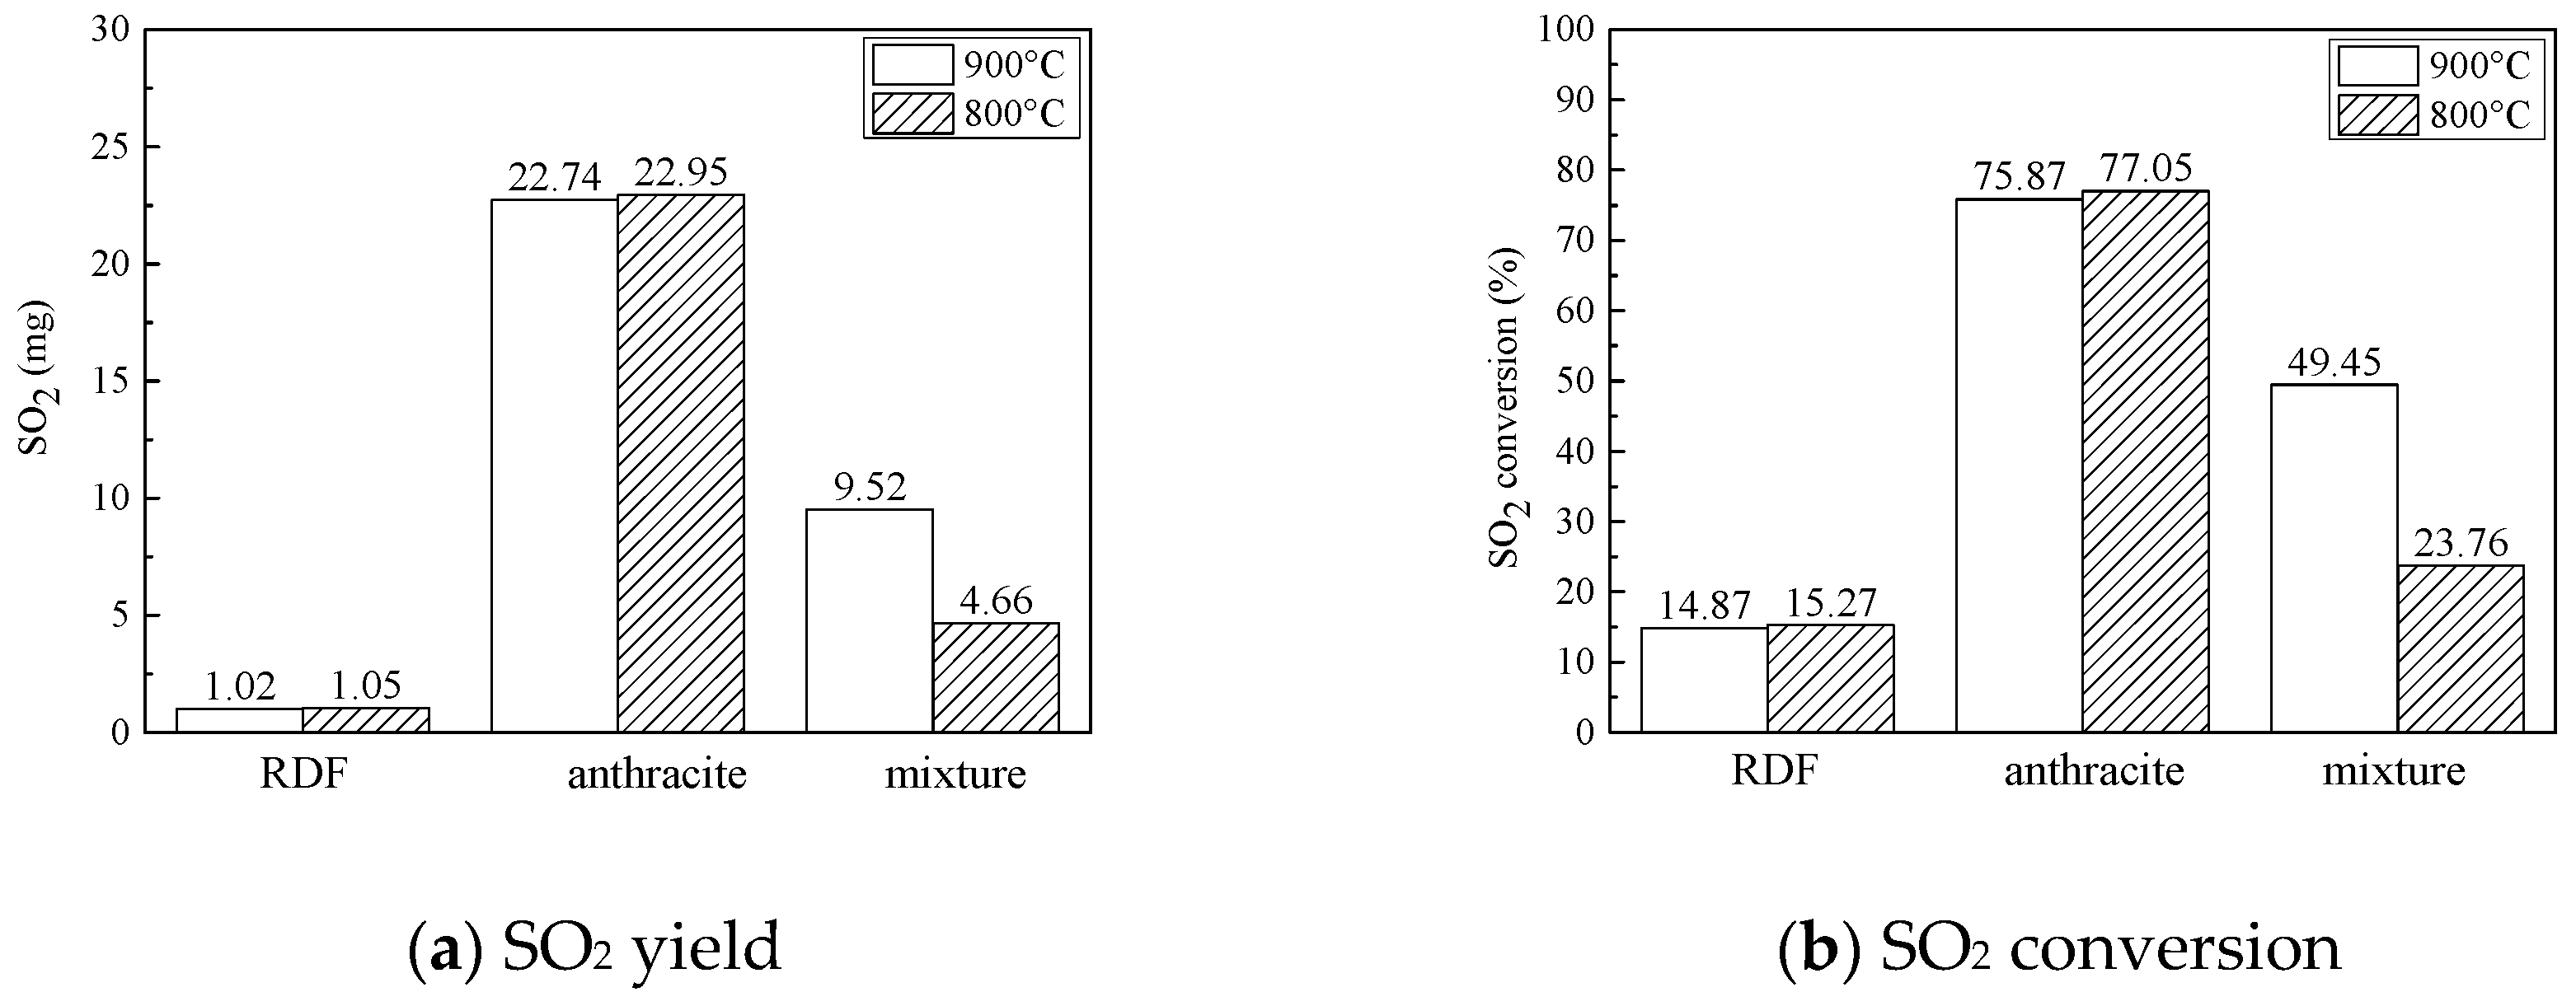
In Figure 8a, during RDF combustion the SO2 released quickly and the maximum SO2 concentration was 69 ppm at t = 130 s at 900 °C, meaning that the SO2 formed mainly in the devolatilization stage; during anthracite combustion, the SO2 released quickly and then formed continually in the whole combustion process, and the SO2 concentration tendency corresponded to the CO concentration curve; during co-combustion, in the first combustion stage, the SO2 concentration was low, and in the char combustion stage the SO2 concentration was nearly the same as the separate combustion of anthracite. In general, this constitutes the synergistic effect for SO2 formation when anthracite combustion is added to RDF, and the SO2 yield and SO2 conversion were nearly equal to the average values of separate combustion of RDF and anthracite.
In Figure 8b, during the separate combustion of anthracite and RDF at 800 °C, the tendency of SO2 formation curves were the same as at 900 °C. The maximum SO2 concentration formed later at 800 °C, but the SO2 yield and SO2 conversion (as shown in Figure 9) were not influenced by temperature. During the co-combustion at 800 °C and in the char combustion stage, the concentration of SO2 was lower than at 900 °C; this is because when the atmosphere temperature was 800 °C, the actual temperature was higher than 800 °C, and the decomposition temperature of CaCO3 was 825 °C, which could generate CaO and promote the reaction (11) and (12).
3.3. Ash Characteristics
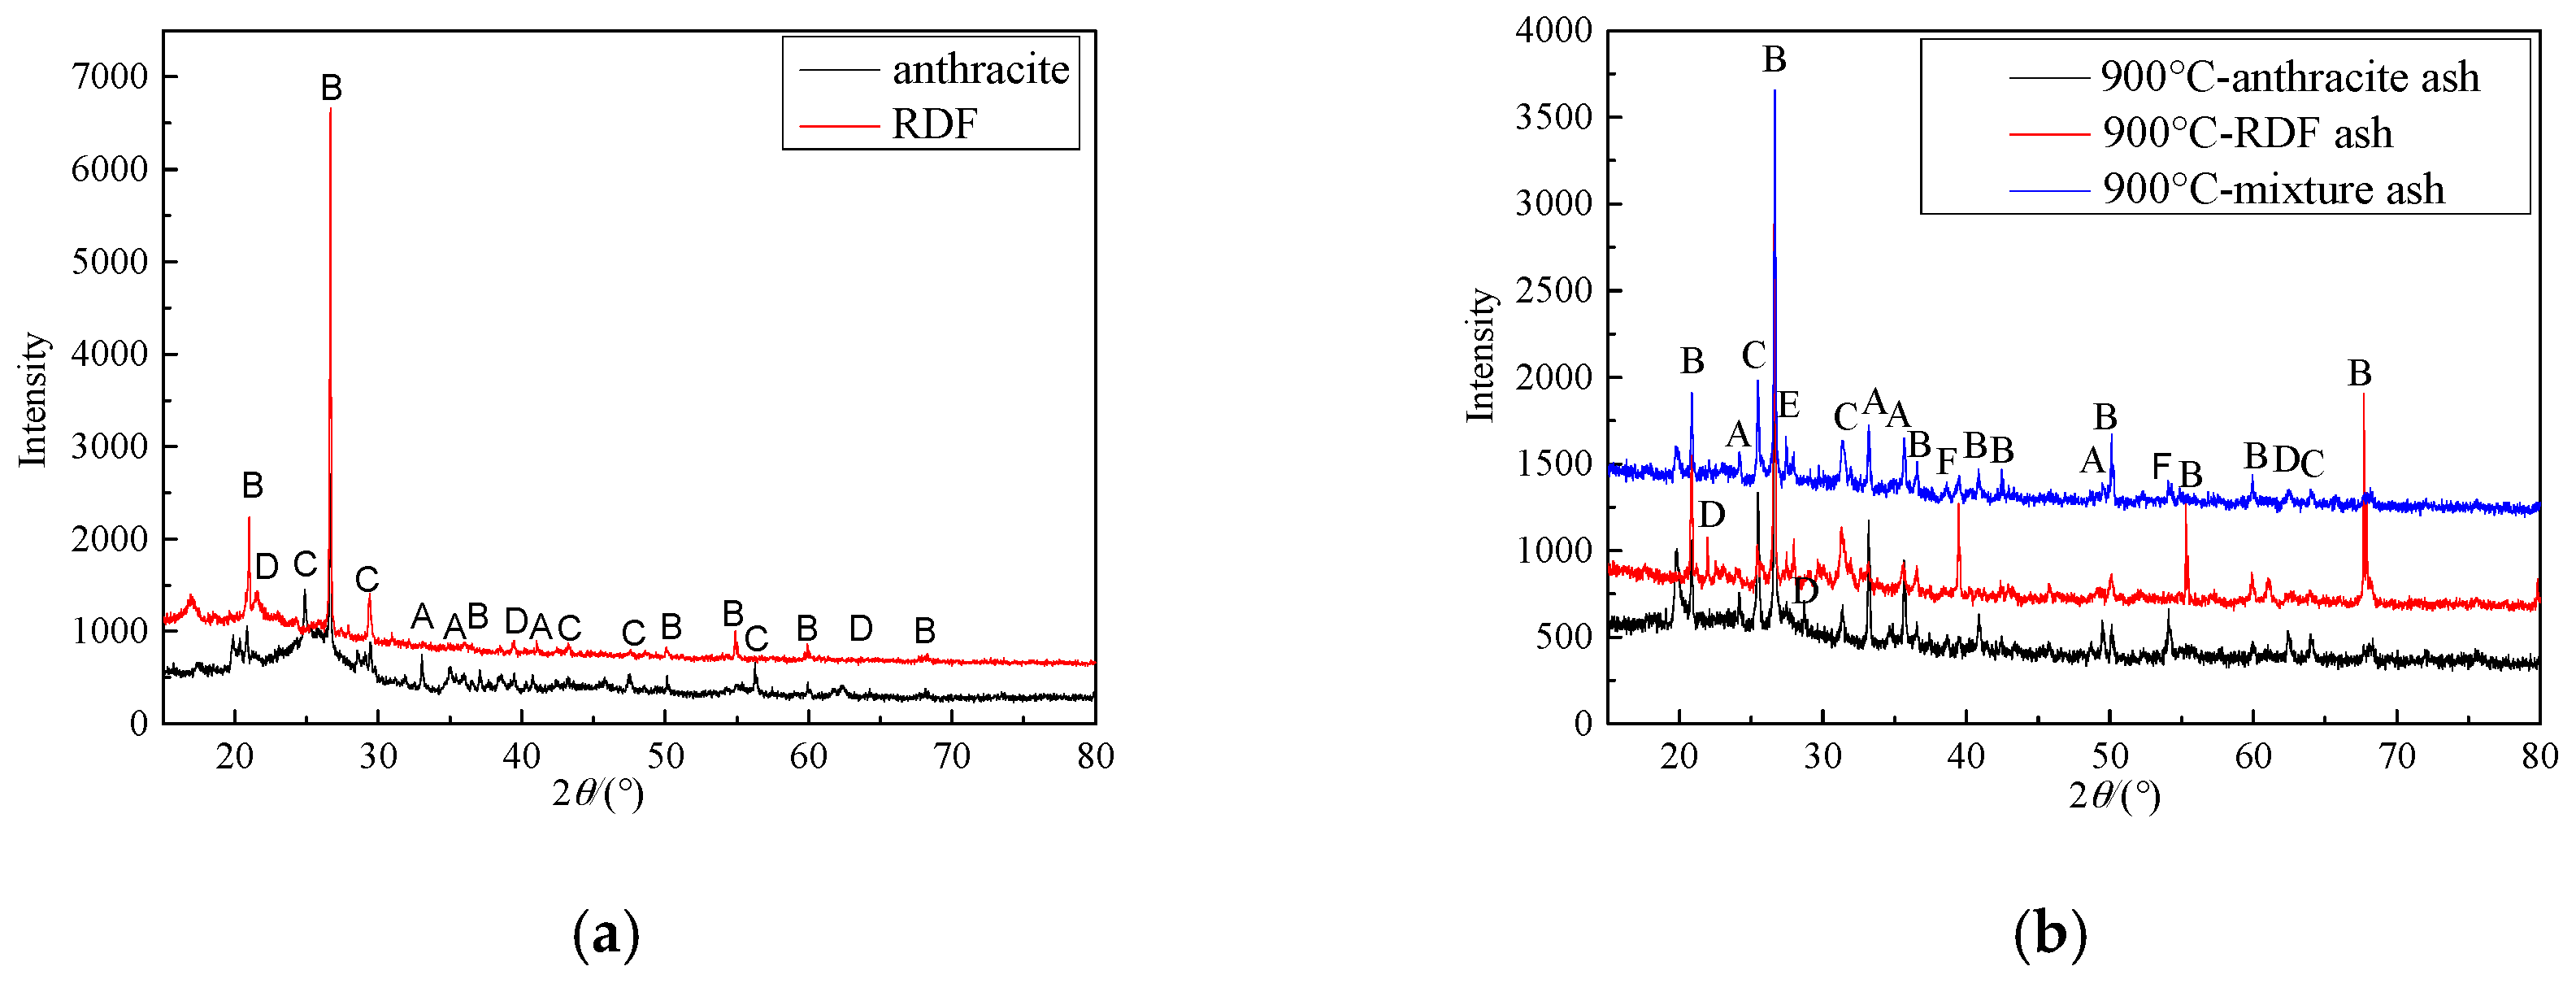
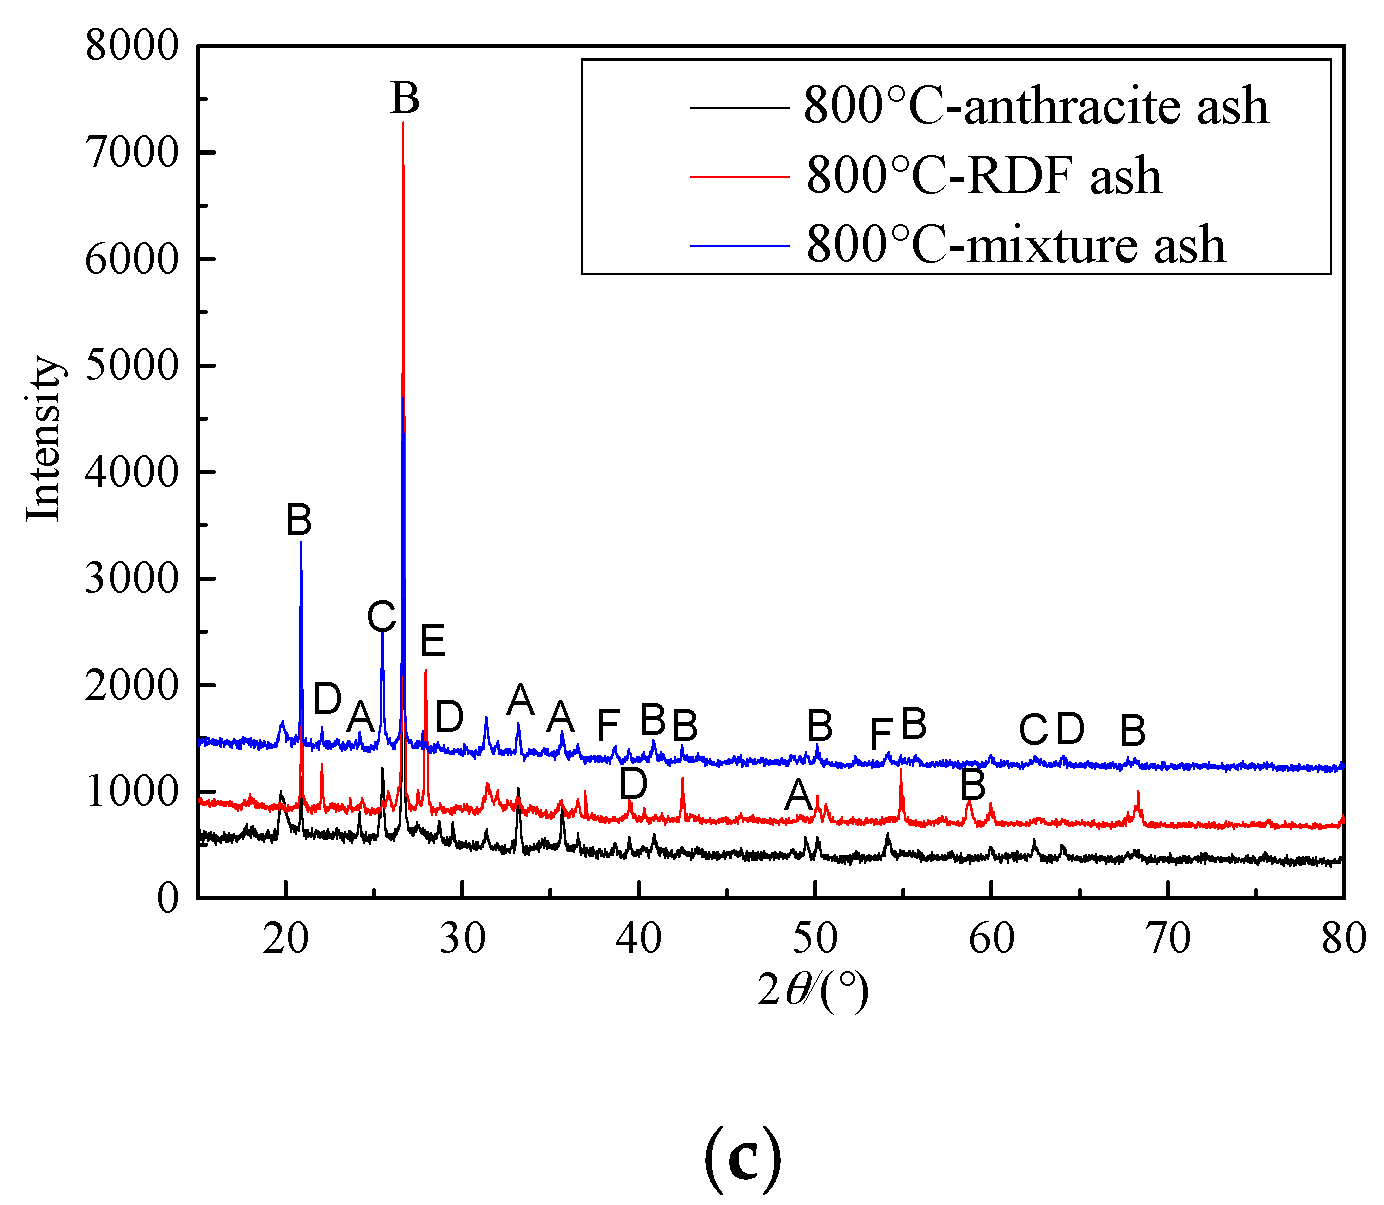
Figure 10 is the XRD analysis of fuels and different ashes. As shown in Figure 10a, Fe2O3, SiO2, CaSO4, and CaCO3 were the main metal oxides in the anthracite and RDF, and SiO2 presented in significant proportions in RDF. There were some new oxides in the ashes—CaAl2Si2O8, CaO. CaCO3 decomposed and then absorbed the SO2 released in the combustion process. At 900 °C, the diffraction peaks of SO2 and CaAl2Si2O8 in the co-combustion ash was obvious, meaning that the ash existed in the more stable forms, which could resist the diffusion of O2 and inhibit the oxidation reaction of fuel-N, resulting in the decrease of NOx. Meanwhile, the diffraction peaks of CaSO4 and CaO in the co-combustion ash were similar to the separate combustion of coal and RDF, and in the fixed-bed experiment, the SO2 yield during co-combustion was nearly the same as the linear addition of the separate combustion of anthracite and RDF. At 800 °C, the diffraction peaks of CaSO4 were more obvious during co-combustion, which meant that more SO2 was absorbed in the form of CaSO4.
4. Conclusions
- (1)
- The combustion characteristics: The combustion process of RDF is dominated by devolatilization and volatile matter combustion, whose ignition temperature is low and whose burn-out time is short; the combustion process of anthracite is dominated by char combustion, whose ignition temperature is high and whose burn-out time is long; in the early stage of co-combustion, constituting the linear additive effect of the separate combustion of RDF and anthracite, the later co-combustion stage constitutes the synergistic effect. It is feasible to use the mixture of RDF and anthracite as an alternative fuel in the cement plant.
- (2)
- The temperature effect on the co-combustion process: At 900 °C, the synergistic effect is obvious in the char combustion stage, which could promote the combustion of anthracite and shorten the burn-out time; at 800 °C, the combustion rate is low in the whole combustion process, and the burn-out time of the co-combustion is nearly the same as the time of the separate combustion of anthracite.
- (3)
- NOx emission characteristics: During co-combution, at 900 °C, NOx released rapidly during the devolatilization stage, but in the char combustion stage the NOx formation were inhibited; at 800 °C, a large amount of CO formed, which could reduce the NOx. In general, at 900 °C and at 800 °C, the application of co-combustion could lower the NOx emission yield and lower the NOx conversion.
- (4)
- SO2 emission characteristics: Combined the combustion characteristics and the XRD results, it was indicated that during co-combustion, at 800 °C, the SO2 formation reaction was inhibited by metal oxides, and the SO2 yield and conversion were quite low.
Acknowledgments
This work was financially supported by the National Natural Science Foundation of China under grant 51502221.
Author Contributions
Xiaolin Chen, Junlin Xie, and Shuxia Mei conceived and designed the experiments; Xiaolin Chen performed the experiments; Xiaolin Chen and Shuxia Mei analyzed the data; Feng He contributed materials and analysis tools; Xiaolin Chen wrote the paper.
Conflicts of Interest
The authors declare no conflict of interest.
References
- Vesterinen, R.; Flyktman, M. Organic emissions from co-combustion of RDF with wood chips and milled peat in a bubbling fluidized bed boiler. Chemosphere 1996, 32, 681–689. [Google Scholar] [CrossRef]
- Zhu, T.Y.; Ye, M.; Jing, P.F.; Xu, W.Q.; Xiao, Y.H. Properties of flue gas from mixed incineration of municipal solid waste and coal in a 1.5 MW circulating fluidized bed boiler. CIESC J. 2010, 61, 2468–2473. [Google Scholar]
- Bai, J.S.; Yu, C.J.; Li, L.M.; LI, X.L.; Wang, Q.H.; Luo, Z.Y. Experimental Investigation on Co-firing of Coal and Refuse-derived Fuel in a Pilot-scale Circulating Fluidized Bed Combustor. Proc. CSEE 2012, 32, 36–41. [Google Scholar] [CrossRef]
- Lee, J.M.; Kim, D.W.; Kim, J.S.; Na, J.G.; Lee, S.H. Co-combustion of refuse derived fuel with Korean anthracite in a commercial circulating fluidized bed boiler. Energy 2010, 35, 2814–2818. [Google Scholar] [CrossRef]
- Li, X.G.; Lv, Y.; Ma, B.G.; Jian, S.W.; Tan, H.B. Thermogravimetric investigation on co-combustion characteristics of tobacco residue and high-ash anthracite coal. Bioresour. Technol. 2011, 102, 9783–9787. [Google Scholar] [CrossRef] [PubMed]
- Fan, W.Y.; Zhu, T.L.; Sun, Y.F.; Dong, L. Effects of gas compositions on NOx reduction by selective non-catalytic reduction with ammonia in a simulated cement precalciner atmosphere. Chemosphere 2014, 113, 182–187. [Google Scholar] [CrossRef] [PubMed]
- Mikulčić, H.; Berg, E.V.; Vujanović, M.; Priesching, P.; Tatschl, R.; Duic, N. Numerical analysis of cement calciner fuel efficiency and pollutant emissions. Clean Technol. Environ. 2013, 15, 489–499. [Google Scholar] [CrossRef] [Green Version]
- Liu, H.F.; Liu, Y.H.; Liu, Y.H.; Che, D.F. N2 formation from coal nitrogen during pyrolysis and combustion. J. Xian Jiaotong Univ. 2008, 42, 350–353. [Google Scholar]
- Gong, Z.Q.; Liu, Z.C.; Zhu, Z.P.; Yu, K.S.; Meng, G.J.; Liu, J.P.; Ouyang, Z.Q.; Sun, Y.K.; Lv, Q.G. Experimental study on semi-coke combustion and coal pyrolysis and combustion coupling. J. China Coal Soc. 2014, 39, 519–525. [Google Scholar]
- Zhou, H.; Huang, Y.; Mo, G.Y.; Liao, Z.Y.; Cen, K.F. Conversion of Fuel-N to N2O and NOx during Coal Combustion in Combustors of Different Scale. Chin. J. Chem. Eng. 2013, 21, 999–1006. [Google Scholar] [CrossRef]
- Collings, M.E.; Mann, M.D.; Young, B.C. Effect of coal rank and circulating fluidized-bed operating parameters on nitrous oxide emissions. Energy Fuels 1993, 7, 554–558. [Google Scholar] [CrossRef]
- Bo, L. Fluidized bed combustion: Mixing and pollutant limitation. Prog. Energy Combust. 1998, 24, 31–61. [Google Scholar] [CrossRef]
- De, D.L.F.; Londono, C.A.; Wang, X.S.; Gibbs, B.M. Influence of operating parameters on NOx and N2O axial profiles in a circulating fluidized bed combustor. Fuel 1996, 75, 971–978. [Google Scholar] [CrossRef]
- Lin, Z.M.; Wang, Z.H.; Liu, J.; Ge, L.C.; Zhang, Y.W.; Zhang, Q.; Zhou, J.H.; Cen, K.F. Experimental study on combustion and NOx emission characteristics of Zhehun blended coal. Therm. Power Gen. 2014, 43, 44–48. [Google Scholar]
- Chui, E.H.; Majeski, A.J.; Douglas, M.A.; Tan, Y.; Thambimuthu, K.V. Numerical investigation of oxy-coal combustion to evaluate burner and combustor design concepts. Energy 2004, 29, 1285–1296. [Google Scholar] [CrossRef]
- Muto, M.; Watanabe, H.; Kurose, R.; Komori, S.; Balusamy, S.; Hochgreb, S. Large-eddy simulation of pulverized coal jet flame—Effect of oxygen concentration on NOx formation. Fuel 2015, 142, 152–163. [Google Scholar] [CrossRef]
- Christopher, R.S.; Alejandro, M. Fundamental investigation of NOx formation during oxy-fuel combustion of pulverized coal. P. Combust. Inst. 2011, 33, 1723–1730. [Google Scholar] [CrossRef]
- Zhou, Z.J.; Zhou, N.; Chen, Y.J.; Zhou, J.H.; Liu, J.Z.; Cen, K.F. Experimental Research on the Combustion and NOx Generation Characteristics of Low Volatile Coal. Proc. CSEE 2010, 30, 55–61. [Google Scholar]
- Liu, Z.G.; Quek, A.; Hoekman, S.K.; Srinivasan, M.P.; Balasubramanian, R. Thermogravimetric investigation of hydrochar-lignite co-combustion. Bioresour. Technol. 2012, 123, 646–652. [Google Scholar] [CrossRef] [PubMed]
Figure 1.
Double furnaces reactor.
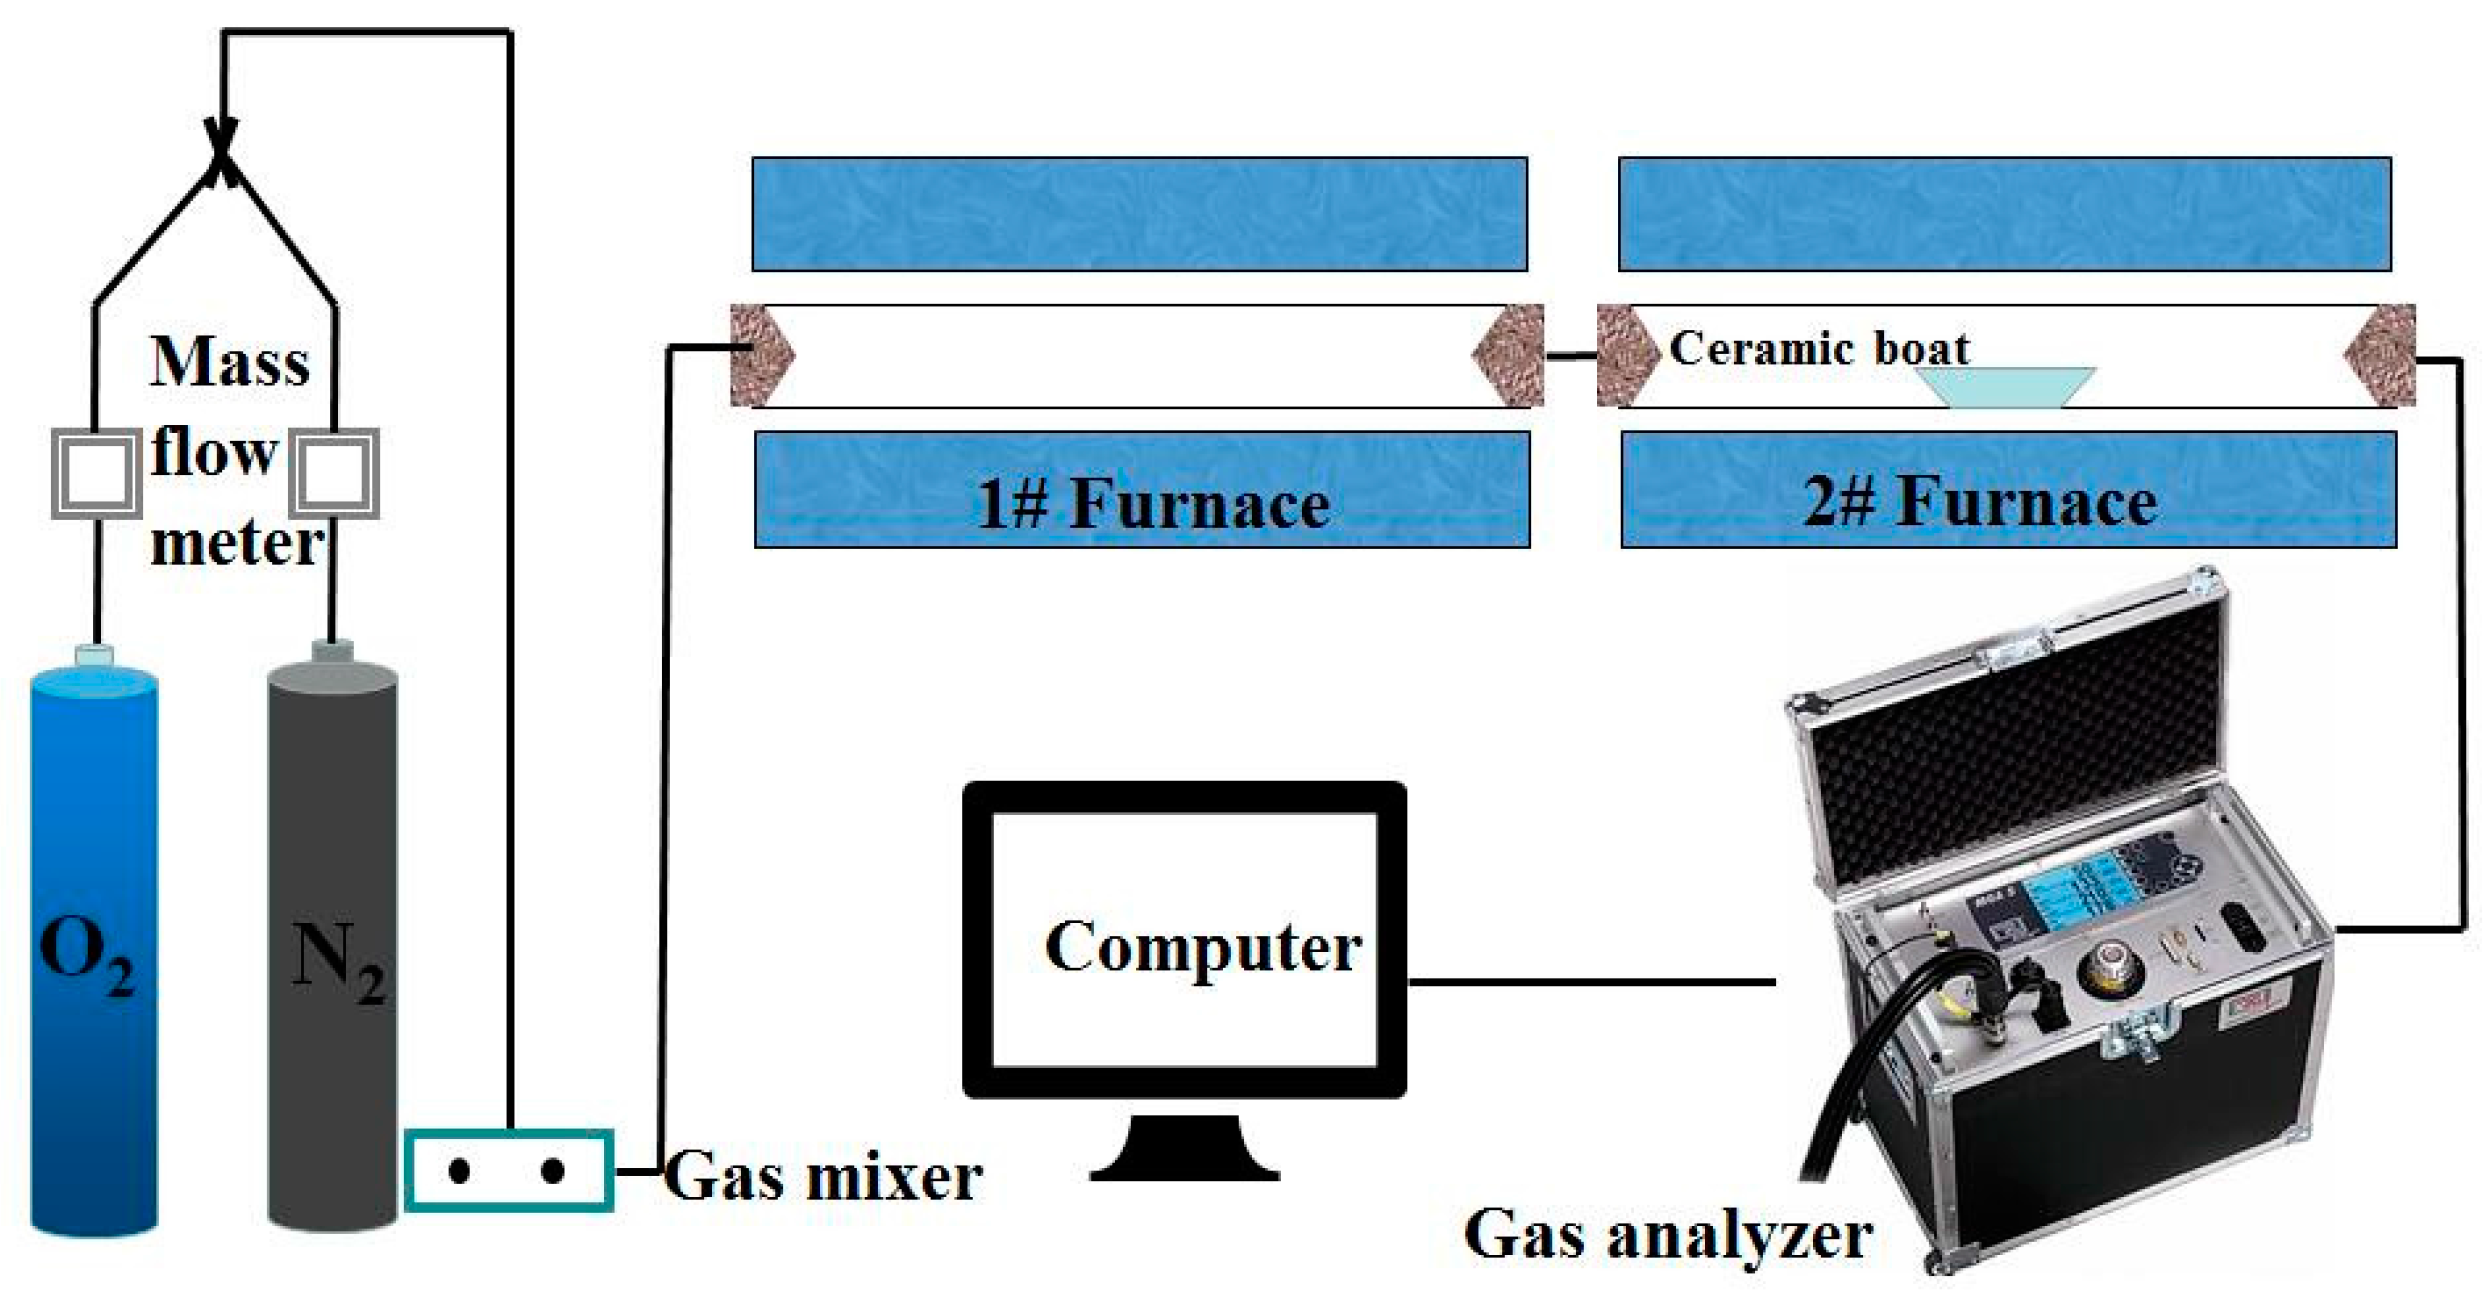
Figure 2.
TG-DTG profiles of fuels combustion.
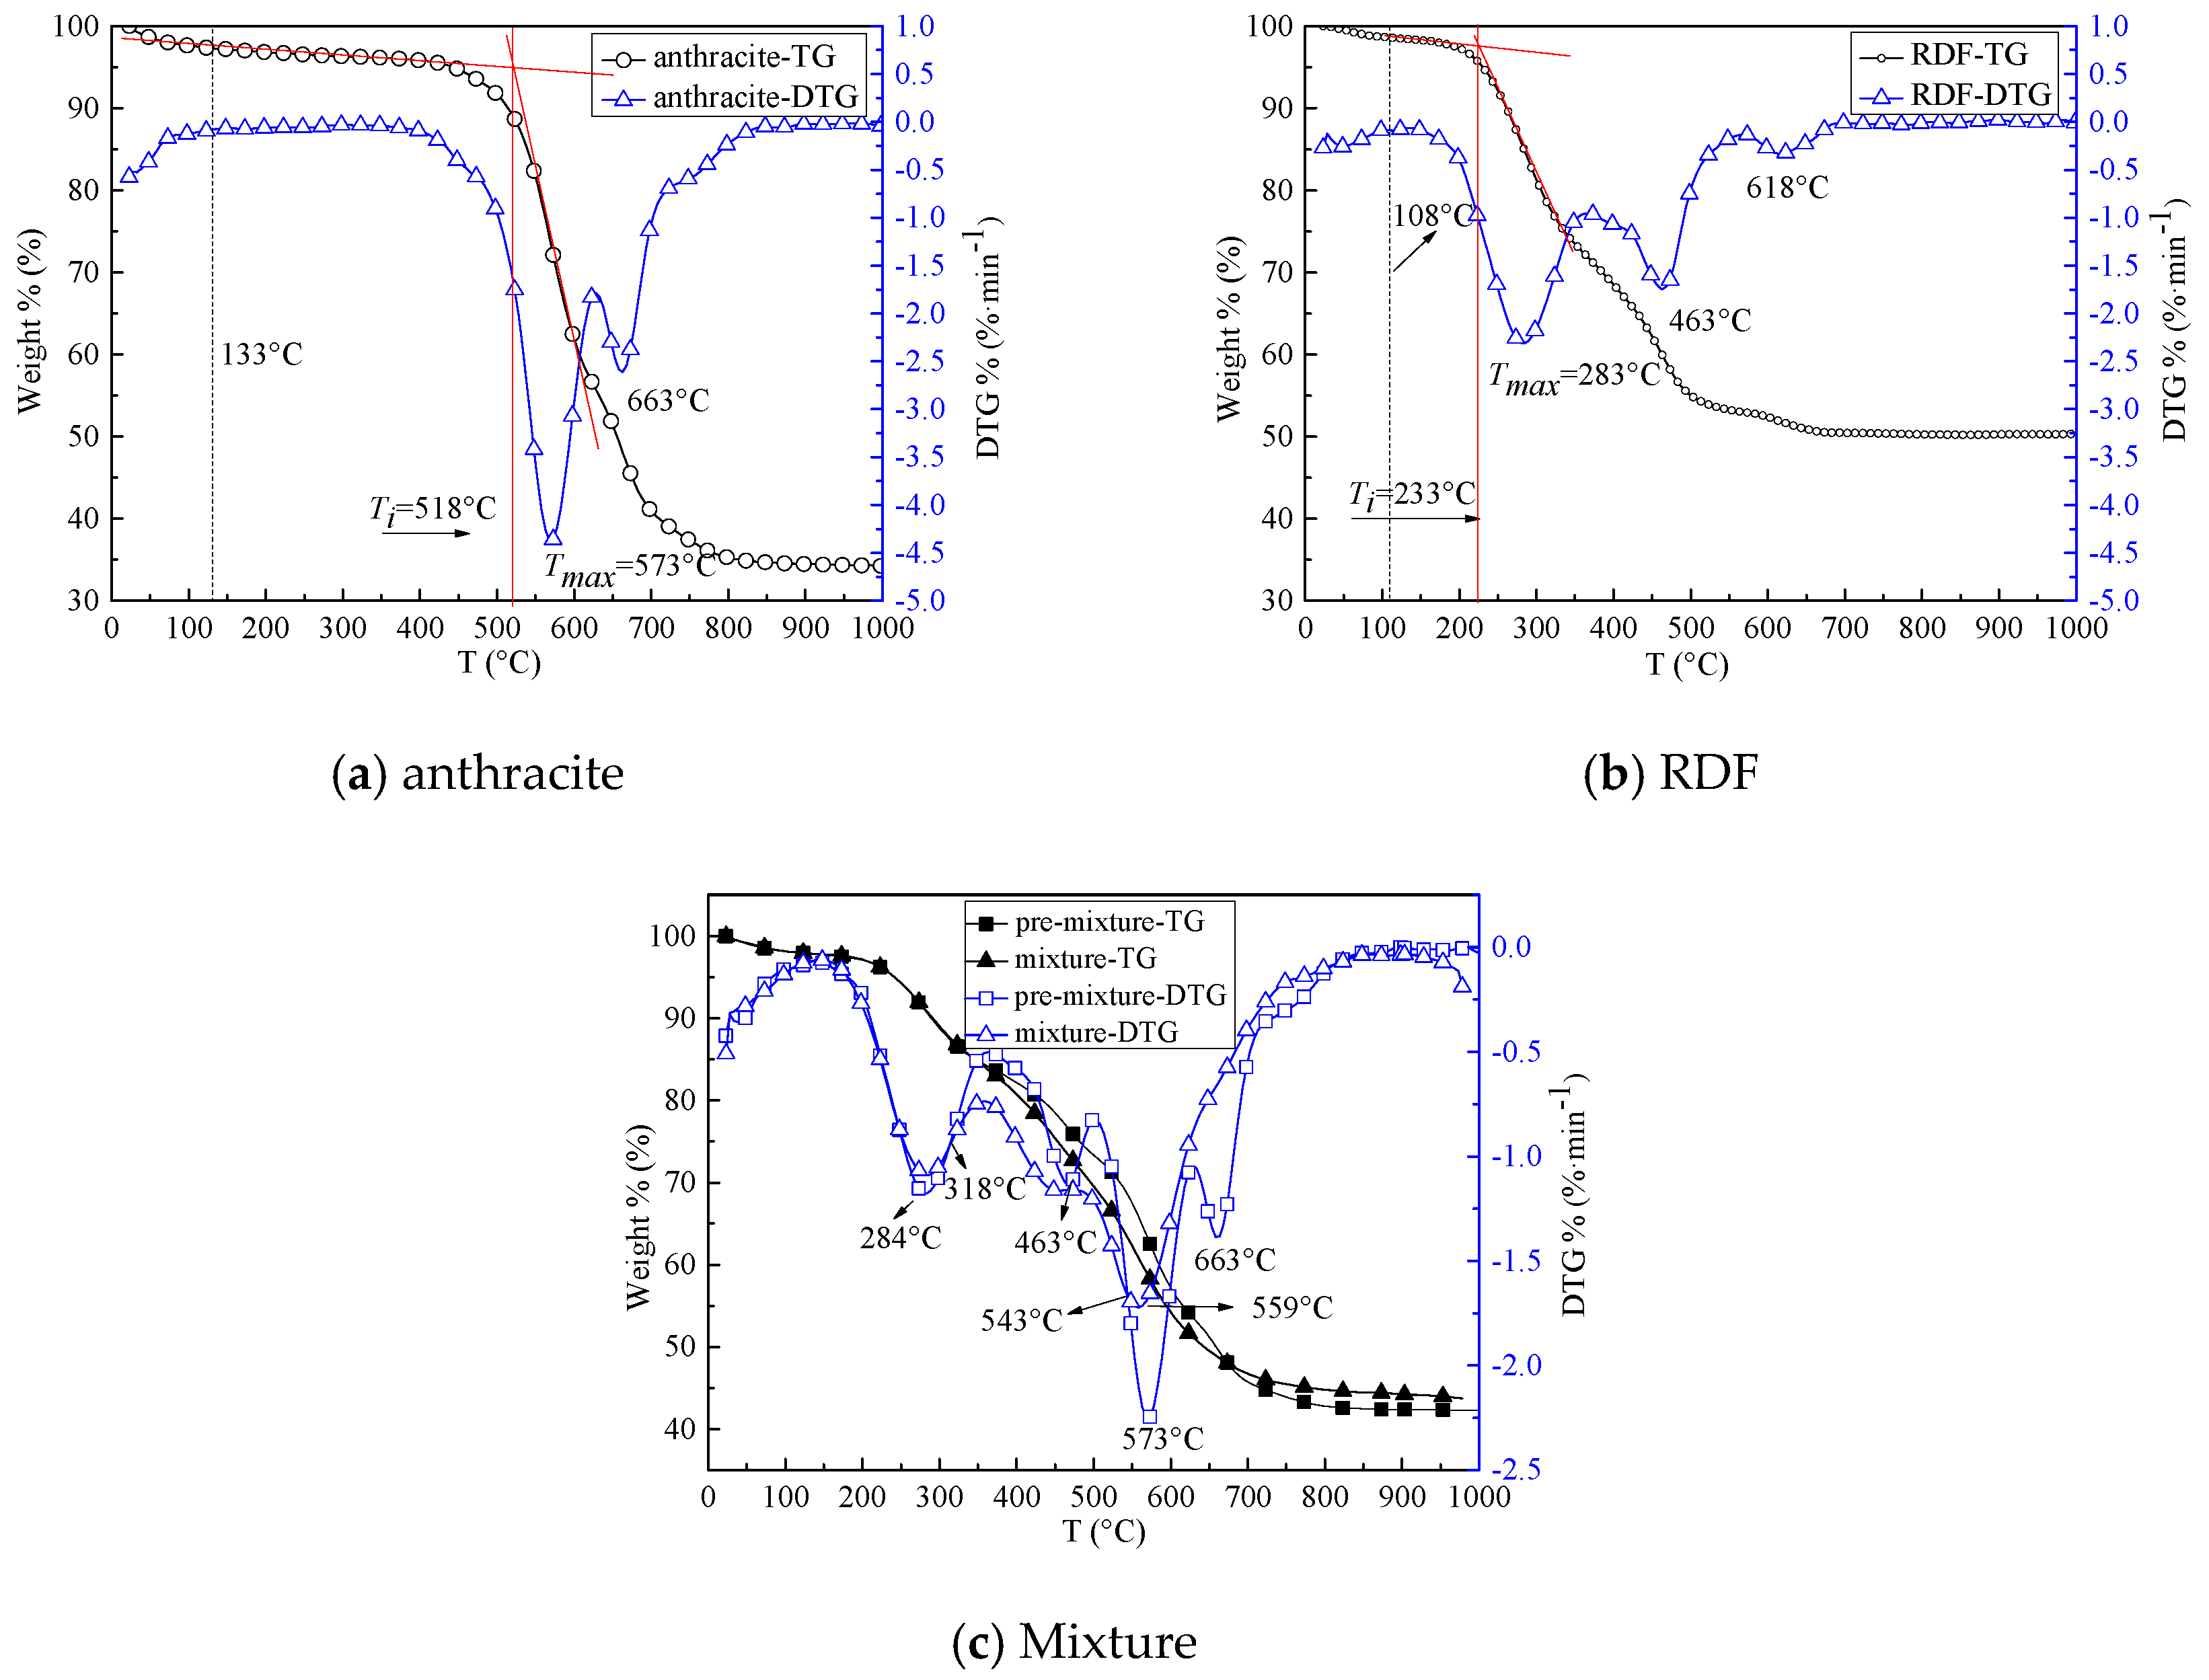
Figure 3.
CO and CO2 emission curves at 900 °C during combustion.

Figure 4.
CO and CO2 emission curves at 800 °C during combustion.

Figure 5.
CO and CO2 emission yield at different temperatures.
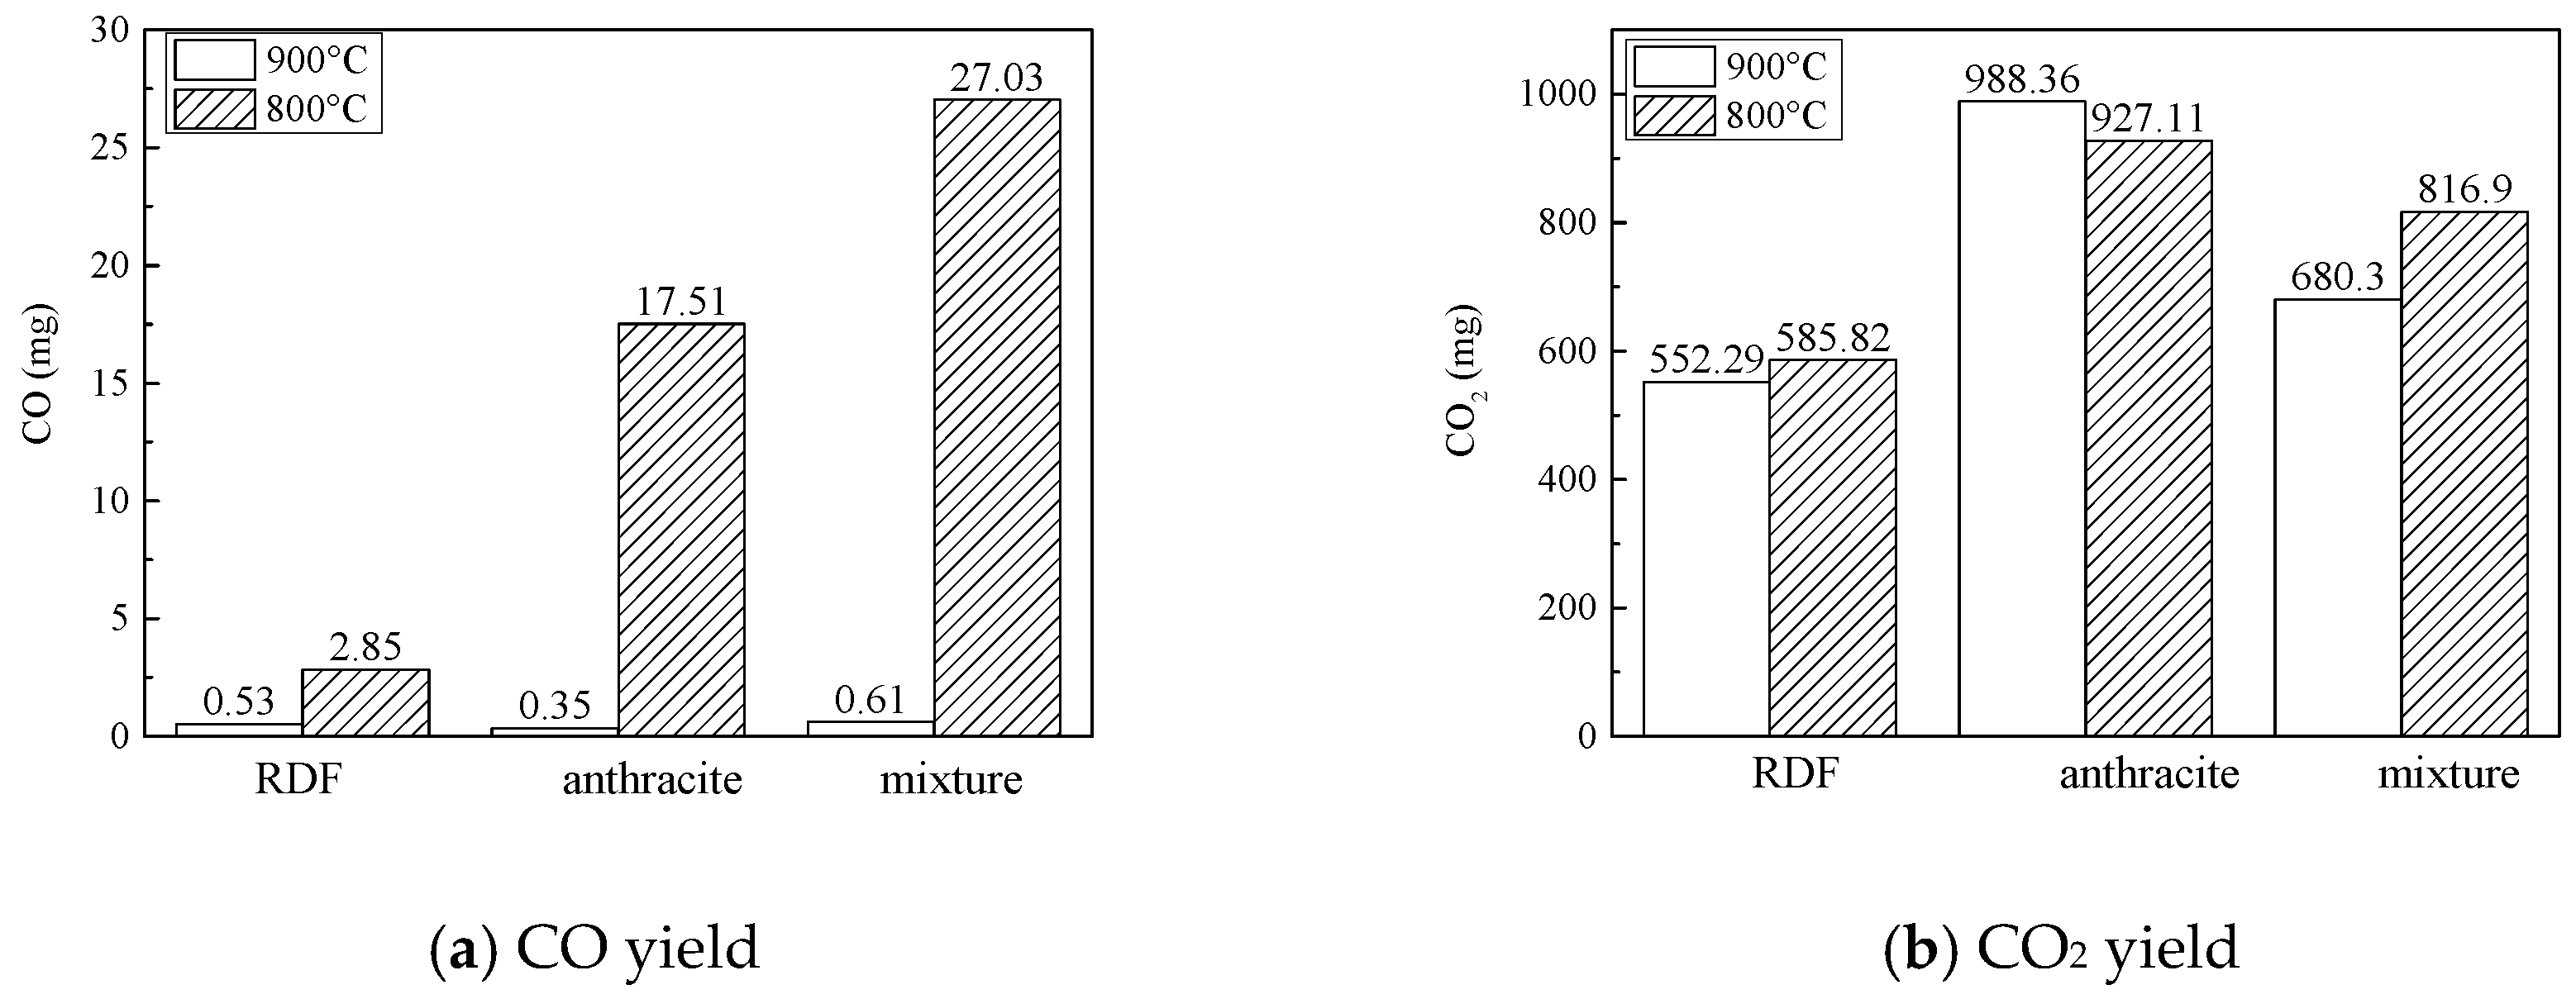
Figure 6.
NOx emission curves at different temperatures.
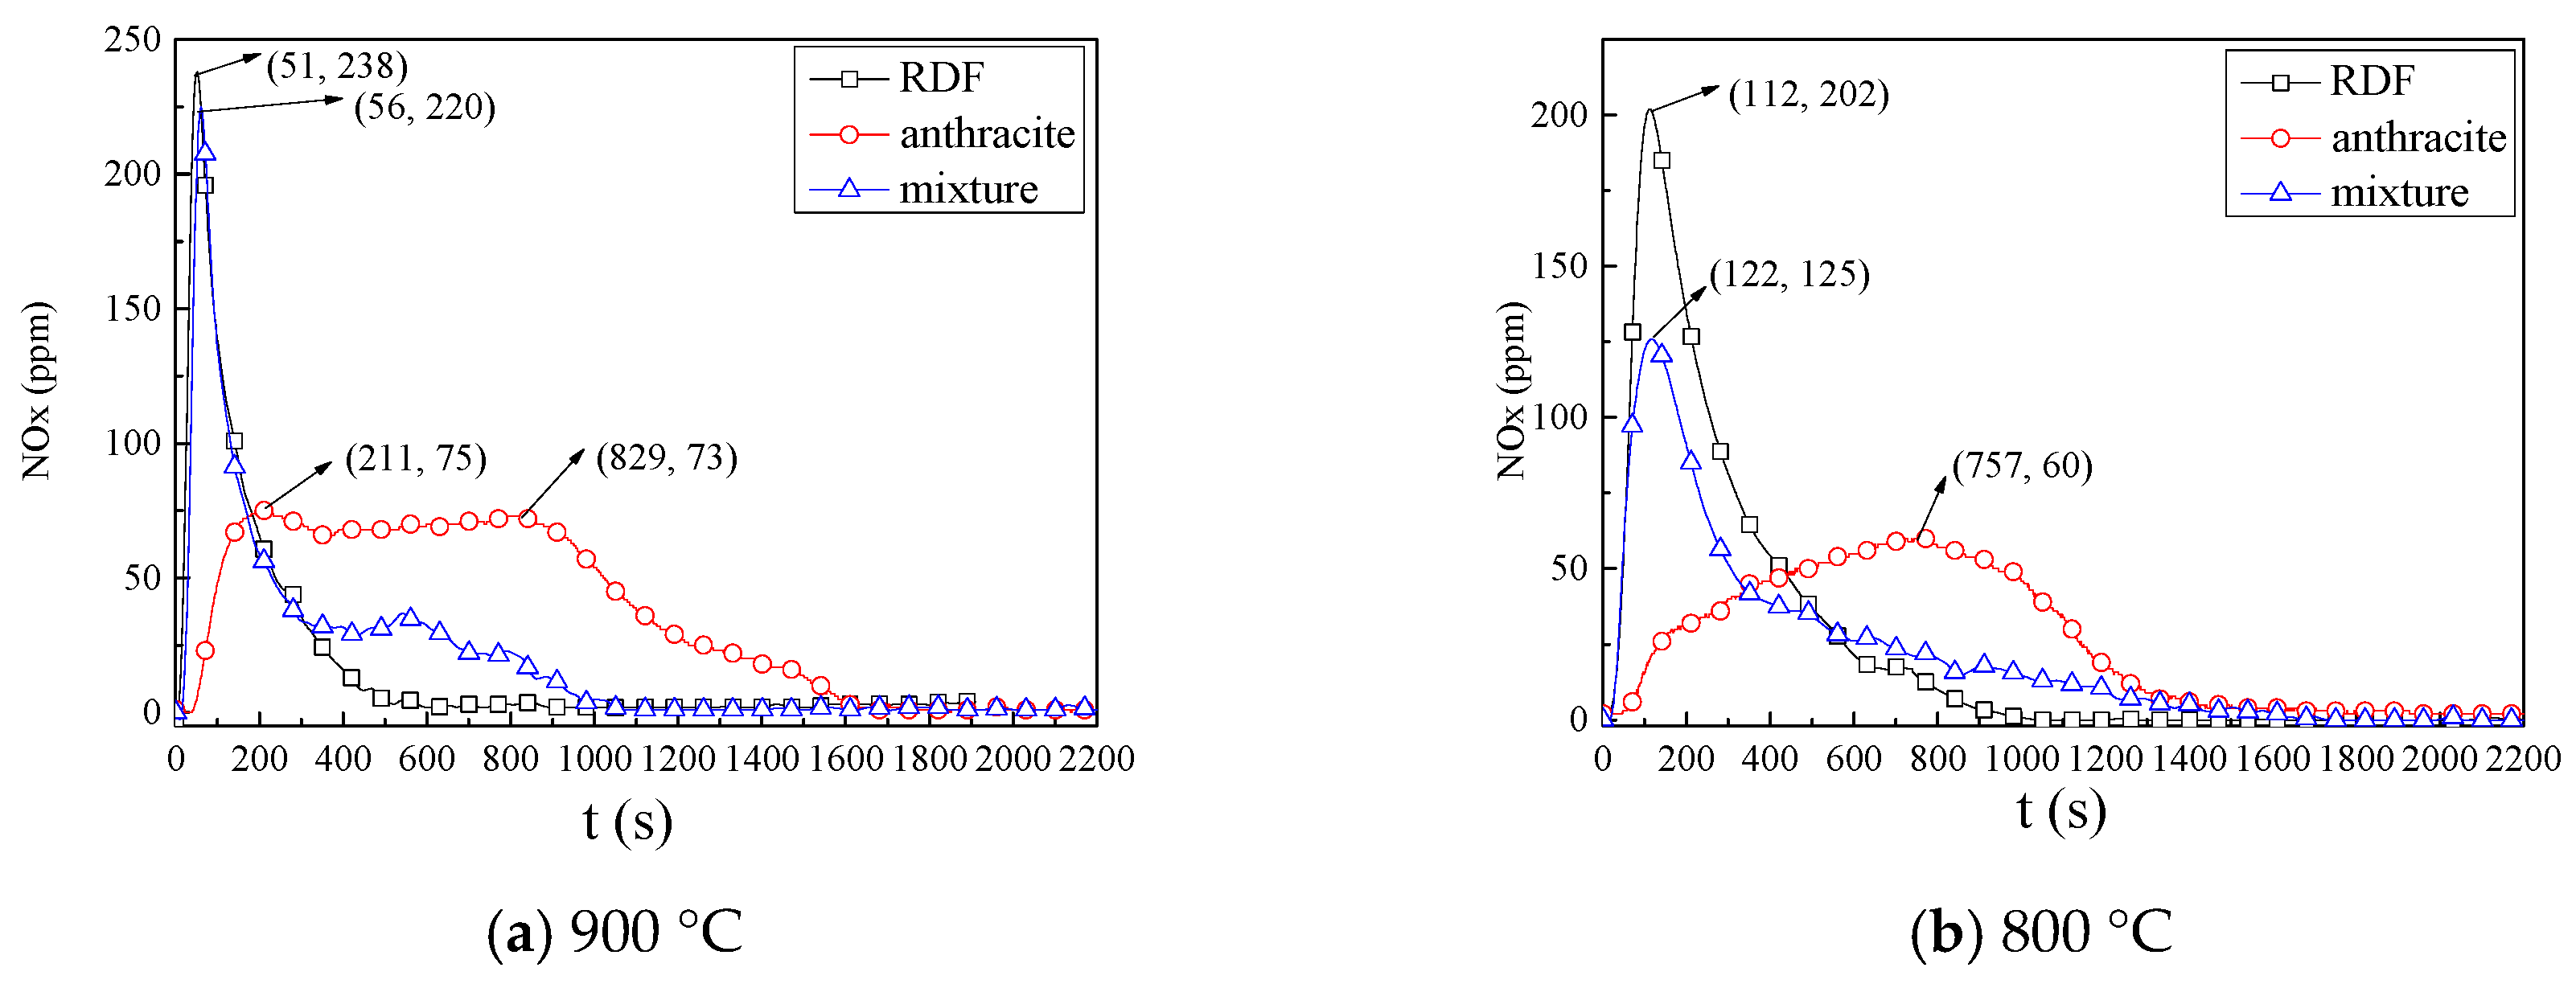
Figure 7.
NOx emission yield and fuel NOx conversion at different temperatures.

Figure 8.
SO2 emission curves at different temperatures.

Figure 9.
SO2 emission yield and SO2 conversion at different temperatures.

Figure 10.
XRD analysis of fuels and different ashes: (a) original fuels; (b) ash at 900 °C; (c) ash at 800 °C, A-Fe2O3, B-SiO2, C-CaSO4, D-CaCO3, E-CaAl2Si2O8, and F-CaO.
Figure 10.
XRD analysis of fuels and different ashes: (a) original fuels; (b) ash at 900 °C; (c) ash at 800 °C, A-Fe2O3, B-SiO2, C-CaSO4, D-CaCO3, E-CaAl2Si2O8, and F-CaO.


Table 1.
Proximate analysis, ultimate analysis, and calorific value results.
| Samples | Proximate Analysis/wt % | Ultimate Analysis/wt % | Qnet,daf/MJ·kg−1 | |||||||
|---|---|---|---|---|---|---|---|---|---|---|
| Mad | Aad | Vad | Fcad | Cad | Had | Oad | Nad | Sad | ||
| RDF | 3.60 | 48.75 | 46.9 | 0.75 | 36.78 | 4.36 | 4.57 | 1.16 | 0.78 | 12.42 |
| anthracite | 2.70 | 36.16 | 8.39 | 52.75 | 55.26 | 1.32 | 3.81 | 0.38 | 3.07 | 19.59 |
Table 2.
Combustion characteristic parameters of samples.
| Samples | Anthracite | RDF | Mixture | Pre-Mixture |
|---|---|---|---|---|
| Ti (°C) | 518 | 233 | 318 | 398 |
| Rmax (mg·min−1) | 4.36 | 2.31 | 1.72 | 2.24 |
| C (mg·min−1·°C−1) | 16.25 | 42.55 | 17.01 | 14.14 |
| Tmax (°C) | 573 | 283 | 559 | 573 |
| Rw (°C−1) | 3.39 | 5.32 | 3.39 | 3.15 |
| Loss weight (%) | 65.74 | 49.48 | 55.61 | 57.27 |
| t0 (min) | 81.63 | 67.47 | 78.03 | 80.05 |
© 2018 by the authors. Licensee MDPI, Basel, Switzerland. This article is an open access article distributed under the terms and conditions of the Creative Commons Attribution (CC BY) license (http://creativecommons.org/licenses/by/4.0/).
Share and Cite
MDPI and ACS Style
Chen, X.; Xie, J.; Mei, S.; He, F. NOx and SO2 Emissions during Co-Combustion of RDF and Anthracite in the Environment of Precalciner. Energies 2018, 11, 337. https://doi.org/10.3390/en11020337
AMA Style
Chen X, Xie J, Mei S, He F. NOx and SO2 Emissions during Co-Combustion of RDF and Anthracite in the Environment of Precalciner. Energies. 2018; 11(2):337. https://doi.org/10.3390/en11020337
Chicago/Turabian StyleChen, Xiaolin, Junlin Xie, Shuxia Mei, and Feng He. 2018. "NOx and SO2 Emissions during Co-Combustion of RDF and Anthracite in the Environment of Precalciner" Energies 11, no. 2: 337. https://doi.org/10.3390/en11020337
Note that from the first issue of 2016, this journal uses article numbers instead of page numbers. See further details here.