Hybrid Density Functional Study of Au2Cs2I6, Ag2GeBaS4, Ag2ZnSnS4, and AgCuPO4 for the Intermediate Band Solar Cells


1
Department of Computing, Mathematics and Physics, Western Norway University of Applied Sciences, Inndalsveien 28, 5063 Bergen, Norway
2
Department of Chemistry, Center for Materials Science and Nanotechnology, University of Oslo, Box 1033, Blindern, N-0315 Oslo, Norway
*
Author to whom correspondence should be addressed.
Energies 2018, 11(12), 3457; https://doi.org/10.3390/en11123457
Submission received: 19 November 2018
/
Revised: 4 December 2018
/
Accepted: 7 December 2018
/
Published: 10 December 2018
Abstract
:We present a comprehensive investigation of the structural, electronic, mechanical, and optical properties of four promising candidates, namely Au2Cs2I6, Ag2GeBaS4, Ag2ZnSnS4, and AgCuPO4, for application in photovoltaic devices based on intermediate band (IB) cells. We perform accurate density functional theory calculations by employing the hybrid functional of Heyd, Scuseria, and Erhzerhof (HSE06). Calculations reveal that IBs are present in all proposed compounds at unoccupied states in the range of 0.34–2.19 eV from the Fermi level. The structural and mechanical stability of these four materials are also systematically investigated. Additional peaks are present in the optical spectra of these compounds, as characterised by a broadened energy range and high intensity for light absorption. Our findings, as reported in this work, may provide a substantial breakthrough on the understanding of these materials, and thus help the design of more efficient IB solar devices.
1. Introduction
The efficiency of standard solar cells can be increased by using multi-bandgap materials [1]. This category includes intermediate band (IB) materials, which are identified by their energy bands, where the main bandgap is split into two or more sub-bandgaps [2,3]. These materials, when inserted between the p-type and n-type semiconductors, act as contacts between the conduction band (CB) and valence band (VB) [4]. Excited electrons transit from the VB to the IB, and later from the IB to the CB by the absorption of photons with energy lower than the bandgaps [1,4]. This will provide additional current to the standard one, which is conventionally obtained from the absorption of phonons through the VB to CB transition [2,3]. Based on Shockley and Queisser [5], Luque et al. [6] showed that IB solar cells can achieve a 63.2% balance-limiting efficiency, which was much larger than the theoretical limit of 41% for traditional single-gap solar cells [1].
The IB solar cell offers an independent absorption channel. The VB to IB and IB to CB transitions can be regarded as a series of two cells that is parallel to the standard VB to CB channel [1]. In the ideal case, the IB is not overlapping either VB or CB, so that fast transitions would not occur, and it is also partially filled, ensuring comparable rates for the absorption of photons with sub-bandgap energies [7]. Additionally, it is desirable for the IB solar cell to exhibit a high tolerance with respect to changes in the solar spectrum [8]. Further increasing the number of IBs can raise the efficiency to values as high as 80% [9,10]. This trend is verified in a number of theoretical and experimental works [11,12,13,14]. We discussed the current research works for quantum-dot IB and bulk IB solar cells in the previous work [1], and we reported the achievement of quantum-dot and bulk-based IB material in the previous work. Currently, researchers are taking up more challenges to attain the theoretical efficiencies of 63.2% for IB solar cells.
An IB can be obtained through the appropriate doping of bulk host semiconductors [15]. In a previous work [1], we presented a detailed study of the electronic band structures of a large number (2100) of novel bulk compounds to identify promising candidates for IB solar cells. For the initial screening of IB compounds, we employed general gradient approximation with Hubbard parameter (GGA + U), which demands less computing resource compared to other more accurate methods. Based on these calculations, we found only 17 compounds to have IBs among the 2100 bulk materials. These were characterised by calculating the band structure and the associated density of electronic states, as well as the effective masses of electrons [1].
In this work, we employ a more accurate method, namely, the screened-exchange hybrid density functional proposed by Heyd, Scuseria, and Ernzerhof (HSE06), for calculating the band structure and the density of states to identify the best candidates among the 17 candidates reported in [1] based on GGA + U approximation. The band structure of these materials showed a more substantial bandgap compared to the previous density functional theory (DFT) results within the GGA + U scheme. An optimal bandgap is of importance in selecting the materials for solar cell applications. Although higher bandgaps give a high open-circuit voltage, they give less short-circuit current, affecting the efficiency of the cell. Considering this, we analysed 17 indirect bandgap materials, and found out that only four materials, namely, Au2Cs2I6, Ag2GeBaS4, Ag2ZnSnS4, and AgCuPO4 had a total bandgap less than 4 eV.
Here, we present an in-depth analysis of Au2Cs2I6, Ag2GeBaS4, Ag2ZnSnS4, and AgCuPO4 by employing a more accurate and computer resource-demanding HSE06 method. The calculated density of states for these four compounds helps to understand the origin of IB further, and identify the higher density of IB states. For one of the four materials, namely Ag2ZnSnS4, experimental results were reported by [16], and we carry out a comparison of numerical results based on HSE06 with these results. To our knowledge, there are still no experimental results reported for Au2Cs2I6, Ag2GeBaS4, or AgCuPO4. In this article, we provide theoretical evidence of the applicability of these candidates for application as photovoltaic materials by studying the optical properties, structural stability, and mechanical stability of the materials.
2. Computational Details
Total energies of Au2Cs2I6, Ag2GeBaS4, Ag2ZnSn S4, and AgCuPO4 have been computed using the Vienna ab initio simulation package (VASP). The core states are described with potential generated through the projected augmented plane wave (PAW) method [17]. The exchange and correlation functional are treated within the GGA approach, using the approximation proposed by Perdew, Burke, and Ernzerhof (PBE) [18]. The Hubbard parameter correction (GGA + U), which included following the rotationally invariant form [19,20,21], is used for the d states of the transition metals. More details regarding the dependence of our calculations on the value of the Hubbard parameter can be found at the web page of the density functional theory based database (DFTBD) [22]. This DFT + U approach is employed for obtaining optimised structures of the considered compound, as calculations of this type within the HSE06 approach are extremely time-consuming, and would not provide significantly different structural parameters. We optimised the atomic positions as well as the cell size and volume, minimising both the stress tensor and the Hellman–Feynman forces with an overall force tolerance of 10−3 eV Å−1. The HSE06 functional was used for computing the electronic structure and the associated optical properties. Our parametrisation included a screened parameter of 0.2 Å−1, and 30% mixing of the screened Hartree-Fock (HF) exchange with the PBE functional [23]. Fully converged results were obtained with a kinetic cut-off energy of 600 eV, and a 6 × 6 × 6 Г-centered Monkhorst-Pack grid for integration over the Brillouin zone. This setting was used in both PBE and HSE06 calculations.
The PAW approach was employed for calculating the macroscopic dielectric matrix, including local field effects [24]. We used both GGA and HSE06 for calculating the static dielectric constant. Moreover, we used HSE06 for calculating the dynamic dielectric functions. The optical properties, such as the optical spectra and the absorption of these compounds, were evaluated using the calculated dynamic dielectric functions. The static dielectric constants were calculated using density functional perturbation theory with local field effects approaches in GGA [24] and HSE06 [25]. A 12 × 12 × 12 Г-centered Monkhorst-Pack k-point mesh was used for these calculations of optical properties. The calculation of the optical properties was performed, accounting for the contribution of 400 electronic bands, as required to accurately obtain the peak position and the intensities in the optical spectrum [26].
The vibrational properties were computed with the frozen phonon approach, using suitably large supercell of the optimised structures. The Phonopy software was used to calculate the phonon dispersion curve and the associated density of states [27,28]. An atomic displacement of 0.0075 Å was used, and displacements in opposite directions were considered to improve the overall accuracy of the calculation of the force constants.
3. Results and Discussion
3.1. Structural Properties
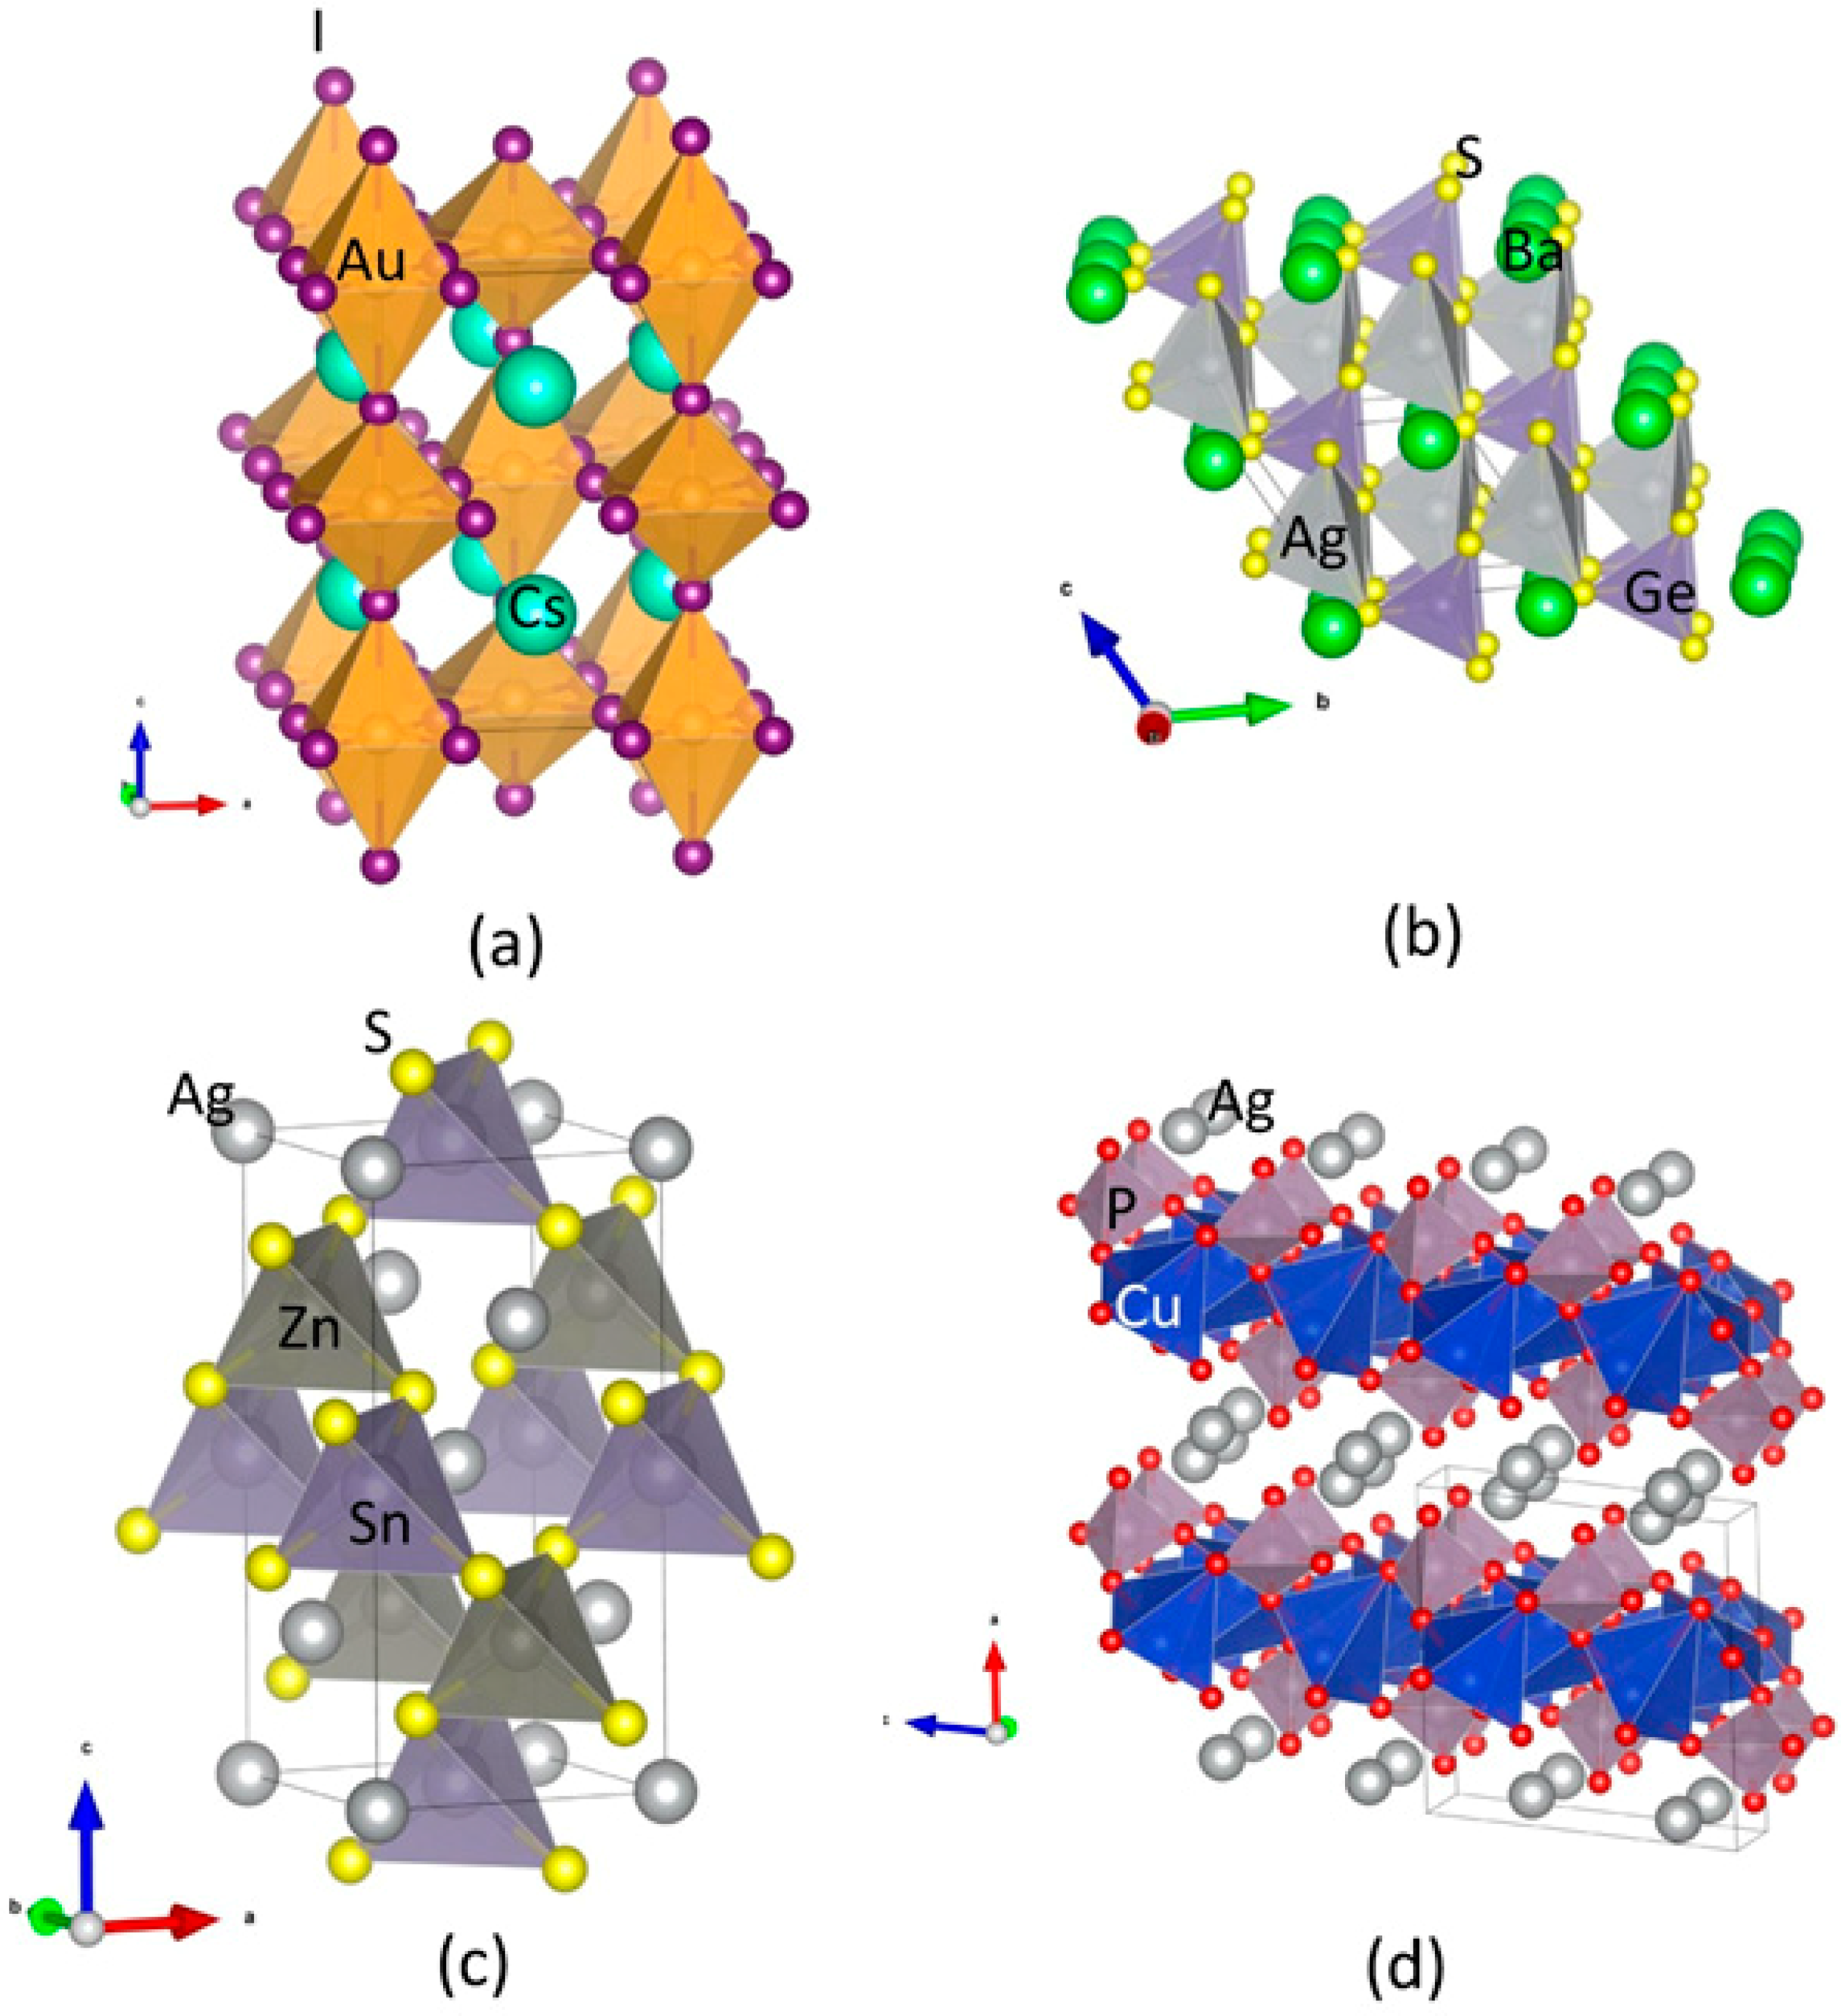
Au2Cs2I6: The Au2Cs2I6 compound adopts the structure of a distorted perovskite (Figure 1c). Although charge counting would indicate a single valence state for gold (AuII) and thus a metallic behaviour, this compound was found to be non-metallic, being comprised of two distinct Au sites with distinct formal valences, AuI and AuIII, forming linear AuI2− and square AuI4− molecules. These two kinds of molecules aligned alternately in the tetragonal lattice. The ratios of short-to-long Au-I bonds (Au-I)/(Au-I2) and (Au2-I2) were slightly closer to unity at 0.7631 and 0.8017, respectively. Notably, a first-order structural and valence transition could be induced via hydrostatic pressure with a critical value of 5.5 Gpa. This feature originated a considerable interest regarding the associated changes in the electronic properties [29,30].
Ag2GeBaS4: The Ag2GeBaS4 crystalised according to a tetragonal structure with space group I-42m (Figure 1b). Among the four compounds considered in this study, Ag2GeBaS4 is the less studied in the literature. Only one structure is reported [31], and the physical and chemical properties of this phase are unknown. Ag2BaGeS4 is one of the homologous tin compounds, with a corresponding tetrahedron construct-like construction type with Ba in anti-prismatic, Ge in tetrahedral, and Ag in strongly deformed tetrahedral coordination sphere. A particularly striking feature of the structure is the four equidistant distances of Ag–S in 2.60 Å in the much-flattened AgS4 tetrahedra. This type of the structure feature is sporadic in sulphidic Ag compounds.
Ag2ZnSnS4: In the literature, two types of tetragonal structures, I-4 (kesterite-type; space group No. 82) and I-42m (stannite-type; space group No. 121) are described for Ag2ZnSnS4. Both modifications present a similar atomic arrangement [1]. Our total energy calculation predicted that the kesterite-type structure is energetically favourable for the Ag2ZnSnS4 compound [1] (Figure 1d). Both modifications consist of a cubic closed packed (ccp) array of anions, with cations occupying one-half of the tetrahedral voids. These two similar structures are assigned to different space groups due to their distinct cation distribution. The kesterite-type structure is characterised by alternating layers of AgSn and AgZn. Thus, one Ag occupied the 2a (0, 0, 0) position with zinc, and the remaining Ag was ordered at 2c (0, 1/2, 1/4) and 2d (0, 1/2, 3/4), resulting in the space group I-4. On the other hand, in the stannite-type structure, ZnSn layers alternated with Ag layers. The structure is consistent with the symmetry of the space group I-42m, with the divalent cation located at the origin (2a), and the monovalent cation located at the 4d position (0, 1/2, 1/4). Sn is located at the 2b site (0, 0, 1/2) in both structures. The anion lies on the (1, 1, 0) mirror plane at 8i (x, x, z) for the stannite-type structure, and 8g (x, y, z) for the kesterite-type structure.
AgCuPO4: Two AgCuPO4 modifications were experimentally observed. The α-AgCuPO4 phase is stable at temperature as high as 848 K, at which an irreversible transition to the β-AgCuPO4 form takes place [32]. The structure of the former consists of a stacking of equivalent (100) Cu2P2O8 layers separated by double layers of silver atoms. Cu2+ is coordinated to five oxygen atoms, according to a distorted square pyramidal group. The interatomic distances between copper and the basal oxygen atoms (Oba) are comprised between 1.88–2.03 Å, while the Cu-O bond length in the case of the apical oxygen atom (Oap) is 2.58 Å (Figure 1a, Table 1). The average Cu–Oba bond length is 1.96 Å, which is compatible with the sum of the ionic radii 14. The Cu bond valence sum 15 was found to be 1.98, and thus compatible with the expected +2 oxidation state. Every pair of CuO5 pyramids shares one edge of their square bases, thus forming a Cu2O8 group (Figure 1a) with an interatomic distance of 3.05 Å between Cu atoms and a Cu–O–Cu bridging angle of 101.1°. These Cu2O8 groups share corners with the PO4 tetrahedra, thus forming Cu2P2O8 layers orthogonal to the (100) direction. Every pair of neighboring Cu atoms are connected either by two Cu–O–Cu bridges, as observed in the case of Cu2O8 dimers, or by one Cu–O–Cu bridge. The silver atom is coordinated by five oxygen atoms with Ag–O distances in the range of 2.32 Å to 2.66 Å, forming a distorted trigonal bipyramidal group. The latter was found to be compressed along the pseudo-threefold rotational axis. The average Ag to axial O interatomic distance is 2.38 Å, and an average Ag to equatorial O distance is 2.56 Å.
3.2. Electronic Properties
The bandgap of photoactive semiconductors is a crucial quantity, as it determines the upper bound of the current on the short circuit and the associated voltage. A large bandgap cell, exhibiting a larger voltage and a lower current with respect to a small bandgap cell, absorbs fewer solar photons. However, the efficiency of an ideal single bandgap solar cell exhibiting an optimal bandgap of 1.4 eV is 32% [5]. This thermalization loss is known to occur due to the broad energy spectrum of the source poorly matching the bandgap, and therefore resulting in efficiencies lower than the detailed balance limit [5]. This is also applies to multi-bandgap solar cells.
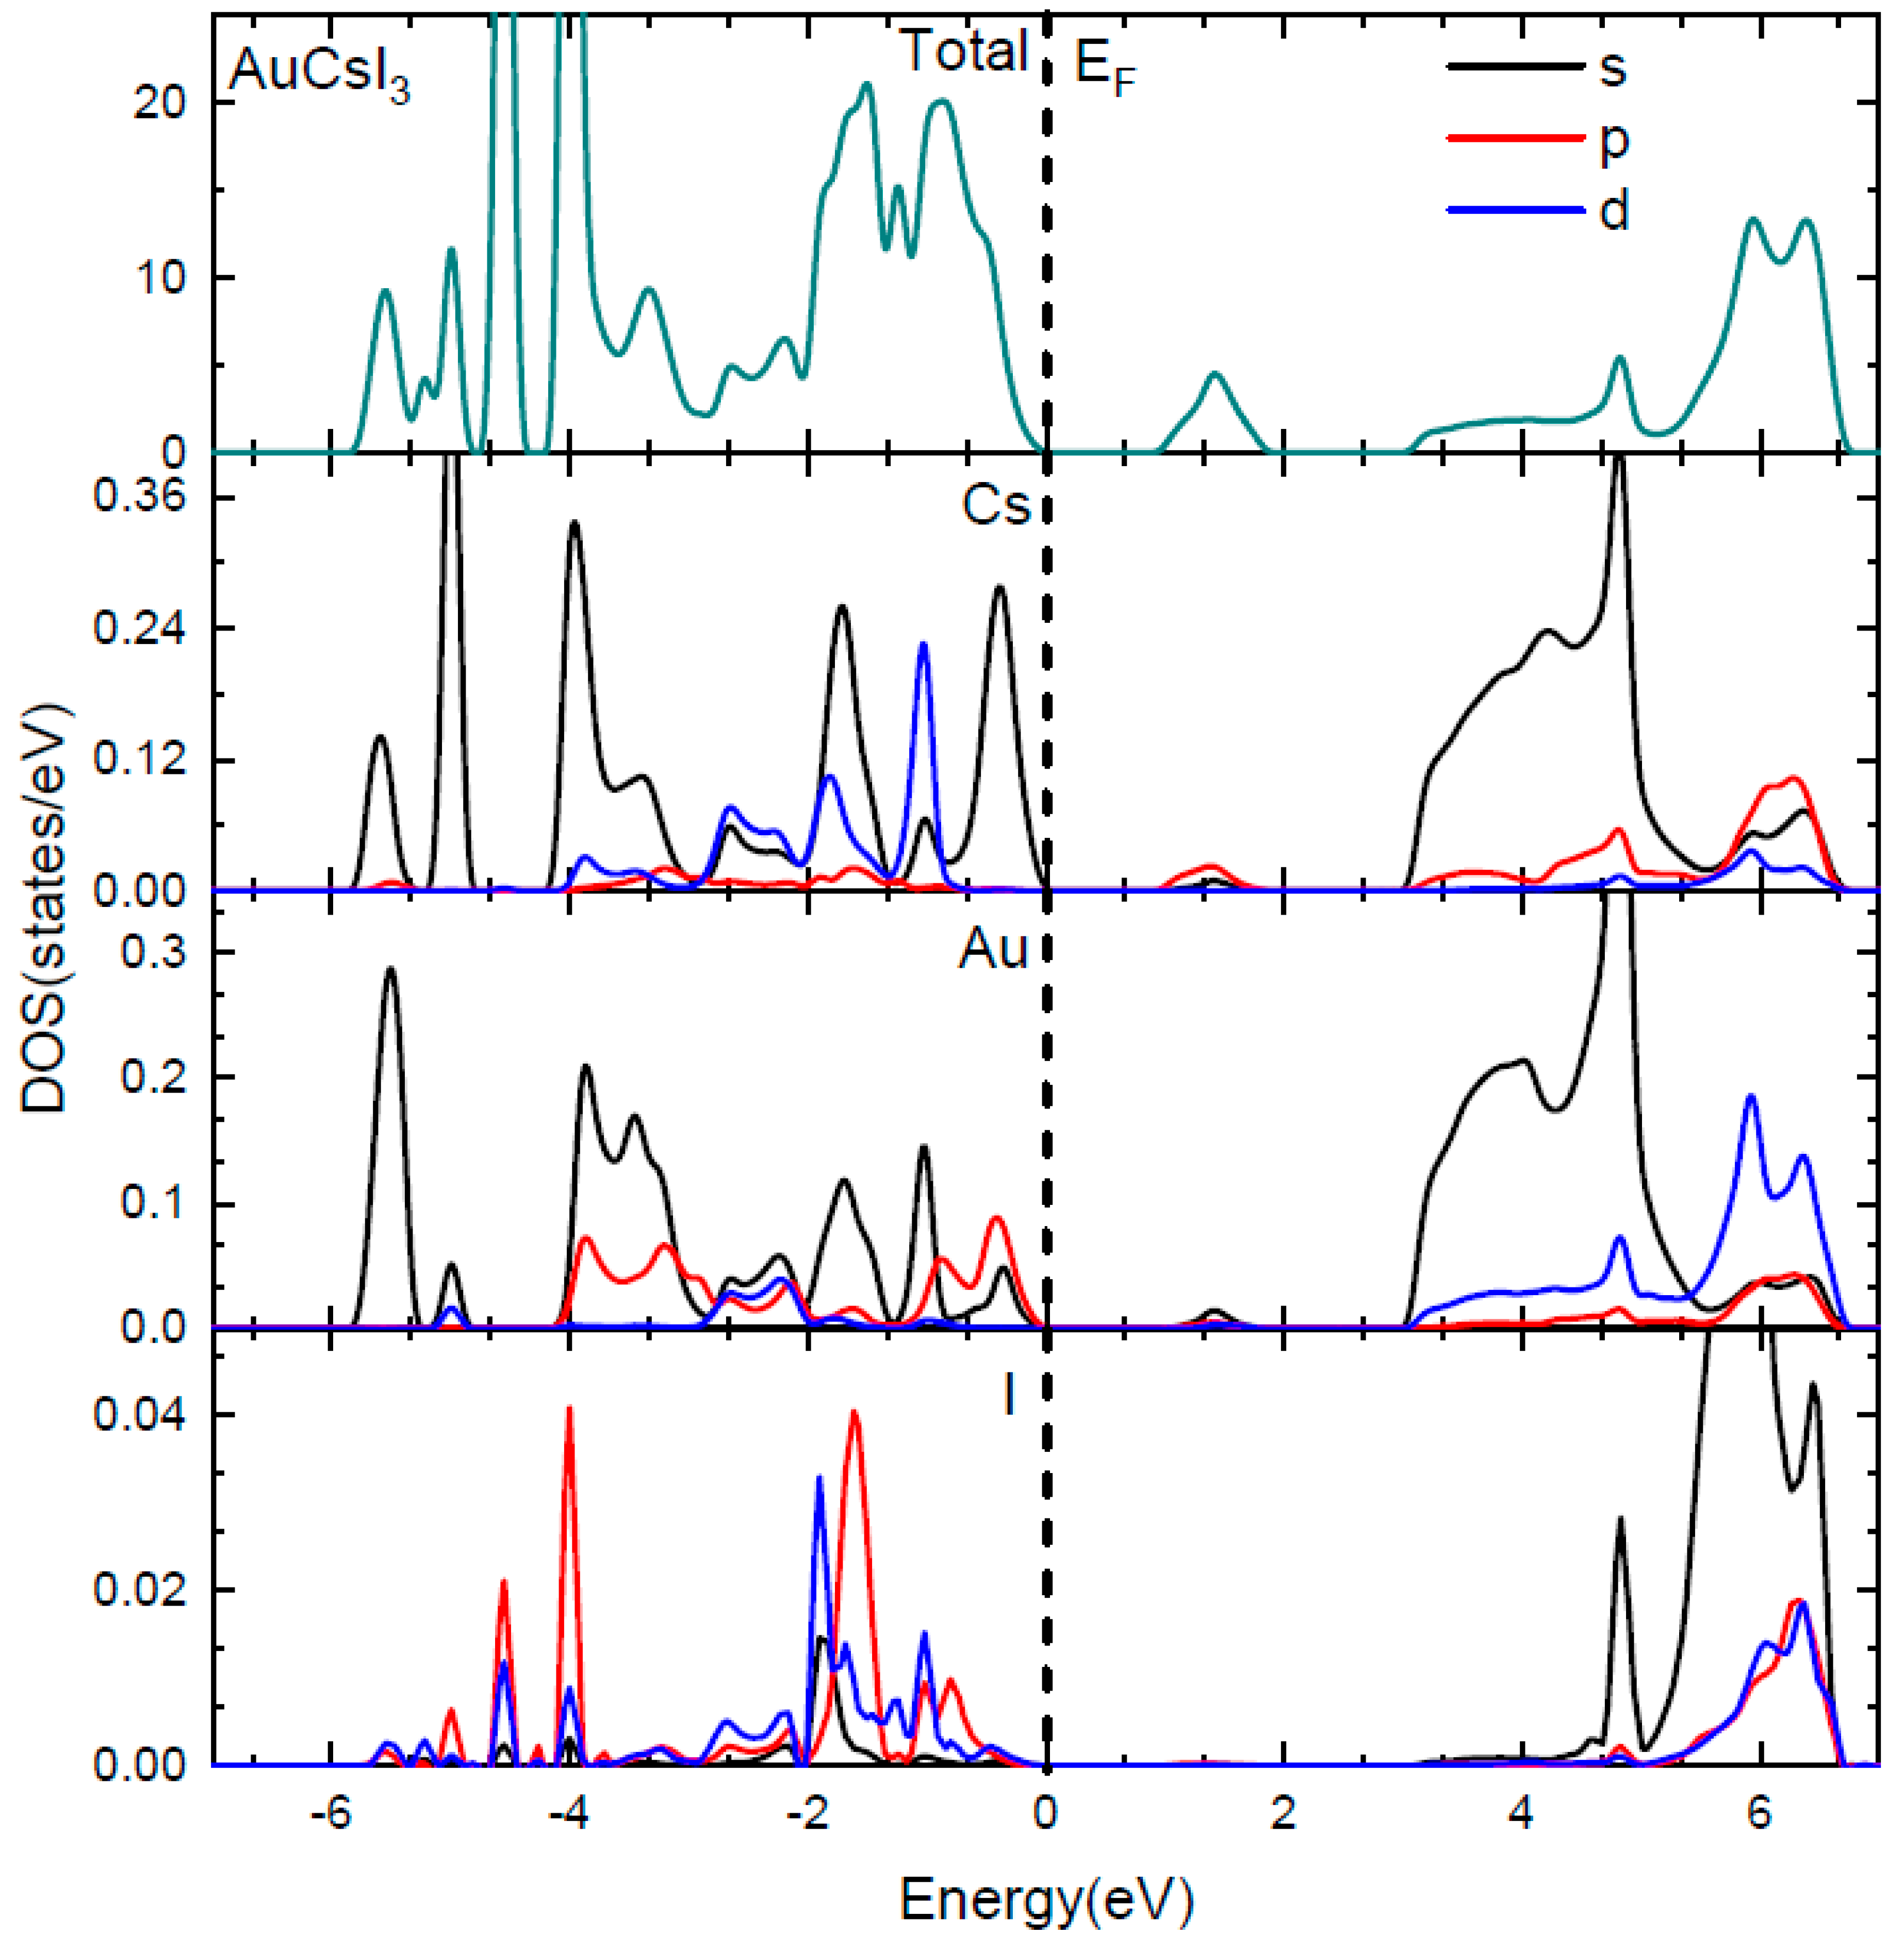
In virtue of the strong correlation between the efficiency of a solar cell and the bandgap of the material employed, the use of theoretical/computational methods to determine the electronic band structure would allow for the engineering of a semiconductor for application as photovoltaic material. The band structures of Au2Cs2I6, Ag2GeBaS4, Ag2ZnSnS4, and AgCuPO4 are presented in Figure 2, and the total and site projected density of states (PDOS) of Au2Cs2I6 are presented in Figure 3. The calculated values of the main bandgap and the sub-bandgap for the four compounds are reported in Table 2. As we explained in [1], all four compounds have indirect bandgaps materials between VB and CB. However, Ag2ZnSnS4 and AgCuPO4 have direct bandgaps between VB and IB.
The HSE06 band structure of Au2Cs2I6 exhibits a bandgap of 2.92 eV, which is significantly larger than the bandgap calculated with the less accurate GGA + U method (2.35 eV) [1]. The direct bandgap between the top of the VB and the bottom of the IB (Evi) is 0.89 eV, and the energy gap between the top of the IB and the CB (Eci) is 1.13 eV. The width of the IB (ΔEi) is 0.90 eV. The intermediate band minimum corresponds to the Cs-5p and the Au-6s states, the valence band maximum corresponds to the Au-5p and the Cs-6s state, and the conduction band minimum corresponds to the Au-6s and Cs-6s states, as shown in Figure 2a and Figure 3. The dispersion of IB of Au2Cs2I6 is high (as shown in Figure 2a), and it is of great significance for high electron mobility. For Au2Cs2I6, the IB located at 0.89 eV is mainly derived from the Cs-5p state, with little contribution from the Au-6s state, as presented in Figure 3.
The band structure of Ag2GeBaS4 is presented in Figure 2b, and the total indirect bandgap at the Г-point is 3.33 eV (2.41 eV using GGA + U [1]), whereas bandgap Evi is 2.08 eV and Eci is 0.34 eV. From Figure 2b and the supporting information from Figure S1 (see supplementary material), the minimum of the intermediate band derives from the Ge-4s and Ag-5s states, with little contribution from the Ba-6s states. The S-3p states contribute to the VB maximum, and the CB is derived from the Ag-5s and the Ge-4s states. The dispersion of Ag2GeBaS4 IB is very high at the Г-point (as shown in Figure 2b), resulting in high electron mobility.
The band structure of Ag2ZnSnS4 shows a direct bandgap at the Г-point of 3.34 eV (2.70 eV using GGA + U [1]), whereas bandgap Evi is 1.15 eV, Eci is 0.34 eV, and the IB width 1.85 eV, as shown in Figure 2c. From Figure 2c and the supporting information in Figure S2, we observe that the IB minimum corresponds to the Sn-5s states, the VB maximum corresponds to the S-3p state, and the CB minimum corresponds to the Sn-4d state. The dispersion of Ag2ZnSnS4 IB is very high at the Г-point, as shown in Figure 2c, resulting in Ag2ZnSnS4 in high electron mobility. Our total energy calculation predicted that the kesterite-type structure is energetically favourable for the Ag2ZnSnS4 phase. We found the IB at 1.15 eV for the kesterite-type structure. According to Gong et al., the energy gap between VB and CB is 2.01 eV for the Ag2ZnSnS4 kesterite-type [35]. From Figure 2d, the HSE06 calculated values for AgCuPO4 are as follows: the total direct bandgap is 2.96 eV, which is more significant than the previous GGA + U study (2.35 eV) [1], whereas bandgap Evi is 0.33 eV, Eci is 2.19 eV, and the width of the IB is 0.44 eV. From Figure 2d and the supporting information in Figure S3, we directly observe that the IB minimum corresponds to the Ag-4d and the Cu-3d states. The VB maximum was extracted from the O-2p, Ag-4d, and Cu-3d states, and the maximum CB was derived from the Ag-5s and P-3s states. The dispersion of AgCuPO4 is low when compared to other compounds, resulting in low electron mobility.
3.3. Lattice Dynamical Stability
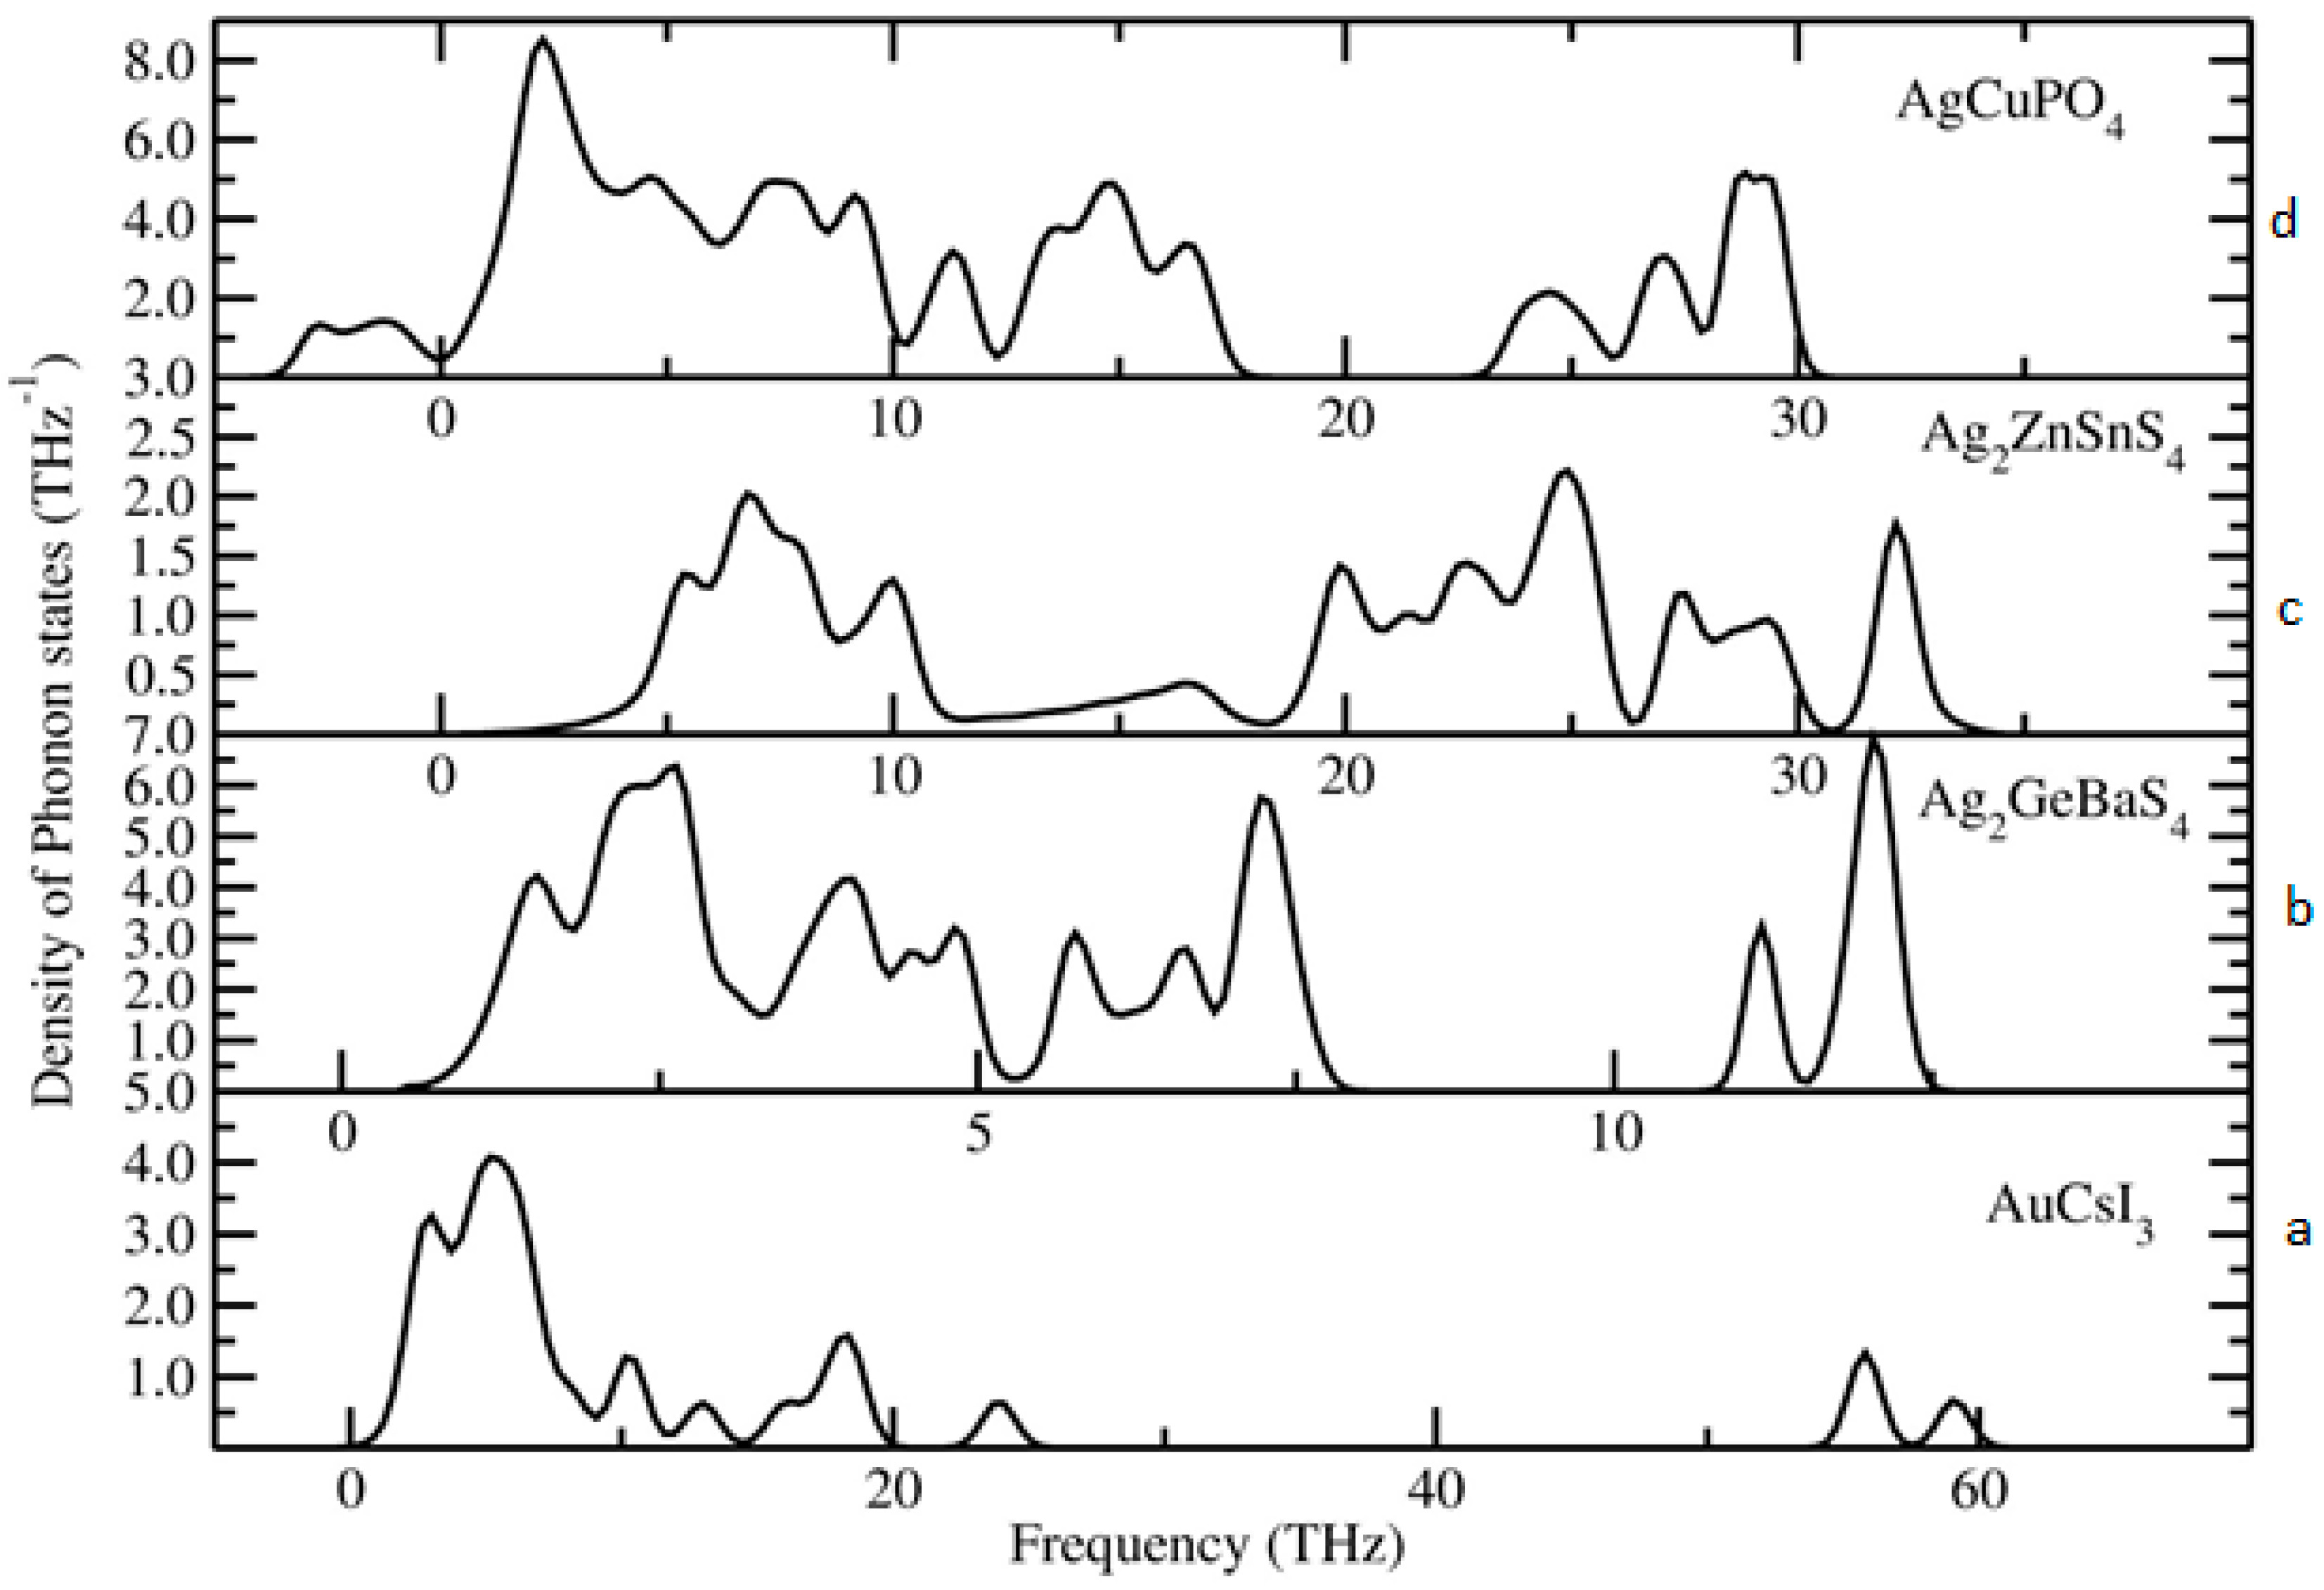
To identify the dynamical stability of the studied systems, the density of vibrational states is calculated for the optimised Au2Cs2I6, Ag2GeBaS4, Ag2ZnSnS4, and AgCuPO4 structures. The results are presented in Figure 4. For all of the examined compounds, imaginary frequencies were not observed (with the only exception of AgCuPO4), indicating that all of the compounds were dynamically stable. In the case of AgCuPO4, the soft phonon modes do not disappear, even at the high-pressure regime. In some of the selected cases, for example in Li2FeSiO4, the stable high-pressure phase has soft modes in ambient conditions, but they are disappearing at pressures above the phase transition point [36]. This finding indicates that this phase may not be dynamically stable, even at high pressure, or the considered supercell size (2 × 1 × 2; 32 formula unit with a total number of atoms 224) might not be sufficient. The other possible reason is that this compound has an antiferromagnetic ordering in both low-temperature and high-temperature modification [32,37]. However, due to the large number of atoms involved in this theoretical simulation, the magnetic ordering is not taken into account. The projected phonon density of states for Au2Cs2I6, Ag2GeBaS4, and Ag2ZnSnS4 are displayed in Figure 5. In the case of Au2Cs2I6, the vibrational modes were spread over the 0-THz to 60-THz range. The Au-I stretching modes are dominating in the 53-THz to 61-THz range and the vibrational modes for the Au, Cs, and I are present in between 15–25 THz, 2–10 THz, and 2–20 THz, respectively.
For Ag2GeBaS4, the vibrational modes were spread over 1 THz to 13 THz. The Ge–S stretching and bending modes are present at 11–13 THz and 6–8 THz, respectively. The lattice vibrational modes for Ag, Ge, Ba, and S presented in between 1–5 THz. For Ag2ZnSnS4, the calculated vibrational modes were spread over 2 THz to 35 THz and the Ag–S and Sn–S stretching modes were present between 27–35 THz. In the phonon spectra, the combined bending and stretching modes of Zn–S, Sn–S, and Ag–S presented in between the 18–25 THz region, and below the 12-THz region, the lattice translational modes of Ag, S, Sn, and Zn presented. The zero-point energy (ZPE) that was calculated for the studied phases varied from 0.24 eV/f.u. to 0.84 eV/f.u. (see respectively along x, y and z directions.), and followed the sequence Ag2GeBaS4 < Ag2ZnSnS4 < Au2Cs2I6 < AgCuPO4. However, the calculated ZPE values for the all the dynamically stable compounds were very close to each other.
3.4. Mechanical Stability
Single Crystal Elastic Constants and Mechanical Stability
As a next step, we verified the mechanical stability of the compounds under examination by calculating the single-crystal elastic constants using the finite strain technique. The elastic constants describe the response of a material to an applied stress or conversely, the amount of stress required in order to maintain a given deformation. According to the Voigt notation, the strain and the stress tensors can be written as a vector of six components, in which the first three are related to tensile deformation, and the last three are related to shear deformation [36]. The linear elastic constants are then written as a 6 × 6 symmetric matrix, having 27 independent components, so that si = Cij εj (si is the stress tensor, Cij is the elastic constant, εj (j = 1, …, 6) is the strain tensor, and the i index denotes 1 to 6) for small stresses σ and strains ε [38]. The symmetry of the crystal structure makes some components of the Cij matrix equal, while others may be vanishing by construction. A cubic crystal has only three independent elastic constants (C11, C12, and C44), each of which is representative of three deformations (C11 = C22 = C33; C12 = C23 = C31; C44 = C55 = C66). In the present study, monoclinic AgCuPO4 has 13 independent elastic constants, and the other three compounds—Ag2GeBaS4, Au2Cs2I6, and Ag2ZnSnS4—have a tetragonal structure with type (I), which has six independent elastic constants. All of the computed elastic constants are presented in Table 3. The mechanical stability criteria for the monoclinic phase are given by [36,39]:
C11 > 0, C22 > 0, C33 > 0, C44 > 0, C55 > 0, C66 > 0
[C11 + C22 + C33 + 2(C12 + C13 + C23)] > 0
(C35·C55 − C235) > 0, (C44·C66 − C246) > 0, (C22 + C33 − 2C23) > 0
[C22(C33·C55 − C235) + 2C23·(C25·C35 − C223·C55 − C225·C33)] > 0
{2[C15·C25(C33·C12 − C13·C23) + C15·C35(C22·C13 − C12·C23) + C25·C35(C11·C23 − C12·C13)] − [C215(C22·C33 − C223) + C225(C11·C33 − C213) + C235(C11·C22 − C212) + C55(C11·C22·C33 − C11·C223 − C22·C213 − C33·C212 + 2C12·C13·C23)]} > 0
The 13 computed independent single crystalline elastic stiffness constants for monoclinic AgCuPO4 at the equilibrium volume are shown in Table 3. In the P21/n monoclinic polymorph, the most significant component is C22, corresponding to the in-plane strain. The second largest component, C33, is just a few tens of GPa smaller than C22 [36]. It is also evident that there is a significant degree of elastic anisotropy among the three principal directions due to C11 C22 C33. All the five conditions given in Equations (1)–(5) are simultaneously satisfied, which indicates that AgCuPO4 is a mechanically stable phase.
The mechanical stability criteria for the tetragonal (type I) phase [39] are given by:
C11 > |C12|
2C213 < C33(C11 + C12)
C44 > 0, C66 > 0
The calculated independent elastic constants for tetragonal Ag2GeBaS4, Au2Cs2I6, Ag2ZnSnS4-I, and Ag2ZnSnS4-II are given in Table 3. The three conditions for mechanical stability, which are given in Equations (6)–(8), are simultaneously satisfied for all these structures, and this finding clearly indicates that these tetragonal phases are mechanically stable. This result is consistent with the phonon calculations that are presented in Section 3.3.
Similarly to the elastic constant tensor, the bulk (Bv, BR) and the shear moduli (Gv, GR) provide information regarding the material hardness under deformation. These properties can be directly computed from the elastic constants tensors [36]. The so-obtained values for the bulk modulus, the shear modulus, the Young’s modulus, and the Poisson ratio are reported in Table 3. These polymorphs exhibit scattered values of the Young’s (varying from nine GPa to 63 GPa) and shear modulus (vary from 3.4 GPa to 23 GPa). The calculated compressibility parameter indicates that these compounds are very soft materials. The G/B ratio can be introduced, in which B indicates the bulk modulus, and G indicates the shear modulus. The bulk (Bv, BR) and shear moduli (Gv, GR) are calculated from the Voigt-Reuss-Hill approximations [40,41]. Calculated values for the Lame constant, longitudinal (νL; in m/s), transverse (νT; in m/s), and average sound velocity (ῡ, in m/s) for all four compounds are listed in Table 3 for the sake of completeness. The high/low value of the G/B ratio is associated with ductility/brittleness. The critical value separating the ductile and brittle materials is conventionally set to 0.5 [42]. The G/B values calculated for the compounds under examination are lower than 0.5, implying ductile behaviour.
3.5. Optical Properties
The optical properties have a considerable impact on the response of solar cell materials. To investigate the optical behaviour of Au2Cs2I6, Ag2GeBaS4, Ag2ZnSnS4, and AgCuPO4, we have calculated the optical dielectric function ε(ω) = ε1(ω) + iε2(ω)and defined as the linear response of the system to electromagnetic radiation, controlling the propagation of radiation in a medium. Here, ε(ω) is connected with the interaction of photons and electrons. The imaginary part ε2(ω) of the dielectric function ε(ω) can be derived from the interband optical transitions by summing over the unoccupied states using the equation [24]:
where the indices α, β indicate the Cartesian components, Ω is the volume of the primitive cell, q denotes the wave vector of an incident wave, c and v are the conduction and valance band states respectively, k is the Bloch wave vector, wk denotes the k-point weight, δ is the Dirac delta function, uck is the cell periodic part of the orbital at k-point k, εck refers to energy of the conduction band, and εvk refers to the energy of the valence band.
The real part of the dielectric function is obtained from the ε2(ω) by Kramer–Kronig relationship [24,43]:
where P indicates the principal value, and η is the complex shift. The frequency dependent linear optical properties, including the absorption coefficients ε(ω) and reflectivity R(ω), can be calculated from ε1(ω) and ε2(ω) [24,43]:
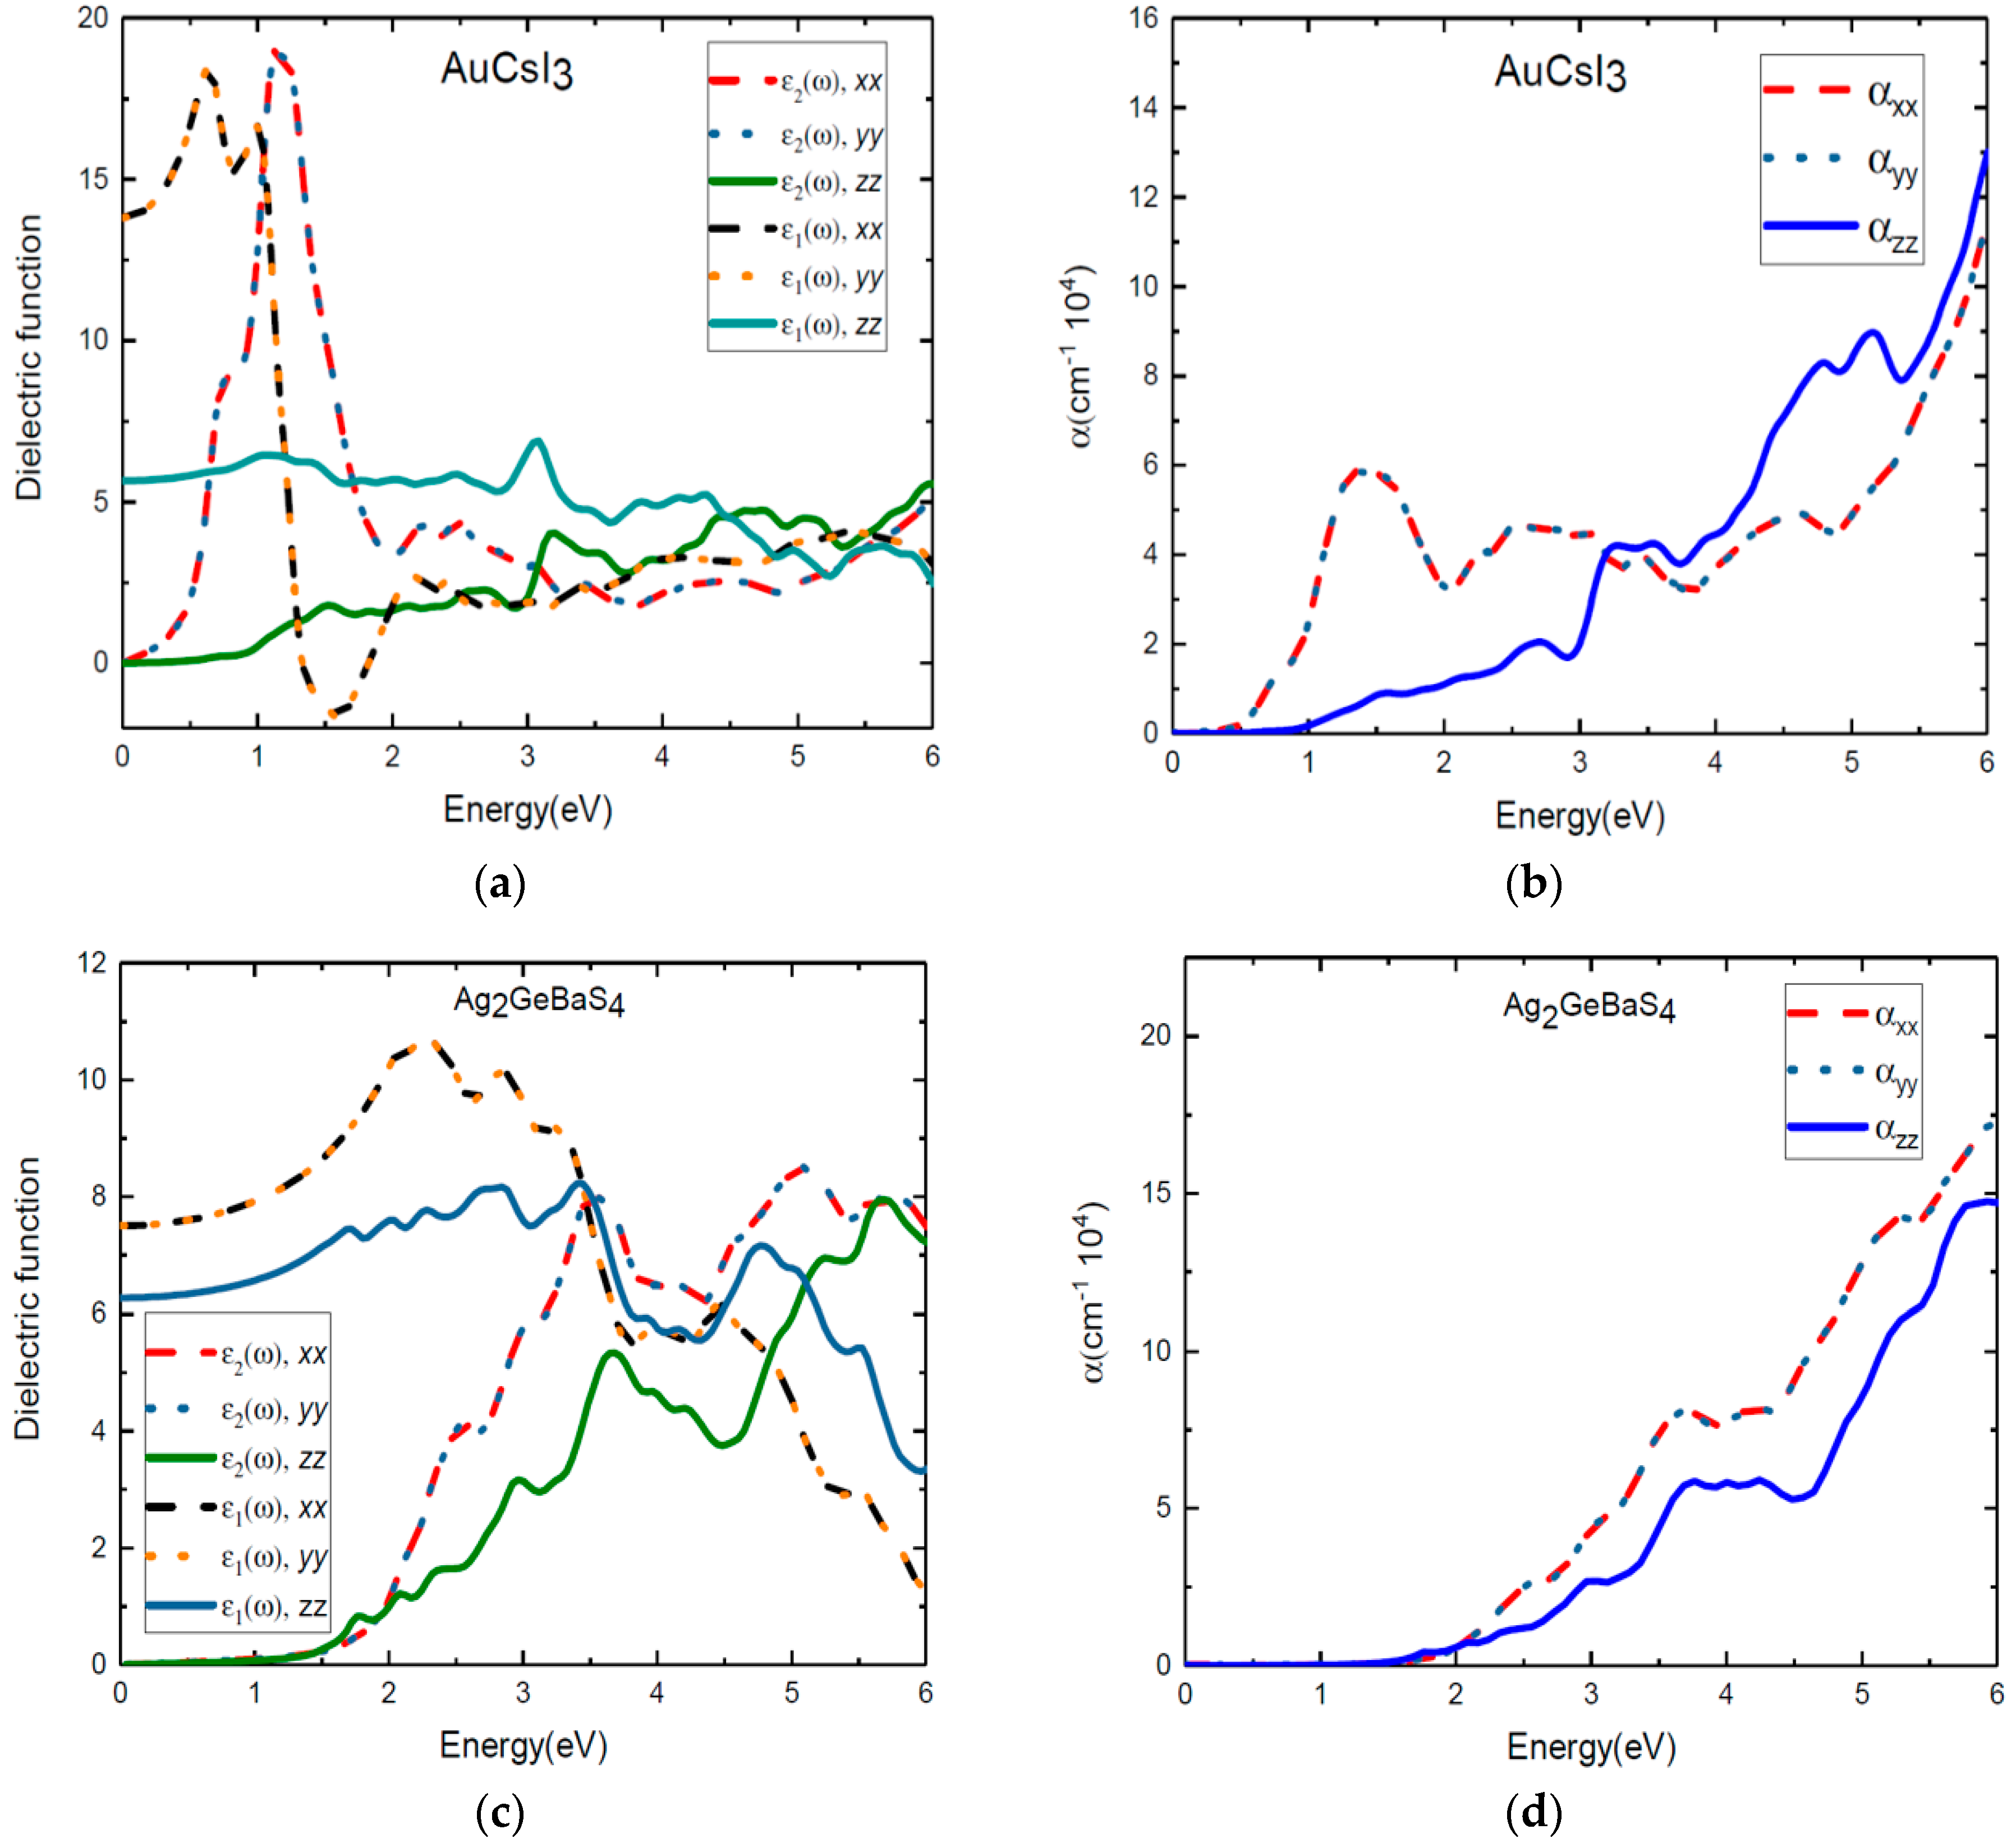
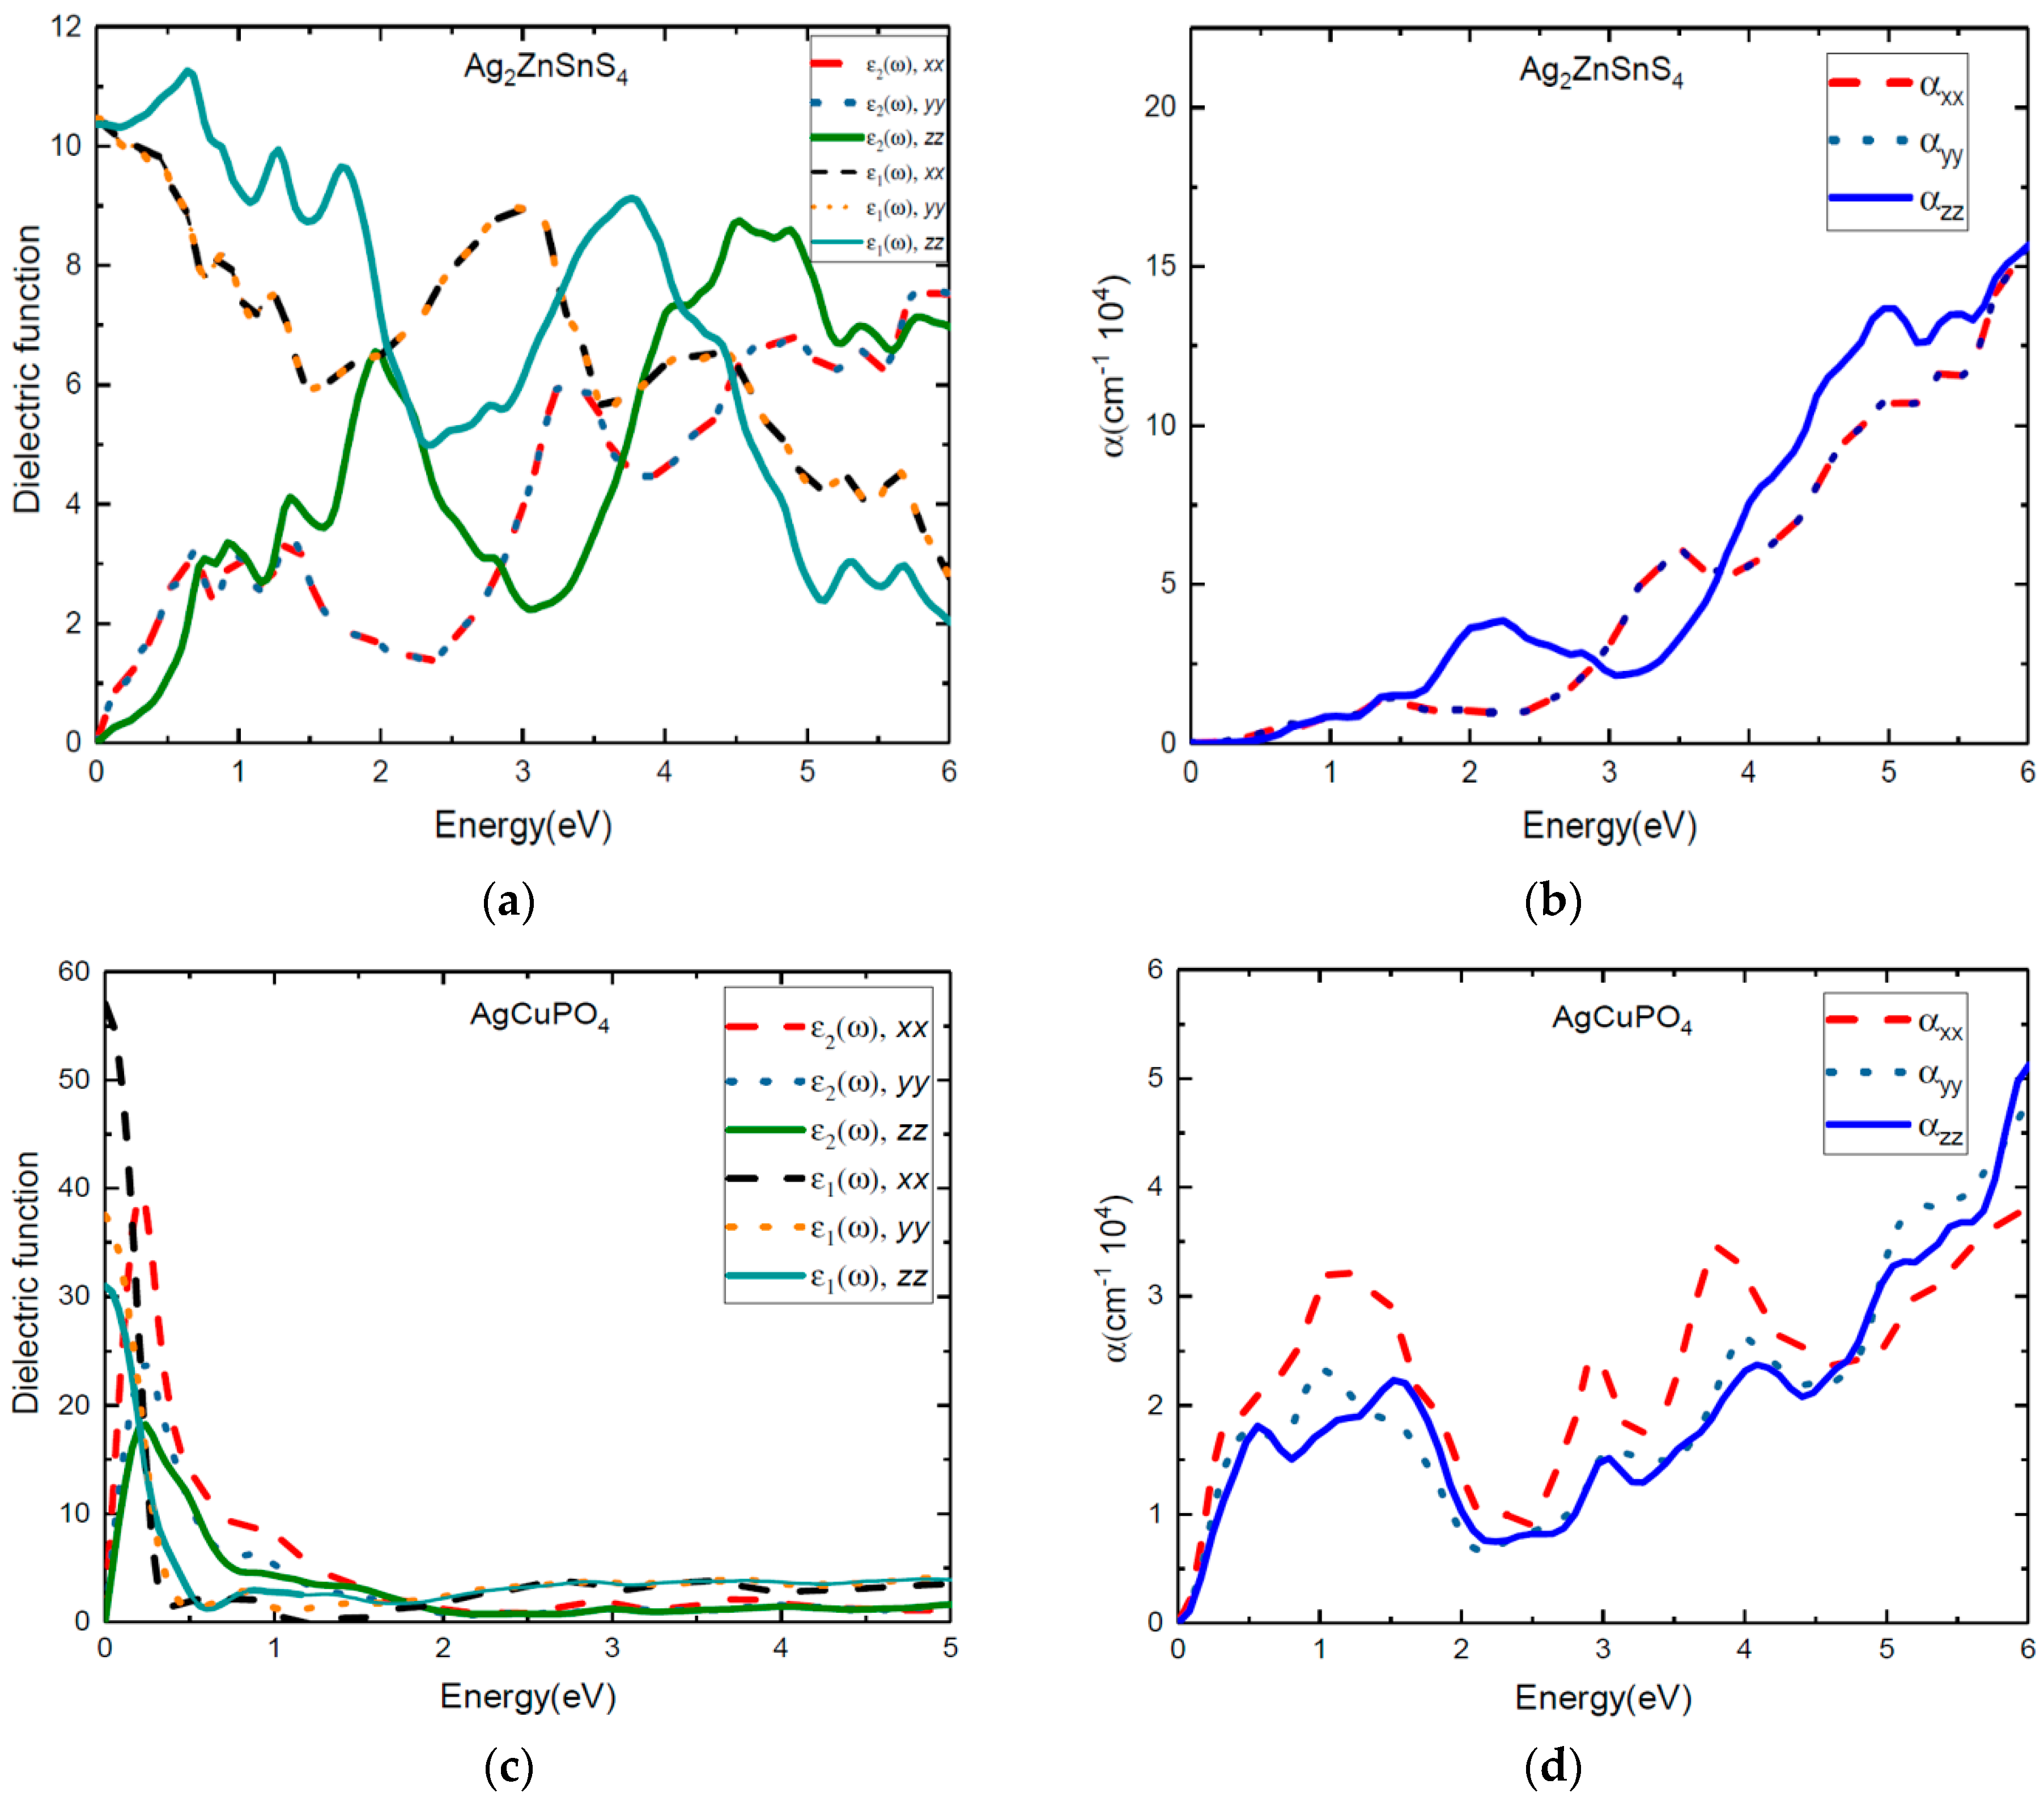
The imaginary part of the dielectric function and the absorption coefficients of Au2Cs2I6, Ag2GeBaS4, Ag2ZnSnS4, and AgCuPO4 are presented in Figure 6 and Figure 7. In general, the hybrid functional produces better results than the semi-local functional for the semiconductor or small gap insulator materials, due to the separation of the exchange energy into a short-range non-local and orbital-dependent exchange term [25]. Numerical results of ε(ω) for the four compounds are calculated using the HSE06 method.
In Figure 6, the real and the imaginary parts of the dielectric function of the tetragonal phases Au2Cs2I6 and Ag2GeBaS4 are plotted against the photon energy. From the directional dependency of ε1(ω) and ε2(ω), we clearly see the anisotropic characteristics of these two materials. In particular, the sharp peaks that are present in the x and y directions are equal. However, these sharp peaks are less pronounced in the z direction. We observe clearly that large anisotropy is present in the lower-energy region due to tetragonal distortion. The peaks at 0.84 eV and 1.12 eV for ε2(ω) along the x and y directions confirm the earlier results presented for the energy gaps between VB–IB and IB–CB in Figure 2a. For photovoltaic purposes, it is of interest to study the transitions that contribute to each peak in the spectra and the influence of the intermediate band on absorption. The electronic transitions from Cs-6s to Cs-5p and Cs-5p to Cs-6s states in Figure 3 clearly demonstrate this. From Figure 6b, we observe that optical absorption for Au2Cs2I6 begins at 0.3 eV, and it is mainly extending from the infrared region to the ultraviolet region of the solar spectrum. Absorption increases drastically in the infrared region due to the intermediate states formed between VB and CB. The overall optical absorption intensity presents a high peak at 1.32 eV, which is attributed to the transition state from Au-5p to Au-6s, as shown in Figure 3. The peak at 2.5 eV is attributed to the states from the 6s orbitals of the substitutional Cs, as shown in Figure 3. In Figure 6b, where the absorption coefficient is plotted against the energy for Au2Cs2I6, we clearly see the peaks at 2.7 eV and 3.2 eV along the z direction. Until 3.5 eV, the absorption coefficients of Au2Cs2I6 in the x and y directions are more pronounced, and from 3.5 eV, the absorption coefficient in the z direction is higher.
Optical reflectivity plays a vital role in the selection of efficient photovoltaic materials. We present results from our study in which first principle calculation is carried out, employing the hybrid functional HSE06 to calculate the optical reflectivity of the materials of interest. In the supporting information in Figure S4, we show the reflectivity of Au2Cs2I6 as a function of the photon energy in all of the directions. As compared to the other three compounds, anisotropy is more pronounced in Au2Cs2I6. We notice that the reflectivity is 0.35–0.5 in the infrared region, and the value drops in the high-energy region along the x and y directions. In the z direction, we notice that the reflectivity is 0.185 in the infrared region and 0.165–0.24 in the visible region, with some peaks. It is also noticed that the reflectivity of Au2Cs2I6 is less in the visible region, which indicates that Au2Cs2I6 can be a good candidate for photovoltaic applications.
We present the ε1(ω) and ε2(ω) values of the dielectric function and the absorption coefficients of Ag2GeBaS4 in Figure 6c,d. Despite the tetragonal phase, the dielectric function and absorption coefficient of Ag2GeBaS4 show that the anisotropy features in this material are less pronounced than other three compounds, as shown in Figure 6c,d. For Ag2GeBaS4 along the x direction, absorption peaks at 2.56 eV (resulting from the transition from the VB to the empty IB states) and 3.56 eV are attributed to the S-3p to Ge-4s transition and S-3p to Ag-5s transition states, respectively, which are presented in the supporting information in Figure S1. However, this curve fails to show the IB to CB transition. We observed that the absorption started to increase after 2 eV, and it mostly extended to the visible region presented in Figure 6d. We clearly notice that the peaks are present at 3 eV and 3.6 eV along the z direction. From 0–6 eV, the absorption coefficient of Ag2GeBaS4 along the z direction is less pronounced than that in the x and y directions. The appearance of absorption peaks in the visible region makes Ag2GeBaS4 a promising candidate for photovoltaic applications. We present the reflectivity of Ag2GeBaS4 as a function of the photon energy in the x, y, and z directions in the supporting information in Figure S5. We notice that the reflectivity is in the range of 0.165 to 0.24 in the infrared region and low-energy side of the visible region along the z direction. At 3 eV, the reflectivity drops by small values; then, the value increases in the high-energy region along the z direction. In the x and y directions, we notice that the reflectivity is around 0.22–0.32 in the infrared region and visible regions. The reflectivity of Ag2GeBaS4 is a little high in the visible region along the x, y and z directions.
The real and imaginary parts of the dielectric function of tetragonal phase Ag2ZnSnS4 and monoclinic phase AgCuPO4 have more optical anisotropic characteristics than the other two compounds, as shown in Figure 7. The calculated real and imaginary parts of the dielectric function and absorption coefficients of Ag2ZnSnS4 are presented in Figure 7a,b. At 0–2 eV photon energy, the ε1(ω) and ε2(ω) and absorption peaks for the z direction are more pronounced than those of the x and y directions (x and y direction are same). From 3–3.8 eV photon energy, α(ω) and ε(ω) along the x direction are more pronounced than those along the z direction. For Ag2ZnSnS4 along the x direction, the absorption peaks that were seen at 1.08 eV (resulting in the electronic transition from IB–CB) were attributed to the Sn-5s to Sn-3d transition states; these results are presented in the supporting information in Figure S2. Next, absorption peaks were noticed at 1.45 eV (electronic transition from the occupied VB to the empty IB state), corresponding to the S-3p to Sn-5s transition states. The absorption peak at 1.94 eV (resulting in electronic transition within IB) is due to the contribution from the S-3p to Zn-3d transition states and 3.27 eV (VB to CB transition) for the S-3p to Sn-4d transition, as shown in the supporting information in Figure S2. We observed that the absorption peaks started to increase from the infrared region due to the intermediate state, and were greatly extended to the visible region. The reflectivity of Ag2ZnSnS4 was high at 0.6 and 2 eV photon energy, and very low at 3 eV photon energy for the z-direction, as shown in the supporting information in Figure S6. However, the reflectivity was very low at 1.5–2 eV along the x and y directions, which indicated that this material can be used for photovoltaic applications.
We present both the ε1(ω) and ε2(ω) values of the dielectric function and the absorption coefficients for AgCuPO4 in Figure 7c,d. The calculated values for ε1(ω) and ε2(ω) of the dielectric function and absorption coefficients indicate that the monoclinic AgCuPO4 phase has more optical anisotropic characteristics than the other compounds. The absorption coefficient of AgCuPO4 is quite similar in the y and z directions after 2 eV of photon energy. However, the α(ω) along the x direction is more pronounced than in the y and z directions. From Figure 7d, we observe the absorption peaks at 0.57 eV, 1.2 eV, 3 eV, and 4eV along the x direction. In the supporting information in Figure S7, we show the reflectivity of the AgCuPO4 as a function of photon energy in all directions. We notice that the reflectivity is 0.1 to 0.59 in the infrared region, and the value drops in the visible region along the x, y, and z directions. This validates that AgCuPO4 can be used in photovoltaic applications. Overall, from the numerical results for the dielectric function, the absorption coefficient, and reflectivity, we conclude that all four compounds exhibited three-level optical transitions. This will lead to enhanced light absorption in the extended visible region.
The static dielectric constant ε1(0) is given by the low energy limit of ε1(ω), and its values for all four compounds are presented in Table 4. Here, we use both GGA and HSE06 to calculate the static dielectric constants, which are presented in Table 4. As expected [25], we observed that the static dielectric constant are overestimated when GGA is employed. This can be explained by the bandgap values being underestimated when GGA is employed. The bandgap between VB and IB is smaller in AgCuPO4, so the static dielectric constant is very high compared to the other three compounds.
4. Conclusions
In summary, we have carried out a comprehensive study of the structural, mechanical, and optical properties of Au2Cs2I6, Ag2GeBaS4, Ag2ZnSnS4, and AgCuPO4 by employing the range-separated hybrid functional, HSE06. Our results revealed that HSE06 could give a more accurate description of the electronic band structure compared to GGA + U, which was employed earlier on these materials. The phonon calculations revealed that the Au2Cs2I6, Ag2GeBaS4, and Ag2ZnSnS4 compounds are dynamically stable, as no imaginary frequency was observed. The zero-point energy values for all of the dynamically stable compounds were calculated. The mechanical properties such as the Young’s modulus, the bulk modulus, the shear modulus, and the Poisson’s ratio were calculated from the values of the elastic constants. The elastic constant calculations characterised the four examined compounds as mechanically stable. The G/B ratio was in all cases smaller than 0.5, confirming the ductile nature of the materials.
Numerical results for the static and the dynamic dielectric functions were provided using GGA and HSE06 methods. As expected, GGA overestimated the static dielectric constant. Interestingly, we also observed additional absorption peaks appearing in the optical spectra of these four IBs compounds, which were accompanied by a broadened light absorption energy range and high absorption intensity. Our detailed study of the electronic and optical properties reveal these materials as potential candidates for photovoltaic application, especially for the development of third-generation intermediate band solar cells.
Supplementary Materials
The following are available online at https://www.mdpi.com/1996-1073/11/12/3457/s1, Figure S1: Calculated total and site projected density of states of Ag2GeBaS4. The Fermi level is set to zero and marked by a vertical dotted line.; Figure S2: Calculated total and site projected density of states of Ag2ZnSnS4. The Fermi level is set to zero and marked by a vertical dotted line.; Figure S3: Calculated total and site projected density of states of AgCuPO4. The Fermi level is set to zero and marked by a vertical dotted line.; Figure S4: Reflectivity of Au2Cs2I6 along x, y and z directions.; Figure S5: Reflectivity of Ag2GeBaS4 along x, y and z directions.; Figure S6: Reflectivity of Ag2ZnSnS4 along x, y and z directions.; Figure S7: Reflectivity of AgCuPO4 along x, y and z directions.
Author Contributions
Conceptualization, M.R., D.V. and P.V.; Methodology, M.R., D.V. and P.V.; Software, M.R., P.V. and D.V.; Validation, P.V., M.R. and D.V.; Formal Analysis, M.R.; Investigation, M.R., D.V. and P.V.; Resources, M.R., P.V.; Data Curation, M.R. and P.V.; Writing-Original Draft Preparation, M.R.; Writing-Review & Editing, D.V., P.V.; Visualization, M.R. and P.V.; Supervision, D.V., P.V.; Project Administration, D.V.; Funding Acquisition, D.V.
Funding
This research was funded by Western Norway University of Applied Sciences grant number 23300.
Acknowledgments
The authors gratefully acknowledge the Western Norway University of Applied Sciences for financially supporting the project (23300) and UNINETT Sigma2 for computing facilities of project numbers NN2867K and NN2875K, which have been used to conduct the calculations presented in this article, and further acknowledge Federico Bianchini for fruitful discussions.
Conflicts of Interest
The authors declare no conflict of interest.
References
- Rasukkannu, M.; Velauthapillai, D.; Vajeeston, P. Computational Modeling of Novel Bulk Materials for the Intermediate-Band Solar Cells. ACS Omega 2017, 2, 1454–1462. [Google Scholar] [CrossRef]
- Luque, A.; Martí, A.; Stanley, C. Understanding intermediate-band solar cells. Nat. Photonics 2012, 6, 146–152. [Google Scholar] [CrossRef] [Green Version]
- Luque, A.; Marti, A. A metallic intermediate band high efficiency solar cell. Prog. Photovolt. Res. Appl. 2001, 9, 73–86. [Google Scholar] [CrossRef]
- Rasukkannu, M.; Velauthapillai, D.; Vajeeston, P. A first-principle study of the electronic, mechanical and optical properties of inorganic perovskite Cs2SnI6 for intermediate-band solar cells. Mater. Lett. 2018, 218, 233–236. [Google Scholar] [CrossRef]
- Shockley, W.; Queisser, H.J. Detailed balance limit of efficiency of p-n junction solar cells. J. Appl. Phys. 1961, 32, 510–519. [Google Scholar] [CrossRef]
- Luque, A.; Martí, A. Increasing the efficiency of ideal solar cells by photon induced transitions at intermediate levels. Phys. Rev. Lett. 1997, 78, 5014. [Google Scholar] [CrossRef]
- Palacios, P.; Aguilera, I.; Sánchez, K.; Conesa, J.; Wahnón, P. Transition-metal-substituted indium thiospinels as novel intermediate-band materials: Prediction and understanding of their electronic properties. Phys. Rev. Lett. 2008, 101, 046403. [Google Scholar] [CrossRef]
- Green, M.A. Multiple band and impurity photovoltaic solar cells: General theory and comparison to tandem cells. Prog. Photovolt. Res. Appl. 2001, 9, 137–144. [Google Scholar] [CrossRef]
- Nozawa, T.; Arakawa, Y. Detailed balance limit of the efficiency of multilevel intermediate band solar cells. Appl. Phys. Lett. 2011, 98, 171108. [Google Scholar] [CrossRef]
- Okada, Y.; Ekins-Daukes, N.; Kita, T.; Tamaki, R.; Yoshida, M.; Pusch, A.; Hess, O.; Phillips, C.; Farrell, D.; Yoshida, K. Intermediate band solar cells: Recent progress and future directions. Appl. Phys. Rev. 2015, 2, 021302. [Google Scholar] [CrossRef] [Green Version]
- Aguilera, I.; Palacios, P.; Wahnón, P. Optical properties of chalcopyrite-type intermediate transition metal band materials from first principles. Thin Solid Films 2008, 516, 7055–7059. [Google Scholar] [CrossRef] [Green Version]
- Han, M.; Zhang, X.; Zeng, Z. The investigation of transition metal doped CuGaS2 for promising intermediate band materials. RSC Adv. 2014, 4, 62380–62386. [Google Scholar] [CrossRef]
- Aguilera, I.; Palacios, P.; Wahnón, P. Enhancement of optical absorption in Ga-chalcopyrite-based intermediate-band materials for high efficiency solar cells. Sol. Energy Mater. Sol. Cells 2010, 94, 1903–1906. [Google Scholar] [CrossRef] [Green Version]
- Chen, P.; Qin, M.; Chen, H.; Yang, C.; Wang, Y.; Huang, F. Cr incorporation in CuGaS2 chalcopyrite: A new intermediate-band photovoltaic material with wide-spectrum solar absorption. Phys. Status Solidi (a) 2013, 210, 1098–1102. [Google Scholar] [CrossRef]
- Han, M.; Zhang, X.; Zhang, Y.; Zeng, Z. The group VA element non-compensated n–p codoping in CuGaS2 for intermediate band materials. Sol. Energy Mater. Sol. Cells 2016, 144, 664–670. [Google Scholar] [CrossRef]
- Gong, W.; Tabata, T.; Takei, K.; Morihama, M.; Maeda, T.; Wada, T. Crystallographic and optical properties of (Cu, Ag)2ZnSnS4 and (Cu, Ag)2ZnSnSe4 solid solutions. Phys. Status Solidi (c) 2015, 12, 700–703. [Google Scholar] [CrossRef]
- Kresse, G.; Furthmüller, J. Efficient iterative schemes for ab initio total-energy calculations using a plane-wave basis set. Phys. Rev. B 1996, 54, 11169. [Google Scholar] [CrossRef]
- Perdew, J.P.; Burke, K.; Ernzerhof, M. Generalized gradient approximation made simple. Phys. Rev. Lett. 1996, 77, 3865. [Google Scholar] [CrossRef]
- Dudarev, S.; Botton, G.; Savrasov, S.Y.; Szotek, Z.; Temmerman, W.; Sutton, A. Electronic Structure and Elastic Properties of Strongly Correlated Metal Oxides from First Principles: LSDA+ U, SIC-LSDA and EELS Study of UO2 and NiO. Phys. Status Solidi (a) 1998, 166, 429–443. [Google Scholar] [CrossRef]
- Kresse, G.; Furthmüller, J. Efficiency of ab-initio total energy calculations for metals and semiconductors using a plane-wave basis set. Comput. Mater. Sci. 1996, 6, 15–50. [Google Scholar] [CrossRef]
- Liechtenstein, A.; Anisimov, V.; Zaanen, J. Density-functional theory and strong interactions: Orbital ordering in Mott-Hubbard insulators. Phys. Rev. B 1995, 52, R5467. [Google Scholar] [CrossRef]
- Ponniah, V. Density Functional Theory Based Database (DFTBD); University of Oslo: Oslo, Norway, 2013. [Google Scholar]
- Heyd, J.; Scuseria, G.E. Efficient hybrid density functional calculations in solids: Assessment of the Heyd–Scuseria–Ernzerhof screened Coulomb hybrid functional. J. Chem. Phys. 2004, 121, 1187–1192. [Google Scholar] [CrossRef] [PubMed]
- Gajdoš, M.; Hummer, K.; Kresse, G.; Furthmüller, J.; Bechstedt, F. Linear optical properties in the projector-augmented wave methodology. Phys. Rev. B 2006, 73, 045112. [Google Scholar] [CrossRef]
- Paier, J.; Marsman, M.; Kresse, G. Dielectric properties and excitons for extended systems from hybrid functionals. Phys. Rev. B 2008, 78, 121201. [Google Scholar] [CrossRef]
- Hellenbrandt, M. The inorganic crystal structure database (ICSD)—Present and future. Crystallogr. Rev. 2004, 10, 17–22. [Google Scholar] [CrossRef]
- Togo, A.; Tanaka, I. First principles phonon calculations in materials science. Scr. Mater. 2015, 108, 1–5. [Google Scholar] [CrossRef] [Green Version]
- Togo, A.; Oba, F.; Tanaka, I. First-principles calculations of the ferroelastic transition between rutile-type and CaCl2-type SiO2 at high pressures. Phys. Rev. B 2008, 78, 134106. [Google Scholar] [CrossRef]
- Matsushita, N.; Kitagawa, H.; Kojima, N. A Three-Dimensional Iodo-Bridged Mixed-Valence Gold (I, III) Compound, Cs2AuIAuIIII6. Acta Crystallogr. Sect. C Cryst. Struct. Commun. 1997, 53, 663–666. [Google Scholar] [CrossRef]
- Liu, X.; Matsuda, K.; Moritomo, Y.; Nakamura, A.; Kojima, N. Electronic structure of the gold complexes Cs2Au2X6 (X = I, Br, and Cl). Phys. Rev. B 1999, 59, 7925. [Google Scholar] [CrossRef]
- Teske, C.L. Darstellung und Kristallstruktur von Silber-Barium-Thiogermanat (IV). Ag2BaGeS4/Preparation and Crystal Structure of Silver-Barium-Thiogermanate (IV). Ag2BaGeS4. Zeitschrift für Naturforschung B 1979, 34, 544–547. [Google Scholar] [CrossRef]
- Quarton, M.; Oumba, M. Proprietes de l’ion Cu2+ dans la structure de AgCuPO4-β. Mater. Res. Bull. 1983, 18, 967–974. [Google Scholar] [CrossRef]
- Riggs, S.C.; Shapiro, M.; Corredor, F.; Geballe, T.; Fisher, I.; McCandless, G.T.; Chan, J.Y. Single crystal growth by self-flux method of the mixed valence gold halides Cs2 [AuIX2][AuIIIX4](X = Br, I). J. Cryst. Growth 2012, 355, 13–16. [Google Scholar] [CrossRef]
- Johan, Z.; Picot, P. La pirquitasite, Ag2ZnSnS4, un nouveau membre du groupe de la stannite. Bull. Miner. 1982, 105, 229–235. [Google Scholar]
- Ben Yahia, H.; Gaudin, E.; Darriet, J.; Dai, D.; Whangbo, M.-H. Comparison of the crystal structures and magnetic properties of the low-and high-temperature forms of AgCuPO4: Crystal structure determination, magnetic susceptibility measurements, and spin dimer analysis. Inorg. Chem. 2006, 45, 5501–5509. [Google Scholar] [CrossRef] [PubMed]
- Vajeeston, P.; Fjellvåg, H. First-principles study of structural stability, dynamical and mechanical properties of Li2FeSiO4 polymorphs. RSC Adv. 2017, 7, 16843–16853. [Google Scholar] [CrossRef]
- Hase, M.; Matsuda, M.; Kakurai, K.; Ozawa, K.; Kitazawa, H.; Tsujii, N.; Dönni, A.; Kuroe, H. Inelastic neutron scattering study of the spin-gap cuprate β−AgCuPO4. Phys. Rev. B 2007, 76, 134403. [Google Scholar] [CrossRef]
- Ashcroft, N.W.; Mermin, N.D. Solid State Physics (Holt, Rinehart and Winston, New York, 1976). Google Sch. 2005, 403, 444–447. [Google Scholar]
- Nye, J.F. Physical Properties of Crystals: Their Representation by Tensors and Matrices; Oxford University Press: Oxford, UK, 1985. [Google Scholar]
- Reuss, A. Berechnung der fließgrenze von mischkristallen auf grund der plastizitätsbedingung für einkristalle. ZAMM-J. Appl. Math. Mech./Zeitschrift für Angewandte Mathematik und Mechanik 1929, 9, 49–58. [Google Scholar] [CrossRef]
- Hill, R. The elastic behaviour of a crystalline aggregate. Proc. Phys. Soc. Sect. A 1952, 65, 349. [Google Scholar] [CrossRef]
- Pugh, S. XCII. Relations between the elastic moduli and the plastic properties of polycrystalline pure metals. Lond. Edinb. Dublin Philos. Mag. J. Sci. 1954, 45, 823–843. [Google Scholar] [CrossRef]
- Yang, L.-M.; Vajeeston, P.; Ravindran, P.; Fjellvåg, H.; Tilset, M. Revisiting isoreticular MOFs of alkaline earth metals: A comprehensive study on phase stability, electronic structure, chemical bonding, and optical properties of A–IRMOF-1 (A = Be, Mg, Ca, Sr, Ba). Phys. Chem. Chem. Phys. 2011, 13, 10191–10203. [Google Scholar] [CrossRef] [PubMed]
Figure 1.
Crystal structures for (a) Au2Cs2I6; (b) Ag2GeBaS4; (c) Ag2ZnSnS4 (in I-4; kesterite-type); and (d) AgCuPO4. The legends for the different kinds of atoms shown in the illustration.
Figure 1.
Crystal structures for (a) Au2Cs2I6; (b) Ag2GeBaS4; (c) Ag2ZnSnS4 (in I-4; kesterite-type); and (d) AgCuPO4. The legends for the different kinds of atoms shown in the illustration.

Figure 2.
Calculated electronic band structure of (a) Au2Cs2I6, (b) Ag2GeBaS4, (c) Ag2ZnSnS4, and (d) AgCuPO4. Colour code: red line—s states, green line—p states, blue—d states). The Fermi level is set to zero.
Figure 2.
Calculated electronic band structure of (a) Au2Cs2I6, (b) Ag2GeBaS4, (c) Ag2ZnSnS4, and (d) AgCuPO4. Colour code: red line—s states, green line—p states, blue—d states). The Fermi level is set to zero.
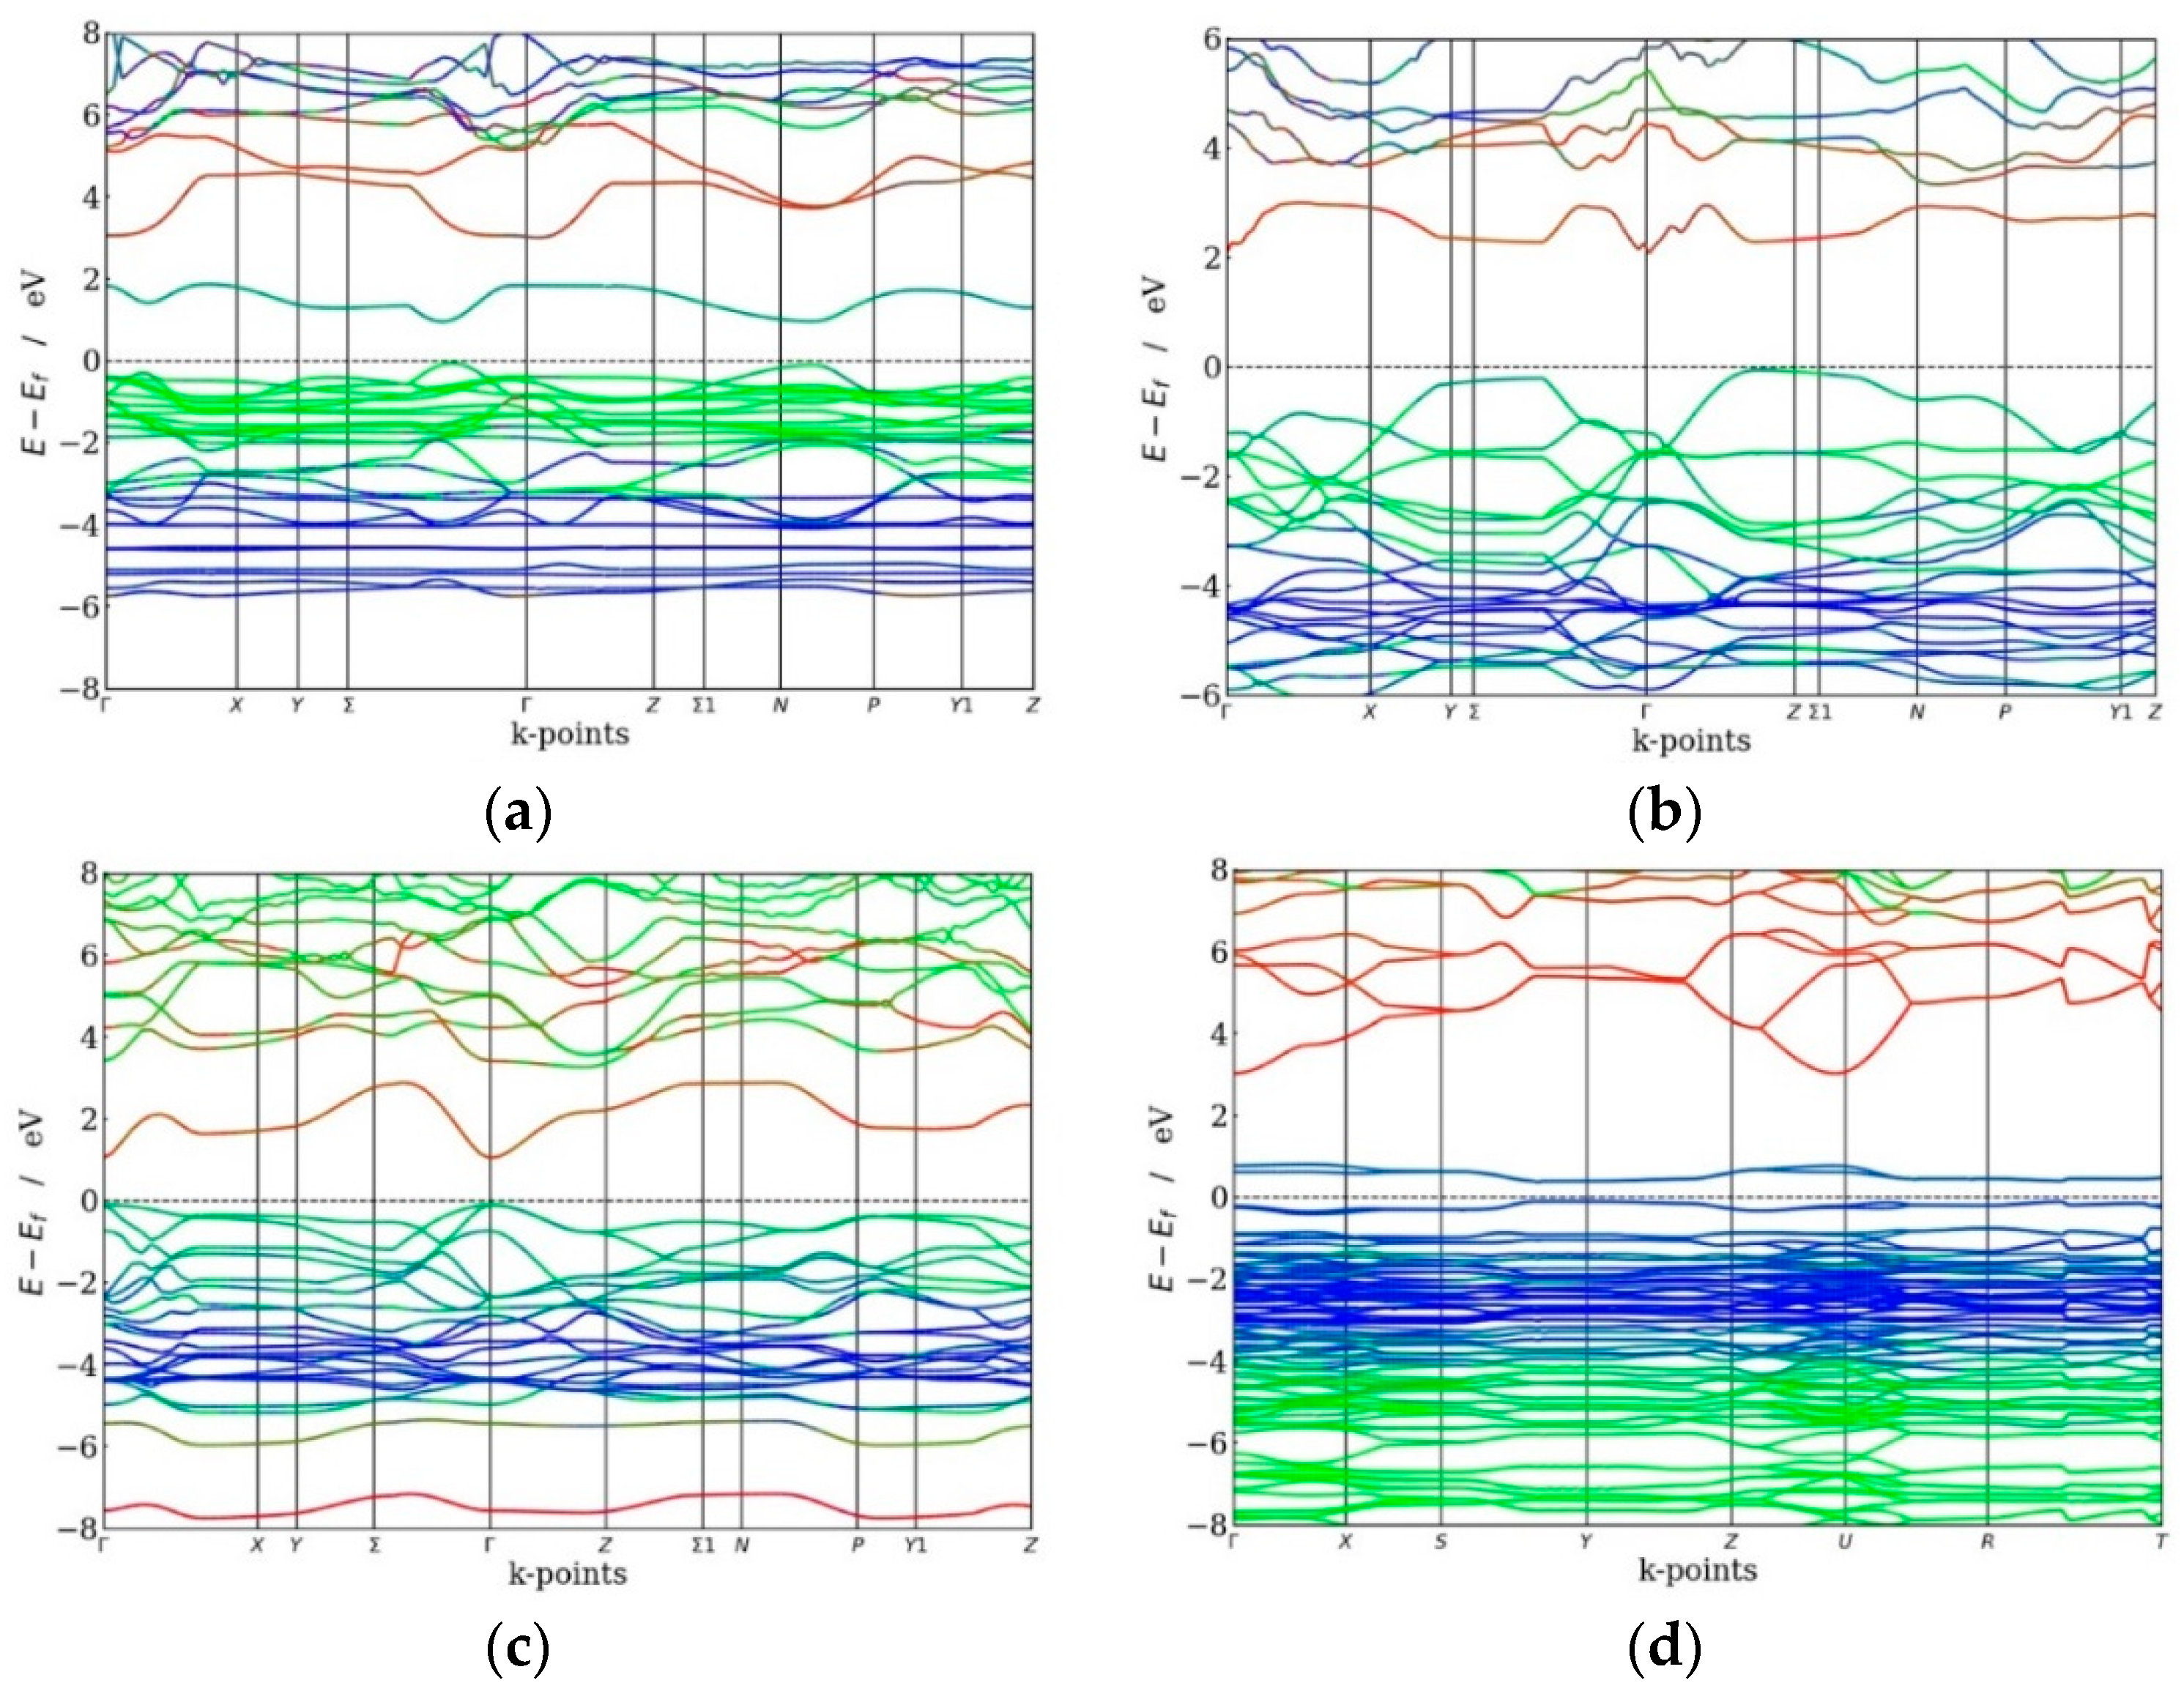
Figure 3.
Total and site projected density of states (PDOS) of Au2Cs2I6. The Fermi level is conventionally set to zero and indicated with a dashed line.
Figure 3.
Total and site projected density of states (PDOS) of Au2Cs2I6. The Fermi level is conventionally set to zero and indicated with a dashed line.

Figure 4.
Calculated total phonon density of states for (a) Au2Cs2I6, (b) Ag2ZnSnS4, (c) Ag2GeBaS4, and (d) AgCuPO4 phases.
Figure 4.
Calculated total phonon density of states for (a) Au2Cs2I6, (b) Ag2ZnSnS4, (c) Ag2GeBaS4, and (d) AgCuPO4 phases.

Figure 5.
Calculated site projected phonon density of states for (a) Au2Cs2I6; (b) Ag2ZnSnS4, and (c) Ag2GeBaS4 phases.
Figure 5.
Calculated site projected phonon density of states for (a) Au2Cs2I6; (b) Ag2ZnSnS4, and (c) Ag2GeBaS4 phases.
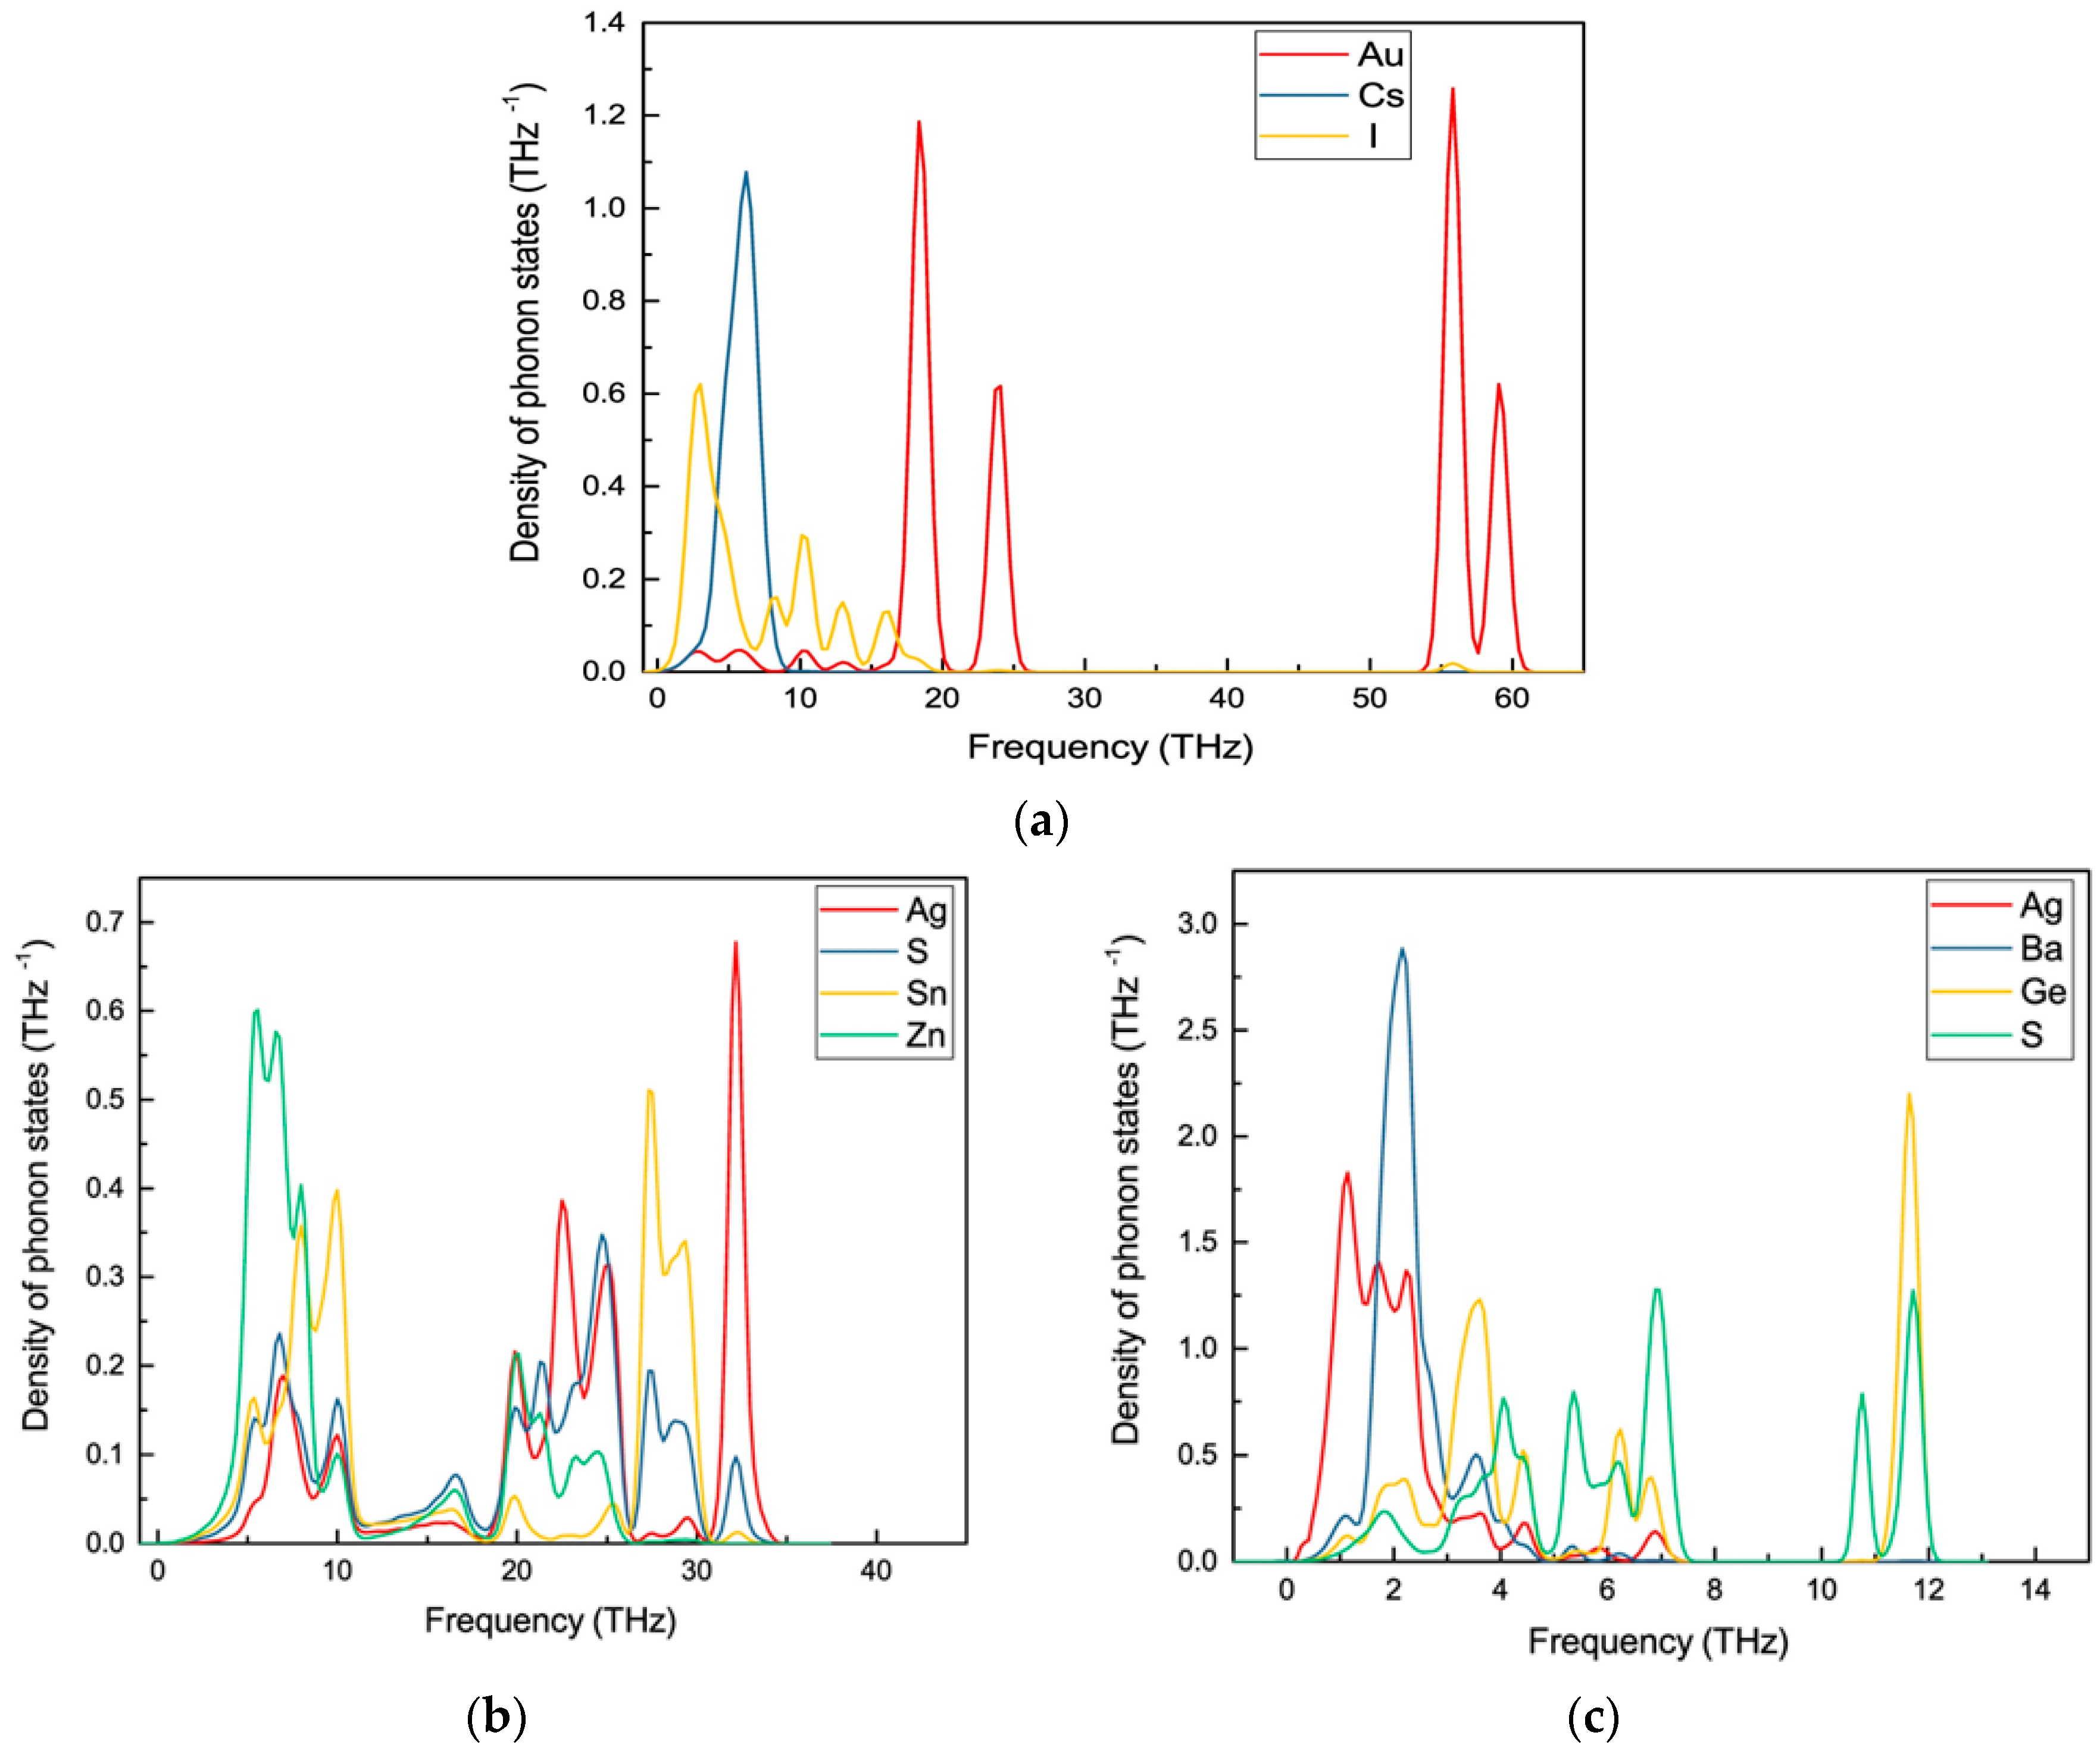
Figure 6.
Calculated dielectric function (a,c) and optical absorption coefficients (b,d) of Au2Cs2I6 and Ag2GeBaS4, respectively, along the x, y, and z directions.
Figure 6.
Calculated dielectric function (a,c) and optical absorption coefficients (b,d) of Au2Cs2I6 and Ag2GeBaS4, respectively, along the x, y, and z directions.

Figure 7.
Calculated dielectric function (a,c) and absorption coefficients (b,d) of AgCuPO4 and Ag2ZnSnS4, respectively along the x, y, and z directions.
Figure 7.
Calculated dielectric function (a,c) and absorption coefficients (b,d) of AgCuPO4 and Ag2ZnSnS4, respectively along the x, y, and z directions.


Table 1.
Calculated structural parameters and atomic positions of AgCuPO4, Ag2GeBaS4, Au2Cs2I6,, and Ag2ZnSnS4.
Table 1.
Calculated structural parameters and atomic positions of AgCuPO4, Ag2GeBaS4, Au2Cs2I6,, and Ag2ZnSnS4.
| Phase | Lattice Parameter | Atomic Positions | |||
|---|---|---|---|---|---|
| a | b | c | β(deg) | ||
| Au2Cs2I6- I4/mmm; 139 | 8.4089 (8.2847 c) | 12.301 (12.0845 c) | 90 | c Cs(4d): 0, 1/2, 1/4 c Au1(2a): 0, 0, 0 c Au2(2b):1/2, 1/2, 0 c I1(8h):0.2258, 0.2285, 0 c I2(4e):1/2, 1/2, 0.2131 | |
| Ag2BaGeS4- I-42m 121 | 6.9327 (6.8280 b) | 8.1705 (8.0170 b) | 90 | b Ba(2a): 0, 0, 0 b Ag(4d): 0, 1/2, 1/4 b Ge(2b): 0, 0, 1/2 b S(8i): 0.1883, 0.1883, 0.3440 | |
| Ag2ZnSnS4- I-4m; 121 | 5.703 (5.693 d) | 11.350 (11.342 d) | 90 | d Zn(2d): 1/2, 0, 1/4 d Sn(2b): 1/2, 1/2, 0 d Ag(2c): 0, 1/2, 1/4 d Ag(2a): 0, 0, 0 d S(8g):0.249, 0.240, 0.128 | |
| Ag2ZnSnS4- I-42m | 5.6503 (5.7860 e) | 11.4884 (10.8290 e) | 90 | e Zn(2a): 0, 0, 0 e Sn(2b): 1/2, 1/2, 0 e Ag(4d): 0, 1/2, 1/4 e S(8i):0.7560, 0.7560, 0.8700 | |
| AgCuPO4- P21/c; 14 | 8.010 (7.8365 a) | 5.6438 (5.6269 a) | 7.6480 (7.4938 a) | 98.15 (99.07 a) | a Ag(4e): 0.9287, 0.1093, 0.1909 a Cu(4e): 0.5834, 0.1205, 0.8533 a P(4e): 0.2754, 0.1150, 0.4925 a O1(4e): 0.3150, −0.0490, 0.6480 a O2(4e): 0.2760, −0.0130, 0.3120 a O3(4e): 0.0990, 0.2370, 0.4920 a O4(4e): 0.4280, 0.3050, 0.5200 |
Table 2.
Calculated HSE06 total bandgap (Eg; in eV), bandgap between the top of the valence band (VB) and the bottom of the intermediate band (IB) (Evi; in eV), energy gap between the top of the IB and the bottom of the conduction band (CB) (Eci; in eV) and the width of the IB (∆Ei; in eV) are listed here for Au2Cs2I6, Ag2GeBaS4, Ag2ZnSnS4,, and AgCuPO4.
| Compounds | Bandgap (Evi) | Bandgap (Eci) | Width of IB (ΔEi) | Total Bandgap (Eg) |
|---|---|---|---|---|
| Au2Cs2I6 | 0.89 | 1.13 | 0.90 | 2.92 |
| Ag2GeBaS4 | 2.08 | 0.34 | 0.91 | 3.33 |
| Ag2ZnSnS4 | 1.15 | 0.34 | 1.85 | 3.34 |
| AgCuPO4 | 0.33 | 2.19 | 0.44 | 2.96 |
Table 3.
The calculated single-crystal elastic constants Cij (in GPa), bulk modulus B (in GPa), shear modulus G (in GPa), Poisson’s ratio (σ), Young’s modulus E (in GPa), compressibility (GPa−1), ductility, Lame constant, longitudinal (νL; in m/s), transverse (νT; in m/s), average sound velocity (ῡ, in m/s), and Debye temperature (θD) for AgCuPO4, Ag2GeBaS4, Au2Cs2I6, and Ag2ZnSnS4 phases. Subscript V indicates the Voigt bound, R indicates the Reuss bound, and VRH indicates the Hill average.
| Properties | Phase | ||||
|---|---|---|---|---|---|
| AgCuPO4 | Ag2GeBaS4 | Au2Cs2I6 | Ag2ZnSnS4 | ||
| P21/n | I-42m | I4/mmm | I-4m | I-42m | |
| Cij | C11 = 86 | C11 = 74 | C11 = 18 | C11 = 67 | C11 = 63 |
| C12 = 66 | C12 = 48 | C12 = 11 | C12 = 44 | C12 = 45 | |
| C13 = 52 | C13 = 33 | C13 =3 | C13 = 43 | C13 = 44 | |
| C16 = 18 | C33 = 47 | C33 = 21 | C33 = 63 | C33 = 74 | |
| C22 = 162 | C44 = 22 | C44 = 7 | C44 = 28 | C44 = 29 | |
| C23 = 72 | C55 = 18 | C55 = 1 | C55 = 25 | C55 = 27 | |
| C26 = 9 | |||||
| C33 = 110 | |||||
| C36 = 23 | |||||
| C44 = 21 | |||||
| C45 = 5 | |||||
| C55 = 18 | |||||
| C66 = 19 | |||||
| BV | 82 | 47 | 10 | 51 | 52 |
| BR | 52 | 43 | 10 | 51 | 52 |
| BVRH | 67 | 44.5 | 10 | 51 | 52 |
| GV | 27 | 17 | 4.5 | 20 | 21 |
| GR | 20 | 16 | 2.3 | 17 | 17 |
| GVRH | 23 | 16.7 | 3.4 | 18.3 | 18.5 |
| E | 63 | 45 | 9 | 49 | 50 |
| Compressibility | 0.02 | 0.02 | 0.1 | 0.02 | 0.02 |
| Ductility | 0.35 | 0.38 | 0.34 | 0.36 | 0.36 |
| Lame constant | 51.4 | 33 | 8 | 39 | 39 |
| σ | 0.34 | 0.33 | 0.35 | 0.34 | 0.34 |
| νL | 4366 | 3777 | 1632 | 4073 | 4086 |
| νT | 2129 | 1888 | 792 | 2007 | 2011 |
| ῡ | 2391 | 2118 | 891 | 2253 | 2258 |
| θD | 771 | 592 | 150 | 634 | 637 |
Table 4.
Calculated static dielectric constants from optical studies for Au2Cs2I6, Ag2GeBaS4, Ag2ZnSnS4, and AgCuPO4. The supercell size used for the phonon study and the calculated zero-point energy (ZPE) for the studied compounds are also listed below.
Table 4.
Calculated static dielectric constants from optical studies for Au2Cs2I6, Ag2GeBaS4, Ag2ZnSnS4, and AgCuPO4. The supercell size used for the phonon study and the calculated zero-point energy (ZPE) for the studied compounds are also listed below.
| Compounds | GGA | HSE | Supercell Size | ZPE |
|---|---|---|---|---|
| Au2Cs2I6 | 14.04 | 11.09 | 3 × 3 × 3 | 0.3 |
| Ag2GeBaS4 | 7.48 | 7.09 | 3 × 3 × 2 | 0.24 |
| Ag2ZnSnS4 | 10.45 | 10.42 | 4 × 4 × 2 | 0.25 |
| AgCuPO4 | 64.86 | 41.84 | 2 × 1 × 2 | 0.84 |
© 2018 by the authors. Licensee MDPI, Basel, Switzerland. This article is an open access article distributed under the terms and conditions of the Creative Commons Attribution (CC BY) license (http://creativecommons.org/licenses/by/4.0/).
Share and Cite
MDPI and ACS Style
Rasukkannu, M.; Velauthapillai, D.; Vajeeston, P. Hybrid Density Functional Study of Au2Cs2I6, Ag2GeBaS4, Ag2ZnSnS4, and AgCuPO4 for the Intermediate Band Solar Cells. Energies 2018, 11, 3457. https://doi.org/10.3390/en11123457
AMA Style
Rasukkannu M, Velauthapillai D, Vajeeston P. Hybrid Density Functional Study of Au2Cs2I6, Ag2GeBaS4, Ag2ZnSnS4, and AgCuPO4 for the Intermediate Band Solar Cells. Energies. 2018; 11(12):3457. https://doi.org/10.3390/en11123457
Chicago/Turabian StyleRasukkannu, Murugesan, Dhayalan Velauthapillai, and Ponniah Vajeeston. 2018. "Hybrid Density Functional Study of Au2Cs2I6, Ag2GeBaS4, Ag2ZnSnS4, and AgCuPO4 for the Intermediate Band Solar Cells" Energies 11, no. 12: 3457. https://doi.org/10.3390/en11123457
Note that from the first issue of 2016, this journal uses article numbers instead of page numbers. See further details here.