Modelling a Hypersonic Single Expansion Ramp Nozzle of a Hypersonic Aircraft through Parametric Studies


College of Engineering, Design and Physical Sciences, Brunel University London, London UB8 3PH, UK
*
Author to whom correspondence should be addressed.
Energies 2018, 11(12), 3449; https://doi.org/10.3390/en11123449
Submission received: 26 September 2018
/
Revised: 3 December 2018
/
Accepted: 7 December 2018
/
Published: 10 December 2018
Abstract
:This paper aims to contribute to developing a potential combined cycle air-breathing engine integrated into an aircraft design, capable of performing flight profiles on a commercial scale. This study specifically focuses on the single expansion ramp nozzle (SERN) and aircraft-engine integration with an emphasis on the combined cycle engine integration into the conceptual aircraft design. A parametric study using computational fluid dynamics (CFD) have been employed to analyze the sensitivity of the SERN’s performance parameters with changing geometry and operating conditions. The SERN adapted to the different operating conditions and was able to retain its performance throughout the altitude simulated. The expansion ramp shape, angle, exit area, and cowl shape influenced the thrust substantially. The internal nozzle expansion and expansion ramp had a significant effect on the lift and moment performance. An optimized SERN was assembled into a scramjet and was subject to various nozzle inflow conditions, to which combustion flow from twin strut injectors produced the best thrust performance. Side fence studies observed longer and diverging side fences to produce extra thrust compared to small and straight fences.
1. Introduction
Hypersonic flight is considered the next great advancement within the aviation industry. In recent years there has been an increase in demand for commercial supersonic and hypersonic travel as aerospace companies have been looking to replace long haul subsonic flights with hypersonic aircraft designs that could be economically and environmentally viable. More aerospace companies are investing in new engine technologies and developing concept aircraft designs capable of supersonic and hypersonic travel. Even though this has been investigated for over half a century, there have been only few breakthroughs which have made hypersonic flight available on a commercial level. This is mainly due to the challenges ranging from structural demands, fuel economy, maintenance issues, direct operating costs, and supersonic combustion.
The most successful supersonic commercial airliner was the Concorde which cruised at Mach 2. Concorde’s retirement in 2003 was a combination of inflated fuel prices and the infamous accident in which 113 people lost their lives. The loss of confidence in the safety of the aircraft was the same reason for the Tupolev Tu-144’s early retirement, the only other commercial supersonic aircraft equivalent to the Concorde.
Hypersonic vehicles have been around for several decades but have never been utilized for commercial aviation. Rocket-powered vehicles were the main bearers of hypersonic flight as, they would propel vehicles beyond the atmosphere and exploit gravity to re-enter the atmosphere, achieving phenomenal speeds of up to Mach 36. The V-2 rocket, designed by Germany, flew at five times the speed of sound, the first vehicle to be considered hypersonic. Other vehicles to have flown at hypersonic speeds are intercontinental ballistic missiles, Apollo space capsules, the space shuttle, and the experimental X-planes [1]. There has never been a hypersonic commercial aircraft manufactured despite these vehicles exceeding Mach 5.
Though this being the case, numerous experimental unmanned aircraft have attempted and achieved hypersonic speed by various means of propulsion, making hypersonic flight of Mach 5 and above a reality.
Air-breathing hypersonic propulsion can help put aircrafts into orbit or sustain flight within the atmosphere with lower weight and propulsion required compared to rockets, as the oxidizer (air) is taken from the environment as opposed to being carried onboard. Hypersonic air-breathing commercial flight will potentially offer great advancements in reliability, reusability, and economies of scale for high-speed atmospheric cruising. These proposed vehicles and methods of propulsion remove the need to carry oxidizers and other limitations which rocket engines incur and increase the possibility of achieving the desired range, payload, and efficiency [2].
Several air-breathing propulsion methods like turbojet, turbofan, ramjets, and scramjets have been adopted in the past to utilize high-speed air-breathing flight. The limitations observed within the turbojet are that the maximum rotational speed of the rotor and the maximum temperature of the gases in front of the turbine affect the durability of the turbine blades. Consequently, engine reliability is risked during operation and the flight speed is limited [3].
Ramjet and sramjet engines utilize the “ram” effect, by exploiting the high speeds and dynamic air pressure to compress the intake air, and thus, avoid the need for rotational components [4]. In addition, ramjets can only produce thrust when the vehicle is moving, meaning other propulsion systems are necessary to accelerate the vehicle to a speed where the ramjet becomes operable (Mach 2.5–3) [5,6,7].
The scramjet (supersonic combustion ramjet) is a variant of the ramjet engine and similarly relies on the vehicle’s speed to compress the air prior to combustion. Scramjets are usually utilized at Mach 5 and above because of the ramjet’s inability to overcome the drag at Mach 5 (Figure 1). In scramjets, the airflow remains supersonic as it passes through the engine including the combustor, whereas in the ramjet, flow is decelerated to subsonic velocity for combustion. A scramjet operates efficiently at hypersonic speeds and allows for supersonic combustion by compressing the incoming airflow without decelerating it below Mach 1. Although, a number of research tests have been performed on scramjets, there is still a long way to go for this technology to be commercialized [7,8]. A typical scramjet consists of a converging inlet, isolator, combustion chamber, and a diverging nozzle. The basic schematic and the combustion process in a scramjet engine are described in detail by Neill and Pesyridis [4].
Air-breathing hypersonic vehicles require a scramjet system in a combined-cycle propulsion architecture that also involves conventional gas turbines and ramjets. The reason for this is that each engine can operate within a different flight speed regime and all three are required for successful operation at hypersonic speeds [2].
1.1. SERN
The single expansion ramp nozzle (SERN) is an essential component for air-breathing hypersonic vehicles to achieve maximum thrust. The SERN is an essential component of the scramjet engine due to its qualities of minimizing weight and frictional drag while producing substantial thrust from high-pressure flow, reflected in its roles in the X-43 vehicle. The SERN operates by only having the gas pressure working on one side, unlike the traditional, axial symmetric nozzles [9]. Single expansion ramp nozzles can be comparable to a single-sided aerospike engine due to its single expansion ramp. Successful hypersonic flights have incorporated the SERN into the scramjet engine such as the X-43. More advanced nozzles are utilized at high speeds and are blended into the airframe which can reduce weight at large expansion ratios, reduce drag, controllability with thrust vectoring, and improve reliability [10]. The SERN shows self-adaptability at off-design conditions by managing the changing static pressure over a range of Mach numbers. This adaptability reduces the need to vary the exit area over different operating conditions.
The SERN internal thrust is virtually unaffected by external flow if the pressure ratio remains high but at low-pressure ratios, the nozzle flow field is strongly influenced by external flow [11]. The expansion ramp is one with the aircraft fuselage, producing complex problems such as limited thrust vectoring controlled by throttling. This requires more control of elevators and complex control systems. In addition, flow leakage and cooling are issues. However, integrating the SERN into the airframe reduces the drag of the propulsion system [12]. Single expansion ramp nozzles tend to be more efficient than conical nozzles and produce less drag as the bottom surface is non-existent. Divergence loss needs to be considered within the SERN design. Larger angles of divergence will increase the flow speed due to the production of expansion fans but the streamlines at the nozzle exit will be at different angles relative to the flight path [8].
This paper aims to analyze the performance of a SERN for a scramjet engine and to optimize its performance and integrate the refined design into a scramjet engine. This scramjet engine will be constructed into a combined cycle engine design to be integrated with an aircraft. The paper will provide insight into performance characteristics of SERN, scramjets, and integration techniques of an aircraft and engine through 2D and 3D computational fluid dynamics (CFD) analysis.
1.2. SERN Analysis
Wind tunnel experiments have investigated SERN’s performance at different altitudes and speeds capturing data through pressure measurements and Schlieren photographs [9,13,14]. Replicating the experimental data and hypersonic phenomena in CFD is complex and challenging as it has to combine all the variables of external and nozzle flow.
Numerical modelling studies of SERN’s have been conducted in Reynolds-Averaged Navier-Stokes (RANS) for various geometry configurations and operating conditions using a variety of models. Reduced order CFD is accurate in predicting plume and flow features such as expansion fans but lacks accuracy in modelling boundary layers [15,16].
Single expansion ramp nozzles have been researched thoroughly including interaction between the nozzle exhaust and external flow [17]. Data mining studies have highlighted the rarity of optimizing the SERN geometry based on sensitivity analysis to highlight the design variables which have minimal impact on improving optimization efficiency. The length of the inner nozzle, cowl expansion, and expansion ramp have a significant influence on thrust and lift [18]. FLUENT was used to investigate SERN divergent angles, length, area ratios, cowl angles, and scramjet nozzle performance [19], and another study investigated ramp angles and side fence influence [20]. The nozzle thrust augmentation [21] and the aforementioned CFD investigations utilized the two equation turbulence models of either K-ϵ or shear stress transport (SST) K-ω due to the robustness and accuracy in modelling high-speed exhaust flows. A few complicating factors in analyzing hypersonic air-breathing nozzles are continuing chemical reactions, flow separation, flow unsteadiness, and cooling, which are similar parameters analyzed in rocket nozzles. Computational fluid dynamics RANS codes have developed into robust, high-fidelity models which are capable of numerically simulating the complex flow characteristics of hypersonic flows [22,23,24].
2. Methodology
2.1. Geometry
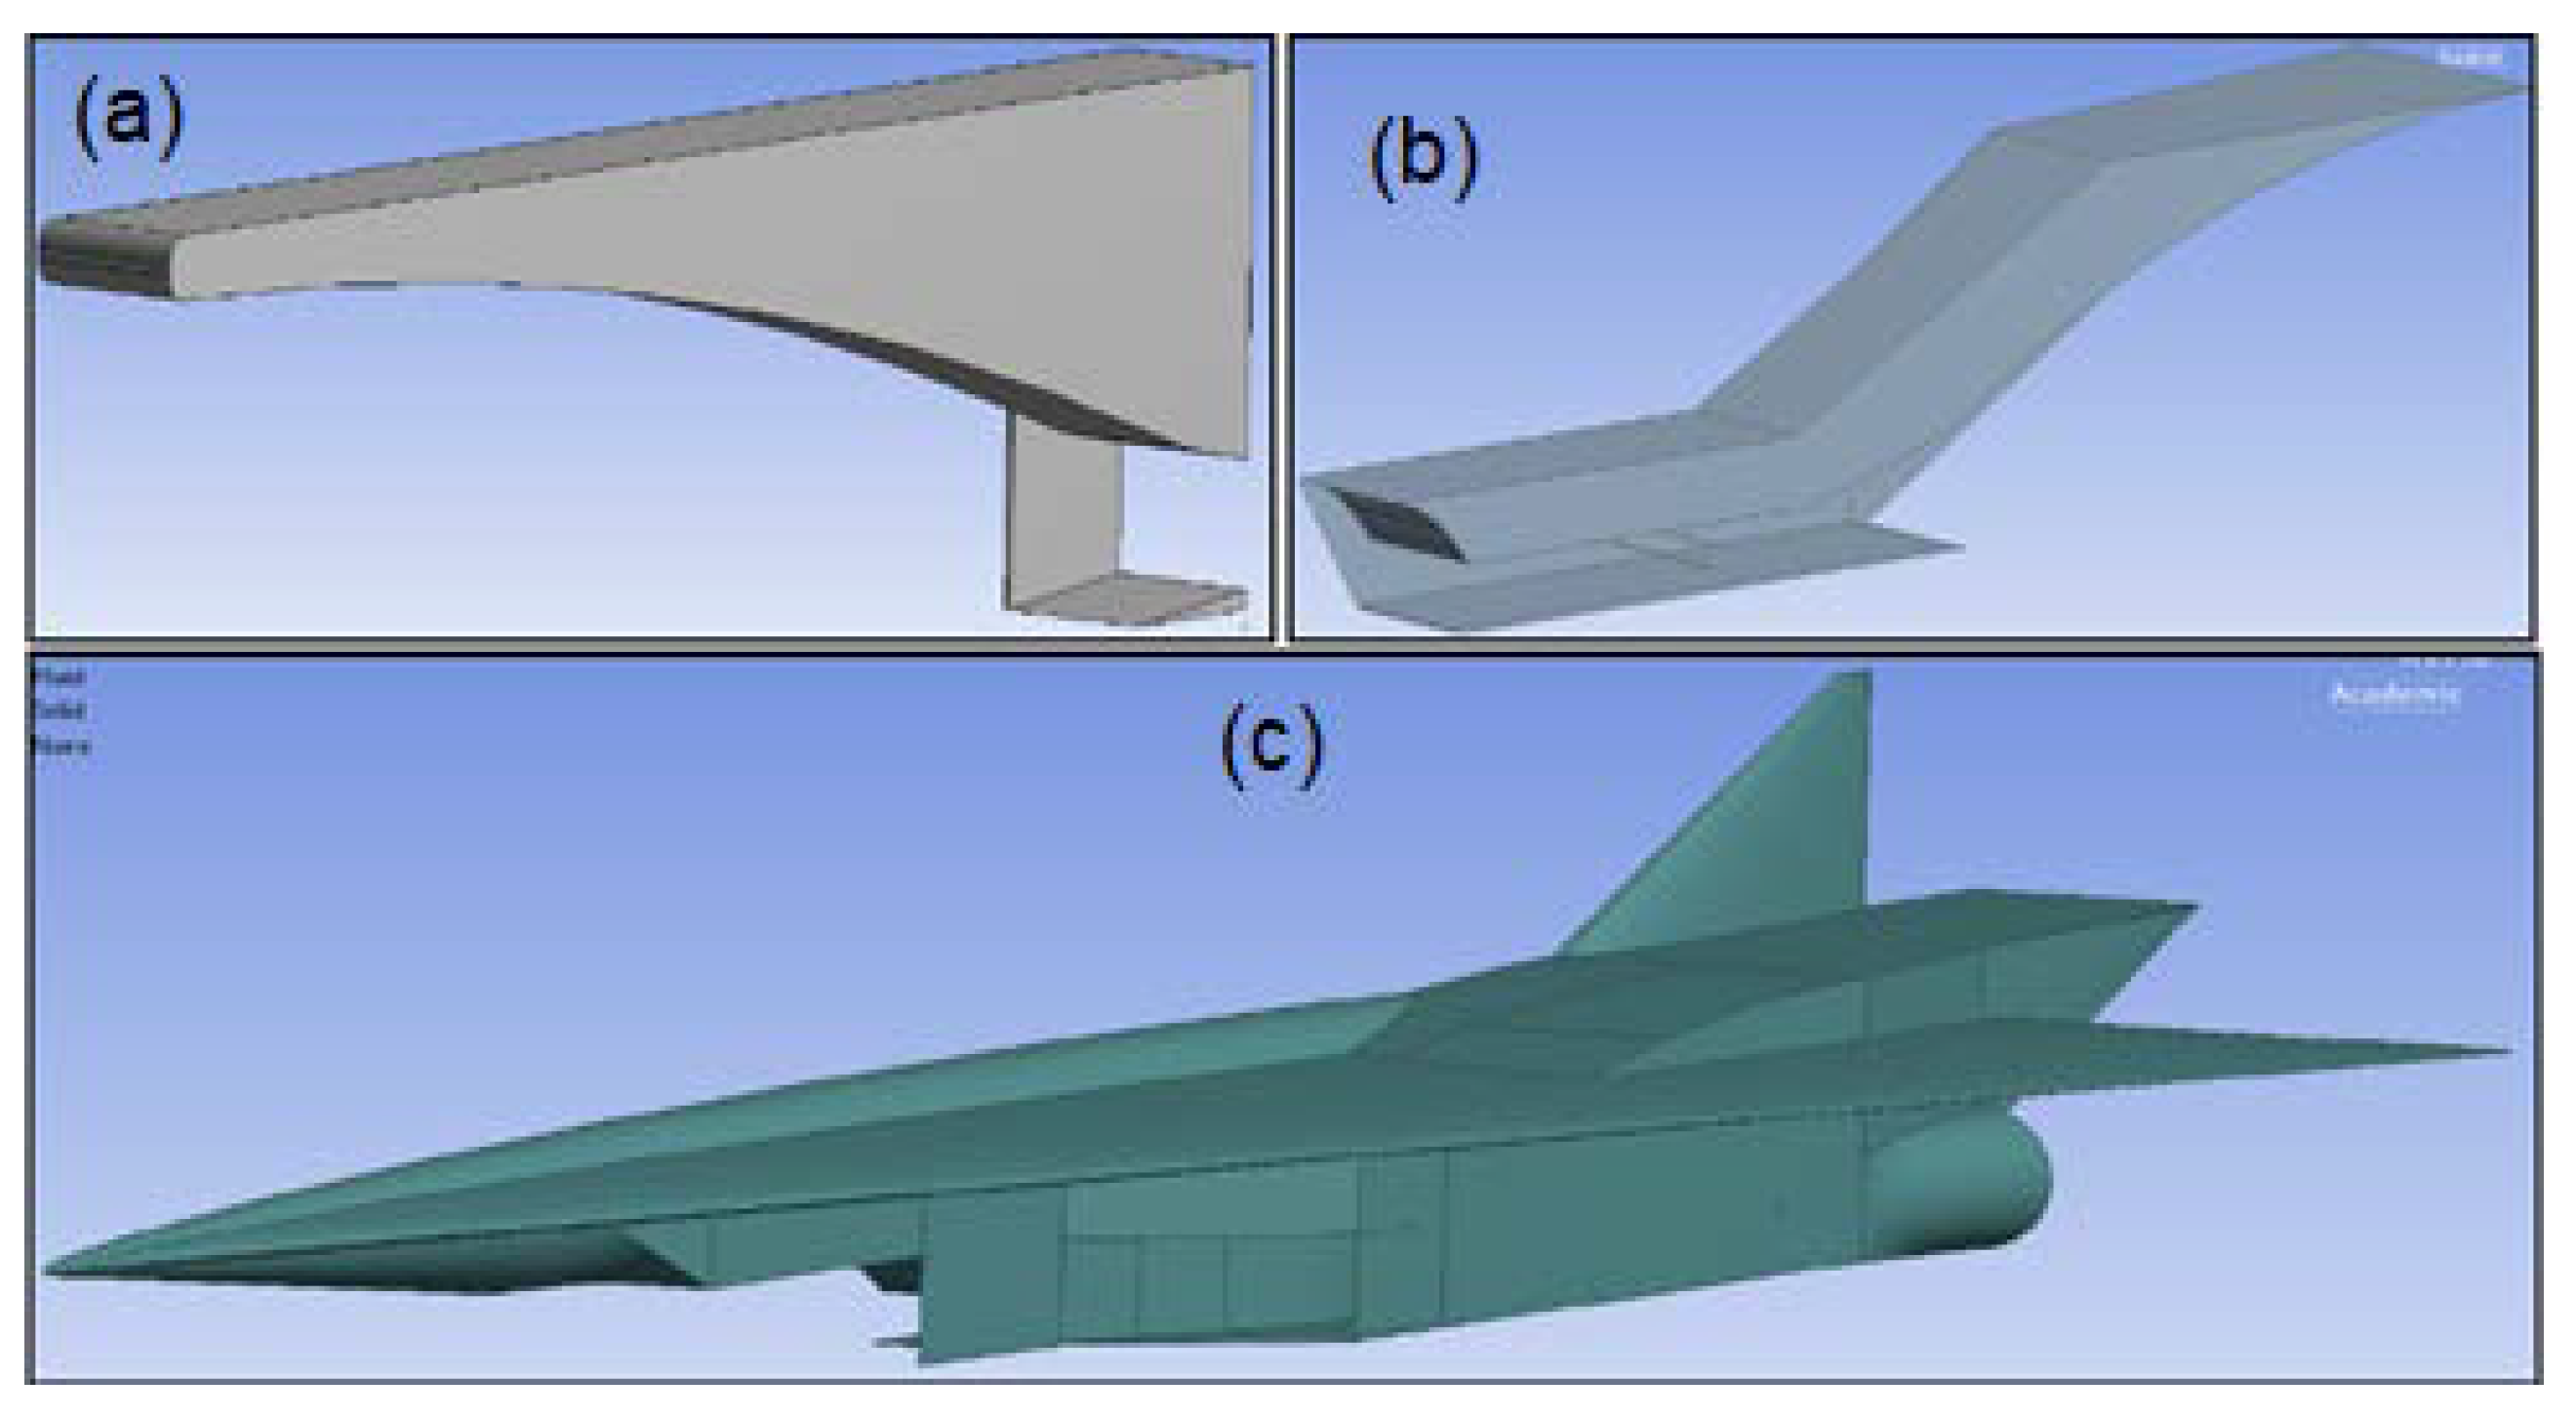
The 2D geometry for the scramjet nozzle, scramjet engine, and the integrated aircraft and combined cycle engine was created using ANSYS design modeler (Figure 2).
A parametric analysis of the single expansion ramp nozzle was performed at various operating conditions. Table 1 shows the different geometric parameters and the corresponding values analyzed. The final design will be selected based on the thrust capabilities of the nozzle. All the geometry components parameterized were changed simultaneously rather than one component being investigated individually, as this will help to understand its effect on the SERN performance. Cowl length was not varied as the design objective was to use the minimum amount of material as possible for lower drag and hence the shortest length was opted.
The 3D geometry of the nozzle was also developed using ANSYS Design Modeler and the geometries for the scramjet engine and the integrated aircraft and combined cycle engine was created using Solidworks (Figure 3). Periodic boundary conditions were employed to all the geometries, to improve the computational efficiency.
2.2. Mesh
Figure 4 shows the 2D mesh for the nozzle, scramjet engine, and integrated aircraft and scramjet engine. The specifications of the 2D mesh employed is described in Table 2. Each mesh underwent mesh refinement and convergence studies. The mesh for the nozzle parametric studies was setup to ensure that the mesh adapted to each change in geometry. The 2D mesh did not reduce the orthogonal quality below 0.1 and the skewness remained minimal, facilitating accurate results for each geometry. Edges were blended to ensure the mesh quality was not degraded through sharp edges.
Proximity and curvature meshing technique was applied to ensure that the 3D mesh was of high quality between the walls and the curved surface of the expansion ramp. Inflation layers were added along the walls of the nozzle to capture the flow at the boundary layer accurately. The 3D mesh for the different components is shown in Figure 5 and the mesh statistics are described in Table 3.
2.3. Numerical Methodology
The 2D and 3D CFD analysis of the compressible flow was performed using the Reynolds Averaged Navier–Stokes equation. The use of the RANS equations was found to produce accurate results for the performance analysis of hypersonic propulsion components and systems [9,25,26,27,28]. Density-based coupled solver was utilized as this will provide strong couplings between density, energy, momentum, and species present in hypersonic flow.
The shear-stress transport (SST) k-ω model was chosen over the standard model as it uses a blended function to activate the k-ω model for the near wall region and the k-ϵ model for flow away from surfaces. The energy equation was applied to ensure that the aerodynamic heating at hypersonic speeds is accounted for and the heat produced from combustion is accurately modelled. An implicit approach was used for the solution of the governing equations with the Roe-flux difference splitting for calculating the convective flux. The flow, turbulent kinetic energy, and turbulent dissipation were set as second order upwind to obtain more accurate solutions. Single step, volumetric reactions and finite rate reaction for the turbulence-chemistry interaction were enabled with the hydrogen-air mixture (H2 + O2), to model the scramjet combustion.
Table 4 describes the boundary conditions for computational analysis and Table 5 describes the input parameters for the nozzle inlet condition. Two-dimensional parametric studies of the scramjet nozzle geometry with different freestream (FS) conditions representing different stages of the flight profile and the expected nozzle inlet (NI) conditions at these stages were investigated. The input parameters were obtained through analyzing different literature (discussed in the Introduction) which conducted experimental and computational studies, where suitable values were established for the input parameters at certain operating conditions. A parametric analysis of the scramjet nozzle geometries was performed to arrive at a parametrically optimum design.
2.4. Computational and Experimental Validation of Numerical Methodology
The numerical methodology adopted in this study was first validated against the SERN results of Huang et al. [18] and Monta [29]. Huang et al. [18] explored the SERN design through parametric studies which was then validated against experimental results by Monta [29]. The major differences in the numerical methodology of Huang et al. [18] from the present study was the application of the Re-Normalisation Group (RNG) k-ε turbulent model with non-equilibrium wall functions, the advection upstream splitting method (AUSM), adiabatic walls, and a constant courant number within the solver.
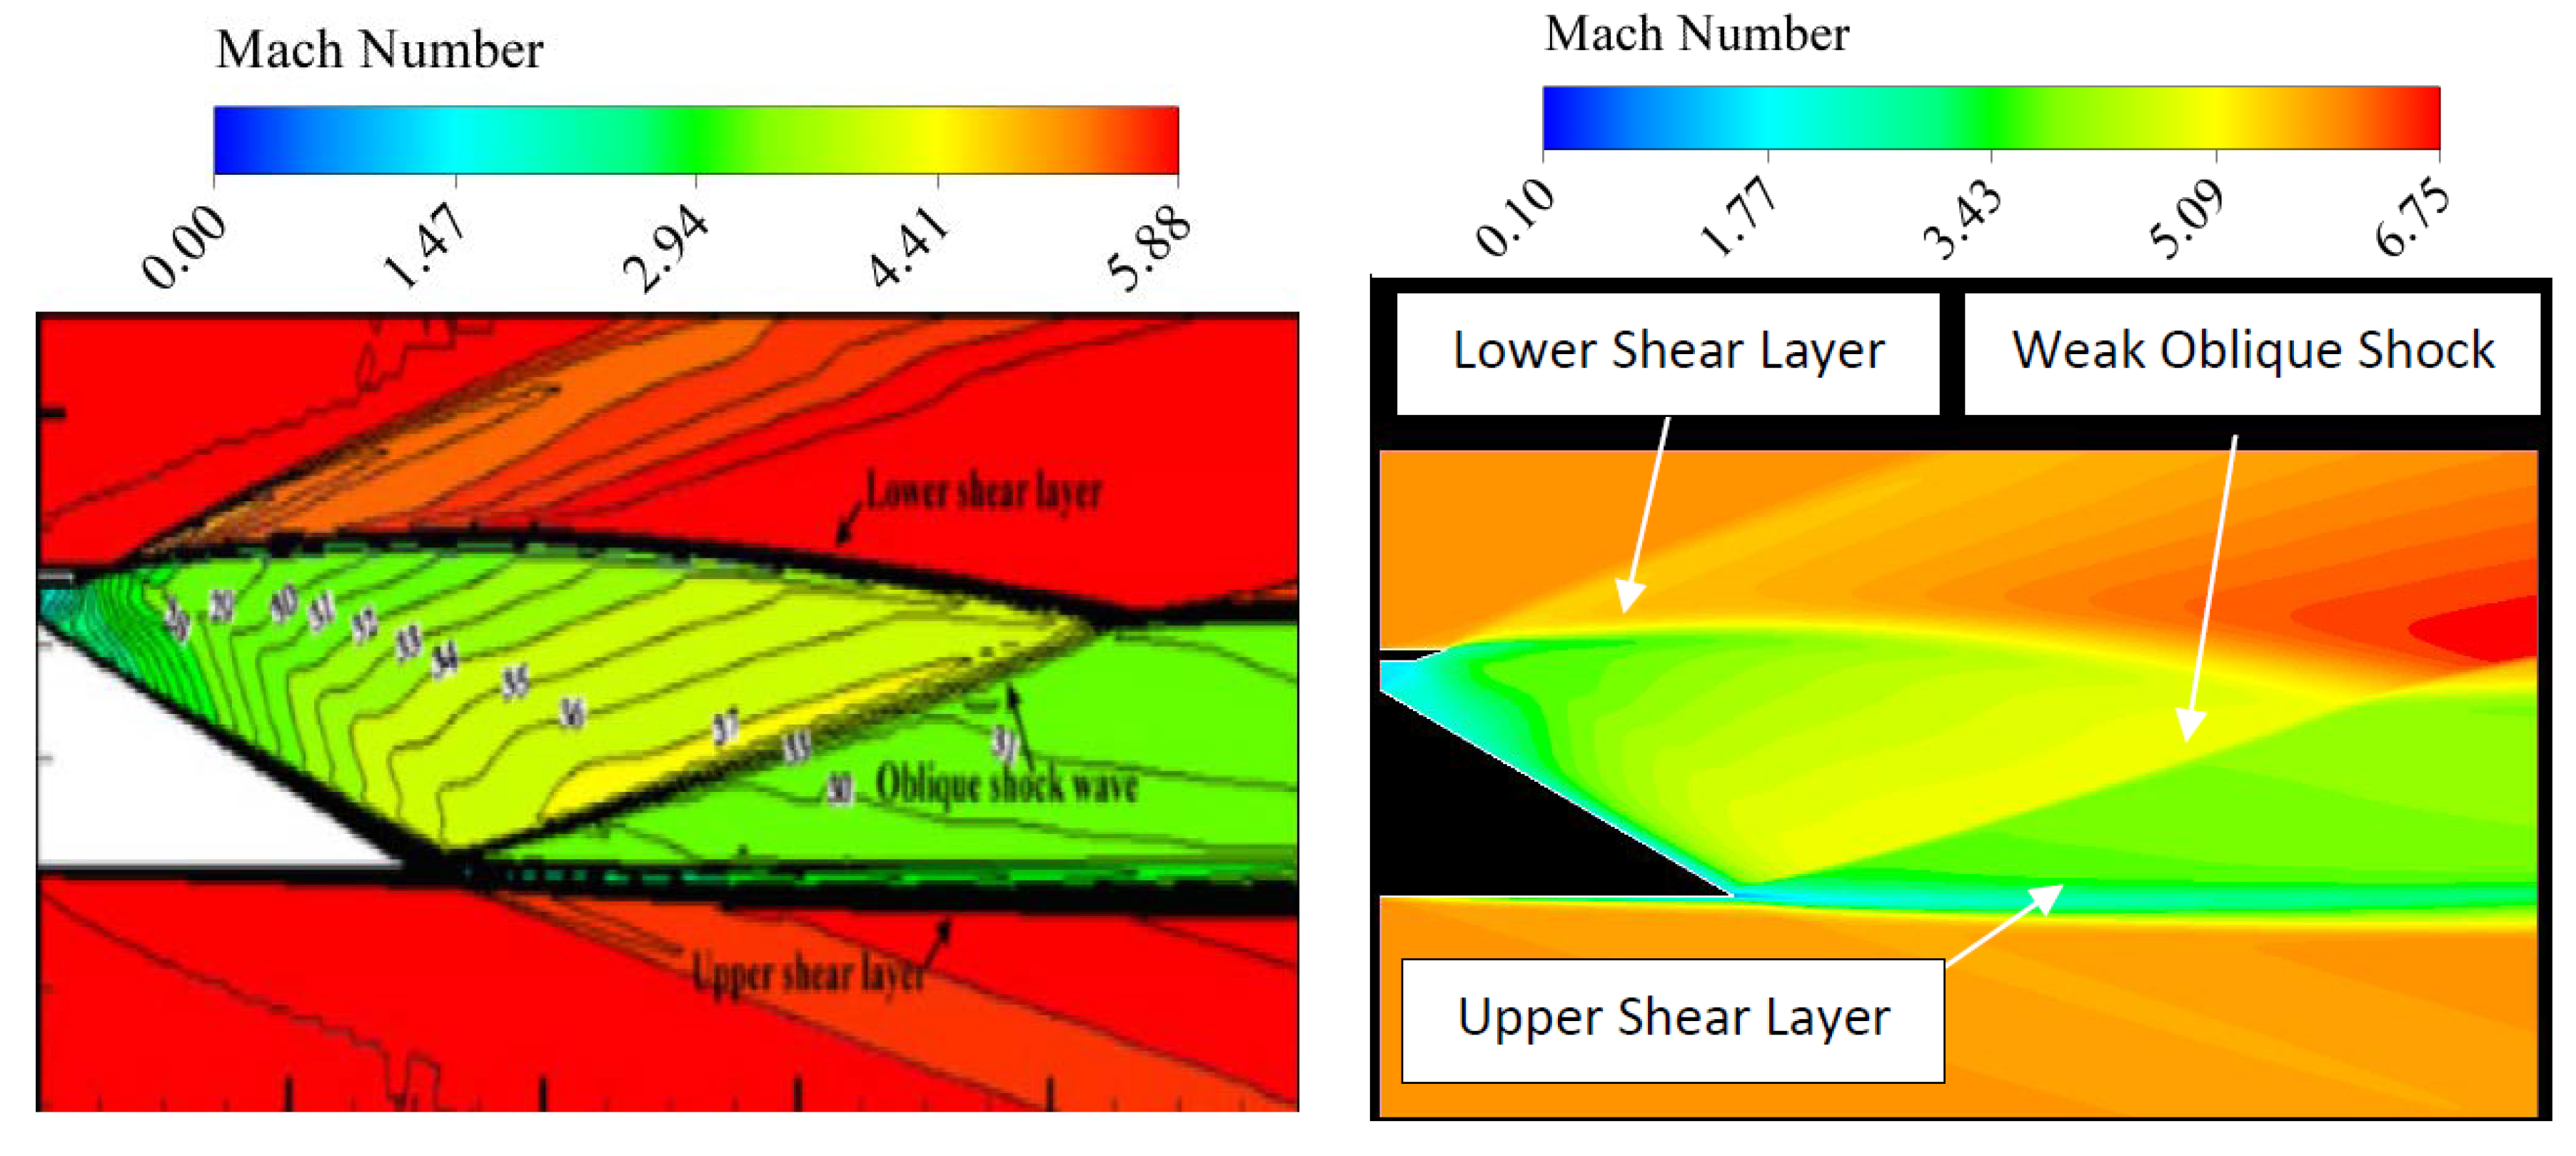
Figure 6 and Figure 7 compare the flow field obtained in the present analysis with that of Huang et al. [18]. The flow field contours of the expansion fan region between the inner nozzle cowl transition points were compared. It can be observed that the upper and lower shear layers are accurately replicated in the present analysis. The weak oblique shock wave forms at the same location and deflects at the same angle from the upper shear layer down to the lower shear layer. As expected, the velocity behind the oblique shock wave decreases and causes the direction of the lower shear layer to vary from being parallel to slightly inclined towards the upper wall of the afterbody. Similar to Huang et al. [18] findings, the lower shear layer was near parallel to the upper shear layer and the external flow round the nozzle was completely developed. The flow features illustrated in each case have a near perfect resemblance to one another except for the differences in the scale values, varying slightly due to the difference in the range specified. It should be noted that, the scales in Huang et al.’s [18] contour plots did not show the maximum value, making complete quantitative validation difficult from the contour plots.
Figure 8 shows the comparison of the pressure distribution behind the normal shock wave with the experimental data. The pressure distribution at a horizontal distance of 0.1143 m was obtained by calculating the pitot pressure. The results provided good agreement with the computational and experimental results of Huang et al. [18] and Monta [29].
3. Results and Discussion
A 2D parametric study of the SERN was performed at three different operating conditions; 80,000 ft., 90,000 ft., and 100,000 ft. This sensitivity analysis will determine which geometrical parameters of the SERN have the most significant impact on the performance parameters. In total, 470 different SERN geometries were successfully tested for the three operating conditions and two nozzle inlet conditions, totaling 2820 cases overall.
3.1. SERN Selection Justifications
The corrected axial thrust was the focal performance parameter on which the SERN design was selected. Maximum thrust was identified as the most important performance parameter because the required thrust for the final aircraft and integrated combined cycle engine design was unknown for Mach 8 cruise conditions. Axial thrust was calculated with a correction factor applied relating to the expansion ramp divergence angle. The nozzle axial thrust (Fa), ideal thrust (Fi), correction factor (λ), nozzle divergence coefficient (Cθ), and net thrust (Fn) were calculated using the following equations:
3.1.1. Effect of Operating Conditions and Nozzle Inlet Conditions on SERN Expansion
Table 6 shows the SERN geometries tested at BCC 1.1. The SERN geometries were analyzed for different conditions with the objective to achieve perfect expansion and to maximize the nozzle efficiency. Only in BCC 1.1 configuration does the nozzle achieve near to perfect expansion. However, the axial thrust production in these SERNs are in the lowest 10%.
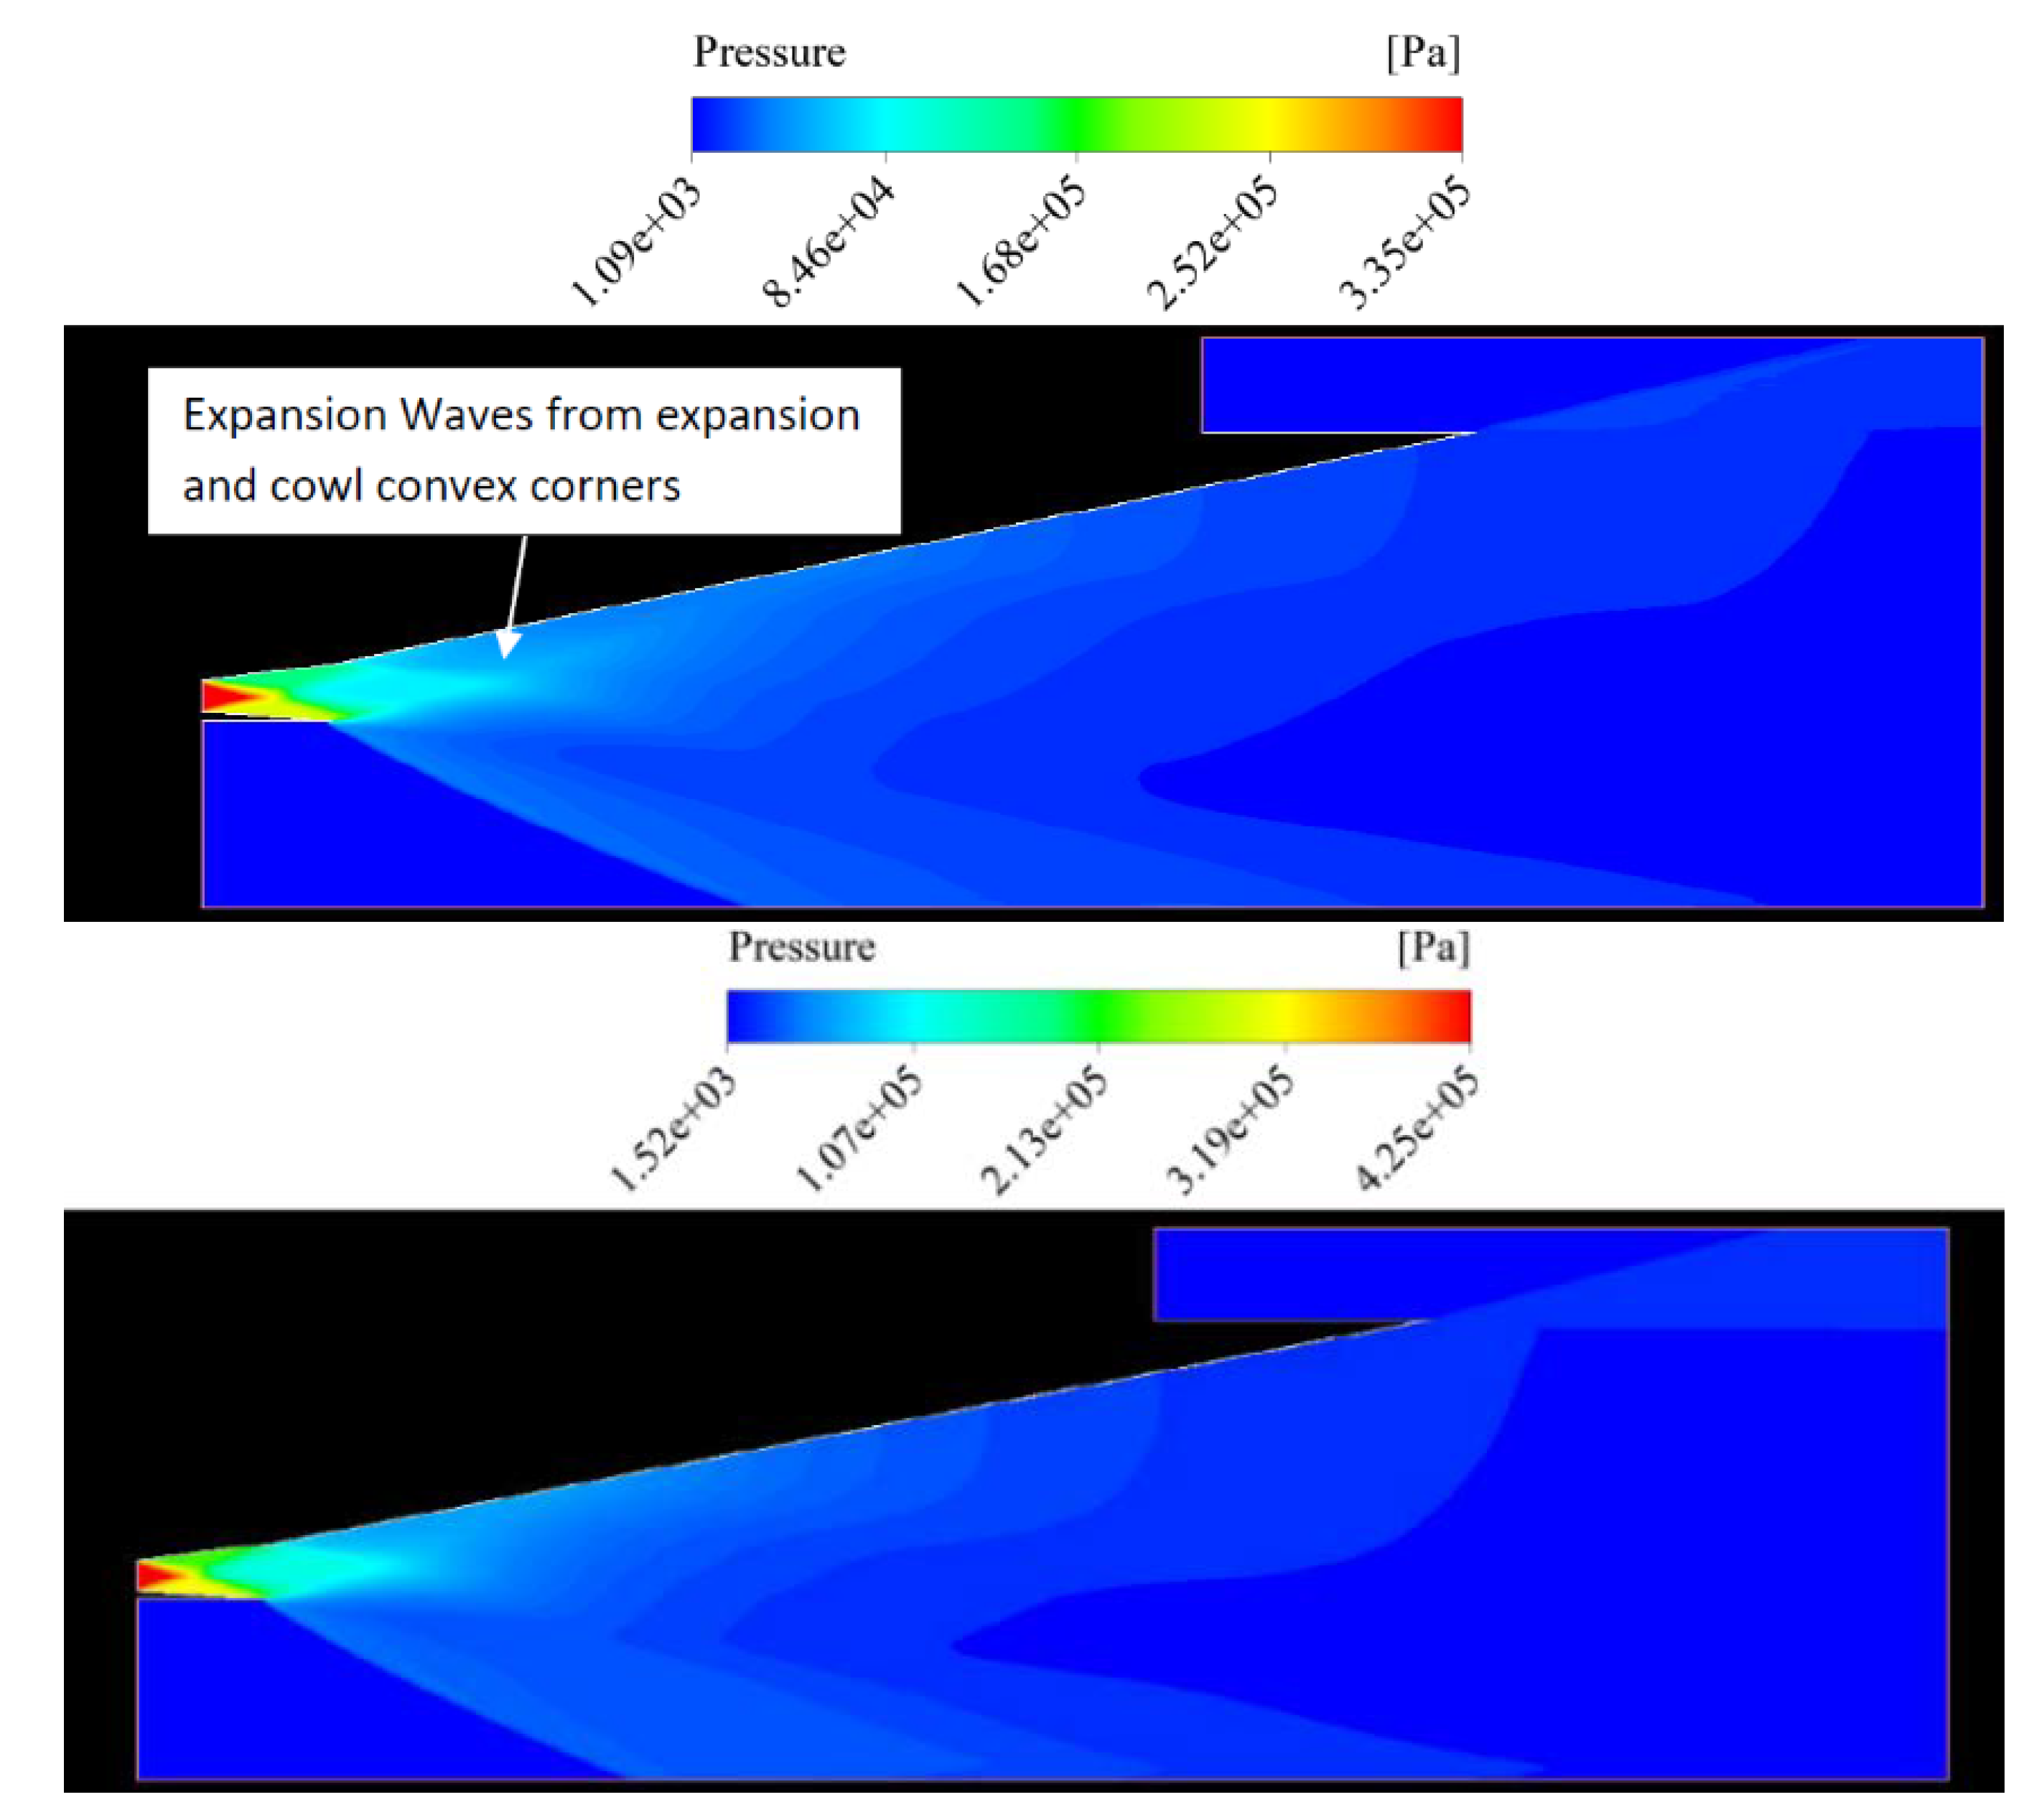
The pressure contours in Figure 9 shows the DP351 nozzle performance at 80,000 and 100,000 feet. The higher nozzle pressures are associated with the lower ambient pressures which is the character of an air-breathing engine. The comparatively similar pressure distribution proves its adaptability to altitude. This can be attributed to the shear layers downstream of the SERN making it insensitive to the pressure change with altitude.
Table 6 suggests that the expansion ramp radius (P3) is an important geometric factor in achieving perfect expansion. With the radius at 5000 m, the expansion ramp becomes a conical nozzle. An initial expansion ramp angle of 10° and an initial conical length of 3.2 m establishes conditions in which the expansion is favorable to achieve perfect expansion. The expansion ramp length does not have a significant effect for the chosen geometric values. Any length, shorter than 30 m may encourage significant under-expansion. The lack of a lower surface beneath the expansion ramp length has an effect on the type of expansion. The lower surface expansion takes place much earlier compared to the expansion ramp. In the boundary conditions investigated, under-expansion is present from the cowl surface until the freestream directs the flow back towards the nozzle exhaust plume, occurring in cases of higher ambient pressure and lower nozzle inlet speeds and pressure.
The near perfect expansion was observed for a nozzle area ratio of 9.3. These nozzle area ratios are large in comparison, and therefore, the SERNs tend to be larger and heavier. Considering the low axial thrust produced and the larger size and weight, these nozzles were not favored for optimum SERN geometries.
Single expansion ramp nozzle DP351 Mach contour flow field for BCC 1.1 and 3.2 in Figure 10 demonstrates the near perfect expansion on the upper shear layer of the exhaust plume. A weak oblique shock wave is observed just below the upper shear layer where the Mach number suddenly decreases. The internal cowl expansion has slight under-expansion initially, but due to the external flow effects, it is made to over-expand as it travels further downstream. Boundary condition BCC 3.2 shows that the lower ambient pressure, the high Mach number, and pressure at the nozzle inlet induce significant under-expansion from the internal cowl and external expansion ramp nozzle, which both cause shock waves due to the outward turning jet flow interacting with the external flow. Although, achieving near perfect expansion would result in reduction of thrust performance, it is unlikely to achieve anywhere near perfect expansion at 100,000 ft. because of the extremely low ambient pressure. Increasing exit height, initial expansion angle, and cowl angles for both operating conditions would increase the likelihood of achieving perfect expansion, but this would encourage more divergence losses and a further decrease in thrust performance.
The operating conditions do not have significant effects on the majority of performance parameters at higher altitudes and different Mach, which is confirmed by Ogawa and Boyce [30]. The adaptability of the nozzle with changing ambient conditions make it robust throughout the hypersonic flight profile.
3.1.2. Effect of SERN Geometry on Axial Thrust
The effects of varying upper ramp length (P6) on the nozzle internal and propulsive performance is significant. Increasing the length of the upper expansion ramp has a tendency to decrease the thrust. The optimal expansion ramp length in regard to achieving maximum thrust, in this case, is 30 m. Comparing the maximum axial thrust at expansion ramp length of 30 m and 40 m shows that the SERN geometries differ extensively overall. Therefore, as the length of the upper expansion ramp changes, other geometrical parameters of the SERN differ when trying to achieve maximum thrust. The SERN geometries in Table 7 are for 30 m and 40 m expansion ramp length, which yield the maximum axial thrust for all BCCs. In the top 10% of axial thrust, 98% of the SERN geometries have an expansion ramp length of 30 m, and hence, is considered as the optimum length.
The expansion ramp radius confirms SERN geometries with larger contoured expansion ramp and a smaller initial expansion angle after a short conical section produces the greatest axial thrust. The more extreme contoured expansion ramps allow for the flow to expand faster within the external section of the SERN.
However, it is not so extreme that flow separation occurs as the pressure expands into this vacant area of air. The large initial expansion angle of the smaller radius contours mean nearer the trailing edge of the expansion ramp, and the divergence angle is smaller, levelling off horizontally more gradually allowing for less flow divergence, maximizing axial thrust. The conical and larger radius contoured expansion ramps have a larger divergence angle at the end of the nozzle subsequently inheriting more losses. In the top 10% of the axial thrust, 77% of the initial expansion ramp angles were 10°, indicating that the shallower initial expansion ramp angle or angles below 30° produce better axial thrust results. An ideal contour radius value for axial thrust is not reasonable, as a contour radius of the same value do not necessarily adopt the same shape due to dependencies on other geometrical parameters such as nozzle length, initial conical length, initial expansion ramp angle, and exit area. However, amplified contoured expansion ramp shapes with small initial expansion angles (P5) generate greater axial thrust. The contoured expansion ramp surfaces that were exposed to higher wall pressures assisted in achieving higher axial thrust.
Again, an optimum value or range for the initial conical length (P4) of the expansion ramp cannot be determined. The initial conical expansion ramp length of 1.6 m is part of the DP102 geometry conversely, only 53% of the SERN geometries in the top 10% incorporated this dimension, showing an absence of an optimum value between 1.6 m and 3.2 m.
The effects of the cowl divergence angle were momentous in the expansion of the exhaust plume, and in turn effected the losses experienced in the internal section of the nozzle. However, axial thrust did not have a trend for the two angles of 5.72° and 33°. The shape of the cowl was diverse between these angles and had a significant effect on the aero-propulsive performance. The 5.72° cowl angle began from the nozzle inlet. Similarly, the internal expansion with the cowl angle at 33° was slower due to the cowl being horizontal for a large portion of its length, with the 33° convex corner near the end of the cowl. Figure 11 displays DP102 and DP464 which have near identical geometry, excluding cowl angles.
Cowl angle 5.72° subsequently has a less under-expanded shear layer compared to the cowl angle at 33°. The nozzle inlet profile presents slight differences in the downstream flow, and therefore, axial thrust which slightly benefits the downstream velocity for cowl angles of 33°. The horizontal section of the cowl helps maximize the axial velocity and limits the divergence losses of the 33° cowl angle. Table 8 presents the maximum thrust for different nozzle area ratios tested in the parametric study.
The SERN exit height proved to be significant in achieving maximum thrust. However, determining the axial thrust through area ratio for the SERN is misleading as it does not establish a consistent relationship. The area ratio for the SERN does not behave as experienced in axisymmetric nozzles. A combination of inlet and exit height at 2 m and 9.3 m, respectively, were the dominant geometries in producing higher axial thrust as they were present in 93% of the geometries which were in the top 10% of axial thrust. The 9.3 m exit height allowed for more expansion of the exhaust flow to take place within the internal and external section of the SERN, maximizing the nozzle axial thrust capability. The difference in axial thrust was substantial with decreasing nozzle inlet height but the geometrical relationships behaved the same as the geometries were incredibly similar shapes.
In comparison to findings in Huang et al.’s [18] SERN geometry study, this challenges the conclusion that increasing the expansion ramp length improves thrust. The contoured 30-m expansion ramps can produce more thrust than the conical 40-m expansion ramps, prompting that increasing the expansion ramp length in conical SERNs greatly improves thrust but not necessarily for contoured SERNs. Ogawa and Boyce [30] observed parametrically optimum conical nozzles produced 0.2% and 2% less in thrust levels than optimum contoured nozzles in fuel-on and -off conditions; however, the DP102 contoured nozzle produced 10.68% more axial thrust than the parametrically optimum DP544 conical nozzle. The uniform inlet conditions exaggerate the performance compared to fuel-on and -off conditions. DP102 and DP544 thrust difference would be expected to be less in non-uniform flow. Despite this, thrust relationships observed between conical and contoured nozzles match Ogawa and Boyce’s [30] findings.
3.1.3. Effect of SERN Geometry on Drag
The effect of SERNs’ geometry on drag was analyzed by monitoring the coefficient of drag (Cd) at the SERNs’ inner walls. The drag was analyzed for BCC 3.1 considering drag will be paramount at the cruise speed of Mach 8. The elevated wall temperatures will amplify skin friction and thereby in drag. The expansion ramp had negligible impact on the drag performance. Contour radii that closely or fully resemble conical expansion ramps tend to increase drag. However, it does not necessarily mean they are the main contributor of drag. The initial expansion ramp length and angle govern the effect of drag produced by the SERN, with the cowl angle having a minor influence. The top 10% of SERN geometries producing the largest Cd all had an initial expansion ramp length of 3.2 m at an angle of 30° from the inlet. Figure 12 displays the DP279, DP690, and DP487 cases which had Cd values of 0.648, 0.328, and 0.065, respectively.
DP279 and DP690 confirm that the initial expansion ramp angle and length generated an expansion fan from the inlet and a weak oblique shock at the concave corner of the expansion ramp. The oblique shock introduced wave drag and decreased total pressure, which was detrimental to the scramjet performance. The expansion fan at the nozzle inlet and cowl angle increased the Mach number but this was thwarted by the oblique shock. The 33° cowl angle, compared to 5.72°, produced a thicker turbulent shear layer resulting in increased Cd. Compared to DP690, which had an initial expansion ramp of 1.6 m and initial expansion angle of 30°, the shorter initial expansion length generated the oblique shock earlier and the shock was deflected towards and reached the lower shear layer in a shorter distance, because of the larger concave angle, which destroyed the shock. This allowed for the flow behind the weak oblique shock to recover faster while producing less wave drag. The SERN geometries that yield the lowest Cd have common geometrical factors of a 10° initial expansion ramp, 5.72° cowl angle, and a convex corner before the conical or contoured ramp, producing expansion fans rather than shock waves.
3.1.4. Effect of SERN Geometry on Lift and Moments
As expected, the coefficient of lift (CL) and coefficient of moment (Cm) values are much greater when simulating the SERN at 100,000 feet and Mach 8. These performance parameters are coupled and the natural moments of SERN’s are to pitch downward when increasing in speed. At maximum CL, Cm is maximum but when lift fluctuates above and below zero, the moment becomes the inverse. The range of the CL and Cm when they become inversely proportional is from 0.05325 to −0.2004 for DP640 and −0.1803 to 0.0524 for DP52, respectively. Below 0.2004 for CL, the Cm yields negative moment values. In this region, for positive lift and negative moment, the common geometrical parameters are an initial expansion ramp angle of 30° and cowl angle of 5.72°. The opposite coupling observes the initial expansion ramp angle being 10° and the cowl angle is 33°. The initial expansion ramp length of 3.2 m, initial expansion ramp angle of 10°, and the cowl angle at 5.72° are present in all the geometries in the top 10% for CL and Cm. Figure 13 illustrates the pressure distribution for DP471, DP640, DP52, and DP205 (Minimum CL = −0.586).
DP471 and DP640 produced positive lift due to the axial flow profile at the nozzle inlet which provided higher pressures on the upper expansion ramp surface. DP640 induced a shock wave but its deflection was gradual compared to DP205. In relation to the upper surface, as it maintained higher pressure along the length of the expansion ramp a negative moment despite positive lift was instigated. DP52 and DP205 inlet flow profile exposed the cowl surface to higher pressures than the expansion ramp surface generating negative lift. DP52 and DP471 had a high-pressure region at the beginning of the expansion ramp but this reduced as it progresses towards the trailing edge, granting a positive moment. DP205 had an extremely high pressure at the expansion ramp surface due to the shock which helped maintain a high pressure along the entire expansion ramp length producing a maximum negative Cm of −2.12. These geometry components of the SERN significantly impacted the CL and Cm. The expansion ramp length and contour radius had a minimal effect in regard to the coefficient of lift as in the top 10% of lift coefficient values, 60% were 30 m. Maximum CL and Cm were 0.4851 and 0.6797 (DP471), achieved when the expansion ramp was 40 m but the maximum CL and Cm at expansion ramp length 30 m were 0.0037% and 0.0073% less, respectively.
3.1.5. SERN Selection
Figure 14 presents the SERN geometries which attained the optimal results in regard to Fa, Cd, CL, Cm, Cθ, and FN compared against DP102. These results were taken at BCC 3.1, the closest representation of cruise condition. Table 9 shows the SERN dimensions for each geometry analyzed. DP102 is superior for axial thrust while producing very little moment but at a higher drag and lower lift penalty. DP471 provided a considerable amount of lift at low drag; however, the lift and moment coupling meant an extremely large moment would be subject to the aircraft from the nozzle while generating a small amount of thrust. DP633 had the lowest moment with a positive lift force and sufficient thrust. Despite the promising performance in other areas, it created the most amount of drag of the selection. DP487 accomplished minimum drag and generated considerable amounts of lift. Consequently, a copious moment was generated, and a lack of axial thrust makes it unappealing. DP456 establishes high amounts of axial thrust with low drag and respectable lift. It is considered a good overall design, despite the large moment coefficient, which can be countered by the aircraft. All the SERN geometries have a relatively high divergence coefficient which indicates good nozzle designs. However, they are all below 0.96 meaning they may encounter issues with separation.
The SERN DP102 (Table 10) produced the highest axial thrust compared to all other SERN geometries at each BCC showing the robustness and adaptability of DP102. Therefore, the complication of variable nozzle geometry can be excluded from the SERN design. The axial thrust of SERN DP102 significantly increases as the nozzle inlet Mach number increases and pressure decreases, showing the substantial increase in Mach at the inlet is enough to compensate for the decreased pressure for uniform inlet conditions. The best SERN geometry is DP102 for achieving maximum axial thrust in each BCC apart from the erroneous BCC 1.1 results, where it was ranked third. However, initial integration evaluations judged that the 9.3-m exit height of DP102 would degrade performance of the entire aircraft due to the SERN upper surface being approximately 2 m above the airframe. Therefore, the SERN which obtained the best axial thrust and overall performance with an exit height of 7.3 m was selected. Consequently, DP456 was chosen to be analyzed further.
3.2. SERN Parametric Studies—SERN DP102 and DP456 Comparison
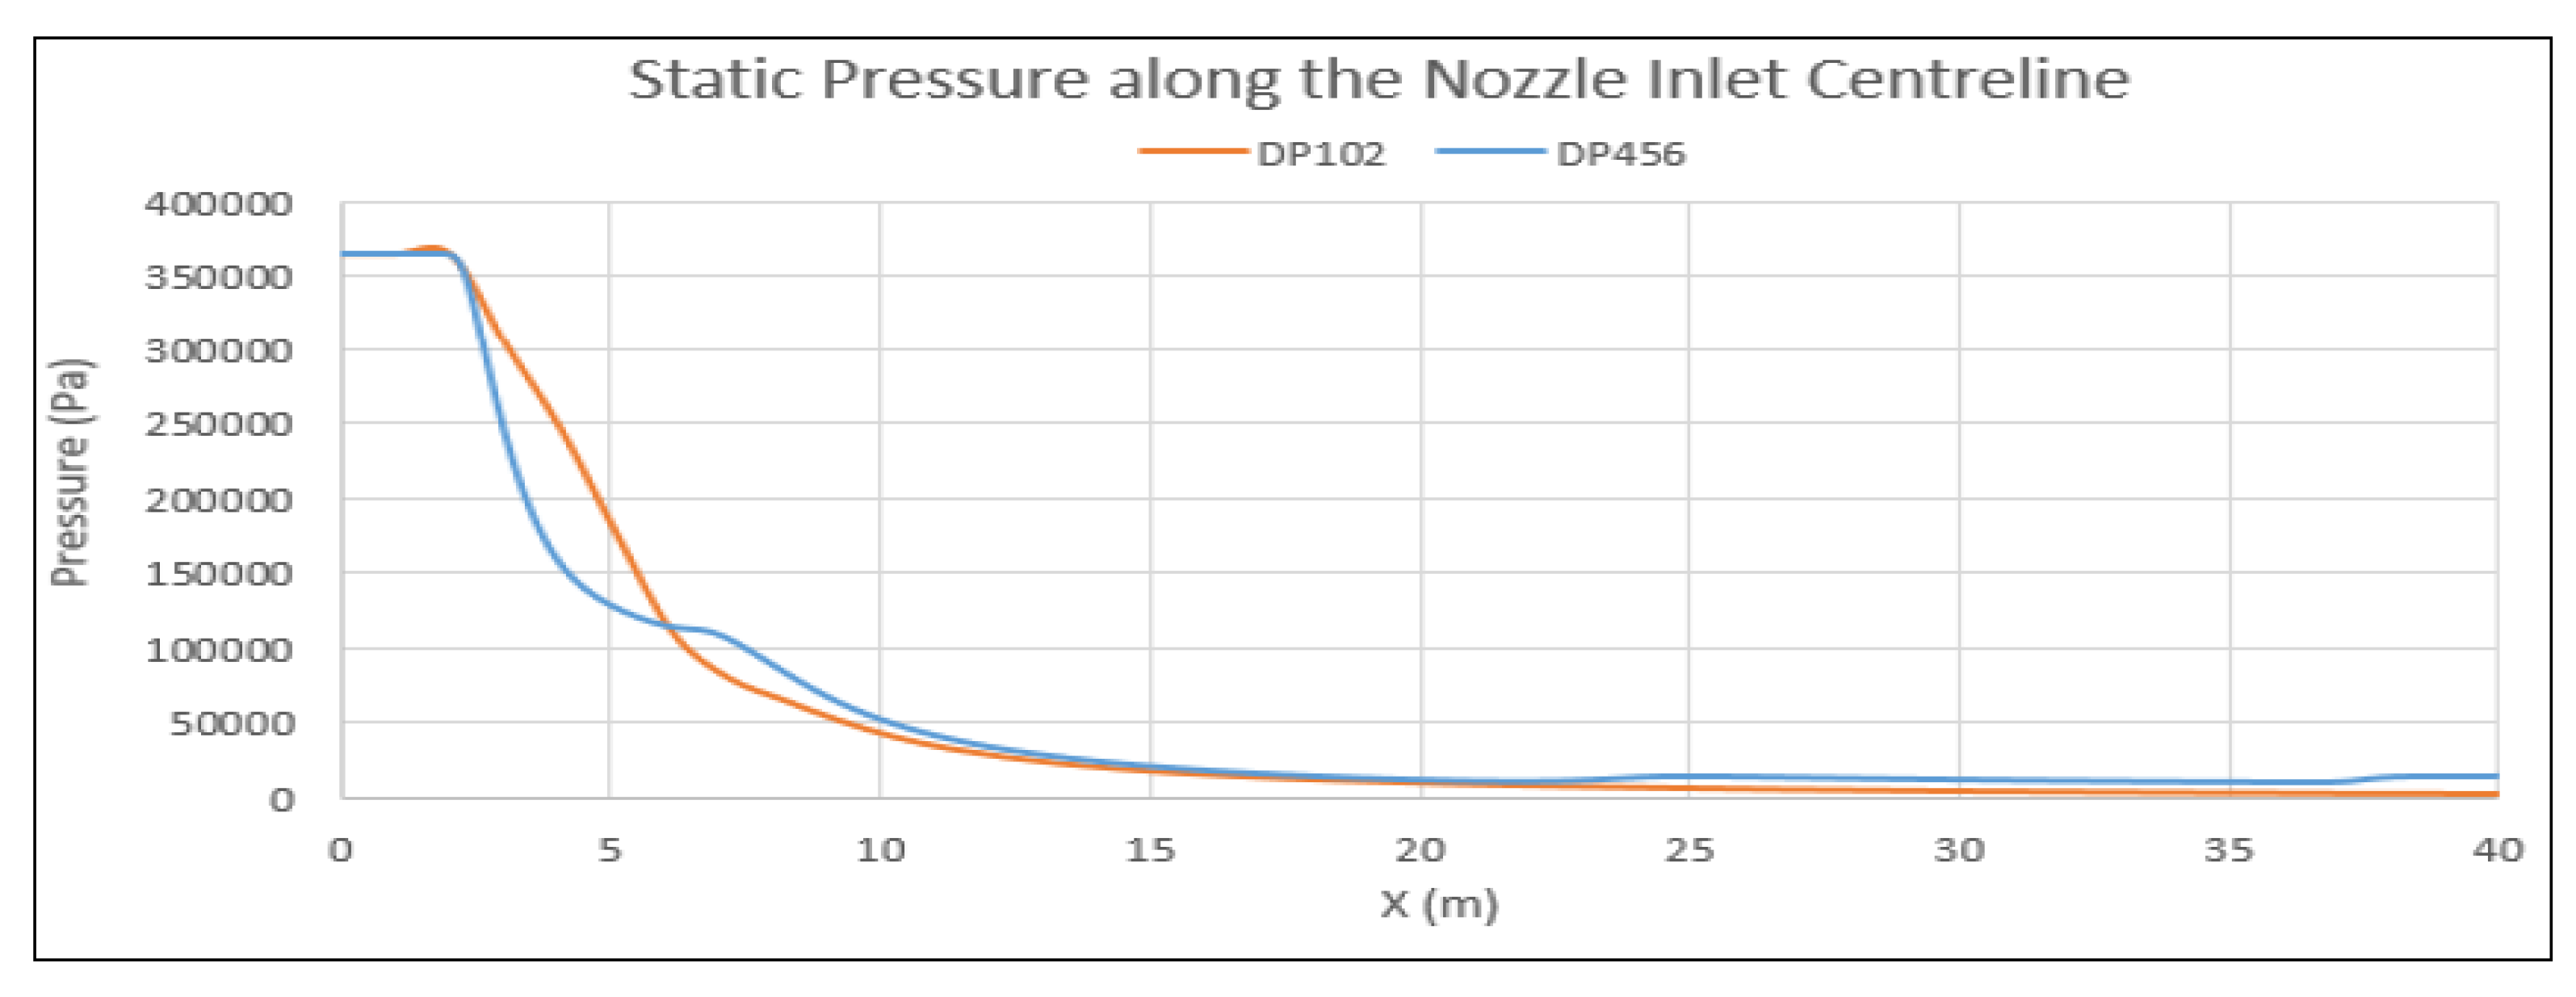
DP102 yields more axial and net thrust but DP456 produces less drag, more lift, and has a higher divergence angle making it less prone to axial losses and less likely to encounter separation. Figure 15 shows the static pressure along the SERN inlet centerline for DP102 and DP456. For 3 m, DP456 was constant due to the more stable parabolic flow profile entering the nozzle as a result of the small divergence angles of the expansion ramp and the cowl (Figure 16). The density contours display the shocks generated in both SERNs and the increase in pressure confirm it. DP102 had a slight increase in pressure just before 3 m as the cowl was exposed to higher pressures. This is because of the initial horizontal section causing lower velocity flow above the cowl.
A faint shock created from where the expansion ramp diverges significantly assisted in the gradual pressure decrease. The larger divergence angle of the expansion ramp and cowl surface created a gradual decline in pressure along the centerline as the cowl expansion fans did not intersect the centerline beyond the cowl. The rapid decrease in pressure was because of the expansion fans induced at the nozzle inlet from the diverging cowl. DP456 experienced another pressure increase before 25 m indicating an encounter with another shock. The density contours portray these shock interactions, as the boundaries where the density increases. DP102 only has one shock produced by the expansion ramp but this did not interact with the centerline within the 40 m domain. SERN DP102 clearly yields better pressures and densities within the internal and external sections of the nozzle.
The higher exit area produced less shock as the expansion ramp was less concaved. The larger region of high momentum flow achieved higher velocities at the exit area. Mach contours in Figure 17 show the development of the kernel region in both the geometries. SERN DP456 holds advantages over DP102 as a smaller divergence coefficient entailing less losses and the additional lift which will support the aircraft at a cost of lower drag.
3.3. 2D Scramjet Engine SERN Analysis
Uniform and Non-Uniform Flow Conditions
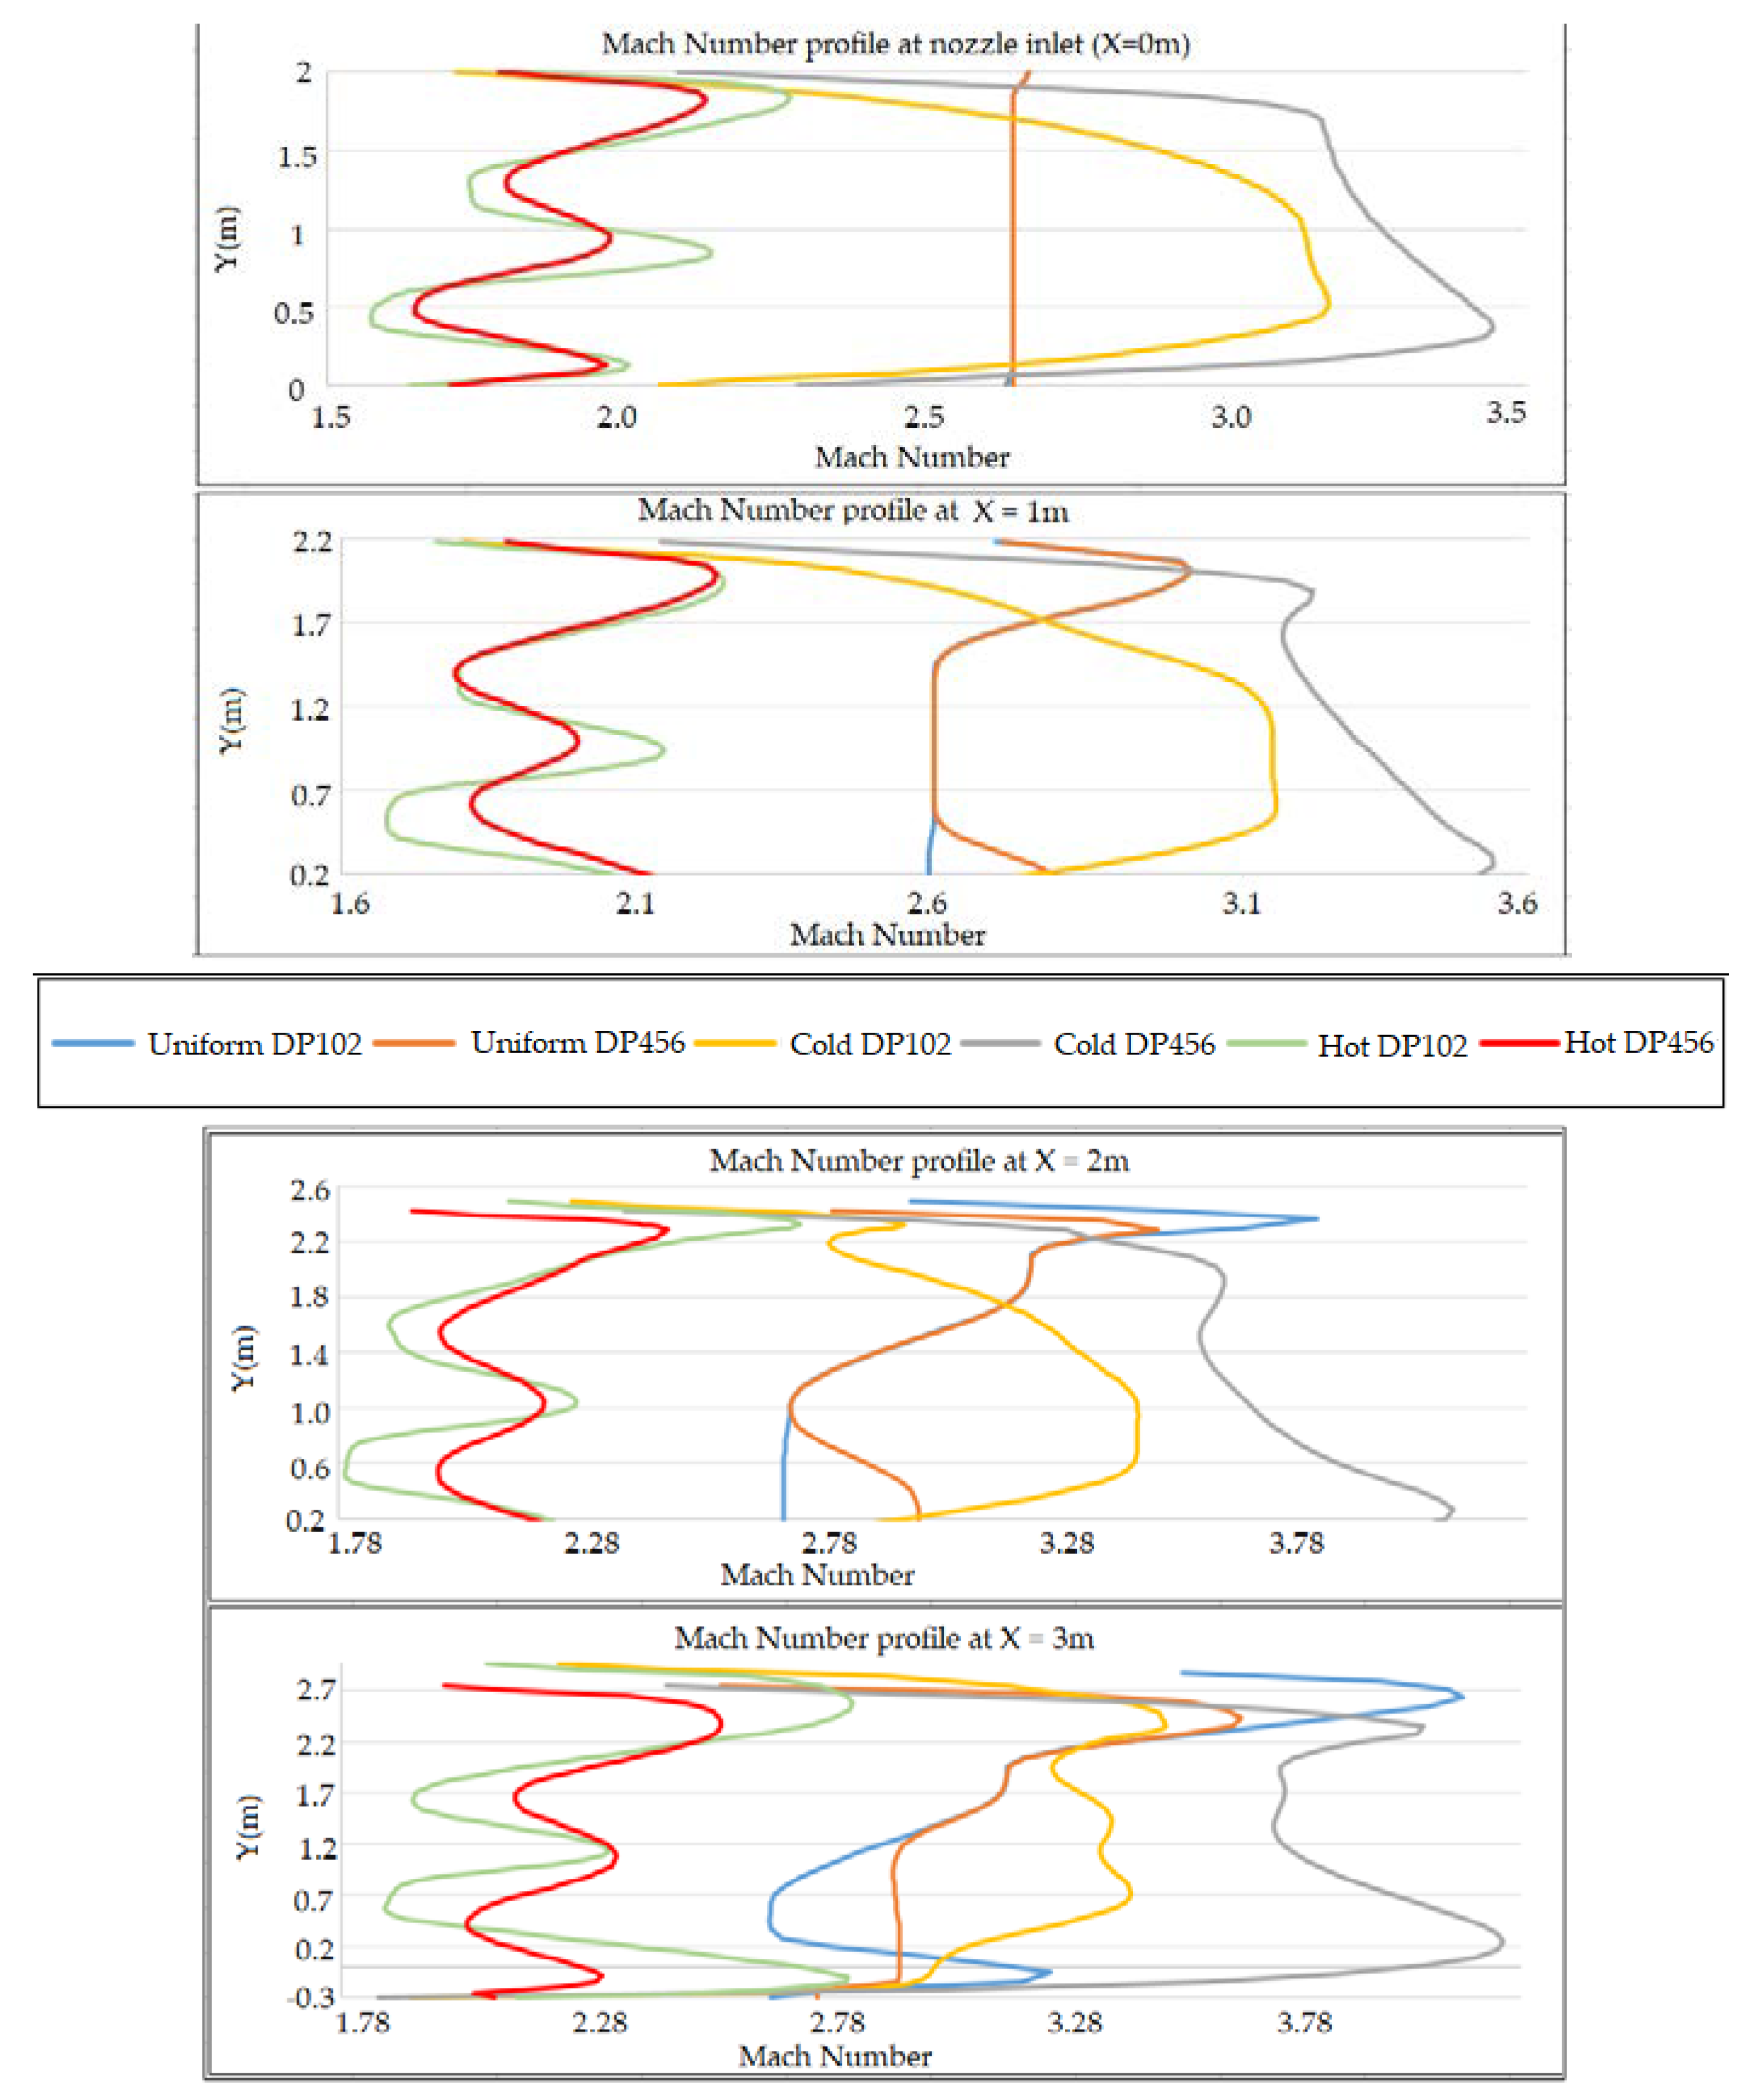
The Mach profiles of DP102 and DP456 for the uniform flow, scramjet cold flow, and scramjet combustion flow are shown in Figure 18. The Mach profile were taken at the nozzle inlet and at a horizontal distance of 1 m, 2 m, and 3 m from the nozzle inlet to demonstrate the initial development of the flow from the nozzle inlet. The uniform flow for DP102 and DP456 is near identical at 0 m and 1 m. However, DP456 has a higher Mach at the cowl in both instances due to the cowl divergence beginning from the inlet. At the cowl, DP102’s Mach exceeds DP456 at 3 m distance because of the expansion fans created by the larger cowl angle. The Mach at the expansion ramp surface is higher for DP102 from axial distance of 2 m and onwards due to the ramp contour radius being smaller. This results in larger divergence angles and thereby leads to expansions fans with a greater Prandtl–Meyer angle and increase in Mach number.
The cold flow of DP102 and DP456 prove the inaccuracy of uniform nozzle inflow. The Mach of the cold flow at the walls and axial positions are lower and higher, respectively, compared to the uniform flow over all horizontal distances, until the expansion fan effects become too great.
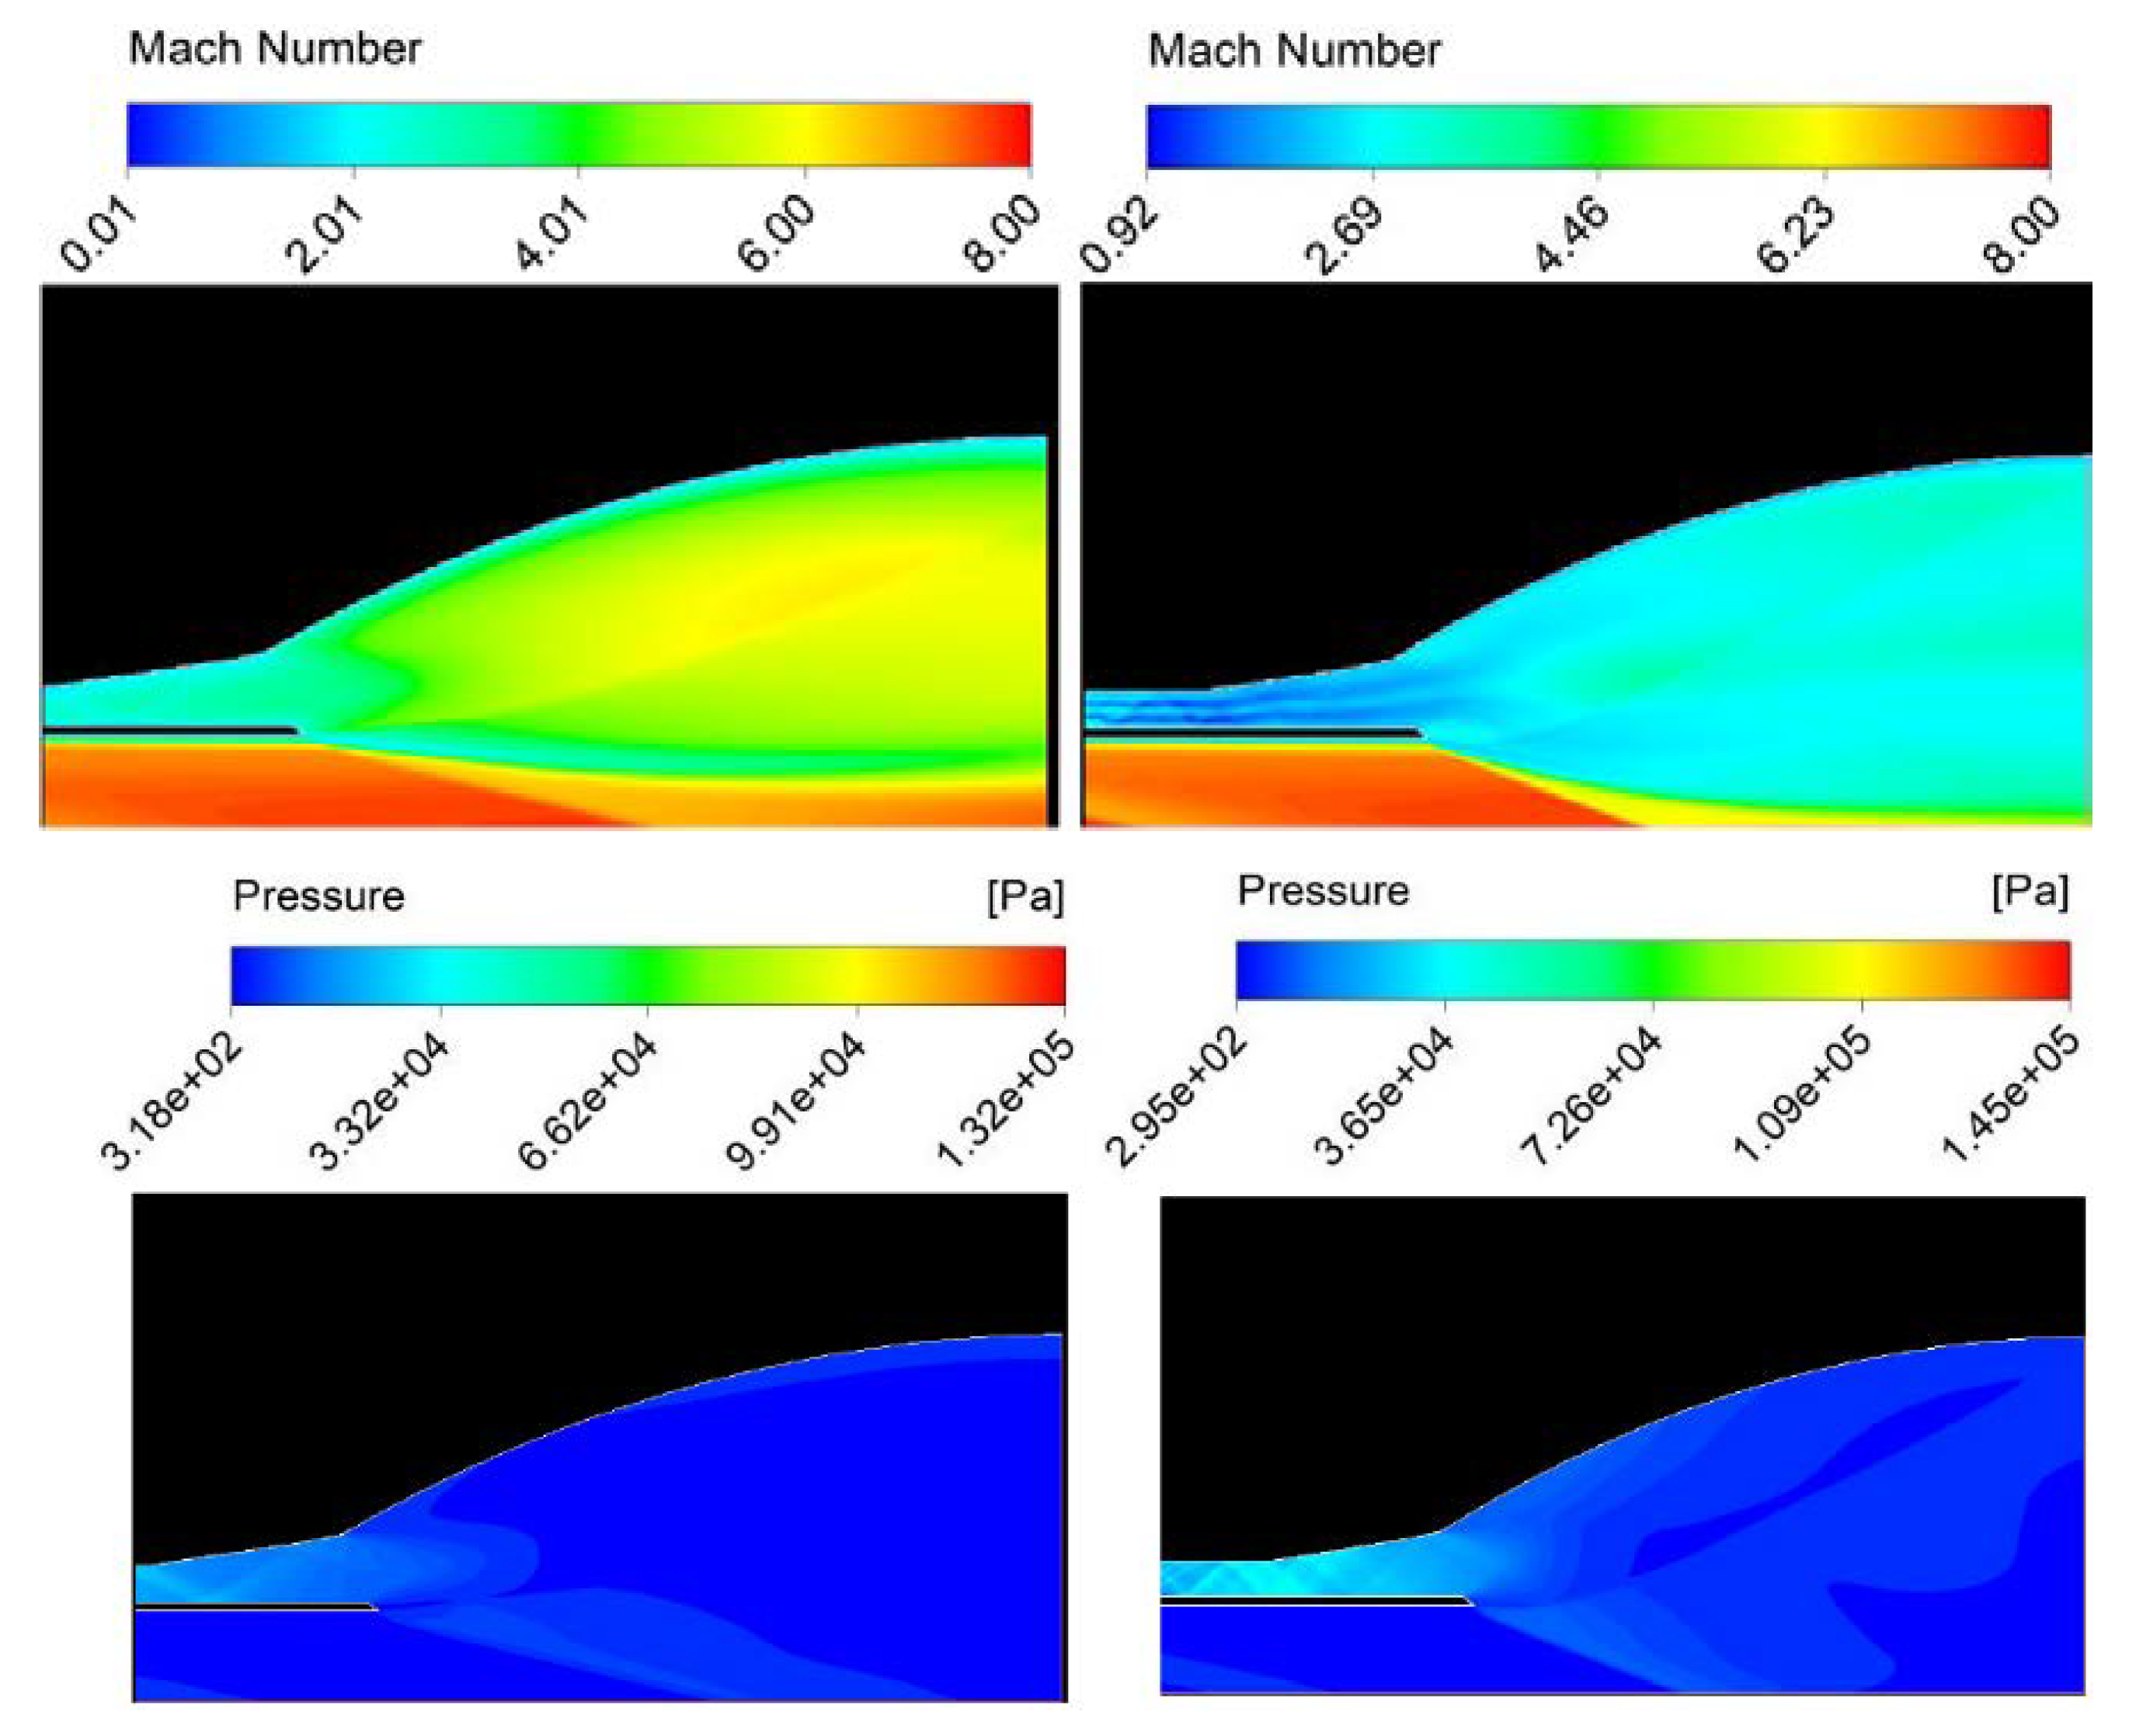
A developed parabolic flow was observed at 0 m for cold flow tests, which was due to the expansion fans from the diverging combustor geometry. The uniform flow starts to take on a similar Mach profile near the expansion ramp wall, but the combustor and nozzle geometry impacts the flow resulting in considerably different inflow Mach profiles across the remainder of the inlet height down to the different cowl shapes. The boundary inflow conditions have a significant impact on the results. Contour plots of the SERN only investigations have shown that setting high uniform boundary conditions provides desirable qualitative and quantitative results. Conversely, when the SERN is combined with the inlet, isolator, and combustion chamber for full engine analysis, the results can be regarded as more realistic. Figure 19 and Figure 20 compares DP102 cold flow and combustion flow contours to distinguish the differences. The contours show a large contrast in the resulting solution of the cold and hot flow through the nozzle.
The Mach within the internal and external sections of the nozzle demonstrate a vast variance in the range of Mach achieved. Cold flow expansion from the combustion chamber has not been affected by the fuel mixing and chemical reaction, unlike the hot flow test, resulting in undisturbed and higher Mach number flow expanding through the nozzle. Whereas, the combusted flow Mach is slowed causing lower Mach number distribution throughout the nozzle. The higher pressure throughout the internal and external nozzle in combusted flow, causes greater under-expansion in contrast to cold flow because of combustion increasing the pressure significantly. The temperature distribution is mainly in the streamline of the combusted flow with higher temperatures experienced throughout the area of the nozzle. Compared to cold flow, the maximum temperatures occur at the walls and shear layers. Increased temperature in the core of the flow consequently reduced the Mach number in combusted flow. With combusted flow, the maximum velocity occurs within the plumes, but the velocity distributed throughout the nozzle is significantly higher in comparison to cold flow.
3.4. 2D Scramjet Twin Strut Combustion—SERN DP102 and DP456 Comparison
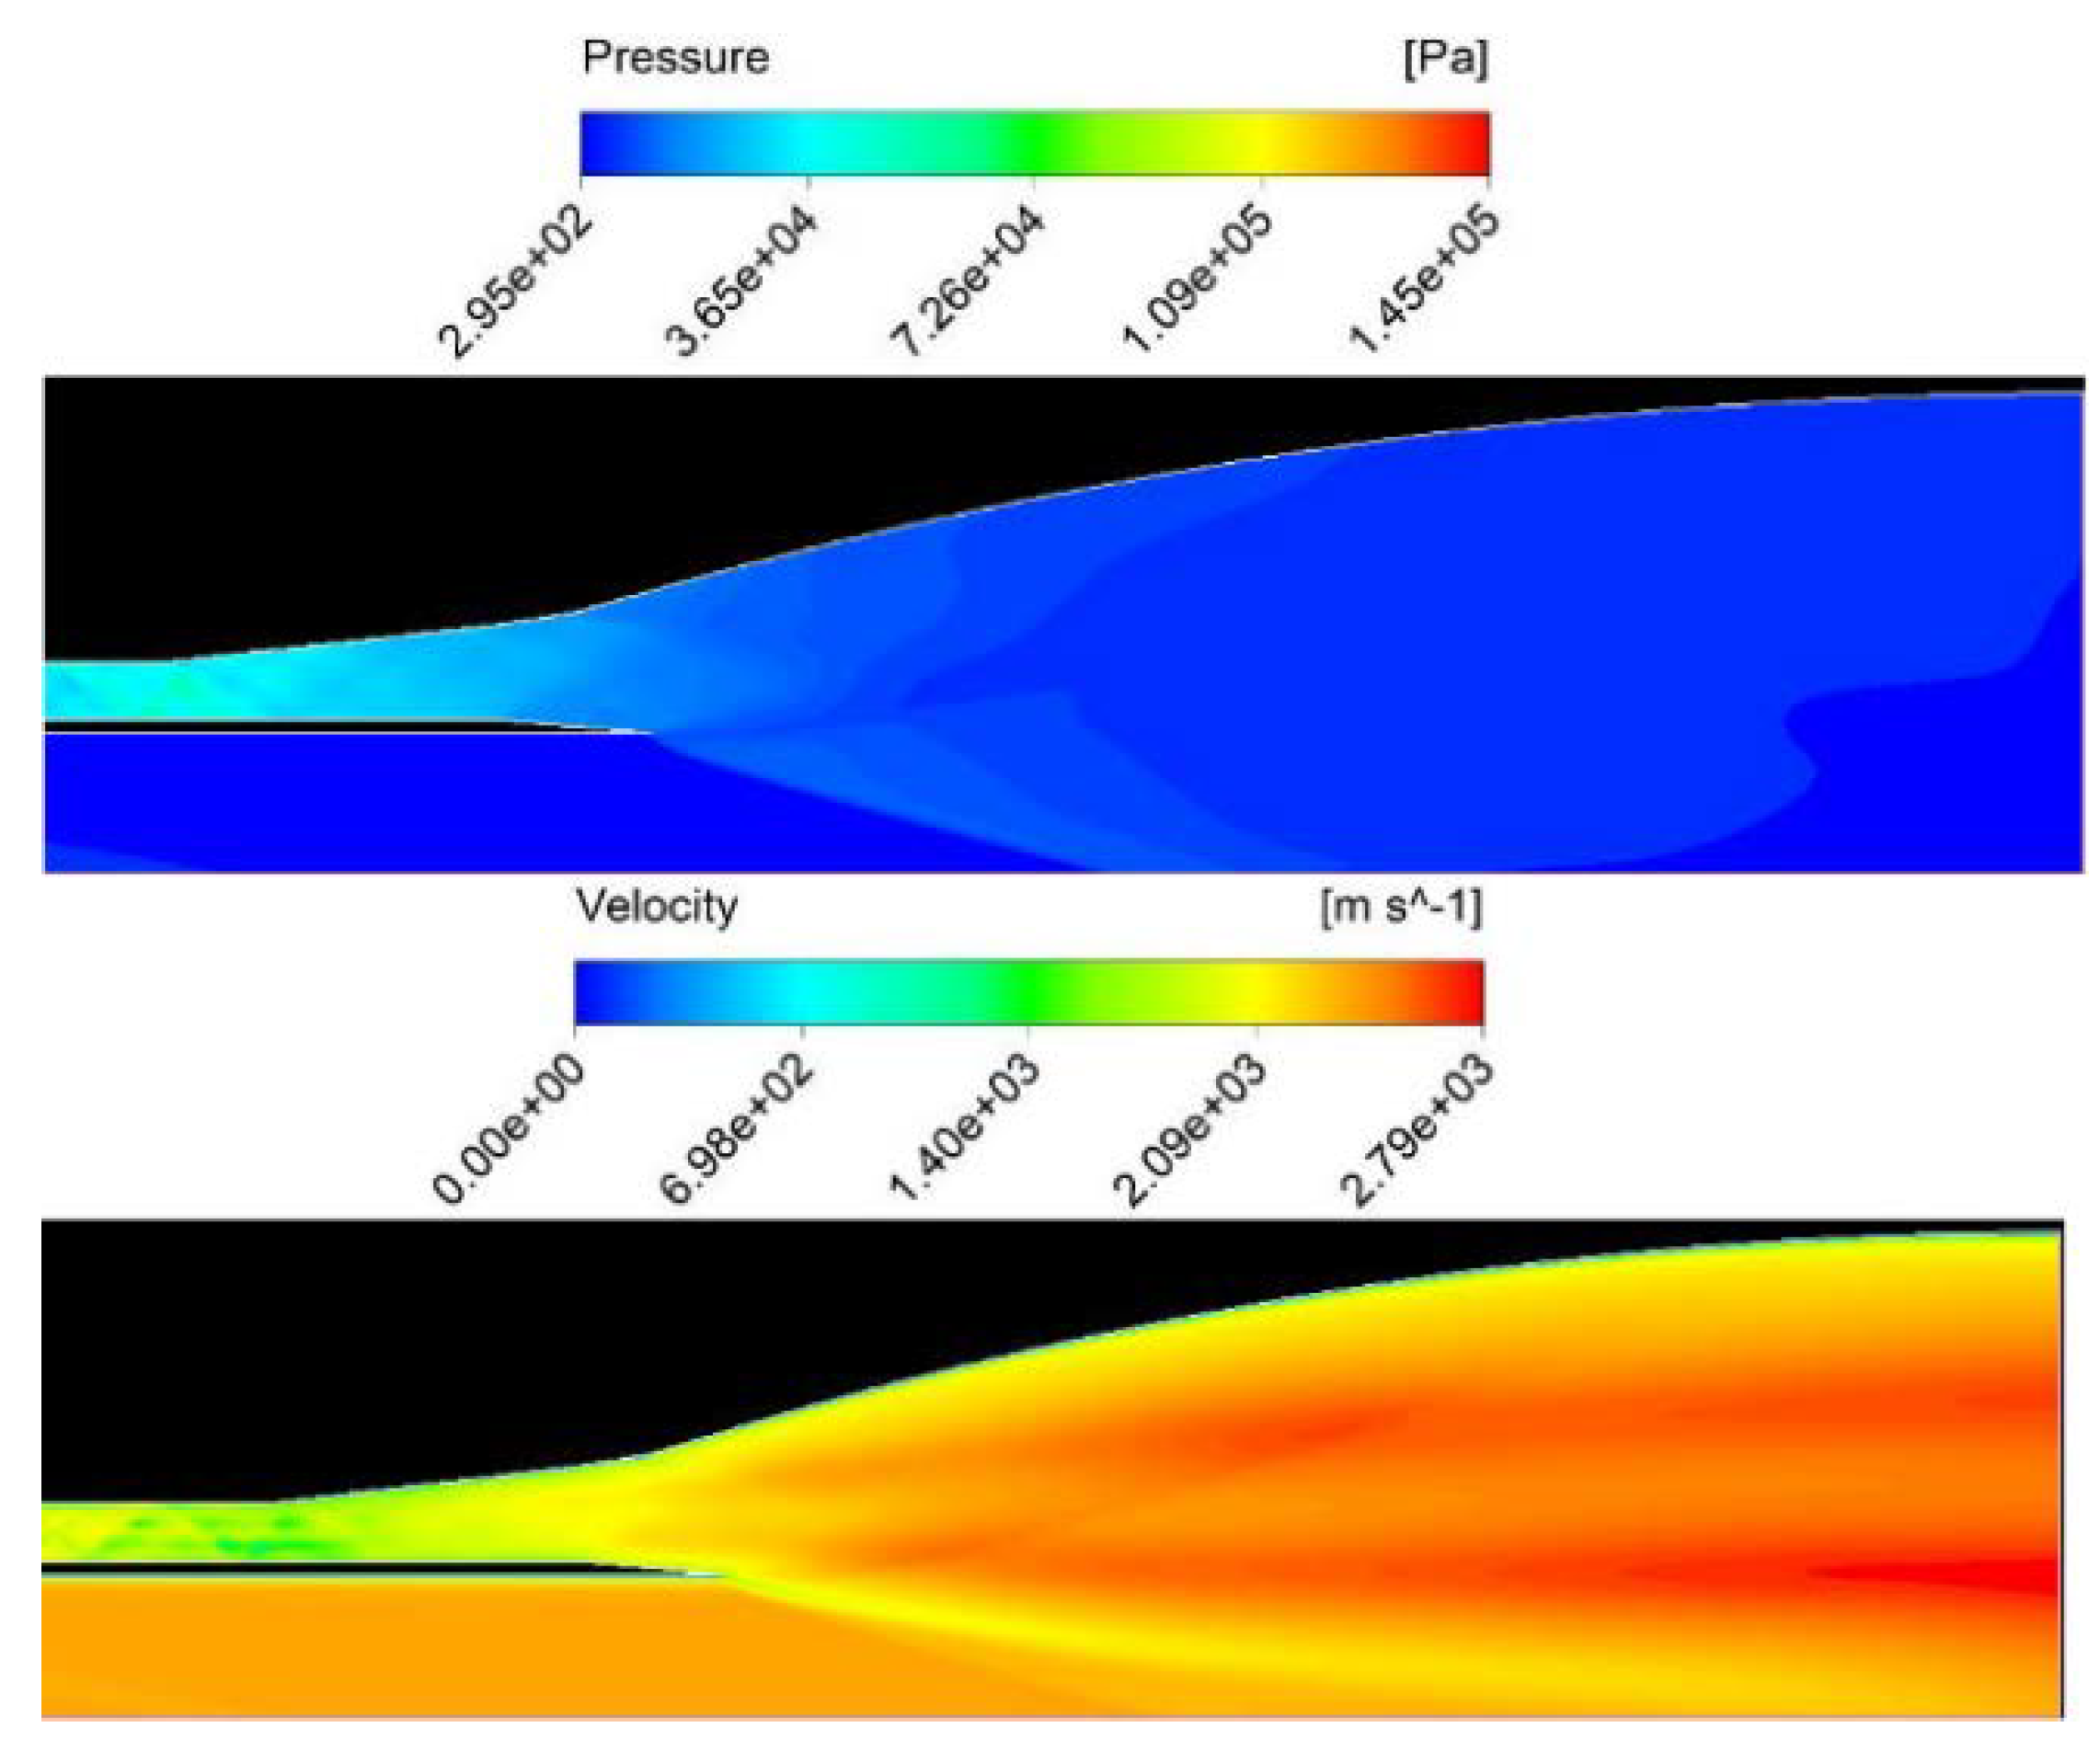
DP102 and DP456 exhibited different flow structures when incorporated with twin strut combustion. Figure 21 shows the velocity and pressure contours of SERN DP456. Compared to SERN DP102, DP456 has larger under expansion mainly due to the higher-pressure regions being distributed throughout a larger area of the nozzle (Figure 20). The cowl induced a shock passing through the exhaust flow of SERN DP456.
Effect of Flow Types on Performance
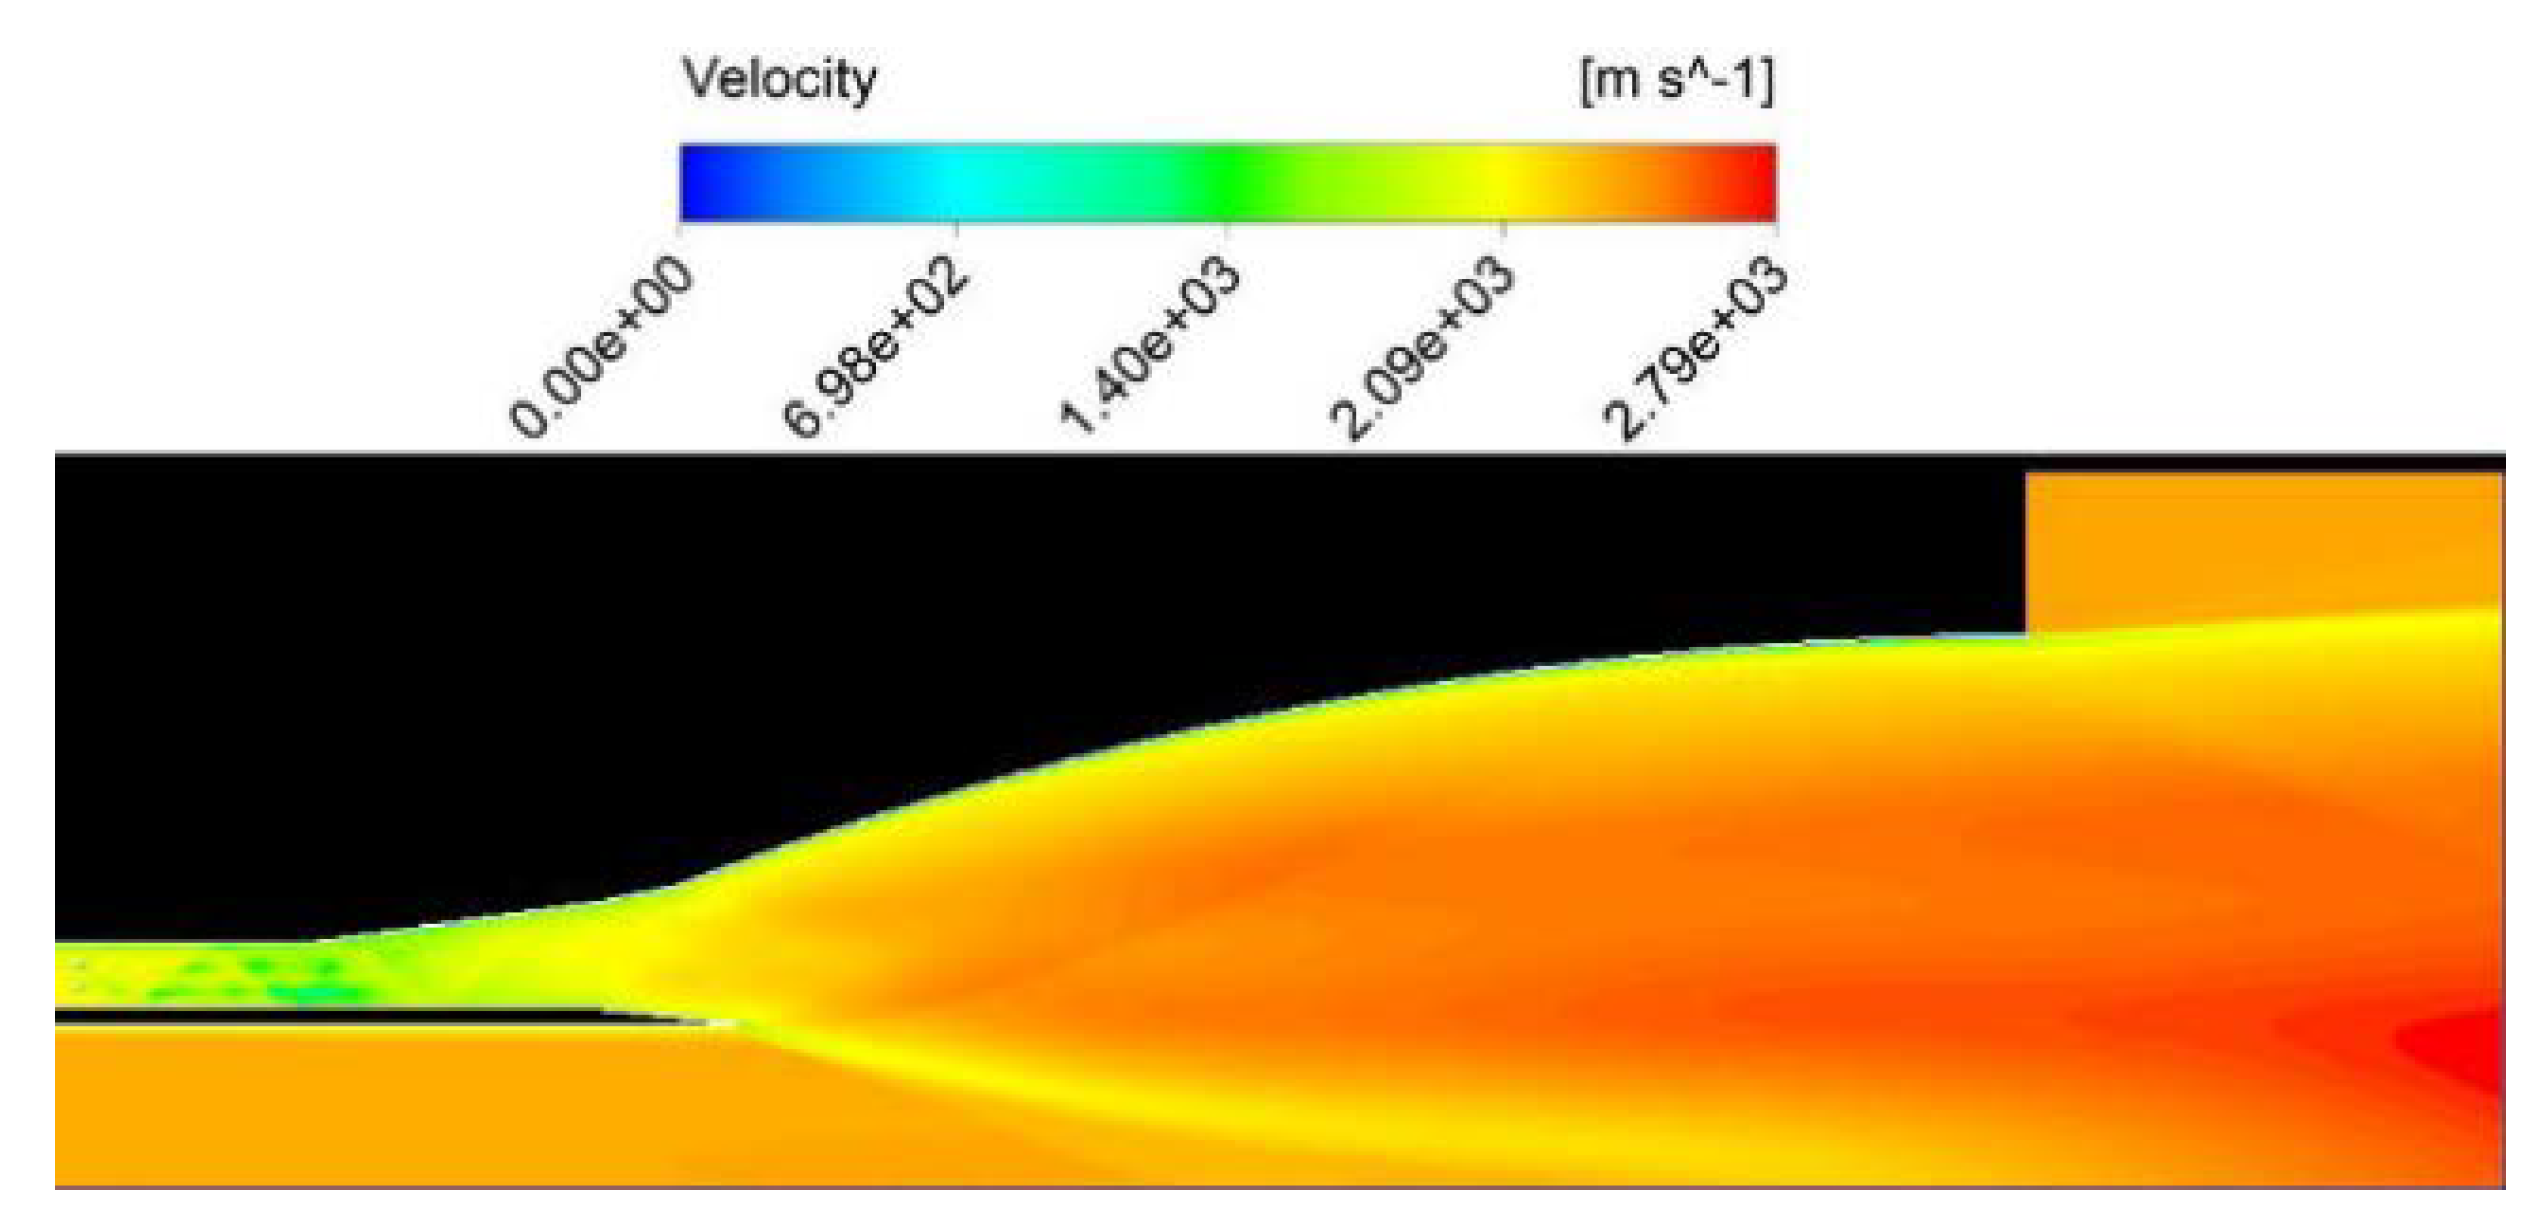
The different uniform and non-uniform cold and hot (combustion) flow conditions affect the parameters entering the SERN. Therefore, the flow behavior and performance parameters will contrast throughout the SERN. Single expansion ramp nozzle DP456 with combustion and an outlet 10 m downstream of the nozzle exit is seen in Figure 22 and will be referred to as “Hot DP456-2” for convenience. Figure 22 illustrates similar characteristics to the hot flow with the downstream outlet; however, the higher velocity region occurs much further downstream than compared to Figure 21. The shock reflects off the expansion ramp surface back into the higher velocity exhaust region beyond the nozzle exit causing a minor reduction in velocity.
The flow types and their performance in regard to static pressure can be seen in Figure 23. The combusted flow produces a substantial increase in static pressure in the nozzle. Therefore, the final performance characteristics will be substantially altered. Comparison of the axial and net thrust calculated for both DP102 and DP456 for the uniform, cold non-uniform, and combusted non-uniform flow is provided in Table 11. These were calculated using the Equations (1)–(5) and using the same method applied in the SERN parametric studies for consistency. Accordingly, “Hot DP456-2” is the most realistic setup tested.
The uniform flow outputs extremely high pressures and velocity in comparison to the cold flow and combustion flow tests. The nature of the uniform flow means the performance will be over-estimated and limitations have prevented accurate domain setup to produce accurate uniform flow. Regardless of the considerably lower thrust values, both DP102 and DP456 combustion flows achieved higher thrust and pressures, for the respective geometries, compared to the cold flow tests. Cold uniform and cold non-uniform flow tests provided good insight into SERN performance characteristics and flow structures. Nevertheless, they lack realism compared to modelling combusted flow through the SERN.
3.5. 3D SERN Studies
Based on the evaluations on the initial aircraft and engine SERN DP456 was selected. The smaller SERN exit height was beneficial towards drag and flow structures over the aircraft body. Therefore, the 3D SERN studies were conducted on DP456 only. The purpose was to compare the 2D results and design the side fences for the SERN.
3.5.1. Effect of SERN Side Fence Length
Side fences contain the flow, preventing spillage from the sides of the SERN. Abundant losses in thrust, lift, and longitudinal stability can result from the 3D flow. Two side fence configurations were analyzed, including a small side fence configuration which ended at the cowl while matching the height between the expansion ramp and the cowl, and a large side fence which covered the height up to the cowl and linearly extended from the cowl to the nozzle exit. Figure 24 shows the Mach distribution of the SERNs with the small and large side fence across the walls, symmetry, and different planes.
The small side fence allows span-wise expansion to take place immediately after the internal nozzle section. This degrades the axial flow and induces performance losses throughout the nozzle. At 10 m along the SERN (i.e., third plane), the span-wise expansion Mach increases as it expands into the freestream and beyond 20 m (i.e., fourth plane) the kernel region seems to form where significant momentum is concentrated. At 20 m, the flow begins to spill over to the top surface which will create more losses through turbulence and high vorticity flow. However, the large side fence contains the majority of the flow until the end of the expansion ramp. The span-wise expansion of the Mach transition is slower compared to the small fence and it prevents significant spillage and flow turning upward and over the SERN. As a result, the reduced spillage will prove better thrust performance of the nozzle, but the larger wall surface means drag will be increased.
The short fence streamlines the display, and the flow instantly begins expanding span wise at large angles of divergence (Figure 25). The flow near the symmetry spills out over a short length of the expansion ramp. The flow turning outward and upward as the expansion ramp gets thinner is illustrated which would introduce unpredictable surface pressures on the SERN. A curved shock formation can be seen attached to the ramp surface which results in separation. The larger fence streamlines control the spillage much better compared to the shorter fence. Spillage is present where the wall begins to incline away from the cowl; however, the majority of spillage is delayed significantly. The divergence of the spillage gets greater as the wall gets smaller when reaching the expansion ramp trailing edge. The wall prevents the flow from circulating up and over the nozzle, keeping the flow axial in a concentrated region.
3.5.2. Effect of SERN Side Fence Angle
Figure 26 illustrates the Mach contour and streamlines of DP456 with a large wall and a 4.29° fence angle. The Mach contour displays similar traits of the large straight wall. The flow spillage is restricted along most of the length of the side fence. However, the outer face of the side fence affects the Mach distribution. It expands the flow downward rather as well as span wise. The side fence angle delays the rapid span-wise expansion producing less losses from spillage. The streamlines prove the span-wise expansion transitions at a much slower rate compared to the large straight side fence. The controlled expansion is due to the span-wise divergence of the side fence.
The thrust of the SERN DP456 with the different nozzle configurations is shown in Table 12. In 2D DP456, the overestimated nozzle inlet boundary conditions produced larger thrust. In addition, the span wise expansion was not accounted for reducing the exit velocity and pressure. However, with the actual exit area put into the thrust calculation, the final values were significantly increased. The straight large fence approximately doubled both axial and net thrust due to the increased density and pressure. The 4.29° fence angle with the large wall saw axial and net thrust increase by 9.63% and 10.93%, respectively, compared to the large side fence with a 0° fence angle. However, as previously established, uniform nozzle inlet flows produce substantial overestimations in performance.
3.6. 3D Scramjet Engine—SERN Analysis
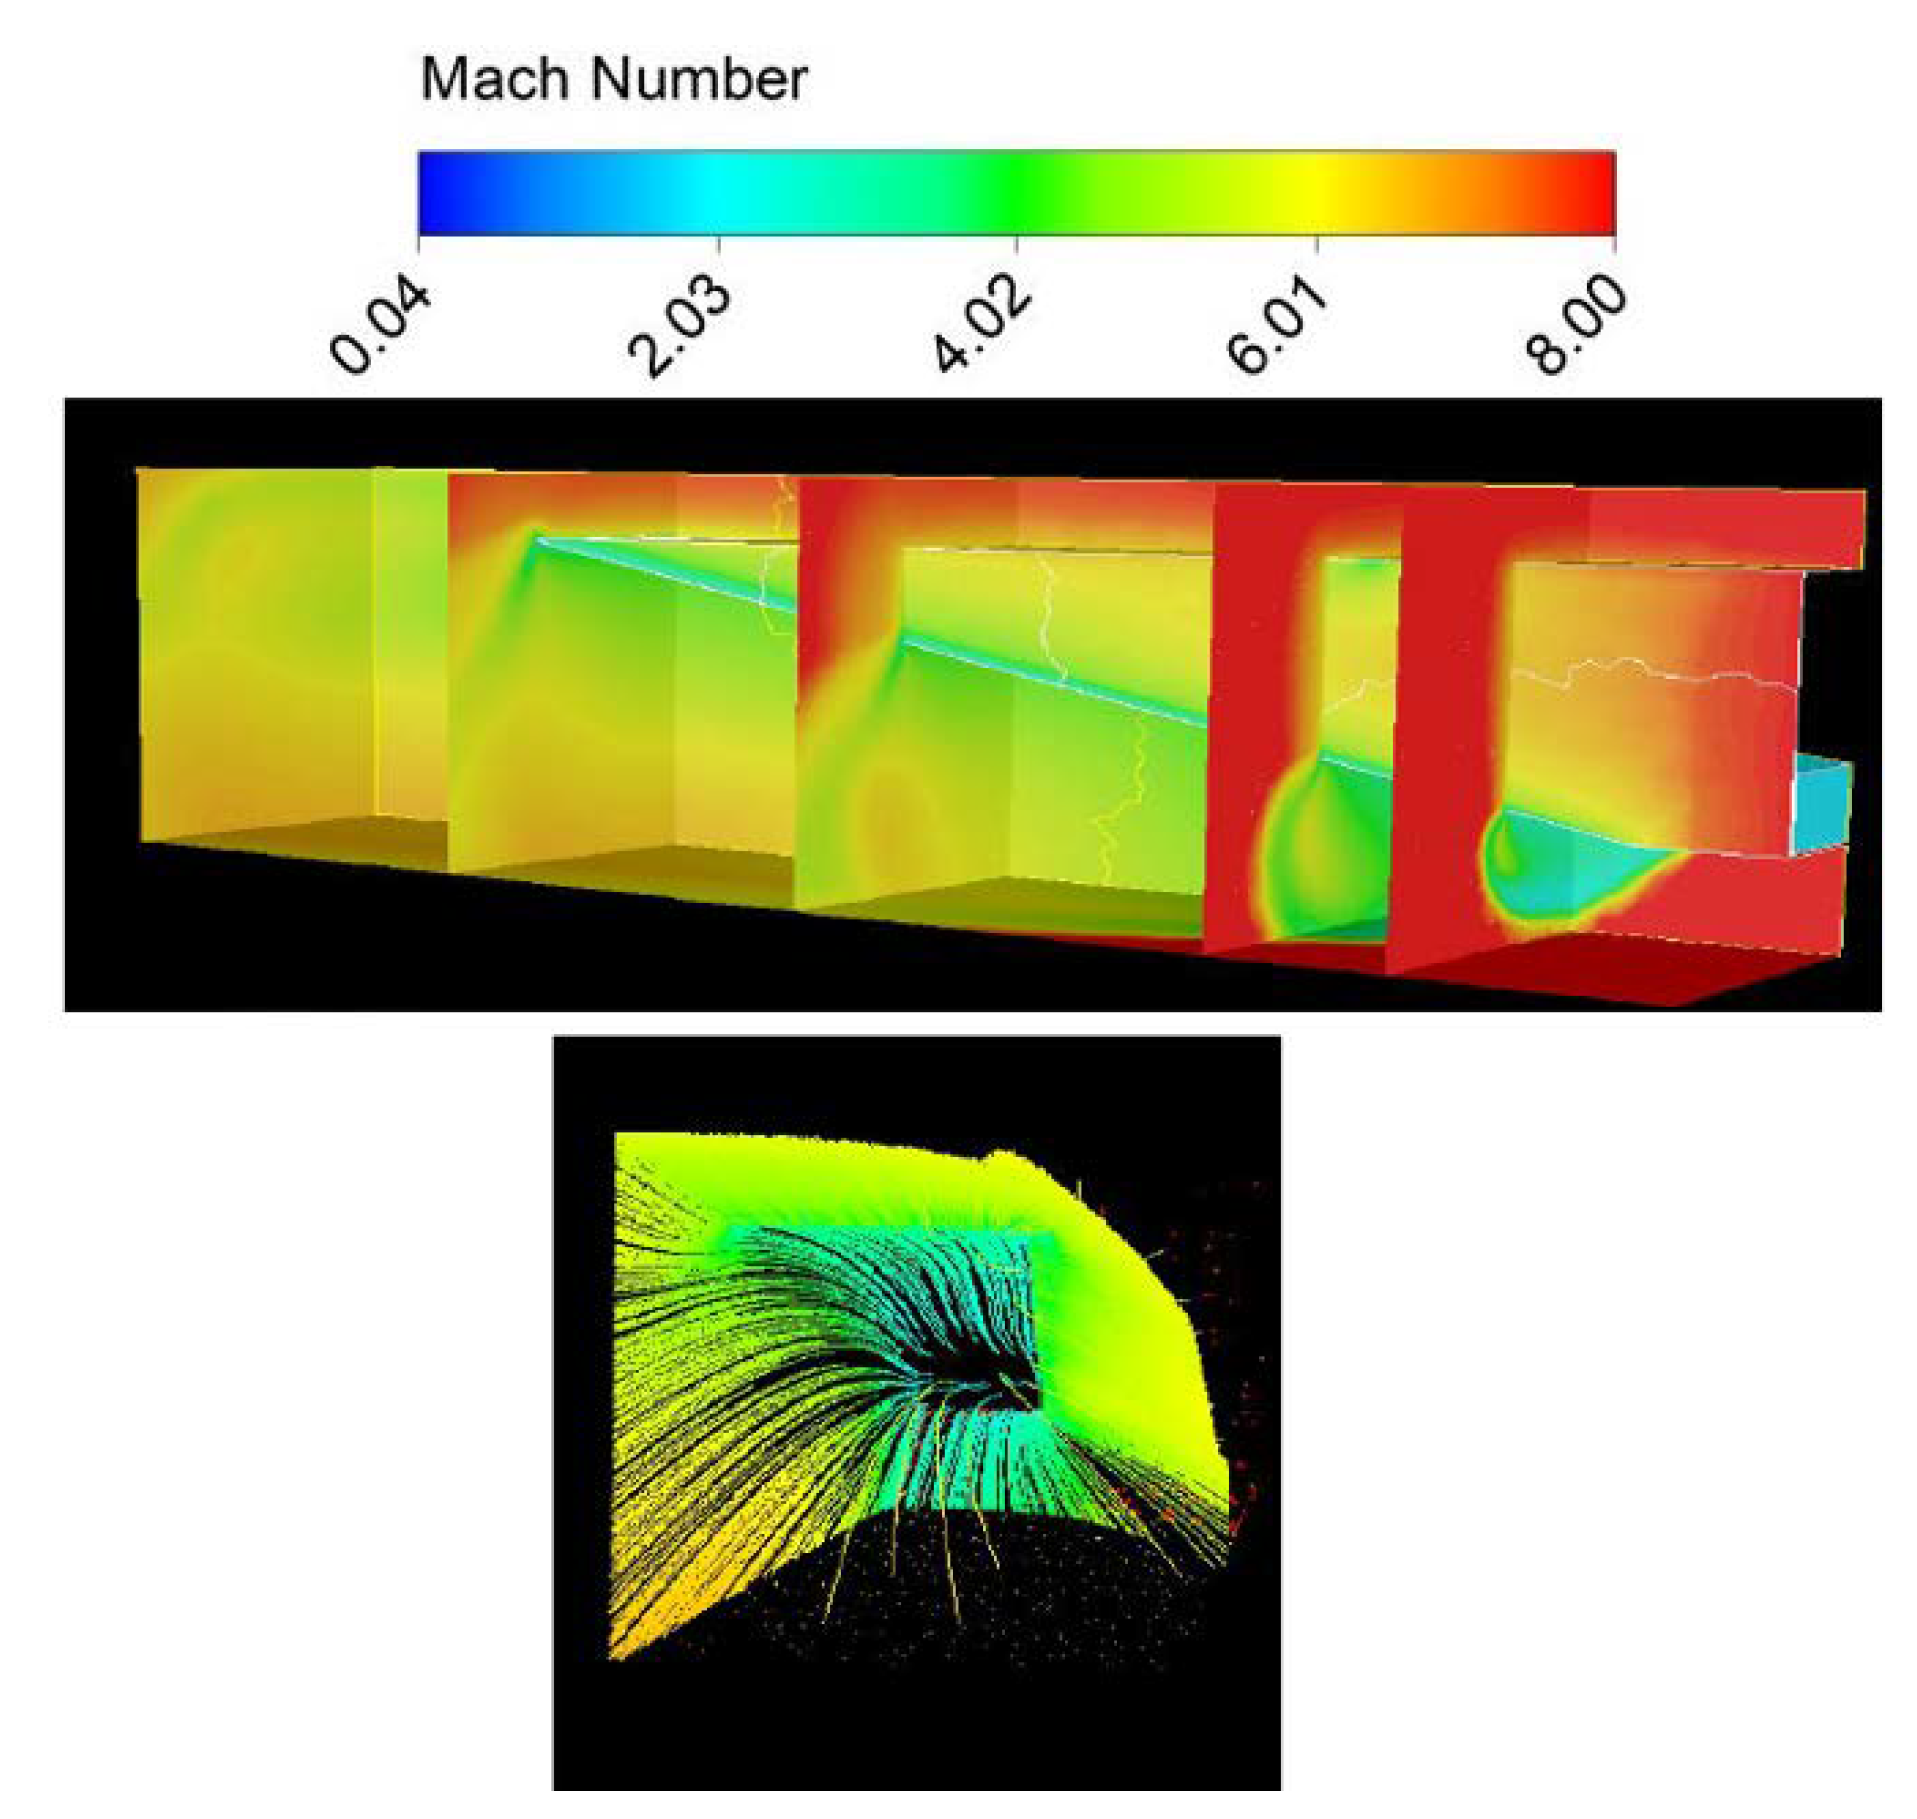
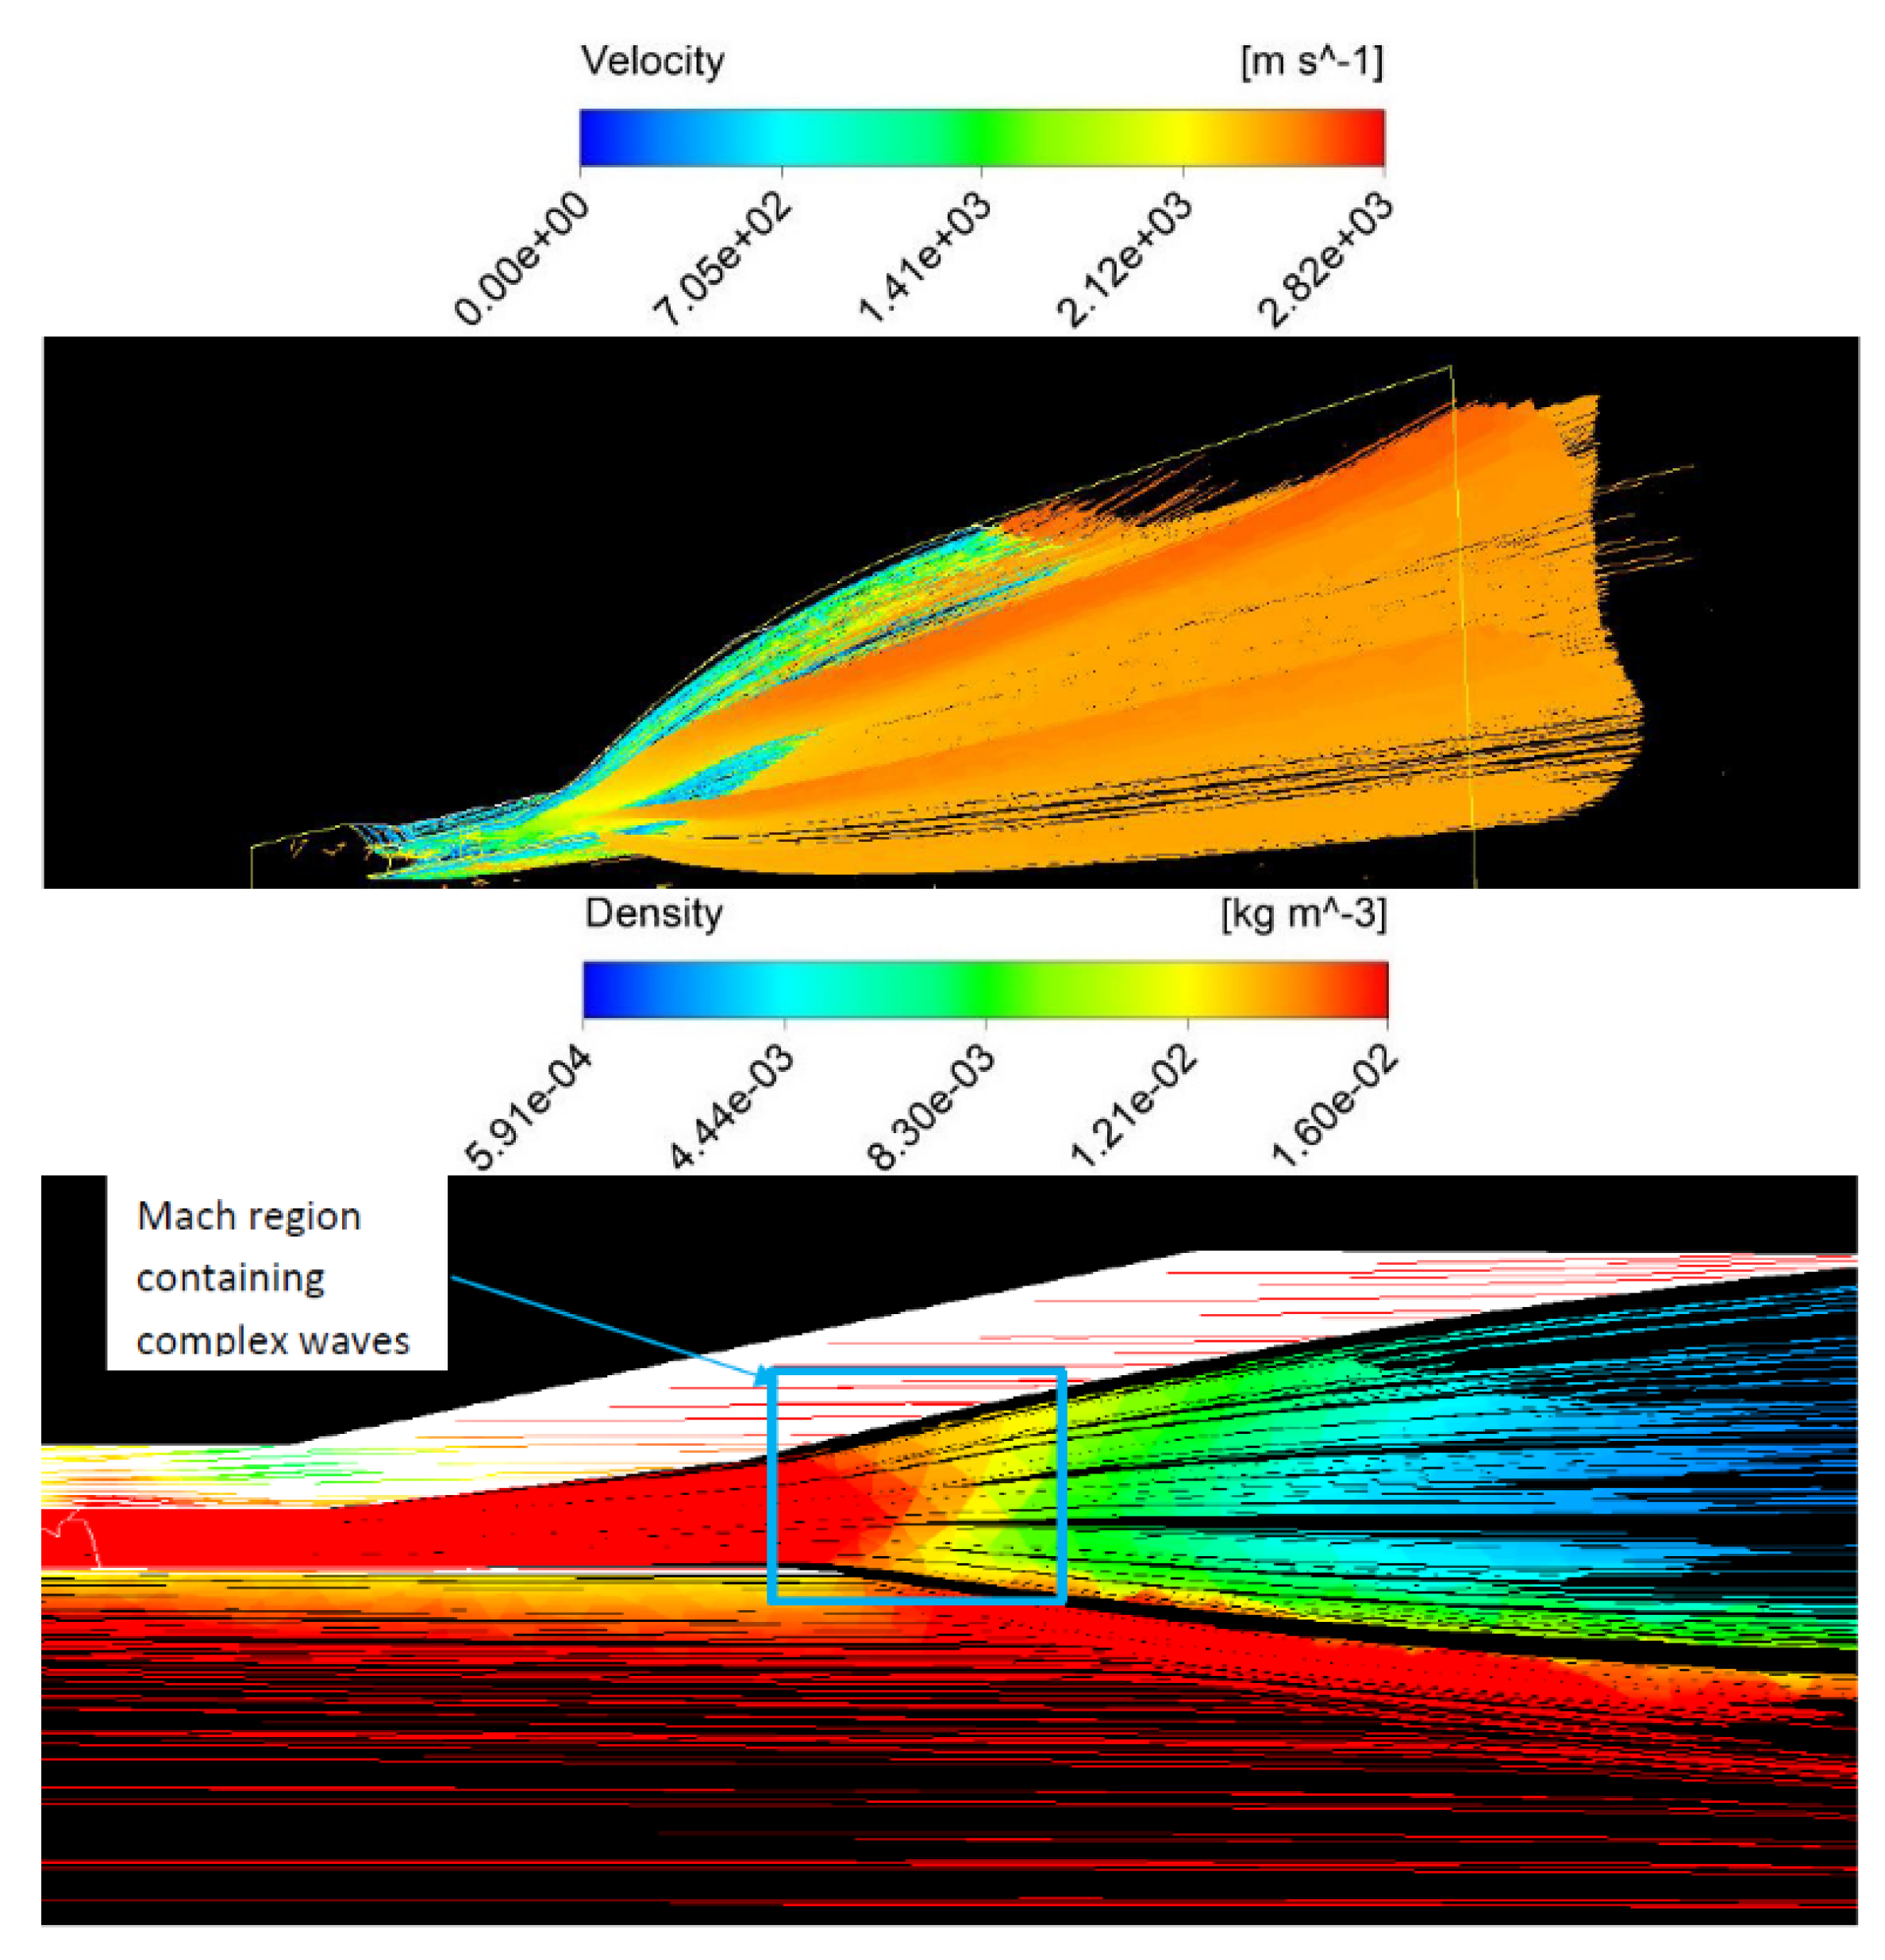
Post individual 3D studies on the scramjet components were completed, the inlet and isolator, twin strut combustor, and the SERN were assembled, without any modifications, for full scramjet flow field testing with combustion. The scramjet engine was simulated at operating conditions representing Mach 8 cruise at 100,000 feet. Figure 27 demonstrates the streamline flow through and around the scramjet engine. The 3D flow behaved analogously regarding the 2D twin strut combustion through the SERN with the stream of exhausted combustion containing regions of high velocity and temperature with lower values around these streamlines of the combusted flow. The increased velocity distributed throughout the nozzle results in lower pressure regions reducing the rate of axial expansion downstream of the SERN. The cowl lip expansion is still the region which observes the fastest span-wise and vertical expansion from the absence of the extended cowl length and side fence height. The density streamline plot at the symmetry shows the complex waves belonging to the families of the expansion fans from the upper expansion ramp surface and the lower cowl surface at the nozzle inlet. The complex waves make up the Mach region in which the Mach increases rapidly before the flow expands into the external flow and beyond the side fence. The complex flow is reflected from the expansion ramp surface and cowl surface as well as the shear layer produced from the cowl.
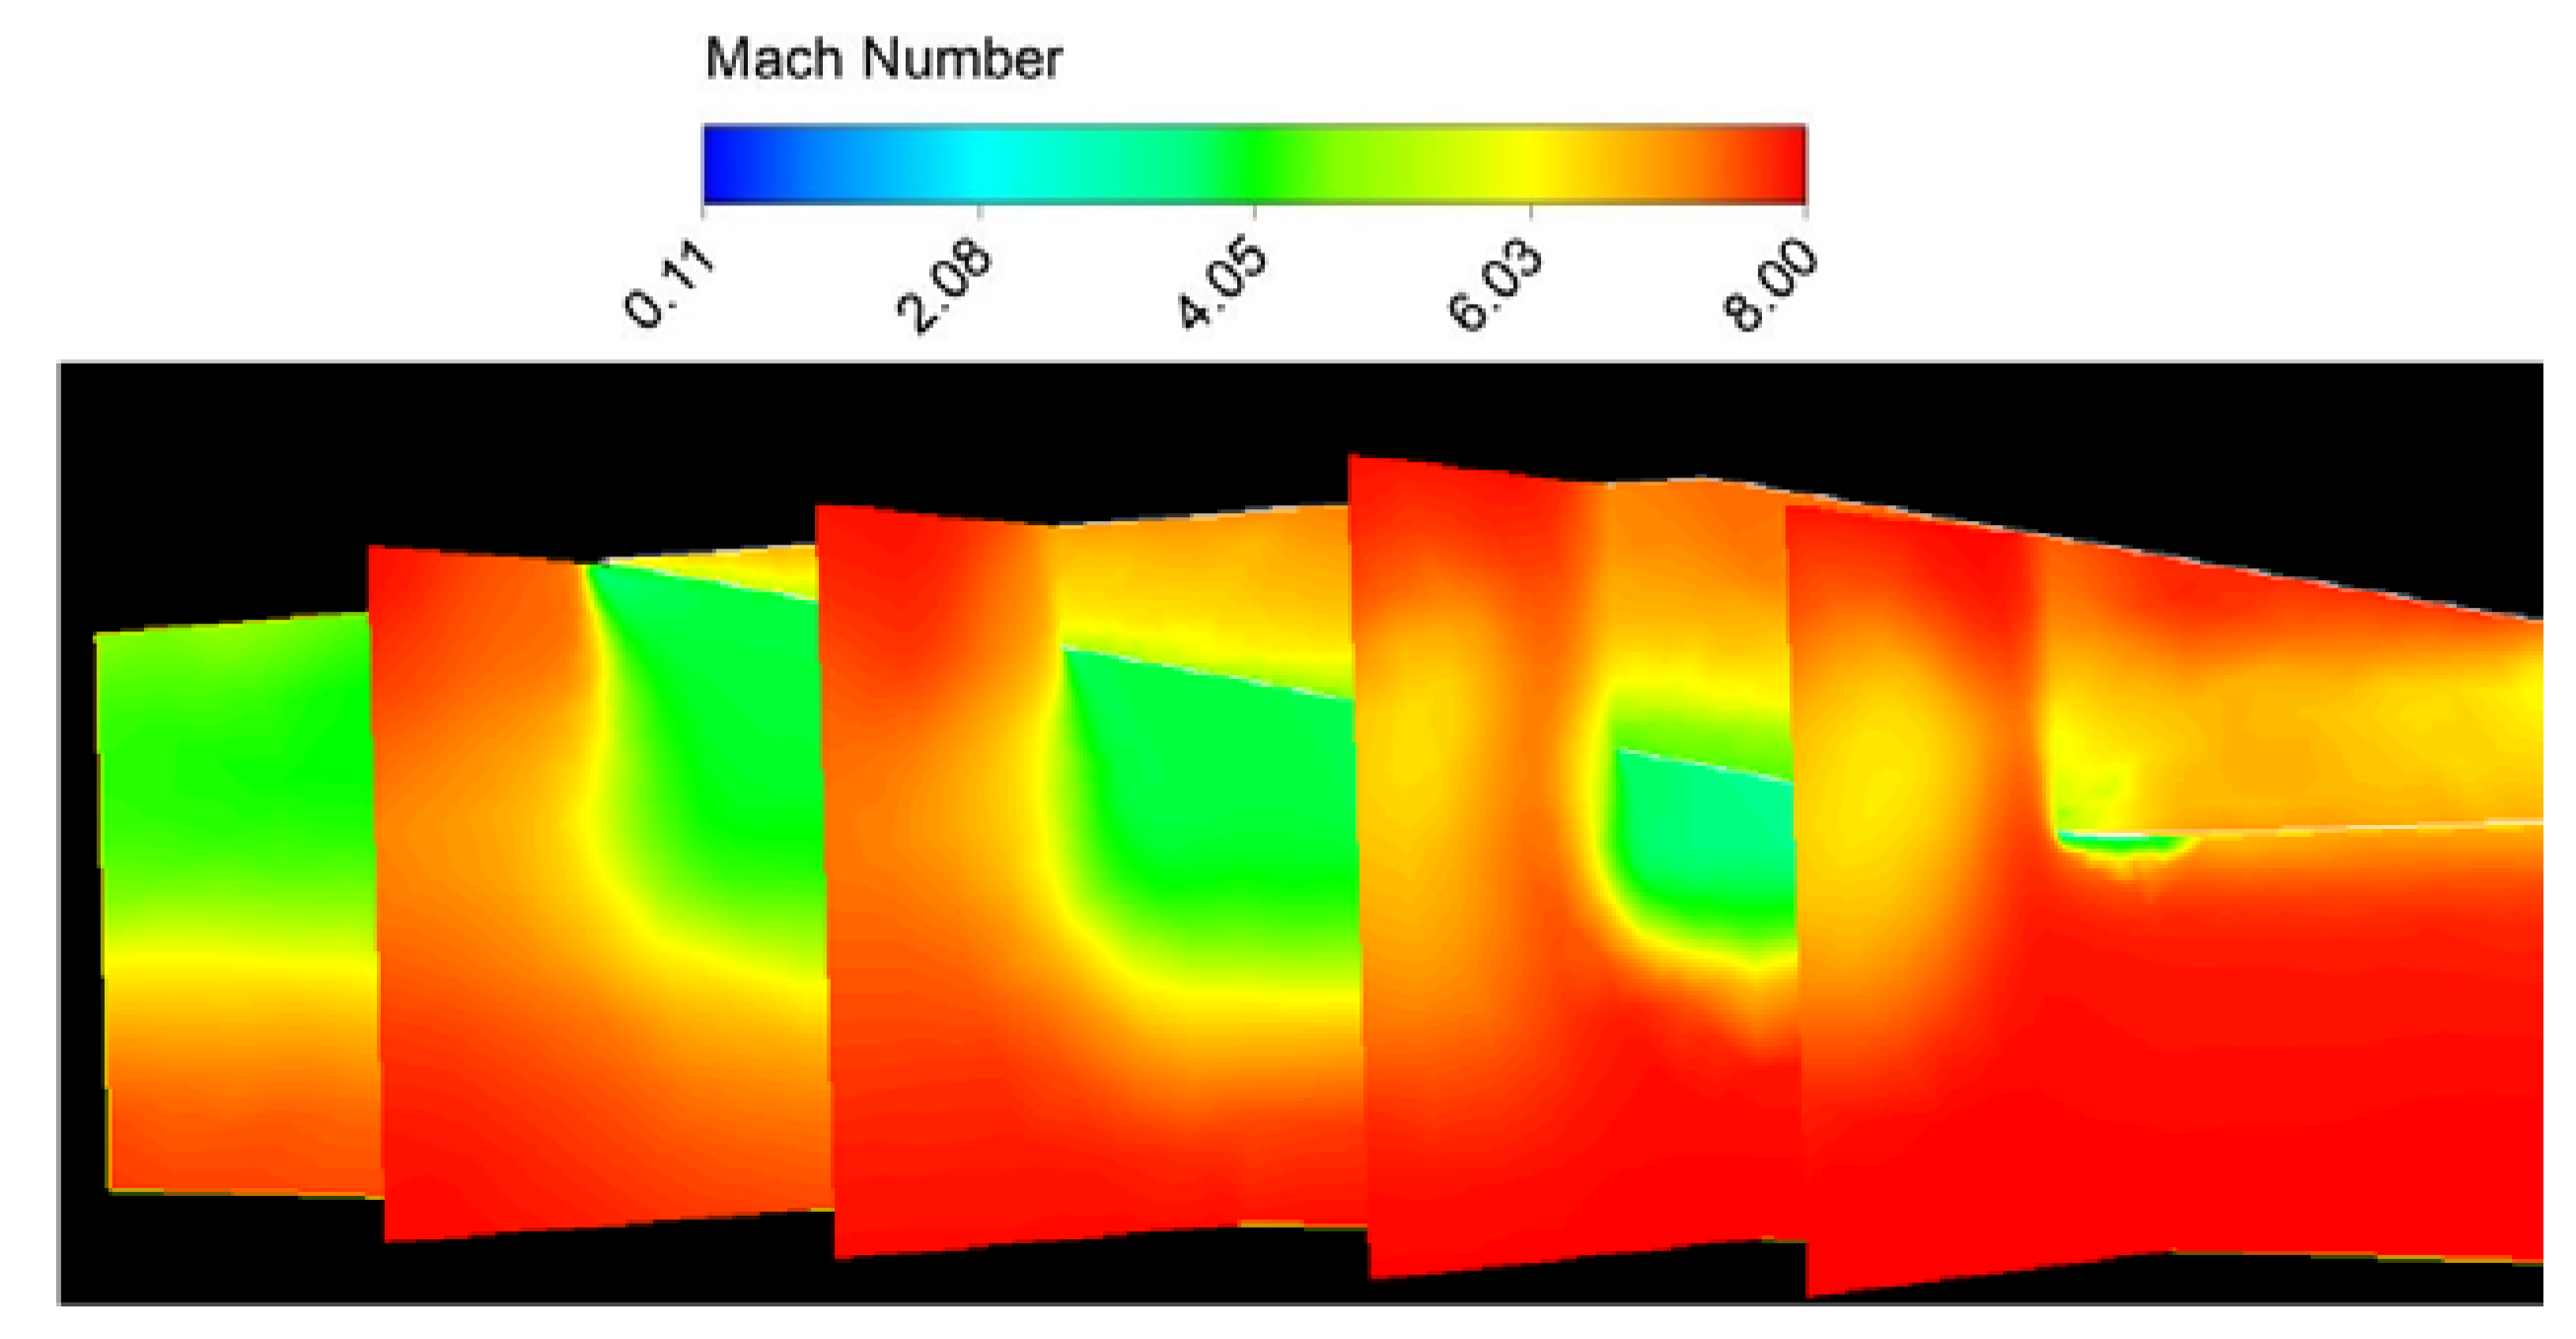
The Mach contours of the SERN flow field from the resultant combusted flow is shown in Figure 28. The combusted flow through the SERN does not intensify the spillage beyond the side fence. The distribution of the exhausted flow expands over a small area in comparison to the flow seen in the previous side fence study with an angle of 4.29°. The Mach is reduced significantly in the 3D full scramjet combustion simulation for the same reasons as the 2D cases, due to the increase in temperature. The axial flow exhausted from the SERN is better as the expansion transitions much slower span-wise and smaller divergence angles result in less 3D losses.
The thrust was calculated for the 3D scramjet with twin strut combustion utilizing SERN DP456 with a 4.29° side fence angle to ensure the solution accounts for the 3D losses to procure an accurate evaluation of the overall engine performance. The final axial and net thrust generated by the SERN DP456 with a side fence angle of 4.29° are 8,362,313 N and 6,854,746 N, respectively. A reduction of 43.27% and 50.24% occurred; however, the full scramjet simulation encompasses more realistic conditions, taking into account the effect of the prior components before the flow field reached the SERN, whereas the previous 3D nozzle simulations incorporated uniform flow conditions at the nozzle inlet. Therefore, the scramjet SERN operates successfully when integrated into the scramjet engine and produces better performance than anticipated from the previous studies.
3D Integrated Aircraft and Combined Cycle Engine—SERN Analysis
The integration of an engine into aircraft is highly complex. The entire scramjet engine requires careful integration into the airframe to be utilized effectively as it needs to capture the large airflow requirements at high speed. Both the airframe and engine affect each other, therefore they need to be designed conscious of the consequences they have [31].
The integrated aircraft and combined cycle engine CFD were conducted through cold flow tests for operating conditions at Mach 4.5 and 8. Design changes to the cowl were implemented to allow the model to mesh for CFD calculations to take place. Therefore, thrust will not be evaluated but rather the altered flow characteristics of the SERN from the aircraft and combined cycle engine design. At Mach 4.5, the ramjet will begin to reach its limit on maximum performance and the scramjet will be engaged to continue the aircrafts acceleration and climb. The ramjet will be producing the thrust and because of the modified engine designs, the ramjet exhaust flow will spill into the SERN exhaust flow. Figure 29 displays the velocity streamlines, Mach contours, and volume flowing downstream over the aircraft, from the ramjet nozzle and the SERN. The streamlines show the flow over the wing and ramjet nozzle cause vortices to form. Through the spiraling flow, the velocity decreases and flow is increasingly turbulent. Combusted flow through the ramjet nozzle would likely reduce the spillage from the exhaust plume into the SERN jet stream. Currently, the ramjet exhaust flow channels through the downstream expansion of the SERN which may reduce the axial thrust performance for both the ramjet nozzle and the SERN. However, the vortices generated from the upper surface of the wing and after body will most likely be present throughout the duration of the flight. Subsequently, part of the flow through the SERN separates near the upper expansion ramp trailing edge, contributing to the vortex generation.
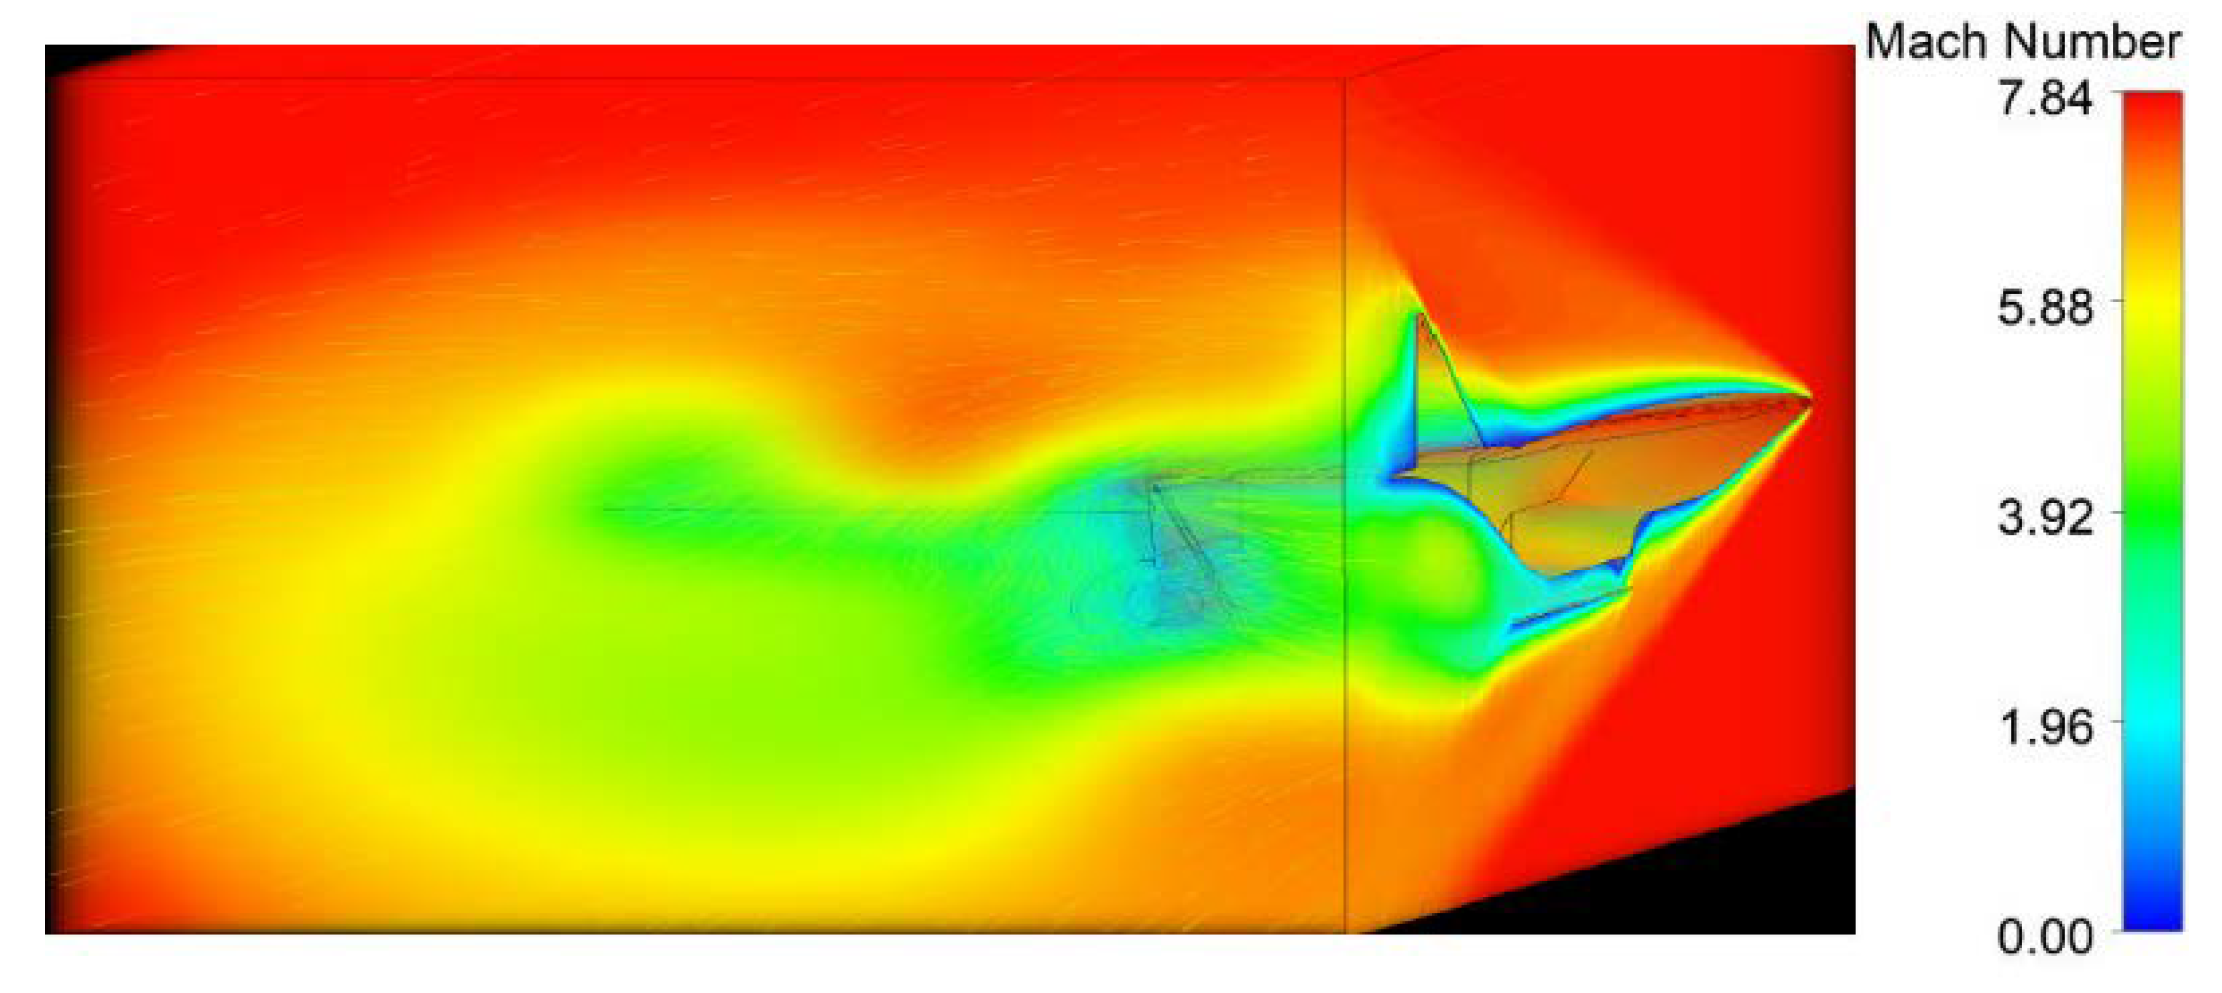
When the ramjet is disengaged, the engine will be shut off by a flap directing flow around the side of the aircraft. Figure 30 shows the streamline flow, Mach contours, and volume to visualize the SERN exhaust flow at Mach 8. The SERN still expands the flow efficiently as it increases the Mach flow from approximately Mach 2 inside the scramjet, to approximately Mach 5 through the SERN. The Mach volume and streamlines still exhibit the vortices being formed from the ramjet nozzle with the blended wall and the upper surface of the proposed aircraft. The extreme vorticity may have a considerable effect on the combusted exhaust plume from the upper strut injector. The axial thrust will be worsened as these vortices will promote separation from at the upper surface of the SERN. In this vortex region it can be seen that the Mach is reduced significantly and will add to the drag. The changed cowl design deteriorates the lower expansion region which produces misleading results of the SERN integrated into the proposed aircraft. Cold flow contributes to the considerable decrease in performance expectations.
4. Conclusions
The study investigated SERNs for a scramjet required to propel an aircraft for sustained hypersonic flight at Mach 8. An efficient SERN geometry was obtained through 2D and 3D parametric analysis and through 3D combustion modelling of the scramjet. It provides further detailed analysis to the overall aircraft configuration published previously as part of this project by References [2,4,32,33,34].
The main conclusions of this study are:
Numerous geometries were produced with different performance benefits. The chosen SERN design exerts equivalent performance over a range of altitudes and Mach numbers demonstrating adaptability and robustness in off-design conditions.
The sensitivity analysis revealed that thrust can be improved through contouring the SERN. The best contoured SERN configuration produced 10.68% more thrust than the best conical SERN with uniform inlet flow, including larger exit areas, and smaller initial expansion ramp angles due to their expansion capabilities.
Drag was found to increase with increase in SERN length. Lift and moments are influenced through the geometries’ effect on the incoming flow profile and pressure distribution between the expansion ramp and cowl.
Through 3D combustion modelling analysis, side fences extending to the SERN trailing edge at an angle of 4.29°, was found to enhance thrust by approximately 10.93% compared to a straight fence.
Despite the in-depth analysis conducted within this report, there is still further refinements to be done which could enhance the final outcome of the SERN and engine integration. This includes,
- (a)
- SERN parametric studies involving the combustion exit conditions to identify the optimal design in more realistic operating and engine design conditions.
- (b)
- CFD analysis of the scramjet engine through each stage of the flight profile, i.e., from subsonic to hypersonic, with altitude, cold, and combusted flow included, to gather definite performance and effects of the scramjet engine through the entire mission profile.
- (c)
- Perform scramjet combustion tests on the final aircraft for cruise conditions to evaluate the performance from a fully-integrated aircraft and engine standpoint.
- (d)
- Thermochemical non-equilibrium effects on the location of shock waves in the intake and in the expansion of high enthalpy flows for combustion [35].
Author Contributions
A.R. was the research student that conducted the detailed study and A.A.S. wrote the paper and checked the validity of the methodology and results. A.P. conceived of the project, created the layout of the investigations, and checked the computational outcome of the resultant modelling effort and subsequent discussion.
Funding
This research received no external funding.
Conflicts of Interest
The authors declare no conflict of interest.
References
- Anderson, J.D., Jr. Hypersonic and High Temperature Gas Dynamics, 2nd ed.; AIAA: Reston, VA, USA, 2006. [Google Scholar]
- Baidya, R.; Pesyridis, A.; Cooper, M. Ramjet Nozzle Analysis for Transport Aircraft Configuration for Sustained Hypersonic Flight. Appl. Sci. 2018, 8, 574. [Google Scholar] [CrossRef]
- Borgon, J. Limitations in the operational range of turbojet engines. Technica Lotnicza Astronautyczna 1977, 32, 27–29. [Google Scholar]
- Neill, S.M.; Pesyridis, A. Modeling of Supersonic Combustion Systems for Sustained Hypersonic Flight. Energies 2017, 10, 1900. [Google Scholar] [CrossRef]
- Fry, R.S. A Century of Ramjet Propulsion Technology Evolution. J. Propuls. Power 2004, 20, 27–58. [Google Scholar] [CrossRef]
- Curran, E.T. Scramjet Engines: The First Forty Years. J. Propuls. Power 2001, 17, 1138–1148. [Google Scholar] [CrossRef]
- Heiser, W.; Daley, D.; Pratt, D. Hypersonic Airbreathing Propulsion; American Institute of Aeronautics and Astronautics: Washington, DC, USA, 1994; ISBN 978-1-56347-035-6. [Google Scholar]
- Curran, E.T.; Murthy, S. Scramjet Propulsion, 1st ed.; Murthy, S.N., Ed.; Progress in Astronautics and Aeronautics; AIAA: Reston, VA, USA, 2001. [Google Scholar]
- Khandai, S.C.; Parammasivam, K.M. Experimental Study of Single Expansion Ramp Nozzle Flows (SERN) at Low Supersonic Speeds. Int. J. Mech. Mechatron. Eng. 2014, 14, 84–89. [Google Scholar]
- Bowers, D.; Laughrey, J. Survey on Techniques Used in Aerodynamic Nozzle Airframe Integration; Advisory Group for Aerospace Research and Development: Neuilly sur Seine, France, 1992. [Google Scholar]
- Perrier, P.; Rapuc, M.; Rostand, P.; Hallard, R.; Regard, D.; DuFour, A.; Pennanhoat, O. Nozzle and Afterbody Design for Hypersonic Airbreathing Vehicles. In Proceedings of the Space Plane and Hypersonic Systems and Technology Conference, Norfolk, VA, USA, 18–22 November 1996. [Google Scholar]
- Zellner, B.; Sterr, W.; Herrmann, O. Integration of Turbo-Expander and Turbo-Ramjet Engines in Hypersonic Vehicles. J. Eng. Gas Turb. Power 1994, 116, 90. [Google Scholar] [CrossRef]
- Hirschen, C.; Gulhan, A. Influence of Heat Capacity Ratio on Pressure and Nozzle Flow of Scramjets. J. Propuls. Power 2009, 25, 303–311. [Google Scholar] [CrossRef]
- Spaid, F.W.; Keener, E.R. Experimental Results for a Hypersonic Nozzle/Afterbody Flow Field. In Proceedings of the 28th Joint Propulsion Conference and Exhibit, Nashville, TN, USA, 6–8 July 1992. [Google Scholar]
- Dalle, D.J.; Torrez, S.M.; Driscoll, J.F. Reduced-Order Modeling of Reacting Supersonic Flows in Scramjet Nozzles. In Proceedings of the 46th AIAA/ASME/SAE/ASEE Joint Propulsion Conference and Exhibit, Nashville, TN, USA, 25–28 July 2010. [Google Scholar]
- Bonelli, F.; Cutrone, L.; Votta, R.; Viggiano, A.; Magi, V. Preliminary design of a hypersonic air-breathing vehicle. In Proceedings of the 17th AIAA International Space Planes and Hypersonic Systems and Technologies Conference, San Franciso, CA, USA, 11–14 April 2011. [Google Scholar]
- Thiagaraian, V.; Panneerselvam, S.; Rathakrishnan, E. Numerical Flow Visualization of Single Expansion Ramp Nozzle with Hypersonic External Flow. J. Visual. 2006, 9, 91–99. [Google Scholar] [CrossRef]
- Huang, W.; Wang, Z.; Ingham, D.B.; Ma, L.; Pourkashanian, M. Design Exploration for a Single Expansion Ramp Nozzle (SERN) Using Data Mining. Acta Astron. 2013, 83, 10–17. [Google Scholar] [CrossRef]
- Jianping, L.; Wenyan, S.; Ying, X.; Feiteng, L. Influences of Geometric Parameters upon Nozzle Performances in Scramjets. Chin. J. Aeronaut. 2008, 21, 506–511. [Google Scholar] [CrossRef] [Green Version]
- Marathe, A.G.; Thiagaraian, V. Effect of Geometric Parameters on the Performance of Single Expansion Ramp Nozzle. In Proceedings of the 41st AIAA/ASME/SAE/ASEE Joint Propulsion Conference and Exhibit, Tucson, AZ, USA, 10–13 July 2005. [Google Scholar]
- Candon, M.J.; Ogawa, H.; Dorrington, G.E. Thrust Augmentation through After-Burning in Scramjet Nozzles. Adv. Aircr. Spacecr. Sci. 2015, 2, 183–198. [Google Scholar] [CrossRef]
- Gülçat, Ü. Fundamentals of Modern Unsteady Aerodynamics, 2nd ed.; Springer: Berlin, Germany, 2006. [Google Scholar]
- Viviani, A.; Pezzella, G. Aerodynamic and Aerothermodynamic Analysis of Space Mission Vehicles; Springer: Berlin, Germany, 2015. [Google Scholar]
- Slater, J.W.; Saunders, J.D. Computational Fluid Dynamics (CFD) Simulation of Hypersonic Turbine-Based Combined-Cycle (TBCC) Inlet Mode Transition. In Proceedings of the 16th AIAA/DLR/DGLR International Space Planes and Hypersonic Systems and Technologies Conference, Bremen, Germany, 19–22 October 2009. [Google Scholar]
- Candon, M.J.; Ogawa, H. Thrust Augmentation Optimization through Supersonic After-burning in Scramjet Engine Nozzles via Surrogate-assisted Evolutionary Algorithms. Acta Astron. 2015, 116, 132–147. [Google Scholar] [CrossRef]
- Murugan, T.; De, S.; Thiagarajan, V. Validation of Three-Dimensional Simulation of Flow through Hypersonic Air-breathing Engine. Defense Sci. J. 2015, 65, 272–278. [Google Scholar] [CrossRef]
- Zhang, S.; Li, J.; Qin, F.; Huang, Z.; Xue, R. Numerical Investigation of Combustion Field of Hypervelocity Scramjet Engine. Acta Astron. 2016, 129, 357–366. [Google Scholar] [CrossRef]
- Savino, R.; Russo, G.; D’Oriano, V.; Visone, M.; Battipede, M.; Gili, P. Performances of a Small Hypersonic Airplane (HyPlane). Acta Astron. 2015, 115, 338–348. [Google Scholar] [CrossRef]
- Monta, W. Pitot Survey of Exhaust Flow Field of a 2-D Scramjet Nozzle at Mach 6 with Air or Freon and Argon Used for Exhaust Simulation; NASA-Technical Report, NASA-TM-4361; NASA Langley Research Center: Hampton, VA, USA, 1992. [Google Scholar]
- Ogawa, H.; Boyce, R. Nozzle Design Optimization for Axisymmetric Scramjets by Using Surrogate-Assisted Evolutionary Algorithms. J. Propuls. Power 2012, 28, 1324–1338. [Google Scholar] [CrossRef]
- Mcclinton, C.R. High Speed/Hypersonic Aircraft Propulsion Technology Development. In Advances on Propulsion Technology for High-Speed Aircraft; Educational Notes RTO-EN-AVT-150; RTO: Neuilly-sur-Seine, France, 2008. [Google Scholar]
- Alkaya, C.; Sam, A.A.; Pesyridis, A. Conceptual Advanced Transport Aircraft Design Configuration for Sustained Hypersonic Flight. Aerospace 2018, 5, 91. [Google Scholar] [CrossRef]
- Veeran, S.; Pesyridis, A.; Ganippa, L. Ramjet Compression System for a Hypersonic Air Transportation Vehicle Combined Cycle Engine. Energies 2018, 11, 2558. [Google Scholar] [CrossRef]
- Sen, D.; Pesyridis, A.; Lenton, A. A Scramjet Compression System for Hypersonic Air Transportation Vehicle Combined Cycle Engines. Energies 2018, 11, 1568. [Google Scholar] [CrossRef]
- Bonelli, F.; Tuttafesta, M.; Colonna, G.; Pascazio, G. An MPI-CUDA approach for hypersonic flows with detailed state-to-state air kinetics using a GPU cluster. Comput. Phys. Commun. 2017, 219, 178–195. [Google Scholar] [CrossRef]
Figure 1.
Operation envelopes of air breathing engines.

Figure 2.
2D geometries of (a) nozzle, (b) scramjet engine, and (c) aircraft and scramjet engine integration.
Figure 2.
2D geometries of (a) nozzle, (b) scramjet engine, and (c) aircraft and scramjet engine integration.

Figure 3.
3D geometries of (a) nozzle, (b) scramjet engine, and (c) aircraft and scramjet engine integration.
Figure 3.
3D geometries of (a) nozzle, (b) scramjet engine, and (c) aircraft and scramjet engine integration.

Figure 4.
Sections of 2D mesh for the nozzle (top left), scramjet engine (top right), and integrated aircraft and scramjet engine (bottom).
Figure 4.
Sections of 2D mesh for the nozzle (top left), scramjet engine (top right), and integrated aircraft and scramjet engine (bottom).

Figure 5.
3D mesh for the nozzle (top), scramjet engine (middle), and integrated aircraft and scramjet engine (bottom).
Figure 5.
3D mesh for the nozzle (top), scramjet engine (middle), and integrated aircraft and scramjet engine (bottom).

Figure 6.
Comparison of static pressure contours between Huang et al. [10] (left) and the present analysis (right).
Figure 6.
Comparison of static pressure contours between Huang et al. [10] (left) and the present analysis (right).

Figure 7.
Comparison of Mach number contours between Huang et al. [10] (left) and the present analysis (right).
Figure 7.
Comparison of Mach number contours between Huang et al. [10] (left) and the present analysis (right).

Figure 8.
Comparison of pressure distribution in the nozzle.

Figure 9.
Static pressure distribution of SERN DP351 for 80,000 ft. (top) and 100,000 ft. (bottom).

Figure 10.
Contours of Mach number for DP 351 at BCC 1.1 (top) and BCC 3.2 (bottom).

Figure 11.
Contours of velocity for DP 464 (top) and DP 102 (bottom).

Figure 12.
Mach number (left) and pressure contours (right) for DP279 (top), DP690 (middle), and DP487 (bottom).
Figure 12.
Mach number (left) and pressure contours (right) for DP279 (top), DP690 (middle), and DP487 (bottom).

Figure 13.
Pressure contours for DP471, DP640, DP52, and DP205 (clockwise from top left).

Figure 14.
SERN geometries achieving best performance parameters for BCC 3.1.

Figure 15.
Static pressure of DP102 and DP456 along the nozzle inlet centerline.

Figure 16.
Density contours of DP102 (top) and DP456 (bottom) illustrating shock structures.

Figure 17.
Mach number contours for DP102 (top) and DP456 (bottom) depicting the kernel region.

Figure 18.
Mach number profiles for different cases at distances (from top to bottom) of: 0 m, 1 m, 2 m, and 3 m from the nozzle inlet.
Figure 18.
Mach number profiles for different cases at distances (from top to bottom) of: 0 m, 1 m, 2 m, and 3 m from the nozzle inlet.

Figure 19.
Mach number (top) and pressure contours (bottom) of DP102 for cold flow (left) and hot flow (right).
Figure 19.
Mach number (top) and pressure contours (bottom) of DP102 for cold flow (left) and hot flow (right).

Figure 20.
Temperature (top) and velocity contours (bottom) of DP102 for cold flow (left) and hot flow (right).
Figure 20.
Temperature (top) and velocity contours (bottom) of DP102 for cold flow (left) and hot flow (right).

Figure 21.
Pressure and velocity contours for SERN DP456.

Figure 22.
Velocity contour of SERN DP456 with combustion at 10 m downstream of the SERN exit.

Figure 23.
Pressure variation along the scramjet for different flow types.

Figure 24.
Mach number contours for SERN DP456 with small (top) and large (bottom) side fence.

Figure 25.
Mach streamlines for SERN DP456 with small (left) and large (right) side fence.

Figure 26.
Mach contours and streamlines for SERN DP456 with the large side fence configuration at a 4.29° angle.
Figure 26.
Mach contours and streamlines for SERN DP456 with the large side fence configuration at a 4.29° angle.

Figure 27.
Velocity and density streamlines of the scramjet engine.

Figure 28.
Mach number contours of the scramjet engine with planes positioned from the nozzle inlet onwards.
Figure 28.
Mach number contours of the scramjet engine with planes positioned from the nozzle inlet onwards.

Figure 29.
Velocity streamlines and displaying the effect on the SERN performance at Mach 4.5.

Figure 30.
Mach streamlines, contours, and volume of the proposed aircraft at Mach 8.


Table 1.
2D nozzle geometric parameters with corresponding values investigated.
| Geometrical Parameters | Parameter ID | Range |
|---|---|---|
| Nozzle inlet height (m) | P1 | 1, 1.5, 2 |
| Nozzle outlet height (m) | P2 | 5.3, 7.3, 9.3 |
| Expansion ramp contour radius (m) | P3 | 50–5000 (conical) |
| Initial expansion ramp length (m) | P4 | 1.6, 3.2 |
| Initial expansion ramp angle (degree) | P5 | 10, 30 |
| Nozzle and after body length (m) | P6 | 30, 40 |
| Cowl length (m) | P7 | 3 |
| Cowl thickness (m) | P8 | 0.3 |
| Cowl ramp angle (degree) | P9 | 5.72, 33 |
Table 2.
2D mesh statistics.
| Parameters | Nozzle Only | Scramjet | Integrated Scramjet |
|---|---|---|---|
| Elements | 93,919–151,956 | 360,702 | 453,185 |
| Average skewness | 0.432 | 0.617 | 0.138 |
| Average orthogonal quality | 0.895 | 0.830 | 0.973 |
Table 3.
3D mesh statistics.
| Parameters | Nozzle Only | Scramjet | Integrated Scramjet Engine |
|---|---|---|---|
| Elements | 3,325,405 | 4,524,968 | 5,591,991 |
| Average skewness | 0.259 | 0.234 | 0.215 |
| Average orthogonal quality | 0.858 | 0.821 | 0.866 |
Table 4.
Boundary conditions for computational analysis.
| Boundary Conditions | Altitude, 80,000 ft | Altitude, 90,000 ft | Altitude, 100,000 ft |
|---|---|---|---|
| Freestream pressure | 2761 | 1730 | 1216 |
| Freestream temperature | 221 | 224 | 224 |
| Freestream Mach number | 5 | 6.5 | 8 |
Table 5.
Input parameters for the nozzle inlet conditions.
| Boundary Conditions (BCC) | BCC 1.1 | BCC 1.2 | BCC 2.1 | BCC 2.2 | BCC 3.1 | BCC 3.2 |
|---|---|---|---|---|---|---|
| 80,000 ft | 80,000 ft | 90,000 ft | 90,000 ft | 100,000 ft | 100,000 ft | |
| NI pressure | 471,112 | 425,000 | 425,000 | 365,000 | 365,000 | 335,000 |
| NI temperature | 2972 | 3030 | 3030 | 3033 | 3033 | 3048 |
| NI Mach number | 2 | 2.4 | 2.4 | 2.7 | 2.7 | 3 |
| FS (freestream) pressure | 2761 | 2761 | 1730 | 1730 | 1216 | 1216 |
| FS temperature | 221 | 221 | 224 | 224 | 224 | 224 |
| FS Mach number | 5 | 5 | 6.5 | 6.5 | 8 | 8 |
Table 6.
SERN geometries for different design points (DPs).
| DP | P1 | P2 | P3 | P4 | P5 | P6 | P7 | P8 | P9 | Pexit | Expansion |
|---|---|---|---|---|---|---|---|---|---|---|---|
| 351 | 1 m | 9.3 m | 5000 m | 3.2 m | 10° | 30 m | 3 m | 0.3 m | 5.72° | 2695 | Over |
| 470 | 1.5 m | 9.3 m | 5000 m | 3.2 m | 10° | 40 m | 3 m | 0.3 m | 33° | 2835 | Under |
| 1524 | 1.5 m | 9.3 m | 5000 m | 3.2 m | 10° | 30 m | 3 m | 0.3 m | 5.72° | 2846 | Under |
Table 7.
SERN geometries which yield maximum thrust at 30 m and 40 m expansion ramp length for BCC 3.2.
Table 7.
SERN geometries which yield maximum thrust at 30 m and 40 m expansion ramp length for BCC 3.2.
| DP | P1 | P2 | P3 | P4 | P5 | P6 | P7 | P8 | P9 | Axial Thrust |
|---|---|---|---|---|---|---|---|---|---|---|
| 102 | 2 m | 9.3 m | 65 m | 1.6 m | 10° | 30 | 3 | 0.3 m | 33° | 5,668,441 N |
| 544 | 2 m | 9.3 m | 125 m | 1.6 m | 10° | 40 | 3 | 0.3 m | 5.72° | 5,063,079 N |
Table 8.
Maximum axial thrust for varying nozzle area ratios of SERN.
| DP | P1 | P2 | P3 | P4 | P5 | P6 | P7 | P8 | P9 | Area Ratio | Axial Thrust (N) |
|---|---|---|---|---|---|---|---|---|---|---|---|
| 102 | 2 m | 9.3 m | 65 m | 1.6 m | 10° | 30 | 3 | 0.3 | 33 | 4.65 | 5,668,441 |
| 456 | 2 m | 7.3 m | 90 m | 1.6 m | 10° | 30 | 3 | 0.3 | 5.72 | 3.65 | 5,144,993 |
| 623 | 1.5 m | 7.3 m | 90 m | 1.6 m | 10° | 30 | 3 | 0.3 | 5.72 | 4.87 | 4,333,759 |
| 86 | 1.5 m | 9.3 m | 60 m | 1.6 m | 10° | 30 | 3 | 0.3 | 33 | 6.2 | 3,990,316 |
| 68 | 1 m | 9.3 m | 57.5 m | 1.6 m | 10° | 30 | 3 | 0.3 | 33 | 9.3 | 2,833,642 |
Table 9.
SERN geometries for best performance.
| DP | P1 | P2 | P3 | P4 | P5 | P6 | P7 | P8 | P9 |
|---|---|---|---|---|---|---|---|---|---|
| 102 | 2 m | 9.3 m | 65 m | 1.6 m | 10° | 30 | 3 | 0.3 | 33 |
| 471 | 1 m | 9.3 m | 5000 m | 3.2 m | 10° | 40 | 3 | 0.3 | 5.72 |
| 633 | 1.5 m | 9.3 m | 75 m | 1.6 m | 30° | 30 | 3 | 0.3 | 5.72 |
| 487 | 1.5 m | 7.3 m | 200 m | 3.2 m | 10° | 40 | 3 | 0.3 | 5.72 |
| 456 | 2 m | 7.3 m | 90 m | 1.6 m | 10° | 30 | 3 | 0.3 | 5.72 |
Table 10.
SERN DP102 overall performance at each BCC.
| Nozzle Inlet Conditions | BCC 1.1 | BCC 1.2 and 2.1 | BCC 2.2 and 3.1 | BCC 3.2 |
|---|---|---|---|---|
| Axial thrust (N) | 4,084,299 | 4,918,431 | 5,144,993 | 5,668,440 |
| Estimated net thrust | N/A | N/A | 4,874,588 | 5,263,095 |
| Nozzle divergence coeff. | 0.934 | 0.934 | 0.934 | 0.934 |
| Lift coeff. | −0.107 | −0.153 | −0.200 | −0.228 |
| Drag coefficient | 0.139 | 0.155 | 0.166 | 0.173 |
| Moment coefficient | 0.112 | 0.069 | 0.021 | −0.0102 |
| Exit velocity | 2929 | 3245 | 3519 | 3809 |
| Exit pressure | 21,061 | 22,069 | 20,723 | 20,509 |
| Nozzle expansion | under | under | under | Under |
Table 11.
Performance comparison of different nozzle inlet conditions at 10,000 ft. and Mach 8.
| Nozzle Inlet Conditions | Uniform DP102 | Uniform DP456 | Cold DP102 | Cold DP456 | Hot DP102 | Hot DP456 | Hot DP456-2 |
|---|---|---|---|---|---|---|---|
| Axial thrust (N) | 5,144,993 | 4,829,270 | 2,117,356 | 1,992,168 | 2,316,858 | 2,085,313 | 2,098,602 |
| Estimated Net Thrust | 4,874,588 | 4,467,074 | 1,826,559 | 1,732,003 | 2,067,173 | 1,836,564 | 1,873,415 |
| Exit velocity (m/s) | 3518 | 3474 | 2223 | 2423 | 2523 | 2482 | 2500 |
| Exit Pressure | 20,722 | 20,098 | 838 | 558 | 1826 | 2122 | 2083 |
Table 12.
Performance comparison of different nozzle conditions at 100,00 ft. and Mach 8.
| Nozzle Inlet Conditions | 2D DP456 | 3D Small Fence 0° Fence Angle | 3D Large Fence 0° Fence Angle | 3D Large Fence 4.29° Fence Angle |
|---|---|---|---|---|
| Axial thrust (N) | 4,829,270 | 7,533,145 | 13,321,487 | 14,741,256 |
| Estimated net Thrust (N) | 4,467,074 | 6,179,926 | 12,269,893 | 13,775,863 |
| Exit velocity (m/s) | 3474 | 2587 | 2502 | 2468 |
| Exit pressure (Pa) | 20,098 | 4732 | 11,848 | 13,893 |
© 2018 by the authors. Licensee MDPI, Basel, Switzerland. This article is an open access article distributed under the terms and conditions of the Creative Commons Attribution (CC BY) license (http://creativecommons.org/licenses/by/4.0/).
Share and Cite
MDPI and ACS Style
Ridgway, A.; Sam, A.A.; Pesyridis, A. Modelling a Hypersonic Single Expansion Ramp Nozzle of a Hypersonic Aircraft through Parametric Studies. Energies 2018, 11, 3449. https://doi.org/10.3390/en11123449
AMA Style
Ridgway A, Sam AA, Pesyridis A. Modelling a Hypersonic Single Expansion Ramp Nozzle of a Hypersonic Aircraft through Parametric Studies. Energies. 2018; 11(12):3449. https://doi.org/10.3390/en11123449
Chicago/Turabian StyleRidgway, Andrew, Ashish Alex Sam, and Apostolos Pesyridis. 2018. "Modelling a Hypersonic Single Expansion Ramp Nozzle of a Hypersonic Aircraft through Parametric Studies" Energies 11, no. 12: 3449. https://doi.org/10.3390/en11123449
Note that from the first issue of 2016, this journal uses article numbers instead of page numbers. See further details here.