Energy Management System for the Photovoltaic Battery Integrated Module
by
 , ,
, ,
Victor Vega-Garita
* ,
,
Muhammad Faizal Sofyan
,
Nishant Narayan
,
Laura Ramirez-Elizondo
and
Pavol Bauer
Department of Electrical Sustainable Energy, Delft University of Technology, P.O. Box 5031, 2600 GA Delft, The Netherlands
*
Author to whom correspondence should be addressed.
Energies 2018, 11(12), 3371; https://doi.org/10.3390/en11123371
Submission received: 31 October 2018
/
Revised: 20 November 2018
/
Accepted: 25 November 2018
/
Published: 2 December 2018
(This article belongs to the Special Issue Solar Energy Harvesting, Storage and Utilization)
Abstract
:Given the complementary nature of photovoltaic (PV) generation and energy storage, the combination of a solar panel and a battery pack in one single device is proposed. To realize this concept, the PV Battery Integrated Module (PBIM), it is fundamental to analyze the system architecture and energy management. This paper focuses on selecting a suitable architecture among the different options, while also indicating the control strategy that the converters must follow to ensure appropriate performance. Also, several modes of operation for the complete system are introduced to implement energy management. For the selected DC architecture, two case studies, viz. off-grid and peak-shaving for a grid-tied system, were employed to characterize the response of the model demonstrating its utility to perform maximum power-point tracking, excess solar power curtailment, and battery charging and discharging. The proposed control and system architecture prove to be feasible for a PV battery-integrated device such as PBIM.
1. Introduction
Solar photovoltaic (PV) energy has been defined as one of the renewable energy sources that can help ameliorate the dependence on fossil fuels for generating electricity to transition towards a more sustainable future [1,2]. Consequently, the amount of PV installed capacity has skyrocketed in recent years, leading to a reduction in cost per Watt [3]. However, along with the rise in solar generation, challenges related to relatively high PV penetration rates started to appear. In countries such as Germany, problems associated with PV overproduction concerning instabilities into the electric grid were identified [4].
For this reason, energy storage technologies have been proposed not just to take care of high production moments but also to provide ancillary services [5]. Batteries, for instance, can be used to store energy in the day and supply energy during the night [6], decreasing the dependency on the grid while avoiding the need for new centralized generation plants. Solar energy stored in batteries might also favor a smarter power delivery, allowing the allocation of energy in moments of peak consumption or in events of blackout [7,8].
Having defined the importance of combining PV panels and battery packs, it must be noted that the total cost of such a combined system needs further reduction. Even though Li-ion battery prices are falling fast and continue to happen for solar panels, other costs such as installation and the balance of system components (BoS) price are becoming more predominant [9,10]. To diminish the total system cost, new PV battery-integration approaches have been introduced.
One of them is the PV Battery Integrated Module (PBIM) [11]. The PBIM is a device that integrates the BoS, viz. battery pack and power electronics, and a PV module in one single unit. This unit is composed of a PV panel, battery pack, and the necessary power electronic converters [12]. A PBIM is expected to act as a building block that enables a system to scale up when more energy generation or storage is required. This might contribute to decreasing the costs related to PV-system design together with easing the installation process.
1.1. Related Literature
The coordination between solar production and energy storage devices is fundamental; for this reason, several energy management systems (EMS) have been proposed in the literature [13,14]. In [15], self-consumption is prioritized taking into account the electricity prices using model-based predictive control. The same control concept has been used to enable peak-shaving in grid-tied systems, including day ahead information to improve the effectiveness of the power management [16].
A previous paper has integrated a solar panel together with a servomotor, power electronics, and batteries that can be mounted in a wall; the PV panel position is dynamically controlled via a single axis solar tracker, demonstrating its applicability for a constant load [17]. In the case of static physically integrated PV battery systems, such as the PBIM, several studies have touched upon the energy management system and system architectures. According to [18], several commercial components can be picked based on the characteristics of the systems and coupled to operate the device. One element optimizes the PV output, while the charging and discharging processes are controlled in two different power stages. However, it is not clear how the power flows are controlled and which kind of auxiliary services a device such as this can perform.
Similarly, in [19], an electronic control unit includes a converter in charge of performing maximum power-point tracking (MPPT), a battery charge/discharge controller, and a battery management system. Particular interest is given to the battery management [20], where battery operation conditions are monitored closely including state of health, temperature, and state of charge levels. As a continuation, a boost converter is proposed to take care of the PV optimal operation, wherein three switches control the power flow [21]. There, just three modes are allowed: PV directly to load, PV to battery, or battery to load. Despite the progress shown in the previous papers, a detailed analysis of the different architectures that can be used in integrated devices has not been explored. Neither the application of this kind of device to both off-grid and grid-connected (peak-shaving) systems using a common architecture, nor the possibility to use the battery together with the solar power to supply the load in particular cases have been thoroughly analyzed.
Therefore, this paper focuses on choosing a suitable electrical architecture for the PBIM that enables the advantages provided using a smart energy management system. The converter’s control is also proposed to be able to perform MPPT, PV curtailment, and battery charging or discharging for an off-grid and peak-shaving case studies.
1.2. Contributions
This paper contributes towards
- selecting a suitable system architecture for a PV battery integrated device based on limitations defined by the PV battery integrated module,
- proposing a control method to manage the DC/DC converters to follow defined modes of operation such as MPPT, excess solar curtailment, and battery charging and discharging.
2. System Architecture
This section presents three system architectures that could be used to control the PBIM together with a qualitative analysis of their advantages and disadvantages with the objective to find the most suitable one.
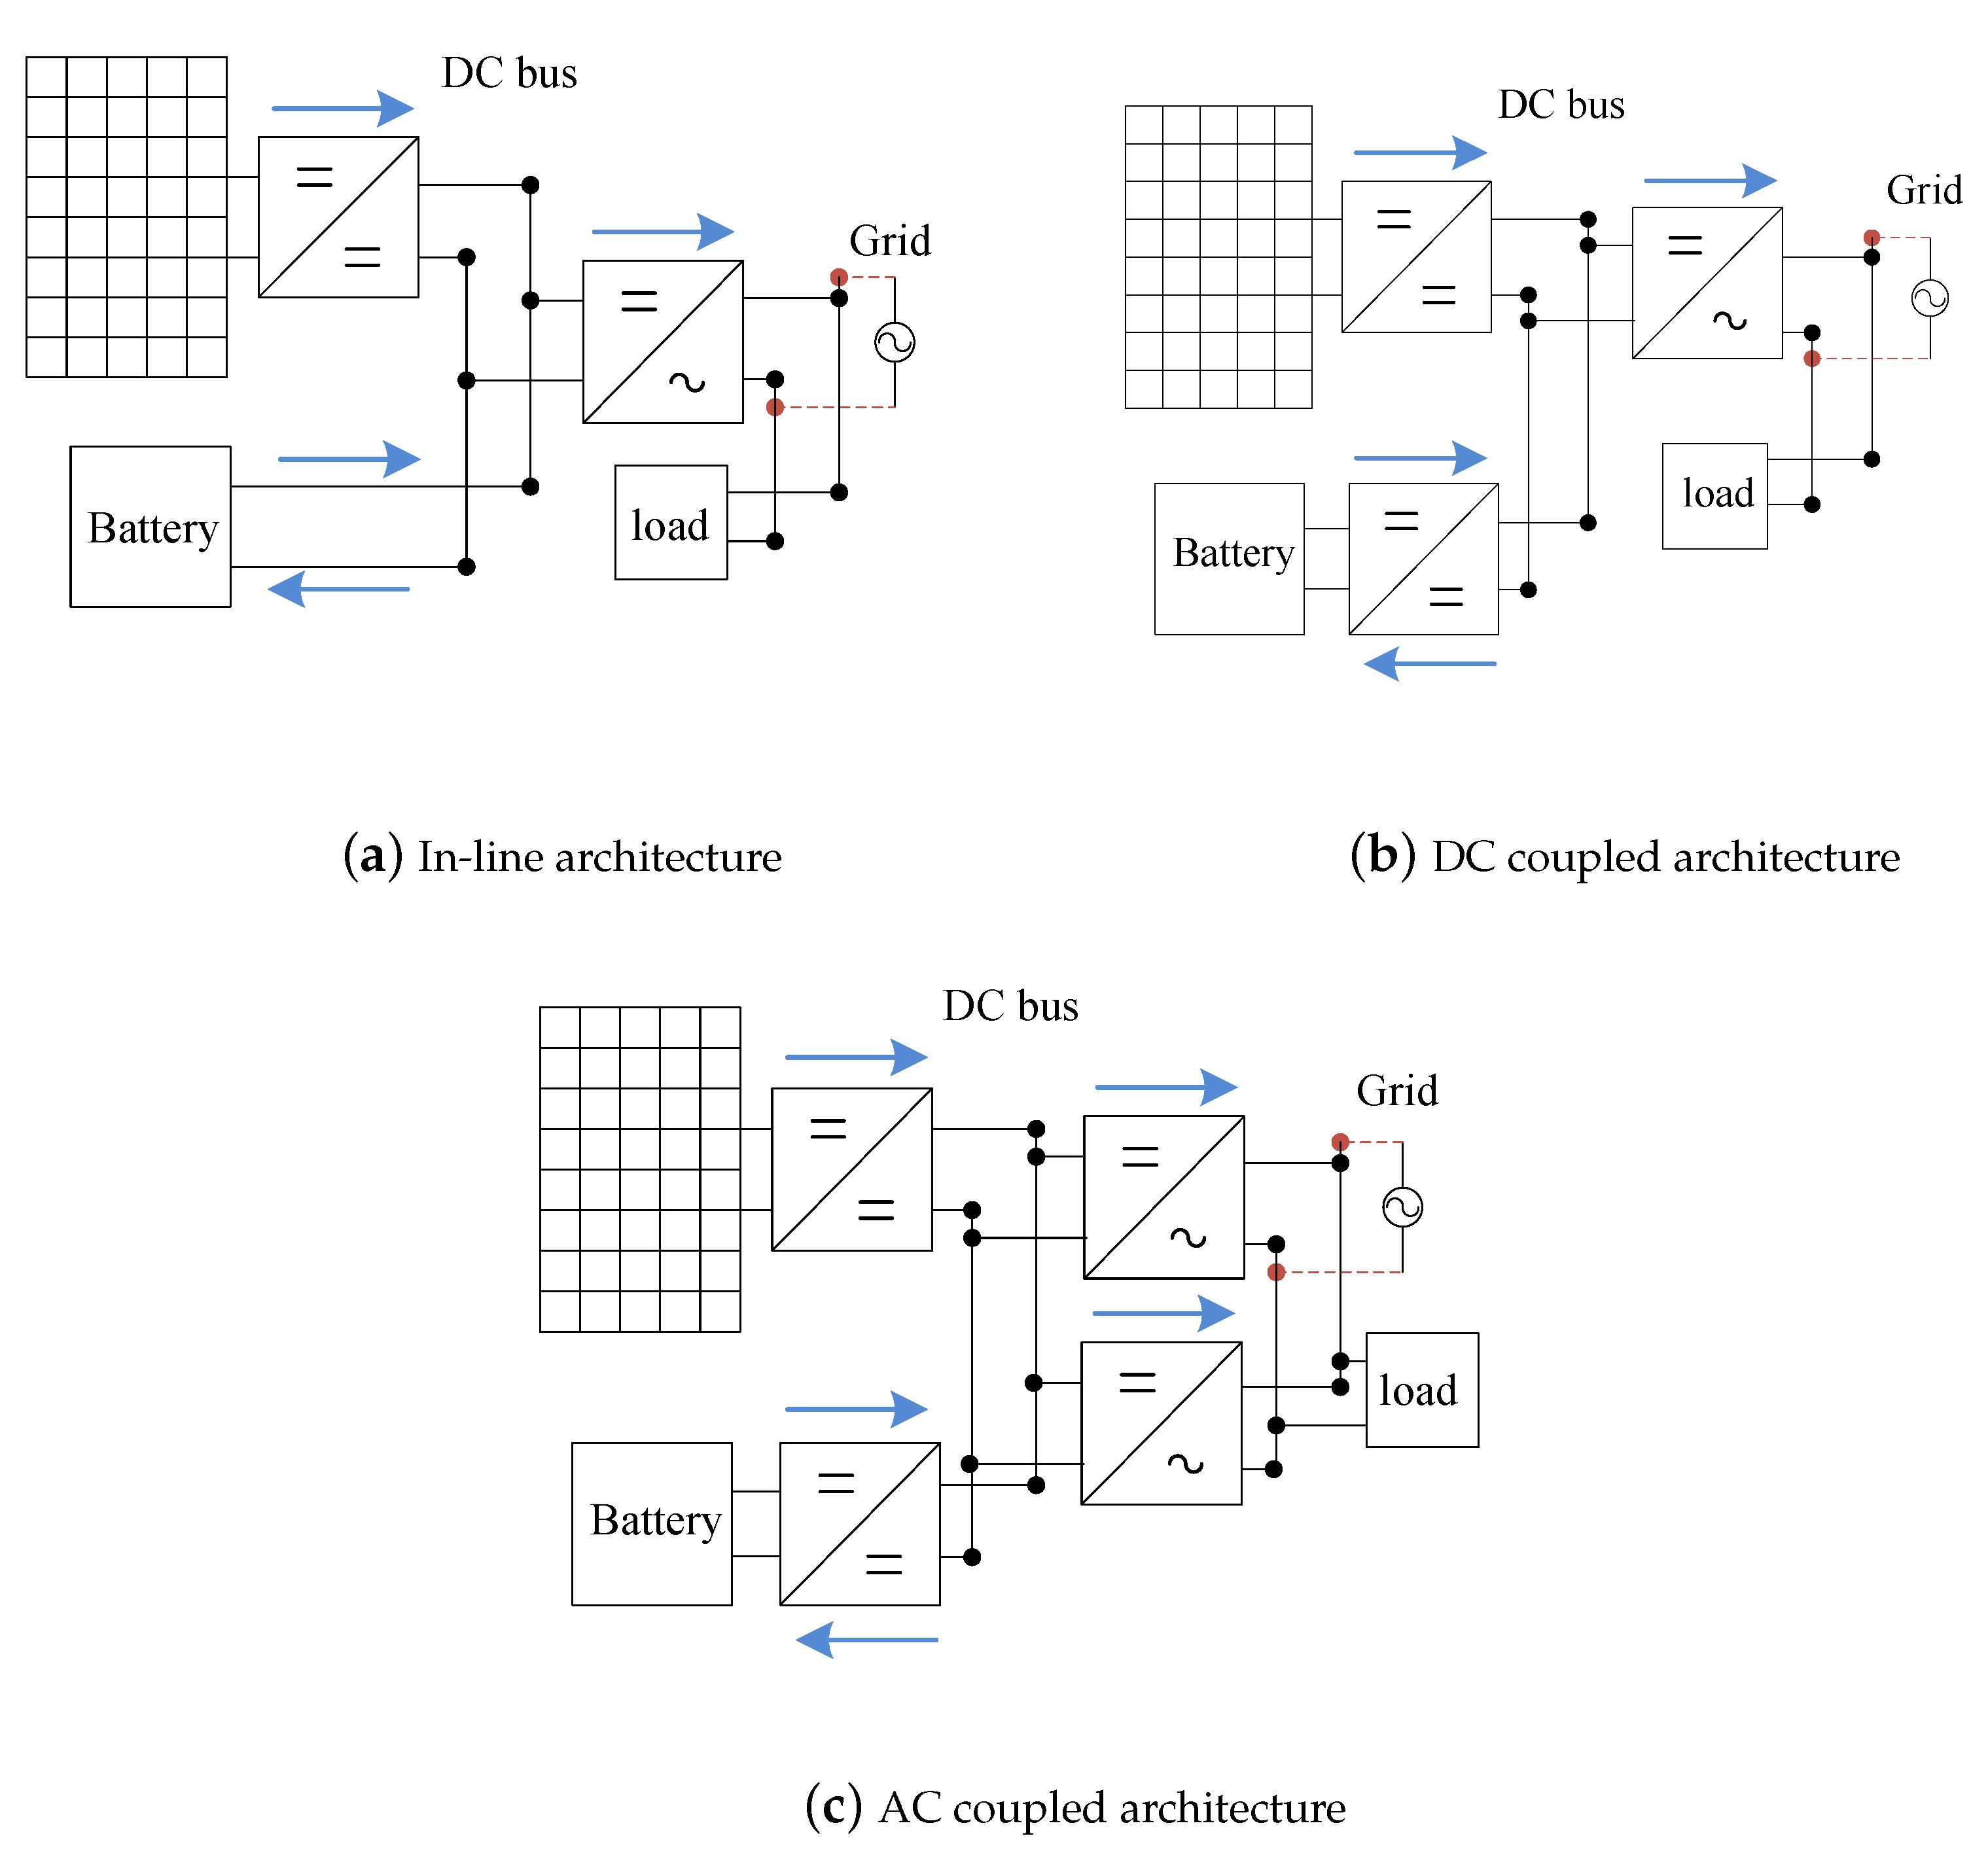
2.1. In-Line
This architecture is the simplest due to its minimum amount of components (Figure 1a), two unidirectional DC/DC and DC/AC converters. The DC/DC converter takes care of performing MPPT, and it is typically sized based on the rated PV power. The inverter, on the other hand, must be sized not just by considering the maximum PV output but also taking into account the maximum load power demand and the battery highest power defined by the manufacturer or application. This is because at specific instances both PV and battery could supply the load at maximum power if demanded by the load.
Contrary to the PV panel, which is attached to the DC bus through a DC/DC converter, the battery is linked directly to the DC bus, which could compromise its safety and maximum battery capacity [22]. As the battery can charge or discharge at fast rates while reaching low and high voltages, in the absence of a converter, battery’s safety and lifetime could be negatively affected [23]. Moreover, the size (capacity) of the battery pack in such a configuration is restricted by the fixed voltage of the DC bus. Additionally, because the voltage of battery sets the bus voltage, the input voltage perceived by inverter would change accordingly, inducing instabilities.
2.2. DC Coupled
In comparison to the previous architecture, the battery pack is coupled to a bidirectional converter, see Figure 1b. In terms of components sizing, the battery pack is not limited by the defined DC bus voltage, resulting in a more flexible architecture. The battery converter and inverter power rating are decided based on the load maximum allowable power. By adding the battery converter, the DC bus can be controlled and monitor more easily while protecting the battery pack. Also, the input voltage of the inverter would be more stable.
However, because just one DC/AC converter is used, its power rating is limited by the PV and battery ratings. Moreover, the DC/AC converter is likely to fail as the power from both energy sources is processed through the DC/AC converter [24]. This issue also holds for the previous architecture.
2.3. AC Coupled
In an AC coupled architecture, the PV panel and the battery pack share a single AC bus (Figure 1c). From the PV side, this architecture is composed of a unidirectional DC/DC converter and an additional inverter, while from the battery side the DC/DC converter must be bidirectional along with an individual inverter.
This architecture provides flexibility regarding system sizing as the battery pack and solar panel ratings can be chosen in an independent manner; therefore, the system could be updated more easily. However, since this architecture has two DC/AC converters, their phases must be synchronized, requiring the implementation of phase control, increasing the complexity of the controller.
In this architecture, the battery pack and the PV panel ratings can be chosen independently, providing flexibility regarding system sizing and enabling modularity, i.e., PV or battery sizes could upgrade without changing inverter size. However, the phase of both inverters must be synchronized, requiring the implementation of phase control and increasing the complexity of the controller.
2.4. Selecting the Architecture
Although the simplest architecture is the in-line, the issues related to safety and negative impact on lifetime together with the DC bus voltage instability make this architecture discardable. Both the DC and the AC couple architectures avoid this problem. Consequently, control complexity is selected as a critical parameter to decide between these two architectures. In this regard, the AC coupled architecture is more complicated than the DC coupled, as fewer converters need to be controlled along with the fact that an additional stage must be added to ensure phase synchronization. As a result, for PBIM the DC coupled architecture is selected and will be used from now on in this paper.
In this paper, the DC voltage has been set to be higher than the PV voltage and the maximum battery voltage cells completely charged. Therefore, for the solar panel, a unidirectional boost converter is required to increase the voltage from to the DC bus voltage reference. Also, a buck-boost converter is selected for the battery to step up the voltage when power is extracted from the battery, and to step down the bus voltage when battery is directly powered from solar. The battery voltage is based on the amount of batteries connected series. For instance, for the off-grid cases study the defined DC bus voltage was 36V; therefore, 10 cells are the maximum that can be connected in series. Otherwise, the battery voltage could surpass the DC bus voltage for LiFePO technology.
3. Controlling the Converters
In this section, the procedure followed to define the power flow directions and control the converters for the chosen architecture is proposed. For doing so, various modes of operation and control methods are introduced to adjust the duty cycle of the converters and to ensure an efficient power delivery within the operating limits. It is important to clarify that inverter operates in constant modulation while the DC bus is kept at its reference value, which allows us to avoid the inverter’s control for simplicity of the presented analysis.
3.1. PV Converter
The PV converter is a unidirectional boost converter in charge of performing MPPT and PV curtailment. By setting a voltage reference, the DC/DC converter discriminates between these two modes of operation.
3.1.1. MPPT and Curtailment
The PV voltage reference is set based on the desired converter mode of operation as can be seen in Figure 2a.
When the MPPT mode is inactive, the PV-curtail mode of operation sets voltage reference; otherwise, the PV panel will operate at MPP. Equation (1) is employed to determine the solar power output () when the MPPT condition is met, whereas Equation (2) defines it when the PV curtailment mode is active
Among the various methods to achieve MPP tracking, the incremental conductance MPPT method was used in this article based on a previous paper [25].
The PV curtailment is related to the instances where the PV generation exceeds the energy needed by the load, and the battery is not able to store the excess. In off-grid systems, the PV power must be dumped to maintain the power balance and a constant DC voltage. Once the unbalance is detected, the operating point of the PV panel should be shifted to a region that results in lower PV efficiency. To accomplish this, the PV voltage reference is slightly increased moving the operating point of the solar panel to the right of the power-voltage curve, while reducing the power. Even though the rate of change at the right side of the power-voltage curve is faster than a voltage change to the left side regarding power reduction, it is beneficial for the boost converter as it can operate in a narrow duty cycle range with a small change in PV voltage. This concept, which defines , is used for feedback loop control of the DC/DC boost converter as the PV voltage reference.
3.1.2. Boost Converter
To determine the duty cycle of the converter switch (SW 1), the feedback loop control shown in Figure 2b is used. The feedback loop control consists of two proportional-integral (PI) controllers; the first loop sets the panel current and the second the voltage.
The reference voltage of the panel is obtained from the MPPT or curtailment process as indicated previously. After that, the pulse width modulation (PWM) generator receive the information, which is a result of the previously determined D’ (see Equation (A4)). Please refer to Appendix A.1, where the equations and coefficients used for this converter are summarized.
3.2. Battery Converter (Buck-Boost)
Figure 2c presents the feedback control loop that defines the required duty cycle for the switches SW 2 () and SW 3 (1-) (see Equation (A8)). They are estimated based on two PI controllers; the first of them set the battery current while the second the DC bus voltage. As previously described, the PWM establishes the duty cycles of SW 2 and SW 3 to set the bus voltage.
3.3. Modes of Operation
To study the power flow directions, 7 modes of operation have been found to describe all the possible cases. These modes are represented in Figure 3 and are explained as follows.
- Mode 1: PV produces power at MPP, while the battery is discharging with the bidirectional converter boosting the voltage. The inverter is active, and the load is satisfied
- Mode 2: PV produces power at MPP, while the battery is charging with the bidirectional converter stepping down the voltage. The inverter is on, and the load is connected.
- Mode 3: The solar panel is disconnected, and the converter switched off. The battery is discharged while the converter boosts the voltage, the DC/AC converter is active, and the load is powered.
- Mode 4: The PV produces power at a lower value than MPP, while the battery is discharging with the bidirectional converter boosting the voltage. The inverter is active, and the load is powered. This mode is only present in the off-grid case study as the surplus cannot be taken by the electricity grid.
- Mode 5: All the converters are switched off. This tends to occur in when the battery is empty at night.
- Mode 6: The solar generation performing at MPPT is solely supplying the load. This mode occurs only on the peak-shaving case when the battery is full, and its energy is saved to be used in peak times.
- Mode 7: The PV power generated at MPP is exclusively used to charge the battery while the bidirectional converter steps down the voltage.
Similarly, Table 1 summarizes the relationship between the modes of operation and the activity of the converters.
Please refer to Appendix A.1, where the transient analysis is performed to the PV and battery converters. The equations and coefficients used to control the converters are also presented in Appendix A.1.
4. Energy Management
In this section, two case studies are explored: an off-grid and peak-shaving for a grid-connected system. The particularities of each one, the power balance equations, and the energy management criteria are introduced as follows.
4.1. Off-Grid
Off-grid solar systems only rely upon the PV power and store energy inside the batteries to supply the load, and consequently, a smart energy management is fundamental to administrate moments of energy deficit and excess. As introduced by Figure 4a, the solar energy must be used to directly supply the load and the energy surplus stored in the batteries to be used during the night. However, sometimes the solar generation is not enough and must be complemented by discharging the batteries. Other times, the solar energy is abundant and the batteries full. Therefore, the solar generation should be curtailed to maintain the power balance.
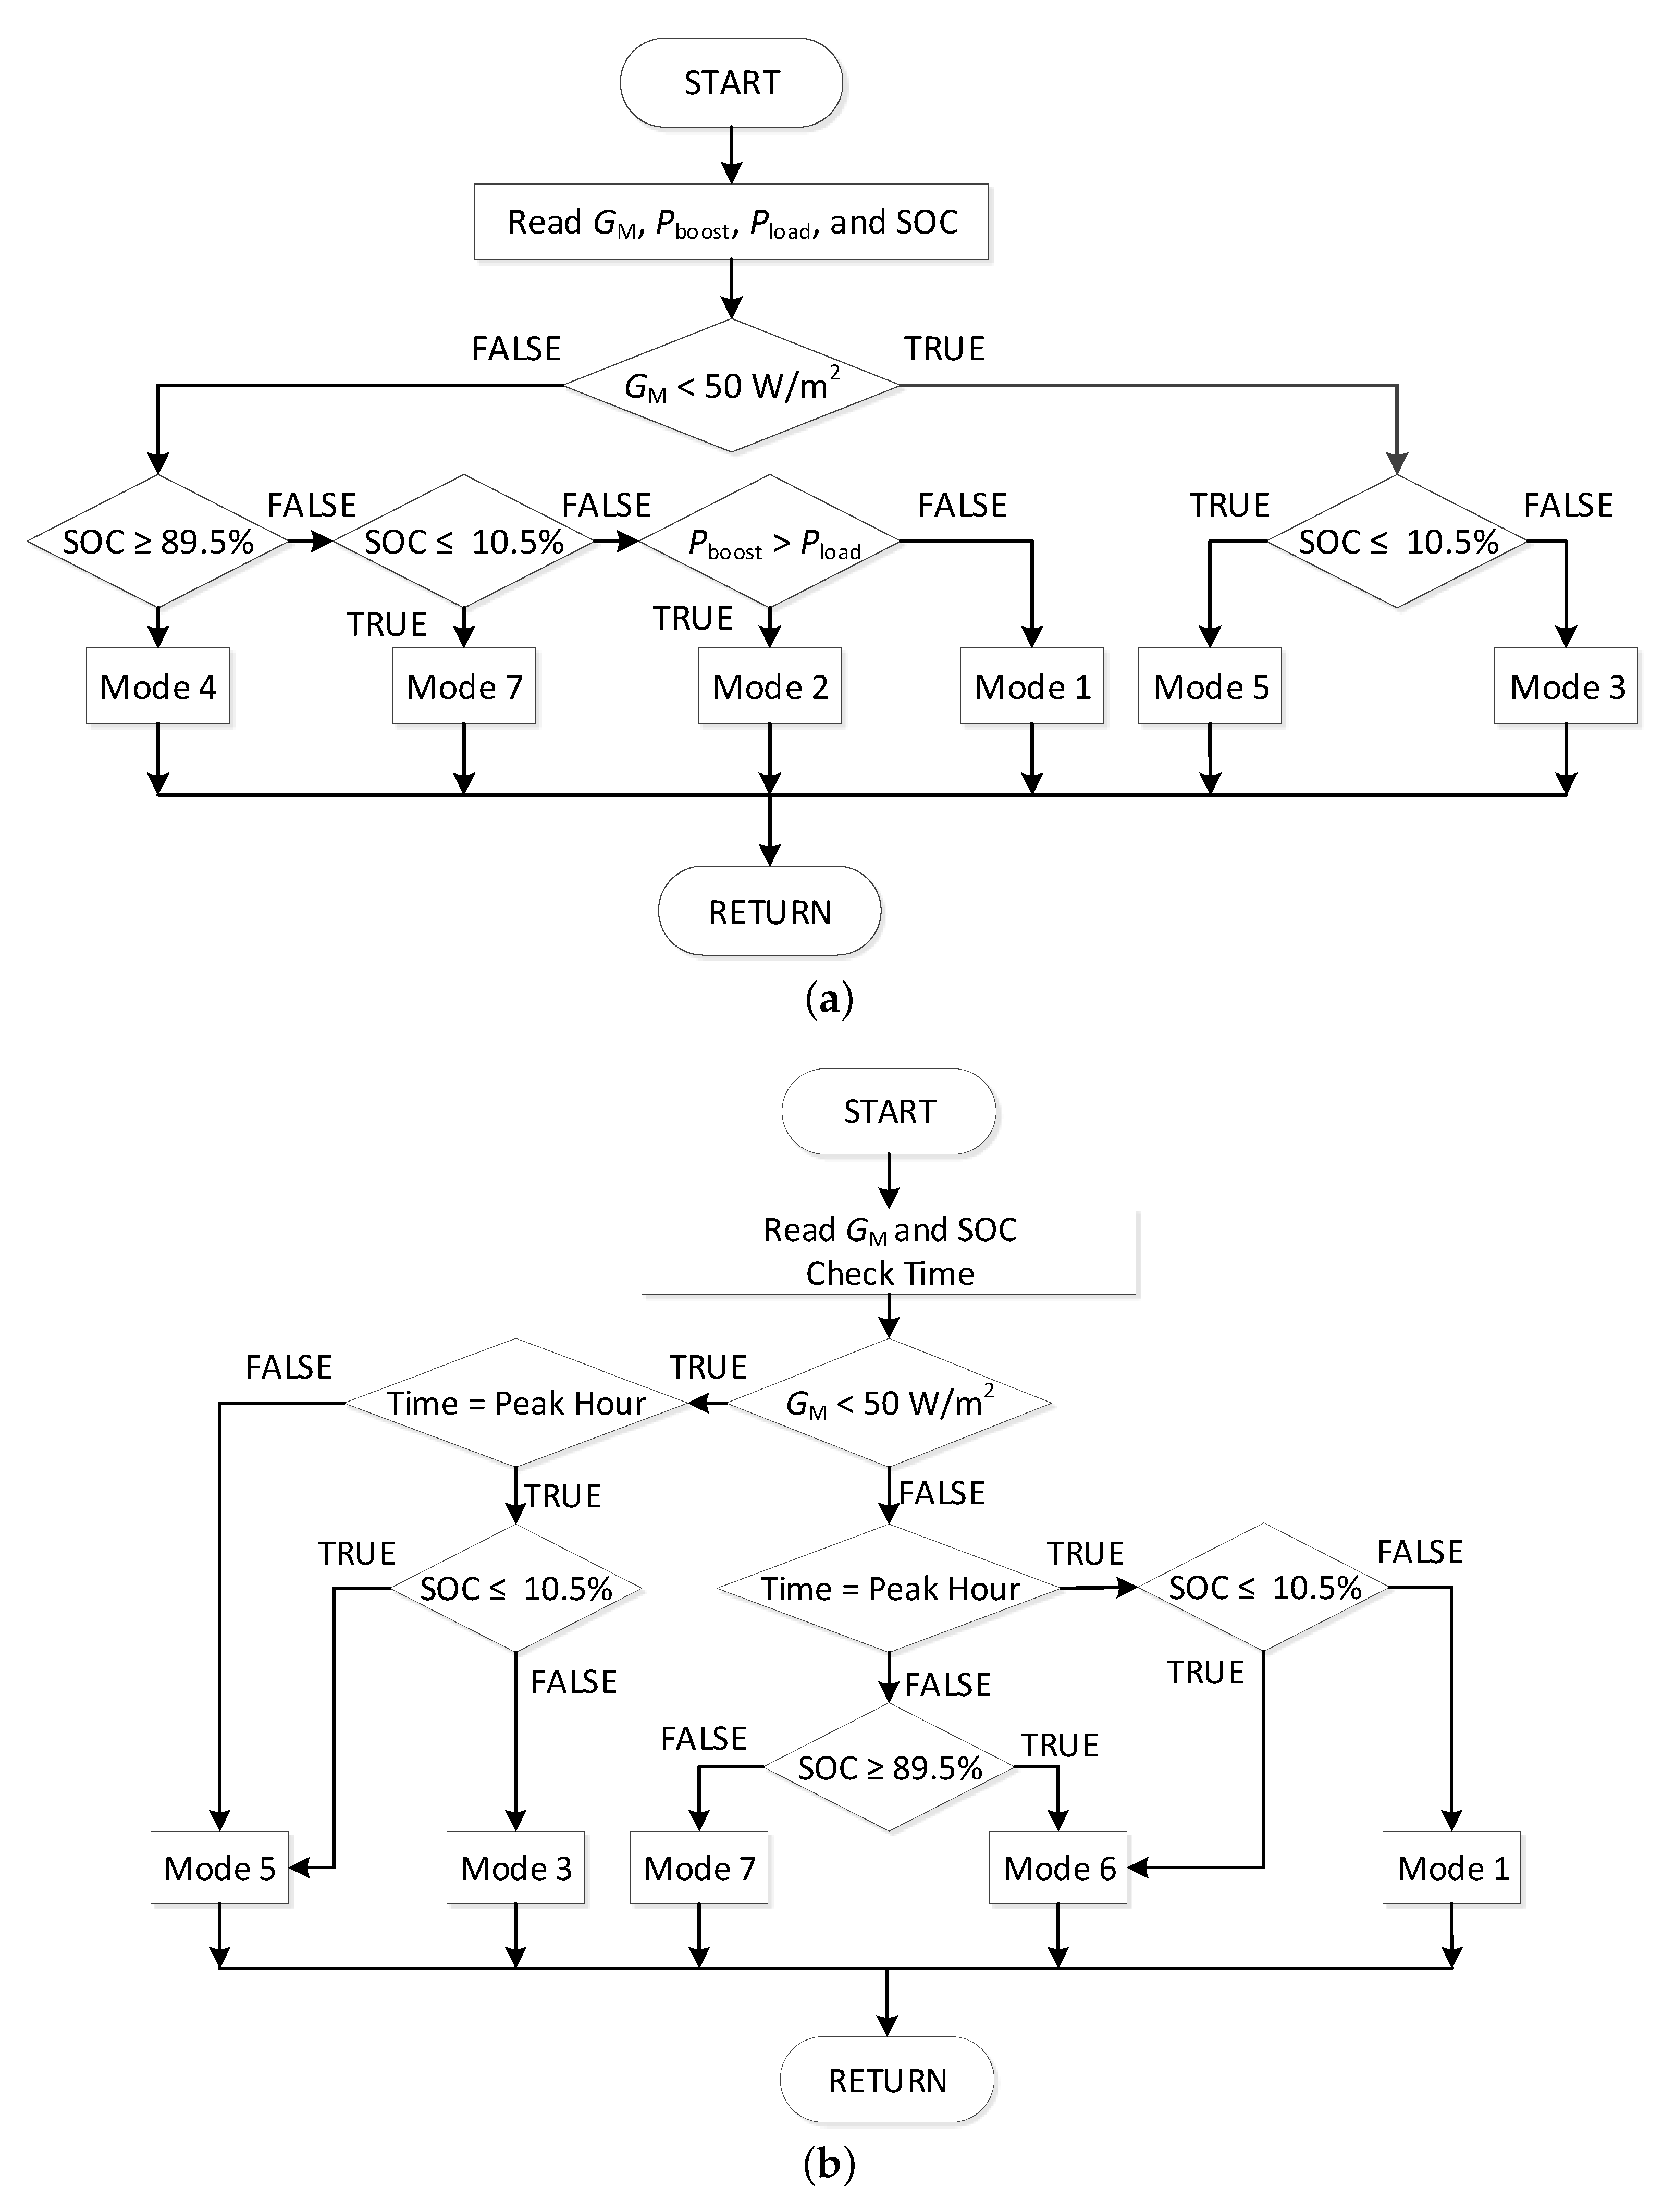
The power flow is decided based on the flowchart shown in Figure 5a, where the upper and lower limits for the SOC are set to determine the modes of operation. Six modes are used in this application, and the power balance equations for each mode are introduced as follows.
- Mode 1
- Mode 2
- Mode 3
- Mode 4
- Mode 5
- Mode 7
Due to the difficulty to match the load when performing PV curtailment (mode 4), a new intermediate SOC upper level (85%) is introduced to prevent sudden and frequent changes between modes 2 and 4. If mode 4 was operational in the previous time step, and the SOC is higher than 85%, mode 4 remains operational in the current time step mode prevails until SOC is lower than 85%.
Also, an intermediate SOC lower level is employed to prevent sudden changes between modes 1 and 7. When the mode 7 was active previously and the SOC is below 15%, the integrated module keeps operating in mode 7 as long as SOC is above 15%, as can be appreciated in Section 6.1.2.
4.2. Peak-Shaving
In peak-shaving applications, the primary purpose is to partially supply the residential load by a combination of previously stored solar energy from the battery and instantaneous solar during peak times to reduce the electricity bill. Unlike off-grid systems, where the reliability of the system only relies on the battery pack and solar energy, the load can be met by using energy from the grid. Therefore, the power flows must be managed differently. In this case, the battery is charged directly from solar energy, and once it is full the PV production can be used to also deliver power to the load as Figure 4b shows.
According to the flowchart depicted in Figure 5b, the definition of peak is related to a particular time in a day. The charging and discharging times can be programmed while checking if the actual battery SOC is between the defined limits. Only modes 1, 3, 5, 6, and 6 are used in the off-grid. The power balance for all the modes is as follows.
- Mode 1
- Mode 3
- Mode 5
- Mode 6
- Mode 7
Mode 3 is active during peak load times when the PV production is insufficient, and at the same time, the battery has remaining energy (SOC above lower limit). In that case, the battery is discharged to power the load; the grid can also partially supplied the load if required.
4.3. Constant Power
This case is to examine the ability of the PBIM to supply a load that consumes constant power by adjusting the PV generation and battery operation.
5. Model
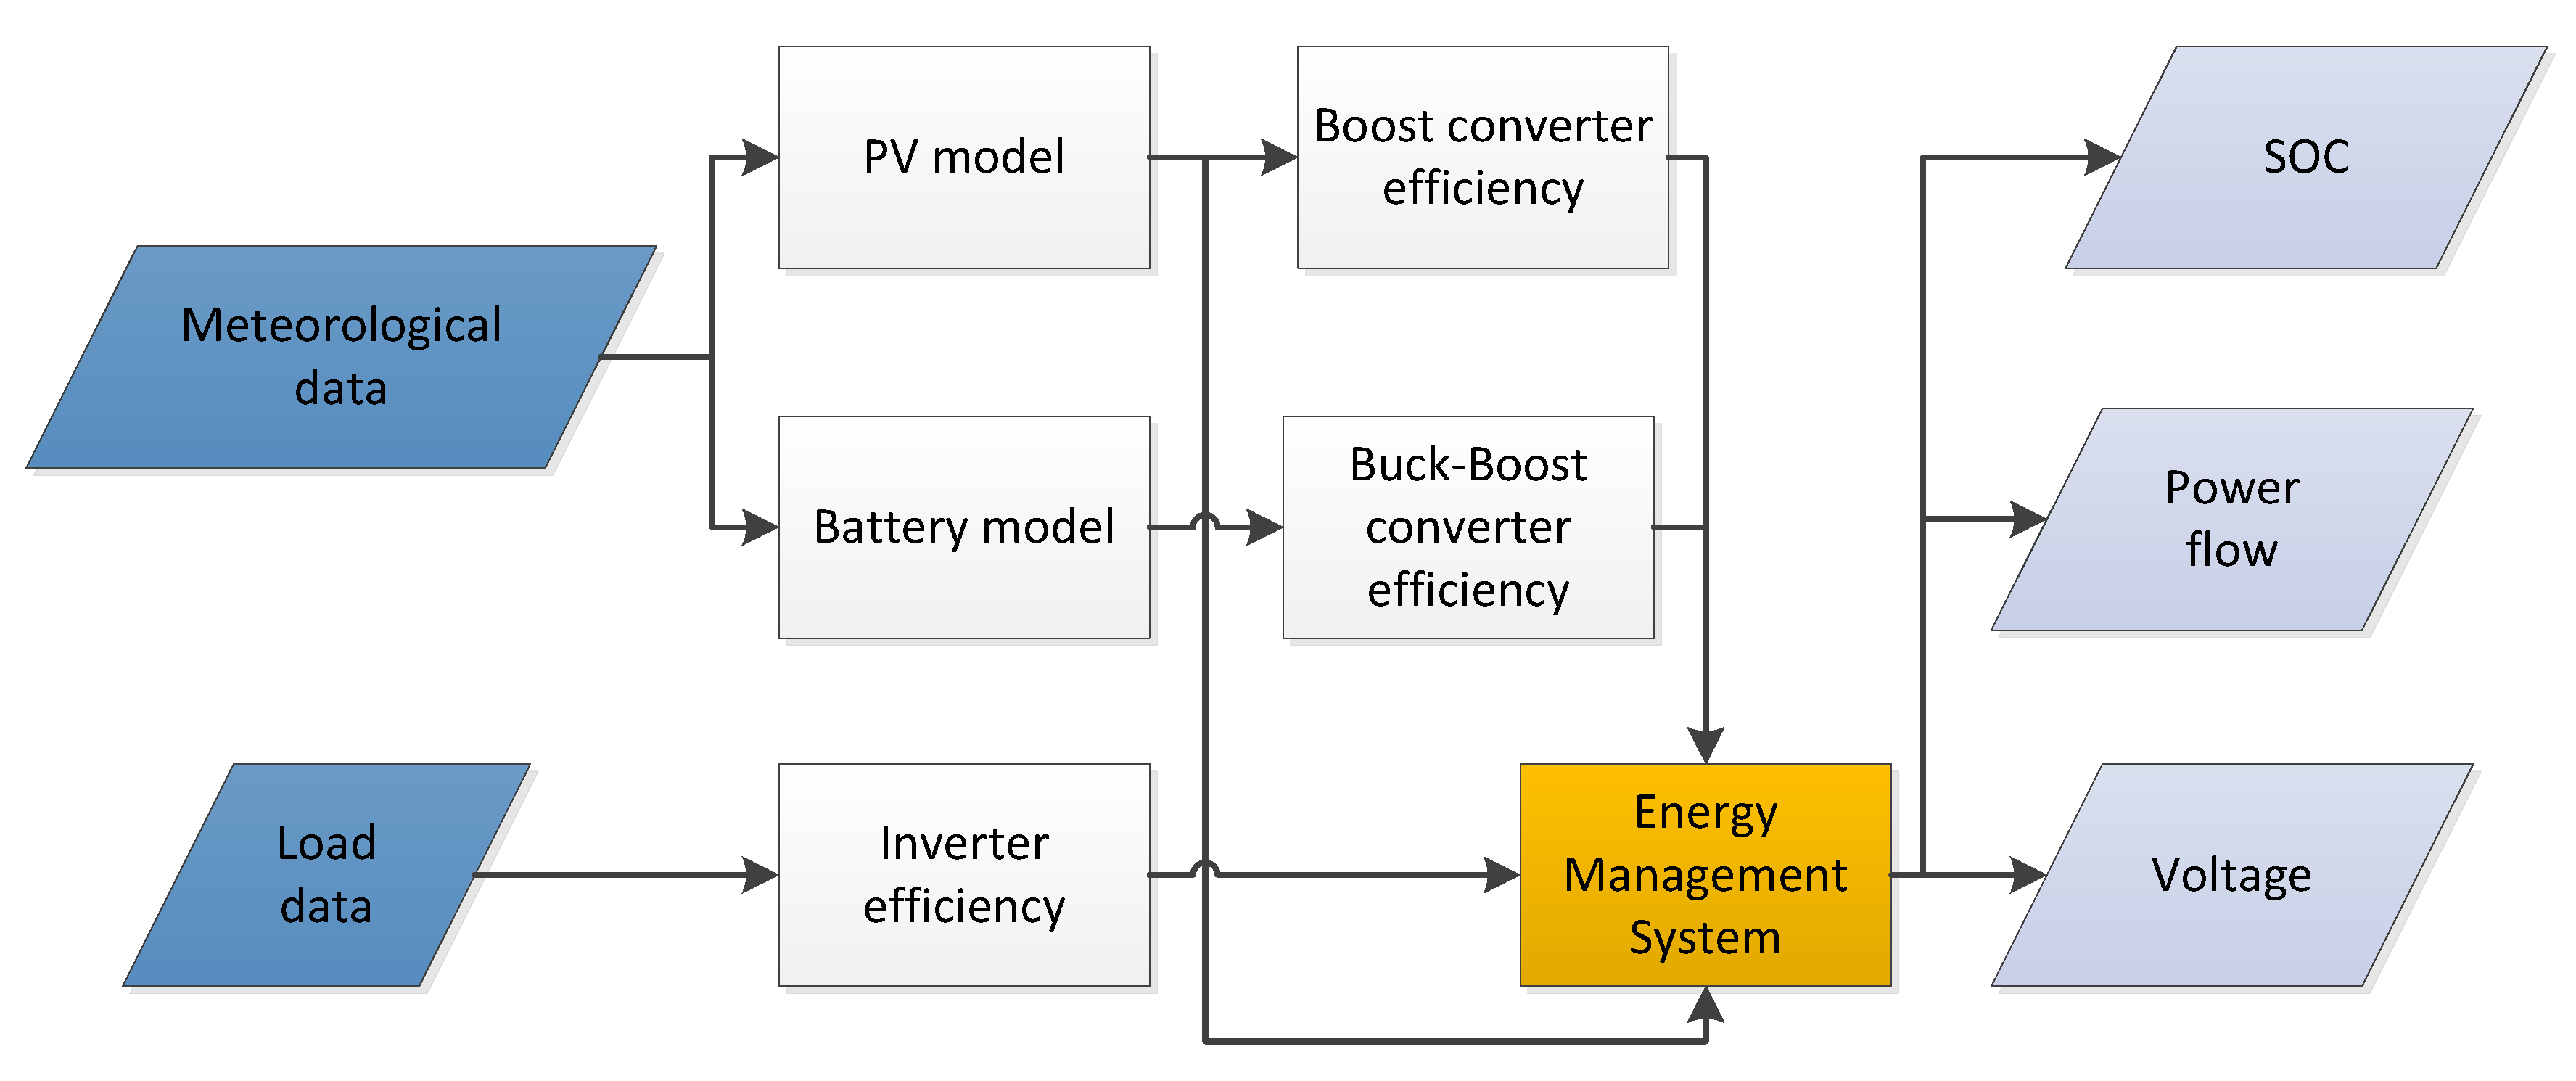
The model consists of a PV power estimation model, a performance battery model, and an energy management controller that decides the power flow magnitudes and directions. These models receive as inputs meteorological data and load power consumption from the selected location, and as outputs determine the power exchange, the voltage of the converters, and the battery bank SOC (refer to Figure 6).
For estimating the PV production, a fluid dynamic model proposed previously was used [26]. In this model, irradiance, wind speed, and PV module geometry are required to estimate the PV panel temperature, which is later linked to the PV power production using a PV panel temperature coefficient. For modeling the battery behavior, a model that takes into account the particularities of battery technology by extracting key parameters from data sheets is used in the general model [27], which has been used other solar system applications [28]. Also, the general model includes the losses expected in the conversion stages. To account for this factor, efficiency curves from known converter were taken into account, for the inverter [29], and for the converters [30].
A transient analysis was performed to study the dynamic response of the system in cases of abrupt changes in solar generation, refer to Appendix A.1. From the analysis, it can be noticed that the transient time (less than 0.1 s) is relatively shorter than the time step used for the power balance (one minute). Therefore, the transient transitions are not considered in this study.
Inputs
All the PV related data (irradiance, ambient temperature, and wind speed) were extracted from Metenorm, for both locations in Cambodia (off-grid), Netherlands (peak-shaving).
For this case, environmental data from a rural area in Cambodia (Stung Treng) is used to obtain the PV power, and the data for the load is taken from a tier 2 case in a rural electrification study [31], both with one-minute time step.
In the case of the grid-connected case study, the typical load for a house in the Netherlands was selected including seasonal effects [32], while for environmental data Delft, a city in the Netherlands (one minute) was selected.
6. Results
6.1. Off-Grid
6.1.1. Sizing
To size the system, the loss of load probability (LLP) was used to find the optimum battery capacity for a solar panel to power the tier 2 load selected (140 W, 18 , 7.78 ). Because every pouch battery (20 Ah, 3.3 V) can deliver 65 Wh, the battery capacity is incremented from one cell to 20 cells in series in steps of 65 Wh.
Based on Figure 7, where the LLP is plotted as the battery size increases, LLP values reduce as the battery capacity increases; however, there is a point in which LLP continuous to lower but more slowly, and a further decrease on LLP is at the expense of extraordinarily high battery sizes. Therefore, the selected battery size was 390 Wh, for an LLP value of 1.53%. To have a battery size of 390 Wh, 6 batteries connected in series are needed.
6.1.2. Power Balance
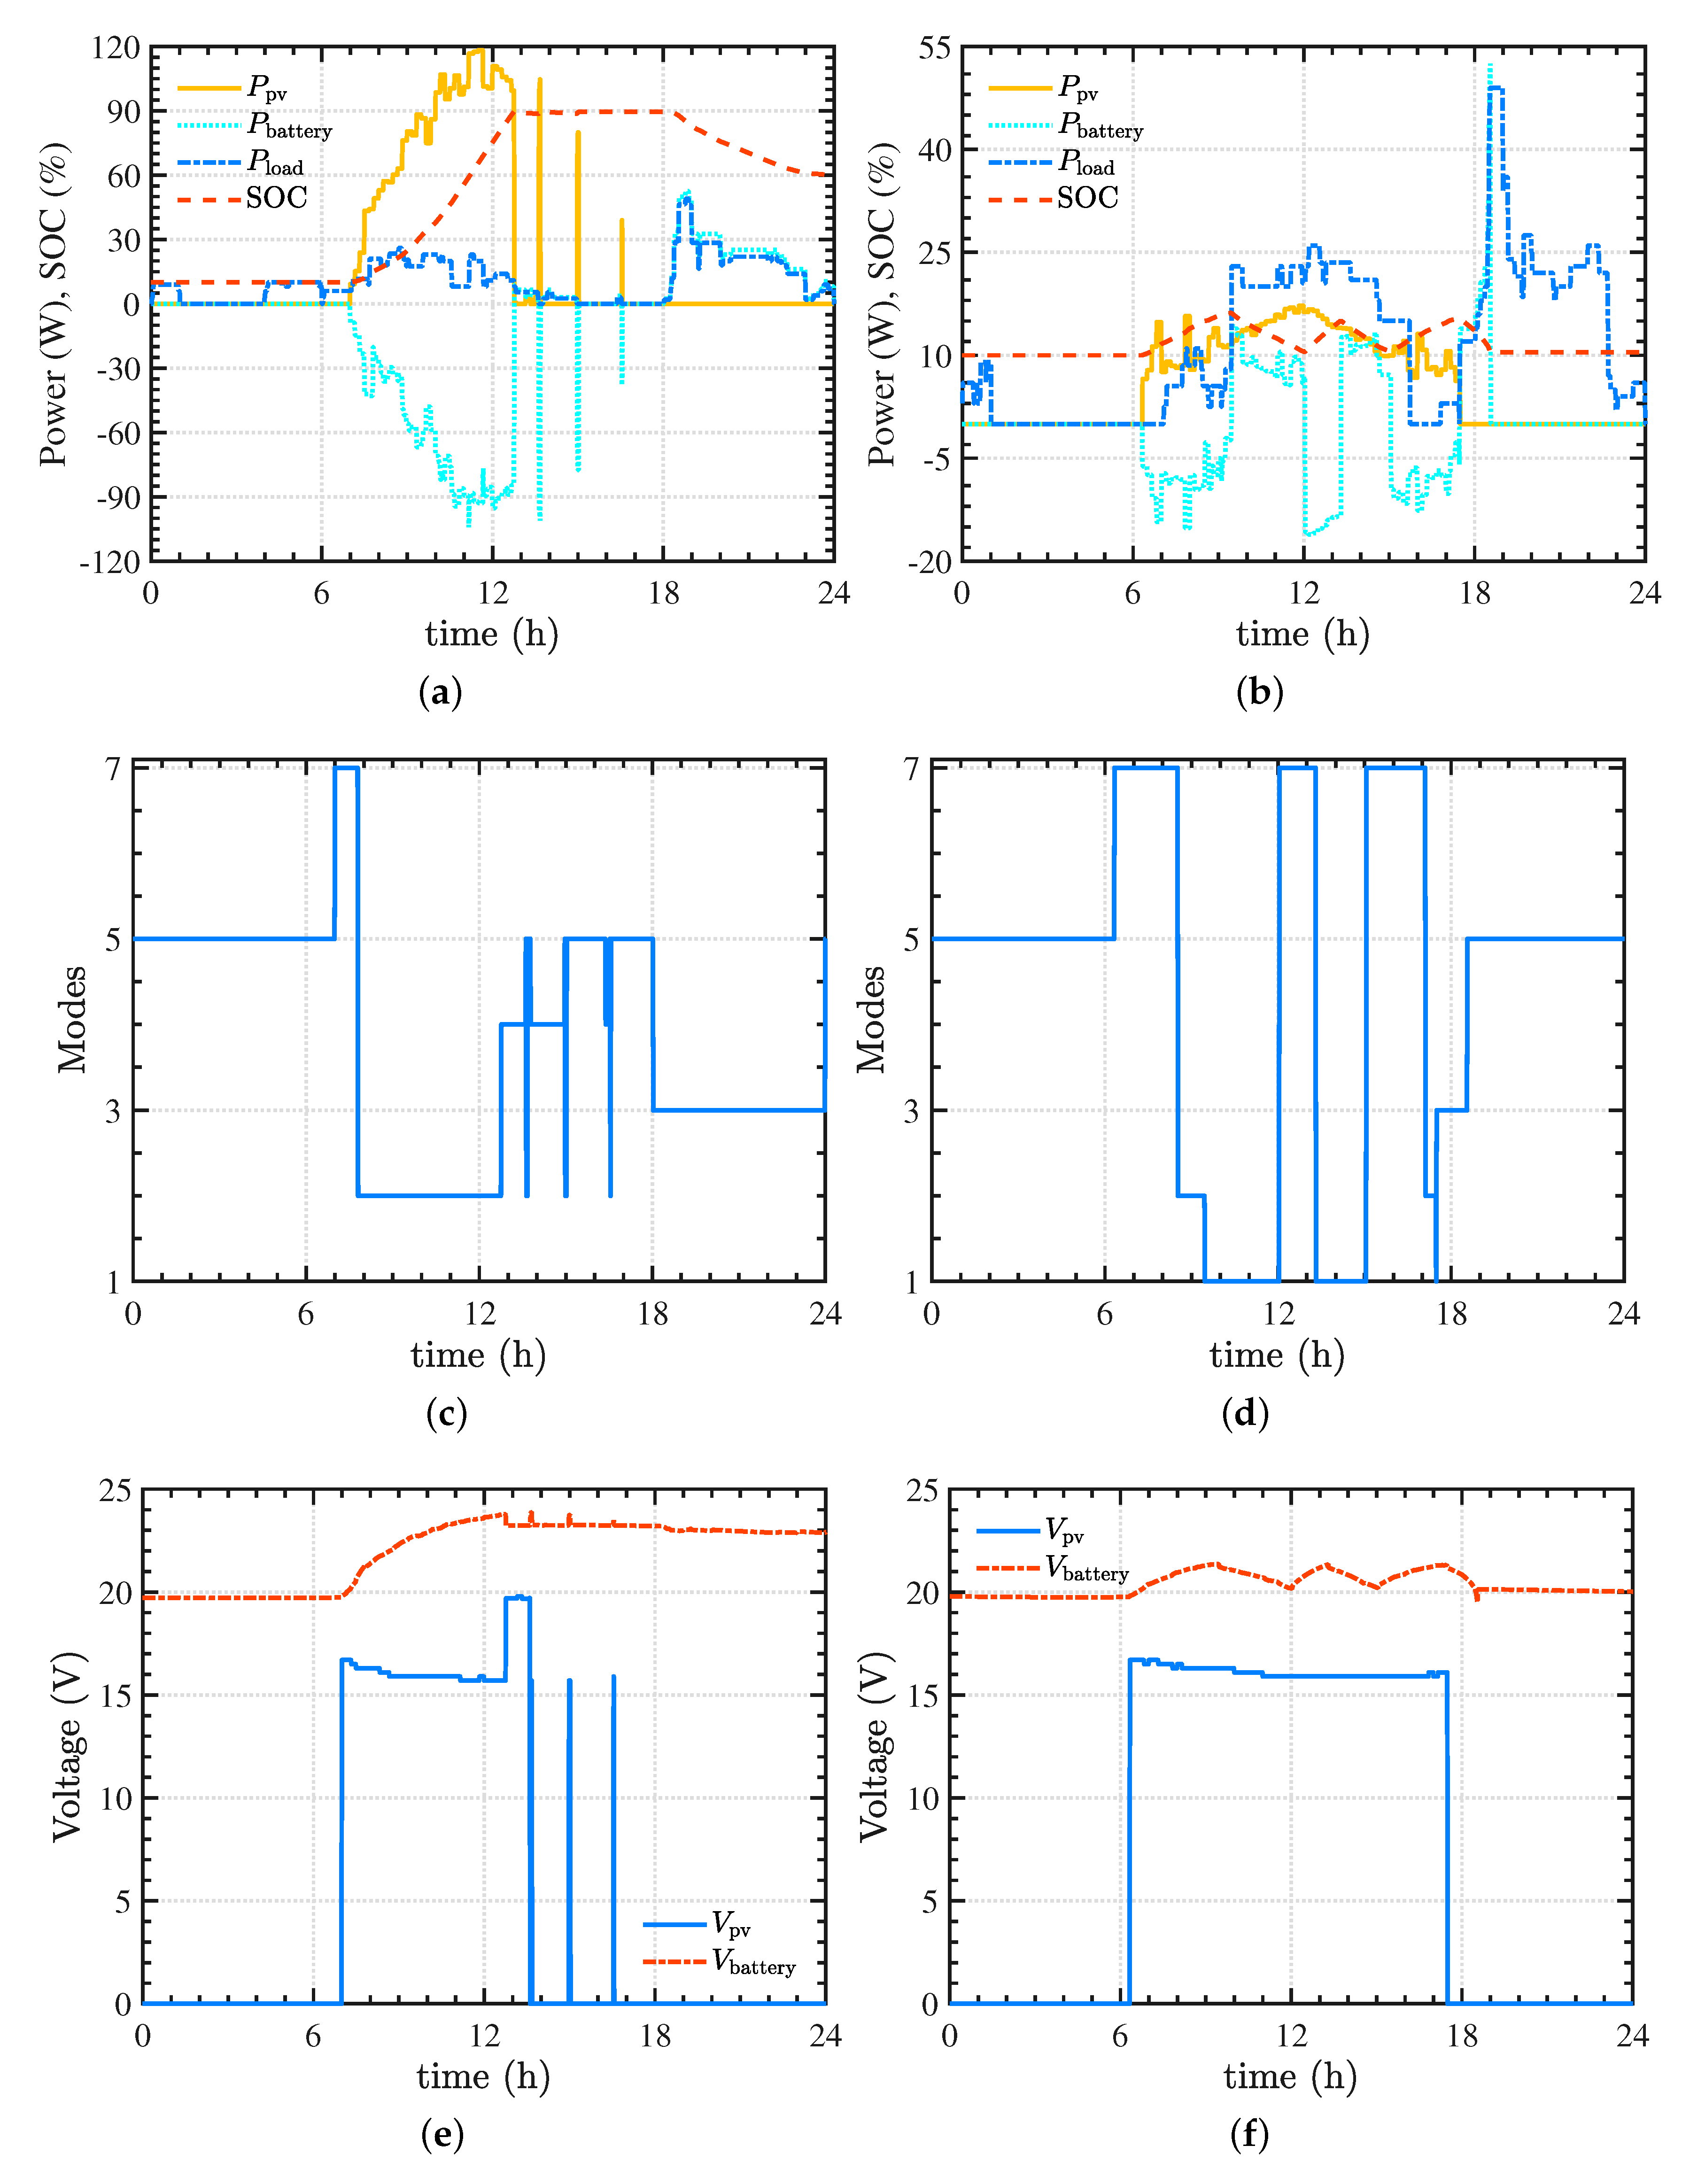
The power balance for a day with high and low irradiance are introduced in Figure 8a,b. Firstly, it is important to mention that the power of the battery is considered negative for charging and positive when discharging. Secondly, the initial SOC is set a 10% which means that neither the battery or solar panel can supply power to the load.
For the chosen day during the dry season, the PBIM operates in mode 5, but as soon as the sun rises the system changes briefly to mode 7, so the panel charges the battery (see Figure 8a,c). Later, because of the vast solar generation at MPP, the battery can be charged, and the load supplied at the same time (mode 2); however, after a while the solar generation is considerably higher than the load and the panel moves to a curtail operation, while the battery partially support the load. When the sun goes down, the device changes to mode 3, which means that the power needed for the load is provided by the battery if there is enough energy remaining.
The three peaks observed between 12:00 and 16:00 are caused by low load consumption periods and excess of PV energy. Around 13:00, the battery (fully charged) is discharged from 90% to 85%, but as soon as the SOC decreases more, the PV panel operates at maximum power point again charging the battery and powering the load—first peak in battery and PV production. After some minutes, the battery is full, and the same phenomenon occurs two more occasions for the dry season—two remaining peaks.
When comparing the selected days for the dry and rainy season, they are clear differences on the SOC level for both cases. As the generation is considerably less in the rainy season, as can be appreciated in Figure 8a,b. For the same reason, the mode of operation 4, where the PV generation is curtailed does not occur Figure 8d. Also, mode 1 which was not present in the dry season, appears in the rainy season due to the inability of the PV panel to supply the load during the middle of the day needing the help of the battery.
6.1.3. PV and Battery Voltages
The changes in voltage for both PV and batteries for the dry and rainy season are illustrated in Figure 8e,f, respectively. Regarding the battery voltage, it can be noted that for the dry season the battery is charged until reaches the upper SOC limit and after some time is partially discharged, while for the rainy day due to the low PV generation the battery is charged and discharged several times. In the case of the PV voltage, it remains relatively constant throughout the day for the rainy season, while for the dry season the voltage dropped abruptly various occasions due to two reasons: the PV curtailment occurred more often, and mode 5 had to take place on various occasions as the load was zero and consequently the PV disconnected ( = 0).
6.2. Constant Load
The objective of this section is to explore the ability of the PBIM to supply an individual appliance whose power consumption is relatively constant, as the PBIM might be useful for portable applications or as a backup in case of emergencies, where basic loads are the priority.
Here, a PBIM, with the same PV and battery size as in Section 6.1, tries to deliver constant power to a 50 W load in an off-grid case study. As depicted in Figure 9, the integrated device powered the load successfully for about 14 h even if the initial battery SOC was low. Because the battery was completely empty during the night, the PBIM was not able to satisfy the load demand, but soon in the morning time, the PV panel was enough to power the load and the remaining power was stored into the battery. In the afternoon, when the PV stated diminishing, the battery started supplying the load until the SOC reached its lower limit.
6.3. Peak-Shaving
For this part of the study, a 265 W (31.44 V, 8.44 I) PV panel, a battery pack of 520 Wh (8 batteries in series), and a DC bus of 48 V are defined as the system characteristics. In this case, study, the PV panel rating is increased compared to the previous case as well as the battery pack capacity. The energy consumed during the peak time in the Netherlands can be shaved by using a battery pack of 520 Wh. Also, the load can be partially supplied by the PV panel in off-peak times, ensuring not PV generation dumped (Figure 10).
6.3.1. Power Balance
Before describing the power flow profiles, it is important to establish the peak consumption time, which in the Netherlands happens between 17:00 and 20:00 almost irrespectively of the season. Because the battery is initially empty during the night, at the beginning of the day the PBIM is in standby, as can be seen in Figure 10a. Therefore, the load is only supported by the grid. As a result, mode 5 represents the inactivity of the PBIM (Figure 10b). As soon as there is enough solar irradiation, the PV panel starts delivering power to the battery and changing to mode 7. A rapid fluctuation between mode 7 and mode 5 can also be seen in Figure 10b, because of low irradiance instances. Once the battery is completely charged, the solar panel can supply the load partially, and the power extracted from the grid reduces (mode 6). Because the SOC of the battery reached the upper limit, the battery is disconnected to be later discharged during peak hours. At peak time, the diminished PV generation and the battery at constant power supply load. However, because the power required from the load is more than the PBIM combined production, power from the electricity grid is needed to complement the power from the PBIM as presented in mode 1. Again, the rapid changes between modes 1 and 3 are caused by the abrupt variations in incident irradiance on the solar panel.
6.3.2. PV and Battery Voltages
The solar panel and battery voltages are presented in Figure 10c. In this case, MPPT is always active when the PV produces power because PV power never surpasses the load required power. Regarding the battery voltage, the voltage does not vary when the battery completely charged and not used, but during peak times the voltage gradually decreases during peak hours as it is discharged. Figure 10c also shows that the PV panel voltage is zero in several occasions; this is because irradiance is below 50 W/m during daylight, and in that condition the DC/DC boost converter is switched off.
6.4. Future Work
As the objective of this paper is only to propose an energy management system for the PBIM, its practical implementation deserves to be explored in future research. In this research, the selected DC coupled architecture must be characterized via extensive testing to evaluate its performance under realistic conditions.
7. Conclusions
This paper focuses on controlling a PV battery-integrated module for performing energy management while paying attention to the system architecture. The most suitable architecture for the PBIM is the DC coupled. This decision is based on the number of conversion stages, battery safety, and converters control complexity. For this architecture, the control strategies needed to manage the converters are proposed. Seven modes of operation are presented to help the system define the most appropriate PV (MPPT, curtailment, or inactive) and battery operation (charging, discharging, or inactive), while the load is continuously changing. Based on this, two applications were explored, an off-grid and a peak-shaving (grid-tied). For both cases, it was established that the PBIM could be managed to supply the load and administrate the intended power delivery. Finally, this paper presented an energy management system especially tailored for a PV battery-integrated module, demonstrating its usefulness and suitability for standalone and grid-tied PV systems.
Author Contributions
Conceptualization, V.V.-G., L.R.-E. and M.F.S.; methodology, V.V.-G. and M.F.S.; software, M.F.S.; formal analysis, V.V.-G. and M.F.S.; investigation, V.V.-G. and M.F.S.; resources, P.B.; writing—original draft preparation, V.V.-G. and M.F.S.; writing—review and editing, V.V.-G., M.F.S., N.N., L.R.-E.; visualization, V.V.-G. and M.F.S.; supervision, L.R.-E. and P.B.
Funding
This research received no external funding.
Acknowledgments
The authors thank the financial support of the Universidad de Costa Rica, Ministerio de Ciencia y Tecnología y Telecomunicaciones of Costa Rica, and Consejo Nacional para Investigaciones Científicas y Tecnológicas.
Conflicts of Interest
The authors declare no conflict of interest.
Abbreviations
The following abbreviations are used in this manuscript:
| SOC | State of charge |
| ref | reference |
| DC | direct current |
| SW | Converter switch |
| MPP | Maximum power point |
| batt | Battery |
| AC | alternating current |
| PI | Proportional integral |
Nomenclature
The following nomenclature are used in this manuscript:
| PV power | |
| power boost converter | |
| power demanded by the load | |
| battery power discharged | |
| battery power charged | |
| power boost converter | |
| power not provided to the load | |
| power required from the grid | |
| boost converter duty cycle | |
| buck-boost converter duty cycle | |
| efficiency of DC/AC converter | |
| efficiency buck-boost converter | |
| PI error for PV voltage (boost converter) | |
| PI error for PV current (boost converter) | |
| PI error for PV voltage (buck-boost converter) | |
| PI error for PV current (buck-boost converter) | |
| DC bus capacitance for buck-boost converter | |
| out capacitance for boost converter | |
| inductance for boost converter | |
| PV voltage | |
| PV voltage at MPP | |
| PV voltage in curtail operation | |
| battery nominal voltage | |
| battery voltage | |
| DC voltage | |
| DC voltage reference | |
| PV current | |
| PV current at MPP | |
| PV current at reference level | |
| PV current in curtail operation | |
| PV current in curtail operation | |
| controller gain parameter for and | |
| controller gain parameter for and | |
| controller gain parameter for and | |
| controller gain parameter for and | |
| battery capacitance for buck-boost converter | |
| in capacitance for boost converter | |
| inductance for buck-boost converter |
Appendix A
Appendix A.1. Transient Analysis
The following equations define the procedure followed to find the parameters needed by the feedback loop of the boost and buck-boost converters:
Appendix A.1.1. Boost Converter
Appendix A.1.2. Buck-Boost Converter
The transient simulations were implemented in MATLAB/Simulink, according to the architecture depicted in Figure 1b. For this simulation, the load and inverter are substituted by constant impedance DC load to simplify the simulation.
The simulation was set to run for 0.4 s as the changes were visible under that period. In Figure A1a a rapid shift in power is observed; this happens because the irradiance values were changed first from 0 to 500 W/m, and later from 500 to 1000 W/m after 0.2 s, a period in which the MPP was reached. Also, based on Figure A1b, two disturbances can be observed, which corresponds to the changes in irradiance. At the beginning of the simulation the solar power was not enough, so the load was not completely satisfied; therefore, the bus voltage slightly deviated from 36 V. Later, power is extracted from the battery to keep the power balance and reach the reference voltage and match the load. When the irradiance reached 1000 W/m, the solar production is now above the power required, and the DC bus voltage rose accordingly. Given the power excess, the battery is powered, and the voltage comes back to its reference level after 0.1 s, reaching equilibrium.
Figure A1.
Transient analysis for (a) PV power, and (b) PV and DC voltage.


Table A1.
Parameters for transient simulation.
| Parameter | Value | Parameter | Value |
|---|---|---|---|
| 36 V | 1 mH | ||
| 18 V | 5 mH | ||
| 26.4 V | 0.01 mF | ||
| PV power rating | 140 W | 2 mF | |
| Load (nominal voltage, nominal load) | 36 V, 100 W | 0.01 mF | |
| Converter switching frequency | 50 kHz | 2 mF | |
| 0.2 | 100 | ||
| 0.02 | 20 |
References
- Sims, R.E. Renewable energy: A response to climate change. Sol. Energy 2004, 76, 9–17. [Google Scholar] [CrossRef]
- Kabir, E.; Kumar, P.; Kumar, S.; Adelodun, A.A.; Kim, K.H. Solar energy: Potential and future prospects. Renew. Sustain. Energy Rev. 2018, 82, 894–900. [Google Scholar] [CrossRef]
- REN21. Ren21: Renewables 2018 Global Status Report. Available online: http://www.ren21.net/wpcontent/uploads/2018/06/17-8652_GSR2018_FullReport_web_final_.pdf (accessed on 29 November 2018).
- Wirth, H. Recent Facts about Photovoltaics in Germany. Fraunhofer ISE 2015. Available online: https://www.ise.fraunhofer.de/content/dam/ise/en/documents/publications/studies/recent-facts-about-photovoltaics-in-germany.pdf (accessed on 29 November 2018).
- Stram, B.N. Key challenges to expanding renewable energy. Energy Policy 2016, 96, 728–734. [Google Scholar] [CrossRef]
- Lai, C.S.; McCulloch, M.D. Levelized cost of electricity for solar photovoltaic and electrical energy storage. Appl. Energy 2017, 190, 191–203. [Google Scholar] [CrossRef]
- Núñez-Reyes, A.; Marcos Rodríguez, D.; Bordons Alba, C.; Ridao Carlini, M.Á. Optimal scheduling of grid-connected PV plants with energy storage for integration in the electricity market. Sol. Energy 2017, 144, 502–516. [Google Scholar] [CrossRef]
- Comello, S.; Reichelstein, S.; Sahoo, A. The road ahead for solar PV power. Renew. Sustain. Energy Rev. 2018, 92, 744–756. [Google Scholar] [CrossRef]
- Lewis, N.S. Research opportunities to advance solar energy utilization. Science 2016, 351, aad1920. [Google Scholar] [CrossRef] [PubMed]
- Isabella, O.; Smets, A.; Jäger, K.; Zeman, M.; van Swaaij, R. Solar Energy: The Physics and Engineering of Photovoltaic Conversion; UIT Cambridge: Cambridge, UK, 2016. [Google Scholar]
- Vega-Garita, V.; Ramirez-Elizondo, L.; Bauer, P. Physical integration of a photovoltaic-battery system: A thermal analysis. Appl. Energy 2017, 208, 446–455. [Google Scholar] [CrossRef]
- Vega-Garita, V.; Harsarapama, A.P.; Ramirez-Elizondo, L.; Bauer, P. Physical integration of PV-battery system: Advantages, challenges, and thermal model. In Proceedings of the 2016 IEEE International Energy Conference (ENERGYCON), Leuven, Belgium, 4–8 April 2016. [Google Scholar]
- Luthander, R.; Widén, J.; Nilsson, D.; Palm, J. Photovoltaic self-consumption in buildings: A review. Appl. Energy 2015, 142, 80–94. [Google Scholar] [CrossRef] [Green Version]
- Bortolini, M.; Gamberi, M.; Graziani, A. Technical and economic design of photovoltaic and battery energy storage system. Energy Convers. Manag. 2014, 86, 81–92. [Google Scholar] [CrossRef]
- Sevilla, F.S.; Knazkins, V.; Park, C.; Korba, P. Advanced Control of Energy Storage Systems for PV Installation Maximizing Self-Consumption. IFAC-PapersOnLine 2015, 48, 524–528. [Google Scholar] [CrossRef]
- Riffonneau, Y.; Bacha, S.; Barruel, F.; Ploix, S. Optimal Power Flow Management for Grid Connected PV Systems With Batteries. IEEE Trans. Sustain. Energy 2011, 2, 309–320. [Google Scholar] [CrossRef]
- Chin, C.; Babu, A.; McBride, W. Design, modeling and testing of a standalone single axis active solar tracker using MATLAB/Simulink. Renew. Energy 2011, 36, 3075–3090. [Google Scholar] [CrossRef]
- Grzesiak, W.; Mackow, P.; Maj, T.; Polak, A.; Klugmann-Radziemska, E.; Zawora, S.; Drabczyk, K.; Gulkowski, S.; Grzesiak, P. Innovative system for energy collection and management integrated within a photovoltaic module. Sol. Energy 2016, 132, 442–452. [Google Scholar] [CrossRef]
- Reynaud, J.F.; Alonso, C.; Aloisi, P.; Cabal, C.; Estibals, B.; Rigobert, G.; Sarre, G.; Rouault, H.; Mourzagh, D.; Mattera, F.; et al. Multifunctional module lithium-ion storage and photovoltaic conversion of solar energy. In Proceedings of the Conference Record of the IEEE Photovoltaic Specialists Conference, San Diego, CA, USA, 11–16 May 2008. [Google Scholar]
- Reynaud, J.; Gantet, O.; Aloisi, P.; Estibals, B.; Alonso, C. New adaptive supervision unit to manage photovoltaic batteries. In Proceedings of the 2009 35th Annual Conference of IEEE Industrial Electronics, Porto, Portugal, 3–5 November 2009; pp. 664–669. [Google Scholar]
- Reynaud, J.; Gantet, O.; Aloisi, P.; Estibals, B.; Alonso, C. A novel distributed photovoltaic power architecture using advanced Li-ion batteries. In Proceedings of the 2010 14th International Power Electronics and Motion Control Conference (EPE/PEMC), Ohrid, Macedonia, 6–8 September 2010. [Google Scholar]
- Hussein, A.A.H.; Harb, S.; Kutkut, N.; Shen, J.; Batarseh, I. Design considerations for distributed micro-storage systems in residential applications. In Proceedings of the Intelec 2010, Orlando, FL, USA, 6–10 June 2010. [Google Scholar]
- Mirzaei, A.; Forooghi, M.; Ghadimi, A.A.; Abolmasoumi, A.H.; Riahi, M.R. Design and construction of a charge controller for stand-alone PV/battery hybrid system by using a new control strategy and power management. Sol. Energy 2017, 149, 132–144. [Google Scholar] [CrossRef]
- Vega-Garita, V.; Ramirez-Elizondo, L.; Mouli, G.R.C.; Bauer, P. Review of residential PV-storage architectures. In Proceedings of the 2016 IEEE International Energy Conference (ENERGYCON), Leuven, Belgium, 4–8 April 2016; pp. 85–94. [Google Scholar]
- Putri, R.I.; Wibowo, S.; Rifa’i, M. Maximum Power Point Tracking for Photovoltaic Using Incremental Conductance Method. Energy Procedia 2015, 68, 22–30. [Google Scholar] [CrossRef]
- Fuentes, M.K. A Simplified Thermal Model for Flat-Plate Photovoltaic Arrays; Technical Report; Sandia National Labs.: Albuquerque, NM, USA, 1987.
- Tremblay, O.; Dessaint, L.; Dekkiche, A. A Generic Battery Model for the Dynamic Simulation of Hybrid Electric Vehicles. In Proceedings of the 2007 IEEE Vehicle Power and Propulsion Conference, Arlington, TX, USA, 9–12 September 2007; pp. 284–289. [Google Scholar]
- Vega-Garita, V.; Lucia, D.D.; Narayan, N.; Ramirez-Elizondo, L.; Bauer, P. PV-battery integrated module as a solution for off-grid applications in the developing world. In Proceedings of the 2018 IEEE International Energy Conference (ENERGYCON), Limassol, Cyprus, 3–7 June 2018; pp. 1–6. [Google Scholar]
- ABB. ABB micro inverter system MICRO-0.25-I-OUTD. Available online: https://library.e.abb.com/public/f398eca735f13f34c1257cec00364cad/MICRO-0.25-0.3-0.3HV-I-OUTD-US%20product%20manual%20rev%20na%201.1.pdf (accessed on 29 November 2018).
- Walker, G.R.; Sernia, P.C. Cascaded DC-DC converter connection of photovoltaic modules. IEEE Trans. Power Electron. 2004, 19, 1130–1139. [Google Scholar] [CrossRef]
- Narayan, N.; Qin, Z.; Popovic-Gerber, J.; Diehl, J.C.; Bauer, P.; Zeman, M. Stochastic load profile construction for the multi-tier framework for household electricity access using off-grid DC appliances. Energy Effic. 2018, 1–19. Available online: https://link.springer.com/article/10.1007/s12053-018-9725-6 (accessed on 29 November 2018).
- Asare-Bediako, B.; Kling, W.L.; Ribeiro, P.F. Future residential load profiles: Scenario-based analysis of high penetration of heavy loads and distributed generation. Energy Build. 2014, 75, 228–238. [Google Scholar] [CrossRef]
Figure 1.
PV Battery Integrated Module (PBIM) possible architectures: (a) in-line; (b) DC coupled; (c) AC coupled.
Figure 1.
PV Battery Integrated Module (PBIM) possible architectures: (a) in-line; (b) DC coupled; (c) AC coupled.

Figure 2.
Feedback loops for (a) PV reference control, (b) feedback loop for boost converter, and (c) feedback loop for buck-boost converter.
Figure 2.
Feedback loops for (a) PV reference control, (b) feedback loop for boost converter, and (c) feedback loop for buck-boost converter.

Figure 3.
Power flow directions for the 7 modes of operation. (a) Mode 1; (b) Mode 2; (c) Mode 3; (d) Mode 4; (e) Mode 5; (f) Mode 6; (g) Mode 7.
Figure 3.
Power flow directions for the 7 modes of operation. (a) Mode 1; (b) Mode 2; (c) Mode 3; (d) Mode 4; (e) Mode 5; (f) Mode 6; (g) Mode 7.

Figure 4.
Energy management for (a) off-grid and (b) peak-shaving concepts.

Figure 5.
Power flow management for (a) off-grid and (b) peak-shaving cases.

Figure 6.
Overall model.

Figure 7.
Loss of load probability for system sizing.

Figure 8.
One day simulation for the dry and rainy season in a off-grid case study. (a) Power flows and SOC levels: dry season, (b) power flows and SOC levels: rainy season (c) modes of operation: dry season, (d) modes of operation: rainy season (e) PV and battery pack voltage: dry season, (f) PV and battery pack voltage: rainy season.

Figure 9.
One day simulation for the constant load case study, (a) Power flows and (b) modes of operation for a constant load.
Figure 9.
One day simulation for the constant load case study, (a) Power flows and (b) modes of operation for a constant load.

Figure 10.
One day simulation for peak-shaving case study, (a) Power flows; (b) modes of operation, and (c) PV and battery pack voltage.
Figure 10.
One day simulation for peak-shaving case study, (a) Power flows; (b) modes of operation, and (c) PV and battery pack voltage.

Table 1.
Converter operation for various modes of operation.
| Converter | Mode 1 | Mode 2 | Mode 3 | Mode 4 | Mode 5 | Mode 6 | Mode 7 |
|---|---|---|---|---|---|---|---|
| Unidirectional | MPP | MPP | OFF | Curtail | OFF | MPP | MPP |
| Bidirectional | Boost | Buck | Boost | Boost | OFF | OFF | Buck |
| Inverter | ON | ON | ON | ON | OFF | ON | OFF |
© 2018 by the authors. Licensee MDPI, Basel, Switzerland. This article is an open access article distributed under the terms and conditions of the Creative Commons Attribution (CC BY) license (http://creativecommons.org/licenses/by/4.0/).
Share and Cite
MDPI and ACS Style
Vega-Garita, V.; Sofyan, M.F.; Narayan, N.; Ramirez-Elizondo, L.; Bauer, P. Energy Management System for the Photovoltaic Battery Integrated Module. Energies 2018, 11, 3371. https://doi.org/10.3390/en11123371
AMA Style
Vega-Garita V, Sofyan MF, Narayan N, Ramirez-Elizondo L, Bauer P. Energy Management System for the Photovoltaic Battery Integrated Module. Energies. 2018; 11(12):3371. https://doi.org/10.3390/en11123371
Chicago/Turabian StyleVega-Garita, Victor, Muhammad Faizal Sofyan, Nishant Narayan, Laura Ramirez-Elizondo, and Pavol Bauer. 2018. "Energy Management System for the Photovoltaic Battery Integrated Module" Energies 11, no. 12: 3371. https://doi.org/10.3390/en11123371
Note that from the first issue of 2016, this journal uses article numbers instead of page numbers. See further details here.