Novel Cyclic Blade Pitching Mechanism for Wind and Tidal Energy Turbine Applications


Department of Mechanical and Aerospace Engineering, Rutgers University, New Brunswick, NJ 08901, USA
*
Author to whom correspondence should be addressed.
Energies 2018, 11(12), 3328; https://doi.org/10.3390/en11123328
Submission received: 5 November 2018
/
Revised: 23 November 2018
/
Accepted: 24 November 2018
/
Published: 29 November 2018
Abstract
:A vertical axis drag-based turbine is proposed that allows for an improved performance by feathering its blades during recovery strokes to eliminate adverse blade forces. The turbine blades resemble flat plates and pitch by 90 between the two turbine strokes using a novel dual-cam mechanism. This passive mechanism orients the blades vertically during the drive stroke for maximum effective area and horizontally for minimum effective area during the recovery stroke. This allows maximizing the positive drive stroke force and minimizing the recovery stroke losses, in turn maximizing the net energy capture and the turbine performance. It is called the cyclic pitch turbine, and a mathematical model is developed that predicts the turbine performance. It shows that the turbine is self-starting for all orientations and has a higher and more uniform static torque coefficient than the popular Savonius turbine. The dynamic analysis also indicates a higher performance, and the predicted values for torque and power coefficients match very closely with those from water channel and wind tunnel experiments on a prototype. Results of testing several blade shapes indicate that airfoil section blades with long and narrow continuous shapes that have less area towards the blade’s tip result in higher performance.
1. Introduction
Power generation using renewable energy sources has been a topic of utmost interest in recent years because of factors like global warming [1], pollution [2], and depletion of fossil fuel [3] among many others. The major renewable power technologies include solar photovoltaic panels and wind turbines. Wind turbines have existed for many centuries, and an increased interest in them has been observed in the last two decades with sharply increasing global capacities [4]. Wind turbine capacity is also predicted to grow 12% globally in the next few years [5], which is faster than that predicted for new fossil fuel power plants [6]. Other renewable methods like energy harvesting from the movement of water in oceans and rivers using turbines have also been gaining much attention due to their higher energy density and better predictability [7]. Present-day wind turbines are classified as horizontal axis or vertical axis, based on the orientation of their rotation axes. They are further classified as lift-based or drag-based wind turbines depending on the type of forces utilized by their blades. Lift-based wind turbines include all the horizontal axis wind turbines (HAWT) and some vertical axis wind turbines (VAWT) like Darrieus. These turbines use lift forces acting on their blades with airfoil cross-sections to generate torque [8]. On the other hand, drag-based turbines try to stop the flow of air [9], which causes a drag force on their blades. The Savonius turbine [10], developed by S.J.Savonius in 1922, is the most popular drag-based turbine and rotates about a vertical turbine axis. These turbines experience a higher positive drive stroke drag force in the downwind direction than the adverse recovery stroke drag force in the upwind direction, which creates a net positive driving force given by .
Savonius rotors have many advantages compared to other wind turbine designs. They are simple in design, less expensive to construct [11], self-starting [12], independent of wind direction [13], and not negatively influenced by turbulence. Despite these advantages, Savonius turbines suffer from adverse recovery stroke drag force and consequently have a low coefficient of power [14], which is the non-dimensional power performance indicator for wind turbines. The adverse drag force increases at higher rotor speeds and results in a sharp drop in its performance. The adverse drag force on the returning blade needs to be reduced if not completely eliminated to improve the performance of drag-based turbines. This has to be done while also simultaneously maximizing the drive stroke drag force [15].
Several researchers in the past have tried to address the problem of recovery stroke drag in Savonius turbines through experimental, analytical, as well as numerical investigations into several design upgrades. Some of the approaches used to improve Savonius turbine’s performance were to use helical slanted buckets instead of straight buckets [16], to use elliptical-shaped blades [17], to use end plates on the buckets [18], to have slotted buckets [19], to change the number of buckets [20], to have a swirling chamber between the buckets [21], and to change the bucket’s aspect ratio, among several others. These methods attempted to find the best Savonius configuration, but did not directly reduce the recovery stroke drag. Some of the approaches to reduce recovery stroke drag were to use deflector plates to shield the returning blade [15,18] or to use a curtain design with two plates in front of the Savonius turbine to direct air flow from the recovering bucket into the bucket undergoing the drive stroke [22]. Both designs improved the performance and eliminated the negative starting torque observed at some azimuth angles. Yet, the turbine design became more complex as the deflector plates add additional parts. The design also makes the turbines dependent on wind direction, requiring the deflector plate to be placed in front of the turbine. Another design uses buckets with several flaps, which swing open while in the return stroke to let air pass through during the recovery stroke and reduce adverse drag [19]. This resulted in undesirable inertial effects of moving parts at high speeds while also significantly increasing the complexity in design. Many of the discussed designs improved the performance slightly, but failed to minimize the recovery stroke drag or did so with major limitations to the Savonius design.
To circumvent the limitations in Savonius turbines to achieve lower recovery losses, new drag-based turbines were developed [23,24]. These turbines have flat or airfoil section blades, which rotate about a vertical axis through the blades, while revolving around the turbine axis. They use chain or belt drives connected to a driven shaft to rotate the blades. This adds a constraint on blade rotation and also complicates the designs. In addition, the turbine design does not completely eliminate recovery stroke drag, as the blades experience some adverse drag at all angles in the recovery stroke, except at one blade location where they are precisely feathered with respect to the fluid flow. The drive stroke also loses in regard to its energy generation potential as the blades are not strictly perpendicular to the flow direction. Another flat plate turbine [25] for use on buildings was developed, but it works only for one wind direction and requires a large rigid structure to shield the returning blades from air flow.
All the above-discussed methods fail to deliver an uncompromising solution to eliminate recovery stroke losses in these machines. To this effect, we have proposed a novel vertical axis drag-based turbine, which utilizes a passive blade pitching mechanism to feather its blades during their entire return stroke to eliminate recovery losses. The turbine’s principle, its blade pitching mechanism, mathematical model, characterizing its static and dynamic performance, theoretical results, as well as its experimental testing and results are discussed in Section 2, Section 3, Section 4, Section 5 and Section 6.
2. Conceptualization
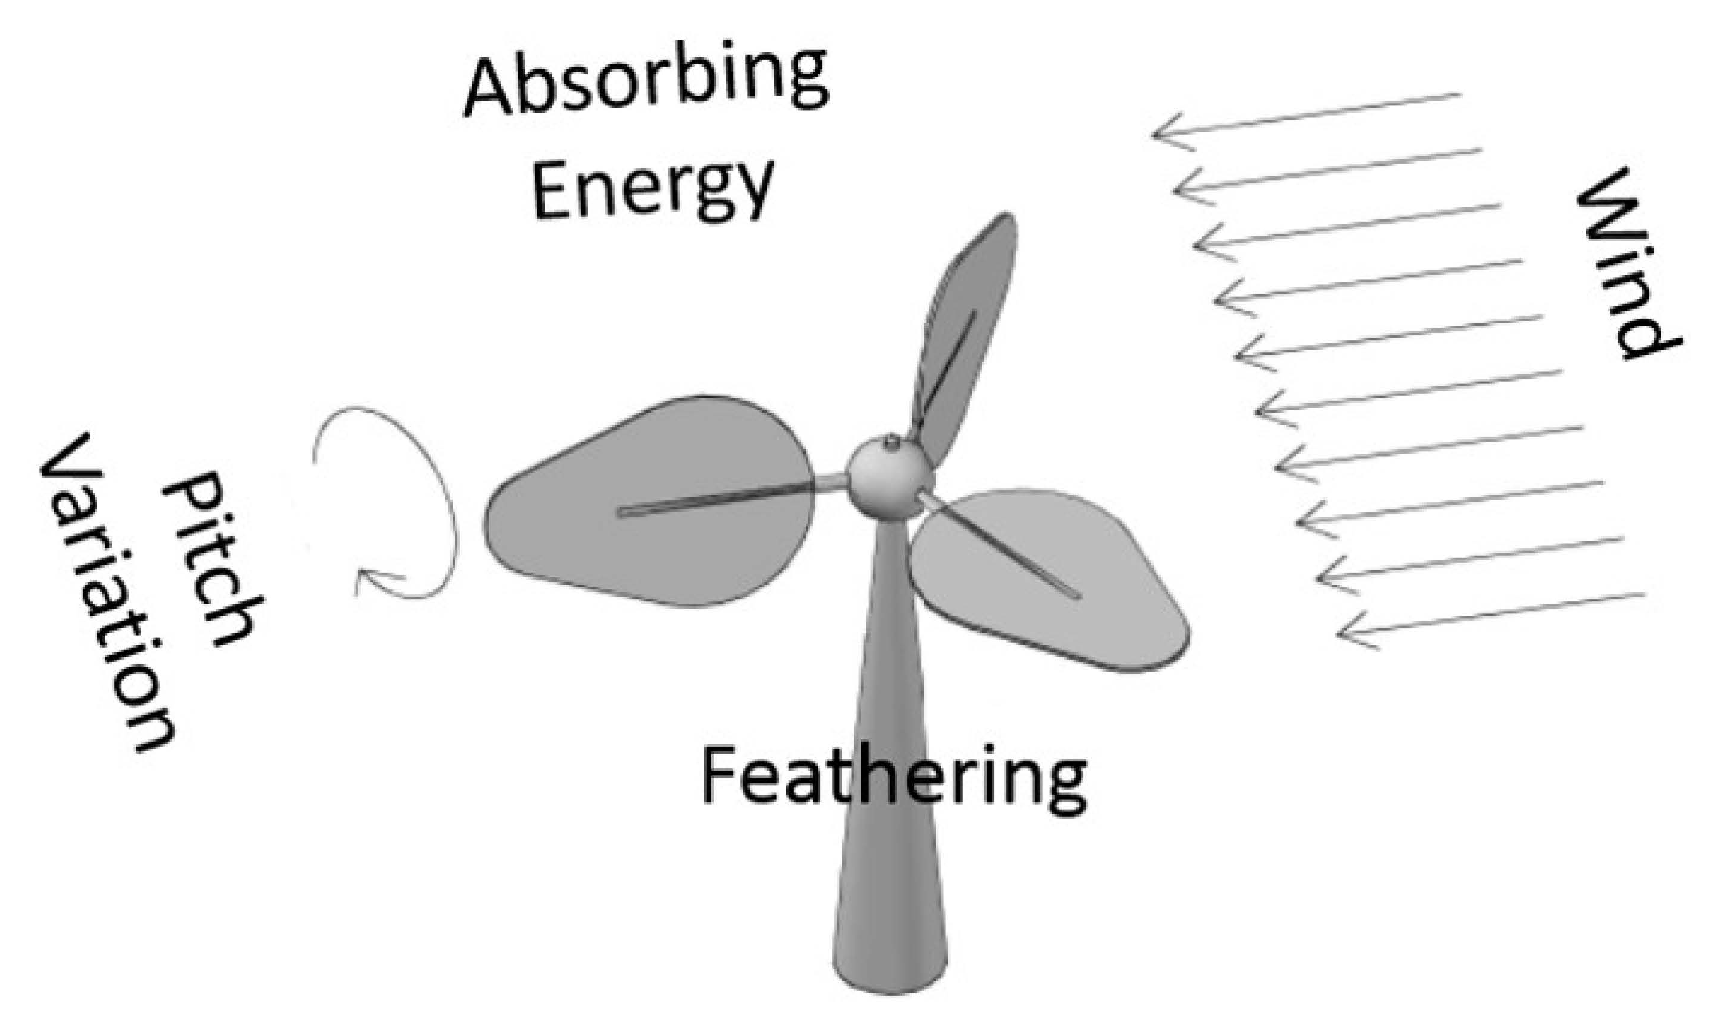
Our turbine is called the Cyclic Pitch Turbine (CPT) [26] and uses flat plates as its blades. Its blade pitching mechanism changes the pitch/angle of attack (AOA) of the blades from in the drive stroke to in the recovery stroke, as seen in Figure 1, to eliminate recovery stroke losses. The blades project the maximum area to generate the maximum driving force during the drive stroke and the minimum possible area in the recovery stroke to eliminate adverse drag force [27]. This principle is also observed, in the sport of shell rowing, where oarsmen strive to perfect an elegant and complex rowing technique to maximize their mean boat speeds [28], and also in the flapping wing flight in certain birds [29]. The principle used in the proposed turbine is to take advantage of the large variation in the drag force on a flat plate as a result of pitching it by to harness energy from a fluid flow efficiently.
Drag force, given by Equation (1), is the frictional resistance to relative motion between a body and a surrounding fluid, and it depends on the coefficient of drag of the body, fluid density , projected body area A, and fluid velocity u. For a flat plate, the drag coefficient change can be ascribed to the pitch angle, also called the angle of attack, and shown through experiments [30]. The drag coefficient for horizontal orientation (AOA = ) is close to zero [30,31], while it is around 1.2 for a vertical orientation (AOA = ) [30,32,33]. The drag forces acting on a horizontally-orientated flat plate are caused by the viscous boundary layers over its top and bottom surfaces.
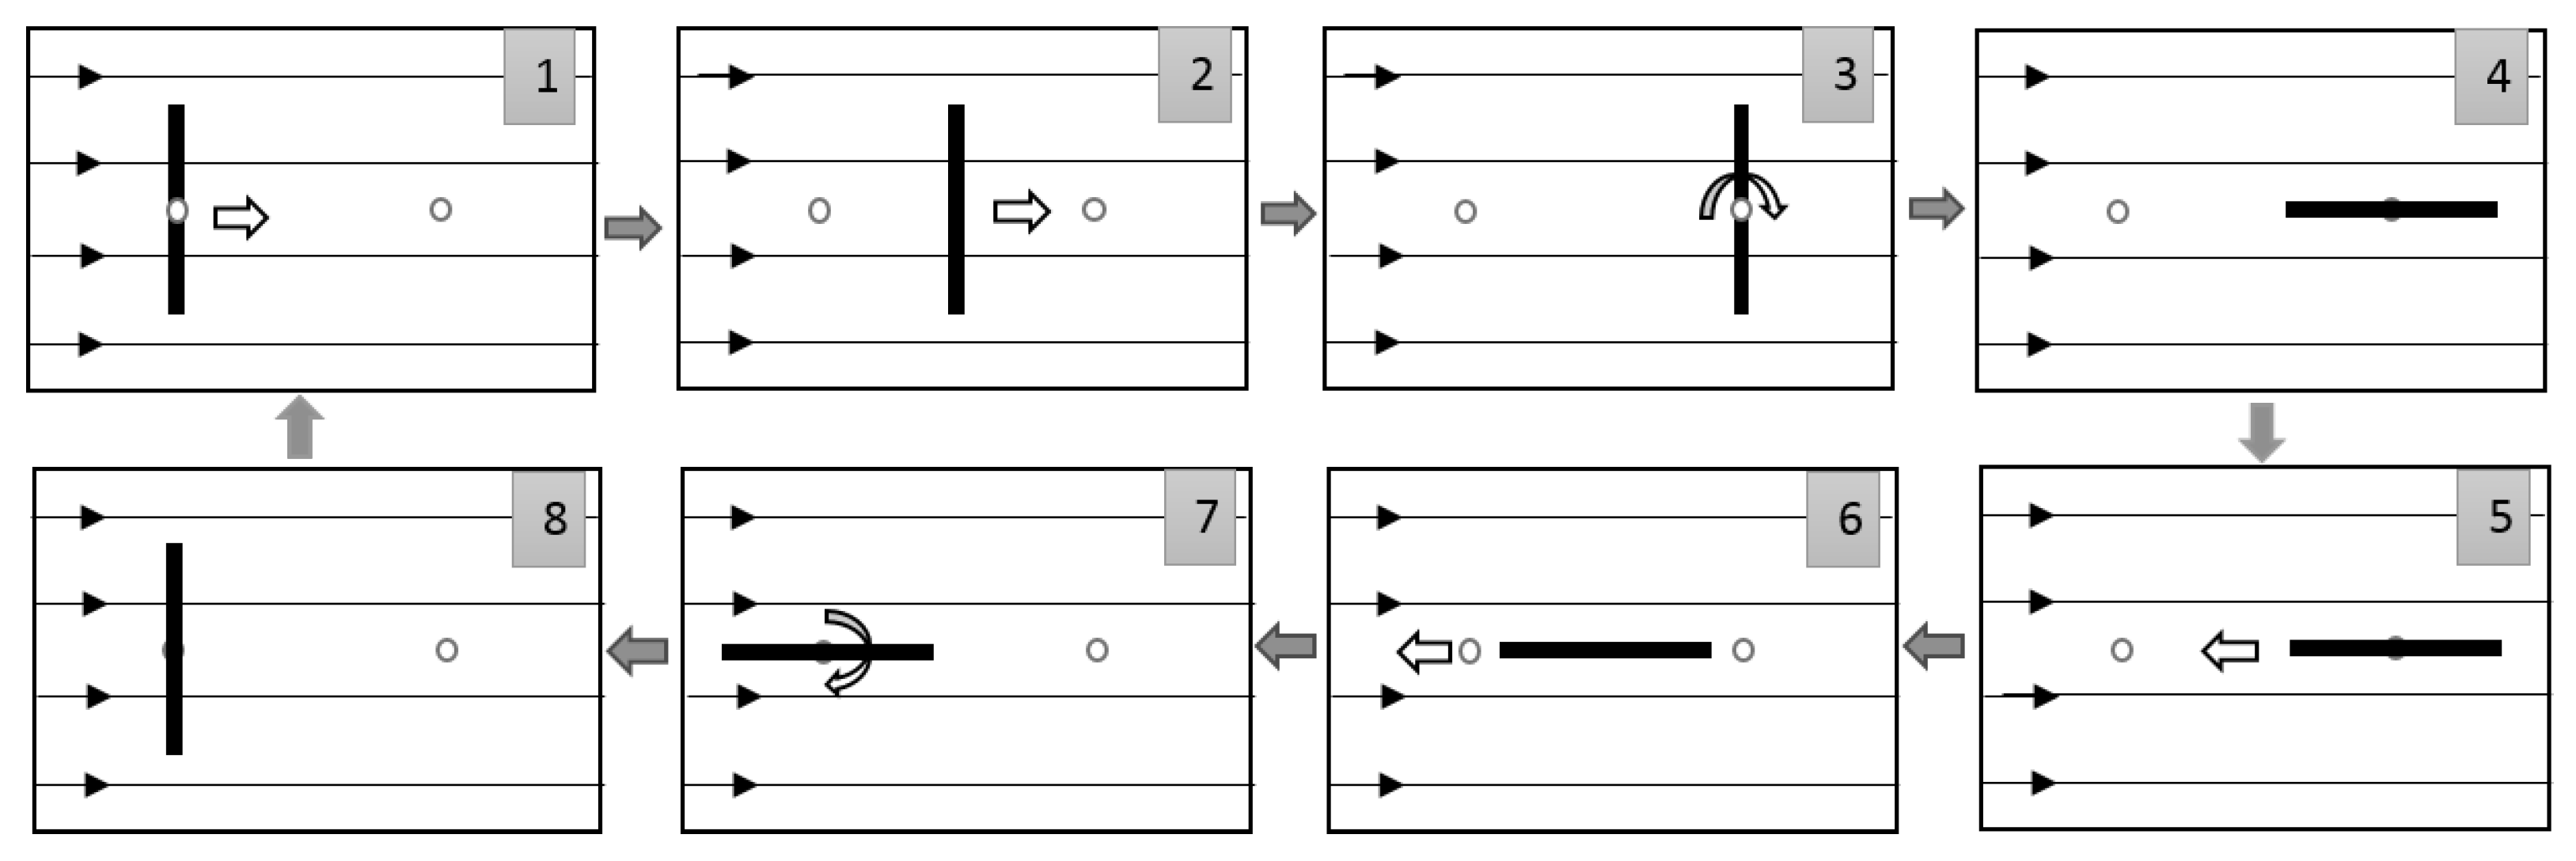
The variation in drag coefficient and the resultant blade forces can be converted to work done by allowing them to move. A flat plate of finite length and negligible thickness immersed in a fluid flow, if allowed to trace the path and while having orientations as shown in Figure 2, would continuously harness energy from the fluid motion. The flat plate would be oriented vertically and pushed from left to right by the fluid flow through some distance with maximum force during a drive stroke. Then, the plate pitches by and uses some of its energy from the drive stroke to recover its initial location while experiencing minimum adverse drag. One complete cycle is achieved when the plate pitches again by to attain its initial orientation. Since the drive stroke generates maximum positive force and the recovery stroke experiences minimum force, maximum possible power can be harnessed using this principle. This linear mechanism requires quick reversals in the direction of motion of the plate and may result in momentum losses. Hence, an analogous rotary actuation mechanism is considered.
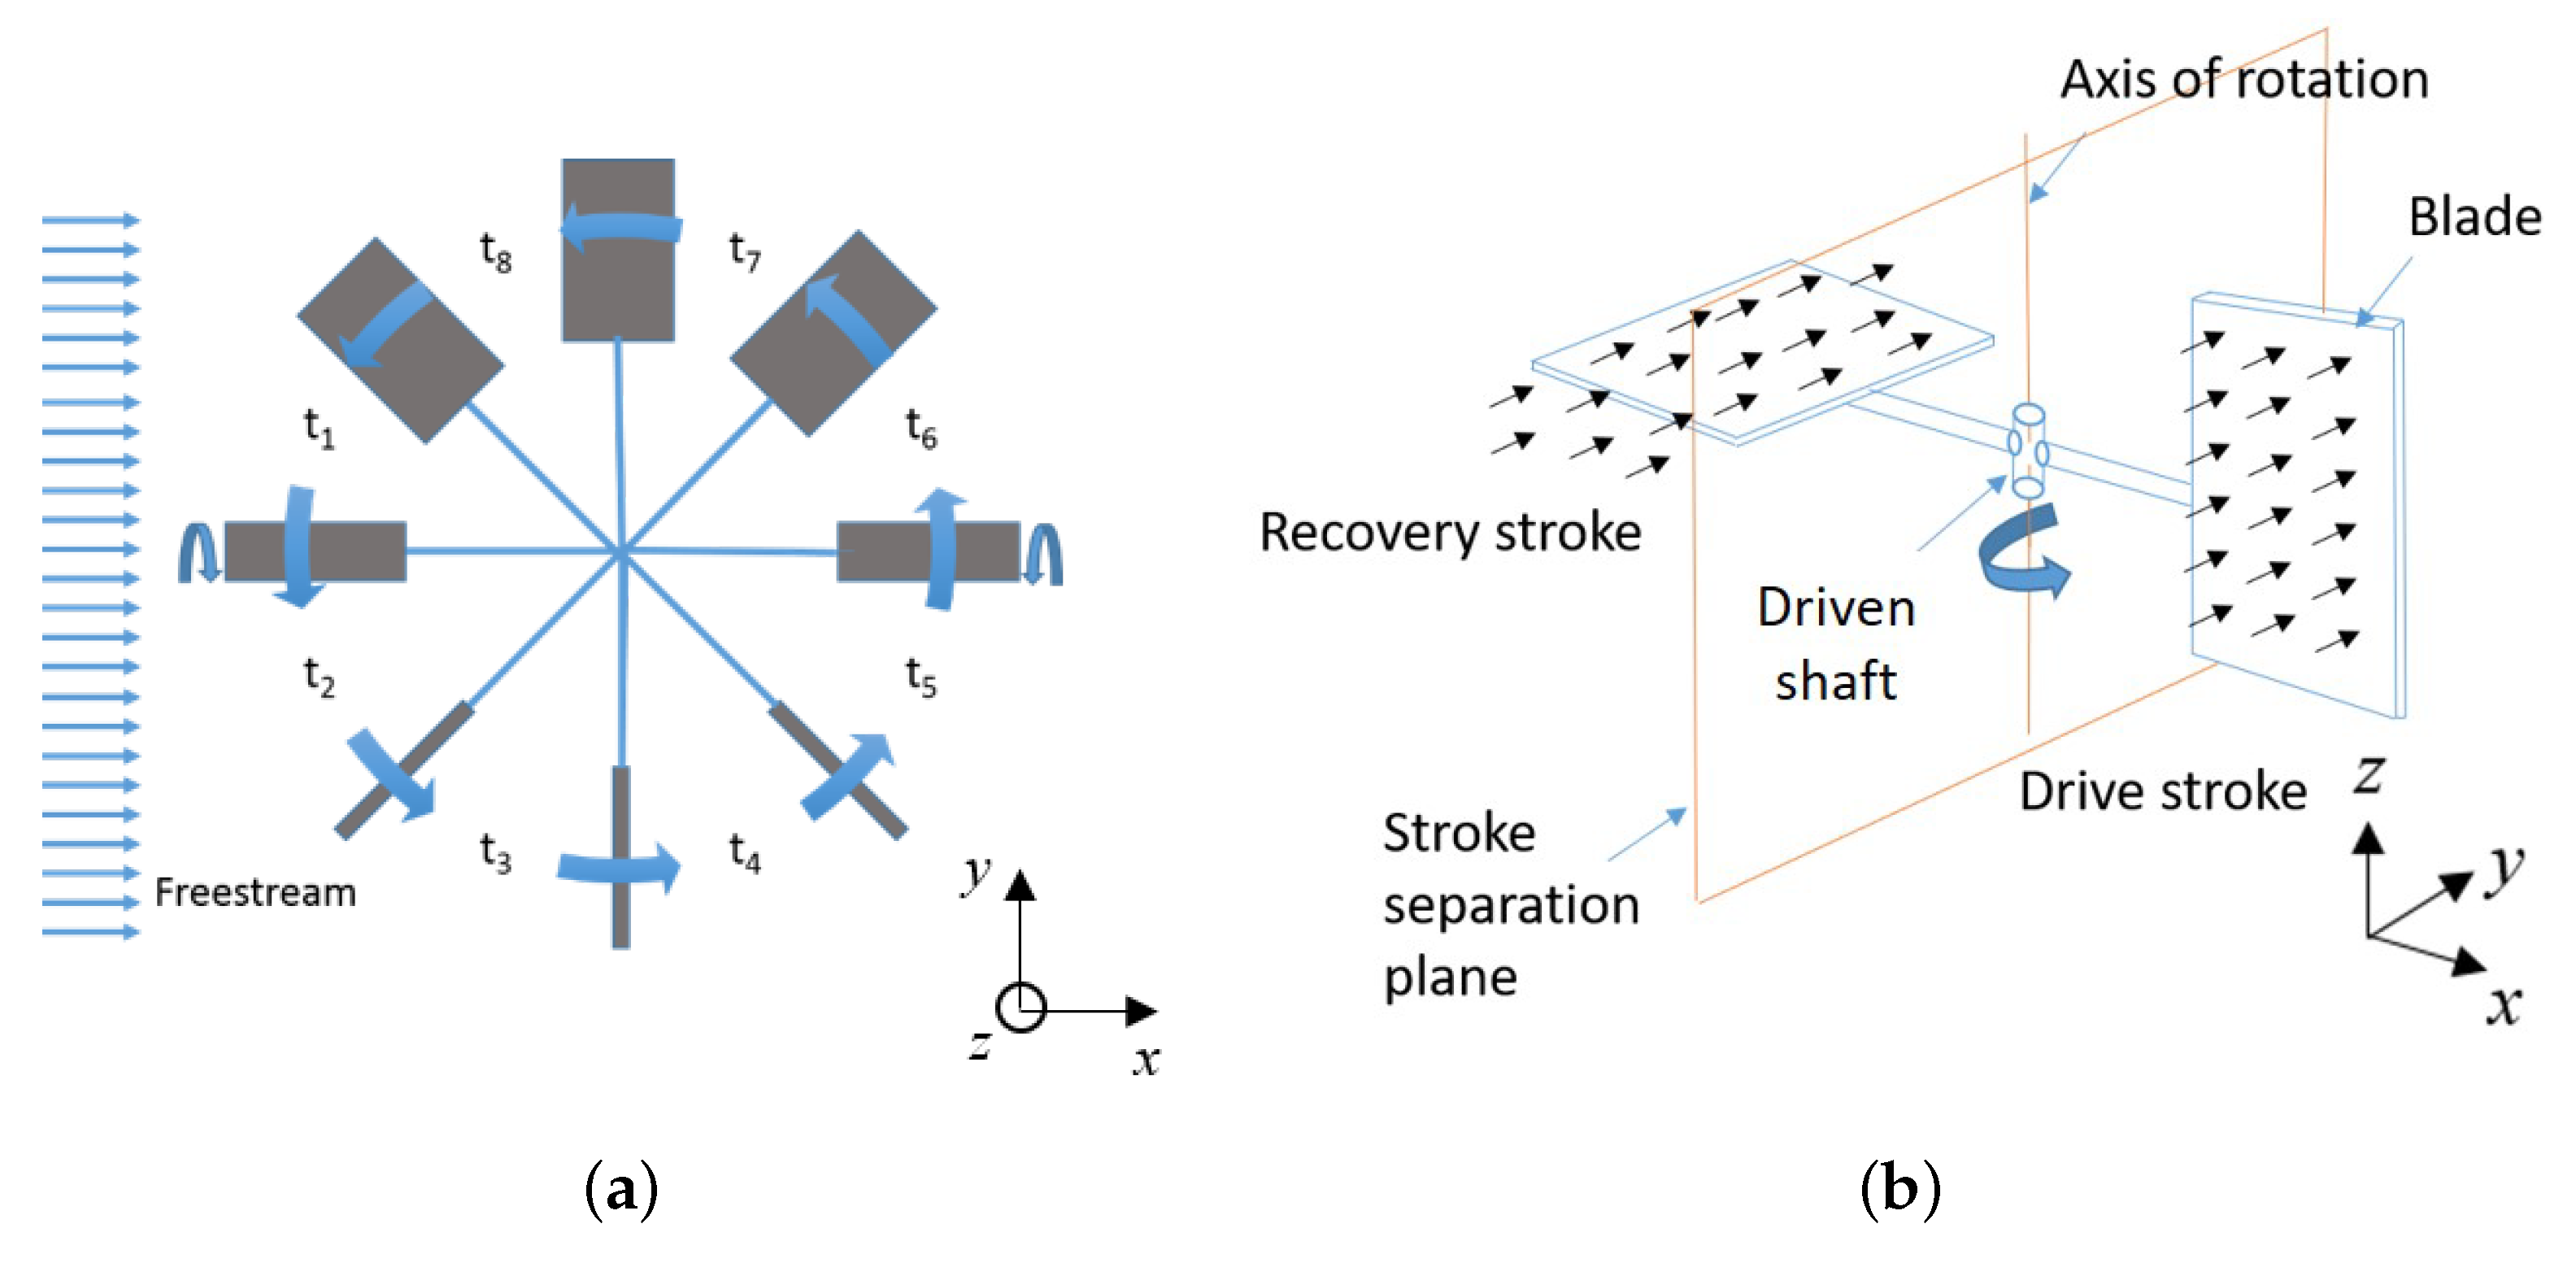
A rotary actuation typical of wind turbines, as described in Figure 3a,b, is developed to achieve a similar result. Here, the plate is vertically oriented for a drive stroke between and . The plate then pitches by and moves upstream from to with a horizontal orientation for a recovery stroke, as shown in Figure 3a. The blades again pitch by to complete one cycle.
3. Mechanism
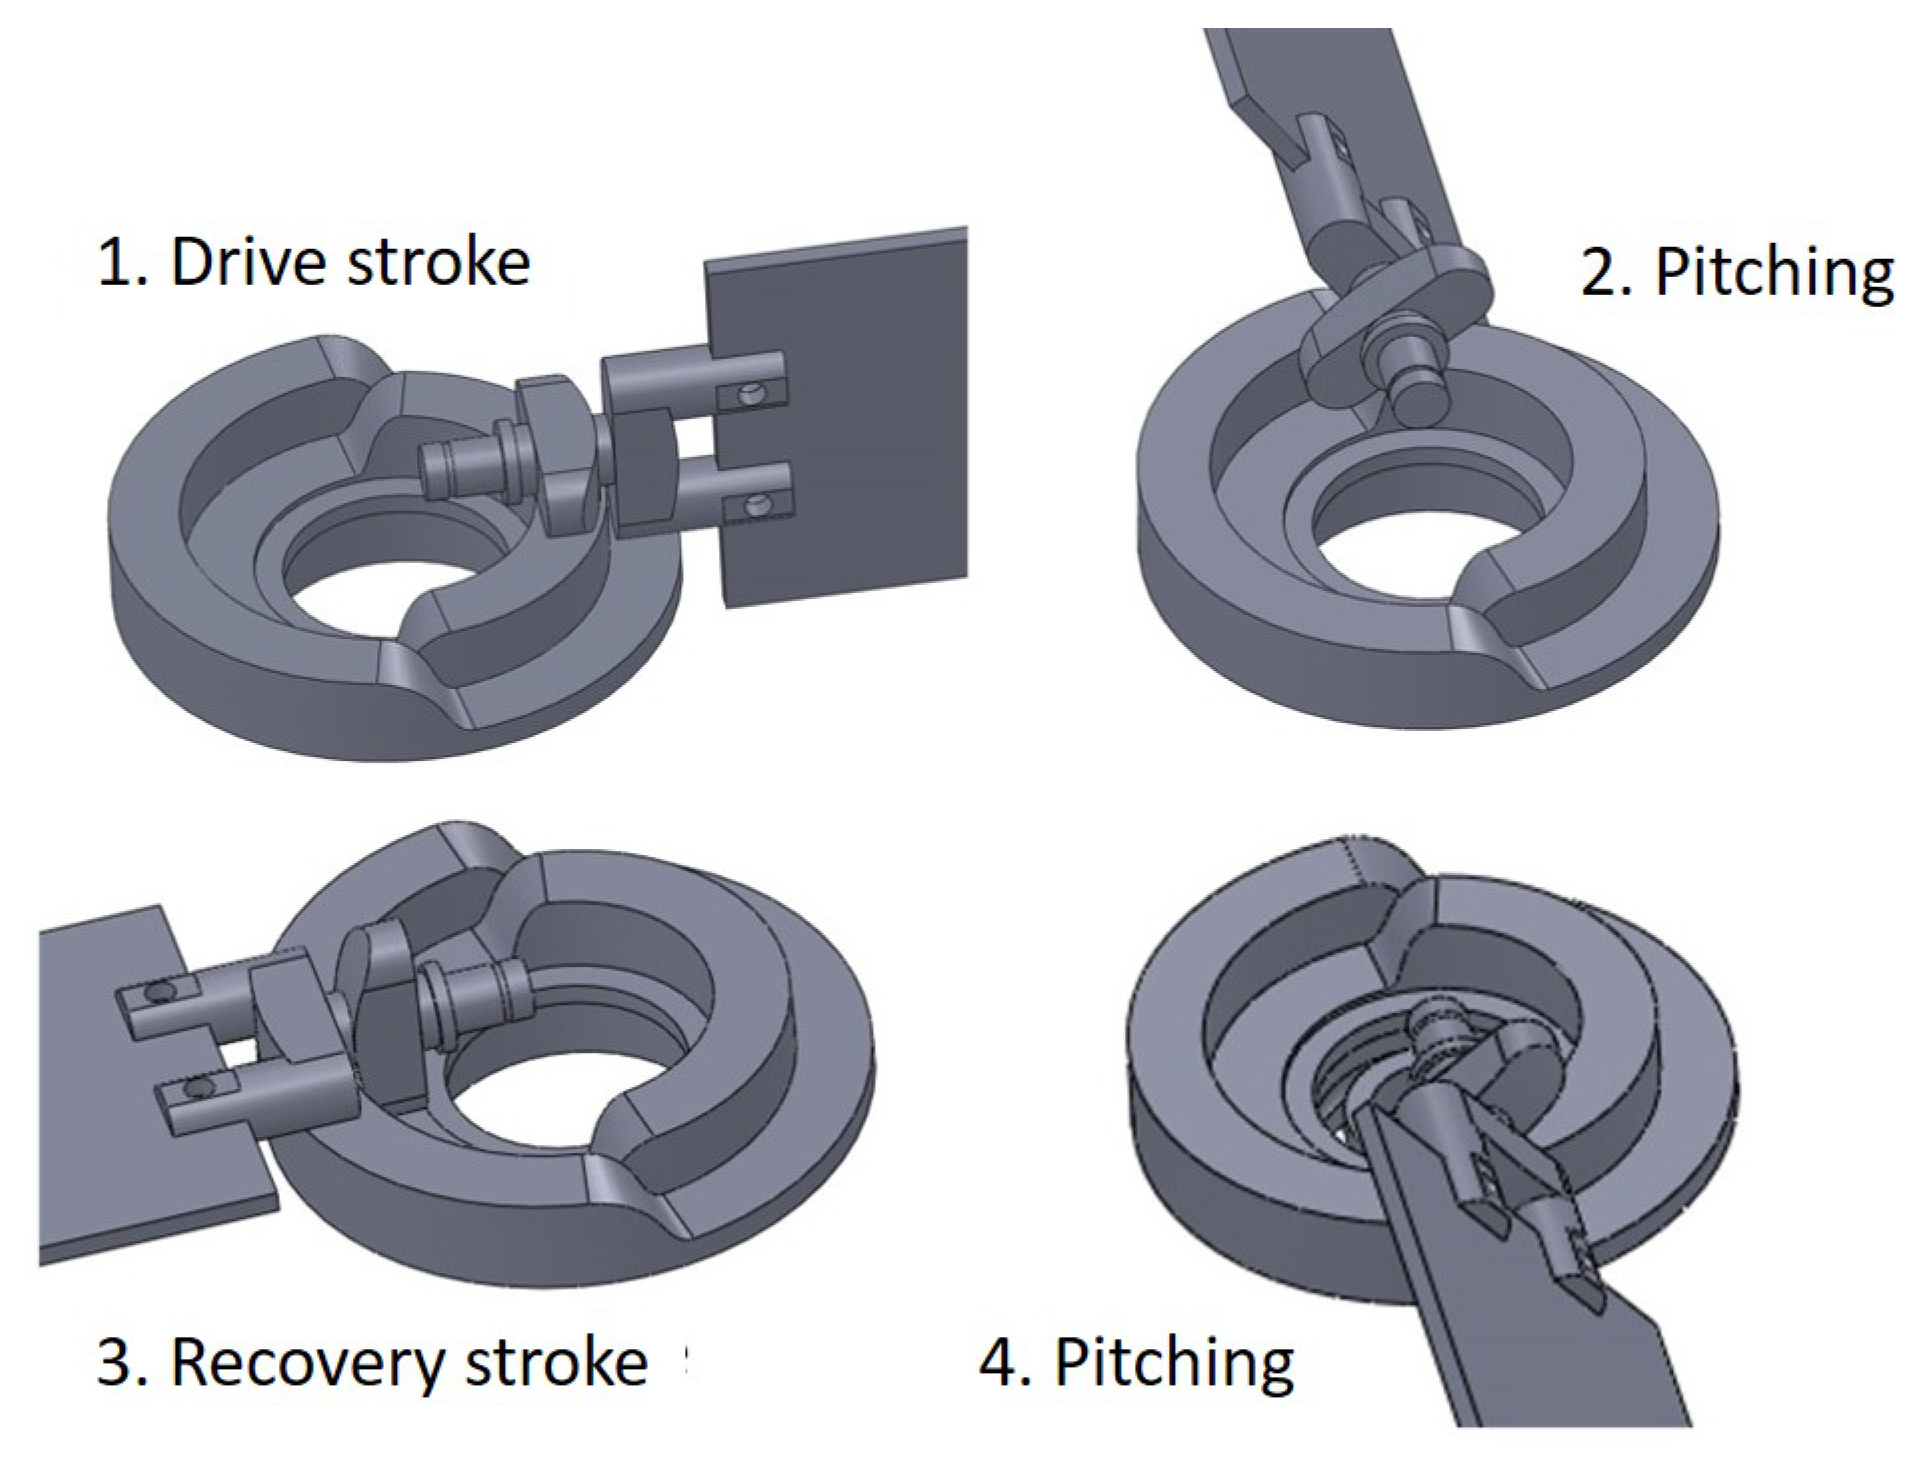
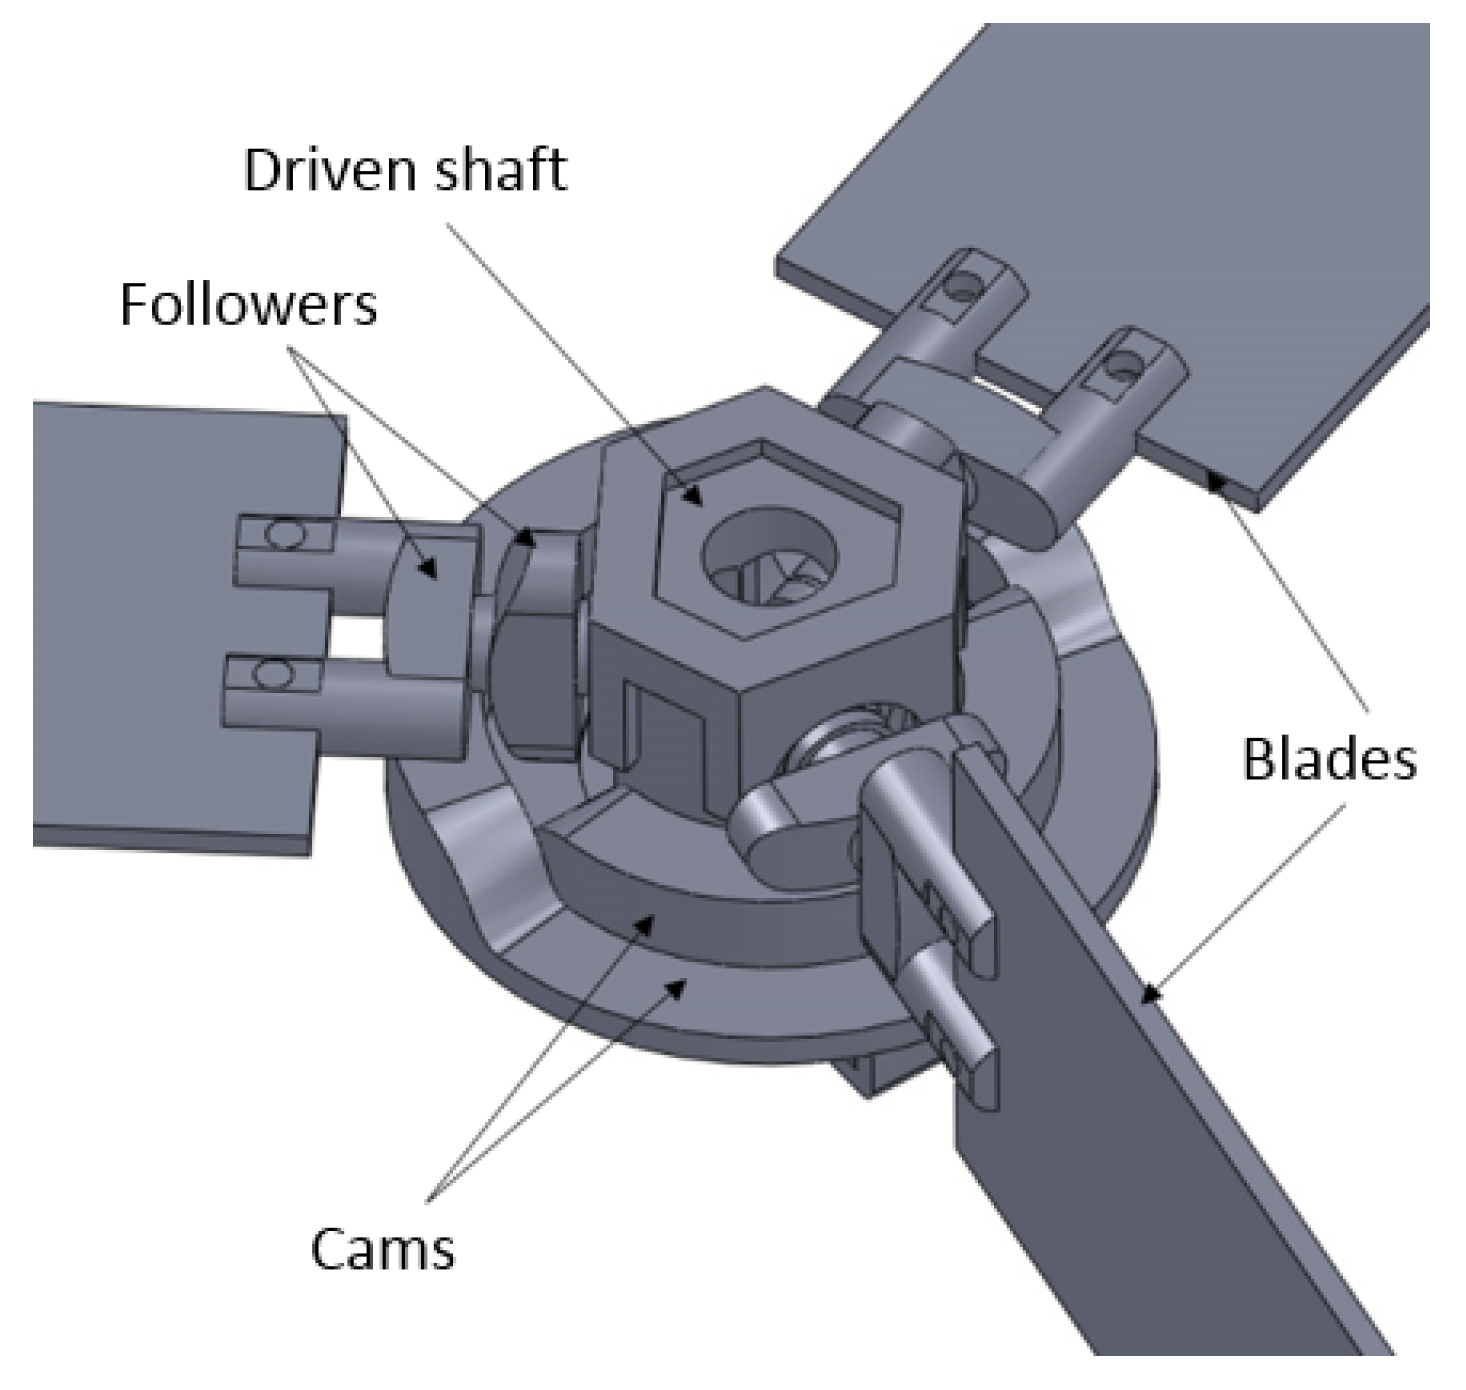
In order to achieve the blade pitching motion, a custom passive mechanism is developed called the dual-cam mechanism. The mechanism can be tuned to optimize turbine parameters and is a combination of existing mechanisms like swash plates observed in helicopters and cams and followers popularly seen in automotive engines. The dual-cam mechanism has two concentric end cams and its corresponding followers. It converts the rotary motion of the turbine about the turbine axis into a controlled pitching motion of the turbine blades while the blades transition between strokes. The four distinct stages of a cyclic pitch turbine’s blade are indicated in Figure 4.
The assembly model of the CPT is shown in Figure 5, which shows all the parts of the turbine. A central hub holds the blades of the turbine, dual-cam mechanism, and turbine blades and extends below as the driven shaft. Bearings are added in the central hub and mechanism to reduce friction.
4. Theoretical Formulation
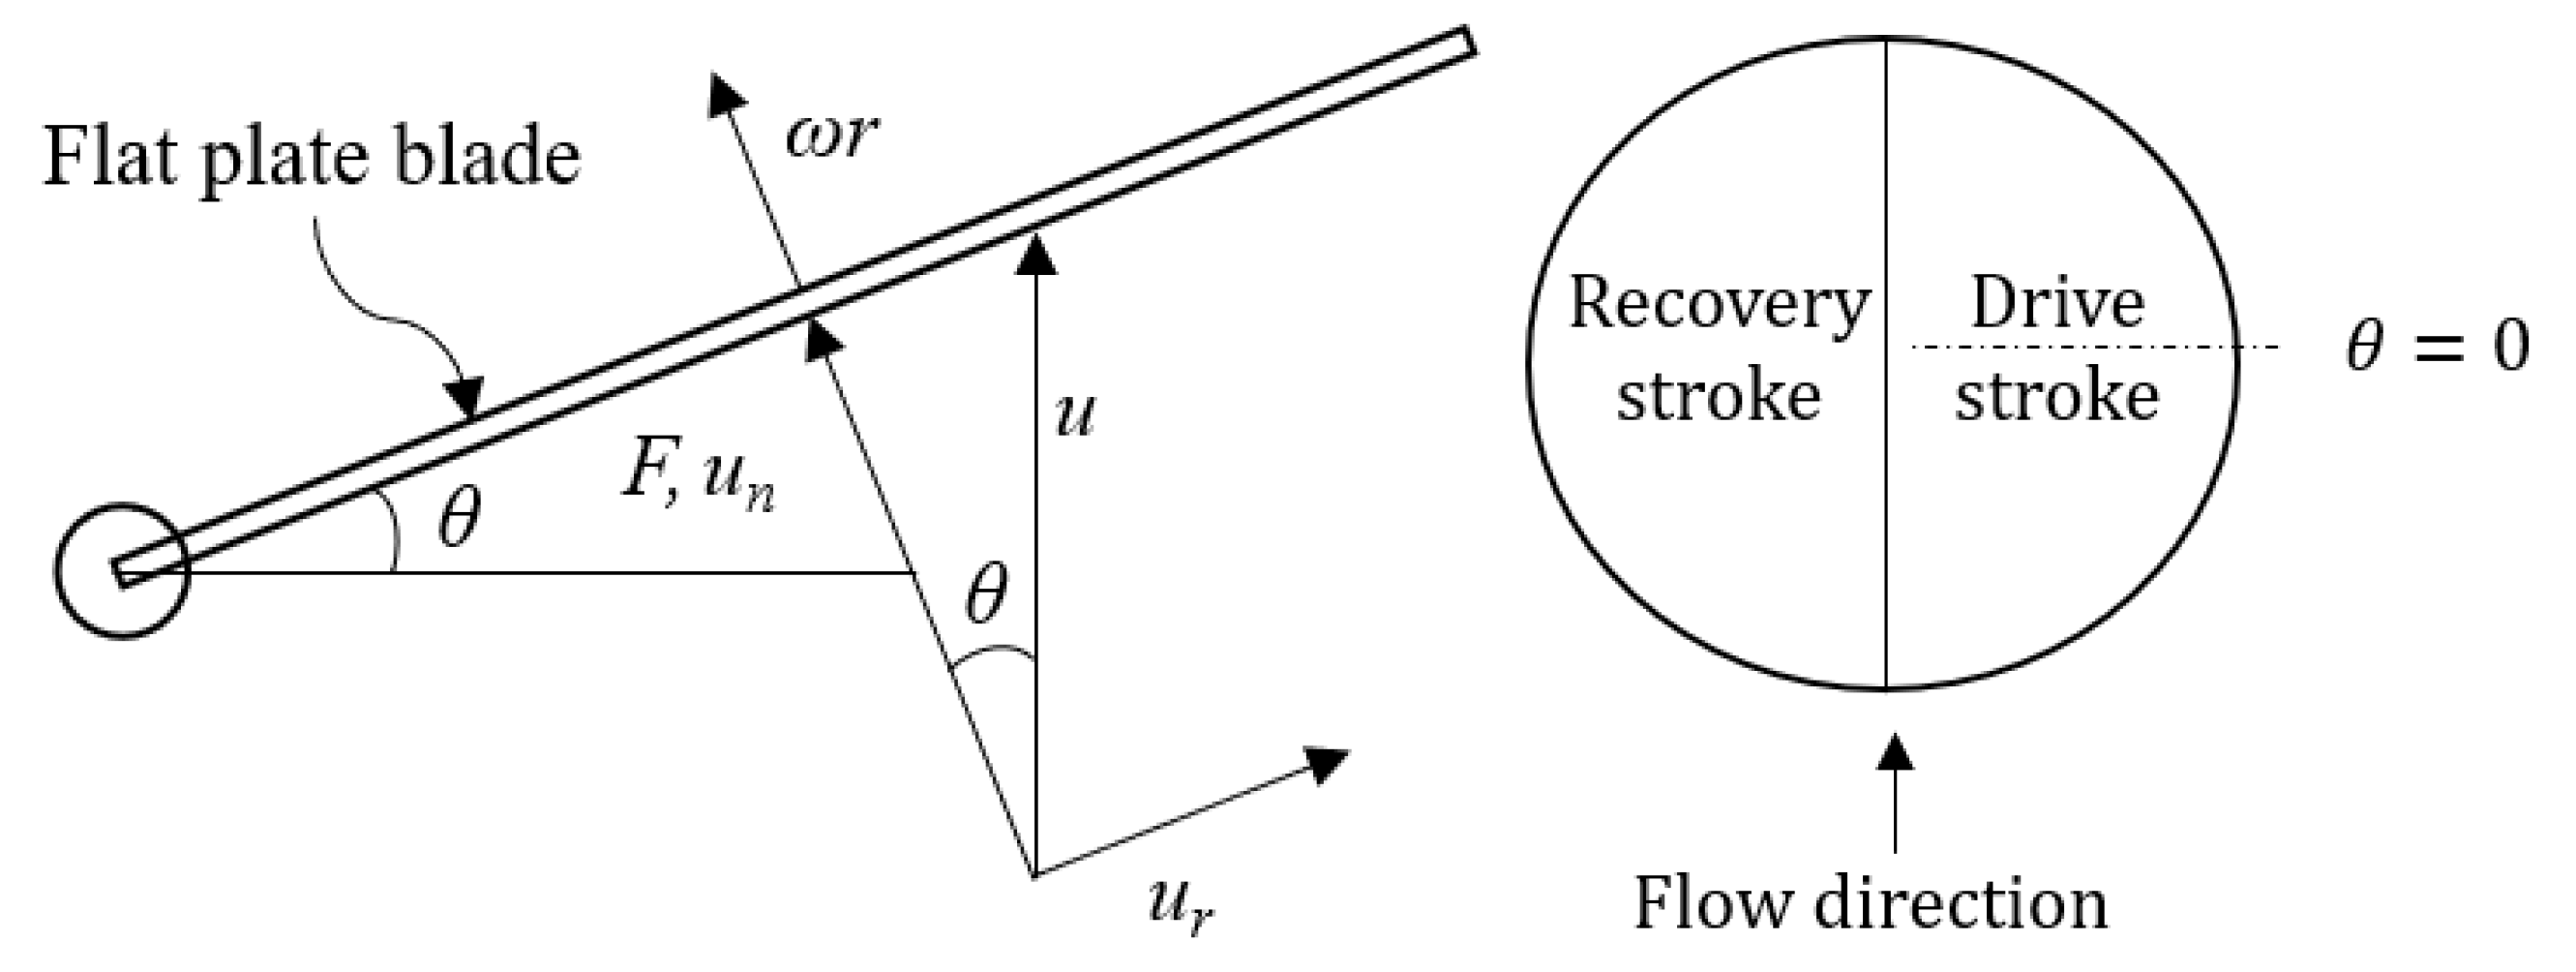
Theoretical models to predict the performance of drag-based turbines are not available due to the complex, turbulent, and transient flow around vertical axis turbines. An analytical approach to predicting the performance of the cyclic pitch turbine to model the turbine’s static and dynamic characteristics is proposed. The turbine blade is represented by a thin flat plate, which extends from the turbine rotation axis to its maximum blade length, R. The velocity diagram of a cyclic pitch turbine blade during a drive stroke is shown in top view in Figure 6. The free stream velocity u is split into radial and normal velocity components with respect to the blade given by Equation (2). The blade is assumed to rotate at a constant angular velocity , and the tangential force on the blade acting on the blade is given by F. The analysis assumes the azimuth angle to be when one of the three blades is perpendicular to the free stream, as shown in the figure, and it increments in the counter-clockwise direction.
4.1. Static Analysis
Static analysis of the turbine sheds light on the blades’ forces and torque generated by the turbine blades when the turbine is held fixed () in a particular position. The total rotation aiding drag force F is calculated for its drive stroke by using Equation (3) where R is blade length, H refers to the blade width, and is the density of fluid. For the recovery stroke, which ranges from – azimuth angles, the adverse drag force coefficient and consequently the drag force are considered to be zero [30,31]. For comparisons to the Savonius turbine, a drag coefficient of 2.3 is considered for the drive stroke (concave) and 1.2 for the recovery stroke (convex) [34].
As the turbine blades are not moving, the drag force is uniformly distributed across a blade’s length. The torque T applied on the turbine shaft by a blade can be calculated as and is given by Equation (4). Then, the static torque coefficient is calculated using Equation (5).
The static torque coefficient, , is an important performance indicator for wind turbines of their self-starting capabilities [35].
4.2. Dynamic Analysis
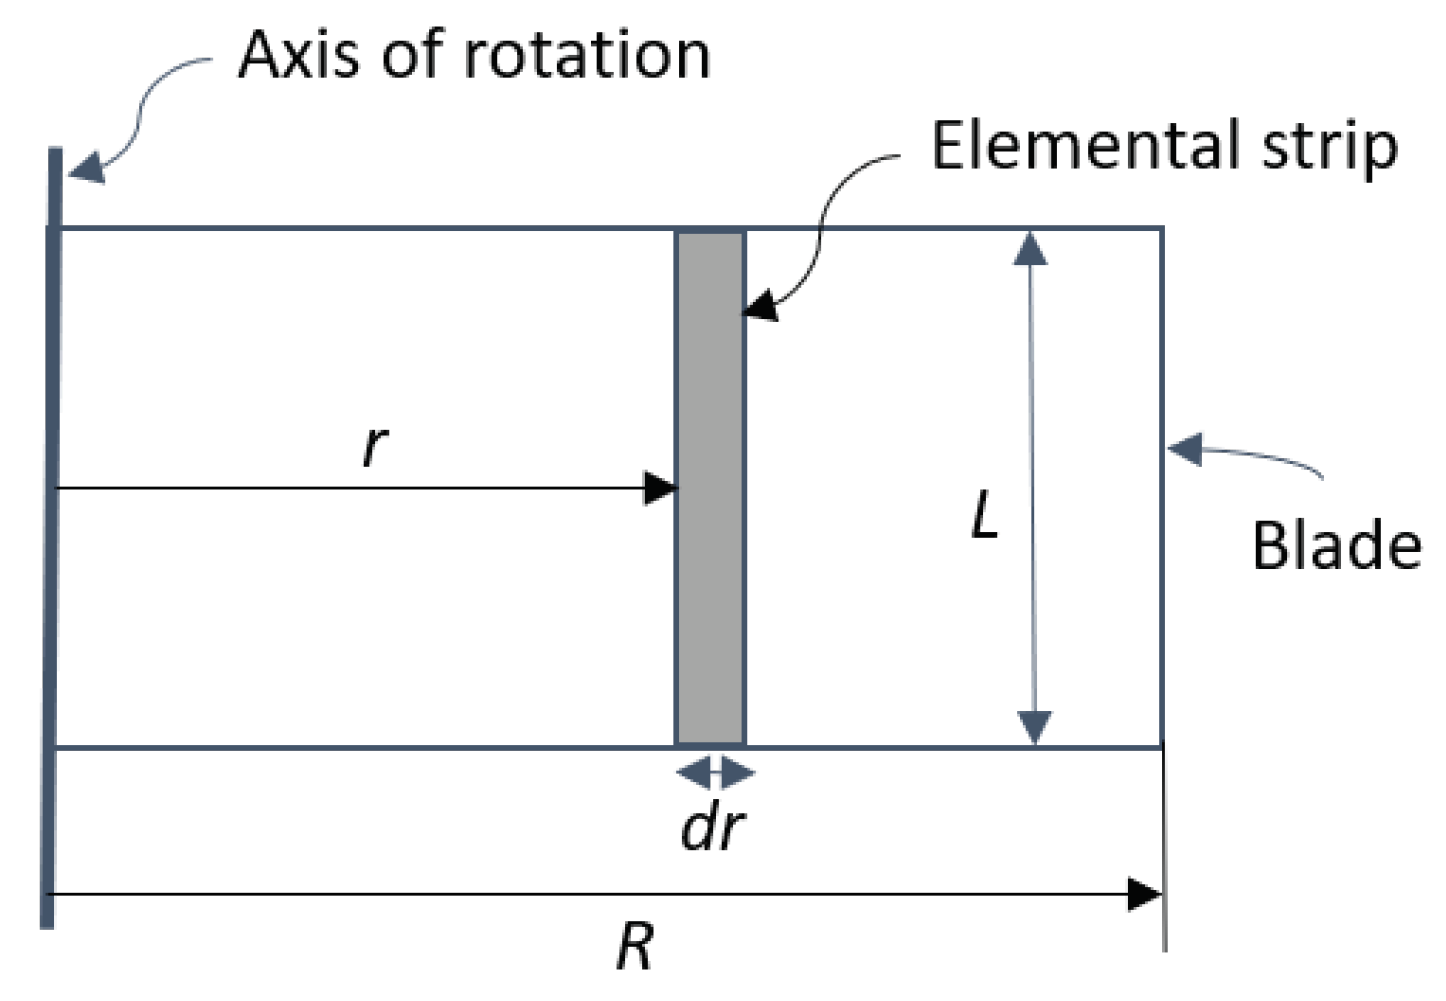
Dynamic characteristics of the turbine including the torque and power performance are evaluated assuming the blades rotate at a constant angular rate . The relative normal velocity component varies across the blade length, and hence, the blade is split into infinitesimal elements, as shown in Figure 7, to calculate the drag forces accurately. The infinitesimal drag force is given by Equation (6) for a blade element of thickness at a distance of r units from the turbine axis.
The normal relative velocity, , decreases as we move from the blade root towards its tip. Up to a certain azimuth angle, on either side of the zero azimuth, the entire blade experiences only positive and generates only positive power . The value for is given by Equation (7) and is a function of just the tip speed ratio given by .
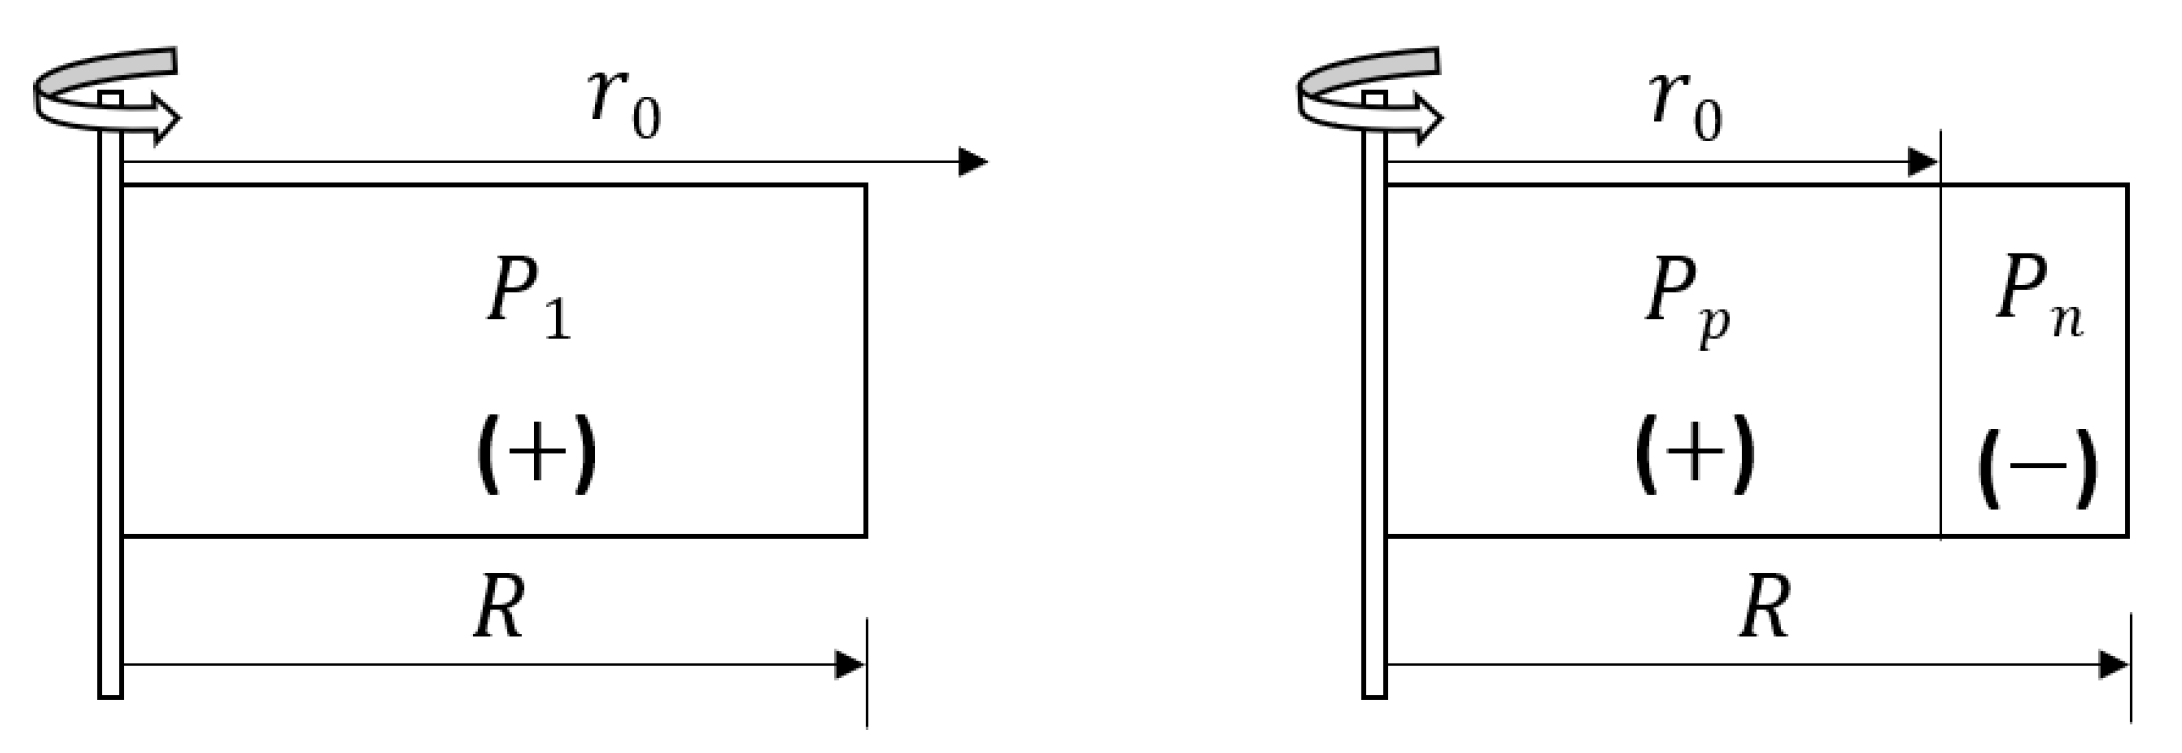
For azimuth angles larger than , blade elements closer to the blade’s tip experience negative and generate negative power . The blade elements closer to the blade’s root experience a positive and generate positive power . The two regions are separated by a radial location where and given by:
The two cases where a CPT blade produces only positive power or both positive power , as well a negative power are illustrated in Figure 8 and are analyzed separately.
The total instantaneous force F acting on the CPT blade at any azimuth angle for both cases is obtained by integrating over the entire blade length using Equation (9). The appropriate ± sign according to the radial integral limits and is to be used. For the first case, where the entire blade produces positive power, and . In the second case, the integration is split at , and the second term has a negative sign.
Similarly, the infinitesimal, as well as the total torque and power outputs from a CPT blade are calculated as:
Using the above equations, , applicable to and and , applicable to the rest of the drive stroke azimuth angles, are obtained as:
The average power output from a CPT blade for one whole rotation is obtained by integrating the instantaneous blade power output for just the drive stroke, as shown in Equation (15), since no power losses occur during the recovery stroke due to the negligible drag forces.
The expression for instantaneous power output is different depending on the azimuth angle under consideration and is appropriately substituted in Equation (15) as:
Integrating the above equation by substituting the expressions for individual terms, the average power output from the cyclic pitch turbine blade is determined to be:
The coefficient of torque for the turbine is calculated from the average torque generated by a blade by using Equation (18) where is the dynamic pressure of the fluid flow.
Similarly, the coefficient of power can be determined by dividing the average power output of the turbine by the total power available in the fluid motion.
The final expression for for a three-bladed turbine can now be obtained as:
The performance of the turbine, as shown by the above equations, is solely based on the drag coefficient of the flat plate and the tip speed ratio , since . To maximize , the turbine must be operated at the optimal tip speed ratio by adjusting the load on the turbine. The turbine blades are separated by , and each blade operates, for the majority of it’s drive stroke, without a secondary blade in its wake or shadow. Hence, shadowing effects and fluid interactions between the blades are not considered in the analysis. If the range of the drive stroke is reduced from its usual active drive stroke angle range of to , the duration of the recovery stroke increases by the same amount for which the blades would remain horizontal. Then, the average power output would be determined by reducing the integration limits in Equation (15).
5. Theoretical Results
5.1. Static Characteristics
The mathematical formulation developed was used to determine the static and dynamic characteristics of the cyclic pitch turbine. The magnitudes of force, torque, and power generated by the turbine blades, as well as the non-dimensional torque and power coefficients of the turbine were evaluated.
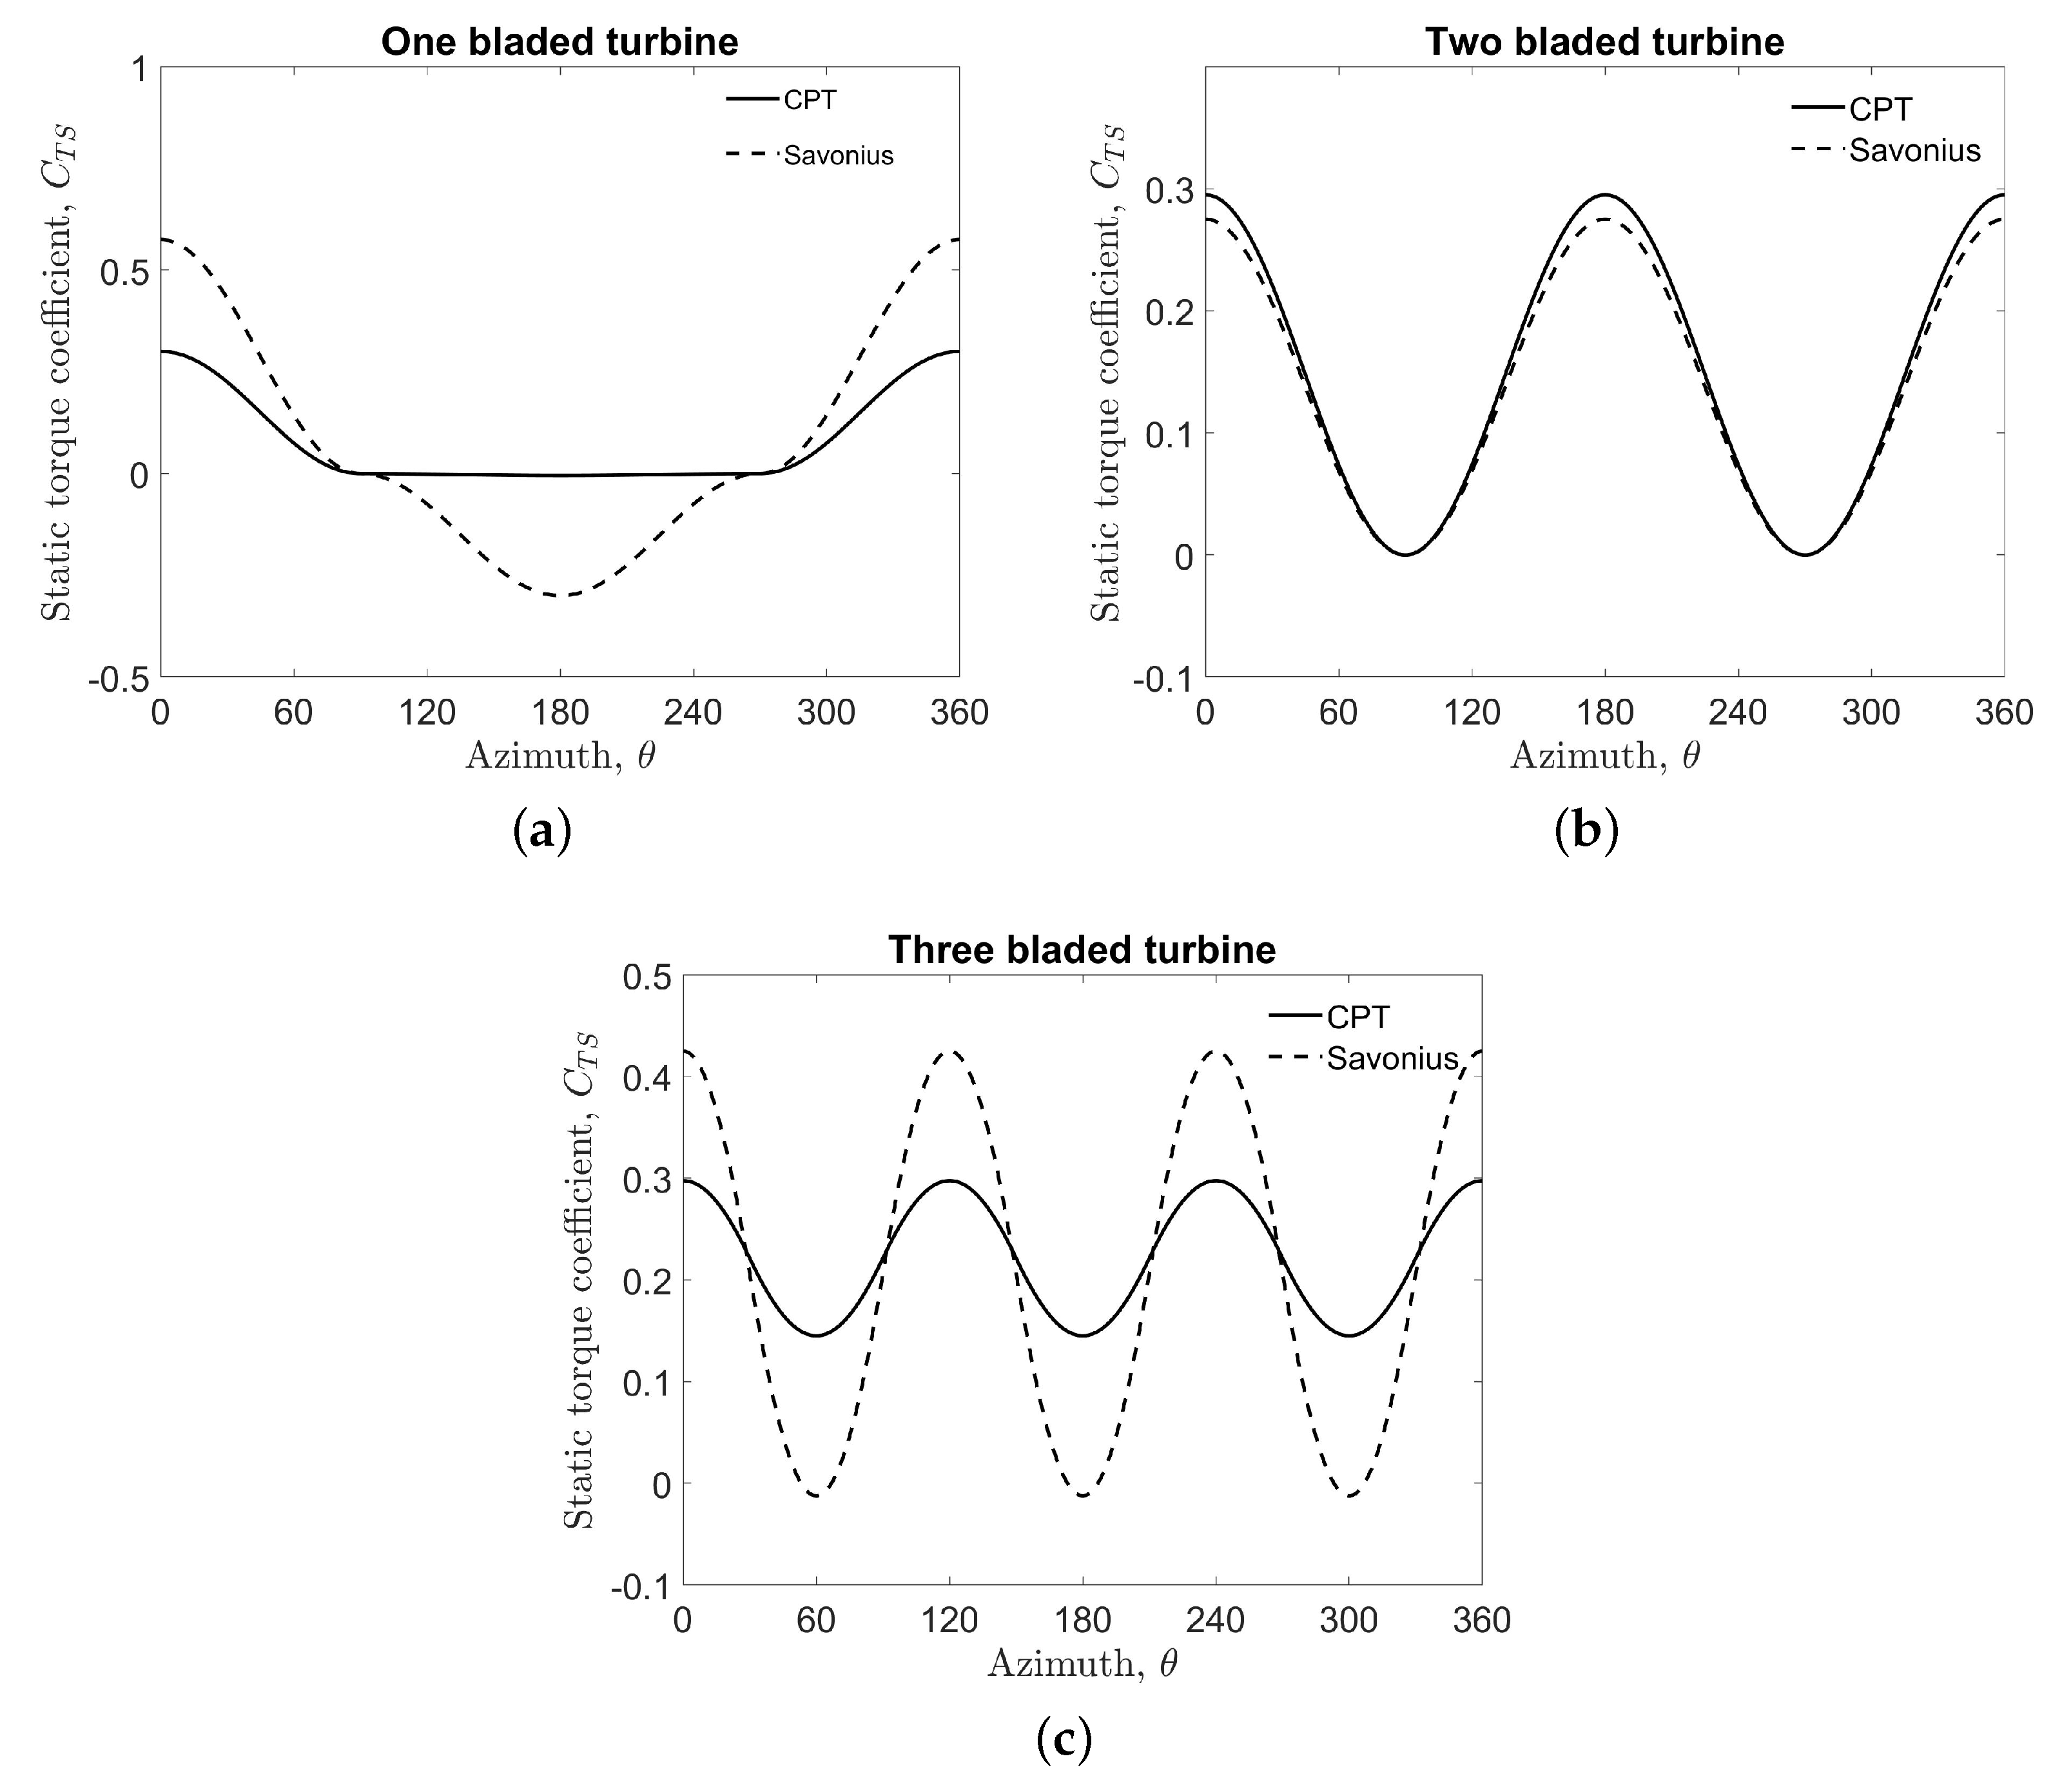
The static torque coefficient was calculated using Equation (5), and it is a measure of torque applied on a turbine’s stationary blades. Static torque coefficient values were calculated for both CPT and the Savonius turbine for one, two and three-bladed turbine designs and compared. The results are plotted as shown in Figure 9. The cyclic pitch turbine had an average that was higher than that of the Savonius turbine for all three configurations. For the one-bladed turbine configuration, as shown in Figure 9a, the CPT had a zero during the recovery stroke, while the Savonius turbines experience negative torque values. For the two-bladed configuration shown in Figure 9b, the CPT followed closely that of the Savonius turbine and showed a slightly higher . For the three-bladed configuration in Figure 9c, both turbines showed an oscillating , with the CPT turbine having a lower amplitude fluctuation, which is desirable for a more consistent and uniform power output. The Savonius turbine, in one rotation, had three instances of slightly negative torque values around , , and where the turbine would not be self-starting. It can be observed from the above three plots that the average starting torque for the CPT turbine was always non-negative and was slightly higher and more consistent than that of the Savonius turbine [36].
5.2. Dynamic Characteristics
Cyclic pitch turbine outputs like the blade forces, torque, power output, and torque and power coefficients were evaluated for a non-zero . While the turbine rotated, the relative normal velocity was lower for the drive stroke and higher for the recovery stroke. For the CPT, the recovery stroke forces still remained negligible due to its almost zero drag coefficient, while the drive stroke forces decreased, resulting in lower power output. The losses were two-fold for a Savonius turbine since adverse drag forces increased on the recovery stroke, while simultaneously, the positive drive stroke forces decreased.
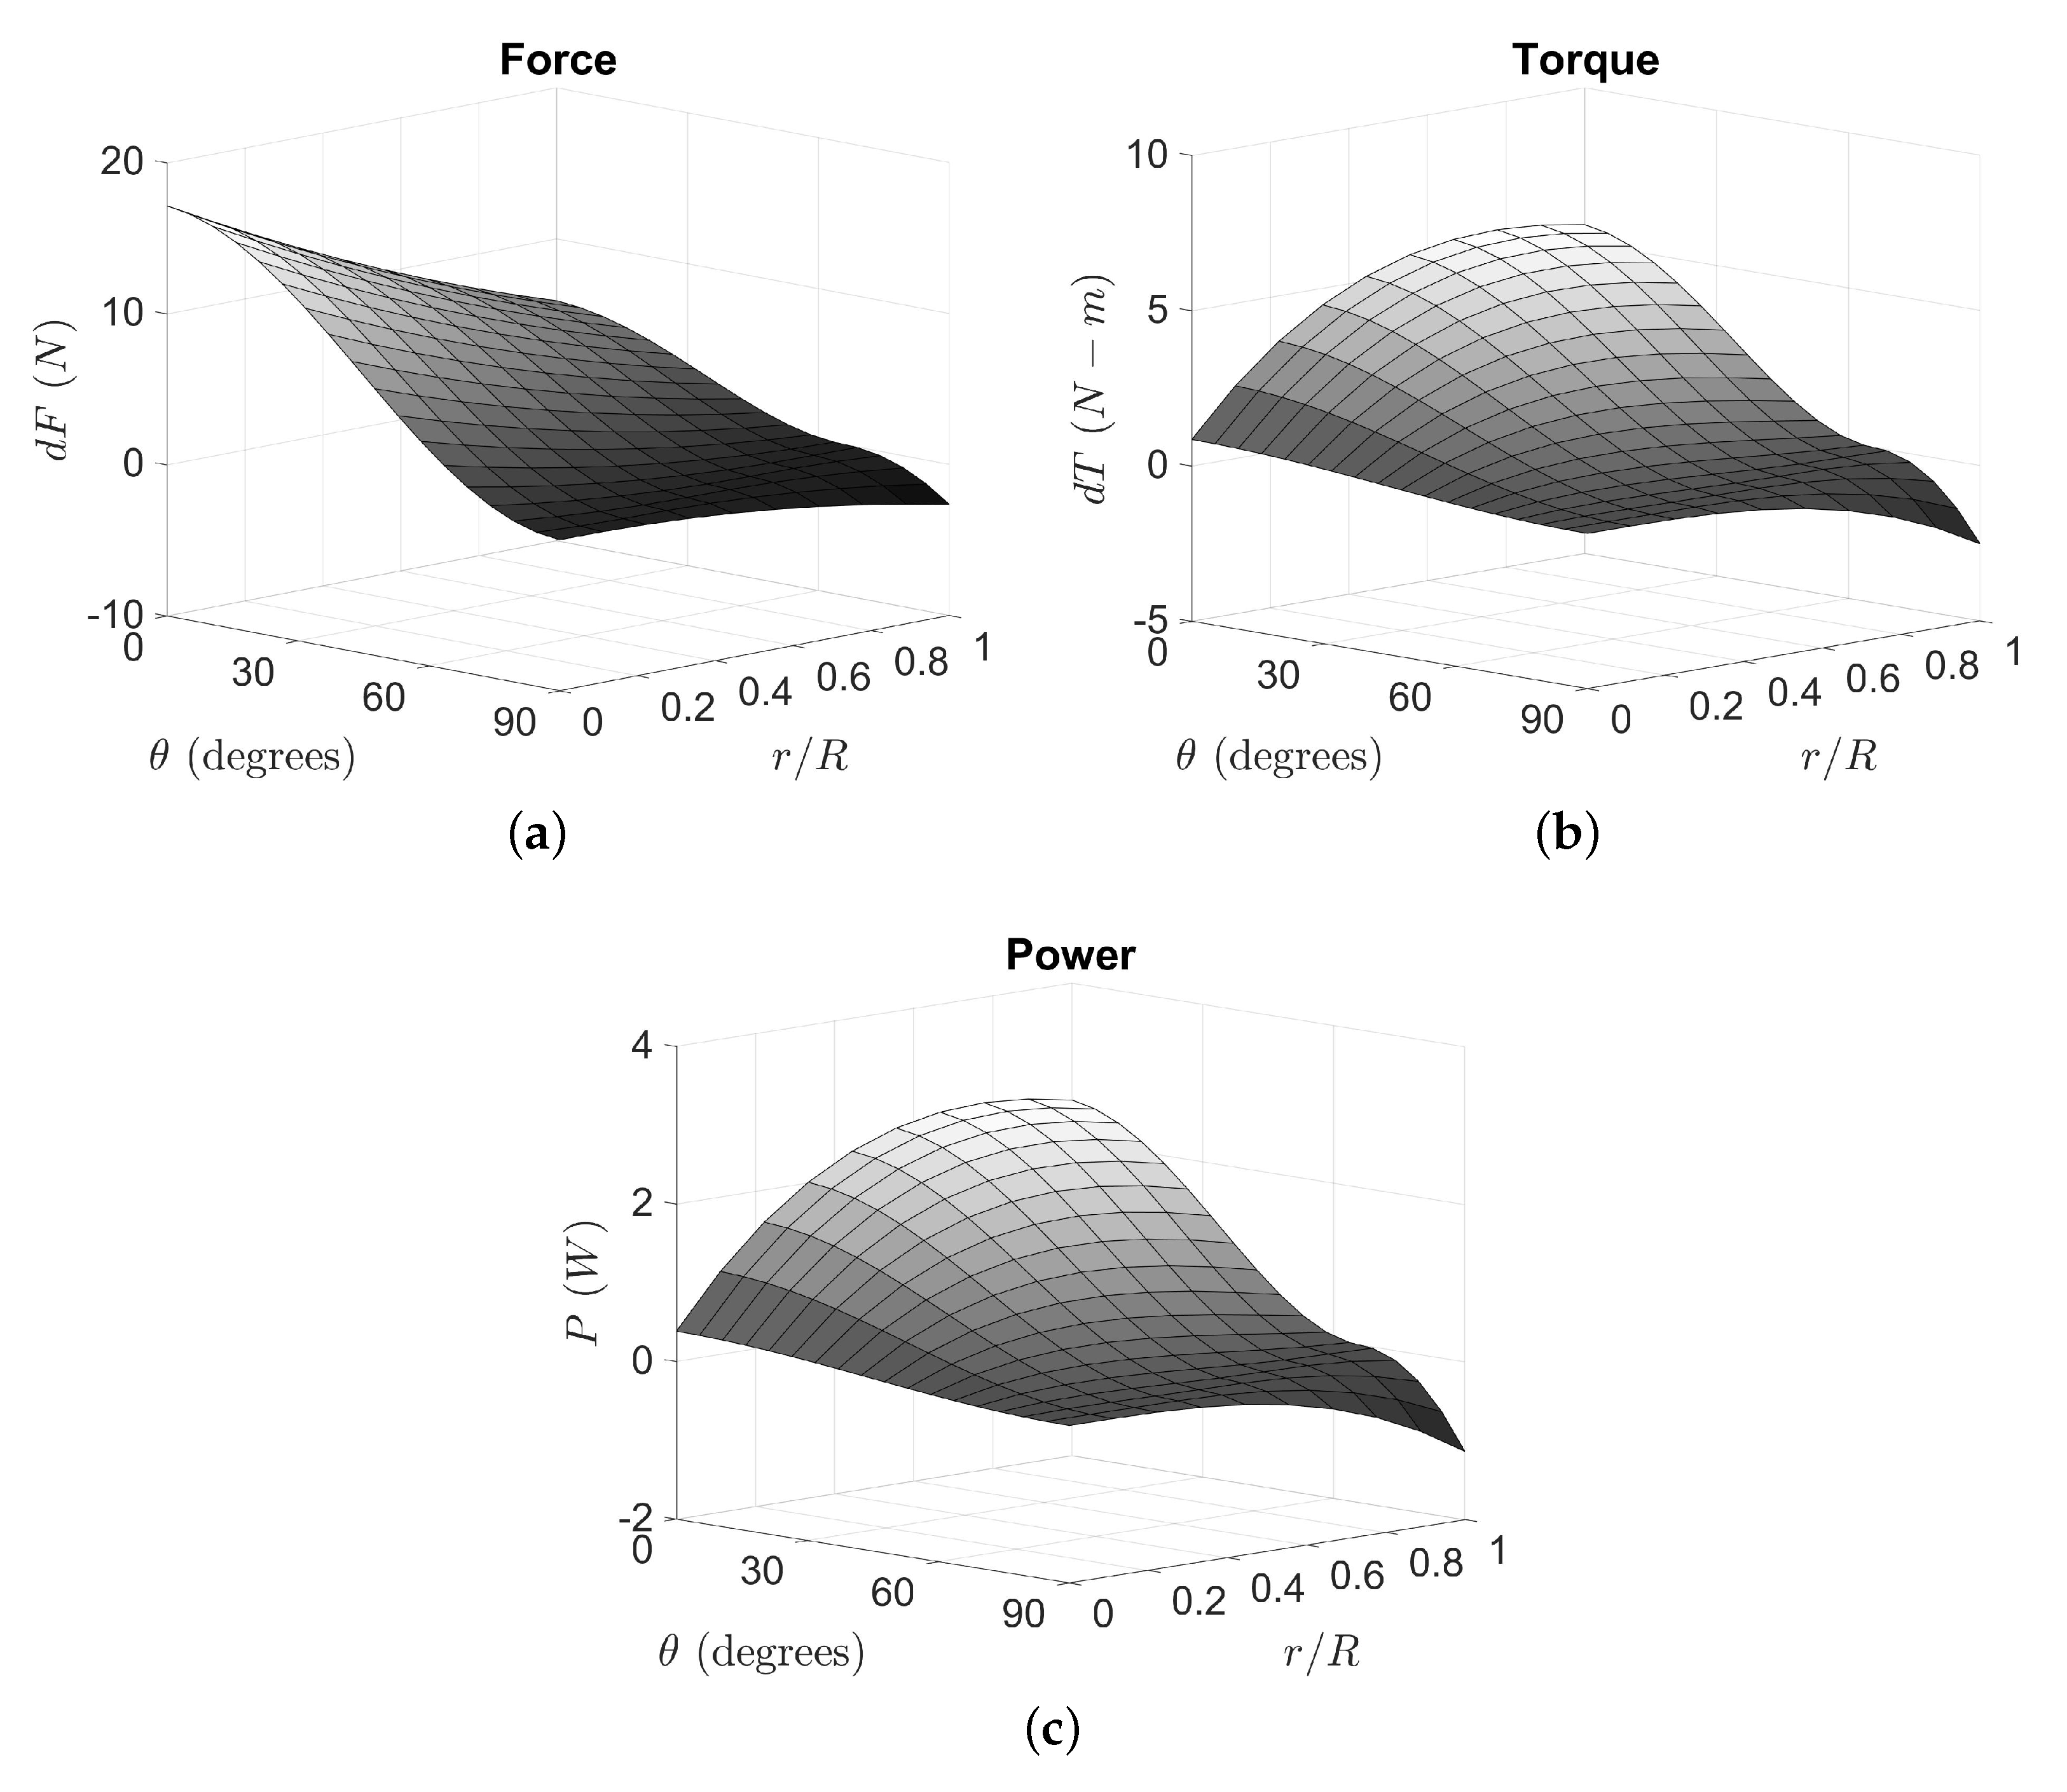
Force, torque, and power generated by CPT blade elements at different span-wise locations and for different azimuth angles are shown as surface plots in Figure 10. The figure gives a sense of the relative contributions from 10 blade elements of a 1 m-long and 0.3 m-wide blade rotating at a tip speed ratio of 0.45 in water. The values are depicted for azimuth angles ranging from 0–90, the second half of the drive stroke. Figure 10a shows that the force on a blade was largest closest to the blade’s root and at where the blade experienced the maximum . The force decreased as we move towards the blade tip and also as the azimuth angle increased. Similarly, Figure 10b shows the calculated torque values, with the maximum magnitude occurring at zero azimuth and at a radial location where the product of force and radius was maximum. Figure 10c shows the instantaneous power output for all the blade elements, and it followed the same trend as torque since the power output P is the product of torque T and angular velocity , which is considered to be constant.
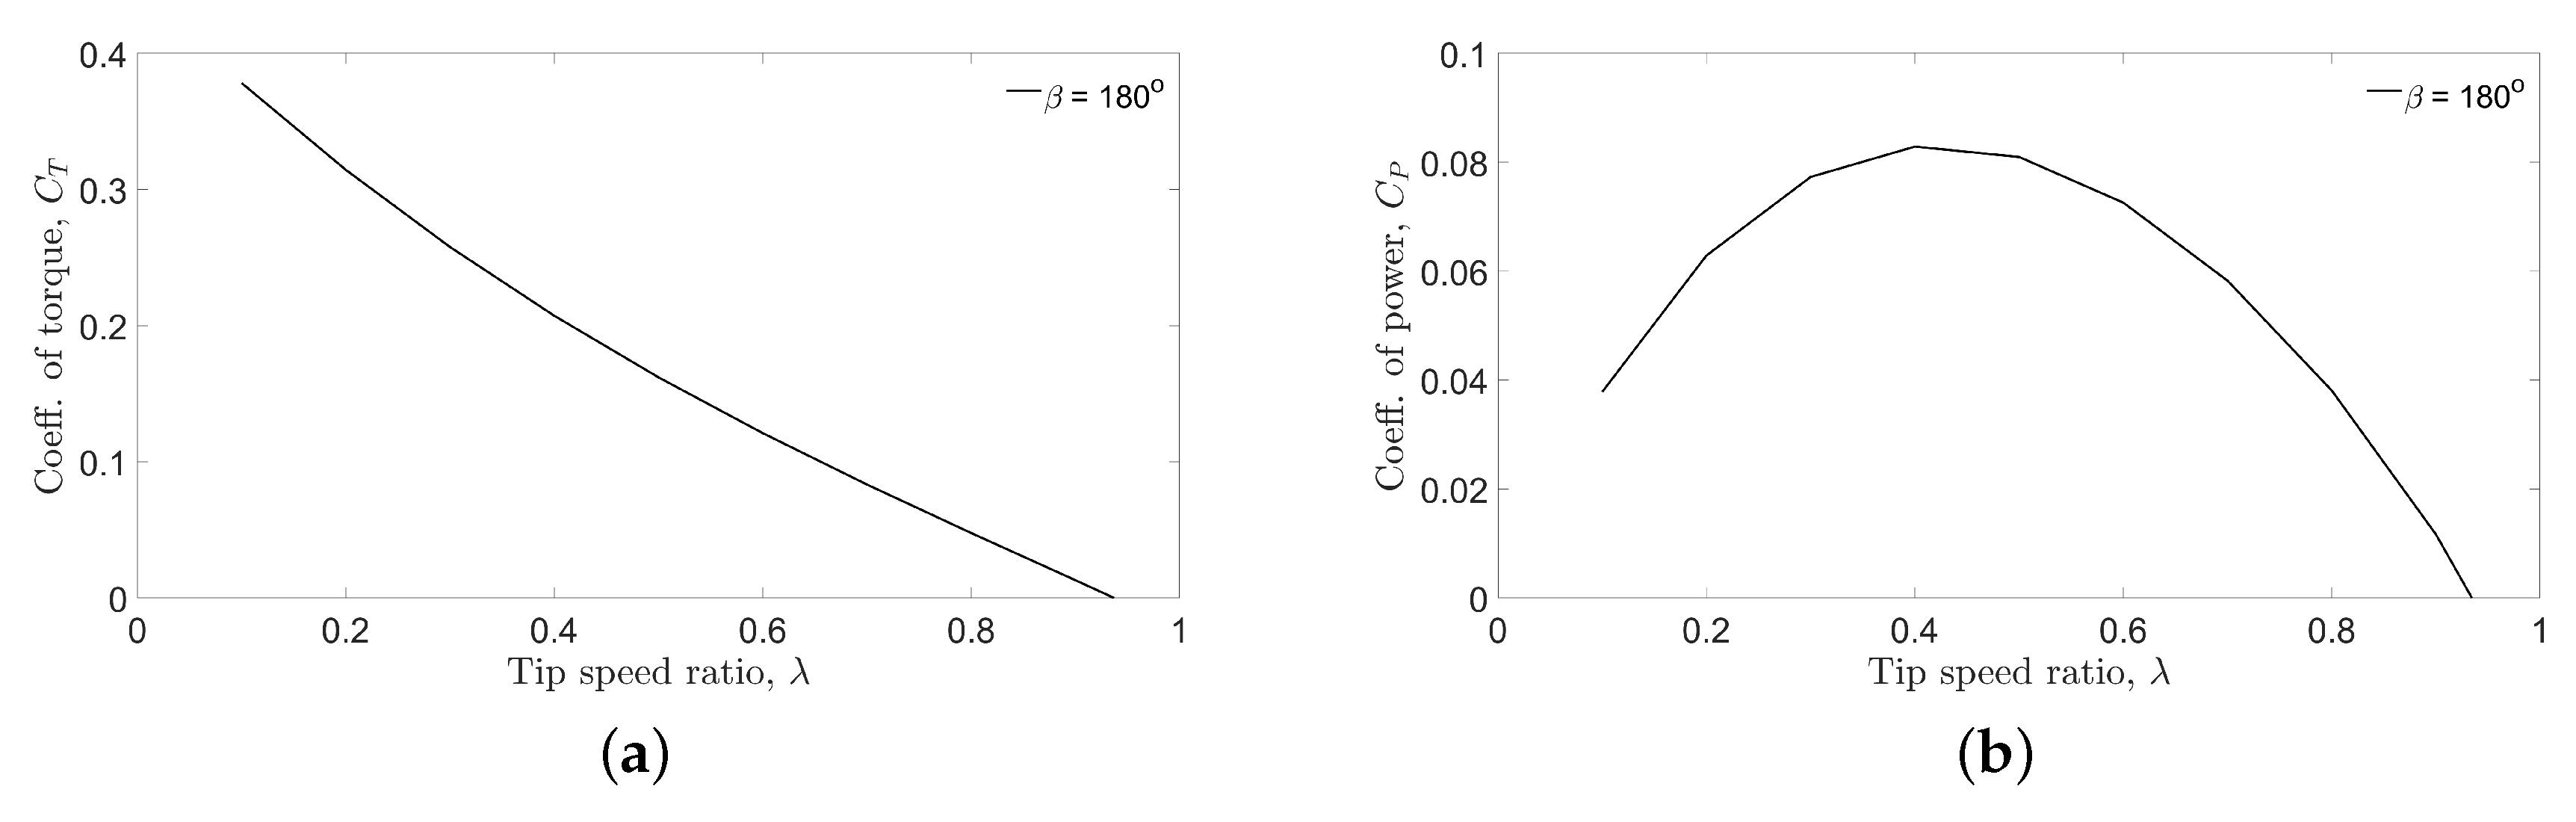
The coefficient of torque and power of the cyclic pitch turbine were calculated and plotted as a function of tip speed ratio for a full active drive stroke angle . Active drive stroke angle was the measure of the duration in degrees for which a CPT blade remained vertical and was active. Figure 11a shows that the coefficient of torque decreased continuously from a value of about 0.35 at a tip speed ratio value of 0.1 to a value of 0.05 at . This gradual drop in torque coefficient was expected and is typical of wind turbines including Savonius [13]. Figure 11b shows that the coefficient of power reached a maximum value of close to 9% at an intermediate tip speed ratio close to 0.5.
5.3. Optimal CPT Configuration
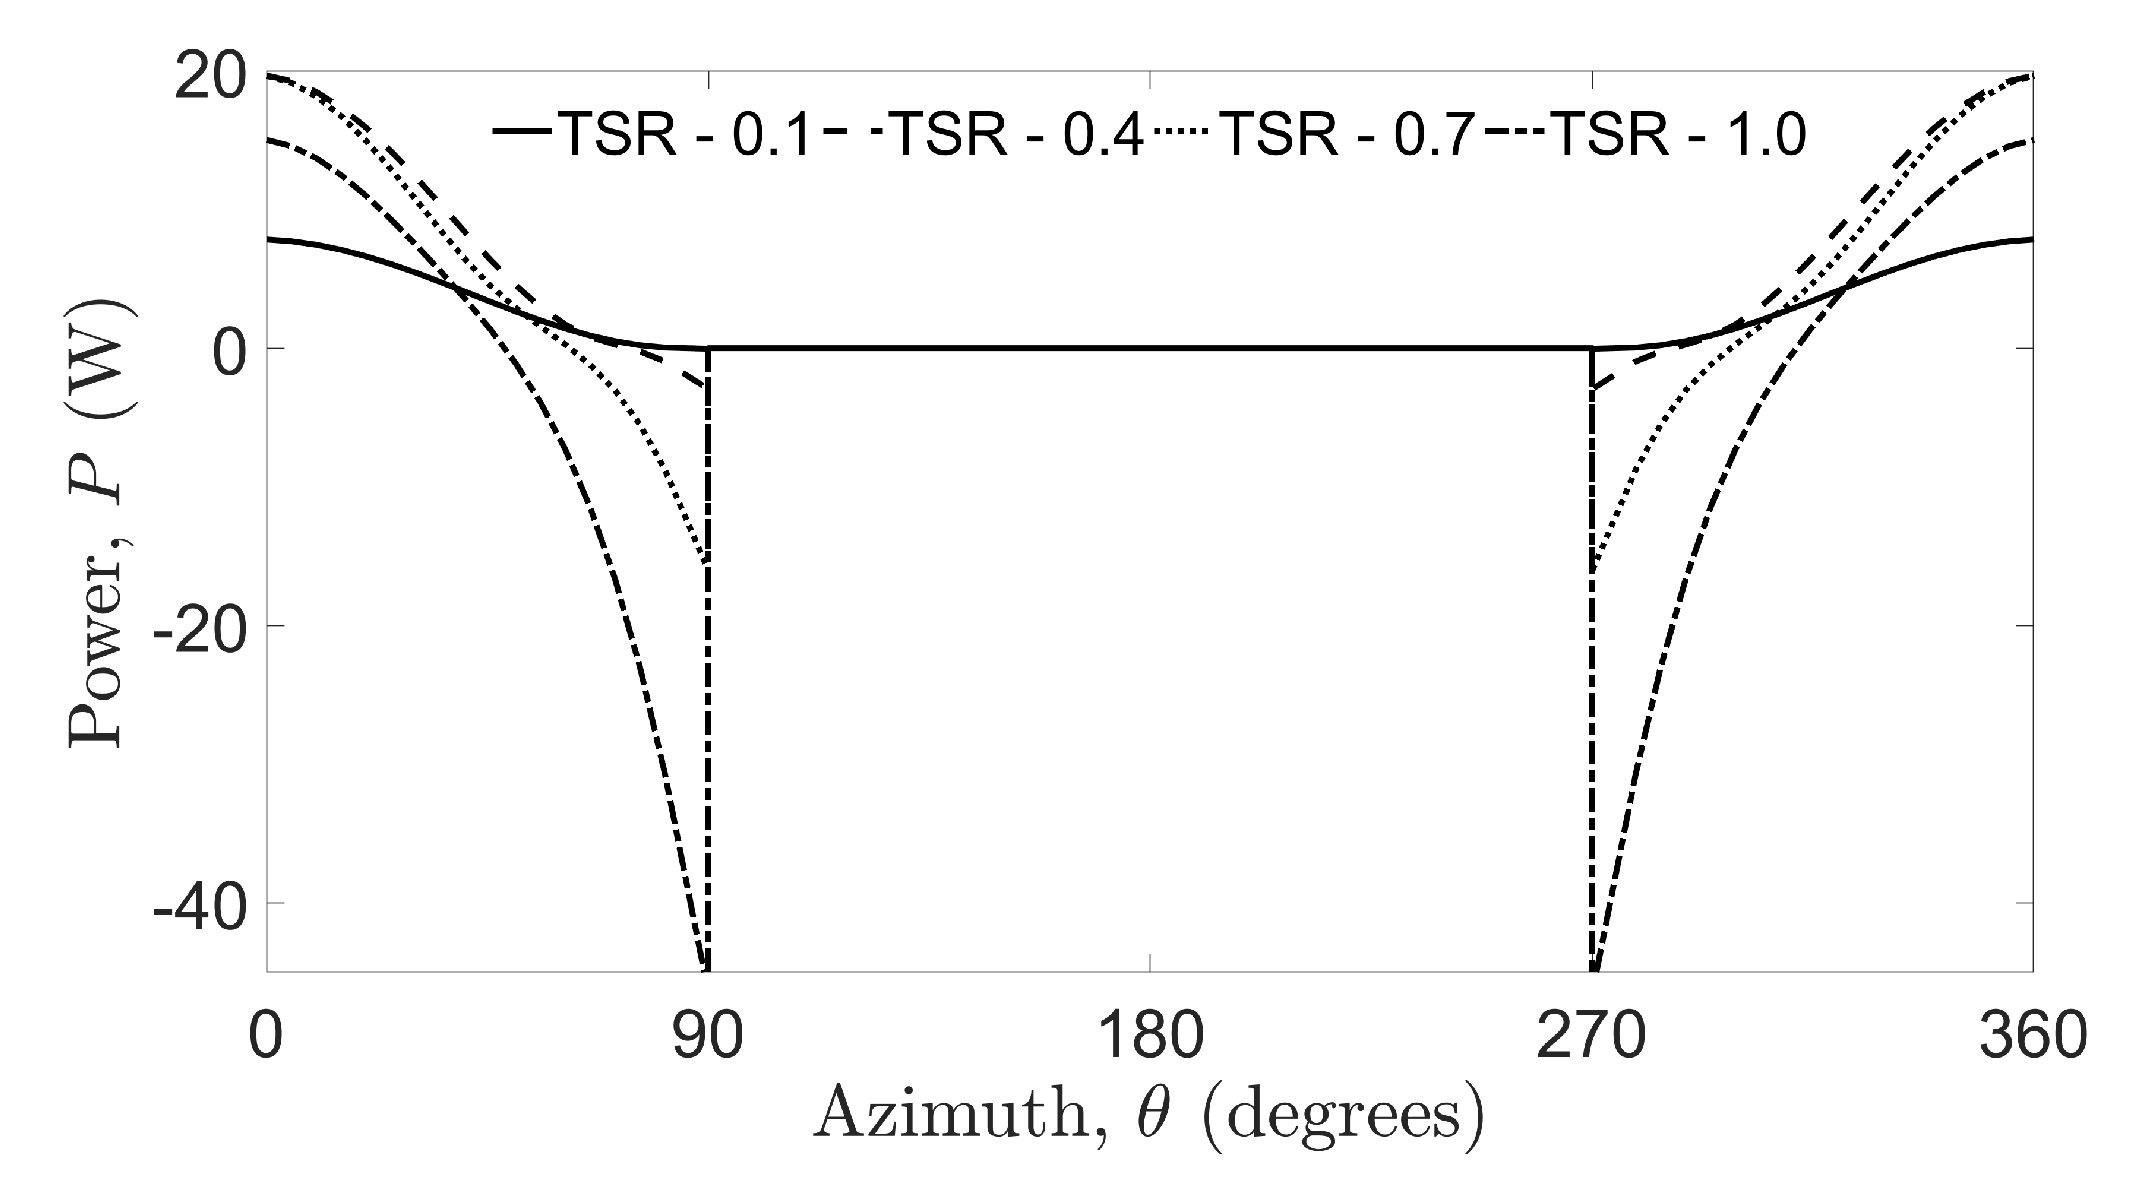
The performance of the developed cyclic pitch turbine can be maximized by using optimal values for tip speed ratio and active drive stroke angle . The instantaneous power output from a CPT blade, for , varied with the azimuth angle and tip speed ratio, as shown in Figure 12. The power output during the recovery stroke was zero, as modeled. During the drive stroke, the power output was positive, except near the recovery stroke (around and , depending on ). For these ranges of azimuth angles, the relative normal velocity component was negative (i.e., ), resulting in negative drag forces and power losses. To avoid these losses, the CPT design can be modified by making the blades passive for these angles in addition to the recovery stroke angles. For , this corresponds to a recovery stroke for and drive stroke for and . Another phenomenon of interest is the instantaneous change of power output from negative values to zero at and . This is a result of assuming that the blade tilting between strokes was instantaneous for simplicity in the theoretical analysis, but occurred gradually in a real prototype.
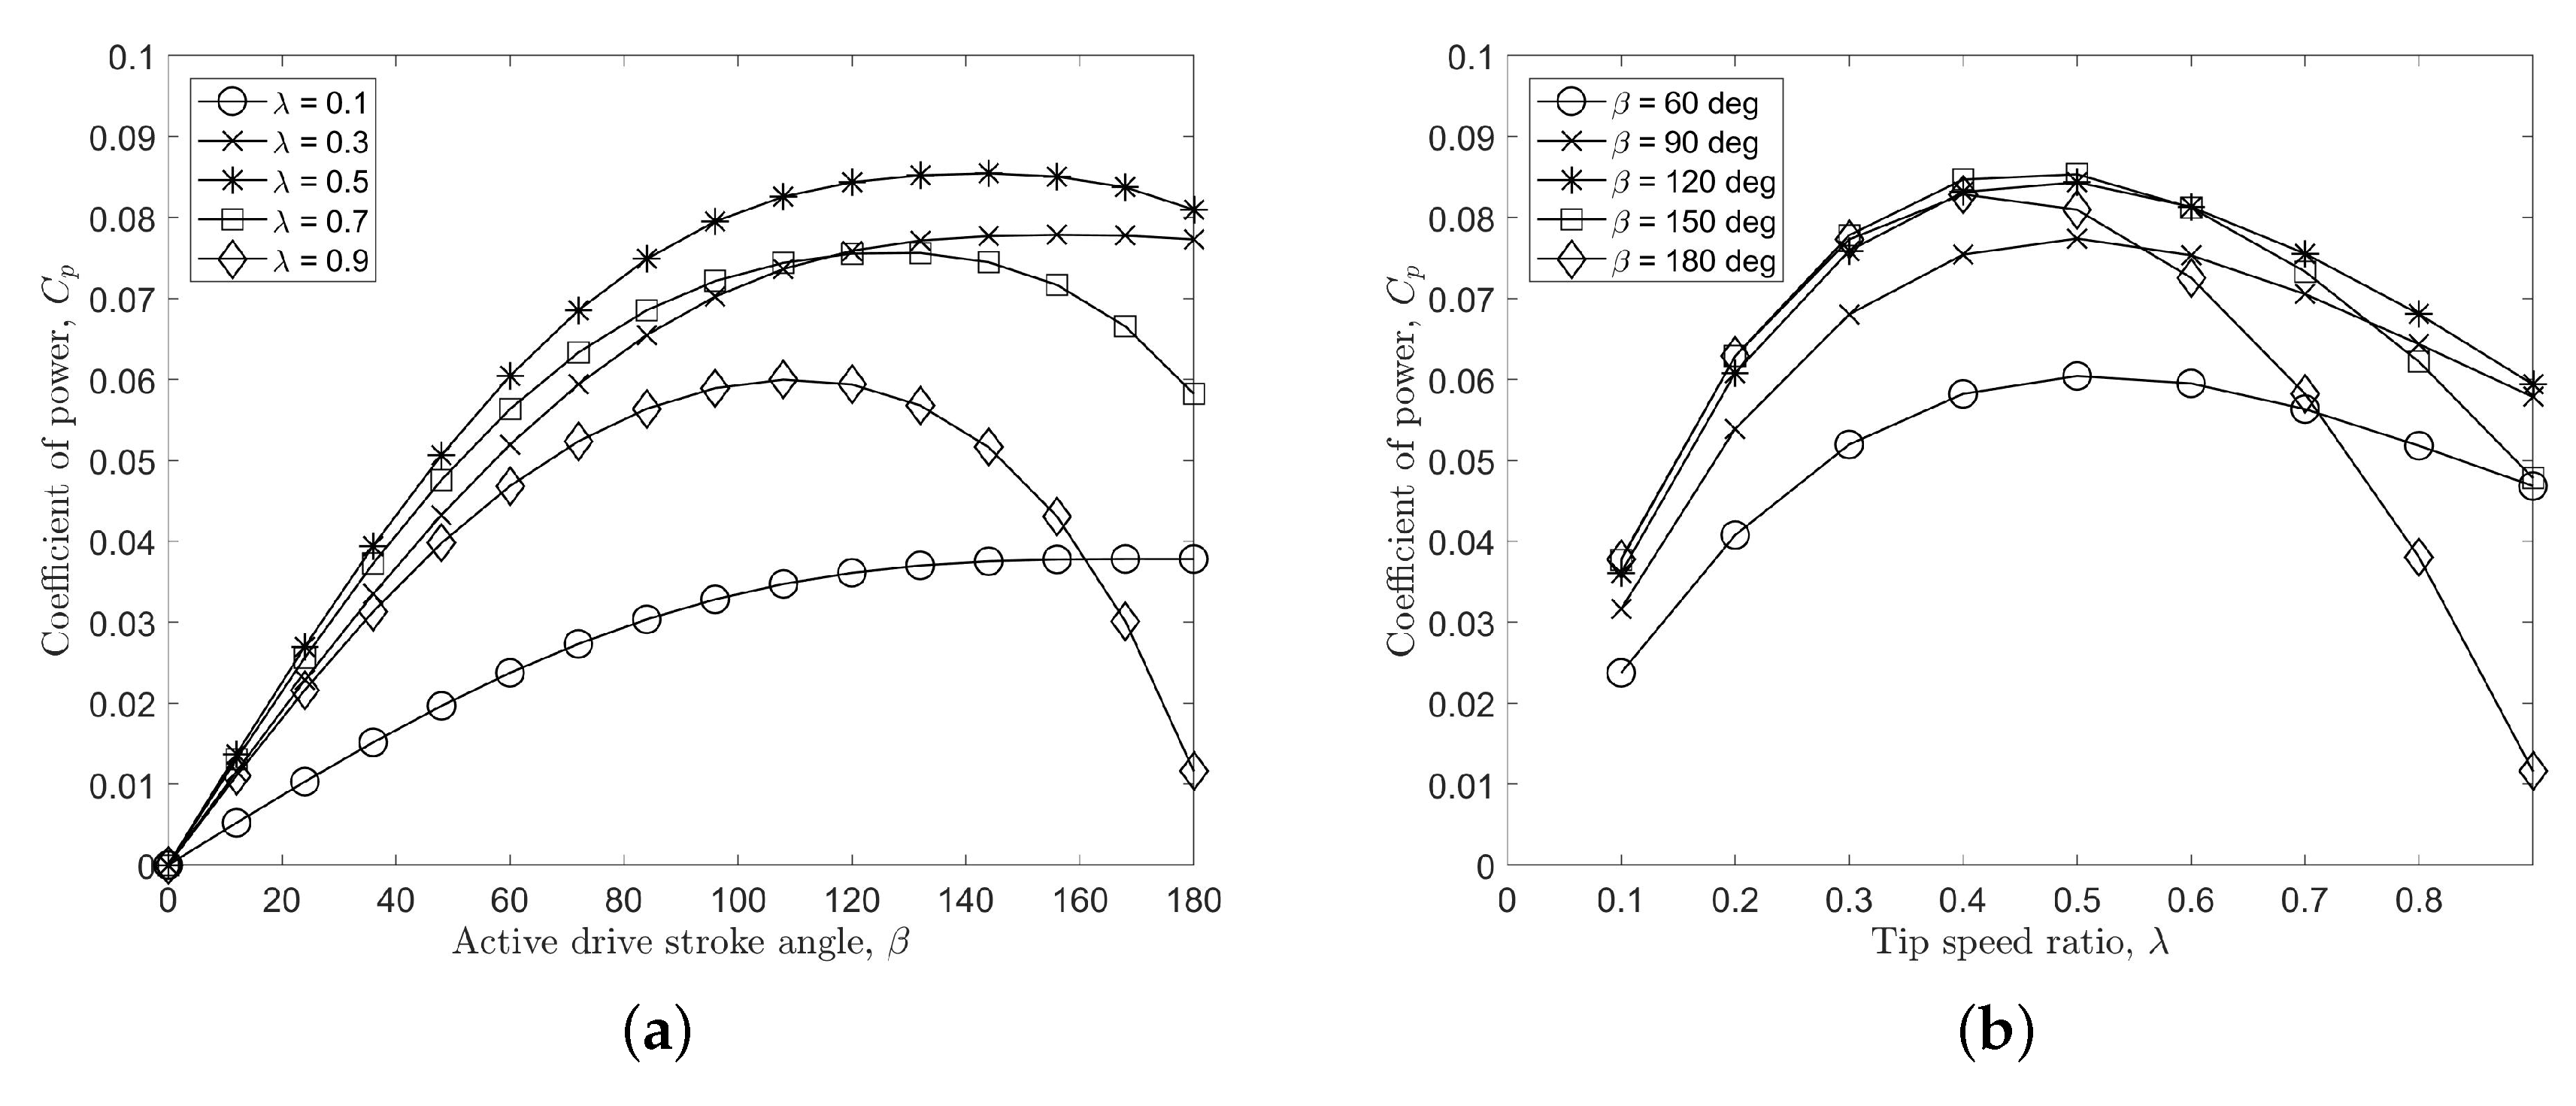
The effect of active drive stroke angle on the coefficient of power is depicted in Figure 13a for several tip speed ratio values ranging from 0.1–0.9. The figure shows that the CPT turbine performed very poorly for very small values of . For tip speed ratios like 0.5, 0.7, and 0.9, when the active drive stroke angle increased, increased to its peak value and decreased for a further increase in . Overall, appears to be the optimal value for . The effect of the tip speed ratio of CPT on the coefficient of power is indicated in Figure 13b. The plot shows values as the tip speed ratio changed from 0.1 to a value of 0.9 for several values of ranging from –. The figure shows that for all values of , was very low for very small tip speed ratios (), as well as very large tip speed ratios (). The coefficient of power was maximum, for values of , when ranged between 0.4 and 0.6. The most optimal value was observed at around 0.5, which is less than a value of one, typical of drag-based turbines including Savonius turbines [37,38].
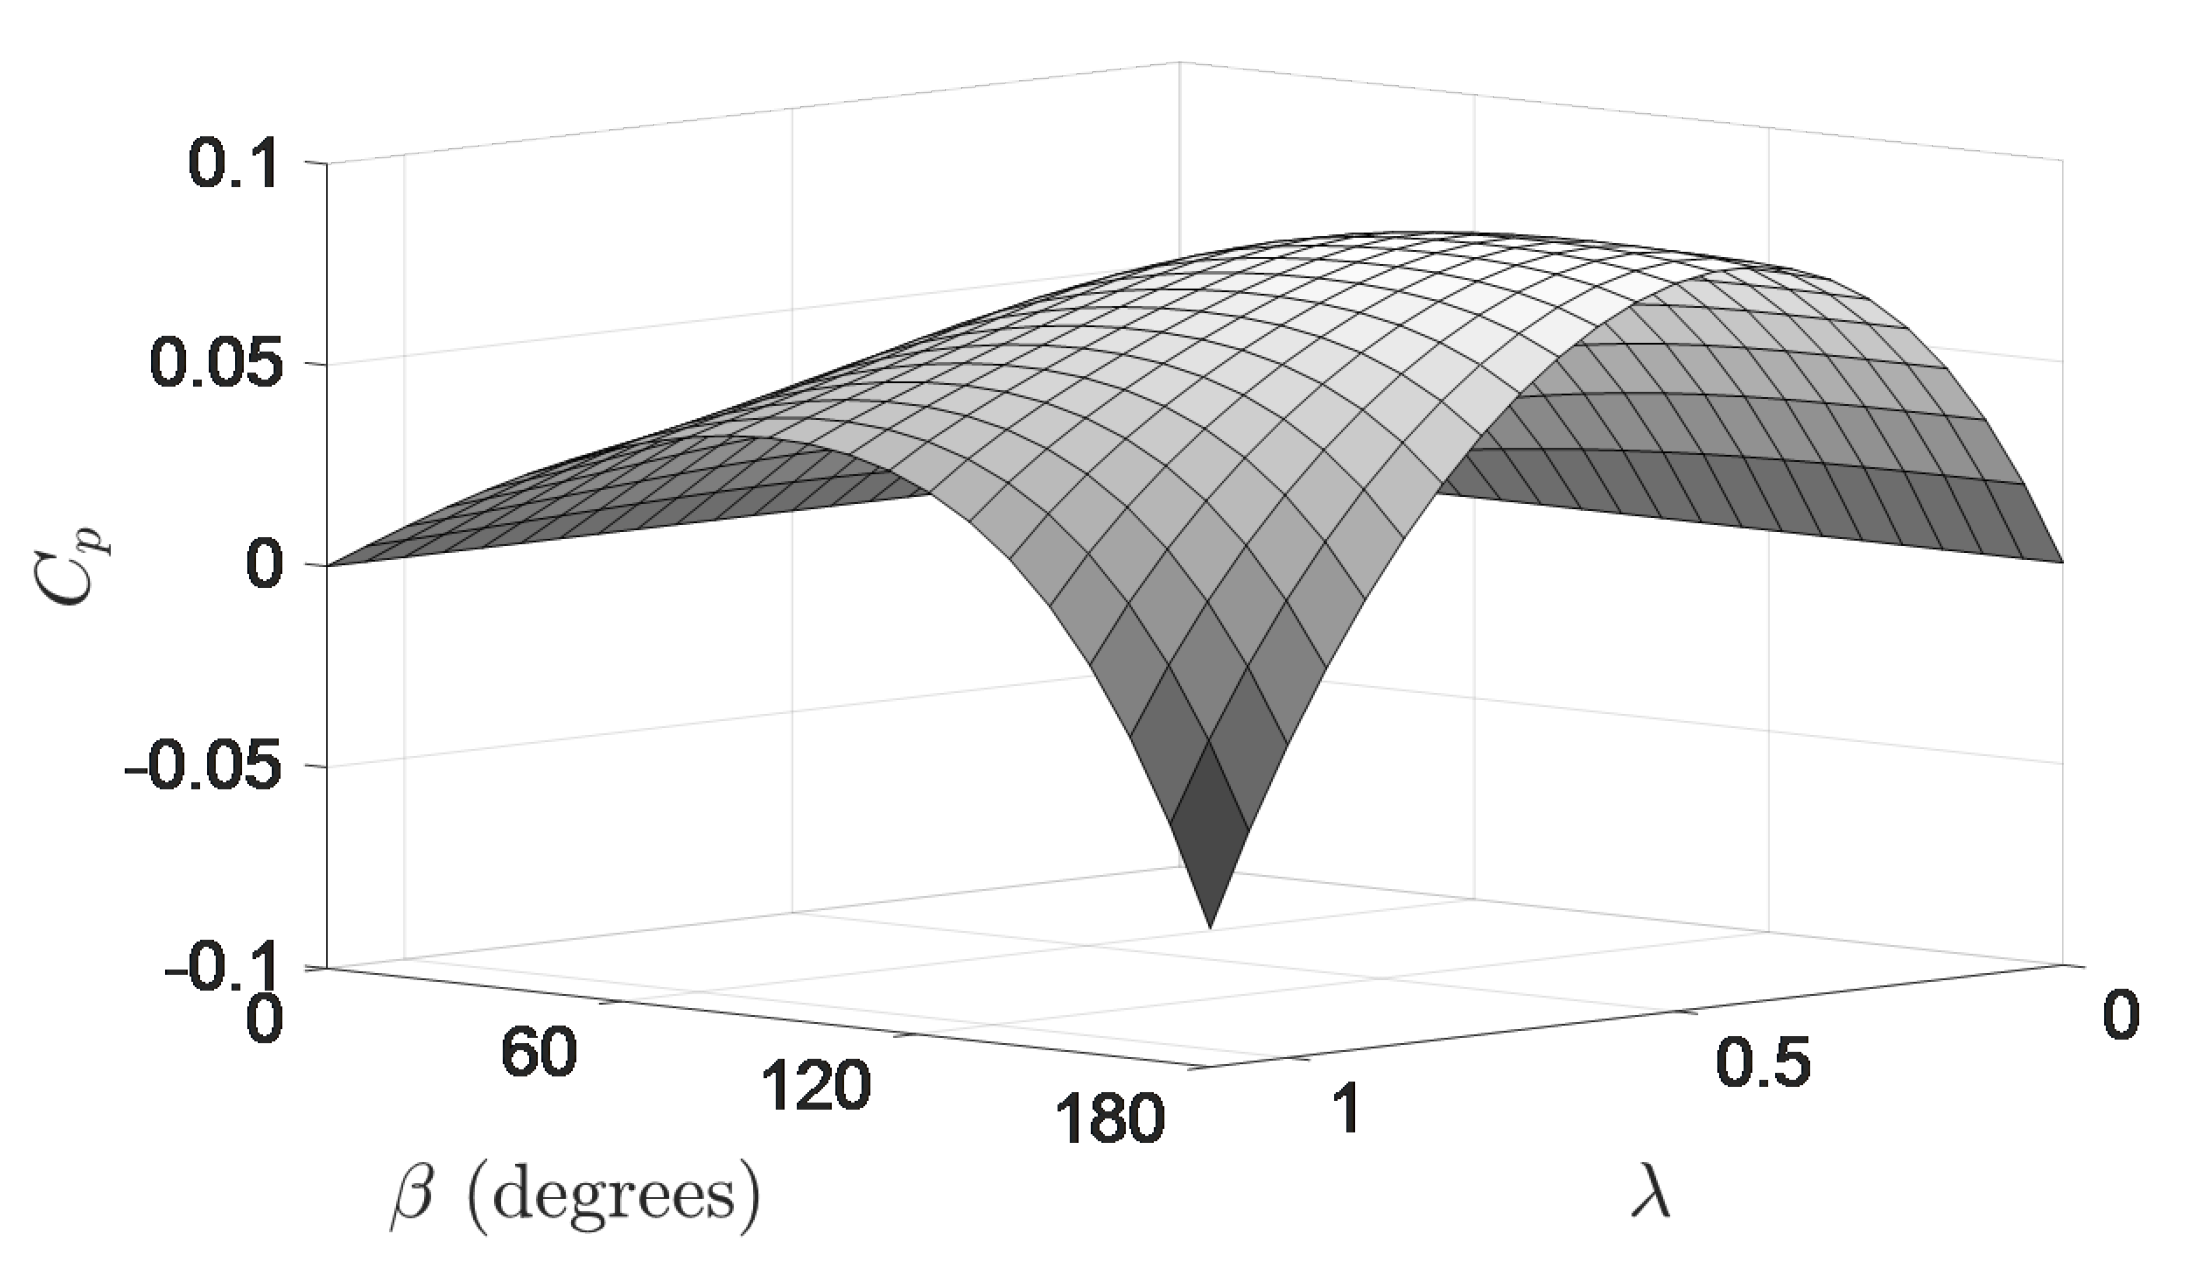
A contour plot for CPT coefficient of power is plotted as a function of the two parameters and simultaneously and is shown in Figure 14. It shows that peak CPT performance was observed for a configuration with and .
6. Experiments
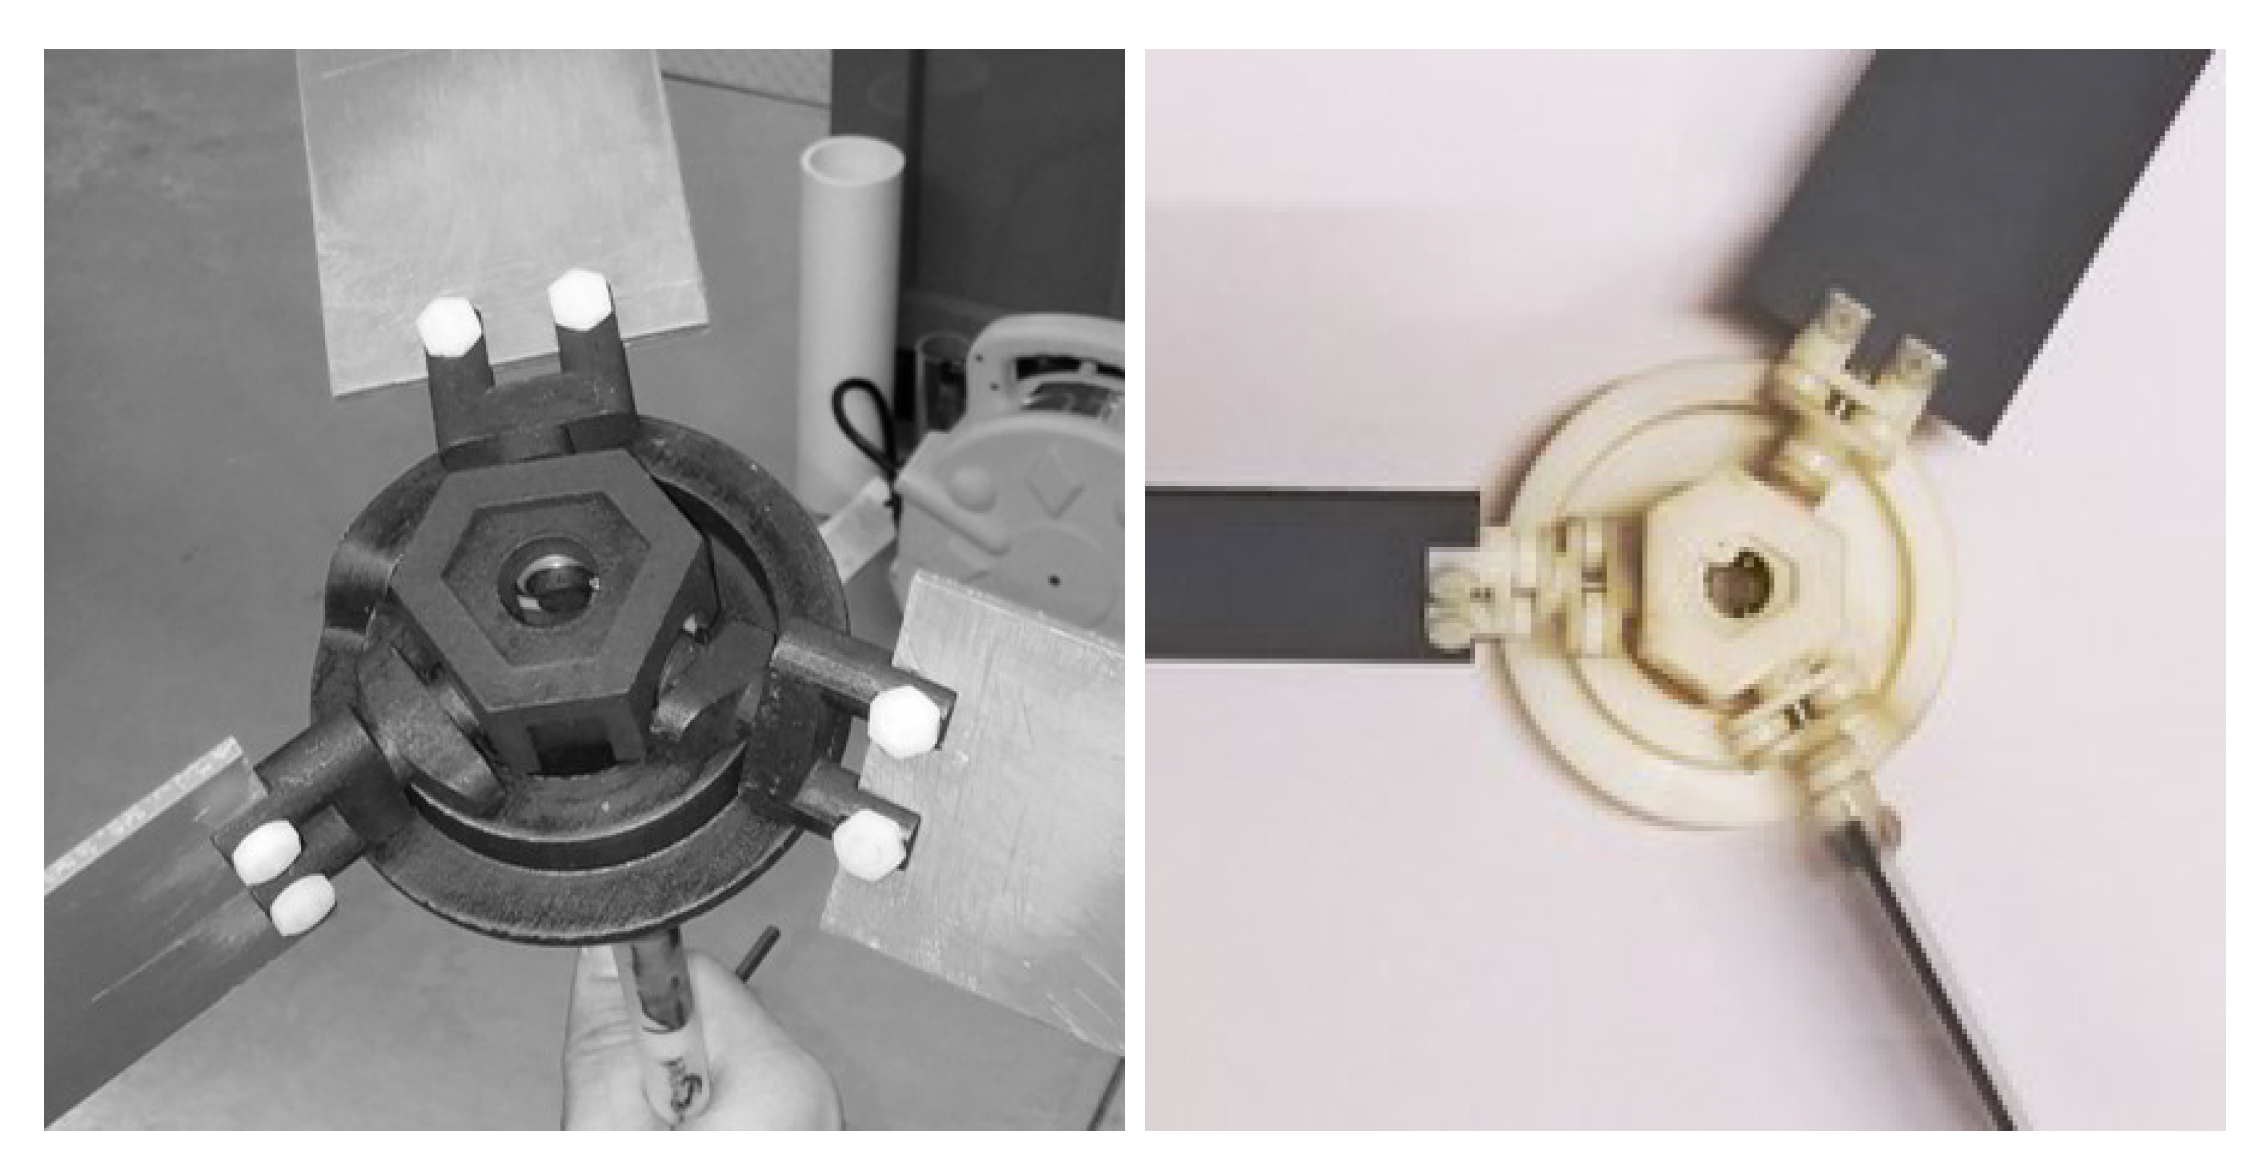
Experiments on CPT prototypes were conducted to prove the turbine concept and to validate the theoretical results. Experiments were conducted in a wind tunnel, as well as a water channel to measure various turbine parameters like average and instantaneous rotation speed, torque output, and power generation under different conditions of free stream velocity and loading. The prototypes were fabricated on 3D printers and conventional machines using plastic materials. For the first prototype, the drive and the recovery stroke were equally long, lasting each. For the second prototype, the duration of the drive stroke was reduced by making the drive stroke start at and end at azimuth. In addition, the second prototype also used ball bearings in its followers to reduce mechanism friction. Both prototypes indicated in Figure 15 had 3 blades and used simple rectangular flat plates of thickness 3 mm, width 60 mm, and length 160 mm, unless otherwise specified.
The cyclic pitch turbine prototypes were tested in a water channel to prove functionality and to quantify turbine performance. The water channel was of the recirculating type with a pump used to increase flow velocity up to a maximum of 0.4 m/s ( = 24,000). Two honey comb meshes were used to remove the turbulence from the fluid before going into a 0.56 m-wide test section where the turbine prototype was tested. Several parameters like average and instantaneous rotational speed and torque output were measured, from which torque and power coefficients were calculated. A similarly-scaled Savonius turbine, as well as airfoil cross-sectioned blades on a CPT turbine were also tested.
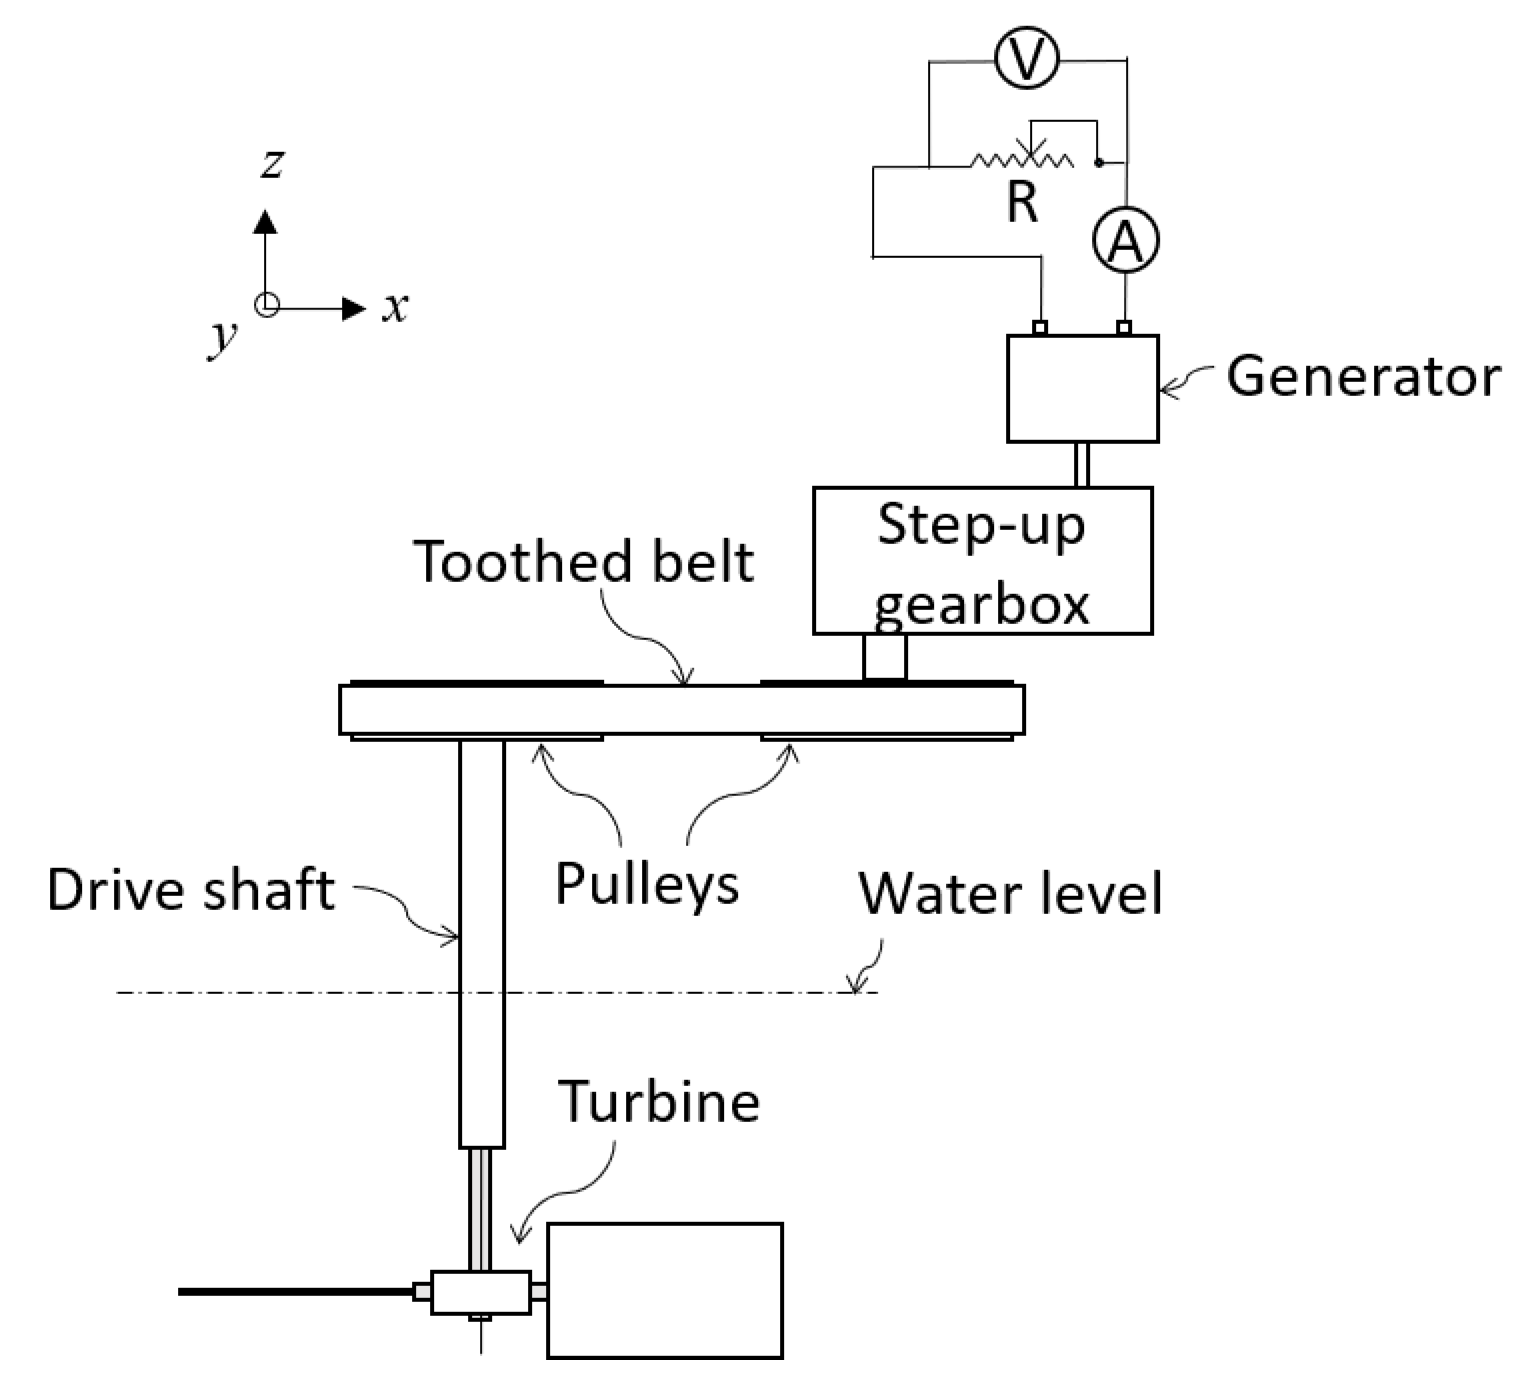
One of the first experimental setups used to test the concept and to determine power generation trends is shown in Figure 16, which includes an electric generator to apply adjustable load on the turbine using a rheostat. More sophisticated setups used further included a torque meter connected through a slip disk brake to measure torque in addition to a US Digital E5 rotary encoder to measure rotation speeds. The water in the water channel was filled up to a height of 0.6 m, resulting in a blockage [39] of about 8.5%. The flow velocity and load on the turbine using either the rheostat or the slip disk brake were varied to obtain different turbine operating conditions. Data were collected through a data acquisition system and recorded on a computer.
Experiments were also conducted in an open-return-type low-speed subsonic wind tunnel capable of up to 25 m/s wind speeds. The wind tunnel was a suction type with a length of about 8 m and a 3600 cm square test cross-section. From the wind tunnel experiments, turbine performance parameters like the coefficient of power and coefficient of torque were determined by measuring rotation speeds and torque outputs. Due to the lower density of air compared to water, larger flow velocities of up to 15 m/s ( = 61,000) were tested and higher rotation speeds were achieved.
The experimental setup involved the cyclic pitch turbine mounted on an acrylic cylindrical tower, which was mounted onto the wind tunnel’s base. A rotary encoder to measure turbine speed and a rope brake dynamometer [21,40,41] were assembled using a pulley of diameter D on the turbine’s drive shaft. Load cell reading S and dead weight load W connected using a nylon thread of diameter d, which looped over the pulley, helped in measuring torque T on the turbine shaft using Equation (21). Using the torque output and turbine rotational speed N from the rotary encoder, the power output P was determined using Equation (22). A hot wire anemometer was inserted into the wind tunnel in front of the turbine at the same level as the turbine to measure wind speed. The support structure, the cam mechanism, and a 160 × 60 mm blade led to a blockage of about 9%. The readings from the dynamometer, rotary encoder, and the anemometer were recorded and merged on a computer using an Arduino-based DAQ system.
Blades of different shapes and sizes were tested to determine the most optimal design for maximum power generation. The different blade shapes tested are listed in Table 1 with dimensions indicated in millimeters. The blade shapes include rectangular blades of different aspect ratios, trapezoids, “T”-shaped blades, etc. Blade area and blade length were kept constant where possible to have the same blockage and achieve similar tip speed ratios.
6.1. Results
Experiments conducted on the cyclic pitch turbine in the water channel and the wind tunnel show the proof of concept of the energy harvesting device, as well as validate the analytical model. The results give insight into the characteristics and trends of the turbine, as well as its performance under various flow and load conditions.
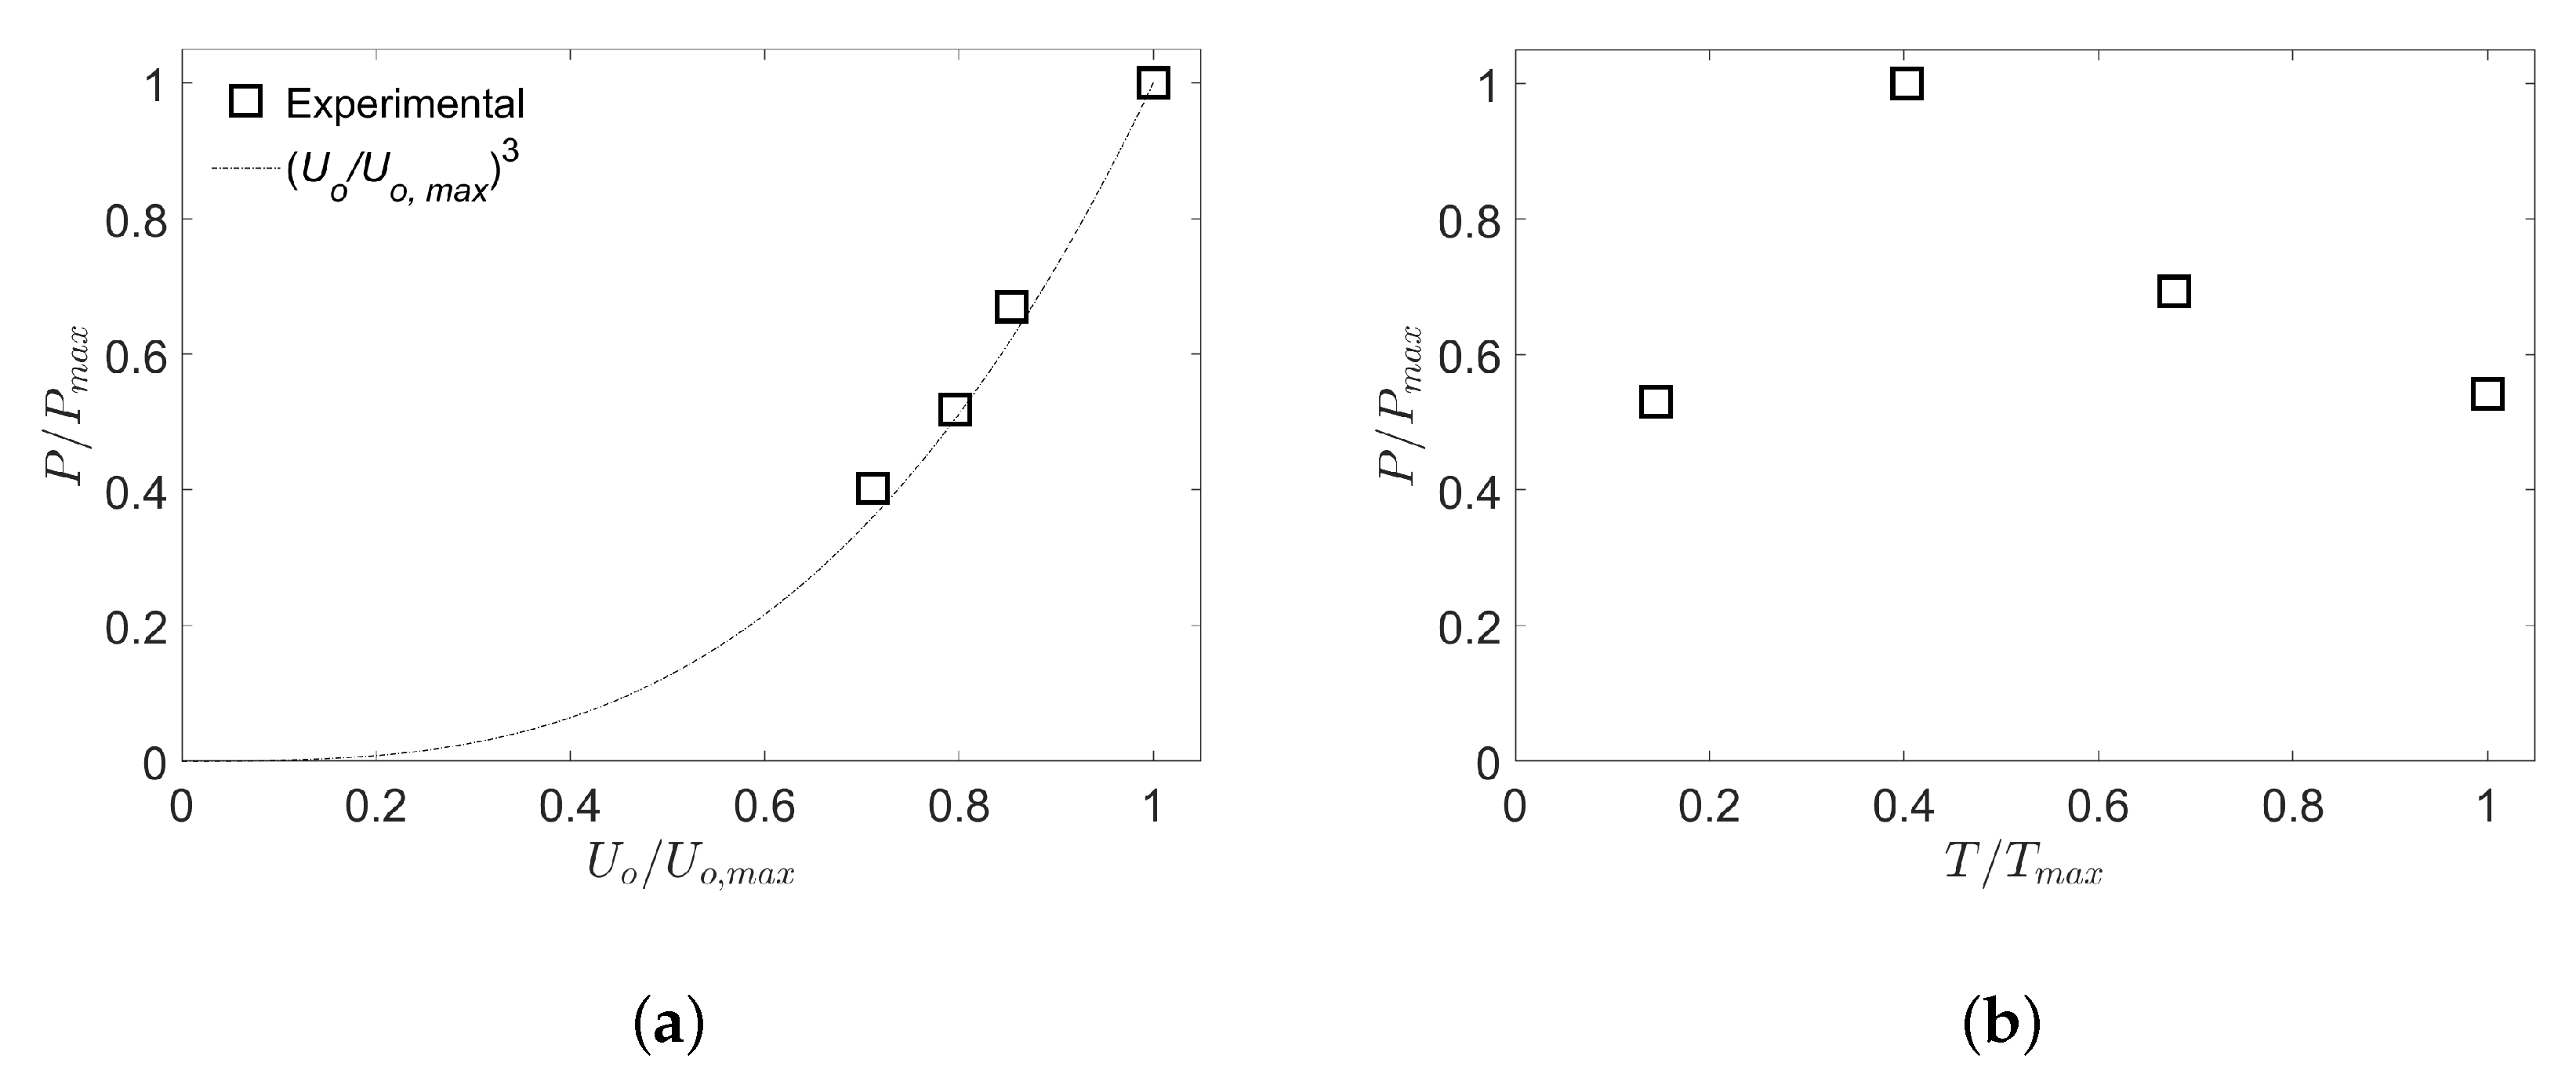
Proof of concept experiments conducted on the first prototype in the water tunnel show that the power output from CPT increased monotonously as the flow velocity u was increased from 0.17 m/s ( = 10,200) to a value m/s ( = 13,800), as shown in Figure 17. The energy in a fluid flow is proportional to the cubic power of the flow velocity and is indicated using a solid line. While fluid flow velocity was kept constant and loading on the turbine was varied, power output increased to a certain peak value and decreased for a further increase in loading, as shown in Figure 17b. Both plots indicate that the turbine power generation under varying flow velocities and loading resulted in trends typical of conventional wind turbines [42].
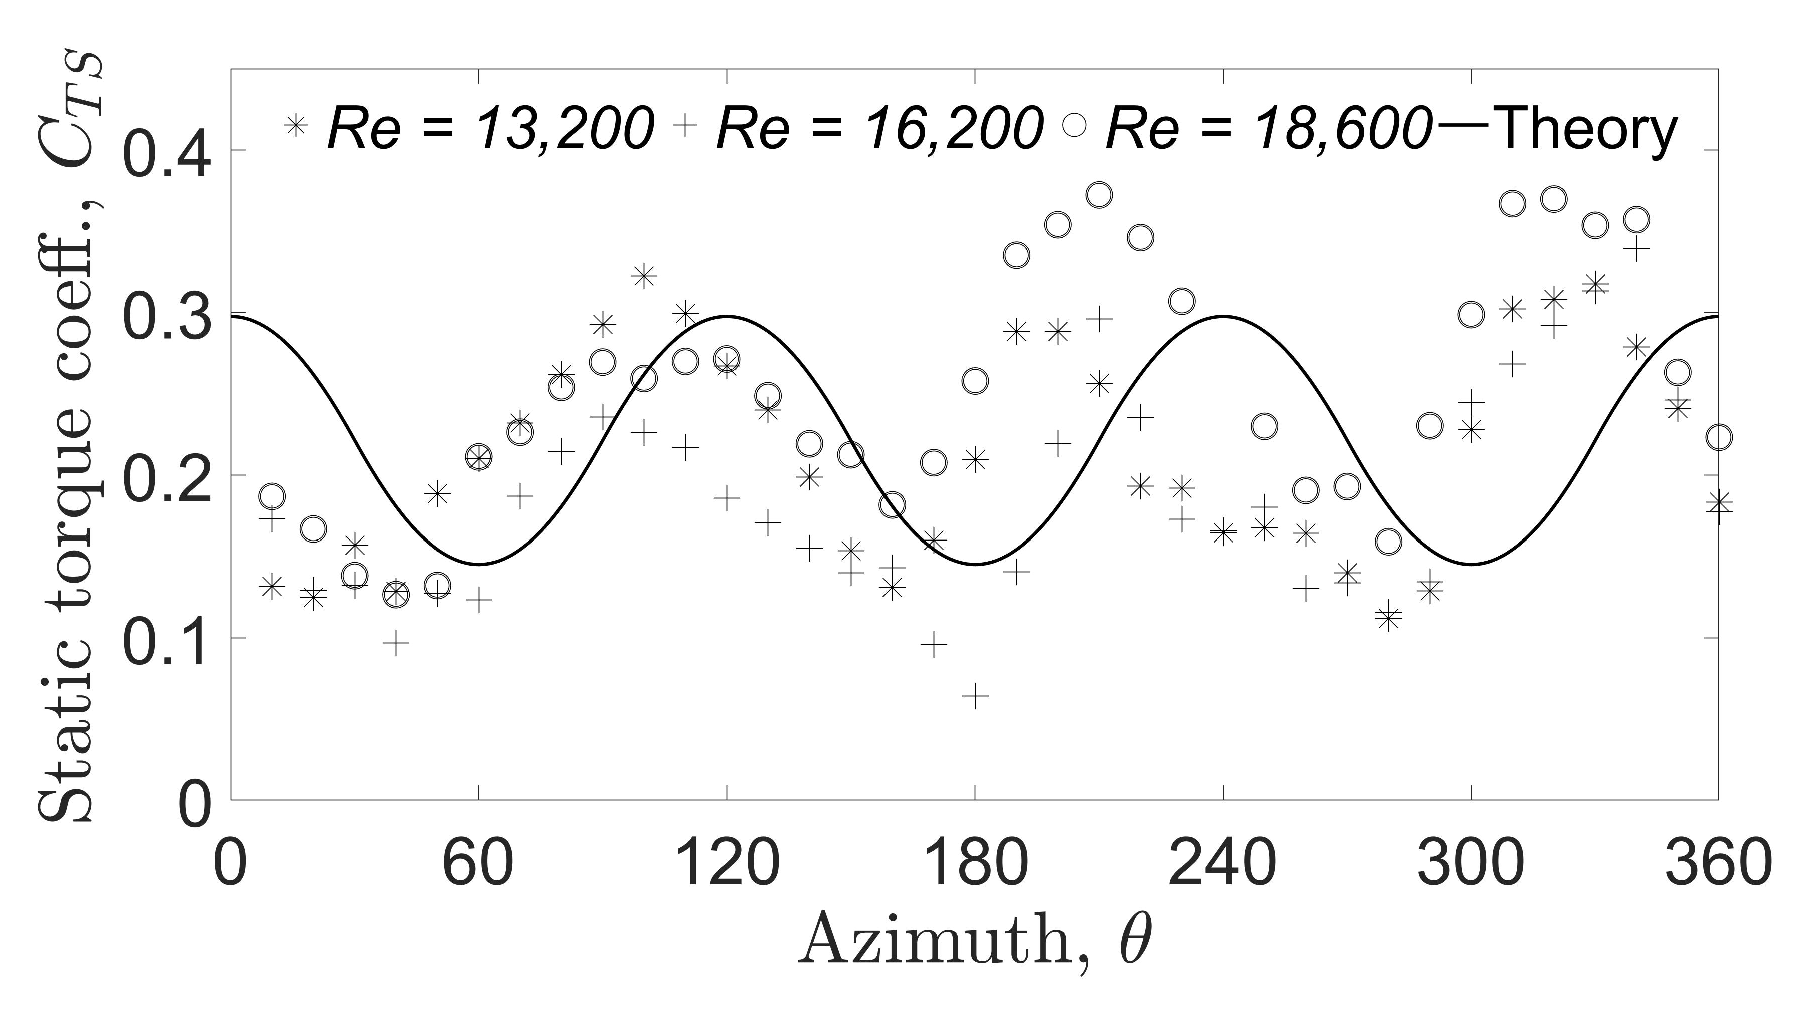
The static torque coefficient values were calculated from static torque measurements for the second prototype at three flow velocities ranging from 0.22 m/s–0.31 m/s, corresponding to Reynolds numbers of 13,200–18,600. The three experimental measurements of had similar magnitudes and shapes as that predicted by the developed theory and are shown in Figure 18. The three peaks and the three troughs were a consequence of having three blades and are typical of drag-based turbines [35]. The theoretical peak values were observed when one of the three blades was at azimuth, the location at which a blade experiences maximum drag force [43]. The peak values in the experimental measurements occurred at about 20–30 degrees before that predicted by the theory. This deviation was a result of the existence of the hub in the prototype design. When a blade was at azimuth angles ahead of , the hub obstructed the fluid from flowing off the blades surfaces towards the turbine center and created a larger pressure force than otherwise expected. This resulted in the three experimental peaks in the plot to exist slightly ahead of the theoretical peaks. The troughs were offset from the peaks by and were located in between any two peaks. Furthermore, the magnitude of was positive for all azimuth angles, indicating that the turbine is always self-starting.
The instantaneous rotation rate is depicted for prototype 2 in Figure 19, which shows the cyclic variations in turbine speed observed in water channel experiments. The trend resembles the plot shown in Figure 18 with three peaks and three troughs located at the same azimuth angles. The variation in rotation speeds was due to the constant torque load input on the turbine and sinusoidal blade forces at different azimuth locations of a rotation cycle. When the free stream velocity was increased from 0.22 m/s ( = 13,200) to 0.31 m/s ( = 18,600), the instantaneous, as well as the mean rotation speeds increased. Higher mean rotation speeds were observed for turbine operation in air, and the resulting higher momentum absorbed and diminished such instantaneous rotary speed variations. These variations can also be eliminated by using multiple arrays of the turbine on top of each other at appropriate azimuth offsets to have a smoother power generation.
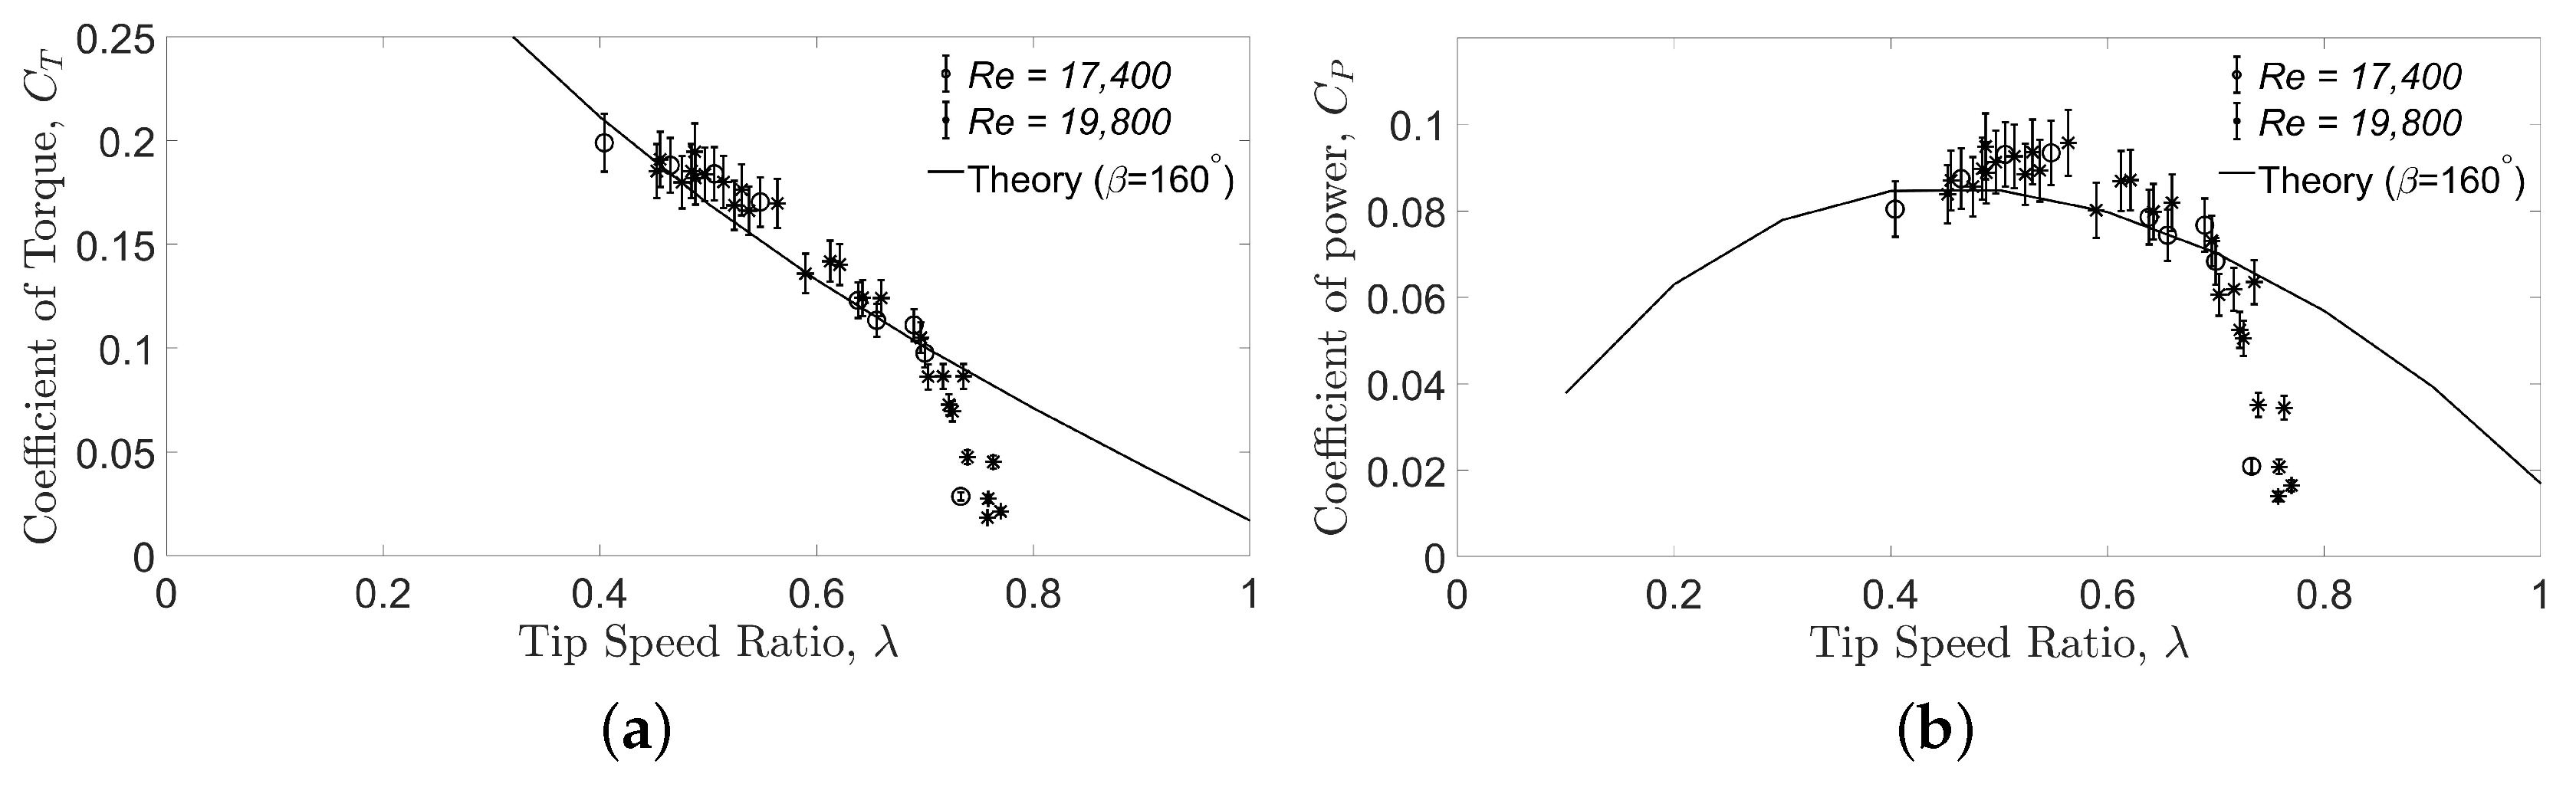
The coefficient of dynamic torque and coefficient of power were measured for the CPT turbine and compared to the results from the theoretical model. Figure 20a,b shows the experimental torque and power coefficient values for two free stream velocities m/s ( = 17,400) and m/s ( = 19,800) and theoretical values for an active drive stroke angle of . The experimental measurements aligned very well with the theoretical values calculated for most of the optimal tip speed ratios. The coefficient of torque values gradually reduced with an increase in tip speed ratio, as expected, since torque and speed are inversely related. A maximum value of about was observed in the experimental results close to a tip speed ratio of about 0.5. The experimental and theoretical power coefficient values had similar maximum magnitudes, and the peaks were observed around the same tip speed ratio. At higher tip speed ratios, increased mechanism friction and pitching losses, not considered in the mathematical model, resulted in lower than predicted values.
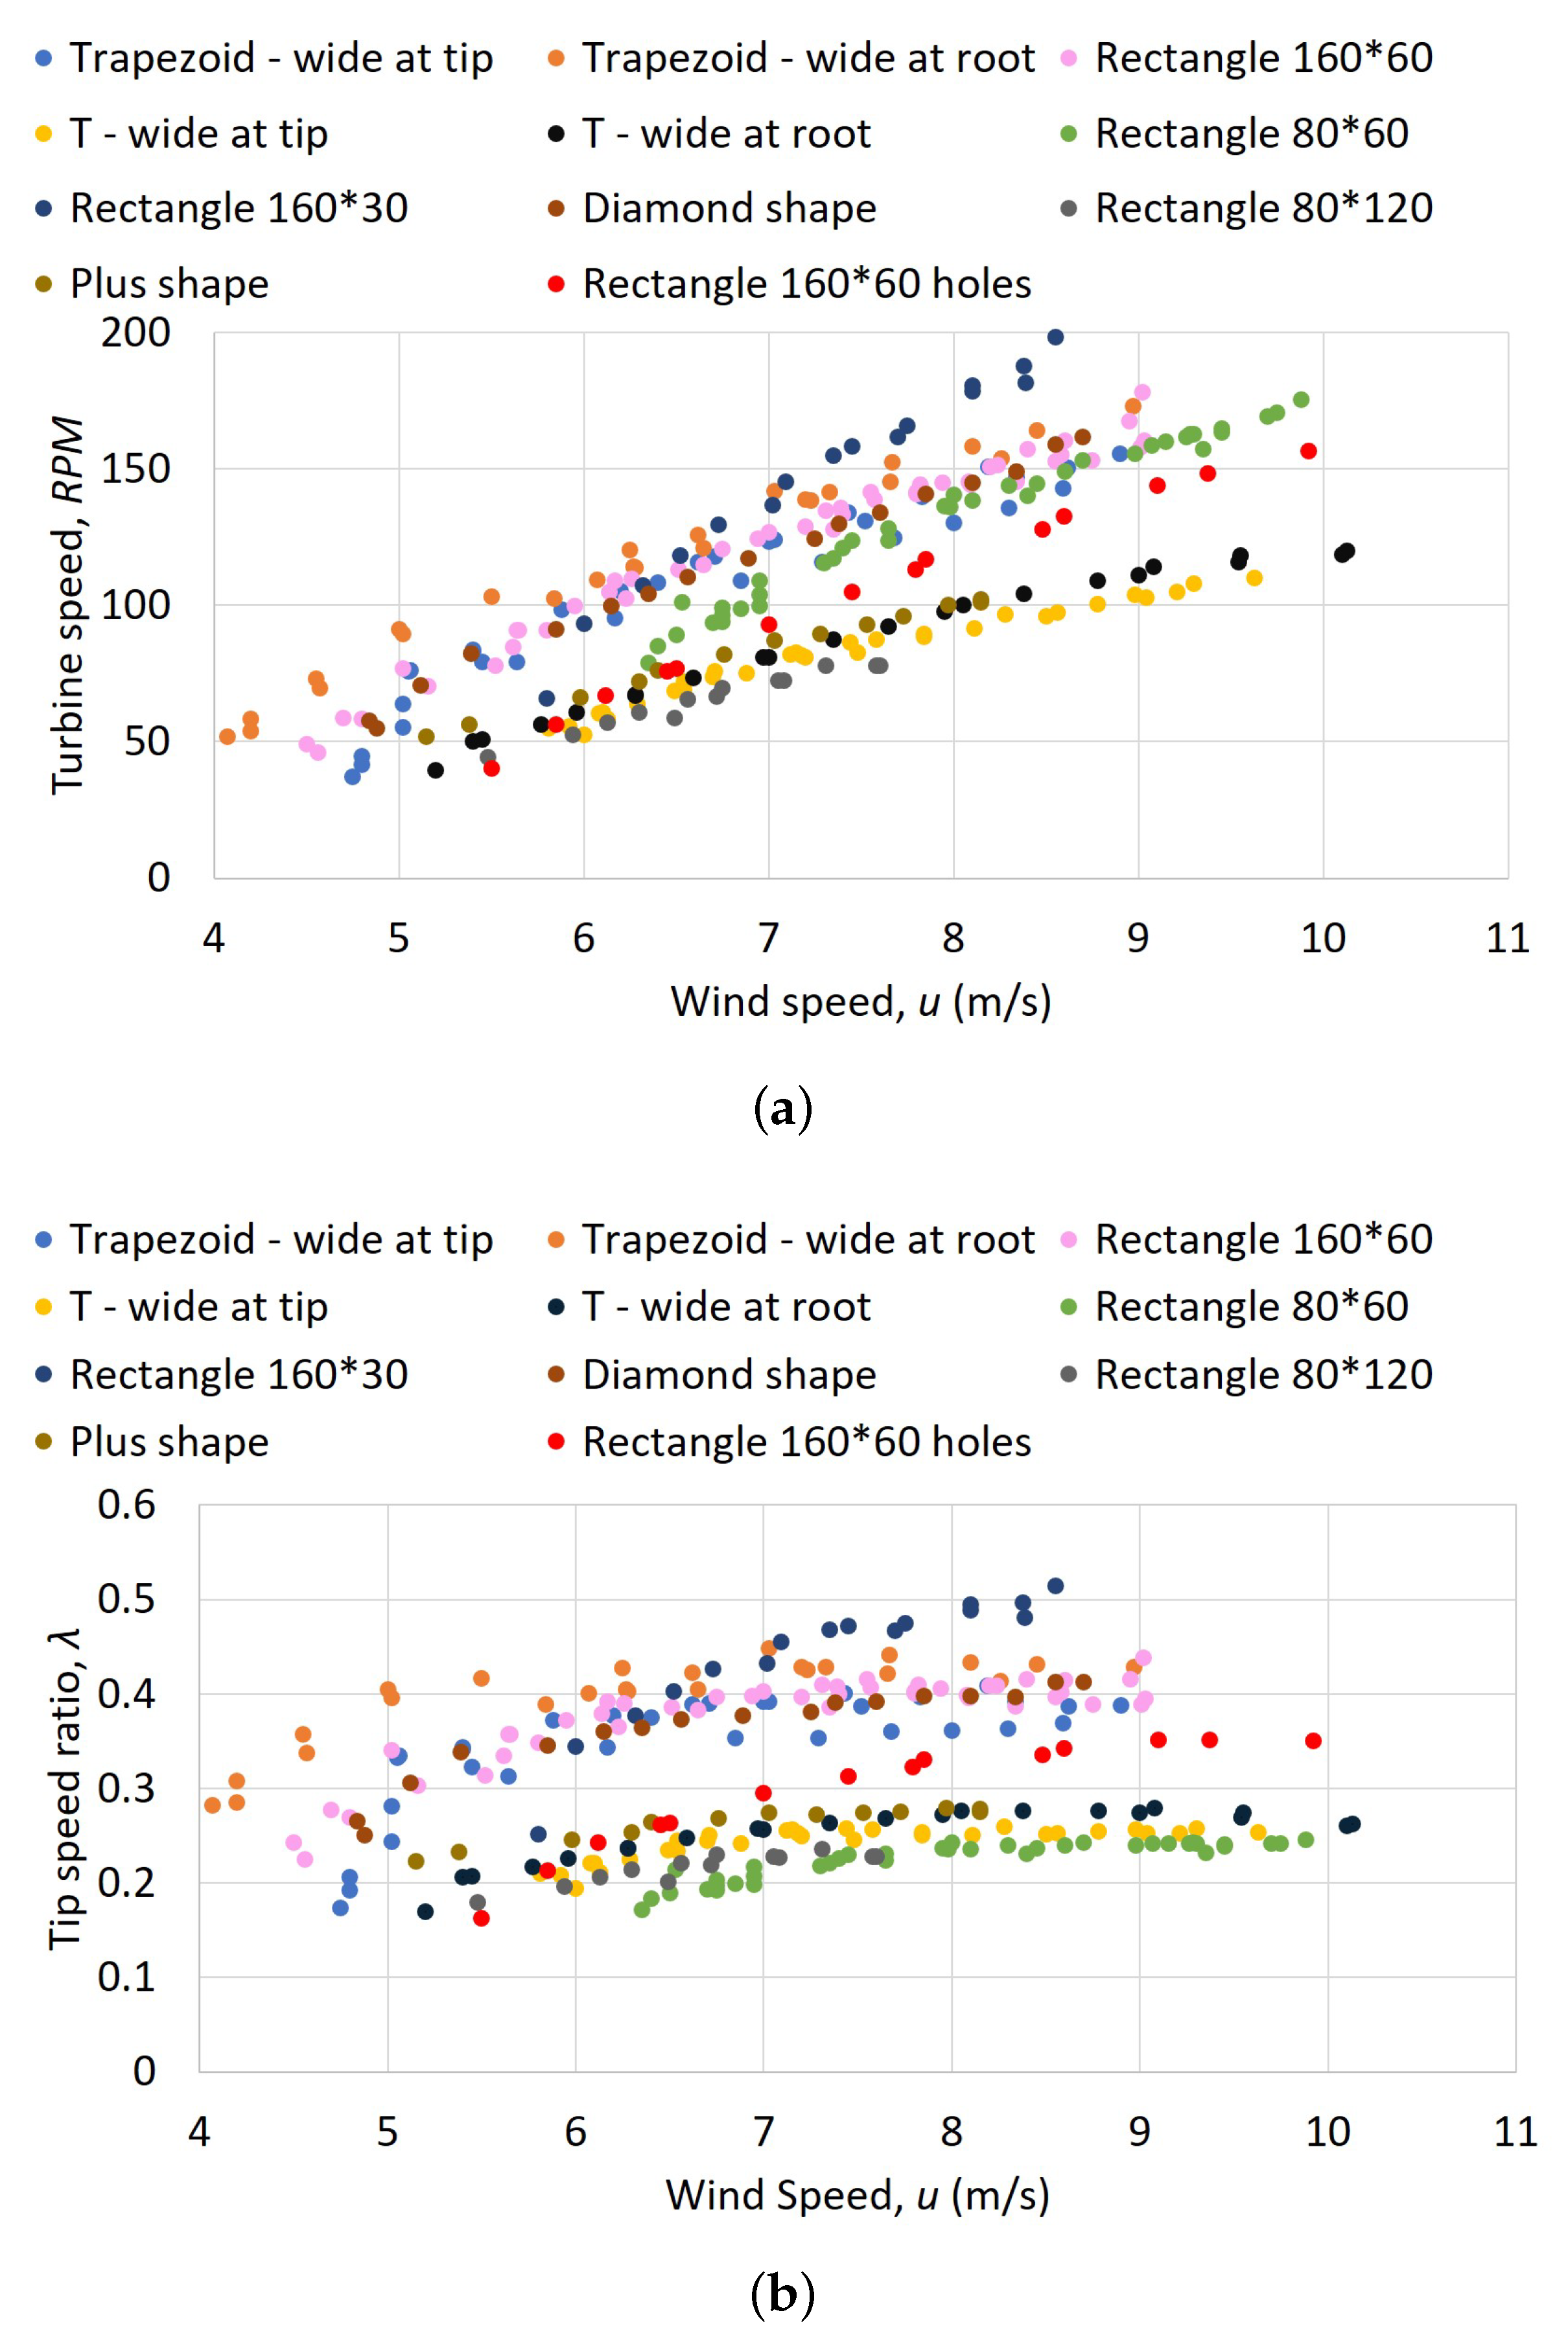
Several blade shapes indicated in Table 1 were tested in the wind tunnel to determine the best shape and dimension for optimal power generation. No-load rotational speed and tip speed ratio values, which are very repeatable and reliable, were measured, as indicated in Figure 21, for wind speeds from 4 m/s ( = 16,200) to about 10 m/s ( = 40,500). The mechanism friction acts as loading on the turbine, and hence, higher turbine speed indicates higher power output and performance of the turbine for a fixed blade area. The mm blades with the highest aspect ratio rotated the fastest, indicating that long and narrow blades perform better compared to shorter mm blades, as well as the mm blades. Comparing the two trapezoid-shaped blades and the diamond-shaped blades, it can be observed that the trapezoid with the wider side at the root and narrow side at the tip rotated faster, produced more power, and performed the best among all blades at lower wind speeds.
Comparing the results from testing “T”, “plus”, and inverse “T”-shaped blades shows that “T”-shaped blades with the wider side at the root performed slightly better than the rest. Overall, these 3 blade shapes performed poorly due to more blade area present far away from the blade pitching axis, causing them to have more losses during pitching motion, which was the most pronounced in the “T”-shaped blade with more area towards the tip. Rectangular blades with half the length and twice the width, i.e., four times the aspect ratio of the regular mm blades, performed the worst out of all the blades tested. Tip speed ratios for these tests are indicated in Figure 21b, which shows that a maximum value of was achieved for the long and narrow mm blades, and the rest of the blades fell around 0.4 or lower. The lowest tip speed ratio at wind velocity 10 m/s ( = 40,500) was about 0.25 for the rectangular blade that was half the length of the other blades.
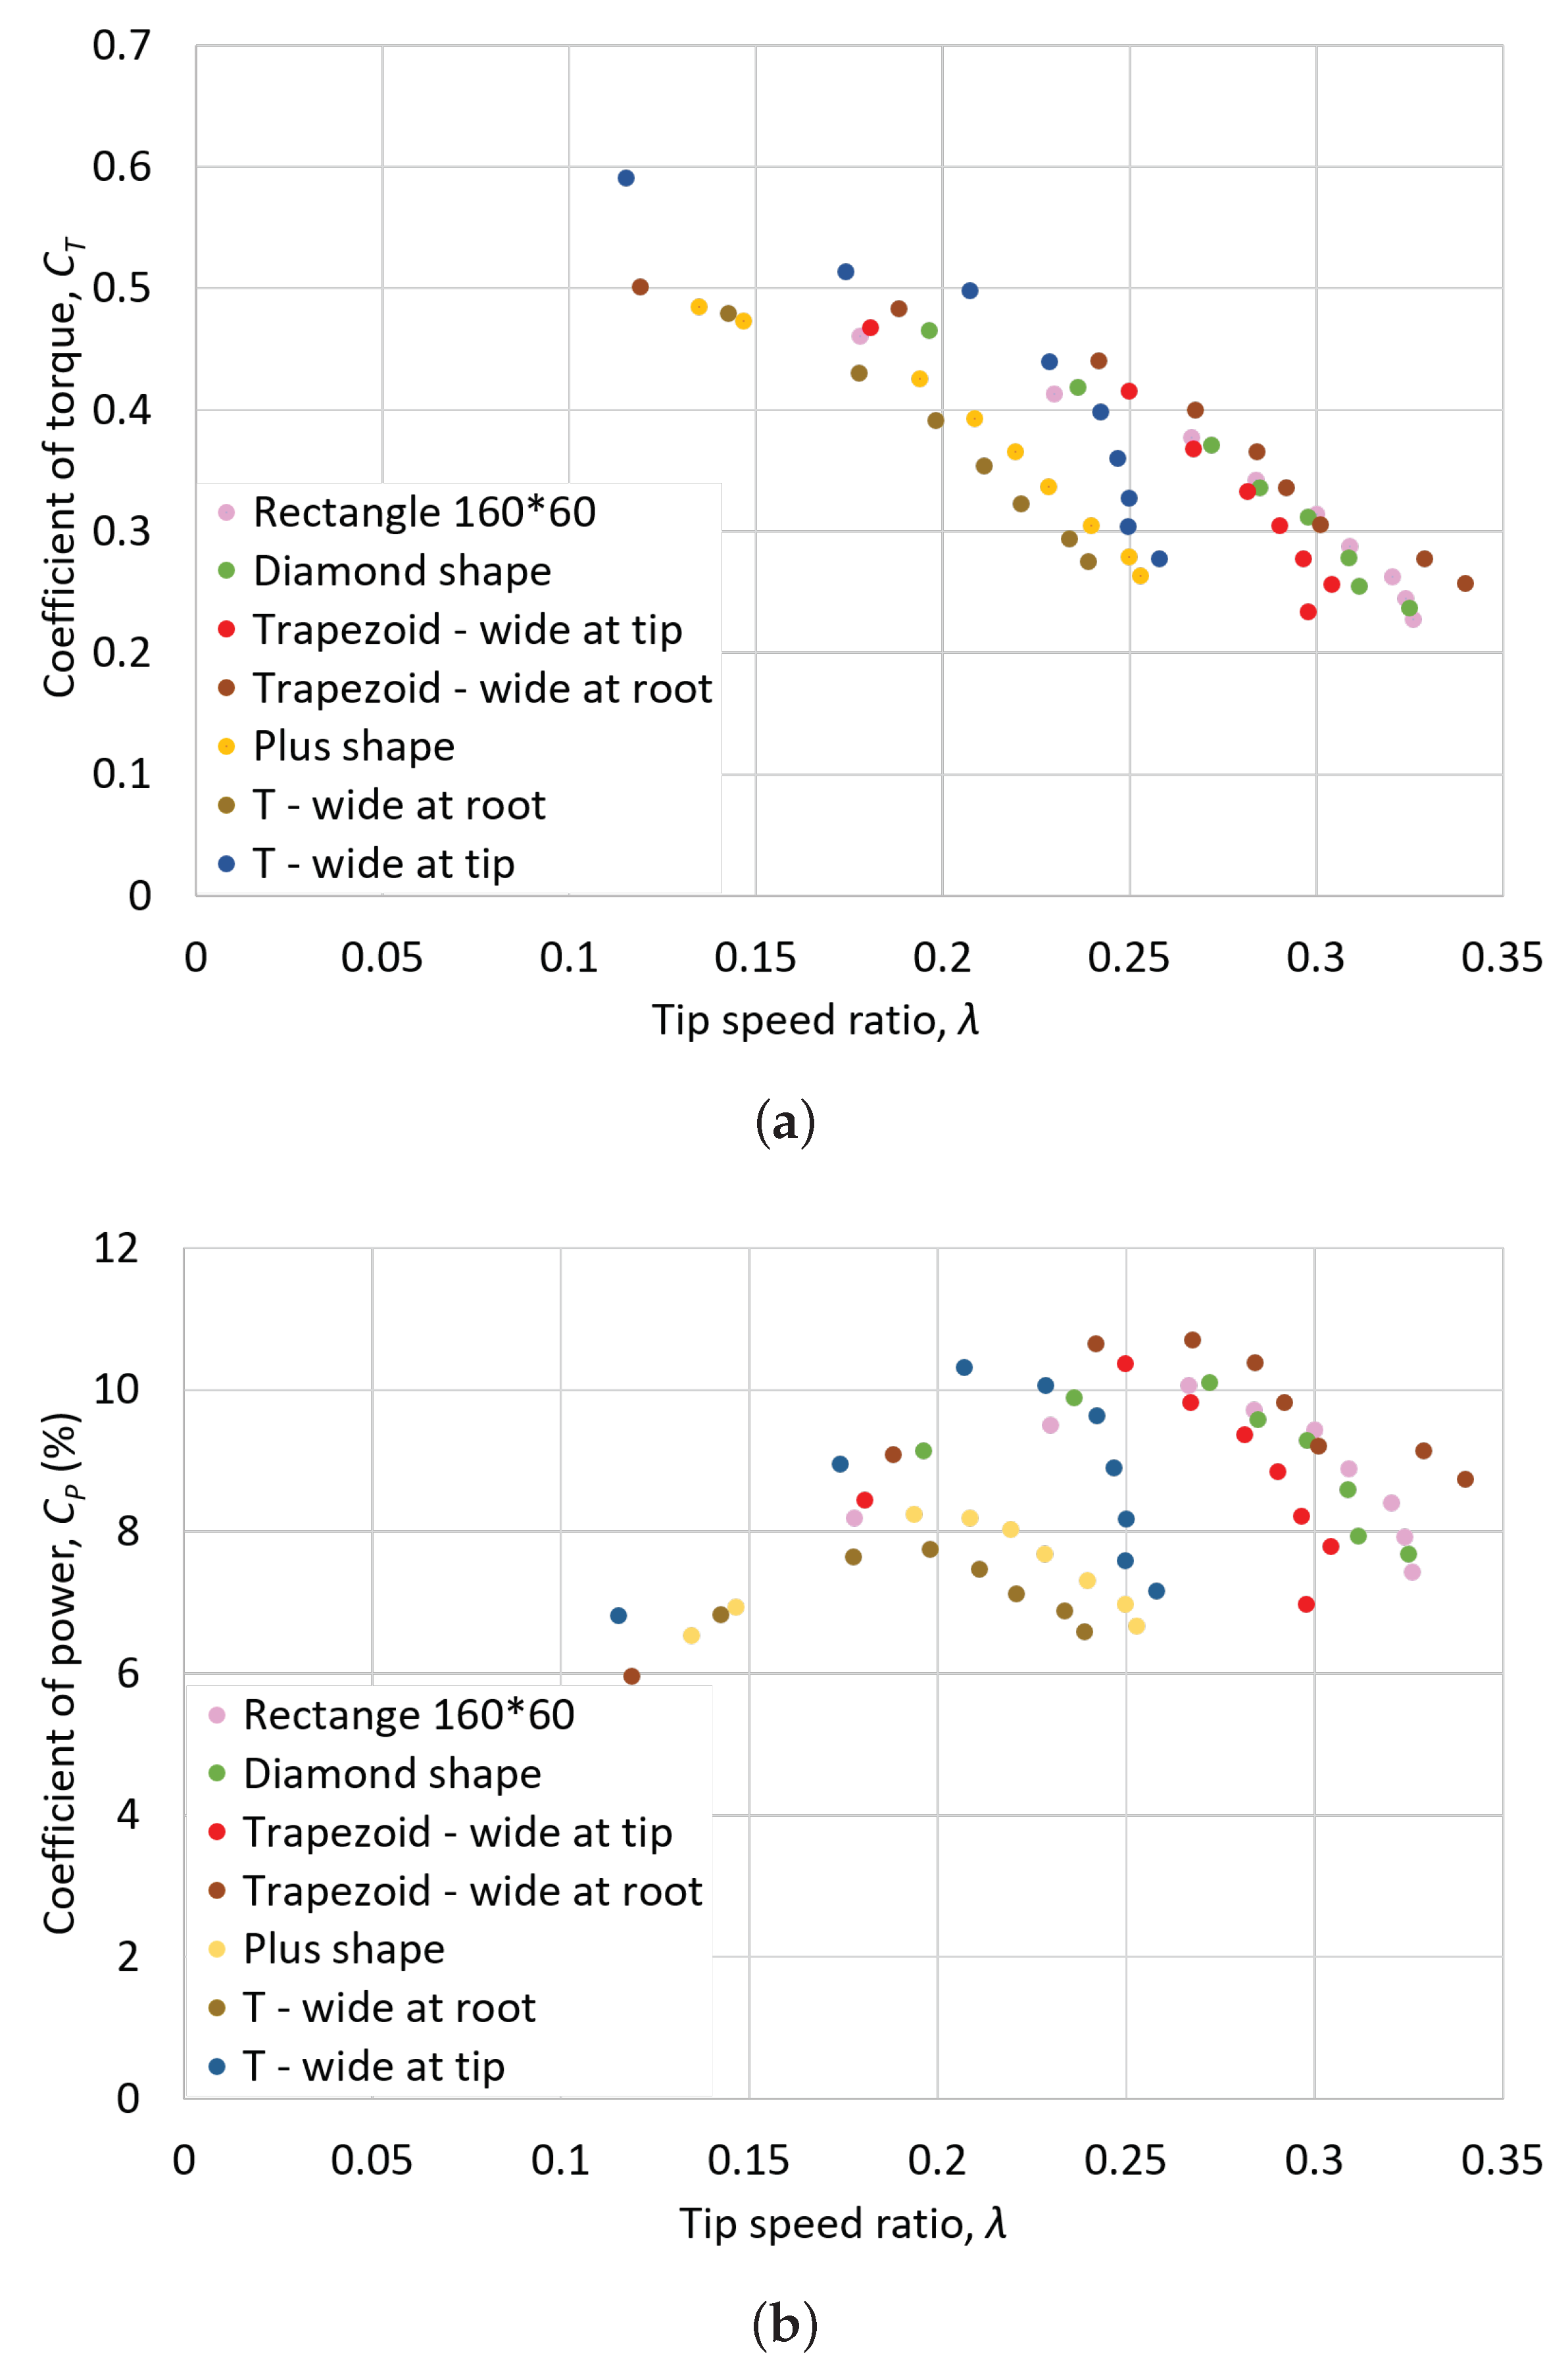
The coefficients of torque and power were measured for several blade shapes having the same blade length and blade area by increasing wind speed while having the same turbine load. The results are plotted in Figure 22a,b for rectangle, diamond, trapezoidal, “plus” and “T”-shaped blades. For the rectangular blade, the torque coefficient values followed the same trend seen in water channel testing, and while the magnitude and shape of the curve still matched very closely with the predicted values and water channel values, they shifted slightly to the left, which could be due to higher friction and pitching losses at higher rotational speeds.
All the tested blade shapes generated the same and trend as that of a rectangular blade. The lowest torque and power performance was observed for “T”-shaped blades with the wider part at the root of the turbine, since most of the blade area was close to the root, which did not generate large torque due to the lower arm length. The highest coefficient of torque and power values for most of the tip speed ratios was observed for the trapezoid blades with the wider part towards the root of the blade, which is consistent with the free rotational speed measurements indicated in Figure 21. The rectangular mm blades were observed to be the second most efficient blades out of the tested blade shapes. The results for intermediate shapes like the “plus”-shape and diamond-shape fell in between their respective extreme shapes like the “T”-shape and the trapezoid-shape respectively, showing a continuity of results.
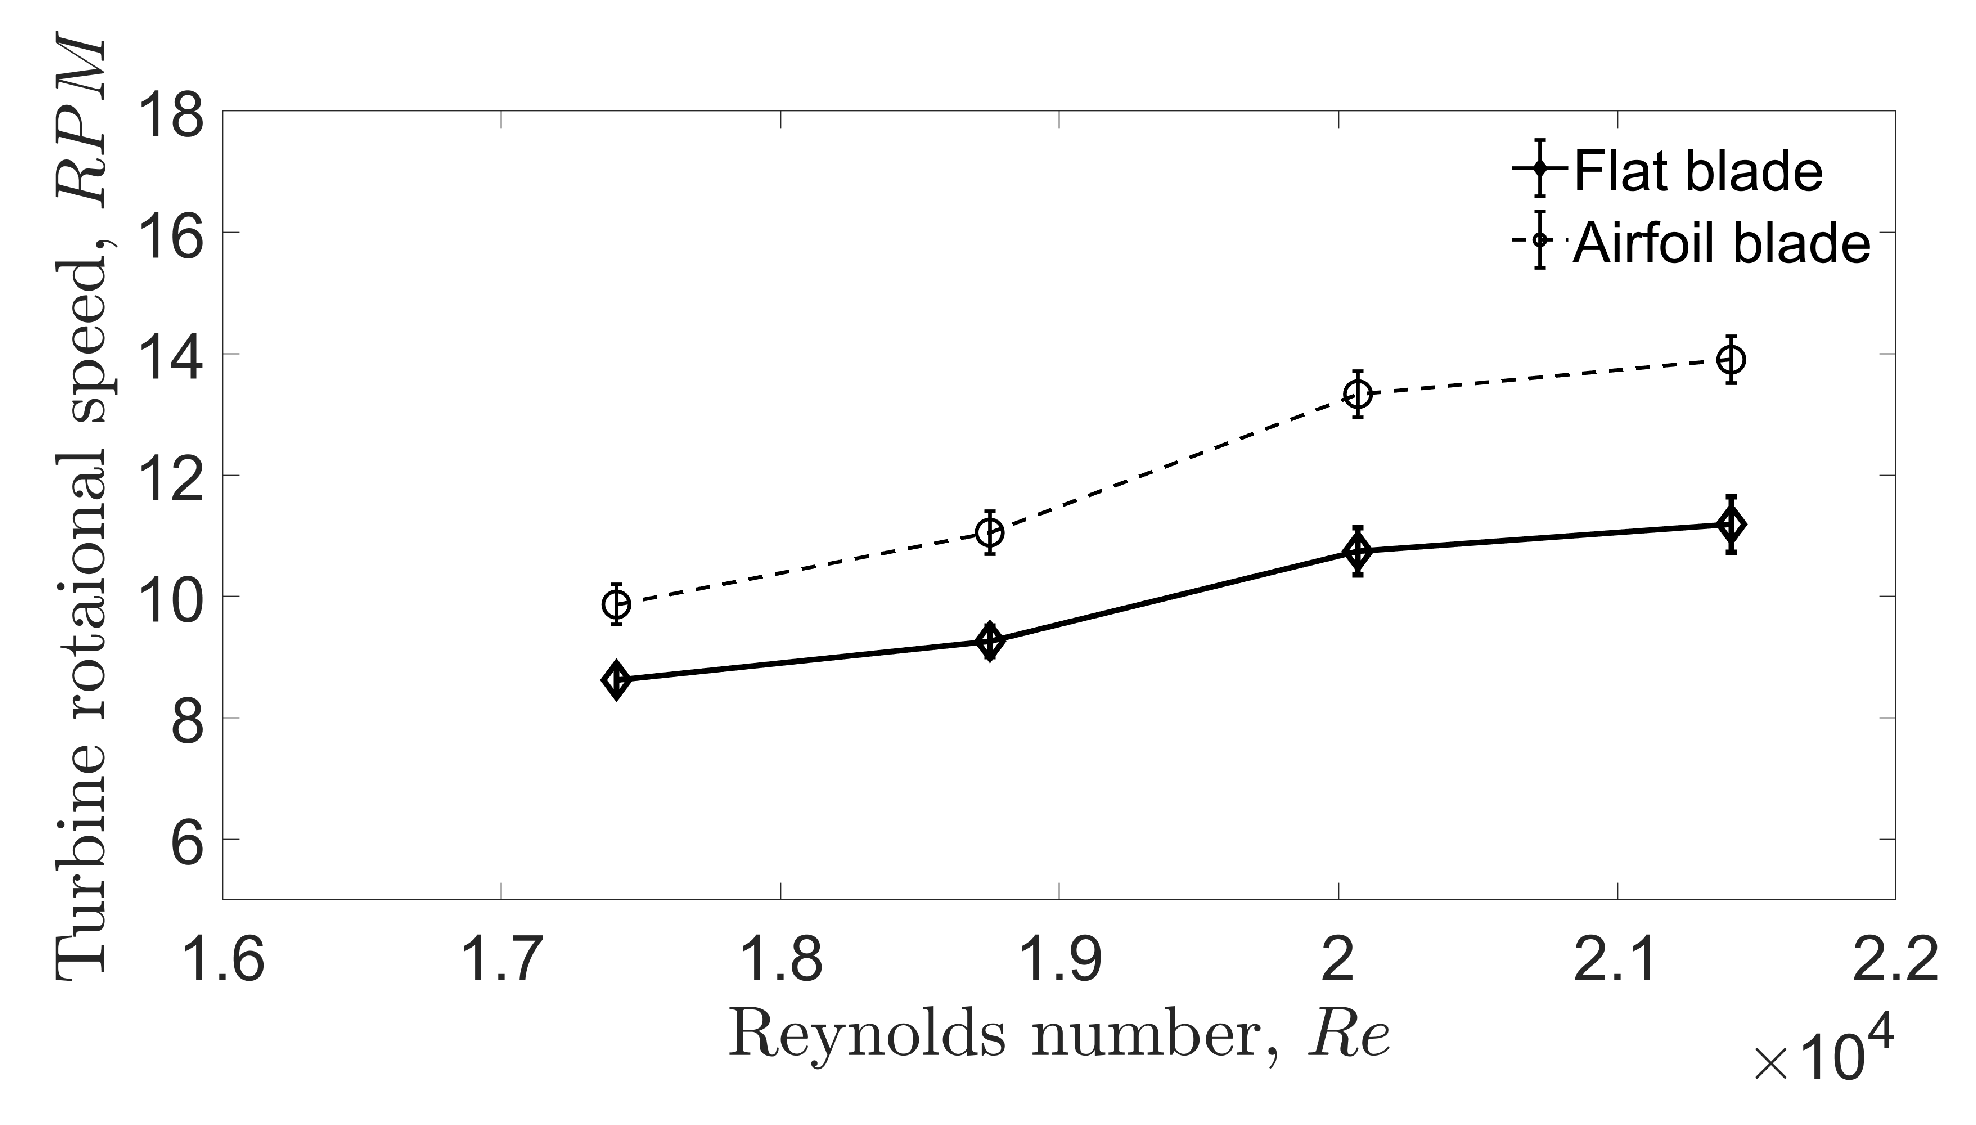
CPT blades with an elliptical airfoil cross-section were tested and compared to the rectangular cross-sections used so far. Elliptical airfoils were experimentally proven to have a lower drag at low (less than ) angles of attack compared to wings without camber [31] and was expected to minimize the recovery stroke drag force to improve performance. No-load rotation speeds are indicated in Figure 23 for the two cases at 4 different free stream velocities ranging from 0.29 m/s ( = 17,400) to 0.36 m/s ( = 21,600). It is observed that the blades with the airfoil cross-section performed better with a 14–24% increase in turbine rotational speeds.
6.2. Comparison to Savonius
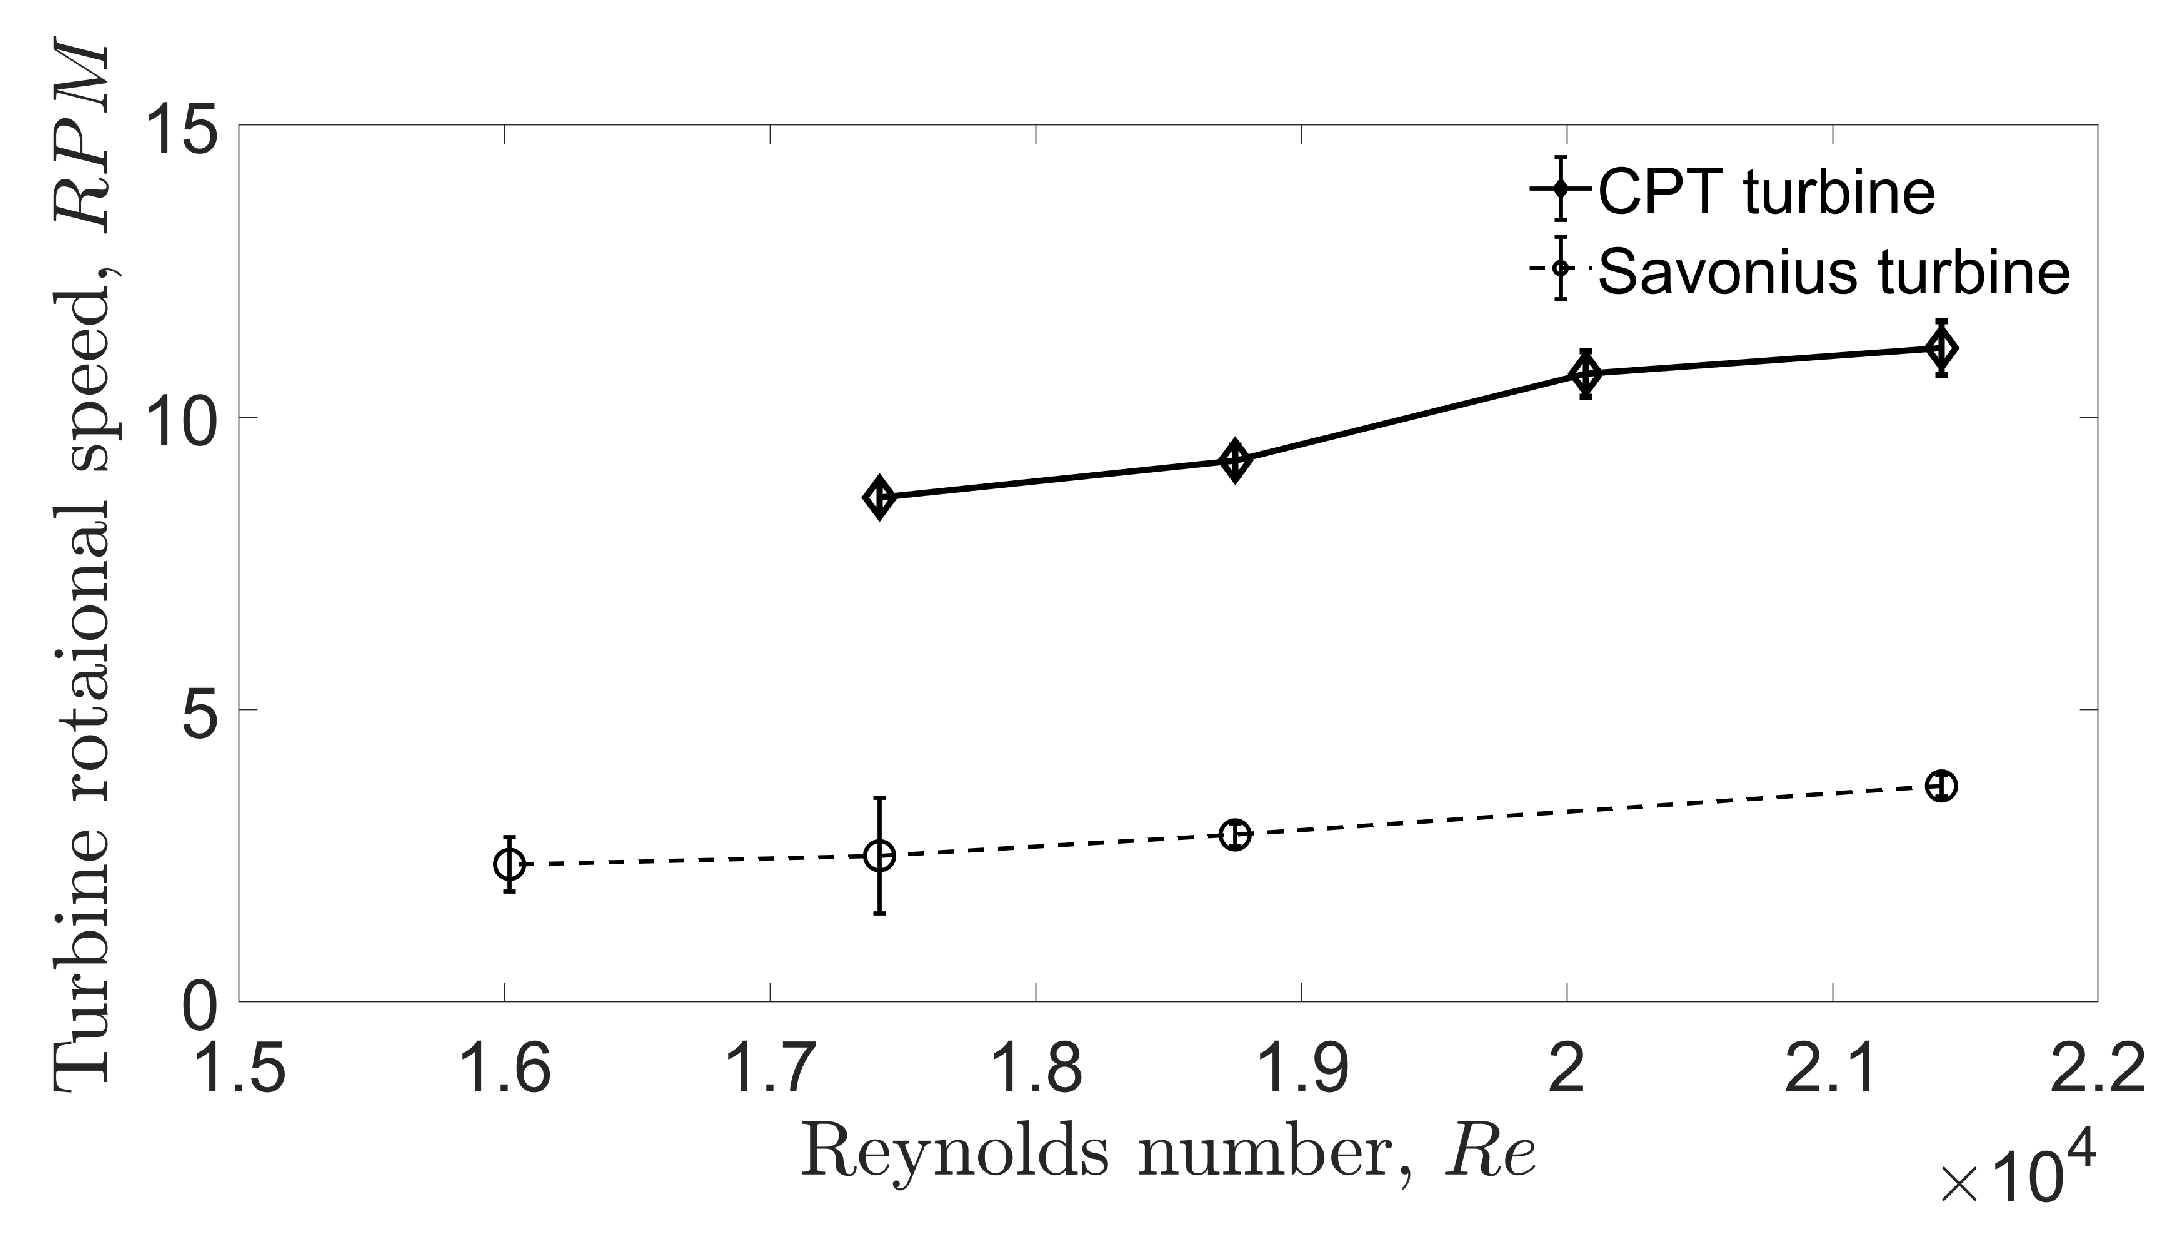
A Savonius turbine with buckets of the same area and aspect ratio as those of a mm blade was tested in the water tunnel and compared to CPT. The results are shown in Figure 24, which clearly show that the Savonius turbine rotated at a very slow rate compared to CPT. It was observed during the experiments that the Savonius turbine had lower fluctuations in rotational speeds due to the absence of the pitching motion of the blades. In addition to a higher mean rotational speed than the Savonius turbine, CPT also experienced a higher mean static torque coefficient, as shown in Figure 9. Considering these two results and a linear torque variation with tip speed ratio, the cyclic pitch turbine was predicted to have a better power performance than a Savonius turbine.
7. Conclusions
A cyclic blade pitching mechanism for wind and tidal energy turbines is developed. The mechanism allows the turbines to eliminate recovery stroke drag force, which adversely affects turbine performance, as seen in drag-based Savonius turbines. This is achieved by pitching and changing the angle of attack of its flat plate blades from in the drive stroke to for the recovery stroke. A similar blade motion and principle are seen in the sport of shell rowing. The main conclusions drawn from this work are:
- A functional vertical axis drag turbine that uses blade pitching to achieve negligible recovery stroke losses is conceptualized and built. A novel dual-cam mechanism to achieve the custom blade pitching motion is also developed.
- A theoretical model of the turbine is developed and validated by testing prototypes in a wind tunnel and a water channel. The developed equations show that the CPT turbine has 7% higher and more uniform static torque coefficient values and indicate a better dynamic performance compared to Savonius.
- Optimization of turbine parameters indicates that an active drive stroke angle of and a tip speed ratio of result in optimal turbine performance.
- Wind tunnel experiments show that long and narrow continuous blade shapes with less area towards blade tips result in better power performance of the turbine.
- Water channel turbine speed measurements together with the static torque measurements indicate a higher CPT power performance than a Savonius turbine. Furthermore, CPT performs even better with airfoil cross-sectioned blades than with flat plate blades.
Future applications for the turbine include power generation in residential locations with lower wind speeds and higher turbulence. The turbine is also practical for tidal and river stream energy.
Author Contributions
Conceptualization, methodology, software, validation, formal analysis, investigation, data curation, writing, original draft preparation, and visualization by J.P.R. Resources, writing, review and editing, supervision, project administration, and funding acquisition by F.J.D.
Funding
This research received no external funding.
Acknowledgments
We would like to thank Arturo Villegas Vaquero and Diego Mercado Ravell for their suggestions and discussions, which have helped progress this work.
Conflicts of Interest
The authors declare no conflict of interest.
References
- Lau, L.C.; Lee, K.T.; Mohamed, A.R. Global warming mitigation and renewable energy policy development from the Kyoto Protocol to the Copenhagen Accord—A comment. Renew. Sustain. Energy Rev. 2012, 16, 5280–5284. [Google Scholar] [CrossRef]
- Mukhopadhyay, K.; Forssell, O. An empirical investigation of air pollution from fossil fuel combustion and its impact on health in India during 1973–1974 to 1996–1997. Ecol. Econ. 2005, 55, 235–250. [Google Scholar] [CrossRef]
- Singh, B.R.; Singh, O. Global trends of fossil fuel reserves and climate change in the 21st century. In Fossil Fuel and the Environment; InTech: London, UK, 2012. [Google Scholar]
- Carrasco, J.M.; Franquelo, L.G.; Bialasiewicz, J.T.; Galván, E.; PortilloGuisado, R.C.; Prats, M.M.; León, J.I.; Moreno-Alfonso, N. Power-electronic systems for the grid integration of renewable energy sources: A survey. IEEE Trans. Ind. Electron. 2006, 53, 1002–1016. [Google Scholar] [CrossRef]
- GWEC. Global Wind Report: Annual Market Update 2015. 2014. Available online: http://gwec. net/global-figures/graphs/ (accessed on 18 May 2017).
- Adib, R.; Murdock, H.; Appavou, F.; Brown, A.; Epp, B.; Leidreiter, A.; Lins, C.; Murdock, H.; Musolino, E.; Petrichenko, K.; et al. Renewables 2015 Global Status Report; REN21 Secretariat: Paris, France, 2015. [Google Scholar]
- Rourke, F.O.; Boyle, F.; Reynolds, A. Tidal energy update 2009. Appl. Energy 2010, 87, 398–409. [Google Scholar] [CrossRef]
- Schubel, P.; Crossley, R. Wind Turbine Blade Design. Energies 2012, 5, 3425–3449. [Google Scholar] [CrossRef] [Green Version]
- Gasch, R.; Twele, J. Wind Power Plants, Fundamentals, Design, Construction and Operation; Springer: Berlin, Germany, 2012. [Google Scholar]
- Savonius, S. The S-rotor and its applications. Mech. Eng. 1931, 53, 333–338. [Google Scholar]
- Ricci, R.; Romagnoli, R.; Montelpare, S.; Vitali, D. Experimental study on a Savonius wind rotor for street lighting systems. Appl. Energy 2016, 161, 143–152. [Google Scholar] [CrossRef]
- D’Alessandro, V.; Montelpare, S.; Ricci, R.; Secchiaroli, A. Unsteady Aerodynamics of a Savonius wind rotor: A new computational approach for the simulation of energy performance. Energy 2010, 35, 3349–3363. [Google Scholar] [CrossRef]
- Akwa, J.; Vielmo, H.; Petry, A. A review on the performance of Savonius wind turbines. Renew. Sustain. Energy Rev. 2012, 16, 3054–3064. [Google Scholar] [CrossRef]
- Trevor, L. Wind Energy Engineering, A Handbook for Onshore and Offshore Wind Turbines; Academic Press, Elsevier: Cambridge, MA, USA, 2017. [Google Scholar]
- Golecha, K.; Eldho, T.; Prabhu, S. Influence of the deflector plate on the performance of modified Savonius water turbine. Appl. Energy 2011, 88, 3207–3217. [Google Scholar] [CrossRef]
- Kamoji, M.; Kedare, S.; Prabhu, S. Performance tests on helical Savonius rotors. Renew. Energy 2009, 34, 521–529. [Google Scholar] [CrossRef]
- Kacprzak, K.; Liskiewicz, G.; Sobczak, K. Numerical investigation of conventional and modified Savonius wind turbines. Renew. Energy 2013, 60, 578–585. [Google Scholar] [CrossRef]
- Mohamed, M.; Janiga, G.; Pap, E.; Thevenin, D. Optimization of Savonius turbines using an obstacle shielding the returning blade. Renew. Energy 2010, 35, 2618–2626. [Google Scholar] [CrossRef]
- Alaimo, A.; Esposito, A.; Milazzo, A.; Orlando, C.; Trentacosti, F. On the Effect of Slotted Blades on Savonius Wind Generator Performances by CFD Analysis. Energies 2013, 6, 6335–6351. [Google Scholar] [CrossRef]
- Wenehenubun, F.; Saputra, A.; Sutanto, H. An experimental study on the performance of Savonius wind turbines related with the number of blades. Energy Procedia 2015, 68, 297–304. [Google Scholar] [CrossRef]
- Al-Faruk, A.; Sharifian, A. Geometrical optimization of a swirling Savonius wind turbine using an open jet wind tunnel. Alex. Eng. J. 2016, 55, 2055–2064. [Google Scholar] [CrossRef]
- Altan, B.D.; Atılgan, M.; Özdamar, A. An experimental study on improvement of a Savonius rotor performance with curtaining. Exp. Therm. Fluid Sci. 2008, 32, 1673–1678. [Google Scholar] [CrossRef]
- Weiss, S.B. Vertical Axis Wind Turbine with Continuous Blade Angle Adjustment. Master’s Thesis, Massachusetts Institute of Technology, Cambridge, MA, USA, 2010. [Google Scholar]
- Cooper, P.; Kennedy, O. Development and analysis of a novel vertical axis wind turbine. In Proceedings Solar 2004—Life, The Universe and Renewables; In Australian and New Zealand Solar Energy Society (ANZSES): Perth, Australia, 2004; pp. 1–9. [Google Scholar]
- Muller, G.; Jentsch, F.; Stoddart, E. Vertical axis resistance type wind turbines for use in buildings. Renew. Energy 2009, 34, 1407–1412. [Google Scholar] [CrossRef]
- Prasad Rao, J. Cyclic Pitch Turbines. Ph.D. Thesis, Rutgers, The State University of New Jersey, New Brunswick, NJ, USA, 2018. [Google Scholar]
- Rao, J.P.; Diez, F.J. Development of a Cyclic Pitch Turbine. In Proceedings of the ASME/JSME/KSME Joint Fluids Engineering Conference, Seoul, Korea, 26–31 July 2015. [Google Scholar]
- Caplan, N.; Gardner, T.N. A fluid dynamic investigation of the Big Blade and Macon oar blade designs in rowing propulsion. J. Sports Sci. 2007, 25, 643–650. [Google Scholar] [CrossRef] [PubMed] [Green Version]
- Brown, R. The flight of birds. Biol. Rev. 1963, 38, 460–489. [Google Scholar] [CrossRef]
- Ortiz, X.; Hemmatti, A.; Rival, D.; Wood, D. Instantaneous forces and moments on inclined flat plates. In Proceedings of the Seventh International Colloquium on Bluff Body Aerodynamics and Applications (BBAA7), Shanghai, China, 2–6 September 2012; pp. 2–6. [Google Scholar]
- Mueller, T.J.; Torres, G.E. Aerodynamics of Low Aspect Ratio Wings at Low Reynolds Numbers with Applications to Micro Air Vehicle Design and Optimization; Technical Report; University of Notre Dame: Notre Dame, IN, USA, 2001. [Google Scholar]
- Munson, B.R.; Young, D.F.; Okiishi, T.H.; Huebsch, W.W. Fundamentals of Fluid Mechanics; John Wiley & Sons: Hoboken, NJ, USA, 1998; Volume 69, Chapter 9. [Google Scholar]
- Nedić, J.; Ganapathisubramani, B.; Vassilicos, J. Drag and near wake characteristics of flat plates normal to the flow with fractal edge geometries. Fluid Dyn. Res. 2013, 45, 061406. [Google Scholar] [CrossRef]
- Sadraey, M. Aircraft Performance: Analysis; VDM Publishing: Saarbrucken, Germany, 2009; Chapter 3. [Google Scholar]
- Ali, M.H. Experimental comparison study for Savonius wind turbine of two & three blades at low wind speed. Int. J. Mod. Eng. Res. 2013, 3, 2978–2986. [Google Scholar]
- Rao, J.P.; Villegas, A.; Diez, F.J. Theoretical Analysis of a Cyclic Pitch Turbine. In Proceedings of the ASME 2016 Fluids Engineering Division Summer Meeting, Washington, DC, USA, 10–14 July 2016. [Google Scholar]
- Zhao, Z.; Zheng, Y.; Xu, X.; Liu, W.; Hu, G. Research on the improvement of the performance of Savonius rotor based on numerical study. In Proceedings of the International Conference on Sustainable Power Generation and Supply, SUPERGEN’09, Nanjing, China, 6–7 April 2009; pp. 1–6. [Google Scholar]
- Kang, C.; Liu, H.; Yang, X. Review of fluid dynamics aspects of Savonius-rotor-based vertical-axis wind rotors. Renew. Sustain. Energy Rev. 2014, 33, 499–508. [Google Scholar] [CrossRef]
- Ross, I.; Altman, A. Wind tunnel blockage corrections: Review and application to Savonius vertical-axis wind turbines. J. Wind Eng. Ind. Aerodyn. 2011, 99, 523–538. [Google Scholar] [CrossRef]
- Mahmoud, N.; El-Haroun, A.; Wahba, E.; Nasef, M. An experimental study on improvement of Savonius rotor performance. Alex. Eng. J. 2012, 51, 19–25. [Google Scholar] [CrossRef]
- Kadam, A.; Patil, S. A review study on Savonius wind rotors for accessing the power performance. IOSR J. Mech. Civ. Eng. 2013, 5, 18–24. [Google Scholar]
- Bowen, A.; Huskey, A.; Link, H.; Sinclair, K.; Forsyth, T.; Jager, D.; van Dam, J.; Smith, J. Small Wind Turbine Testing Results from the National Renewable Energy Lab; Technical Report; National Renewable Energy Lab. (NREL): Golden, CO, USA, 2009. [Google Scholar]
- Rao, J.P.; Diez, F.J. Experimental Analysis of a Cyclic Pitch Turbine. In Proceedings of the ASME 2017 Fluids Engineering Division Summer Meeting, Waikoloa, HI, USA, 30 July–3 August 2017. [Google Scholar]
Figure 1.
Illustration of the working principle of a cyclic pitch turbine.

Figure 2.
Sketch showing one full cycle of a linearly-actuated cyclic pitch turbine.

Figure 3.
Sketches showing the rotary actuation cycle and its different blade orientations in (a) a top view and (b) an isometric view.
Figure 3.
Sketches showing the rotary actuation cycle and its different blade orientations in (a) a top view and (b) an isometric view.

Figure 4.
The four different Cyclic Pitch Turbine (CPT) blade phases generated by the dual-cam mechanism.
Figure 4.
The four different Cyclic Pitch Turbine (CPT) blade phases generated by the dual-cam mechanism.

Figure 5.
Assembly of the CPT turbine model indicating the different parts.

Figure 6.
Relative velocity diagram for a CPT blade and illustration of the location of zero azimuth.
Figure 6.
Relative velocity diagram for a CPT blade and illustration of the location of zero azimuth.

Figure 7.
An infinitesimal blade element of the CPT blade considered for force analysis.

Figure 8.
Two cases observed for a CPT blade in terms of the direction of and the corresponding power generation or power loss.
Figure 8.
Two cases observed for a CPT blade in terms of the direction of and the corresponding power generation or power loss.

Figure 9.
for a CPT and a Savonius turbine for (a) one, (b) two, and (c) three-bladed turbine configurations.
Figure 9.
for a CPT and a Savonius turbine for (a) one, (b) two, and (c) three-bladed turbine configurations.

Figure 10.
Surface plots showing the variation of (a) force, (b) torque, and (c) power outputs from different radial locations of a CPT blade at azimuth angles –.
Figure 10.
Surface plots showing the variation of (a) force, (b) torque, and (c) power outputs from different radial locations of a CPT blade at azimuth angles –.

Figure 11.
Variation of (a) torque coefficient and (b) power coefficient of a three-bladed CPT.

Figure 12.
Power generation or power loss experienced by a CPT blade in one rotation cycle at several tip speed ratios, , the non-dimensional turbine speed parameter.
Figure 12.
Power generation or power loss experienced by a CPT blade in one rotation cycle at several tip speed ratios, , the non-dimensional turbine speed parameter.

Figure 13.
CPT power coefficient with varying (a) active drive stroke angles and (b) tip speed ratios.
Figure 13.
CPT power coefficient with varying (a) active drive stroke angles and (b) tip speed ratios.

Figure 14.
Optimization of as a simultaneous function of and .

Figure 15.
Photographs showing the fabricated and assembled CPT Prototypes 1 and 2.

Figure 16.
Sketch of the experimental setup used to test CPT in the water channel.

Figure 17.
Water channel tests showing power variation with (a) fluid velocity and (b) applied torque.
Figure 17.
Water channel tests showing power variation with (a) fluid velocity and (b) applied torque.

Figure 18.
Comparison of from water channel experiments to theoretical results.

Figure 19.
Variation in instantaneous rotational speeds of the CPT turbine.

Figure 20.
(a) and (b) of CPT from water channel experiments compared to the theoretical results.

Figure 21.
(a) Mean RPM and (b) tip speed ratio measurements for 11 different blade shapes tested in the wind tunnel.
Figure 21.
(a) Mean RPM and (b) tip speed ratio measurements for 11 different blade shapes tested in the wind tunnel.

Figure 22.
(a) and (b) of CPT with 6 blades of the same area from wind tunnel testing.

Figure 23.
CPT mean RPM measurements with a flat plate blade and an airfoil sectioned blade tested in the water channel.
Figure 23.
CPT mean RPM measurements with a flat plate blade and an airfoil sectioned blade tested in the water channel.

Figure 24.
Mean RPM measurements of CPT and Savonius turbine tested in the water channel.


Table 1.
Blade shapes proposed for experimental wind tunnel testing.
| S.No. | Shape | Length | Root Width | Mid Width | Tip Width | Area |
|---|---|---|---|---|---|---|
| 1 | Rectangle 1 | 160 | 60 | 60 | 60 | 9600 |
| 2 | Rectangle 2 | 160 | 30 | 30 | 30 | 4800 |
| 3 | Rectangle 3 | 80 | 120 | 120 | 120 | 9600 |
| 4 | Rectangle 4 | 80 | 60 | 60 | 60 | 4800 |
| 5 | Rectangle Holes | 160 | 60 | 60 | 60 | 9600 |
| 6 | Trapezoid 1 | 160 | 90 | 60 | 30 | 9600 |
| 7 | Trapezoid 2 | 160 | 30 | 60 | 90 | 9600 |
| 8 | Diamond | 160 | 30 | 75 | 30 | 9600 |
| 9 | T Shape 1 | 160 | 120 | 30 | 30 | 9600 |
| 10 | T Shape 2 | 160 | 30 | 30 | 120 | 9600 |
| 11 | Plus shape | 160 | 30 | 120 | 30 | 9600 |
© 2018 by the authors. Licensee MDPI, Basel, Switzerland. This article is an open access article distributed under the terms and conditions of the Creative Commons Attribution (CC BY) license (http://creativecommons.org/licenses/by/4.0/).
Share and Cite
MDPI and ACS Style
Prasad Rao, J.; Diez, F.J. Novel Cyclic Blade Pitching Mechanism for Wind and Tidal Energy Turbine Applications. Energies 2018, 11, 3328. https://doi.org/10.3390/en11123328
AMA Style
Prasad Rao J, Diez FJ. Novel Cyclic Blade Pitching Mechanism for Wind and Tidal Energy Turbine Applications. Energies. 2018; 11(12):3328. https://doi.org/10.3390/en11123328
Chicago/Turabian StylePrasad Rao, Jubilee, and Francisco J. Diez. 2018. "Novel Cyclic Blade Pitching Mechanism for Wind and Tidal Energy Turbine Applications" Energies 11, no. 12: 3328. https://doi.org/10.3390/en11123328
Note that from the first issue of 2016, this journal uses article numbers instead of page numbers. See further details here.