Nonsteady Shock Wave Attenuation Due to Leakage


1
School of Energy and Power Engineering, Beihang University, Beijing 100083, China
2
National Key Laboratory of Science & Technology on Aero-Engine Aero-Thermodynamics, Beihang University, Beijing 100083, China
*
Author to whom correspondence should be addressed.
Energies 2018, 11(12), 3275; https://doi.org/10.3390/en11123275
Submission received: 8 October 2018
/
Revised: 17 November 2018
/
Accepted: 19 November 2018
/
Published: 23 November 2018
(This article belongs to the Section I: Energy Fundamentals and Conversion)
Abstract
:Leakage flow between the rotor and the stator can cause serious performance degradation of wave rotors which utilize nonsteady shock waves to directly transfer energy from burned gases to precompressed air. To solve this problem, primary flow features relevant to leakage are extracted and it was found that the leakage-attributed performance degradation could be abstracted to a special initial-boundary value problem of one-dimensional Euler equations. Then, a general loss assessment method is proposed to solve the problem of nonsteady flow loss prediction. Using the above method, a reasonable physical hypothesis of the initial-boundary value problem depicting the nonsteady leakage flow process is proposed and further, a closed-form leakage loss analytical model combined with an empirical correction method for the discharge coefficient is established. Finally, with the experimentally verified CFD method, comprehensive numerical verification is conducted for the loss prediction model; it is proved that the physical hypothesis of the proposed model in this paper is reasonable and the model is capable of predicting nonsteady shock wave attenuation due to leakage exactly within the range of parameter variations of wave rotors.
1. Introduction
A wave rotor is a kind of nonsteady fluid machinery utilizing moving shock and expansion waves to directly exchange energy between gases and precompressed air which has a much higher energy exchange efficiency than traditional steady flow diffusers. Due to the theoretical advantages of nonsteady flows, the wave rotor technology has the potential of circumventing the development bottleneck of current gas turbine technology and substantially improving engine performance. When a wave rotor is integrated into a traditional gas turbine, the thermal efficiency and the specific power can be raised to a higher level. For the C30 (specific power of 30 kW) and C60 (specific power of 60 kW) micro turbo engines, Akbari and Müller [1] predicted in performance calculations an increase of 33% for the former type and 25% for the latter in thermal efficiency and specific power. Welch and Paxson [2] pointed out that for small (300–500 kW) and midsize (2000–3000 kW) turboshaft engines the specific power could be raised by 19–21% and the specific fuel consumption rate could be reduced by 16–17% when integrated with a wave rotor; for the largescale turbofan engine (355–450 kN), the specific fuel consumption rate and the turbine inlet temperature could be reduced by 6–7% and 72 K, respectively, keeping the engine thrust unchanged. Furthermore, when the combustion process is transferred from the traditional gas turbine combustor with total pressure loss to the wave rotor channels with the deflagration or detonation combustion mode, which forms the internal combustion wave rotor, the total pressure at the combustor exit could be raised even higher keeping the turbine inlet temperature unchanged and the complexity of the ducting system and the engine weight could be reduced substantially [3,4].
Extensive researches have been conducted on working principle [2,5], design methods [6,7,8,9,10,11,12], loss mechanisms [13,14,15,16,17,18,19,20], and experimental performance tests [10,18,19,21,22], etc. It is realized that although the wave rotor possesses appealing aerodynamic and structural features, the following technical obstacles need to be overcame for engineering applications, including: leakage flows, local thermal and mechanical loads, fatigue of rotor blades, guidance of port flows, and limitations of design and analytical tools. Especially the losses due to leakage flows between the rotor and the stator is recognized as the critical factor of supercharging performance degradation of wave rotors [23]. Hoerler [18] studied the impact of various flow losses on efficiency for the commercial wave rotor type Comprex® (Brown Boveri, Baden, Switzerland) and he pointed out that leakage dominates all loss factors, especially for the smaller wave rotor type for which the influence of leakage flows on performance is more prominent. Wilson [18] also found in three and four port wave rotor experiments that leakage has a great influence on wave rotor performance degradation. For internal combustion wave rotors, serious leakage resulting from inappropriate design not only reduces maximum pressure rise in the channel dramatically but also causes fuel and hot gas leakage, premature ignition and misfiring [13,24].
Worldwide, currently, the leakage problem has been studied by researchers with different methods and important progress has been made. The widely used single cavity model [7,9,19,22] in wave rotor quasi-one dimensional design procedures and the segmented boundary leakage model proposed by Akbari and Nalim [17] consider the influence of leakage flows on the main stream via adding leakage source terms to the flow control equations. The above method could predict wave rotor performance degradation effectively through turning on the leakage submodel in the source terms. Wilson [18] has made massive tests on a three-port wave rotor divider working at design point. Detailed analyses on flow parameter distributions and the variations of supercharging efficiency with leakage gap width have been performed. In Spring’s finite difference model developed for the pressure-wave supercharged engine systems, the influence of leakage on channel mass flows was emphasized and studied in detail. It was found that typically 15% of the channel flows were leaked into the casing [25]. In order to take into account leakage losses in wave rotor analytic design procedures, it is necessary to develop methods to correlate leakage flows with nonsteady waves directly. Liu, C.Y. and Liu, H.X. [20] have studied the interaction between the leakage flows and the main stream numerically. The attenuation mechanism of the hammer shock wave reflected from the closed end when leakage happens was obtained and a simple analytical model was developed to predict the hammer shock attenuation.
On the basis of the authors’ former work, this paper conducts further studies on the attenuation mechanism of the reflected shock wave generated when the rotor channel is connected with the high pressure exhaust port. Nonsteady leakage loss evaluation method for wave rotors is also discussed. Finally, the nondimensional leakage loss equation is derived, combining with the general empirically modified model of the discharge coefficient. The method combined with the derived equation could be further extended to cases of incident shock wave, hammer shock wave and expansion waves. Based on the above method, it is possible to consider the influence of leakage on the wave system in wave rotor analytical design procedures and the influence on design parameters. Finally, more accurate analytical design results could be obtained.
Besides the engineering applications, in the scientific sense, the basic flow phenomenon of leakage-attributed shock wave attenuation is discussed in detail and the corresponding method for predicting the attenuation magnitude is proposed for the first time. The model in this paper could be taken as a special case of the general initial-boundary value problem of Euler equations. The solving of it is one of the most important topics in computational fluid dynamics. The Godunov type method solves the Riemann problem approximately or exactly in local flow fields through numerical discretization, and thus obtains the numerical solution of the problem [26]. Specifically, although the numerical solution could be obtained easily through use of the Godunov method, an analytic solution of the general initial-boundary value problem does not exist and the decomposition of flow parameter discontinuities in the one-dimensional nonsteady flow field revealed in this paper has not been mentioned in any literature before.
2. Physical Formulation of the Leakage Problem of Wave Rotors
The primary cause of leakage in a wave rotor lies in that the rotor channel pressure is generally not equal to the cavity pressure, as a result of which gases are driven by the pressure difference to flow between the channel and the cavity through the rotor-stator gap, especially when the incident shock wave reaches the channel end and reflects since the pressure difference reaches its maximum. Figure 1 shows the above waves in the high pressure part of the wave diagram, which was analyzed in detail in Akbari’s analytical design work [27].
As illustrated in Figure 1, the majority of the gases in the rotor channel are driven to the stationary exhaust port, whereas a minority of them are driven to the cavity in the form of radial leakage, as shown in Figure 2; in addition, at the moment the exhaust port opens, the rotor channels are located on the two sides of the port leading edge and consequently the gases in them are in the states in front of the incident shock and behind the reflected shock respectively, as a result of which the gases are driven to flow between the adjacent rotor channels in the form of circumferential leakage due to inter-channel pressure difference. The circumferential leakage only occurs at the circumferential locations where incident and reflected pressure waves generate at either channel end and consequently the leakage flow area is much smaller than that of the radial leakage; therefore, the circumferential leakage is usually neglected when performing preliminary analysis. To study radial leakage flows, a representative radial plane is selected, as shown in Figure 3; in addition, the effect of the wall between adjacent rotor channels on flows is neglected. The radial area-change effect is also neglected.
The essential cause of leakage-attributed supercharging performance decay of wave rotors lies in the attenuation of the channel shock wave which pressurizes gases. Consider the reflection of the incident shock wave as shown in Figure 1, when the width of the gap between the rotor channels and the stationary air port is fixed and the wave rotor runs stably, both the radial leakage flows at the entrance of the air port and the port flows are steady. Consequently, the incident shock wave will reflect normally as if the leakage flows have no influence on it. As a result, the attenuation of the reflected shock and the supercharging performance could not be obtained if only considering the stable operation mode for which the leakage flows have already been established.
Consider an ideal wave rotor with no leakage which runs stably initially, when the gap width is increased from zero to a fixed value, it is obvious that the performance of the wave rotor will attenuate due to leakage flows. Specifically, expansion waves will be generated and propagate into the air port and the channels facing the port at the instant the gap width will increase, as shown in Figure 4. It is noteworthy that the expansion waves will occupy the space from the leading edge to the trailing edge of the port. As a result, the pressure in the air port will be lowered. As the wave rotor runs continuously, the radial leakage flows and the port flows will become steady again and reflected shock waves will be generated when subsequent rotor channels connect with the air port. The strength of these reflected shocks are the same with the attenuated shock wave which is generated at the instant the gap width is increased suddenly.
According to the above analysis, the most important issue in predicting leakage-attributed performance degradation and in analytical design procedures considering leakage is to solve the problem of shock wave attenuation due to leakage. In this paper, the attenuation of reflected shock waves is analyzed. Figure 4 shows the cross section where the analytical model lies in. The analytic technique is similar for incident shock wave.
3. Discussion of Loss Assessment Method
Since leakage occupies a large proportion of all wave rotor flow losses, it is very important for wave rotor design and performance prediction to correctly evaluate the leakage loss. As depicted in Figure 5c, for the wave rotor that works at stable state, according to the flow parameters behind the reflected shock wave and the leakage flow rate at the downstream rotor-stator gap, the flow parameters in the stationary port could be computed. However, the leakage-attributed flow parameter variations including the attenuation magnitude of the shock strength could not be obtained and, therefore, the leakage loss is failed to be assessed quantitatively. Consequently, the ideal state without leakage must be considered to assess the leakage loss, as illustrated in Figure 5a. Corresponding to the status from Figure 5a to Figure 5c, the leakage flow rate varies from zero to a finite value which corresponds to a nonsteady flow process. To evaluate the leakage-attributed flow parameter variations, an appropriate physical model must be constructed corresponding to the above process.
A noticeable phenomenon is that in an actual wave rotor the width of the leakage gap varies continuously or gradually, which takes time. The comparison between the case with leakage and the ideal case without leakage implies the assumption that the leakage gap is suddenly widened from zero to a given value. This assumption is also implicit in quasi-one dimensional wave rotor codes which predict wave rotor performance degradation through turning on the leakage submodel. The assumption is consistent with the gradual change of gap width in a wave rotor. There are mainly two reasons: Firstly, there always exists stably reflecting shock waves at the leading edge of the high pressure air port when the wave rotor runs stably or quasi-stably; secondly, similar with the thought of calculous, when the time interval considering leakage gap width variations is small enough, the change of the gap width could be considered as a sudden process. The reflected shock waves at the leading edge of the air inlet port will experience a series of “sudden” changes of leakage gap width.
To further illustrate the loss assessment method, review the total pressure loss evaluation method of inlet with steady flows. The total pressure discussed here is defined in the frame of reference of the stationary passage. Referring to Figure 6, the inlet total pressure recovery coefficient is defined in general as:
In Equation (1), is the total pressure at the exit of the inlet port, is the total pressure far ahead where the airflow is undisturbed. This paper holds that in essence the assessment of aerodynamic loss is reviewing the aerodynamic parameter variations when some loss is superposed on the ideal flow without any loss factor. From this point of view, is defined as:
As seen from Equation (2), whether or not losses exist such as wall friction and shock wave, the entrance flow parameters will not be affected since the inlet flow field is generally steady. Hence, Equation (2) is equivalent to Equation (1) in steady flow pattern according to the assessment method in this paper. Similarly for the leakage attributed total pressure loss , referring to Figure 7, Equation (3) could be obtained.
For steady leakage flow, equals to , hence Equation (4) is established and the leakage loss definition is similar to that of inlet total pressure recovery coefficient; whereas for nonsteady leakage flow, which is generally accompanied by the propagation of shock and expansion waves, the loss definition method is no longer applicable. The general loss assessment idea will be applied.
4. Physical Mechanism of the Leakage Attributed Nonsteady Shock Wave Loss
For the ideal flow as shown in Figure 5a, when the gap width is increased from zero to a fixed value suddenly, the leakage flows will be initiated at the passage-port interface via expansion waves propagating into the channel and the port simultaneously. For propagating shock and expansion waves in the same direction, the two will catch up with each other; specifically, for the channel facing the high pressure air port at the leading edge of the port, the reflected shock wave in it is coupled immediately with the expansion wave propagating into the channel and it appears as an attenuated reflected shock.
The expansion waves propagating into the port cause the reduction of pressure, temperature and flow velocity. Since the port flows are steady when the wave rotor runs stably, the expansion waves propagating into the port will gradually dissipate and finally disappear, as illustrated from Figure 5a–c. The final steady flow state with leakage is given in Figure 5c.
Through careful investigations into the CFD (Computational Fluid Dynamics) results, it is found that there exists entropy difference across the leakage gap (from the passage to the port). The analytical results also show an entropy discontinuity at the passage-port interface. In general, it is generated due to sudden enlargement of flow areas when the fluid in the channel arrives at the interface. Despite the entropy discontinuity at the interface, there also exists an entropy discontinuity propagating downstream at the speed of gas flows.
As seen in Figure 5b, entropy behind the attenuated reflected shock wave is lower than that of the ideal reflected shock wave, which is the same state in front of the expansion waves in the port. Since expansion waves do not change the entropy of fluid, there exists entropy difference between the fluids behind the reflected shock wave and the fluids behind the expansion waves. As a result, there must be an entropy discontinuity propagating downstream and the strength of it is determined by the losses generated when the fluid flows across the leakage gap.
5. Establishment of the Basic Leakage-Attributed Loss Model
After analyzing the physical mechanism of leakage-attributed flow parameter variations, the analytical loss model will be established. For the ideal case without leakage, given the flow parameters in front of the reflected shock wave and the post-shock static pressure, using Rankine-Hugoniot relations and Prandtl relation, the flow parameters including the reflected shock wave speed, the post-shock temperature and the post-shock flow velocity will be determined. Choosing the control volume as shown in Figure 8 and making the following assumptions: 1. The flow is one-dimensional and inviscid; 2. the leakage gas flowing out of the control volume has the same x-component velocity with the channel main flow upstream of the leakage gap. According to the second assumption, the momentum equation could be obtained:
The final form conservation equations are listed as follows:
Continuity equation:
Momentum equation:
Energy equation:
In Equations (6)–(8), , , , are the flow velocity, pressure, density and temperature behind the reflected shock wave; , , , are the flow velocity, pressure, density and temperature in the stationary port downstream of the leakage gap; is specific heat at constant pressure; is the mass flow rate of the leakage gas; is the channel height; and is the channel width.
The expansion waves propagating into the port are forward simple waves. According to the theory of characteristics, Equation (9) could be obtained.
In Equation (9), is the flow velocity behind the expansion wave, is the flow velocity behind the ideal reflected shock wave in the case of zero leakage, is specific heat ratio, is the gas constant of air, is the static temperature behind the expansion wave, and is the static temperature behind the ideal reflected shock wave in the case of zero leakage.
The flows are isentropic through the expansion wave and only ideal gas is considered in this paper. As a result, Equation (10) is equivalent to Equation (9).
The flow velocity and pressure are continuous across the entropy discontinuity as illustrated in Figure 5b; hence Equation (11) is equivalent to Equation (10).
Combining Equation (7) with Equation (8) leads to another relation in terms of and , i.e., Equation (12). Thus, the intermediate variables and are expressed as the implicit functions of the flow parameters behind the reflected shock and could be solved numerically through iterative method.
After some formal processing of the continuity equation, the leakage equation to solve the post-shock pressure of the leakage-attributed attenuated reflected shock wave is obtained, as shown in Equation (13). The intermediate variables of , , and in Equations (11)–(13) could be expressed as the function of the flow parameters in front of the reflected shock and the post-shock pressure, as illustrated in Equations (14)–(17).
To be noted, the leakage flow rate in Equation (13) is still unknown and hence needs to be formulated as the function of known quantities and the unknown variable . Since there exists dissipation losses such as viscosity, heat conduction and flow separation at the entrance of the leakage gap, which leads to the complexity of leakage flows, it is impractical and inaccurate to calculate leakage flow rate using analytical models without empirical parameters. Hence, the classical isentropic nozzle flow model illustrated in Equation (18) is applied and the flow coefficient in it will be corrected by empirical correlations.
In Equation (18), is the leakage gap width, is the discharge coefficient, and is the outlet pressure of the leakage gap.
Defining the nondimensional gap width , the final nondimensionalized leakage equation is obtained, as seen in Equation (19).
6. Modelling of the Discharge Coefficient with Empirical Correlations
Though the geometric forms of wave rotor channels, stationary ports and leakage paths are relatively simple compared with that of gas turbines, the leakage flow mechanism is involved with many factors which bring difficulties to the accurate prediction of leakage flow rate. When the rotor-stator gap width varies, the character of leakage flow changes, as illustrated in Figure 9. For relatively small gap width, the leakage flow is similar to nozzle flow; for relatively large gap width, in which case the expansion process of leakage gas lacks the restriction of gap walls, the leakage flow is similar to that of sharp-edged orifices [28]. The discharge coefficients of sharp-edged orifice jet and nozzle jet are quite different; for the former, the typical value is 0.6 and for the latter, the typical value is 0.8. Therefore, the discharge coefficient cannot be set constant and needs to take into account the influence of leakage gap length to width variations.
The Reynolds number of leakage flow is on the scale of tens of thousands, which is relatively small and viscosity may have a significant influence on the flow structure which in turn affects the discharge coefficient. The experimental results from Lichtarowicz [29] have revealed the influence of Reynolds number on the discharge coefficient.
With the increasing of inlet to outlet pressure ratio, discharge coefficient increases gradually and finally approximates the maximum value [30]. The experimental results given by Perry, Deckker, etc. and the corresponding fitted curve are illustrated in Figure 10.
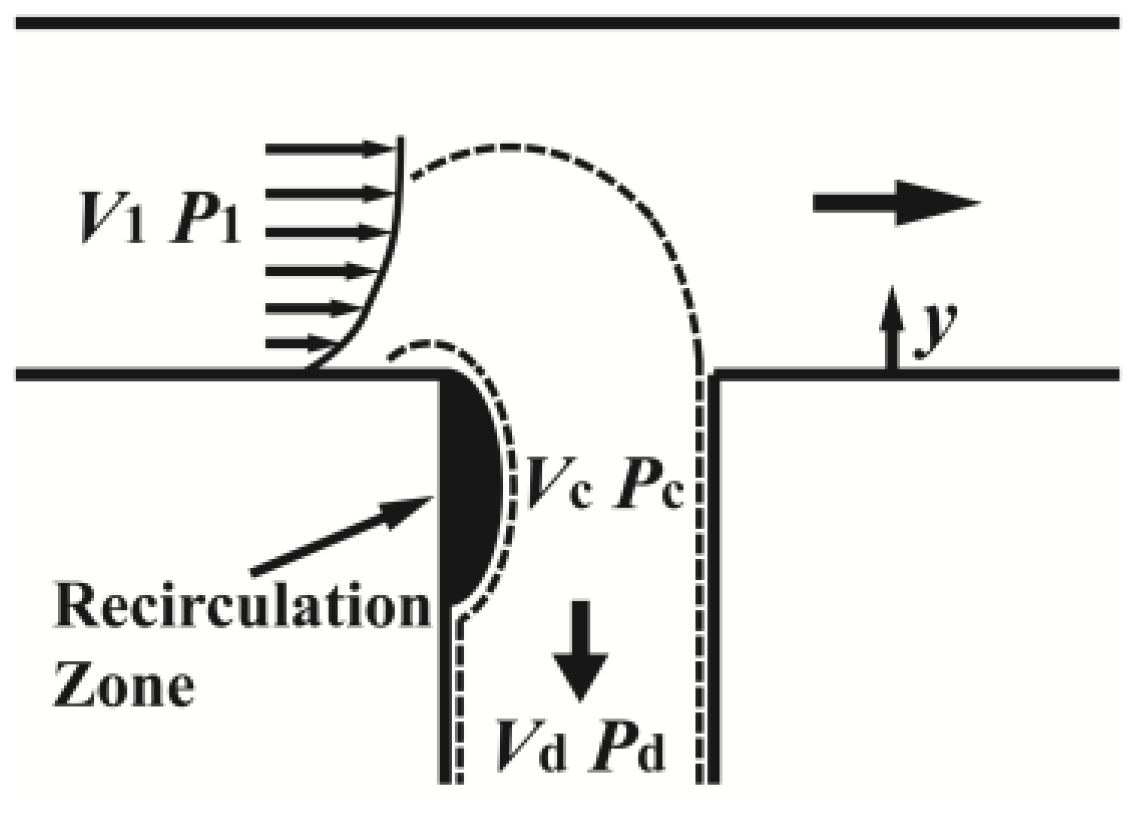
A notable phenomenon is that there exists inlet cross-flow as illustrated in Figure 11. The cross-flow causes flow separation at the leading edge of the leakage gap and the formation of a separation bubble if the gap length-to-width ratio is large enough. Flow separation has a direct influence on the flow area and the pressure recovery process down the recirculation zone and finally affects the discharge coefficient. To take into account the cross-flow factor, the nondimensional velocity ratio is defined and taken as a new independent variable of the discharge coefficient.
According to the above analysis, though the influencing factors on the discharge coefficient are diverse, they are still possible to be classified according to their physical natures. The real leakage flow differs from the ideal case mainly due to two points: There exists a separation bubble at the gap leading edge due to the local adverse pressure gradient and developing boundary layer along the gap wall, whereas for the ideal case there is no flow separation and the flow velocity is uniform perpendicular to the gap wall. The above two points result in the actual leakage rate being lower than the ideal value and bring about the necessity to introduce discharge coefficient. There are mainly three types of influencing factors which contribute to the differences between the real and ideal leakage flows: 1. Geometric factor, indicated with nondimensionalized gap length in which is the gap length and is the hydraulic diameter of the leakage gap; 2. gas motion parameter, indicated with nondimensionalized velocity ratio ; 3. gas state parameters including Reynolds number and Mach number, for the latter using pressure ratio instead for convenience.
For every major effect on the discharge coefficient, abundant analytical and empirical models have been proposed by researchers [29,31,32]. However, for wave rotor leakage flows, the discharge coefficient is influenced by various effects and the above models failed to be applied directly. McGreehan [33] has proposed a widely used correlation method for the major influencing factors which successfully predicts the combining effects on the discharge coefficient. In this paper, the method is modified to add the pressure ratio effect and neglect the corner radius effect. The discharge coefficient considering the combining effects of leakage flow Reynolds number, leakage gap length-to-width ratio, leakage gap inlet-to-outlet pressure ratio, and inlet cross-flow is expressed as follows:
First consider the effect of Reynolds number and establish the correlation with the discharge coefficient for sharp-edged orifices. McGreehan has adopted the correlation proposed by Miller and Kneisel [34] in the literature, i.e., Equation (21). The applicable scope of Equation (21) is which coincides with the leakage problem in this paper.
The influence of leakage gap length-to-width ratio on the discharge coefficient is considered using the correlation in Equation (22).
The weight factor in Equation (22) satisfies:
The hydraulic diameter and the Reynolds number in Equations (21)–(23) are defined respectively as:
In Equation (25), is the dynamic viscosity at the exit and is approximated using Sutherland’s Law.
To further consider the effect of leakage gap inlet-to-outlet pressure ratio, using the correlation proposed by Idris and Pullen [30]:
In Equation (26):
The effect of inlet cross-flow is considered using Equation (28).
In which:
Finally, giving the independent variables: u2, T2, p2, p0, pd, h, w, δ, l, the unknown variable p1 could be solved and all other flow variables relevant to the attenuated shock wave will be obtained.
7. Verification of the Leakage Loss Model and Attenuation Characteristics of the Reflected Shock Wave
7.1. Numerical Method for the Verification Model
Compared with other commercial solvers such as CFX, Fluent shows prominent capabilities for capturing moving shock waves and is suited to solve flow phenomena relevant to nonsteady shock waves. The numerical verification of the leakage loss model is performed using the density-based implicit solver in Fluent 12.1. The convective flux vectors of the flow control equations are discretized using AUSM (Advection Upwind Splitting Method) scheme. Third order MUSCL (Monotonic Upwind Scheme for Conservation Laws) interpolation is adopted in calculating the convective flux. Central difference scheme is used to discretize the viscous term. Second order implicit scheme is used to discretize the temporal term. The solving of turbulence is performed using Spalart-Allmaras one equation model. For the boundary treatments of the numerical model, no slip adiabatic wall and symmetry conditions are applied. For the computational domain discretization, a quadrilateral structured mesh is applied. For all verification cases, the conditon is satisfied. The working gas is considered as ideal gas and Sutherland’s law is used to calculate the dynamic viscosity. The calculation of constant pressure specific heat applies the piecewise polynomial method. The above numerical method has been verified comprehensively with experimental results in the literature [20].
For all the numerical verification cases, ideal flow parameters without leakage are set for the initial flow field. The initial reflected shock wave is located at the passage-port interface where leakage happens. Before the reflected shock wave crosses over the gap, the flow fields in the channel and the port are the same with that of the ideal case without leakage, so gases in the gap and the cavity should be kept stationary. Other flow parameters in the leakage gap and the cavity are kept the same with that in front of the reflected shock wave. The total simulation time is 0.28 ms. To be noted, the concerned flows and corresponding flow parameters are that between the reflected shock wave and the expansion waves; so the channel and the duct are prolonged to avoid wave reflections from the boundary during the simulation period.
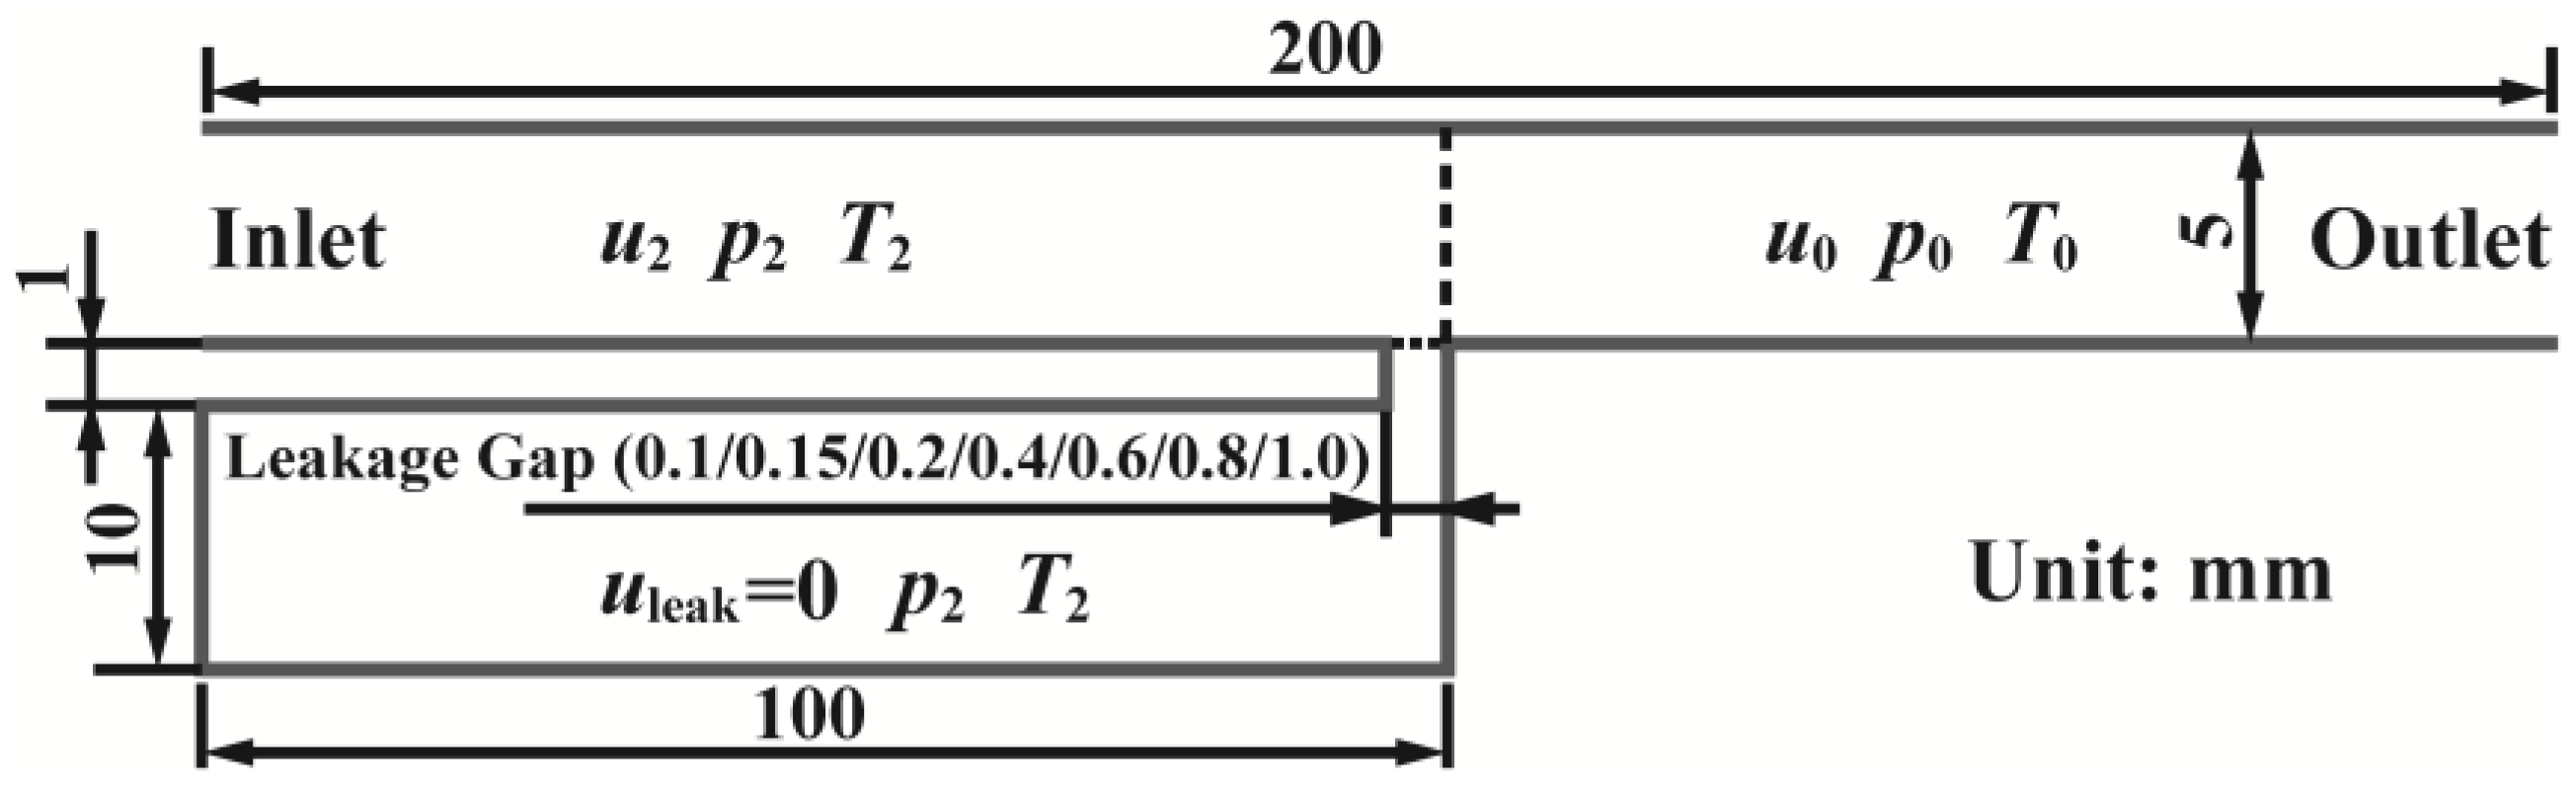
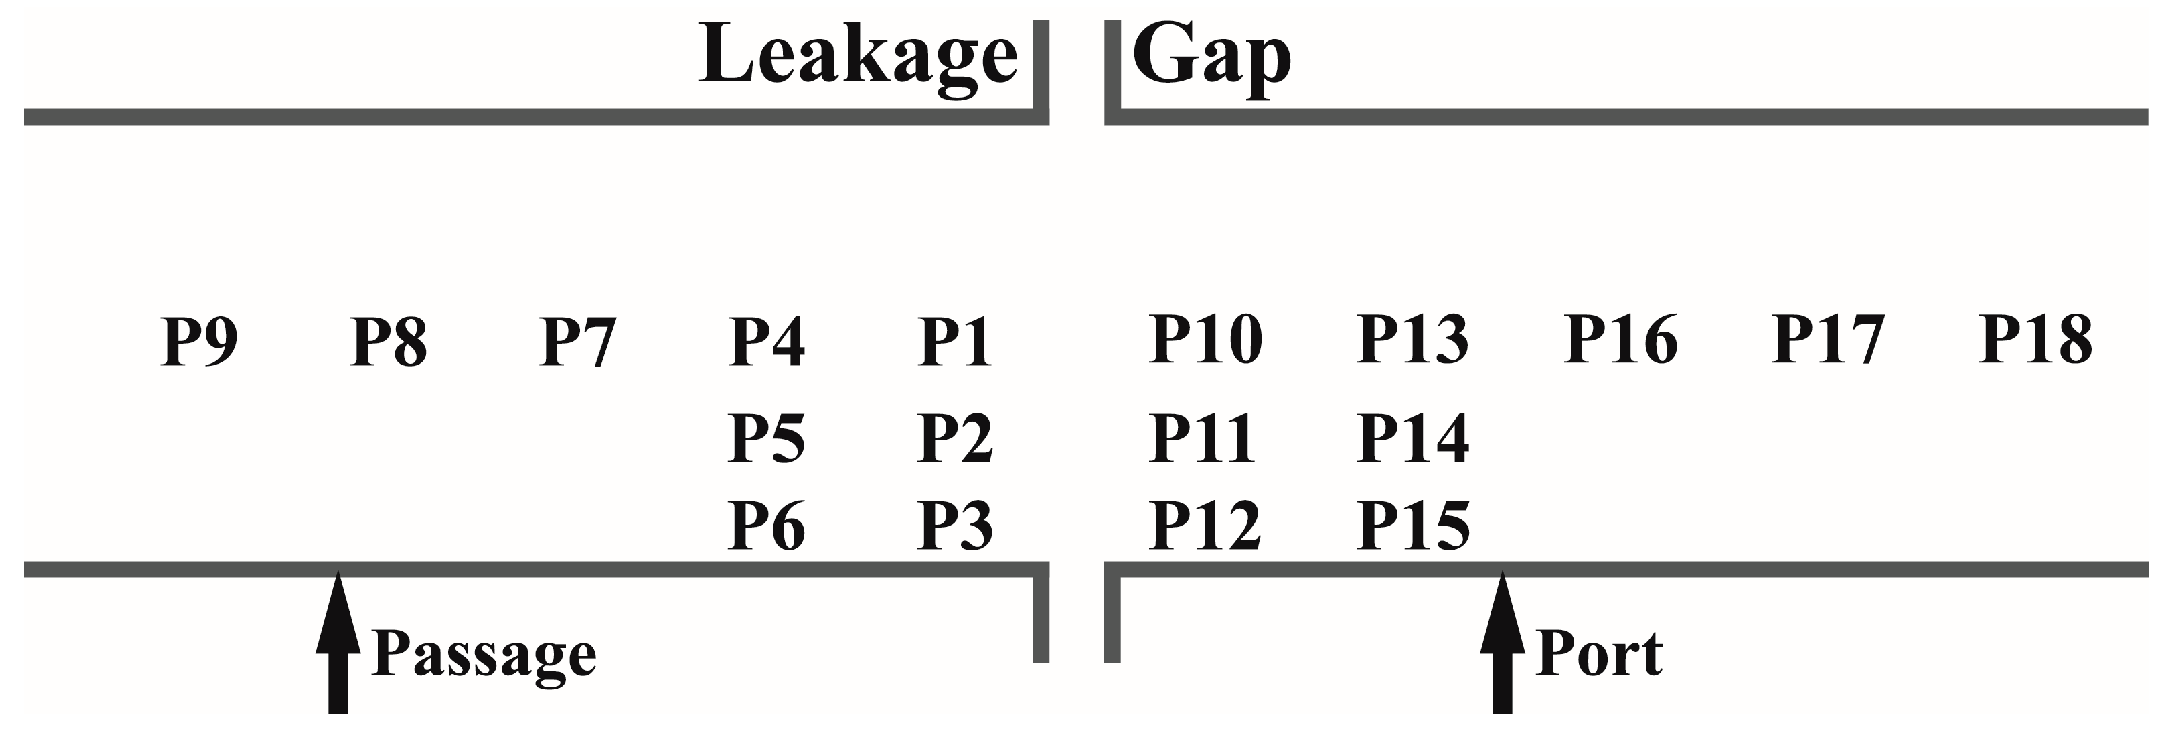
Part of the variable values in the model are set as follows: , , , , , , , , . To investigate the loss prediction accuracy of the analytical model in the range of flow parameter variations of wave rotors, the reflected shock wave strength and the leakage gap width are both modified. The pressure ratios of 1.2, 1.3, 1.4, 1.5 and 1.6 are selected and the gap widths of 0.1 mm, 0.15 mm, 0.2 mm, 0.4 mm, 0.6 mm, 0.8 mm and 1.0 mm are selected. The number of total cases is 35. The numerical verification model is given in Figure 12. No radial area-change effect is considered in this model. The distributions of the flow parameter monitors are illustrated in Figure 13.
To better illustrate the setup of the numerical model, one typical verification case is given in Figure 14. To be noted, the CFD simulations of the upper model without leakage in Figure 14 show nearly the same results with that of the theoretical calculations using classical shock wave relations. For convenience, both results of the CFD simulations and the analytical model with leakage are compared with that of the theoretical calculations.
7.2. Analysis of the CFD Results
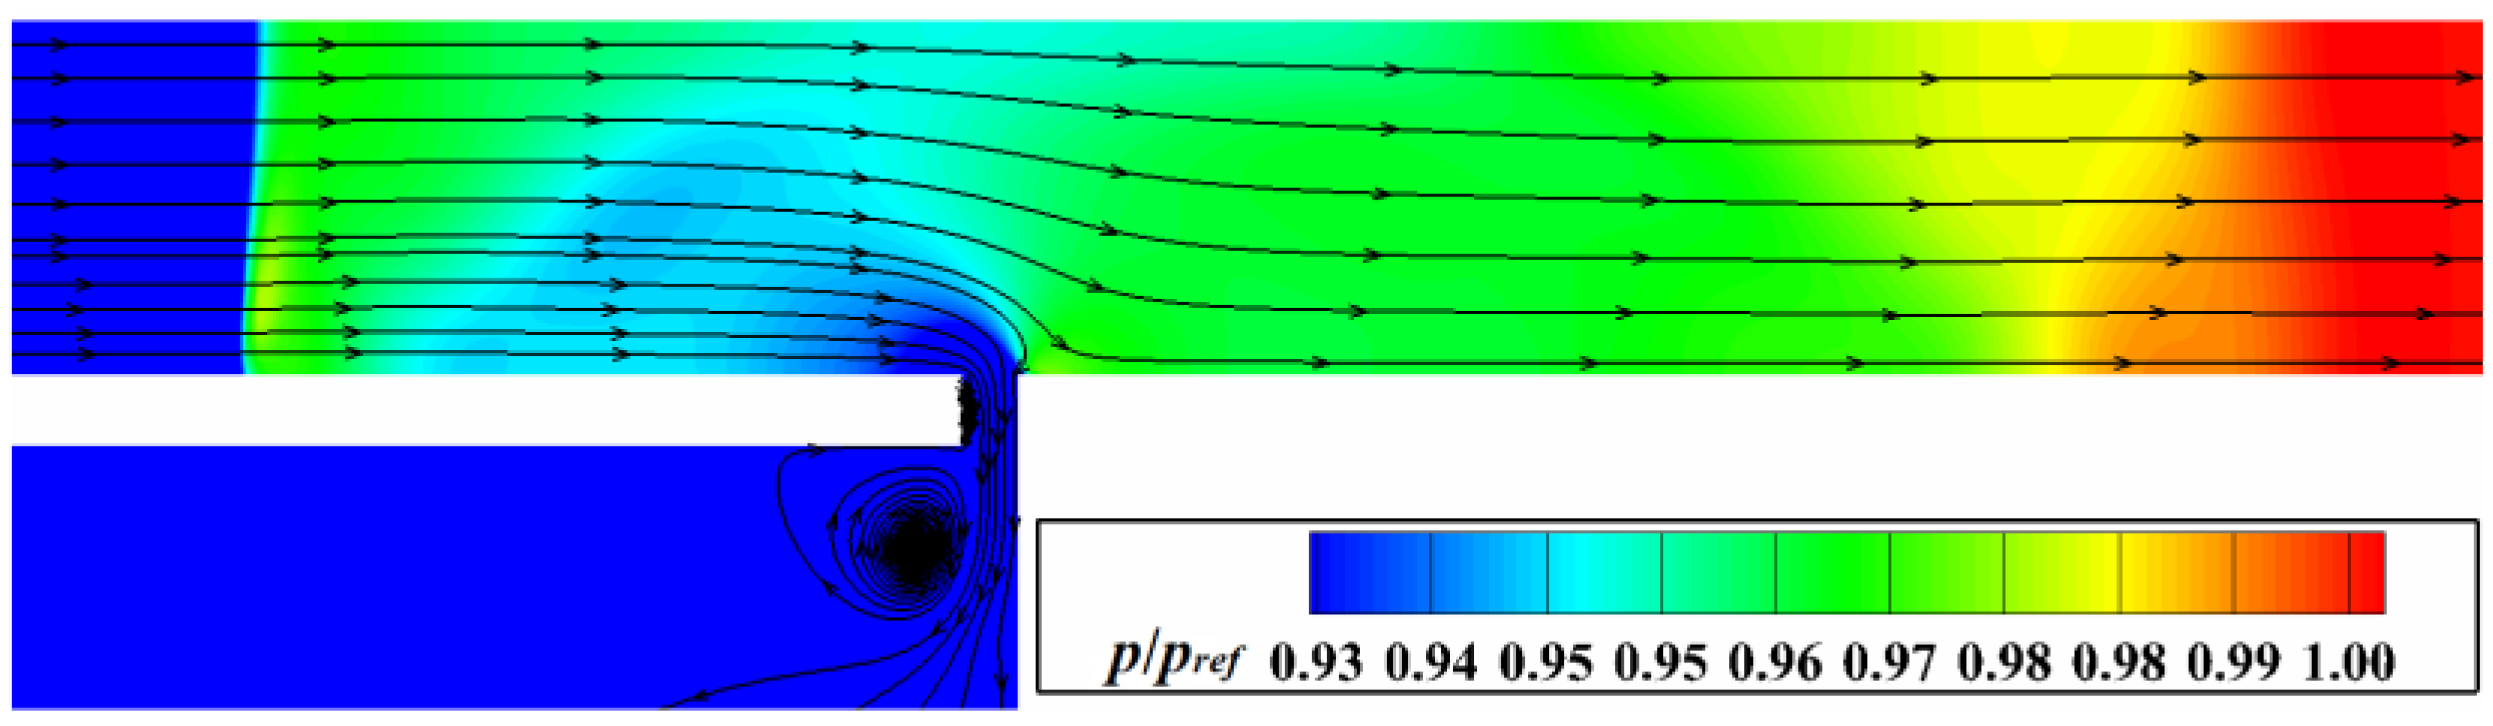
After detailed examination, it is found that the flow structures of all cases are generally the same. For clear discrimination of nonsteady waves, the case with the gap width of 0.8 mm and the pressure ratio of 1.5 is selected for which the leakage flows have a relatively strong influence on the main stream. Figure 15 gives the streamlines and pressure distribution at 0.04 ms. The pressure is nondimensionalized by the highest pressure in the fluid zone which is designated by . It is clear that the leakage at the gap generates nonsteady expansion waves propagating into the passage and the port which are generally two-dimensional and reflect between the walls. The ideal quasi-one dimensional flow is destroyed especially near the gap where the streamlines are bent. To be noticed, a separation bubble is generated in the gap which has a great influence on the discharge coefficient.
According to the above analysis, the shock wave attenuation mechanism and the assumptions made for the leakage loss model coincide well with the CFD results. To confirm this point, the entropy distribution at 0.30 ms as illustrated in Figure 16 is analyzed further. According to the assumptions as illustrated in Figure 8, an entropy discontinuity forms immediately after the incident shock reflects at the passage-port interface where leakage happens and propagates downstream into the port with the velocity of gas flows. The flow velocity in Figure 16 is about 50.2 m/s and the flow time is 0.30 ms; the entropy discontinuity should be at 0.115 m in the direction. As seen in Figure 16, the entropy distributions coincide with the above assumption whereas the discontinuity appears as a transition area due to the gradual mixing between gases.
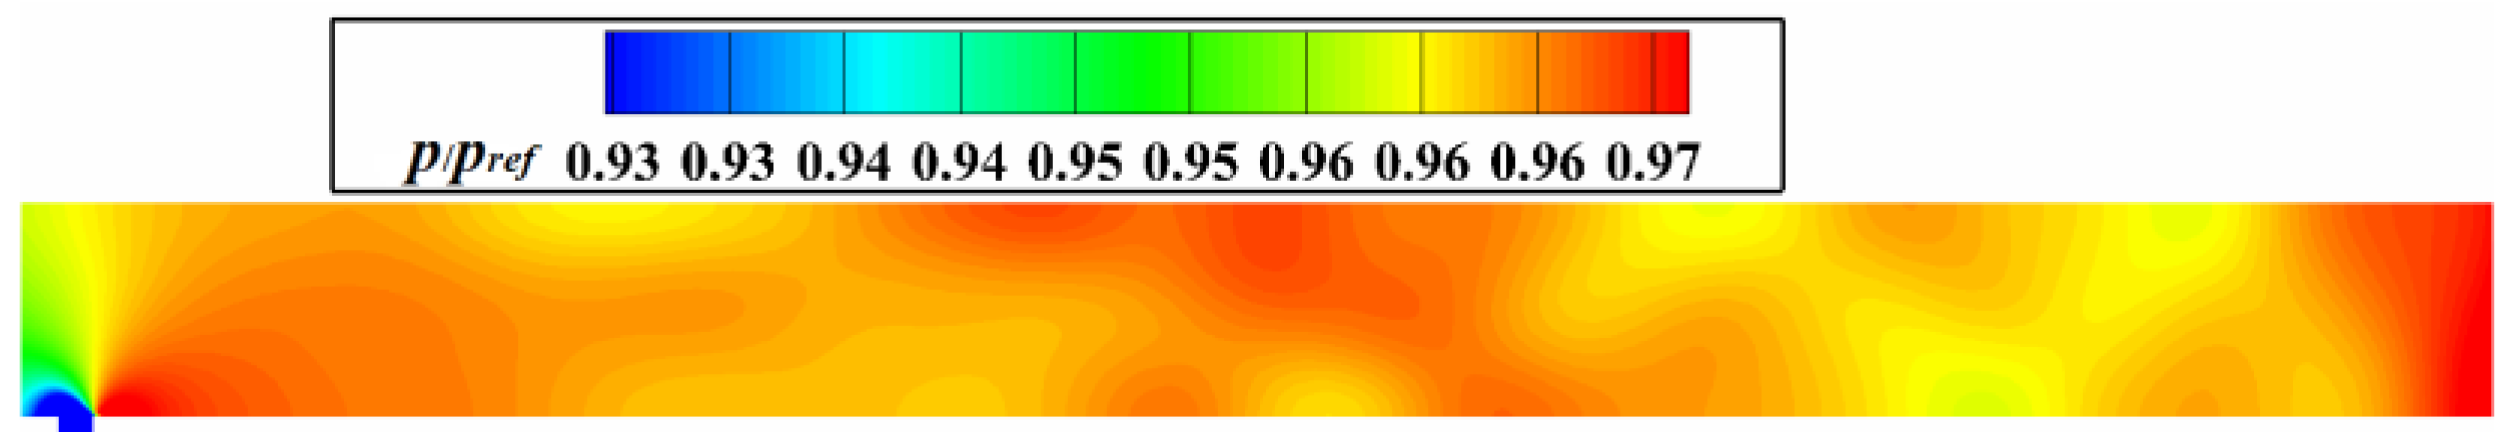
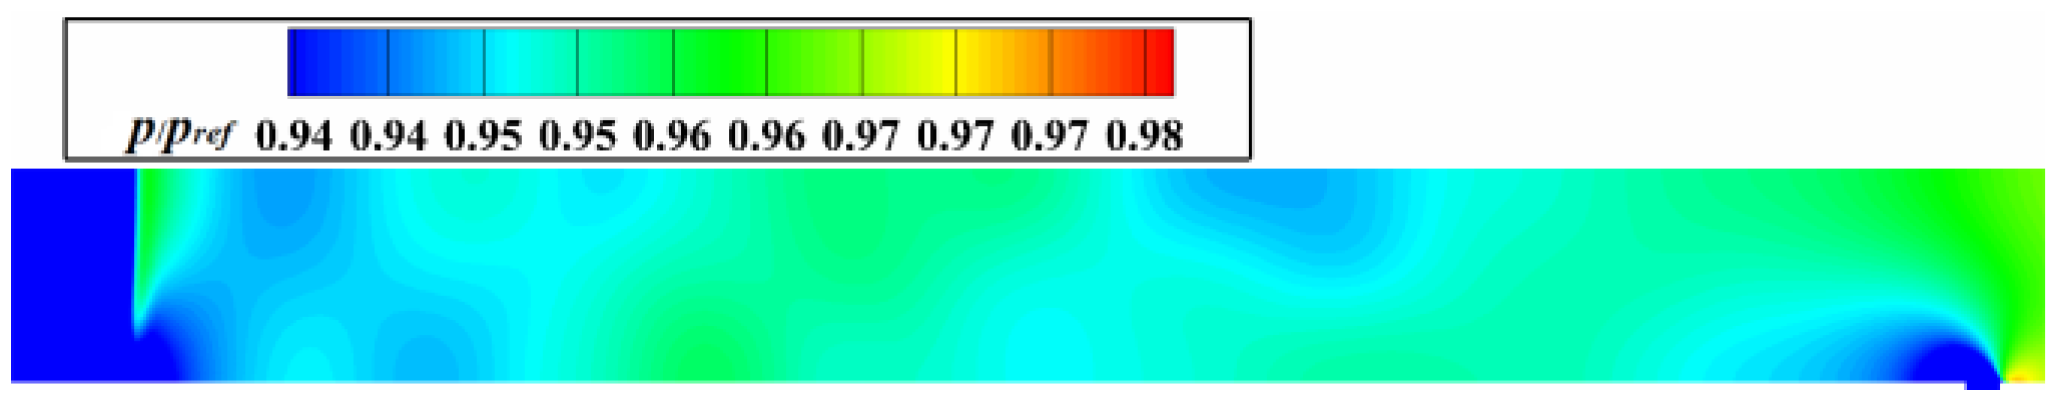
Figure 17 and Figure 18 give the pressure distributions in the port at 0.14 ms and in the passage at 0.16 ms respectively. Due to pressure oscillations in the cavity, the pressure distributions are not uniform. Weak compression and expansion waves reflecting between the walls are discernable. Though there exists pressure oscillations, the average value remains the same, as can be seen in the next section.
7.3. Attenuation Characteristics of the Reflected Shock And Discrepancies of the Model
The numerical verification of the loss model constitutes two steps: First, analyze the distribution law of flow parameters perpendicular to and parallel with the rotor passage; then select representative monitor points and compare the numerical results with that of the leakage loss model. The prediction results of the loss model are obtained using Fortran code. For the convenience of comparative analysis, the pressure attenuation magnitude is defined in Equation (30). Similarly, the definitions for temperature and flow velocity are given as: , . The relative leakage flow rate is defined in Equation (31), in which is the port flow rate behind the ideal reflected shock wave.
Numerical studies have found that there exists periodic oscillations of flow parameters including pressure, temperature and flow velocity in the channel due to the influence of leakage flows. The physical mechanism of oscillations have been investigated in detail in Reference [20]. According to the conclusions in Reference [20], since the cavity is only connected to the leakage gap, abrupt leakage flows into it will cause pressure in the cavity to rise slightly and generate weak compression waves into the channel; then the pressure in the cavity is lowered and expansion waves will be generated. As a result, there will be periodically emerging expansion and compression waves propagating from the leakage gap to the channel and the port. These periodic waves are relatively weak and reflect between the upper and lower walls of the channel and the port. As time goes by, flow parameter oscillations due to these periodic waves attenuate gradually; the oscillation cycle is also prolonged.
In a real wave rotor, to minimize leakage flows, the rotor cavity is sealed from the atmosphere; so if the rotor-stator gap is enlarged, there will be oscillations in rotor channels and stationary ports.
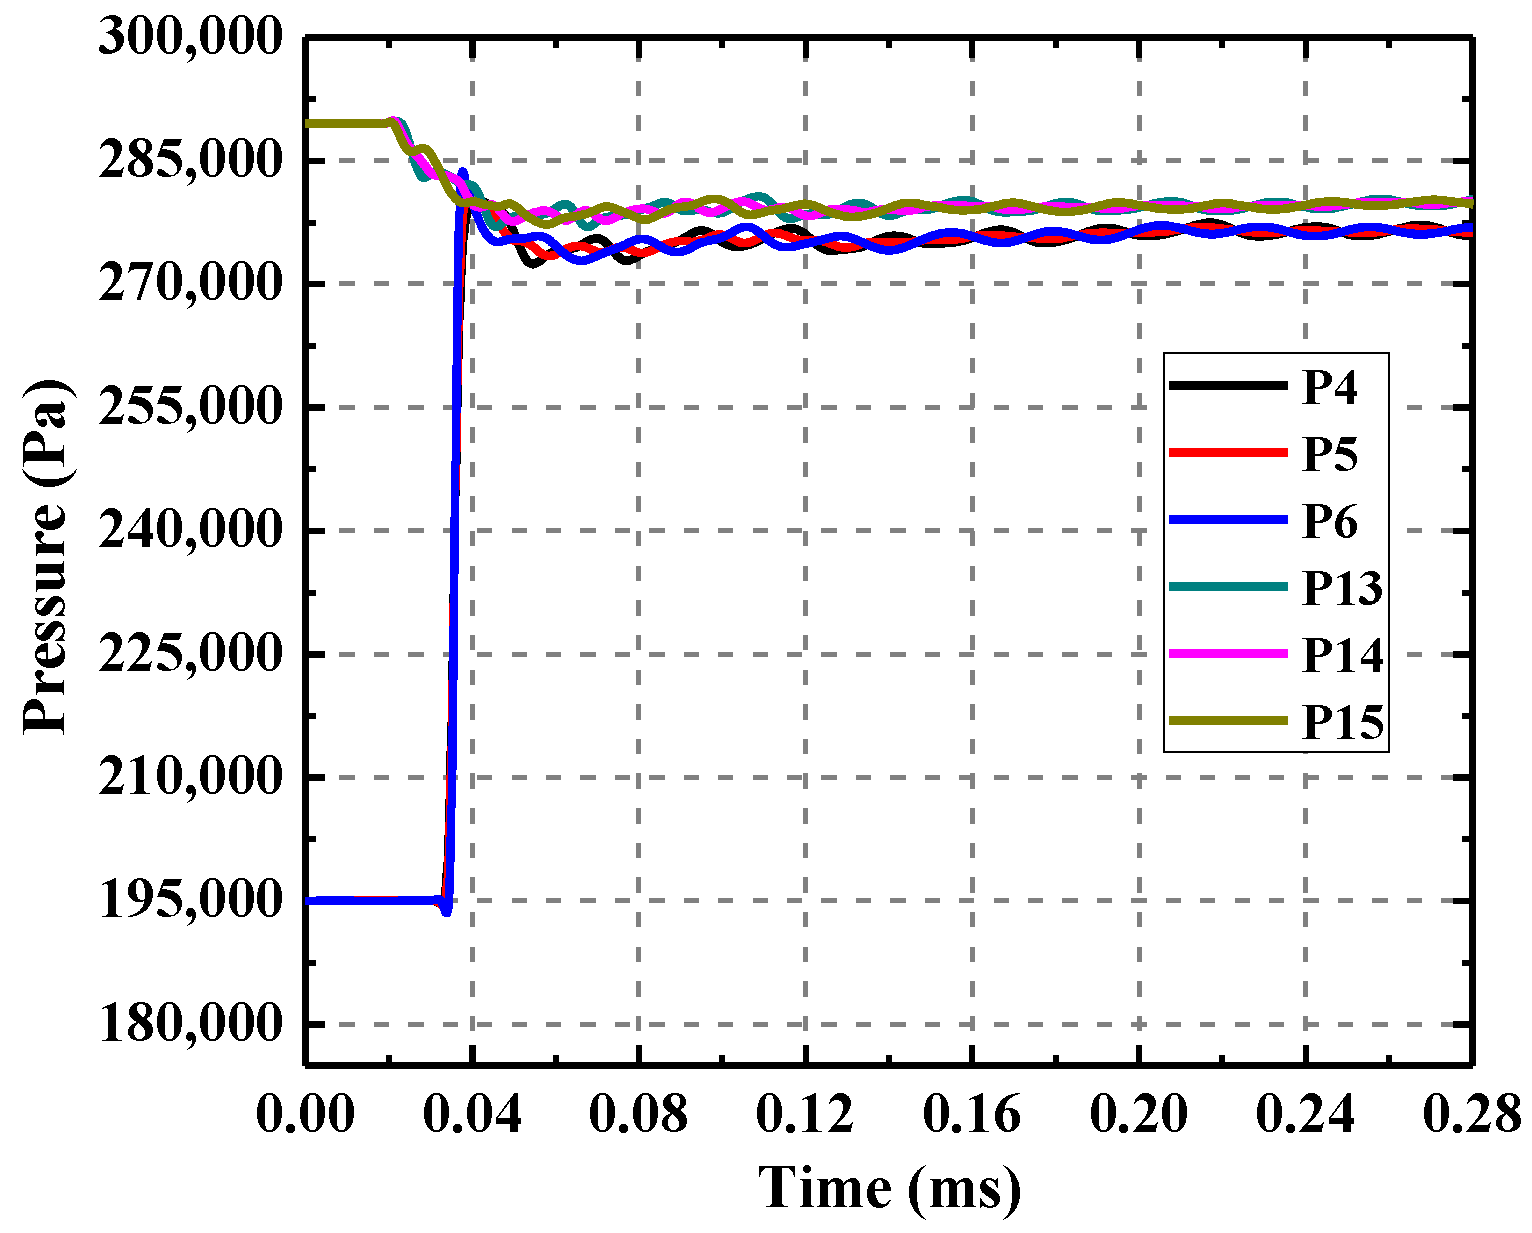
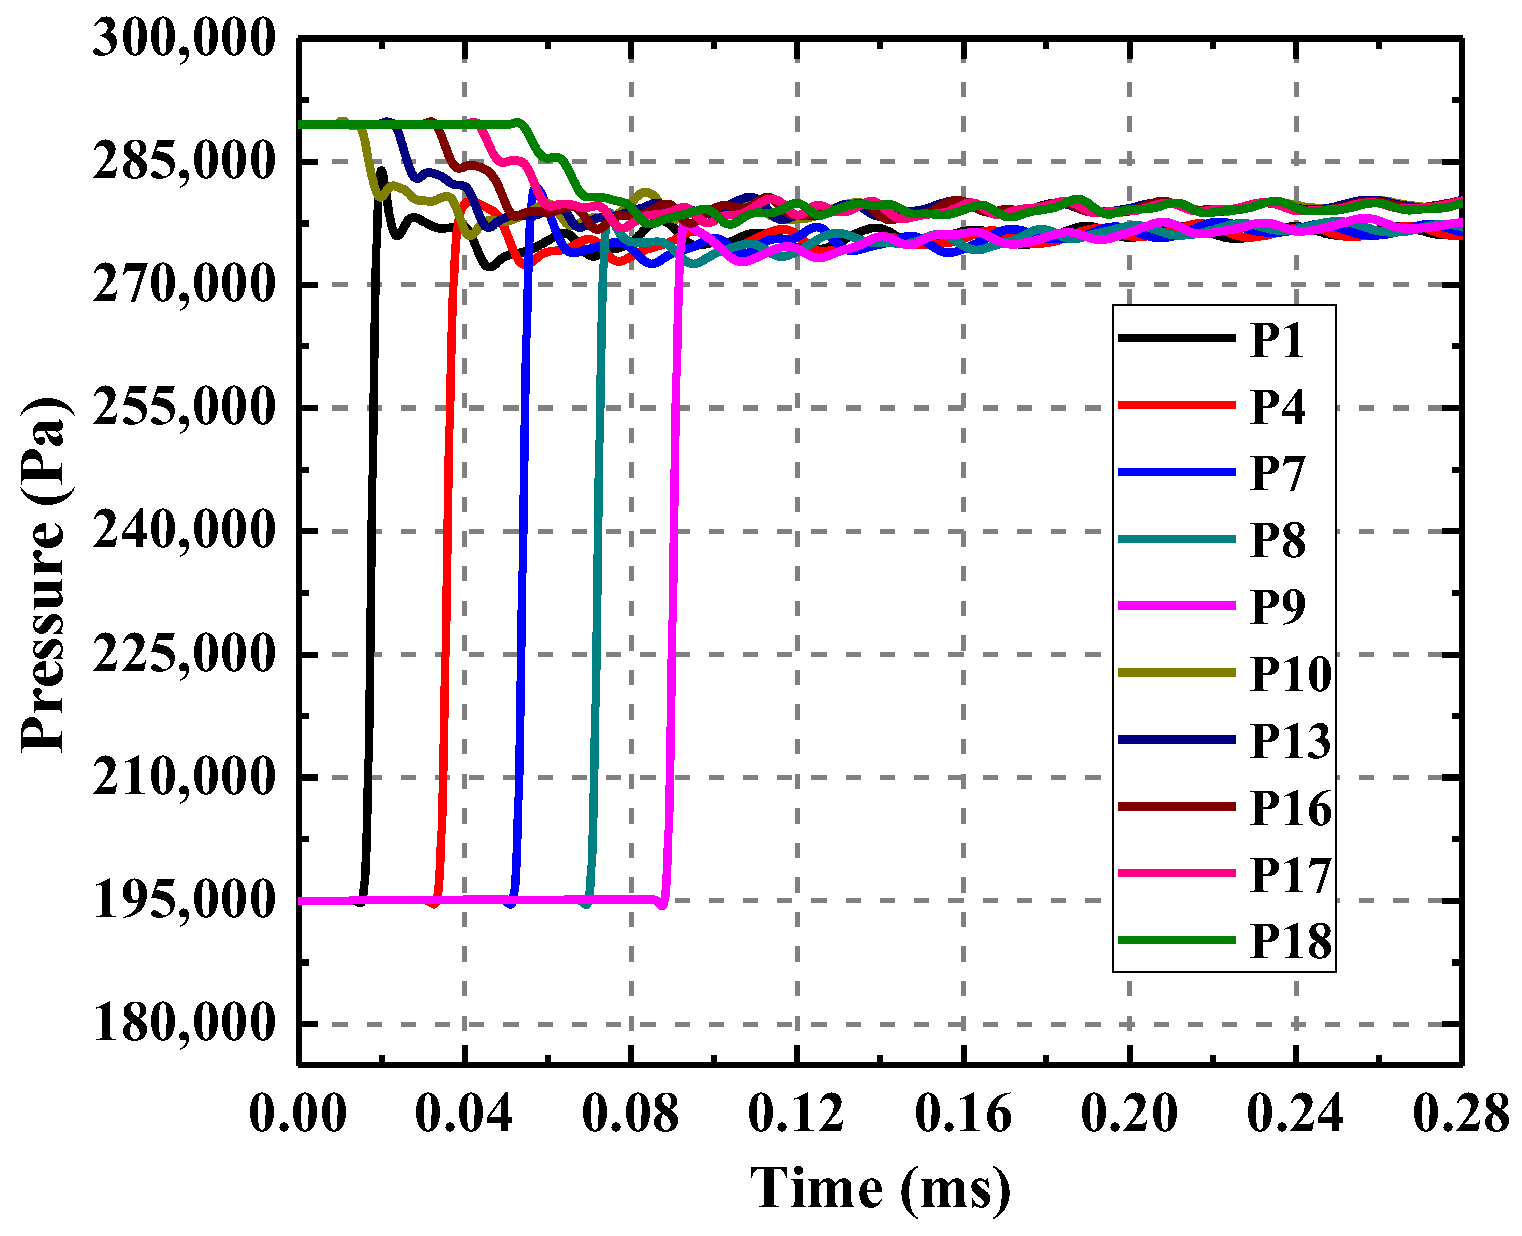
The pressure-time curves of the monitor points in the passage and the port are illustrated in Figure 19 and Figure 20. It could be found that though the oscillation magnitude and phase vary at different locations, the time-averaged values are generally the same for each flow parameter. The flows in the channel and the port could be treated as one-dimensional.
Further investigations have found that leakage causes the reflected shock strength to attenuate, and as a result, the post-shock pressure is lower than the ideal value without leakage; simultaneously, nonsteady expansion waves are generated at the passage-port interface which propagate downstream into the port. To be noted, the pressure behind the expansion waves is slightly higher than the pressure behind the reflected shock wave. The above phenomena are coincident with the theoretical assumptions of the leakage loss model in this paper.
Selecting the CFD simulation results of pressure, temperature and flow velocity at P1 from 0.1 ms to 0.2 ms for all cases and performing time averaging operations, the time-averaged value of each flow parameter is obtained and compared with the prediction result of the leakage loss model.
The CFD results and the model prediction results of the reflected shock attenuation magnitude with the leakage gap width and the ideal reflected shock strength are given in Figure 21 and Figure 22, respectively.
It can be seen from the figures that on the whole the analytic loss model coincides well with the CFD model and has successfully predicted the tendencies of the variation of the shock strength attenuation magnitude at different gap width and different ideal shock strength. Further investigations show that with the increasing of gap width and ideal shock strength, the attenuation of the shock becomes slower; furthermore, the variation of the shock attenuation level with the corresponding ideal shock strength is less relevant than with the gap width. For the case of gap width of 1.0 mm and shock pressure ratio of 1.6, the attenuation magnitude reaches 6% compared with the case without leakage. When the gap width is around 0.8 mm and the shock pressure ratio is around 1.2, the prediction error of the model reaches its maximum.
The tendencies of temperature variations are similar with pressure except that the attenuation magnitude is smaller than that of pressure on the whole. For the case of the gap width of 1.0 mm and the ideal shock pressure ratio of 1.6, the post-shock temperature decreases about 1.9%.
The tendencies of the variation of the post-shock velocity increasing magnitude with the shock pressure ratio are illustrated in Figure 23. Different from the cases of pressure and temperature, the flow velocity is more affected by leakage flows. With the increasing of the shock pressure ratio, the flow velocity increases more and more rapidly. For the case of the pressure ratio of 1.6 and the gap width of 1.0mm, compared with the ideal case without leakage, the post-shock flow velocity increases by 45%.
The variation of the relative leakage flow rate with the gap width is given in Figure 24. Since the reflected shock strength is relatively weak in the wave rotor applications, the cases of the shock pressure ratio of 1.6 are not practical and are ignored here. For other cases, it is found that the reflected shock strength has a profound influence on mass defect due to leakage. Strict leakage control is needed when a wave rotor is designed with strong shock waves. For most cases, a leakage gap width smaller than 0.2 mm is preferred.
Through detailed numerical investigations, it is found that the leakage-attributed shock wave loss model predicts reliably the flow parameter variations under different flow conditions. The model could be applied to the evaluation of wave rotor leakage losses and the preliminary analytical design work.
8. Conclusions
In this paper, the leakage-attributed shock wave attention problem which possesses an explicit engineering application background and basic theoretical value is studied in detail using theoretical analysis combined with a numerical method. The main conclusions could be drawn in the following aspects:
(1) The leakage loss evaluation method under nonsteady flow conditions is discussed and proposed.
(2) Starting from the engineering problem of wave rotor leakage, a special initial-boundary value problem is proposed, i.e., superposing new flow parameter discontinuities due to leakage on the initial discontinuities corresponding to the stably propagating one-dimensional nonsteady shock wave.
(3) The physical mechanism of nonsteady shock wave attenuation is analyzed; the appropriate discontinuity decomposition method is proposed, i.e., the initial discontinuity is decomposed into the backward propagating attenuated shock wave, the zero-dimensional leakage flow, the entropy discontinuity, and the forward propagating expansion waves.
(4) Combined with the conventional discharge coefficient empirical correlations developed for steady flows, the leakage-attributed nonsteady shock loss model is established.
(5) The shock wave attenuation characteristics under different leakage gap widths and reflected shock strengths are obtained.
Author Contributions
C.L. proposed the leakage attributed shock wave attenuation mechanism and the corresponding loss model, conducted the mathematical deduction, performed the CFD verification and wrote the paper. H.L. is the wave rotor project administrator, proposed and discussed the relevant problems in wave rotor analytical design field and provides financial support for the research project.
Funding
This research received no external funding.
Acknowledgments
The authors would like to acknowledge the support of National Key Laboratory of Science and Technology on Aero-Engine Aero-thermodynamics, Beihang University for CFD simulation software packages and computing clusters.
Conflicts of Interest
The authors declare no conflict of interest. The funders had no role in the design of the study; in the collection, analyses, or interpretation of data; in the writing of the manuscript, and in the decision to publish the results.
References
- Akbari, P.; Müller, N. Performance Improvement of Small Gas Turbines Through Use of Wave Rotor Topping Cycles. In Proceedings of the ASME Turbo Expo 2003 International Joint Power Generation Conference, GT 2003-38772, Atlanta, GA, USA, 16–19 June 2003. [Google Scholar]
- Welch, G.E.; Jones, S.M.; Paxson, D.E. Wave Rotor-Enhanced Gas Turbine Engines. ASME J. Eng. Gas. Turb. Power 1995, 119, 469–477. [Google Scholar] [CrossRef]
- Akbari, P.; Nalim, M.R. Review of Recent Developments in Wave Rotor Combustion Technology. J. Propul. Power 2009, 25, 833–844. [Google Scholar] [CrossRef] [Green Version]
- Lenoble, G.; Ogaji, S. Performance Analysis and Optimization of a Gas Turbine Cycle Integrated with an Internal Combustion Wave Rotor. Proc. Inst. Mech. Eng. Part A J. Power Energy 2010, 224, 889–900. [Google Scholar] [CrossRef]
- Nalim, M.R.; Jules, K. Pulse Combustion and Wave Rotors for High-speed Propulsion Engines. In Proceedings of the 8th AIAA International Space Planes and Hypersonic Systems and Technologies Conference, Norfolk, VA, USA, 27–30 April 1998. [Google Scholar]
- Pohořelský, L.; Sané, P.; Rozsas, T.; Müller, N. Wave Rotor Design Procedure for Gas Turbine Enhancement. In Proceedings of the ASME Turbo Expo 2008: Power for Land, Sea and Air, GT 2008-51354, Berlin, Germany, 9–13 June 2008. [Google Scholar]
- Elharis, T.M.; Wijeyakulasuriya, S.D.; Nalim, M.R. Wave Rotor Combustor Aerothermodynamic Design and Model Validation based on Initial Testing. In Proceedings of the 46th AIAA/ASME/SAE/ASEE Joint Propulsion Conference & Exhibit, AIAA 2010-7041, Nashville, TN, USA, 25–28 July 2010. [Google Scholar]
- Materano, G.; Savill, M. Preliminary Design of a Double Expansion Through Flow Wave Rotor: Thermal and Gas Dynamic Analysis. In Proceedings of the ASME Turbo Expo 2013: Turbine Technical Conference and Exposition, GT 2013-94987, San Antonio, Texas, USA, 3–7 June 2013. [Google Scholar]
- McClearn, M.J.; Polanka, M.D.; Mataczynski, M.R.; Schauer, F.R.; Paxson, D.E. The Design of a Small-Scale Wave Rotor for Use as a Modified Brayton-Cycle Engine. In Proceedings of the 54th AIAA Aerospace Sciences Meeting, San Diego, CA, USA, 4–8 January 2016. [Google Scholar] [CrossRef]
- Lapp, K.P.; Polanka, M.D.; McClearn, M.J.; Hoke, J.L.; Paxson, D.E. Design and Testing of a Micro-Scale Wave Rotor System. In Proceedings of the 53rd AIAA/SAE/ASEE Joint Propulsion Conference, Atlanta, GA, USA, 10–12 July 2017. [Google Scholar] [CrossRef]
- Liu, H.X.; Chan, S.N. Mass-based Design and Optimization of Wave Rotors for Gas Turbine Engine Enhancement. Shock Waves 2017, 27, 313–324. [Google Scholar] [CrossRef]
- Chan, S.N.; Liu, H.X. Wave Rotor Design Method with Three Steps Including Experimental Validation. J. Eng. Gas Turbines Power 2018, 140, 111201. [Google Scholar] [CrossRef]
- Pekkan, K.; Nalim, M.R. Control of Fuel and Hot-Gas Leakage in a Stratified Internal Combustion Wave Rotor. In Proceedings of the 38th AIAA/ASME/SAE/ASEE Joint Propulsion Conference & Exhibit, Indianapolis, IN, USA, 7–10 July 2002. [Google Scholar]
- Deng, S.; Okamoto, K.; Teramoto, S. Numerical Investigation of Heat Transfer Effects in Small Wave Rotor. J. Mech. Sci. Technol. 2015, 29, 939–950. [Google Scholar] [CrossRef]
- Hu, D.P.; Li, R.F.; Liu, P.Q.; Zhao, J.Q. The Loss in Charge Process and Effects on Performance of Wave Rotor Refrigerator. Int. J. Heat Mass Tran. 2016, 100, 497–507. [Google Scholar] [CrossRef]
- Jagannath, R.R.; Bane, S.P.M.; Feyz, M.E.; Nalim, M.R. Assessment of Incidence Loss and Shaft Work Production for Wave Rotor Combustor with Non-Axial Channels. In Proceedings of the 55th AIAA Aerospace Sciences Meeting, Grapevine, TX, USA, 9–13 January 2017. [Google Scholar]
- Akbari, P.; Nalim, M.R.; Donovan, E.S.; Snyder, P.H. Leakage Assessment of Pressure-Exchange Wave Rotors. J. Propul. Power 2008, 24, 732–740. [Google Scholar] [CrossRef] [Green Version]
- Wilson, J. An Experimental Determination of Losses in a Three-Port Wave Rotor. ASME J. Eng. Gas Turb. Power 1998, 120, 833–842. [Google Scholar] [CrossRef]
- Paxson, D.E. Comparison Between Numerically Modeled and Experimentally Measured Wave-Rotor Loss Mechanisms. J. Propul. Power 1995, 11, 908–914. [Google Scholar] [CrossRef]
- Liu, C.Y.; Liu, H.X. Mechanism of Nonsteady Leakage Flow of Wave Rotors. Acta Aeronautica et Astronautica Sinica 2017, 38, 91–104. [Google Scholar] [CrossRef]
- Matsutomi, Y.; Meyer, S.E.; Wijeyakulasuriya, S.; Izzy, Z.; Nalim, M.R.; Shimo, M.; Kowalkowski, M.; Snyder, P.H. Experimental Investigation on the Wave Rotor Constant Volume Combustor. In Proceedings of the 46th AIAA/ASME/SAE/ASEE Joint Propulsion Conference & Exhibit, AIAA 2010–7043, Nashville, TN, USA, 25–28 July 2010. [Google Scholar]
- Nalim, M.R.; Snyder, P.H.; Kowalkowski, M. Experimental Test, Model Validation, and Viability Assessment of a Wave-Rotor Constant-Volume Combustor. J. Propul. Power 2017, 33, 163–175. [Google Scholar] [CrossRef] [Green Version]
- Akbari, P.; Nalim, M.R.; Müller, N. A Review of Wave Rotor Technology and Its Applications. ASME J. Eng. Gas Turb. Power 2006, 128, 717–735. [Google Scholar] [CrossRef] [Green Version]
- Li, J.Z.; Gong, E.L.; Yuan, L.; Li, W.; Zhang, K.C. Experimental Investigation on Pressure Rise Characteristics in an Ethylene Fuelled Wave Rotor Combustor. Energy Fuels 2017, 31, 10165–10177. [Google Scholar] [CrossRef]
- Spring, P. Modeling and Control of Pressure-Wave Supercharged Engine Systems. Ph.D. Thesis, Swiss Federal Institute of Technology, Zurich, Switzerland, 2006. [Google Scholar]
- Toro, E.F. Riemann Solvers and Numerical Methods for Fluid Dynamics, 3rd ed.; Spring-Verlag: Berlin, Germany, 2009; pp. 41–236. ISBN 978-3-662-03492-7. [Google Scholar]
- Akbari, P.; Müller, N. Gas Dynamic Design Analysis of Charging Zone for Reverse-Flow Pressure Wave Superchargers. In Proceedings of the ICES03, 2003 Spring Technical Conference of the ASME Internal Combustion Engine Division, ICES2003-690, Salzburg, Austria, 11–14 May 2003. [Google Scholar]
- Hüning, M. Comparison of Discharge Coefficient Measurements and Correlations for Orifices with Cross-Flow and Rotation. ASME J. Turbomach 2010, 132, 031017. [Google Scholar] [CrossRef]
- Lichtarowicz, A.; Duggins, R.K.; Markland, E. Discharge Coefficients for Incompressible Non-Cavitating Flow Through Long Orifices. Proc. Inst. Mech. Eng. Part C J. Mech. Eng. Sci. 1965, 7, 210–219. [Google Scholar] [CrossRef]
- Idris, A.; Pullen, K.R. Correlations for the Discharge Coefficient of Rotating Orifices based on the Incidence Angle. Proc. Inst. Mech. Eng. Part A J. Power Energy 2005, 219, 333–352. [Google Scholar] [CrossRef]
- Strakey, P.A.; Talley, D.G. The Effect of Manifold Cross-Flow on the Discharge Coefficient of Sharp-Edged Orifices. Atomization Sprays 1998, 9, 34. [Google Scholar] [CrossRef]
- Yu, B.; Fu, P.F.; Zhang, T.; Zhou, H.C. The Influence of Back Pressure on the Flow Discharge Coefficients of Plain Orifice Nozzle. Int. J. Heat Fluid Flow 2013, 44, 509–514. [Google Scholar] [CrossRef]
- McGreehan, W.F.; Schotsch, M.J. Flow Characteristics of Long Orifices with Rotation and Corner Radiusing. ASME J. Turbomach 1988, 110, 213–217. [Google Scholar] [CrossRef]
- Miller, R.W.; Kneisel, O. A Comparison between Orifice and Flow Nozzle Laboratory Data and Published Coefficients. ASME J. Fluids Eng. 1974, 96, 139–149. [Google Scholar] [CrossRef]
Figure 1.
Two-dimensional illustration of high pressure part wave diagram of the wave rotor cycle.

Figure 2.
Illustration of wave rotor leakage in radial direction.

Figure 3.
Selection of the plane for the analytical model and the 2-D numerical model.

Figure 4.
Selection of the analytical model for the study of reflected shock wave attenuation in wave rotors.
Figure 4.
Selection of the analytical model for the study of reflected shock wave attenuation in wave rotors.

Figure 5.
(a) Flow parameter matching relations without leakage of the leakage attributed nonsteady shock wave loss model; (b) flow parameter matching process with the leakage of the model; and (c) flow parameter matching relations at the stable state with the leakage of the model.
Figure 5.
(a) Flow parameter matching relations without leakage of the leakage attributed nonsteady shock wave loss model; (b) flow parameter matching process with the leakage of the model; and (c) flow parameter matching relations at the stable state with the leakage of the model.

Figure 6.
Assessment of inlet total pressure loss.

Figure 7.
Leakage loss assessment.

Figure 8.
Control volume selection for the establishment of the leakage flow equation.

Figure 9.
Illustration of sharp-edged orifice jet and nozzle jet.

Figure 10.
Influence of the leakage pressure ratio on the discharge coefficient.

Figure 11.
Illustration of leakage with inlet cross-flow.

Figure 12.
Verification model of the leakage-attributed shock wave losses.

Figure 13.
Distributions of the flow parameter monitors.

Figure 14.
Initial and boundary conditions for one typical verification case.

Figure 15.
Streamlines and pressure distribution at 0.04 ms for the case of gap width of 0.8 mm, pressure ratio of 1.5.
Figure 15.
Streamlines and pressure distribution at 0.04 ms for the case of gap width of 0.8 mm, pressure ratio of 1.5.

Figure 16.
Entropy distribution at 0.30 ms for the case of gap width of 0.8 mm, pressure ratio of 1.5.
Figure 16.
Entropy distribution at 0.30 ms for the case of gap width of 0.8 mm, pressure ratio of 1.5.

Figure 17.
Pressure distribution in the port at 0.14 ms for the case of gap width of 0.8 mm, pressure ratio of 1.5.
Figure 17.
Pressure distribution in the port at 0.14 ms for the case of gap width of 0.8 mm, pressure ratio of 1.5.

Figure 18.
Pressure distribution in the passage at 0.16 ms for the case of gap width of 0.8 mm, pressure ratio of 1.5.
Figure 18.
Pressure distribution in the passage at 0.16 ms for the case of gap width of 0.8 mm, pressure ratio of 1.5.

Figure 19.
Pressure-time curves of the monitor points perpendicular to the passage walls.

Figure 20.
Pressure-time curves of the monitor points parallel with the passage walls.

Figure 21.
Variation of the attenuation magnitude of the reflected shock pressure ratio with the leakage gap width.
Figure 21.
Variation of the attenuation magnitude of the reflected shock pressure ratio with the leakage gap width.

Figure 22.
Variation of the attenuation magnitude of the reflected shock pressure ratio with the ideal shock strength.
Figure 22.
Variation of the attenuation magnitude of the reflected shock pressure ratio with the ideal shock strength.

Figure 23.
Variation of the increasing magnitude of the reflected shock velocity ratio with the ideal shock strength.
Figure 23.
Variation of the increasing magnitude of the reflected shock velocity ratio with the ideal shock strength.

Figure 24.
Variation of the relative leakage flow rate with the gap width.

© 2018 by the authors. Licensee MDPI, Basel, Switzerland. This article is an open access article distributed under the terms and conditions of the Creative Commons Attribution (CC BY) license (http://creativecommons.org/licenses/by/4.0/).
Share and Cite
MDPI and ACS Style
Liu, C.; Liu, H. Nonsteady Shock Wave Attenuation Due to Leakage. Energies 2018, 11, 3275. https://doi.org/10.3390/en11123275
AMA Style
Liu C, Liu H. Nonsteady Shock Wave Attenuation Due to Leakage. Energies. 2018; 11(12):3275. https://doi.org/10.3390/en11123275
Chicago/Turabian StyleLiu, Chenyuan, and Huoxing Liu. 2018. "Nonsteady Shock Wave Attenuation Due to Leakage" Energies 11, no. 12: 3275. https://doi.org/10.3390/en11123275
Note that from the first issue of 2016, this journal uses article numbers instead of page numbers. See further details here.