One-Dimensional Simulation of Synergistic Desulfurization and Denitrification Processes for Electrostatic Precipitators Based on a Fluid-Chemical Reaction Hybrid Model


Abstract
:1. Introduction
2. Model Description
2.1. Governing Equations
2.2. Electron Collision and Chemical Kinetic Model
2.2.1. Electron Collision Kinetic Model
2.2.2. Chemical Kinetic Model
2.2.3. Collision Reactions at the Electrode Surface
2.3. Boundary Conditions
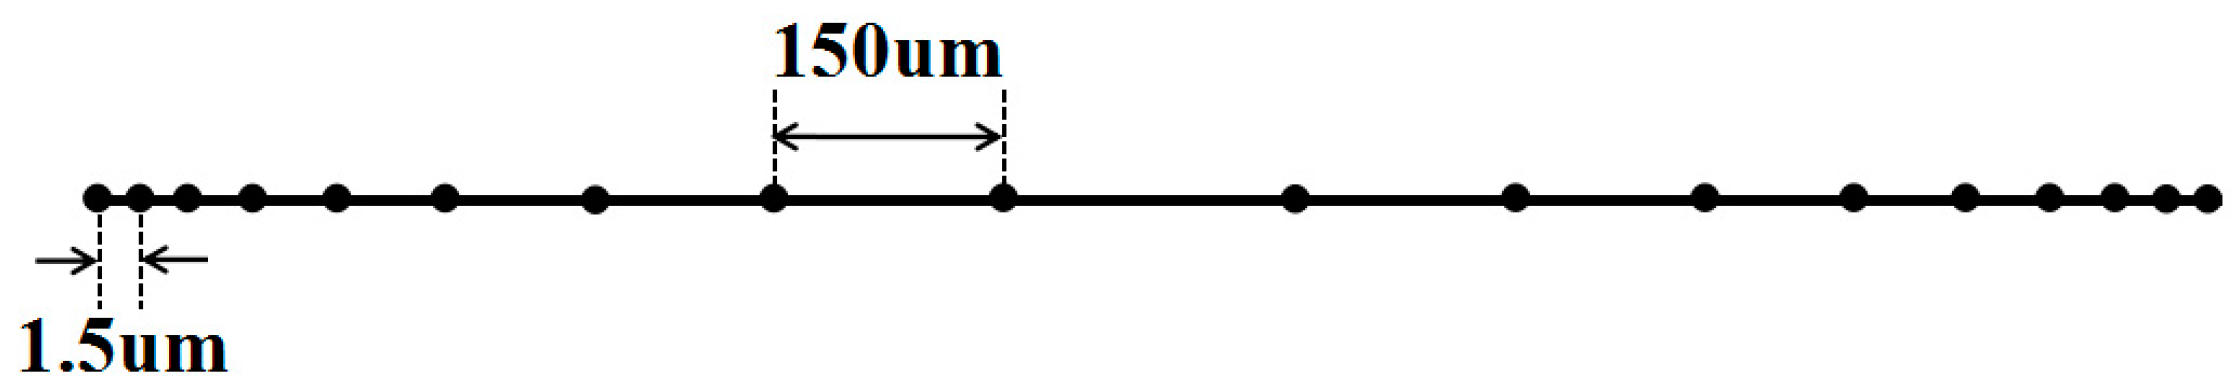
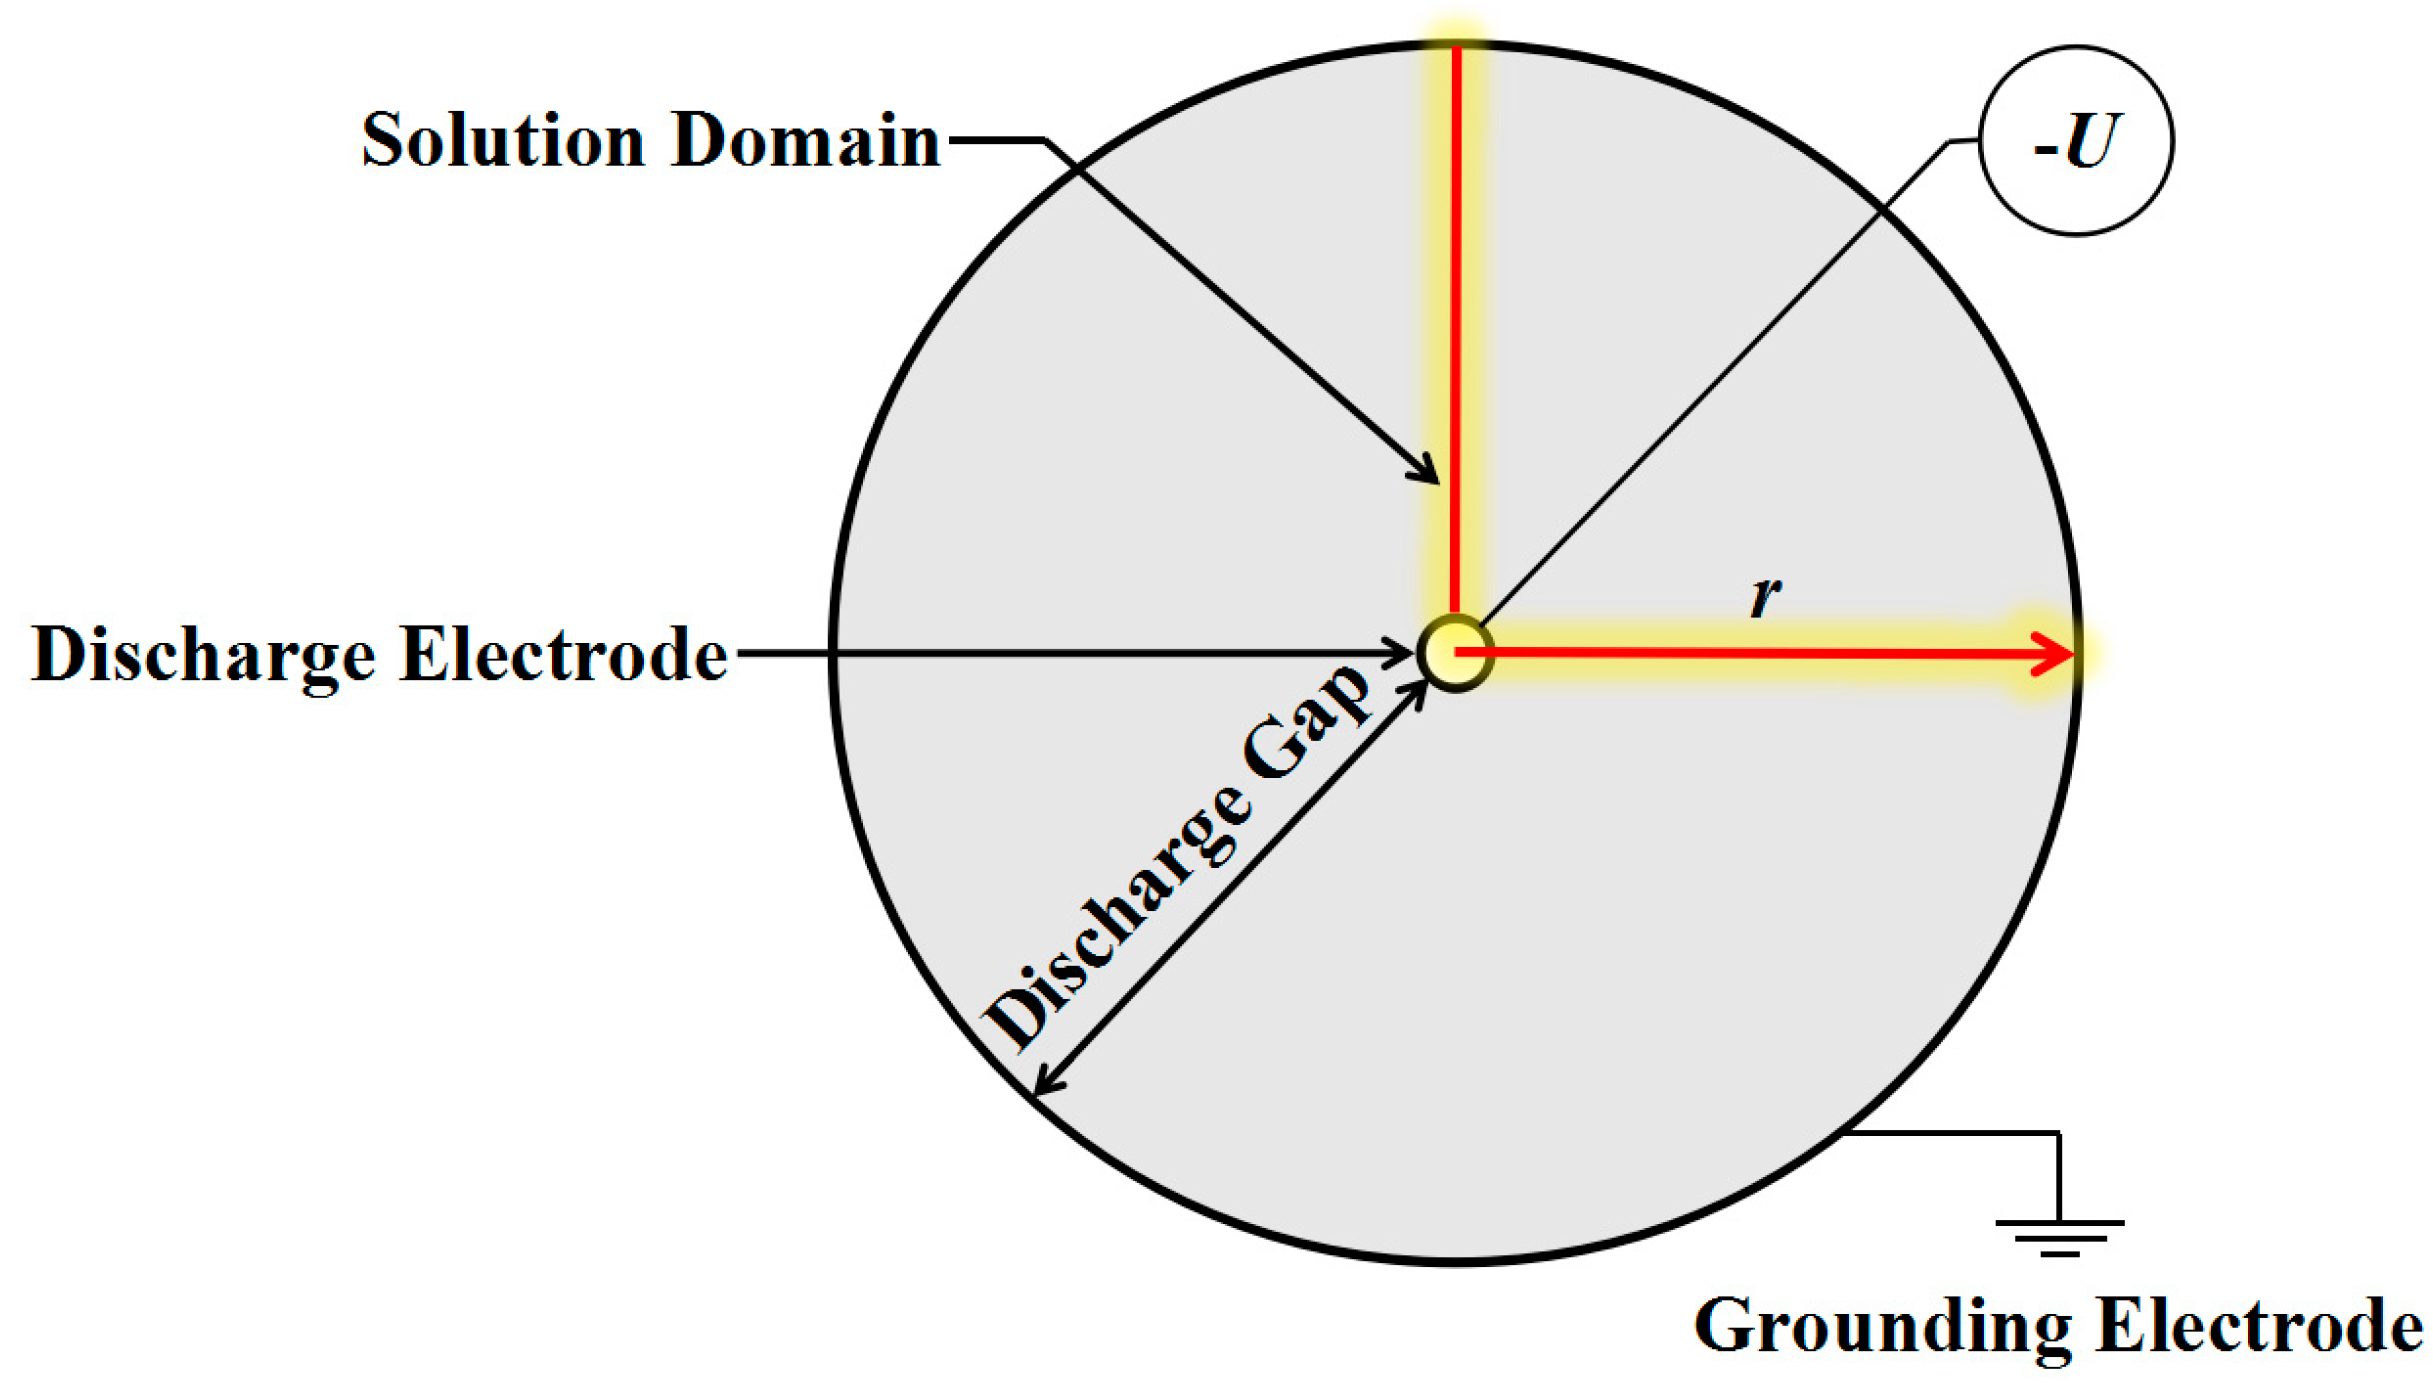
2.4. Physical Model
2.5. Mesh Generation and Numerical Solution
3. Results and Discussion
3.1. Effect of Discharge Voltage
3.2. Analysis of Chemical Reactions
4. Conclusions
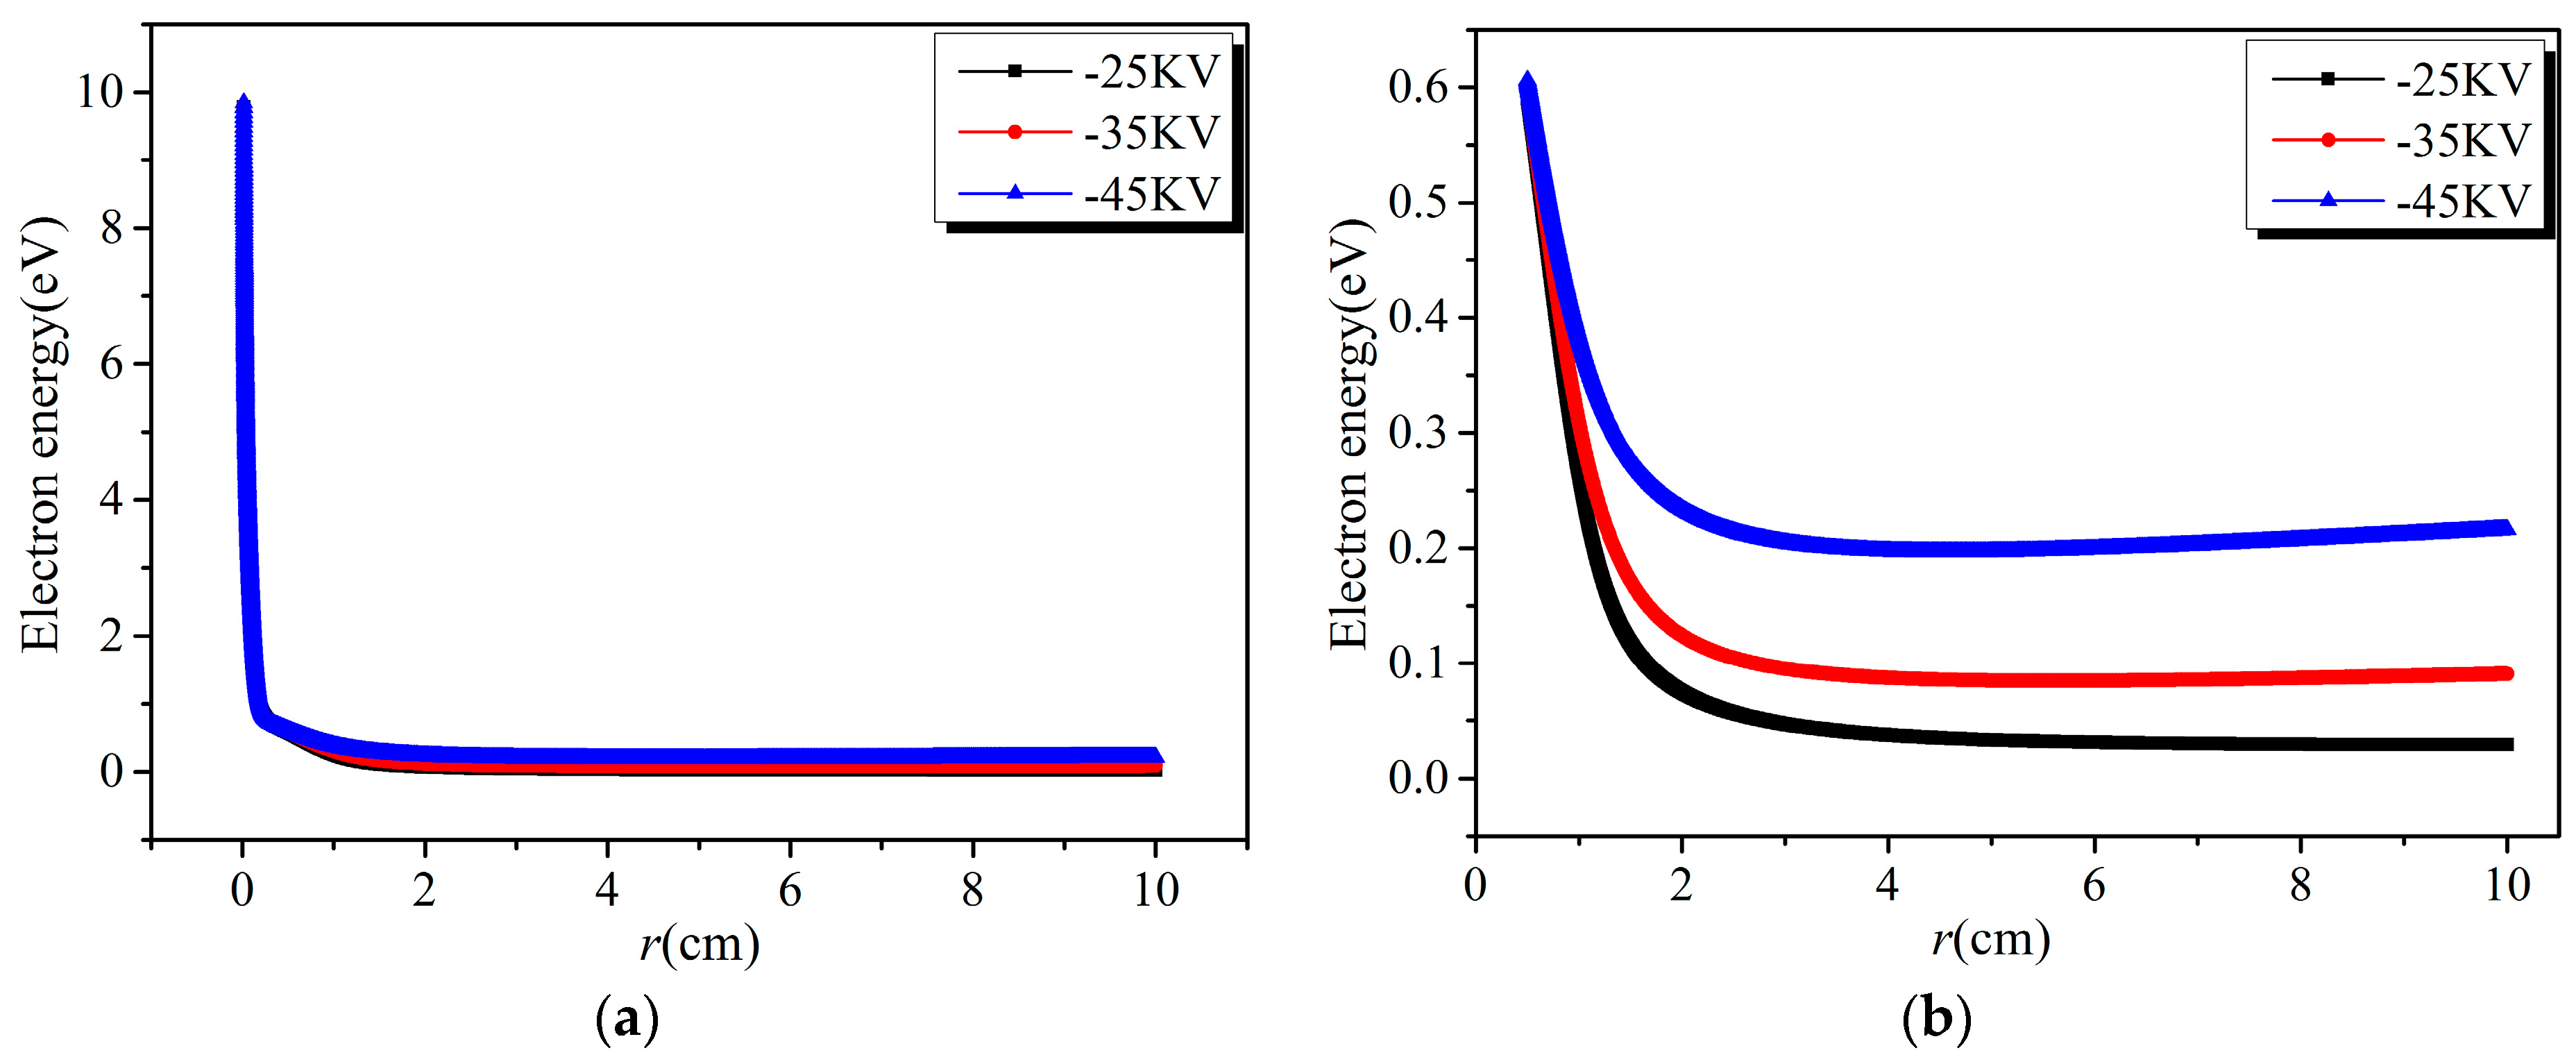
- (1)
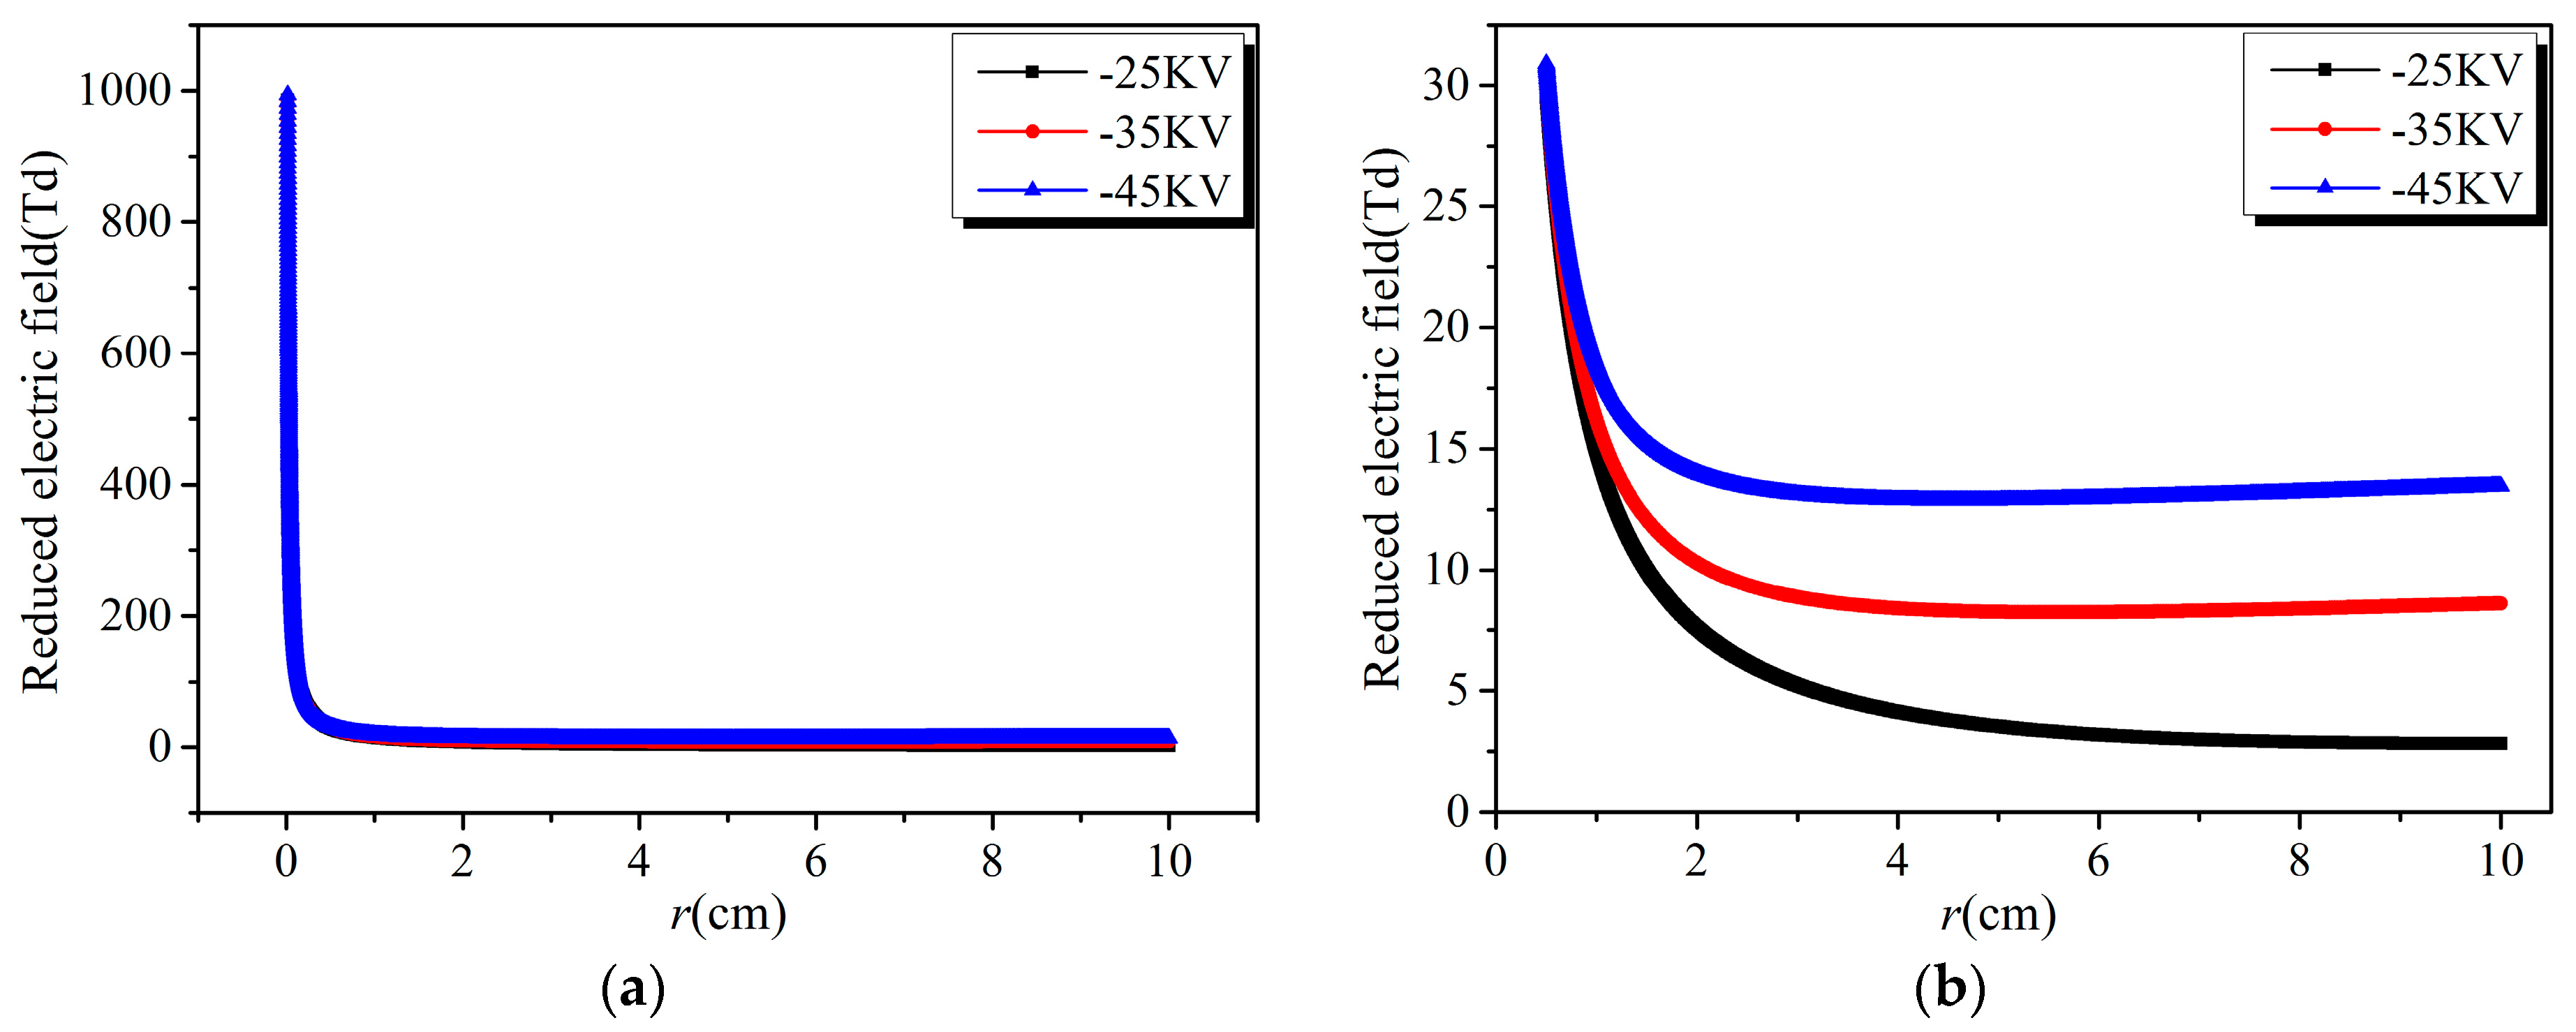
- The reduced electric field decreases sharply from the edge of the discharge electrode, forming a narrow high electric field region about one mm away from the cathode. The high electric field region is also the high electron energy region, where the electron energy is close to each other under different discharge voltages.
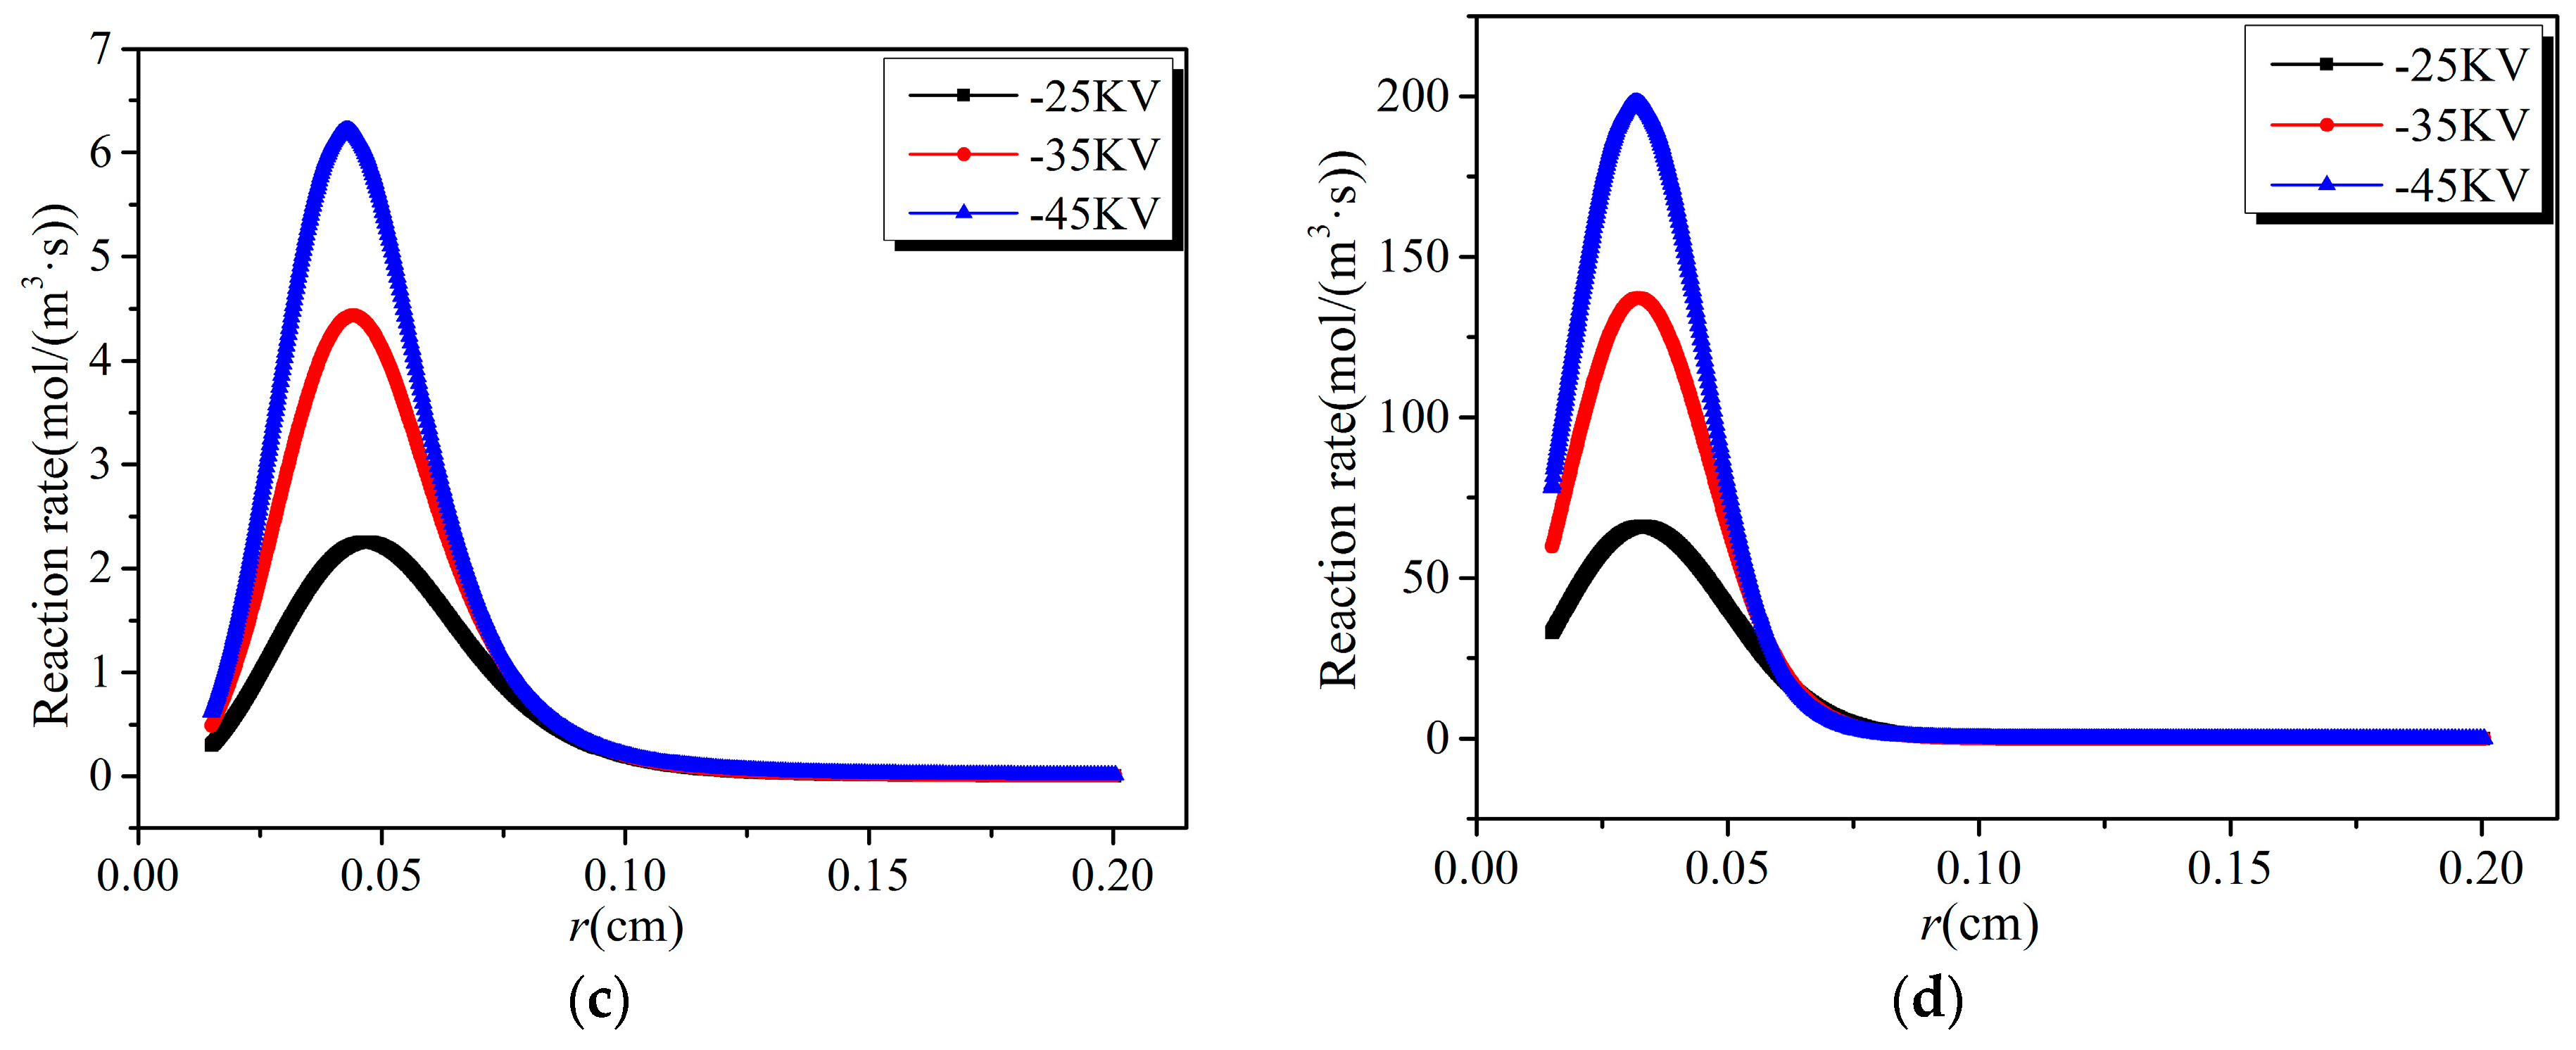
- (2)
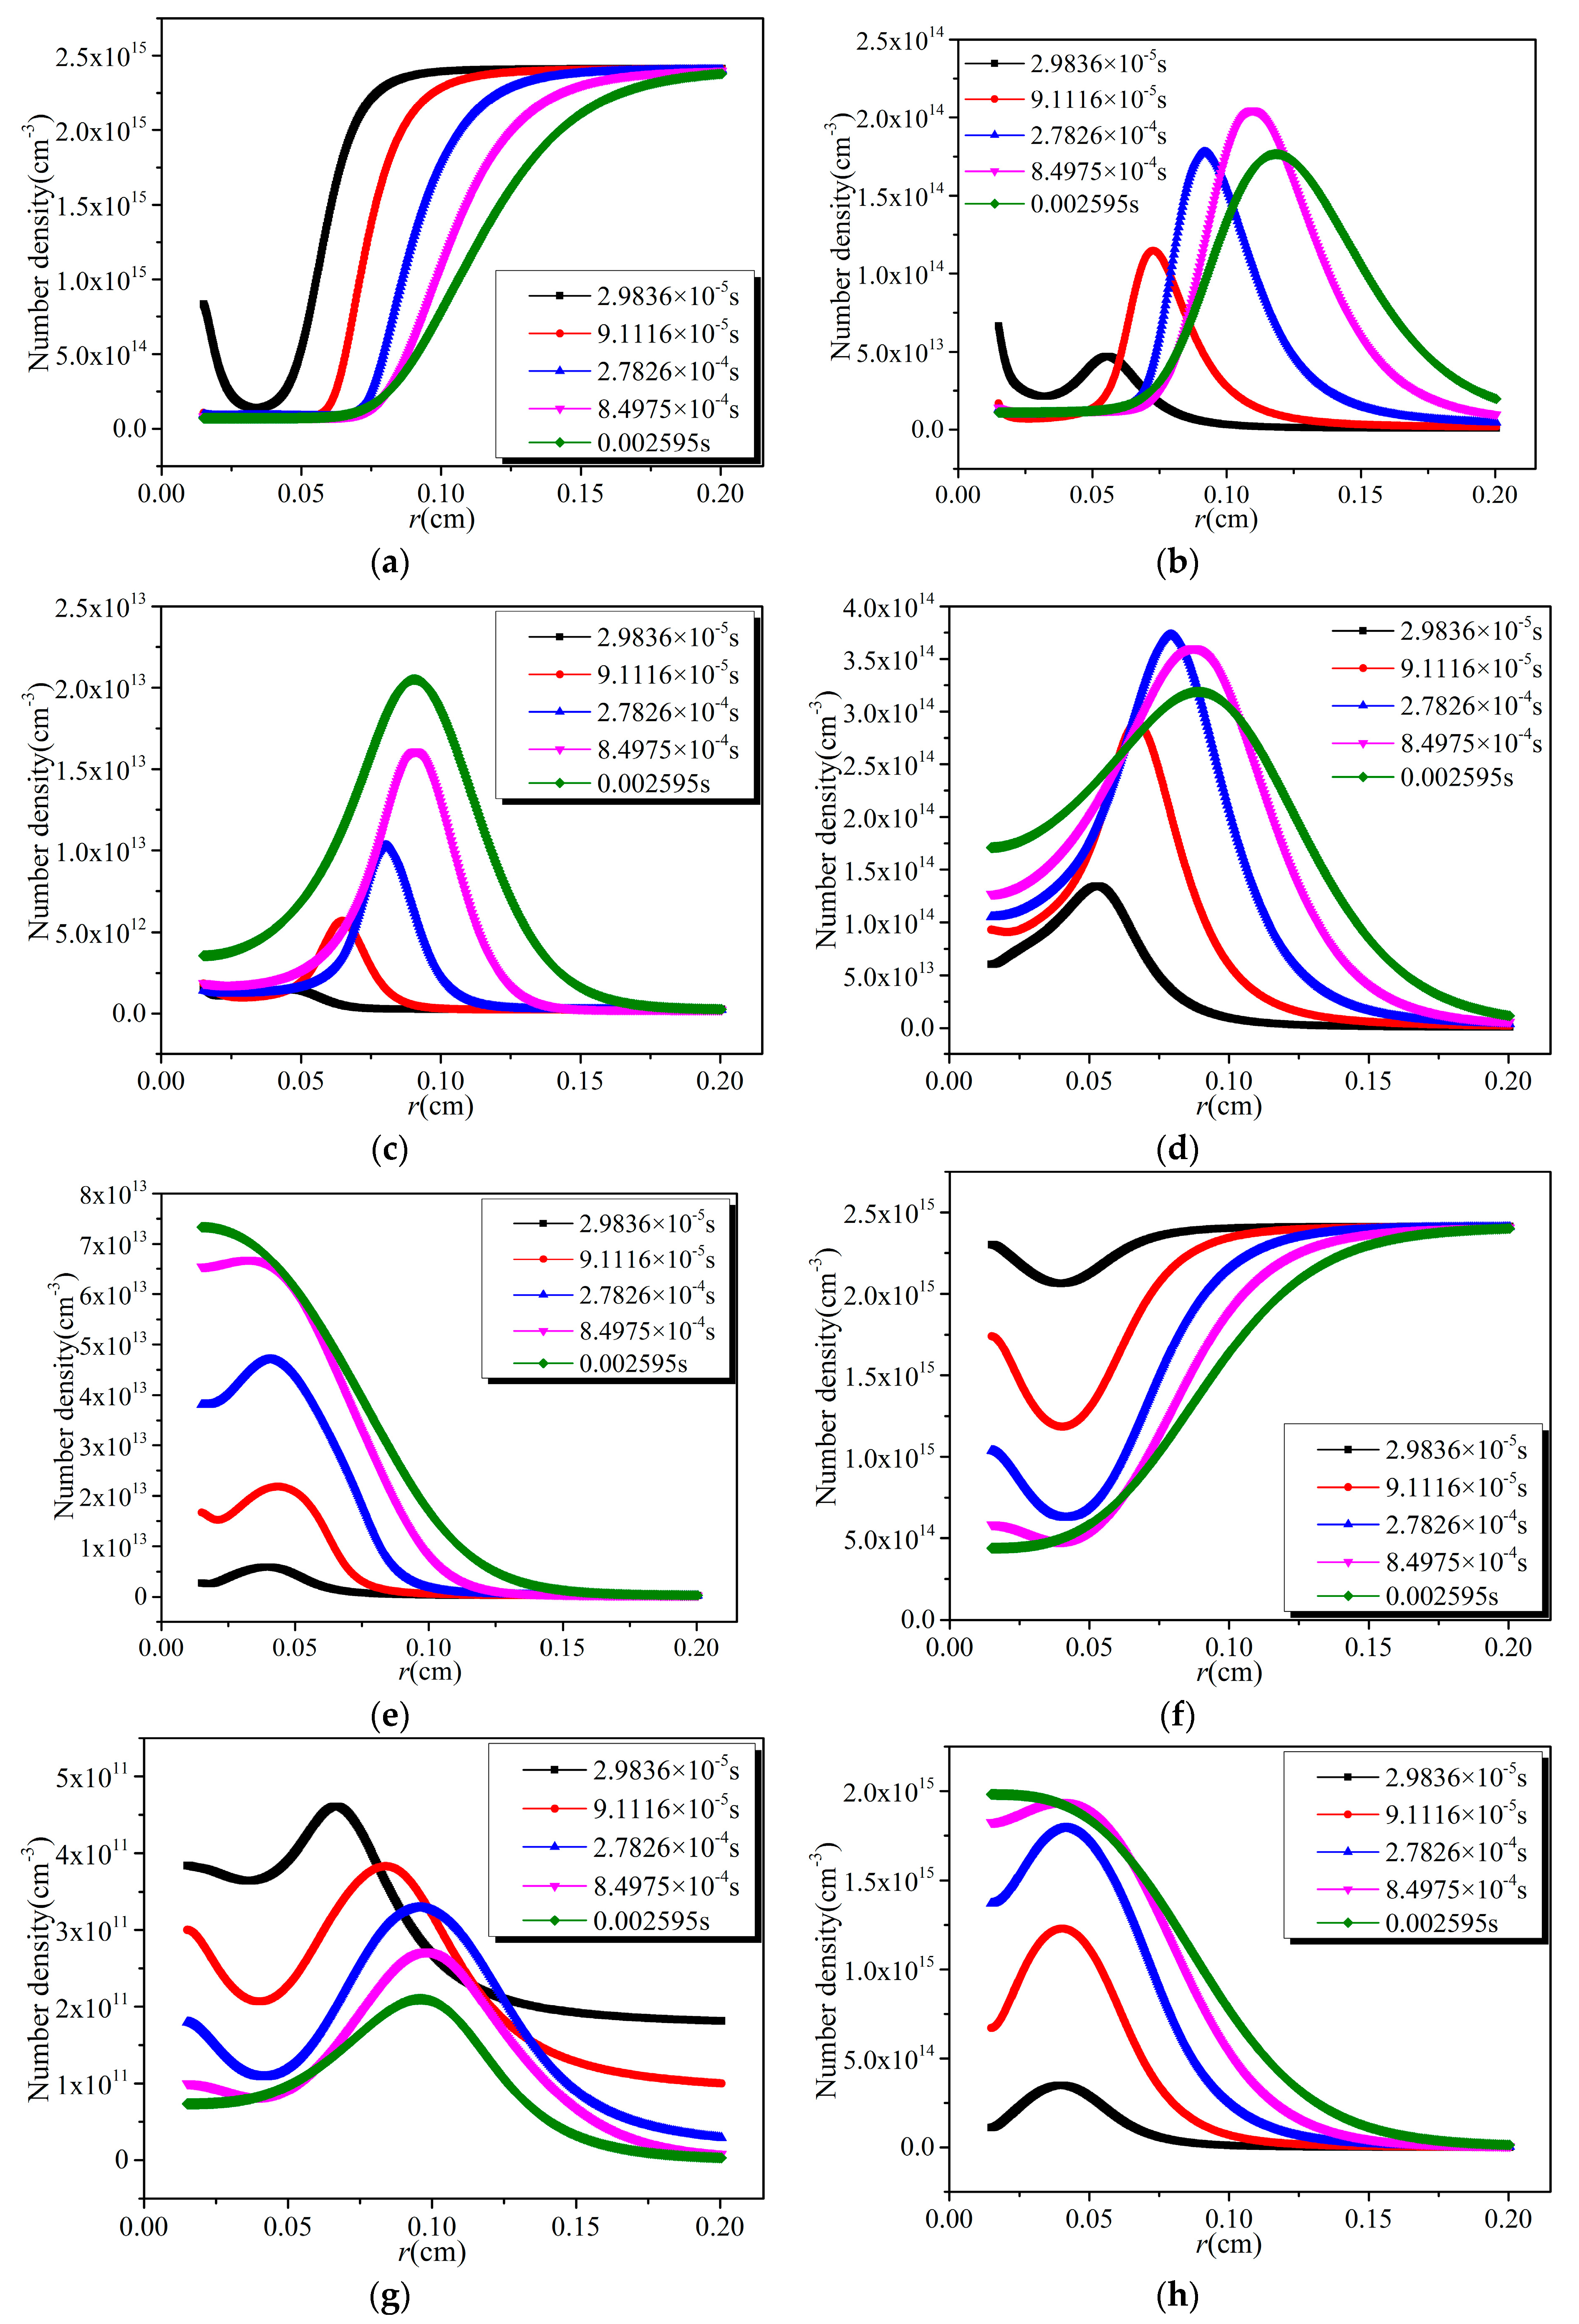
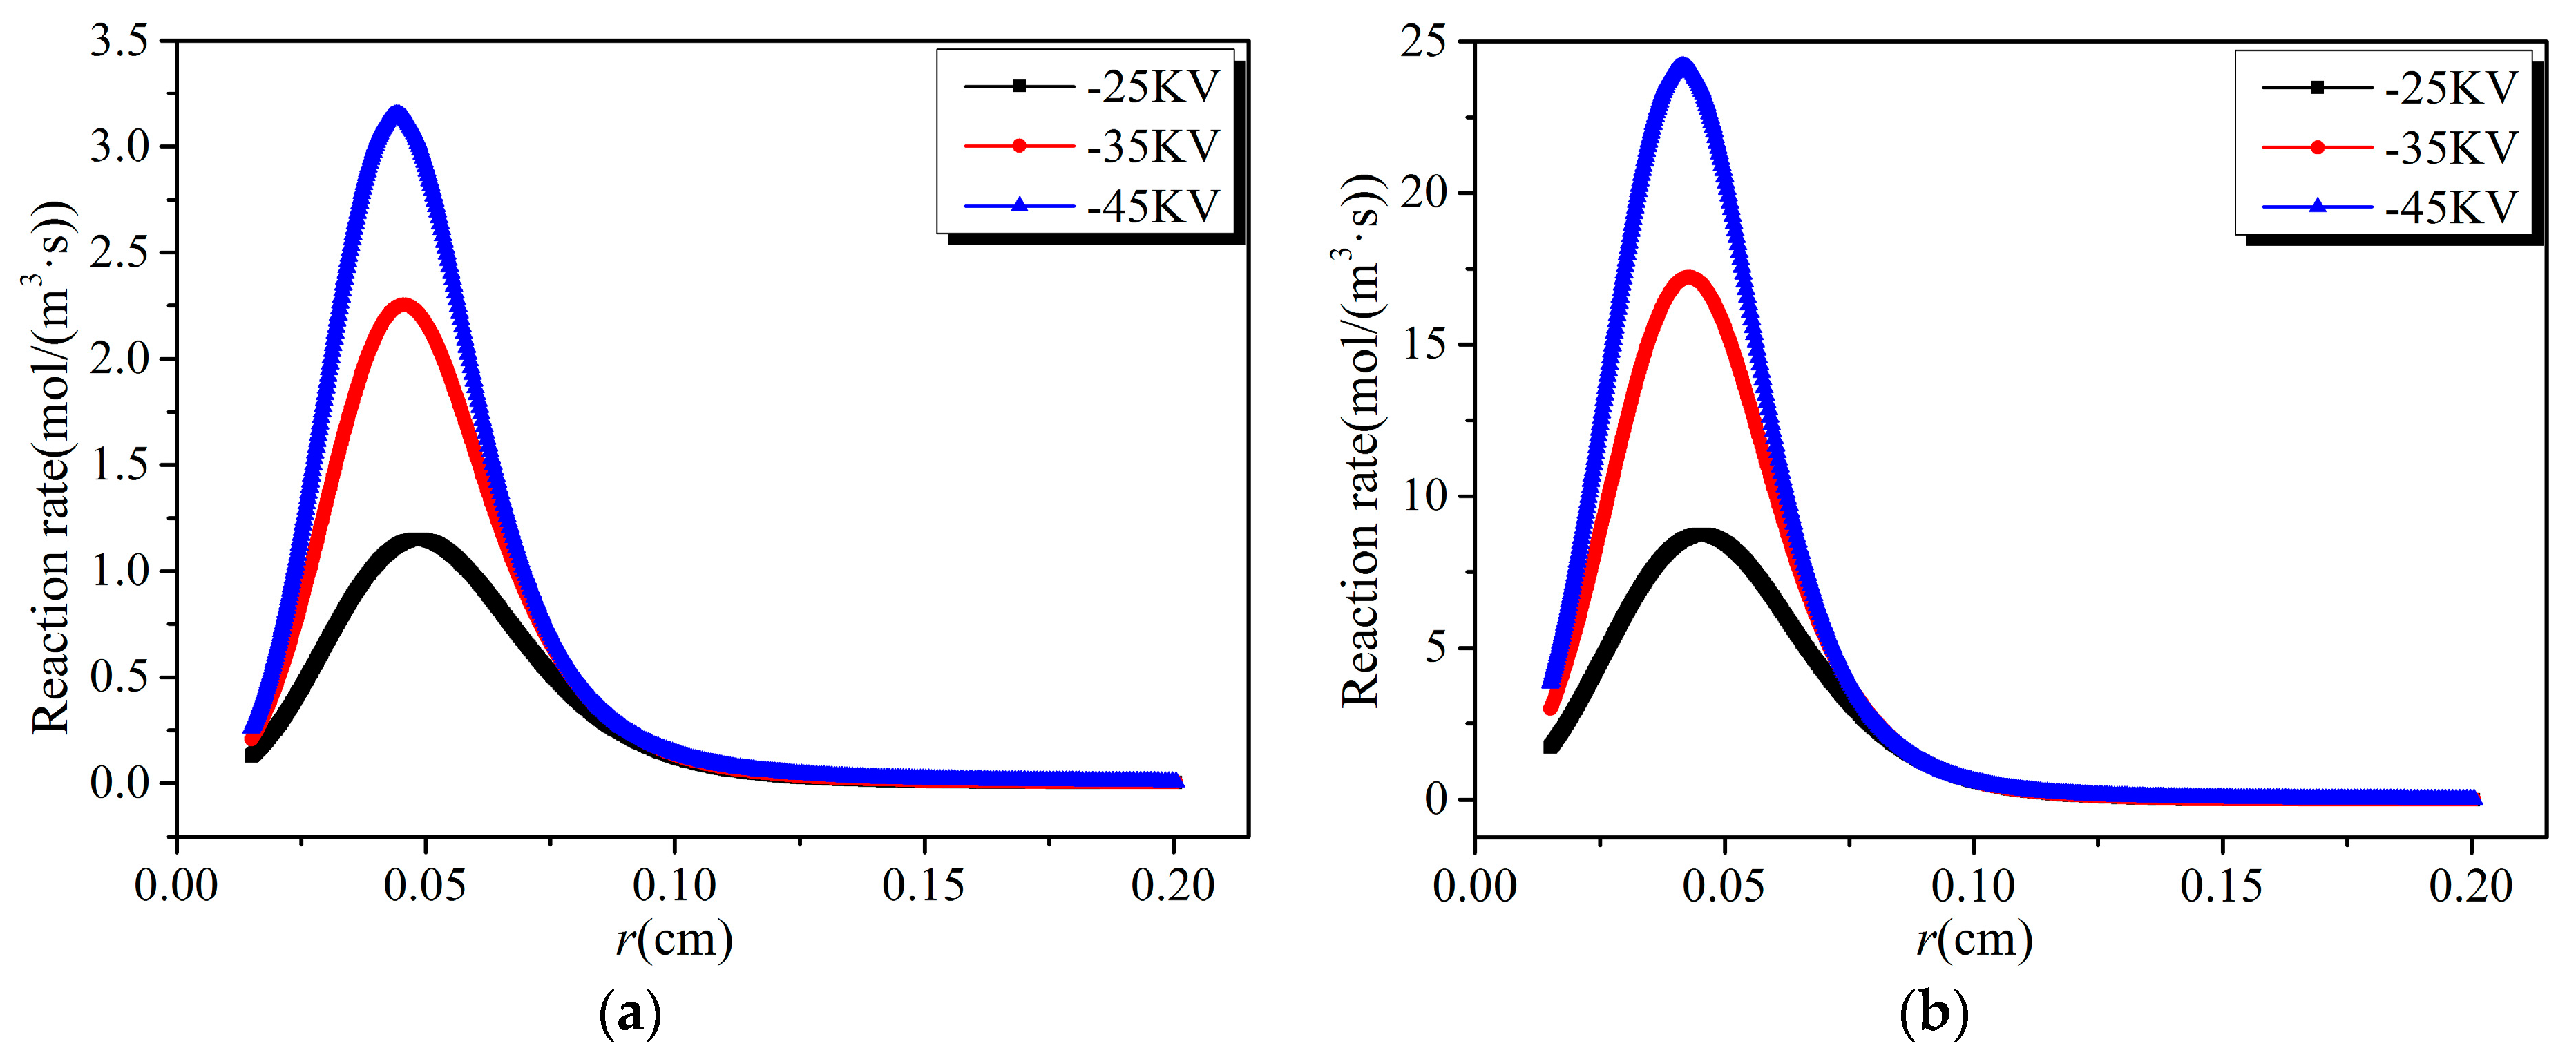
- The reaction rates of electron collision reactions are higher in the high electric field region and tend to zero gradually outside this region. There is a peak value in the spatial distribution of various reaction rates, whose position is determined by the location of the electron energy threshold corresponding to various reactions.
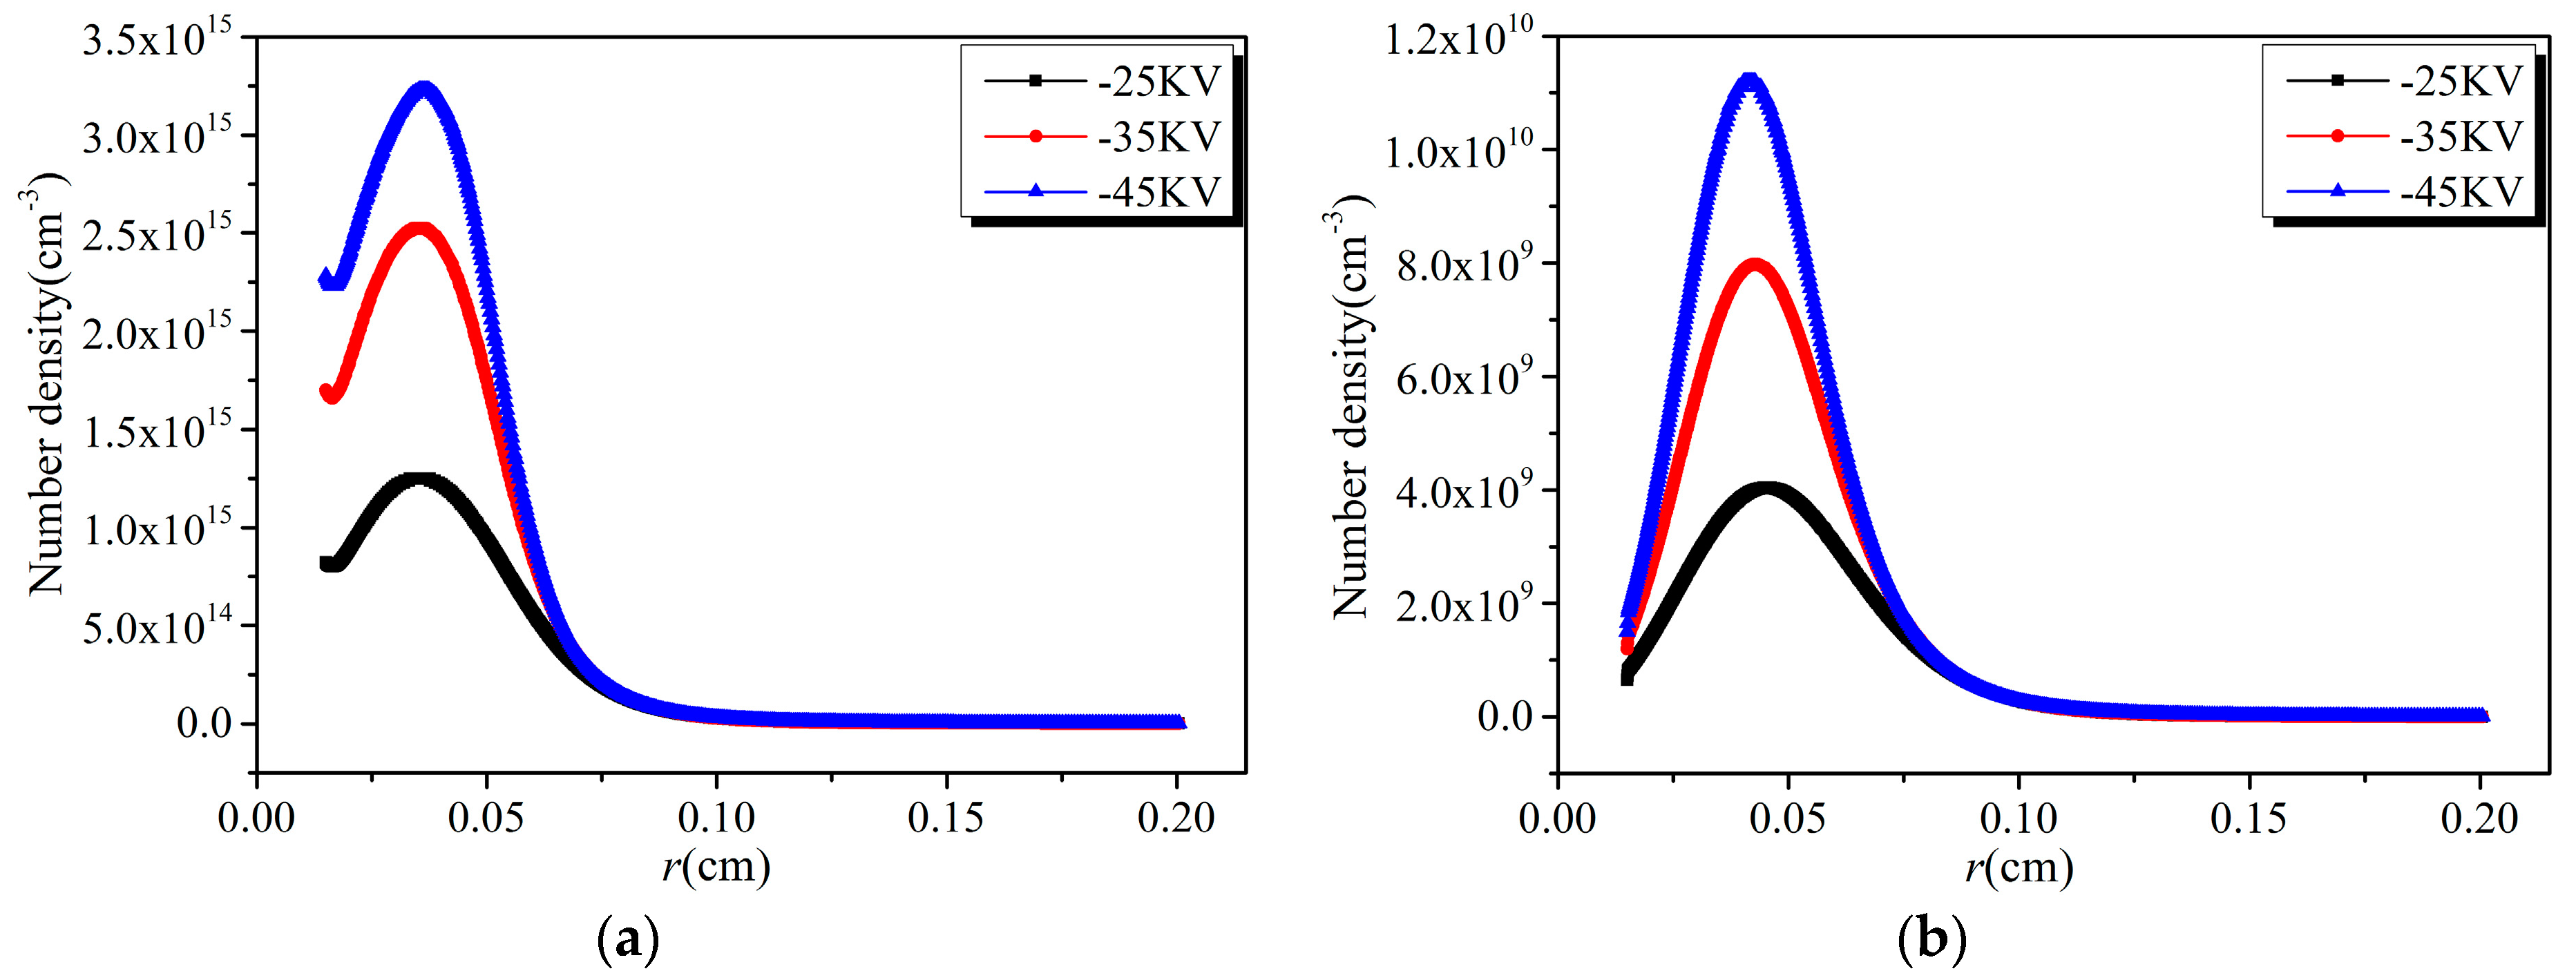
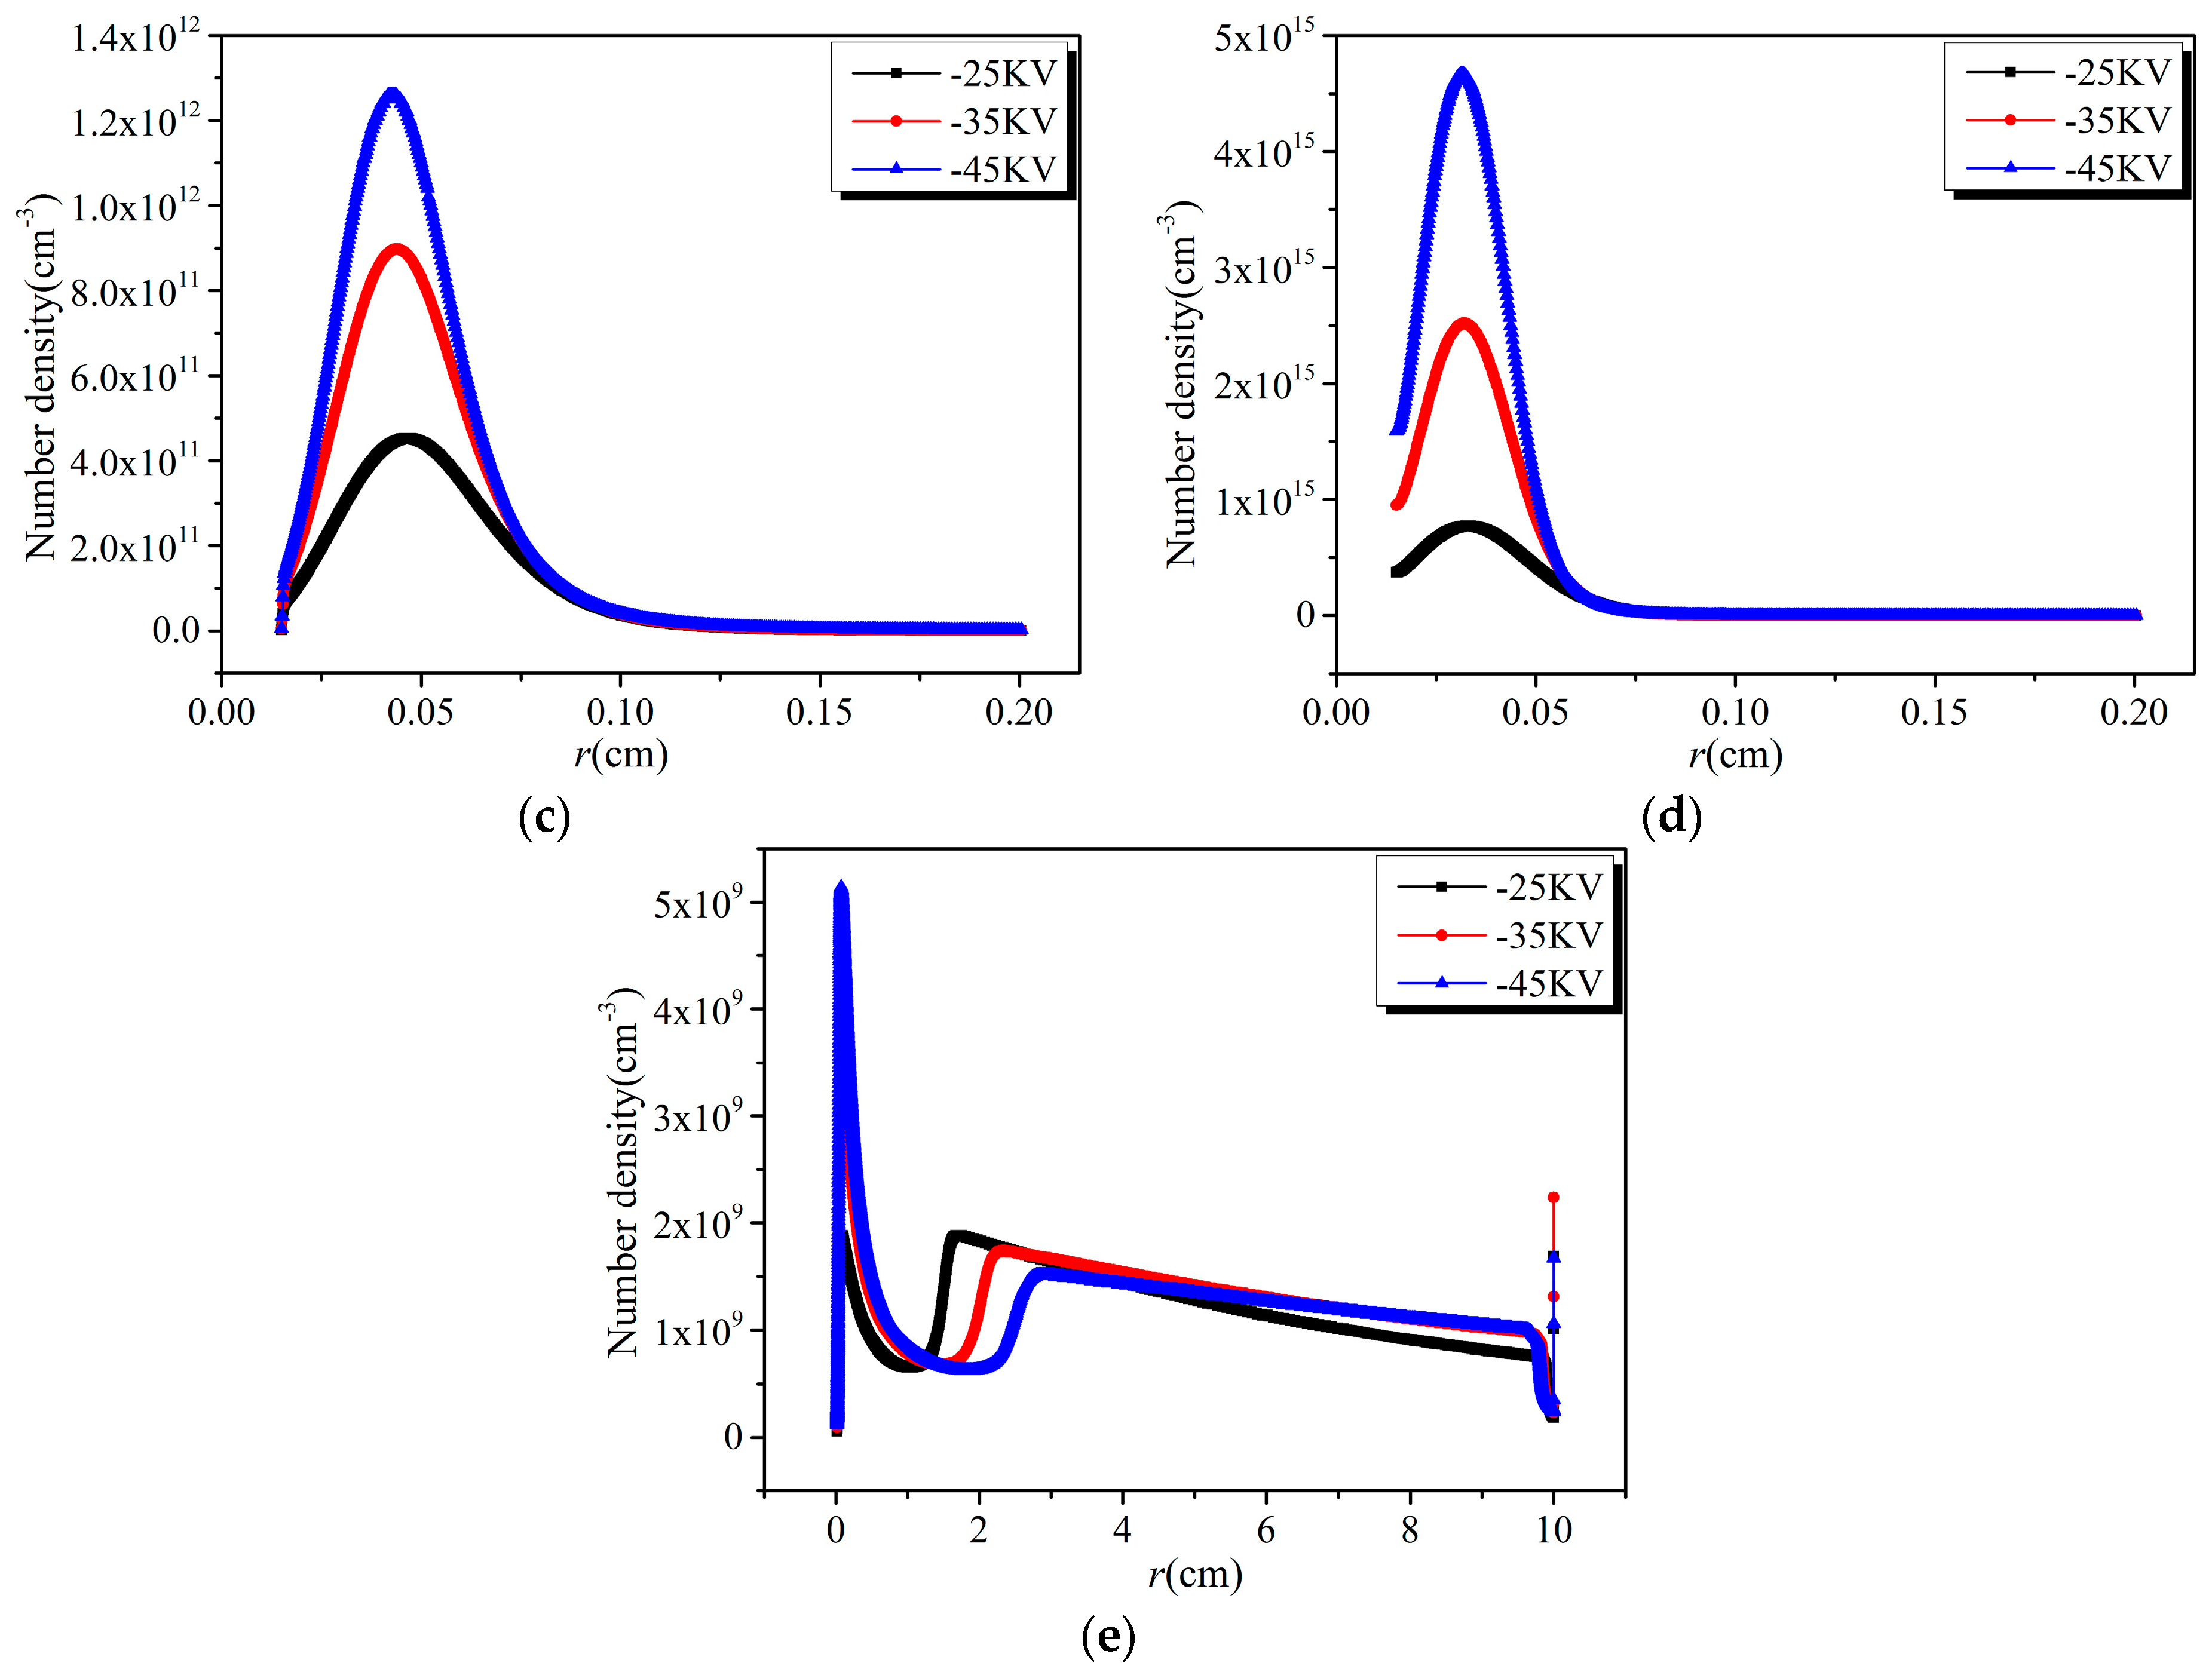
- (3)
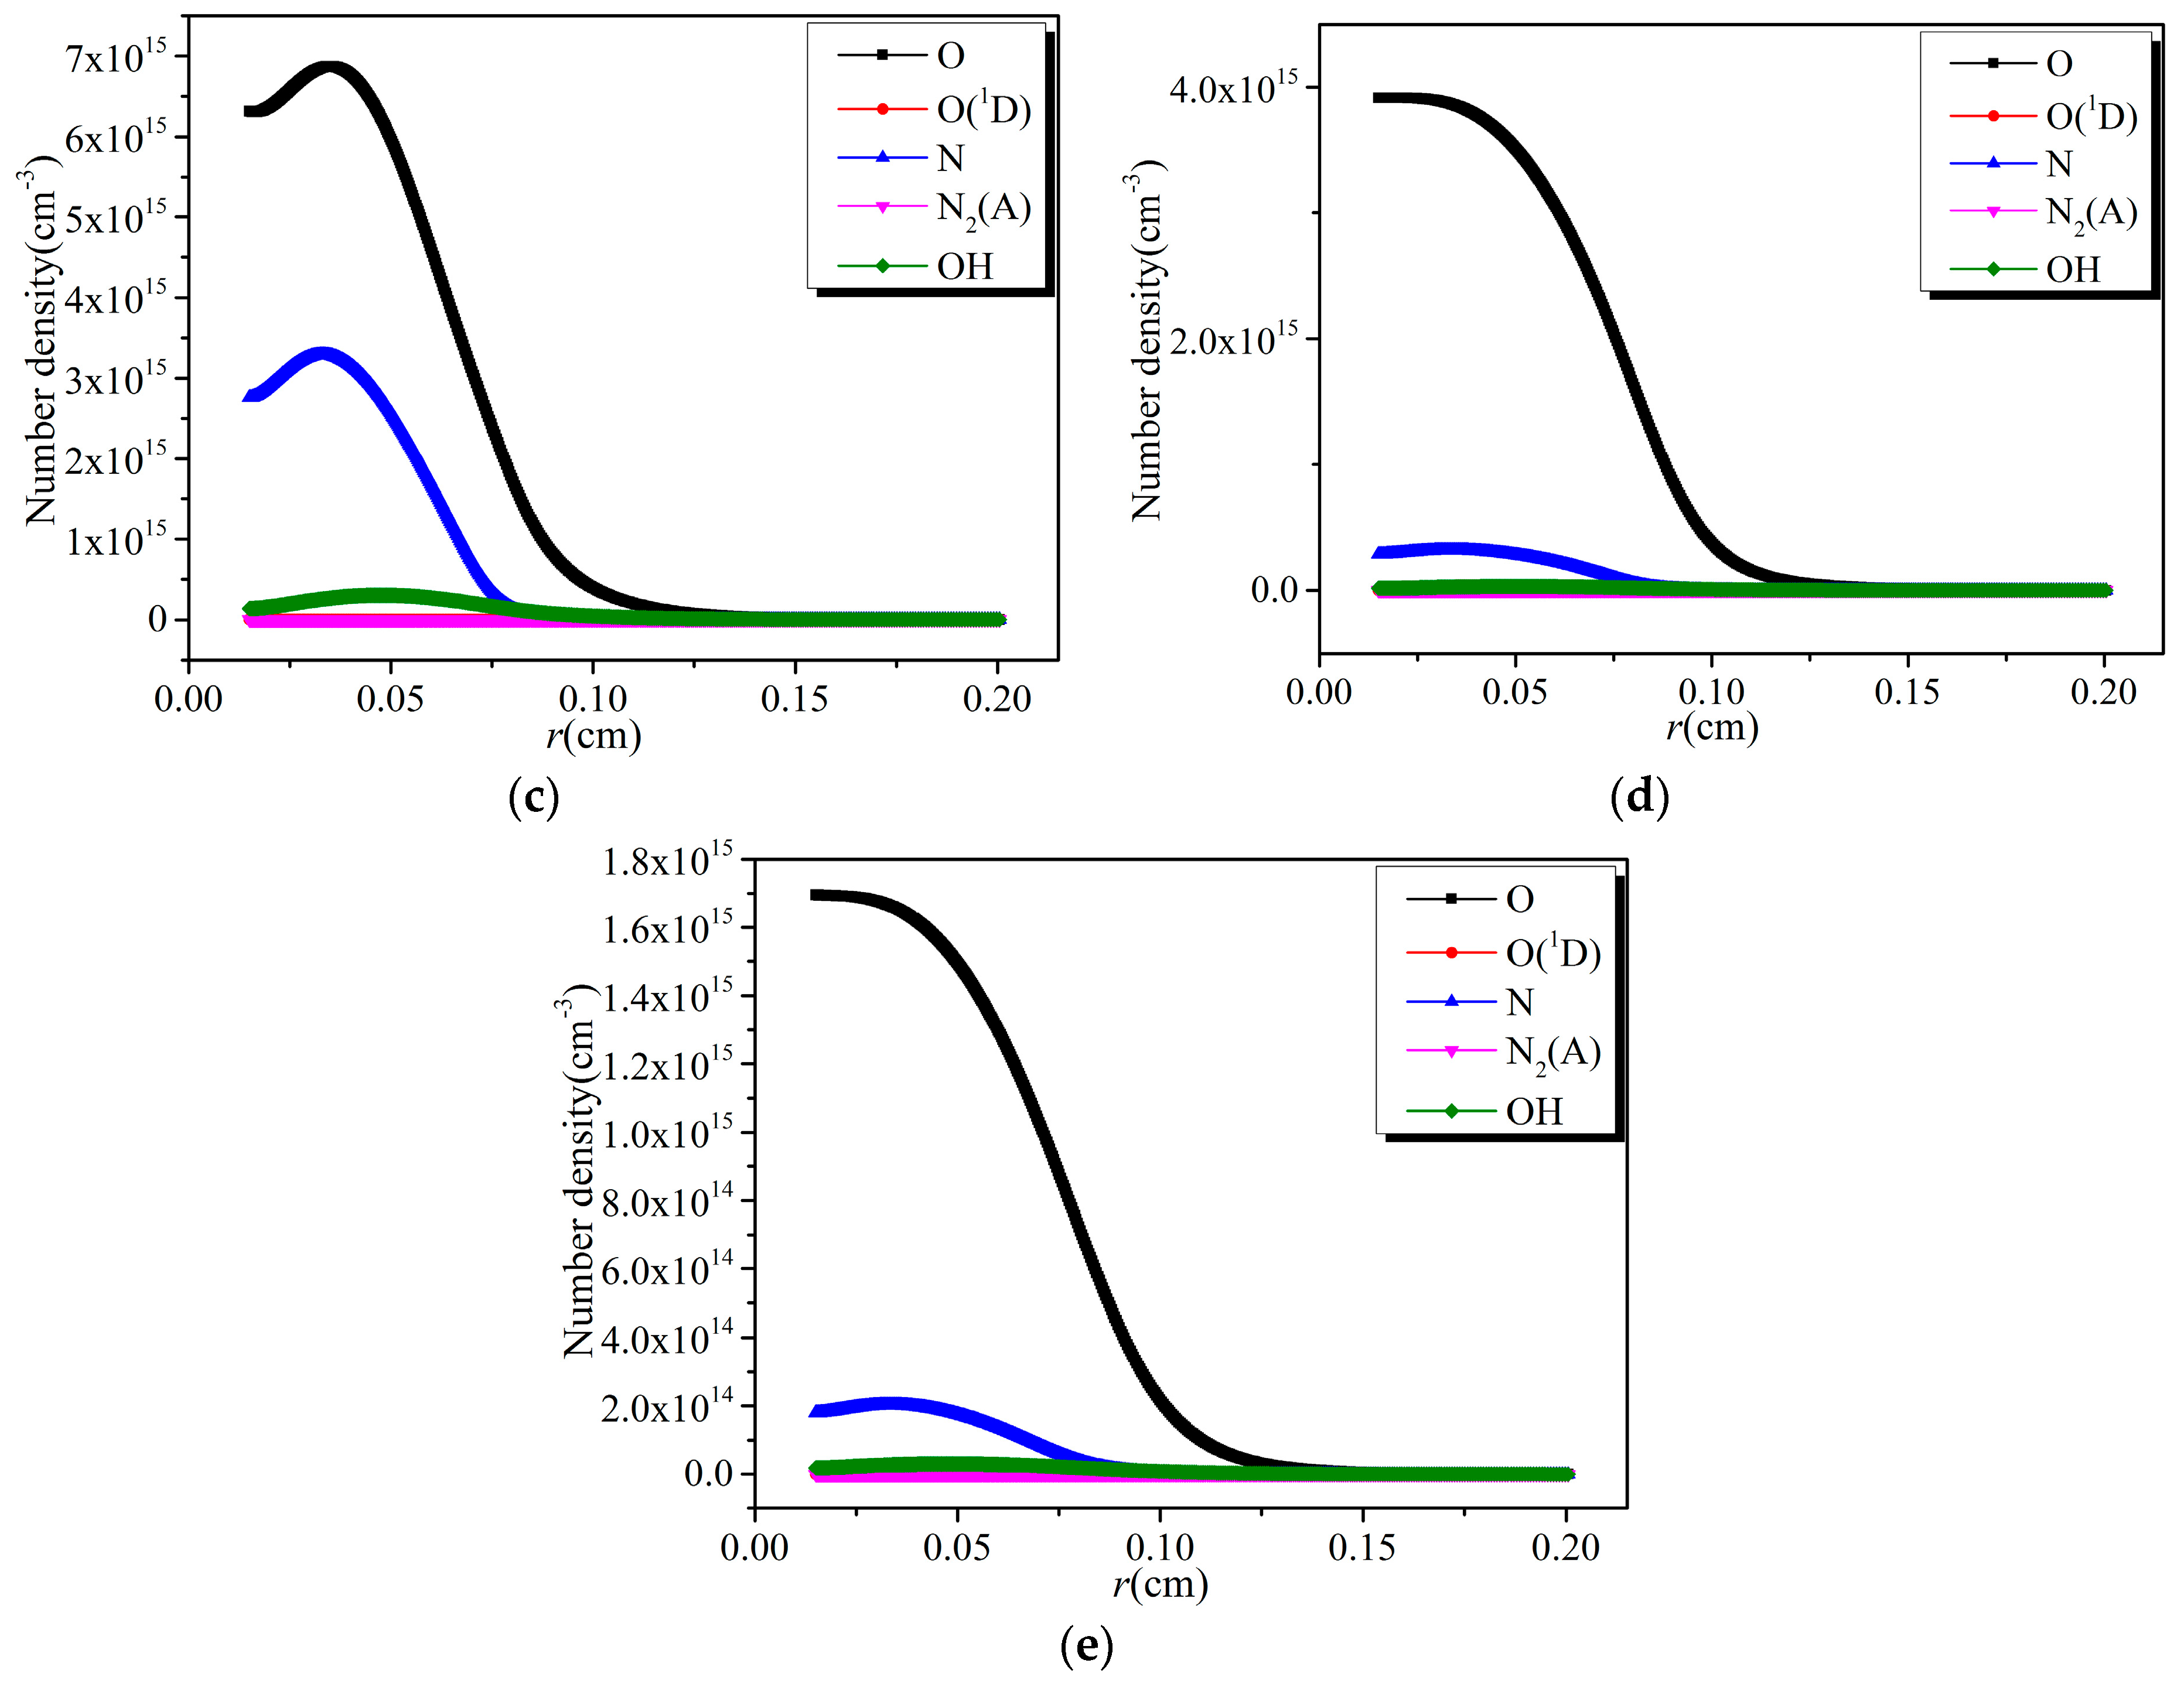
- The distribution of the number densities of active particles between two electrodes has the same trend as that of the corresponding electron collision reaction rates.
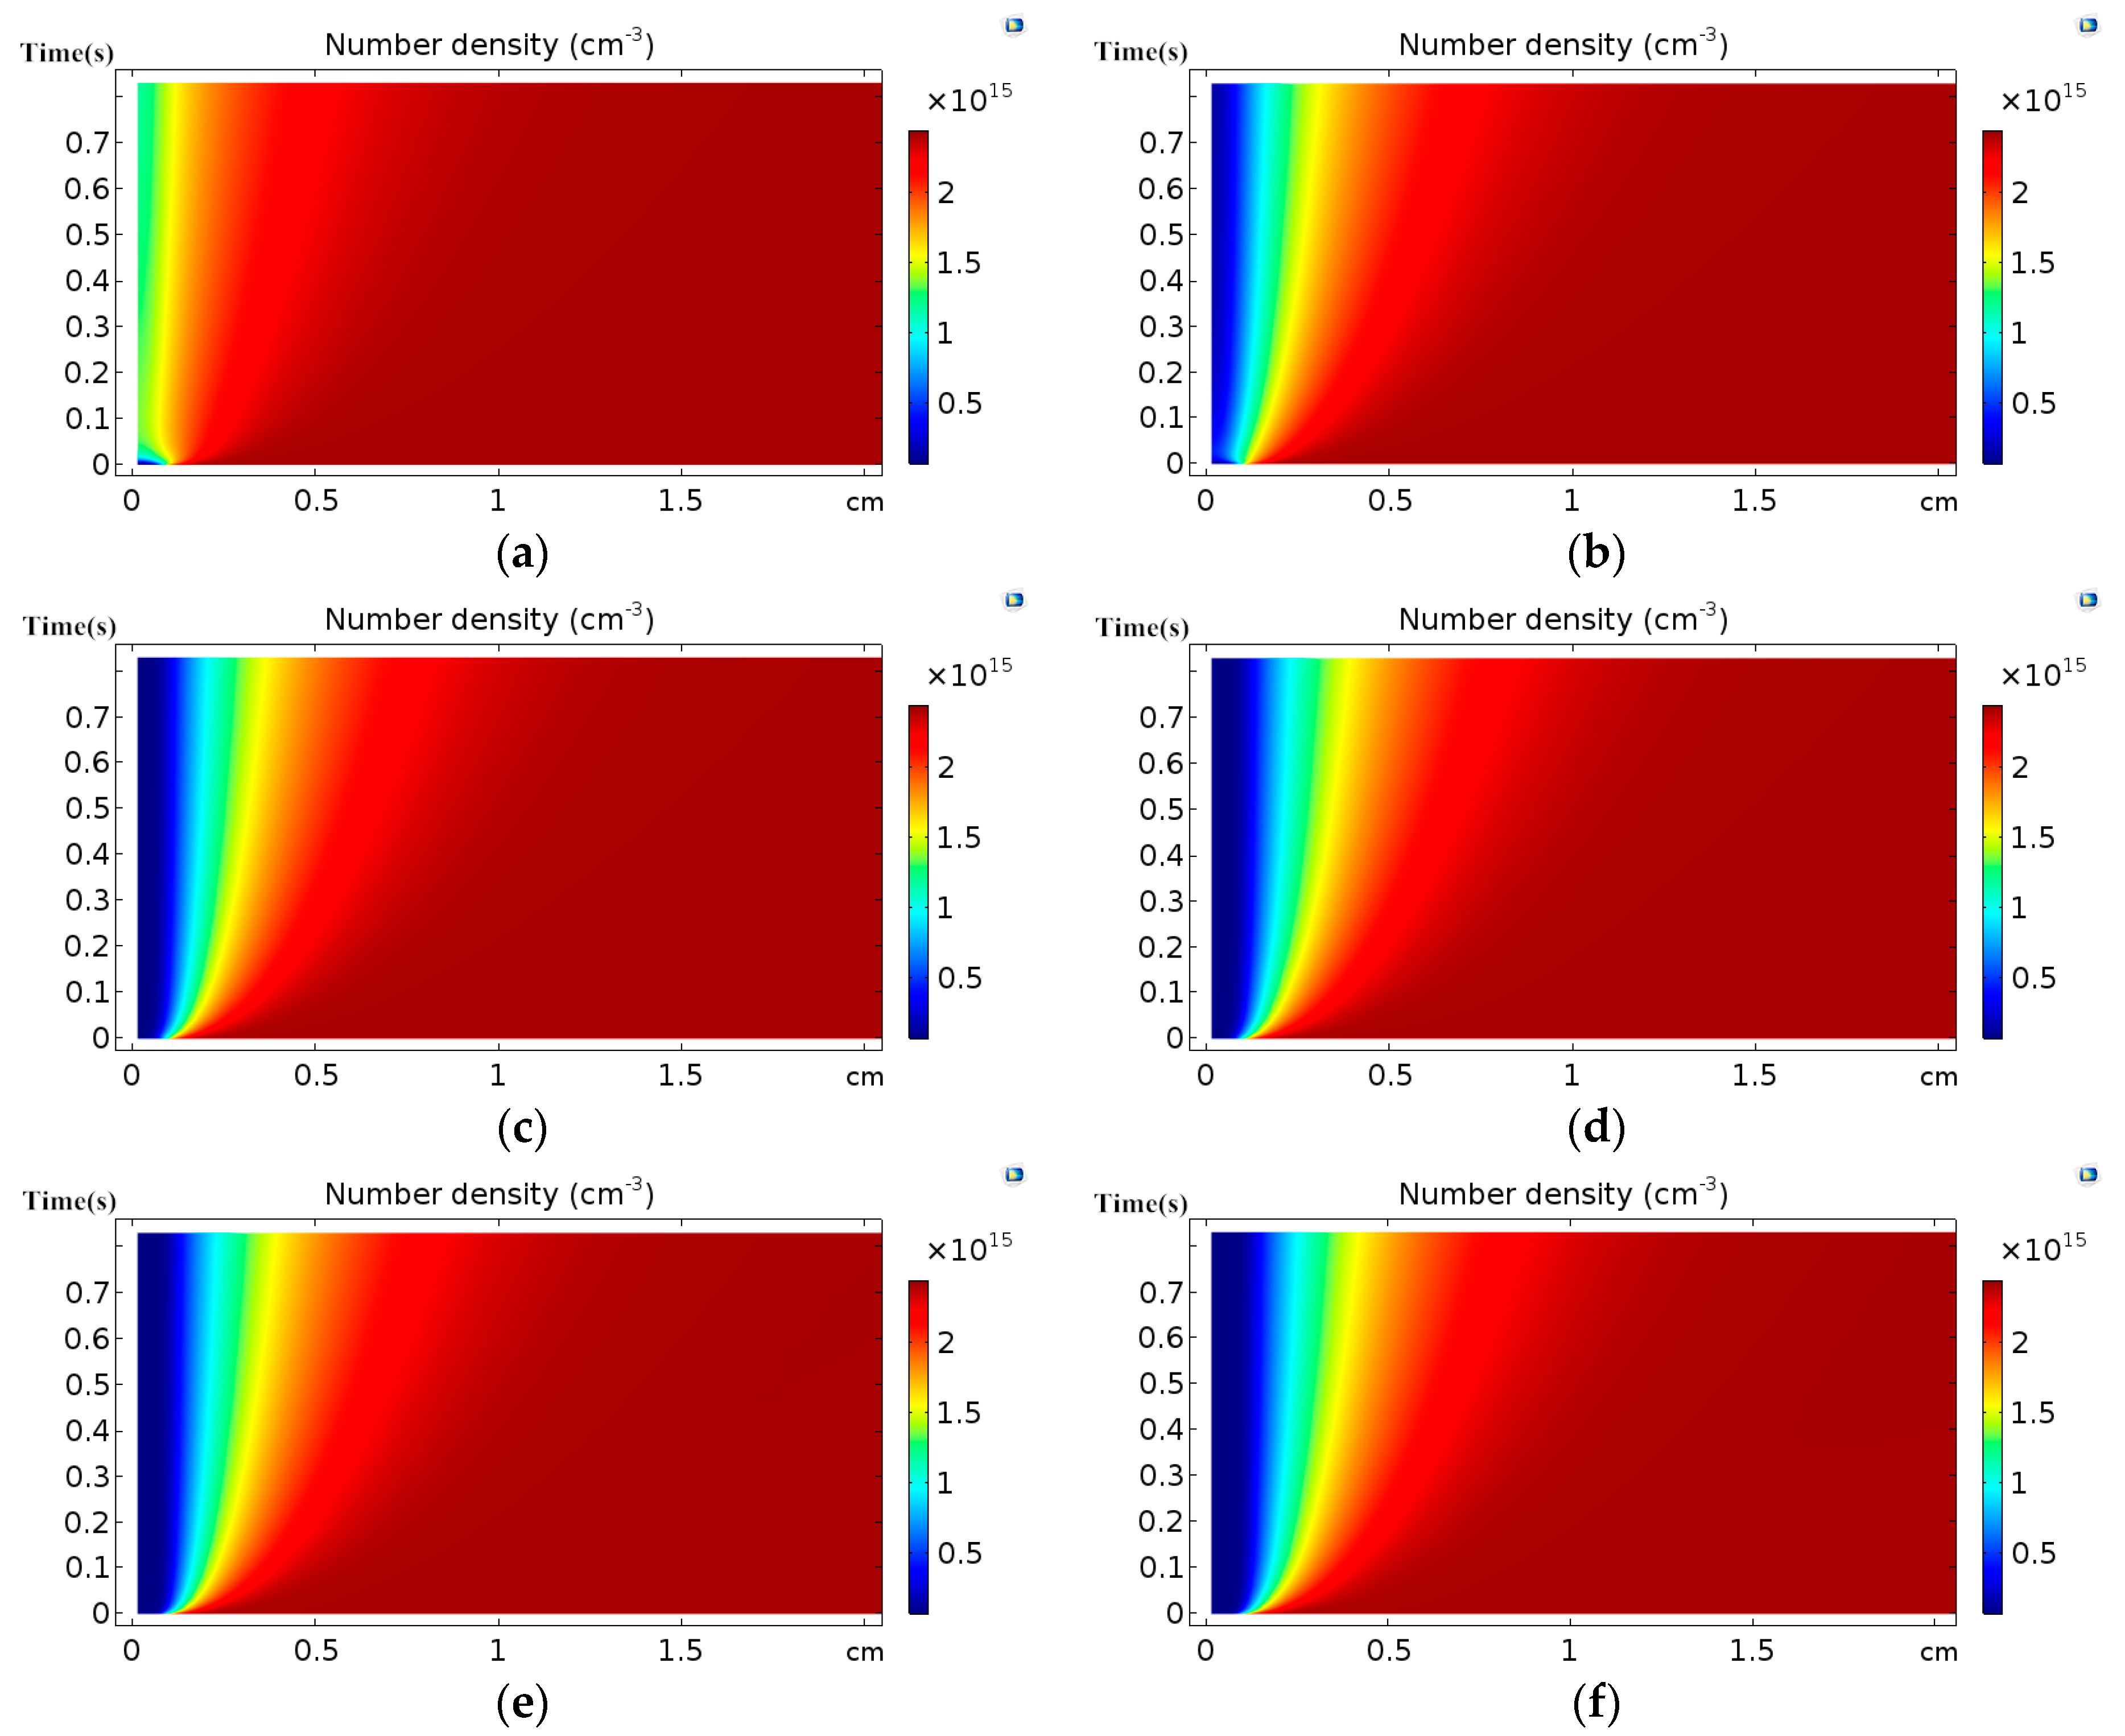
- (4)
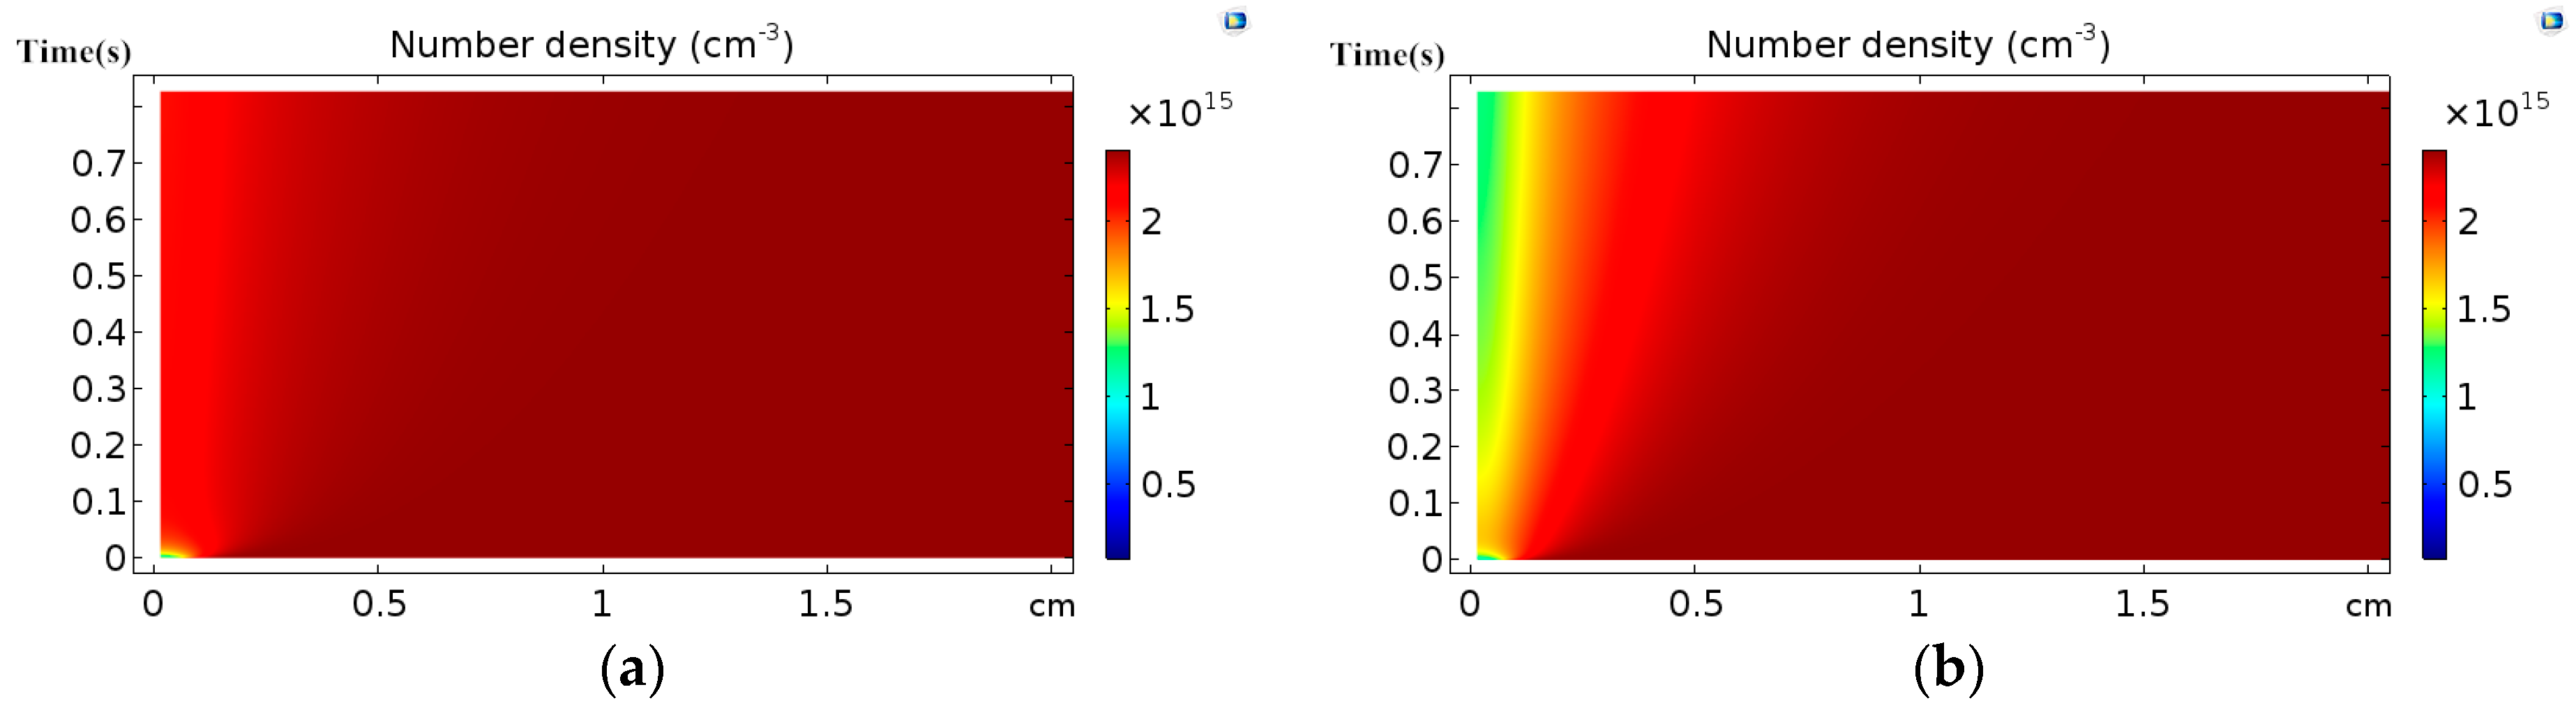
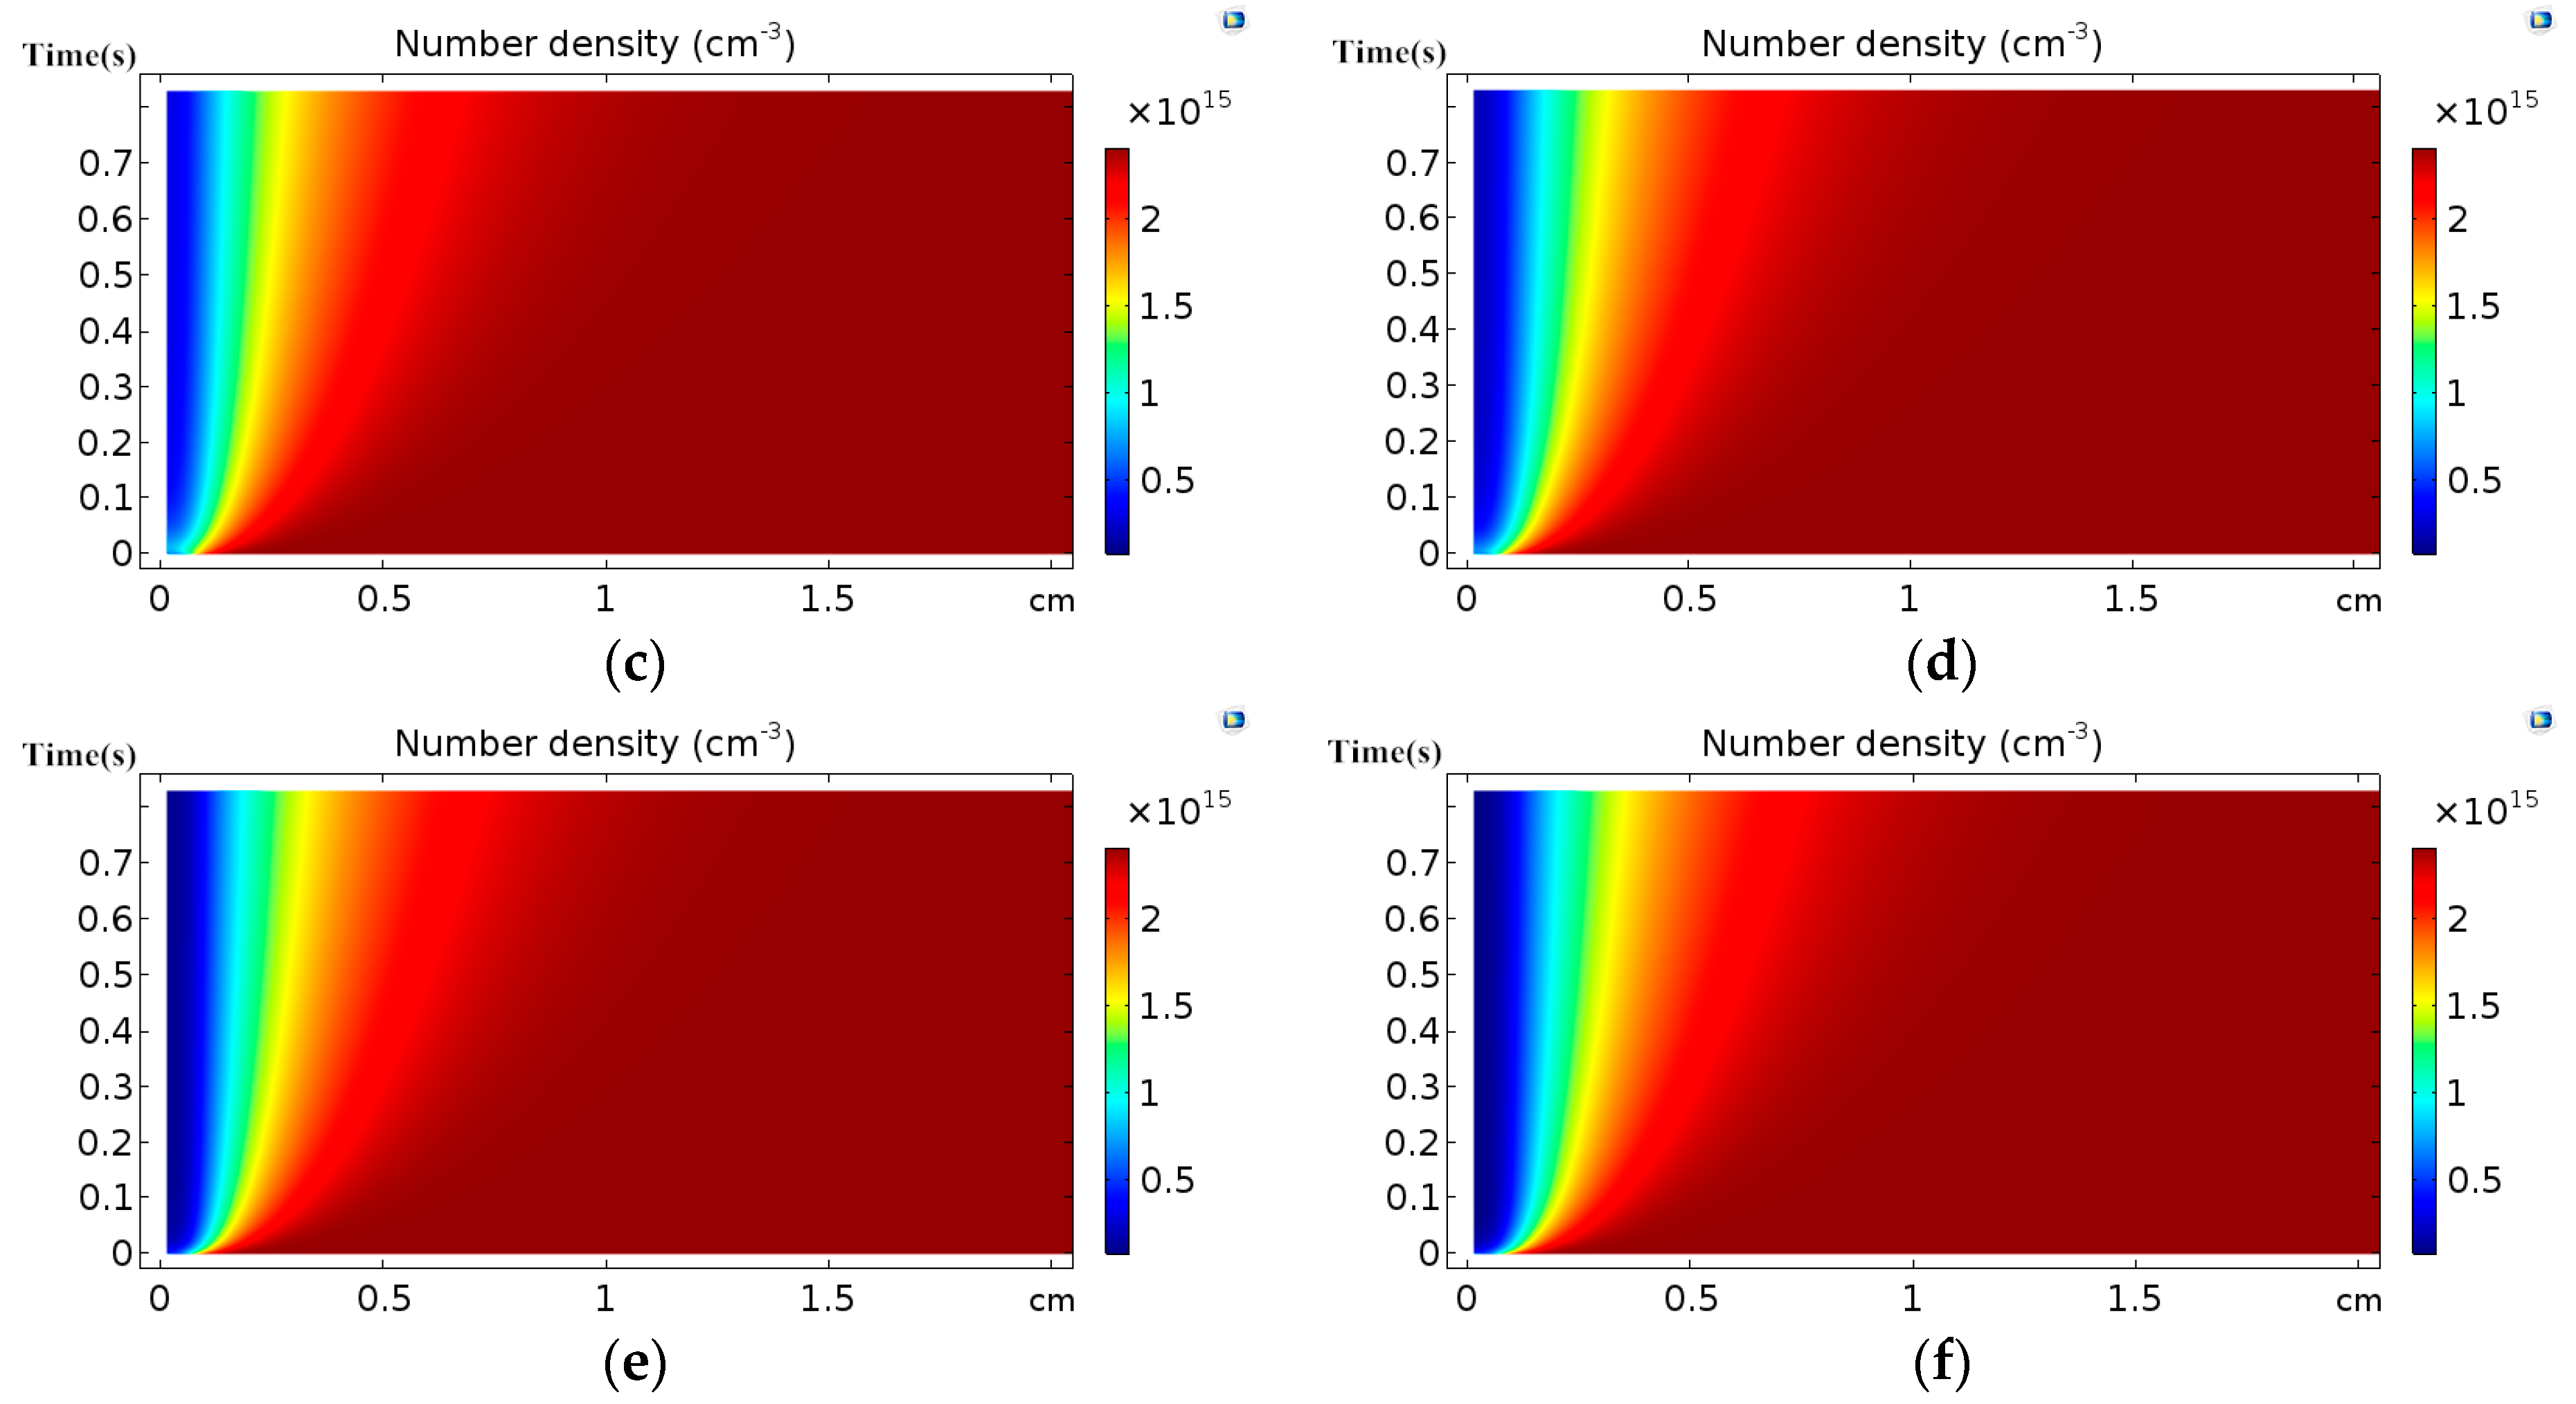
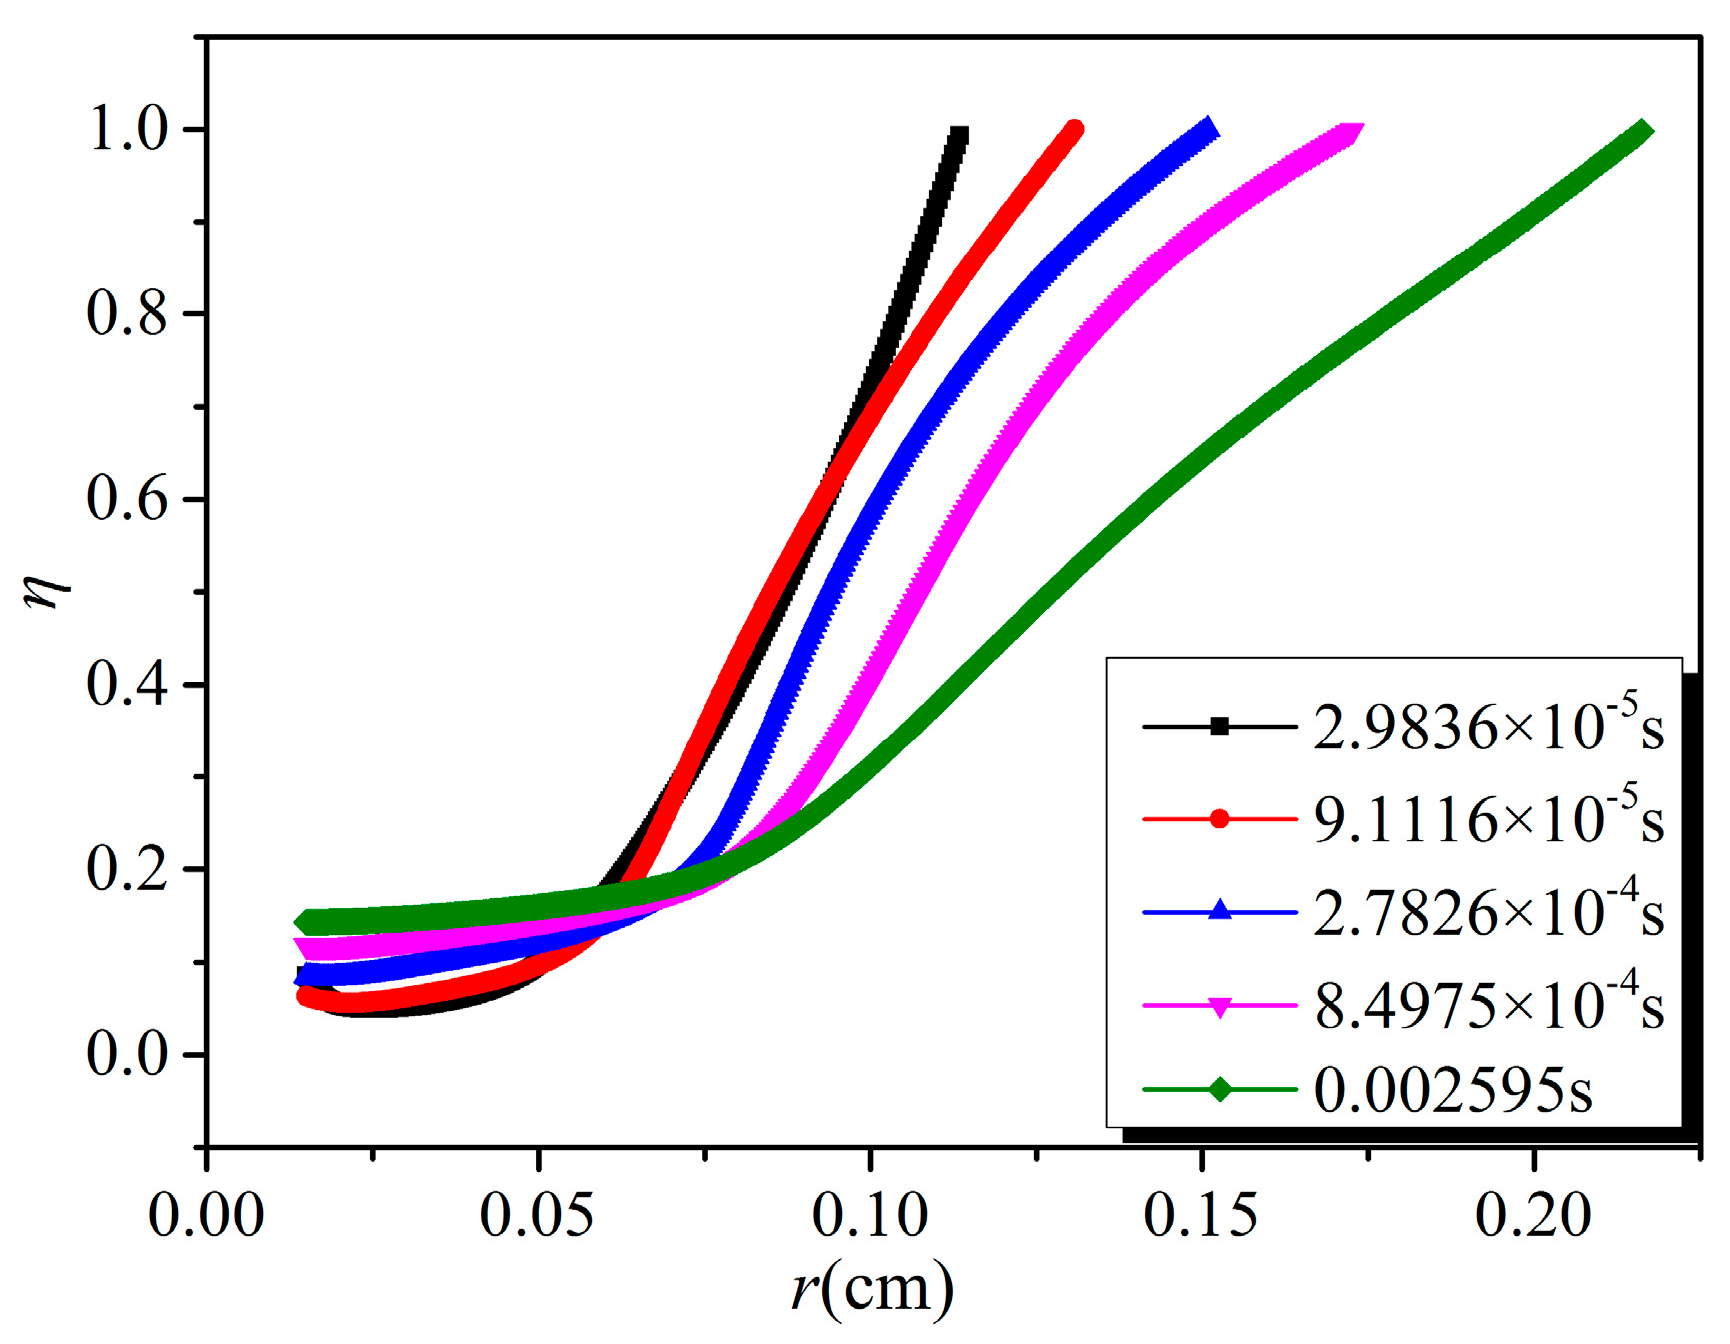
- The effective removal area of NO and SO2 increases with time, and the removal efficiency decreases with the increase of distance from the discharge electrode under the same discharge voltage. With the increase of discharge voltage, the effective removal area of NO and SO2, as well as the removal efficiency at the same position, increase.
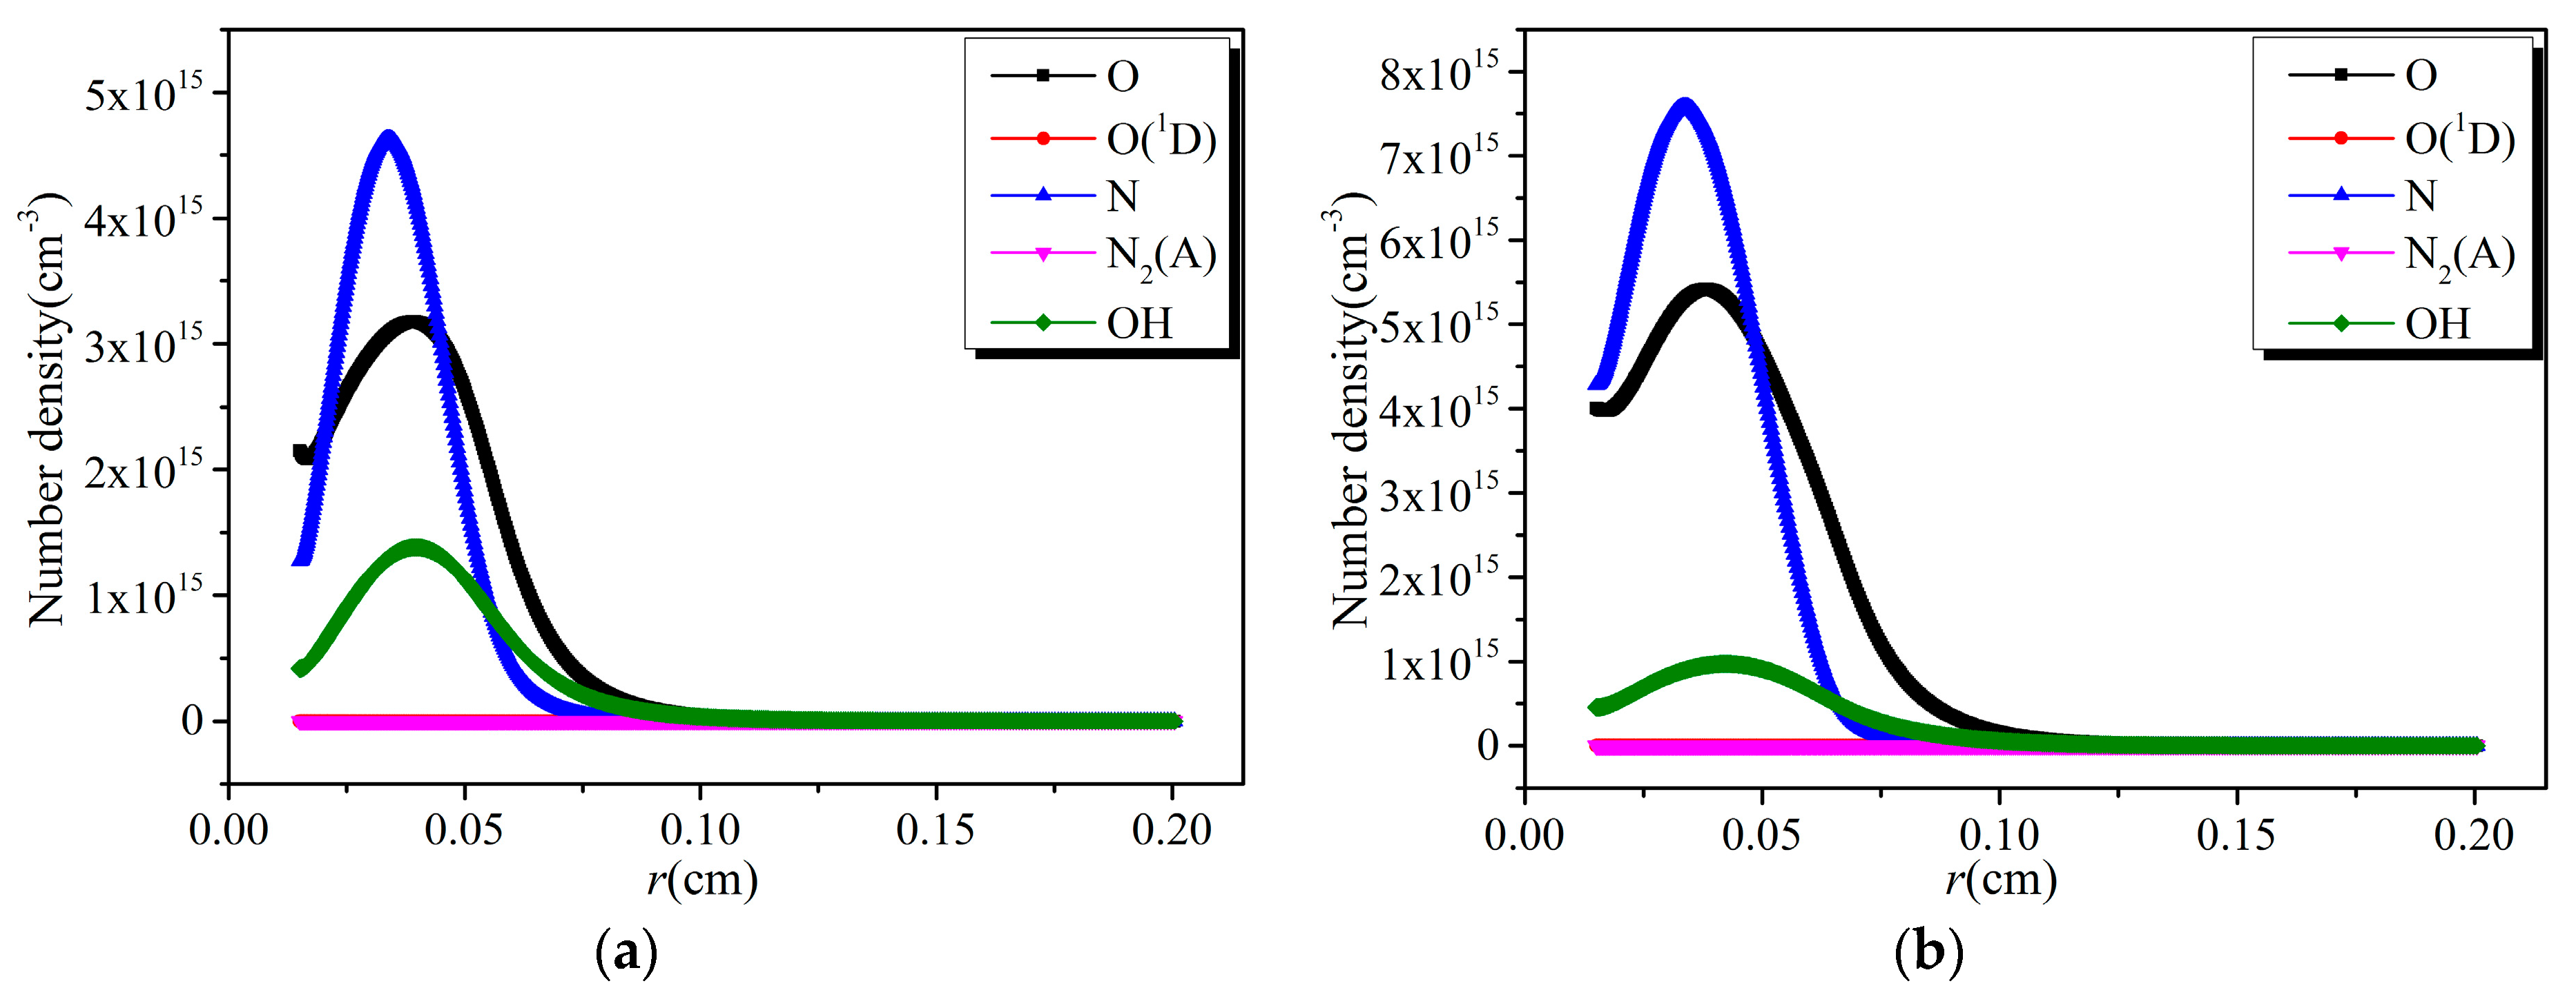
- (5)
- The removal of NO mainly depends on the reduction process in the region near the discharge electrode, while it mainly depends on the oxidation process in the region far away from the cathode. The sum of the number densities of HSO3 and H2SO4 is several orders of magnitude larger than that of SO3, which indicates that the oxidation by OH is the main path of SO2 removal.
Author Contributions
Funding
Conflicts of Interest
Appendix A

| Number | Reaction Equation | Number | Reaction Equation |
|---|---|---|---|
| R1 | e + O2 → e + O2 | R2 | e + O2 → O2− |
| R3 | e + O2 → O + O− | R4 | e + O2 → e + O2(ROT) |
| R5 | e + O2 → e + O2(VSUM) | R6 | e + O2 → e + O2(a1Δg) |
| R7 | e + O2 → e + O2(b1∑g+) | R8 | e + O2 → e + O2(4.5) |
| R9 | e + O2 → e + O + O | R10 | e + O2 → e + O + O(1D) |
| R11 | e + O2 → e + e + O2+ | R12 | e + O2 → e + e + O + O+ |
| R13 | e + N2 → e + N2 | R14 | e + N2 → e + N2*(0.02eV) |
| R15 | e + N2 → e + N2(V1) (0.29eV) | R16 | e + N2 → e + N2(V1) (0.291eV) |
| R17 | e + N2 → e + N2(V2) (0.59eV) | R18 | e + N2 → e + N2(V3) (0.88eV) |
| R19 | e + N2 → e + N2(V4) (1.17eV) | R20 | e + N2 → e + N2(V5) (1.47eV) |
| R21 | e + N2 → e + N2(V6) (1.76eV) | R22 | e + N2 → e + N2(V7) (2.06eV) |
| R23 | e + N2 → e + N2(V8) (2.35eV) | R24 | e + N2 → e + N2(A) |
| R25 | e + N2 → e + N2*(7eV) | R26 | e + N2 → e + N2*(7.35eV) |
| R27 | e + N2 → e + N2*(7.36eV) | R28 | e + N2 → e + N2*(7.8eV) |
| R29 | e + N2 → e + N2*(8.16eV) | R30 | e + N2 → e + N2*(8.4eV) |
| R31 | e + N2 → e + N2*(8.55eV) | R32 | e + N2 → e + N2*(8.89eV) |
| R33 | e + N2 → e + N2*(11.03eV) | R34 | e + N2 → e + N2*(11.88eV) |
| R35 | e + N2 → e + N2*(12.25eV) | R36 | e + N2 → e + N + N(13eV) |
| R37 | e + N2 → e + e + N2+ | R38 | e + H2O → e + H2O |
| R39 | e + H2O → H2 + O− | R40 | e + H2O → OH + H− |
| R41 | e + H2O → e + H2O(ROT) | R42 | e + H2O → e + H2O(010) |
| R43 | e + H2O → e + H2O(101) | R44 | e + H2O → e + H + OH |
| R45 | e + H2O → e + e + H2O+ | R46 | e + CO2 → e + CO2 |
| R47 | e + CO2 → CO + O− | R48 | e + CO2 → e + CO2(010) |
| R49 | e + CO2 → e + CO2(100) | R50 | e + CO2 → e + CO2(110) |
| R51 | e + CO2 → e + CO2(001) | R52 | e + CO2 → e + CO2(200) |
| R53 | e + CO2 → e + CO2(210) | R54 | e + CO2 → e + CO2(300) |
| R55 | e + CO2 → e+ CO2/1010 | R56 | e + CO2 → e + CO2(7) |
| R57 | e + CO2 → e + CO2(8) | R58 | e + CO2 → e + CO2(9) |
| R59 | e + CO2 → e + CO2/11.1 | R60 | e + CO2 → e + CO2/11.9 |
| R61 | e + CO2 → e + CO2/12.4 | R62 | e + CO2 → e + CO2/17.3 |
| R63 | e + CO2 → e + CO2/18.1 | R64 | e + CO2 → e + e + CO2+ |
Appendix B
| Number | Reaction Equation | Rate Coefficient | Reference |
|---|---|---|---|
| R65 | O2 + O2(a1Δg) → 2O2 | 2.2 × 10⁻¹⁸ | [15] |
| R66 | O2(a1Δg) + O2(a1Δg) → 2O2 | 2.0 × 10⁻¹⁷ | [15] |
| R67 | O + O2 → O3 | 1.0 × 10⁻¹⁴ | [15] |
| R68 | N2 + O3 → N2 + O2 + O | 2.0 × 10⁻²⁶ | [15] |
| R69 | O + O + N2 → O2 + N2 | 8.0 × 10⁻³³ | [15] |
| R70 | O + O3 → 2O2 | 1.0 × 10⁻¹⁴ | [15] |
| R71 | OH + OH → H2O + O | 2.0 × 10⁻¹² | [15] |
| R72 | OH + H + N2 → H2O + N2 | 5.0 × 10⁻³¹ | [15] |
| R73 | O + NO + N2 → NO2 + N2 | 9.0 × 10⁻³² | [15] |
| R74 | O + NO2 + N2 → NO3 + N2 | 9.0 × 10⁻³² | [15] |
| R75 | O + NO2 → NO + O2 | 1.0 × 10⁻¹¹ | [15] |
| R76 | NO3 + NO2 + N2 → N2O5 + N2 | 2.2 × 10⁻³⁰ | [15] |
| R77 | NO3 + NO → 2NO2 | 3.0 × 10⁻¹¹ | [15] |
| R78 | NO3 + O → NO2 + O2 | 1.7 × 10⁻¹¹ | [15] |
| R79 | NO2 + O3 → NO3 + O2 | 3.0 × 10⁻¹⁷ | [15] |
| R80 | NO + O3 → NO2 + O2 | 1.8 × 10⁻¹⁴ | [15] |
| R81 | N + NO → N2 + O | 5.9 × 10⁻¹¹ | [15] |
| R82 | N + NO2 → 2NO | 9.0 × 10⁻¹² | [15] |
| R83 | N + NO2 → N2O + O | 3.0 × 10⁻¹² | [15] |
| R84 | N + N + N2 → N2 + N2 | 4.0 × 10⁻³³ | [15] |
| R85 | N + O + N2 → NO + N2 | 1.0 × 10⁻³² | [15] |
| R86 | N + O2 → NO + O | 1.0 × 10⁻¹⁶ | [15] |
| R87 | N + O3 → NO + O2 | 1.0 × 10⁻¹⁶ | [15] |
| R88 | N2(A) + O2 → O2(a1Δg) + N2 | 1.0 × 10⁻¹² | [15] |
| R89 | N2(A) + O2 → N2 + O + O | 2.5 × 10⁻¹² | [15] |
| R90 | N2(A) + O2 → N2O + O | 7.8 × 10⁻¹⁴ | [15] |
| R91 | N2(A) + O → NO + N | 7.0 × 10⁻¹² | [15] |
| R92 | N2(A) + O → N2 + O | 2.0 × 10⁻¹¹ | [15] |
| R93 | N2(A) + N2O → N2 + N + NO | 1.0 × 10⁻¹¹ | [15] |
| R94 | N2(A) + N2O → 2N2 + O | 1.0 × 10⁻¹¹ | [15] |
| R95 | N2(A) + N2(A) → 2N2 | 2.0 × 10⁻¹² | [15] |
| R96 | N2(A) + N2 → 2N2 | 3.0 × 10⁻¹⁶ | [15] |
| R97 | N2(A) + NO → N2 + NO | 7.0 × 10⁻¹¹ | [15] |
| R98 | N2(A) + NO2 → N2 + NO + O | 1.0 × 10⁻¹² | [15] |
| R99 | O(1D) + H2O → 2OH | 2.2 × 10⁻¹⁰ | [15] |
| R100 | O(1D) + H2O → H2O + O | 1.2 × 10⁻¹¹ | [15] |
| R101 | O(1D) + O3 → 2O + O2 | 1.2 × 10⁻¹⁰ | [15] |
| R102 | O(1D) + O3 → 2O2 | 1.2 × 10⁻¹⁰ | [15] |
| R103 | O(1D) + NO → N + O2 | 1.7 × 10⁻¹⁰ | [15] |
| R104 | O(1D) + NO2 → NO + O2 | 1.4 × 10⁻¹⁰ | [15] |
| R105 | O(1D) + N2 → O + N2 | 2.6 × 10⁻¹¹ | [15] |
| R106 | O(1D) + O2 → O + O2(a1Δg) | 3.4 × 10⁻¹¹ | [15] |
| R107 | O(1D) + O2 → O + O2 | 6.3 × 10⁻¹² | [15] |
| R108 | O(1D) + N2 → O + N2 | 1.8 × 10⁻¹¹ | [15] |
| R109 | O(1D) + O + N2 → O2 + N2 | 9.9 × 10⁻³³ | [15] |
| R110 | O(1D) + N2O → 2NO | 6.7 × 10⁻¹¹ | [15] |
| R111 | O(1D) + N2O → N2 + O2 | 4.9 × 10⁻¹¹ | [15] |
| R112 | O(1D) + N2 + N2 → N2O + N2 | 3.5 × 10−37 | [15] |
| R113 | NO2 + OH → HNO3 | 1.0 × 10⁻¹¹ | [15] |
| R114 | NO + OH → HNO2 | 6.6 × 10⁻¹² | [15] |
| R115 | HNO2 + OH → NO2 + H2O | 0.5 × 10⁻¹¹ | [15] |
| R116 | HNO2 + HNO2 → NO + NO2 + H2O | 1.0 × 10⁻²⁰ | [15] |
| R117 | HNO2 + O → NO2 + OH | 3.0 × 10⁻¹⁵ | [15] |
| R118 | OH + SO2 → HSO3 | 7.5 × 10⁻¹² | [15] |
| R119 | OH + HSO3 → H2SO4 | 1.0 × 10⁻¹² | [15] |
| R120 | O + SO2 + N2 → SO3 + N2 | 1.4 × 10⁻³³ | [15] |
| R121 | O + SO3 + N2 → SO2 + O2 + N2 | 8.0 × 10⁻³⁰ | [15] |
| R122 | SO3 + H2O → H2SO4 | 6.0 × 10⁻¹⁵ | [15] |
| R123 | CO + O + N2 → CO2 + N2 | 4.7 × 10−36 | [15] |
| R124 | CO + OH → CO2 + H | 1.5 × 10⁻¹³ | [15] |
| R125 | NO3 + CO → NO2 + CO2 | 3.2 × 10⁻¹⁶ | [15] |
| R126 | N + CO2 → NO + CO | 1.0 × 10⁻¹⁴ | [15] |
| R127 | N2+ + e → N2 | 4.0 × 10⁻¹²+6.0 × 10⁻²⁷ [M] | [16] |
| R128 | N2+ + O2− → N2 + O2 | 1.6 × 10⁻⁷+3.0 × 10⁻²⁵ [M] | [16] |
| R129 | N2+ + O− → N2 + O | 4.0 × 10⁻⁷+3.0 × 10⁻²⁵ [M] | [16] |
| R130 | N2+ + NO− → N2 + NO | 4.0 × 10⁻⁷+3.0 × 10⁻²⁵ [M] | [16] |
| R131 | N2+ + NO2− → NO2 + N2 | 4.0 × 10⁻⁷+3.0 × 10⁻²⁵ [M] | [16] |
| R132 | O2+ + e → O + O(1D) | 2.1 × 10⁻⁷ | [16] |
| R133 | O2+ + e → O2 | 4.0 × 10⁻¹²+6.0 × 10⁻²⁷ [M] | [16] |
| R134 | O2+ + O− → O2 + O | 9.6 × 10⁻⁸+3.0 × 10⁻²⁵ [M] | [16] |
| R135 | O2+ + O2− → 2O2 | 4.2 × 10⁻⁷+3.0 × 10⁻²⁵[M] | [16] |
| R136 | H−+ O2+ → H + O2 | 2.0 × 10⁻⁷ | [15] |
| R137 | O2+ + NO− → NO + O2 | 4.0 × 10⁻⁷+3.0 × 10⁻²⁵ [M] | [16] |
| R138 | O2+ + NO2− → NO2 + O2 | 4.1 × 10⁻⁷+3.0 × 10⁻²⁵ [M] | [16] |
| R139 | O+ + e → O | 4.0 × 10⁻¹²+6.0 × 10⁻²⁷ [M] | [16] |
| R140 | O+ + O− → 2O | 2.7 × 10⁻⁷+3.0 × 10⁻²⁵ [M] | [16] |
| R141 | O+ + O2− → O + O2 | 4.0 × 10⁻⁷+3.0 × 10⁻²⁵ [M] | [16] |
| R142 | O+ + NO− → NO + O | 4.0 × 10⁻⁷+3.0 × 10⁻²⁵ [M] | [16] |
| R143 | O++ NO2− → NO + O2 | 4.0 × 10⁻⁷+3.0 × 10⁻²⁵ [M] | [16] |
| R144 | H2O+ + e → OH + H | 3.8 × 10⁻⁷ | [16] |
| R145 | H2O+ + e → H2 + O | 1.4 × 10⁻⁷ | [16] |
| R146 | H2O+ + e → 2H + O | 1.7 × 10⁻⁷ | [16] |
| R147 | H2O+ + e + M → H2O + M | 6.0 × 10⁻²⁷ | [16] |
| R148 | H2O+ + O− → H2O + O | 4.0 × 10⁻⁷+3.0 × 10⁻²⁵ [M] | [16] |
| R149 | H2O+ + O2− → H2O + O2 | 4.0 × 10⁻⁷+3.0 × 10⁻²⁵ [M] | [16] |
| R150 | H2O+ + NO− → NO + H2O | 4.0 × 10⁻⁷+3.0 × 10⁻²⁵ [M] | [16] |
| R151 | H2O+ + NO2− → NO2 + H2O | 4.0 × 10⁻⁷+3.0 × 10⁻²⁵ [M] | [16] |
| R152 | CO2+ + e → CO + O | 4.0 × 10⁻⁷ | [16] |
| R153 | CO2+ + e + M → CO2 + M | 6.0 × 10⁻²⁷ | [16] |
| R154 | CO2+ + O− → CO2 + O | 4.0 × 10⁻⁷+3.0 × 10⁻²⁵ [M] | [16] |
| R155 | CO2+ + O2− → CO2 + O2 | 4.0 × 10⁻⁷+3.0 × 10⁻²⁵ [M] | [16] |
| R156 | CO2+ + NO− → CO2 + NO | 4.0 × 10⁻⁷+3.0 × 10⁻²⁵ [M] | [16] |
| R157 | CO2+ + NO2− → CO2 + NO2 | 4.0 × 10⁻⁷+3.0 × 10⁻²⁵ [M] | [16] |
| R158 | NO+ + e → NO | 4.0 × 10⁻¹²+6.0 × 10⁻²⁷ [M] | [16] |
| R159 | NO+ + e + M → N + O + M | 1.0 × 10⁻²⁷ | [16] |
| R160 | NO+ + O− → O + NO | 4.9 × 10⁻⁷+3.0 × 10⁻²⁵ [M] | [16] |
| R161 | NO+ + O2− → NO + O2 | 4.0 × 10⁻⁷+3.0 × 10⁻²⁵ [M] | [16] |
| R162 | NO+ + NO− → O2 + N2 | 4.0 × 10⁻⁷+3.0 × 10⁻²⁵ [M] | [16] |
| R163 | NO+ + NO2− → NO2 + N + O | 1.0 × 10⁻⁷ | [16] |
| R164 | NO+ + NO2− → NO + NO2 | 3.5 × 10⁻⁷+3.0 × 10⁻²⁵ [M] | [16] |
| R165 | NO2+ + e → NO + O | 3.0 × 10⁻⁷ | [16] |
| R166 | NO2+ + e + M → NO2 + M | 6.0 × 10⁻²⁷ | [16] |
| R167 | NO2+ + O− → NO + O2 | 4.0 × 10⁻⁷+3.0 × 10⁻²⁵ [M] | [16] |
| R168 | NO2+ + O2− → NO2 + O2 | 4.0 × 10⁻⁷+3.0 × 10⁻²⁵ [M] | [16] |
| R169 | NO2+ + NO− → N2O + O2 | 4.0 × 10⁻⁷+3.0 × 10⁻²⁵ [M] | [16] |
| R170 | NO2+ + NO2− → 2O2 + N2 | 4.0 × 10⁻⁷+3.0 × 10⁻²⁵ [M] | [16] |
| R171 | O2+ + NO → NO+ + O2 | 3.5 × 10⁻¹⁰ | [16] |
| R172 | O2+ + NO2 → NO2+ + O2 | 6.0 × 10⁻¹⁰ | [16] |
| R173 | O2+ + NO2 → NO+ + O3 | 1.0 × 10⁻¹¹ | [15] |
| R174 | O2+ + N → NO+ + O | 1.8 × 10⁻¹⁰ | [16] |
| R175 | O−+ O2 → O2− + O | 1.0 × 10⁻¹⁰ | [15] |
| R176 | O−+ NO → e + NO2 | 3.1 × 10⁻¹⁰ | [16] |
| R177 | O−+ SO2 → SO3 + e | 2.0 × 10⁻⁹ | [15] |
| R178 | e + 2O2 → O2− + O2(a1Δg) | 3.3 × 10−39 | [16] |
| R179 | e + NO + M → NO− + M | 8.0 × 10⁻³¹ | [16] |
| R180 | e + NO2 + M→ NO2− + M | 1.5 × 10⁻³⁰ | [16] |
| R181 | e + HNO3 → NO2− + OH | 5.0 × 10⁻⁸ | [16] |
References
- Anaghizi, S.J.; Talebizadeh, P.; Rahimzadeh, H.; Ghomi, H. The configuration effects of electrode on the performance of dielectric barrier discharge reactor for NOx removal. IEEE Trans. Plasma Sci. 2015, 43, 1944–1953. [Google Scholar] [CrossRef]
- Wang, M.; Sun, Y.; Zhu, T. Removal of NOx, SO2, and Hg from simulated flue gas by plasma-absorption hybrid system. IEEE Trans. Plasma Sci. 2013, 41, 312–318. [Google Scholar] [CrossRef]
- Yu, C.J.; Xu, F.; Luo, Z.Y.; Cao, W.; Wei, B.; Gao, X.; Fang, M.X.; Cen, K.F. Influences of water vapor and fly ash addition on NO and SO2 gas conversion efficiencies enhanced by pulsed corona discharge. J. Electrost. 2009, 67, 829–834. [Google Scholar] [CrossRef]
- Yan, K.; Li, R.; Zhu, T.; Zhang, H.; Hu, X.; Jiang, X.; Liang, H.; Qiu, R.; Wang, Y. A semi-wet technological process for flue gas desulfurization by corona discharges at an industrial scale. Chem. Eng. J. 2006, 116, 139–147. [Google Scholar] [CrossRef]
- Lee, Y.H.; Jung, W.S.; Choi, Y.R.; Oh, J.S.; Jang, S.D.; Son, Y.G.; Cho, M.; Namkung, W.; Koh, D.J.; Mok, Y.S.; et al. Application of pulsed corona induced plasma chemical process to an industrial incinerator. Environ. Sci. Technol. 2003, 37, 2563–2567. [Google Scholar] [CrossRef] [PubMed]
- Jõgi, I.; Haljaste, A.; Laan, M. Hybrid TiO2 based plasma-catalytic reactors for the removal of hazardous gasses. Surf. Coat. Technol. 2014, 242, 195–199. [Google Scholar] [CrossRef]
- Huang, L.; Dang, Y. Removal of SO2 and NOx by pulsed corona combined with in situ Ca(OH)2 absorption. Chin. J. Chem. Eng. 2011, 19, 518–522. [Google Scholar] [CrossRef]
- Kim, H.H. Nonthermal plasma processing for air-pollution control: A historical review, current issues, and future prospects. Plasma Process. Polym. 2004, 1, 91–110. [Google Scholar] [CrossRef]
- Li, L.W.; Yu, G.; Yu, Q. Simulation of simultaneous removal of SO2 and NO using pulsed discharge. J. Adv. Oxid. Technol. 2012, 15, 163–169. [Google Scholar] [CrossRef]
- Teodoru, S.; Kusano, Y.; Bogaerts, A. The effect of O2 in a humid O2/N2/NOx gas mixture on NOx and N2O remediation by an atmospheric pressure dielectric barrier discharge. Plasma Process. Polym. 2012, 9, 652–689. [Google Scholar] [CrossRef]
- Yin, S.E. Numerical simulation of NO conversion in the N2/O2/NO by dielectric barrier discharge. Appl. Mech. Mater. 2011, 84–85, 426–430. [Google Scholar] [CrossRef]
- Li, Z.; Zhao, Z.; Li, X. Modeling of plasma chemistry in an atmospheric pressure Ar/NH3 cylindrical dielectric barrier discharge described using the one-dimensional fluid model. Phys. Plasmas 2013, 20, 2782–2783. [Google Scholar] [CrossRef]
- Eylenceoǧlu, E.; Rafatov, I. Two-dimensional hybrid model for a glow discharge: Comparison with fluid and kinetic (particle) models, reliability and accuracy. J. Phys. Conf. Ser. 2014, 572. [Google Scholar] [CrossRef]
- Tebani, H.; Hennad, A. Three-dimensional modelling of the DC glow discharge using the second order fluid model. Przegl. Elektrotech. 2013, 89, 166–171. [Google Scholar]
- Lowke, J.J.; Morrow, R. Theoretical analysis of removal of oxides of sulphur and nitrogen in pulsed operation of electrostatic precipitators. IEEE Trans. Plasma Sci. 1995, 23, 661–671. [Google Scholar] [CrossRef]
- Mätzing, H. Chemical kinetics of flue gas cleaning by irradiation with electrons. Adv. Chem. Phys. 1991, 80, 315–402. [Google Scholar] [CrossRef]
- Hagelaar, G.J.M.; Pitchford, L.C. Solving the Boltzmann equation to obtain electron transport coefficients and rate coefficients for fluid models. Plasma Sources Sci. Technol. 2005, 14, 722–733. [Google Scholar] [CrossRef]
- Wesselingh, J.A.; Krishna, R. Mass Transfer in Multicomponent Mixtures, 1st ed.; Delft University Press: Delft, The Netherlands, 2000; ISBN 90-407-2071-1. [Google Scholar]
- Krishna, R.; Wesselingh, J.A. The Maxwell-Stefan approach to mass transfer. Chem. Eng. Sci. 1997, 52, 861–911. [Google Scholar] [CrossRef]
- Guo, S.H. Electrodynamics, 3rd ed.; Higher Education Press: Beijing, China, 2008; ISBN 978-7-04-023924-9. [Google Scholar]
- Yang, B.C.; Liu, X.B.; Dai, Y.S. High Voltage Technology, 3rd ed.; Chongqing University Press: Chongqing, China, 2018; ISBN 978-7-5624-2441-3. [Google Scholar]
- LXcat. Available online: https://nl.lxcat.net/home/ (accessed on 27 October 2018).
- TRINITI Database. Available online: https://fr.lxcat.net/contributors/#d24 (accessed on 27 October 2018).
- Morgan (Kinema Research & Software). Available online: https://fr.lxcat.net/contributors/#d16 (accessed on 27 October 2018).
- Farouk, T.; Farouk, B.; Staack, D.; Gutsol, A.; Fridman, A. Simulation of dc atmospheric pressure argon micro glow-discharge. Plasma Sources Sci. Technol. 2006, 15, 676–688. [Google Scholar] [CrossRef]
- Hagelaar, G.J.M.; de Hoog, F.J.; Kroesen, G.M.W. Boundary conditions in fluid models of gas discharges. Phys. Rev. E Stat. Phys. Plasmas Fluids Relat. Interdiscip. Top. 2000, 62, 1452–1454. [Google Scholar] [CrossRef]
- Greb, A.; Niemi, K.; O’Connell, D.; Ennis, G.J.; MacGearailt, N.; Gans, T. Improved fluid simulations of radio-frequency plasmas using energy dependent ion mobilities. Phys. Plasmas 2013, 20, 053502. [Google Scholar] [CrossRef]
- Li, S.; Huang, Y.; Wang, F.; Liu, J.; Feng, F.; Shen, X.; Zheng, Q.; Liu, Z.; Wang, L.; Yan, K. Fundamentals and environmental applications of non-thermal plasmas: Multi-pollutants emission control from coal-fired flue gas. Plasma Chem. Plasma Process. 2014, 34, 579–603. [Google Scholar] [CrossRef]


© 2018 by the authors. Licensee MDPI, Basel, Switzerland. This article is an open access article distributed under the terms and conditions of the Creative Commons Attribution (CC BY) license (http://creativecommons.org/licenses/by/4.0/).
Share and Cite
Zhang, C.; Yang, L. One-Dimensional Simulation of Synergistic Desulfurization and Denitrification Processes for Electrostatic Precipitators Based on a Fluid-Chemical Reaction Hybrid Model. Energies 2018, 11, 3249. https://doi.org/10.3390/en11123249
Zhang C, Yang L. One-Dimensional Simulation of Synergistic Desulfurization and Denitrification Processes for Electrostatic Precipitators Based on a Fluid-Chemical Reaction Hybrid Model. Energies. 2018; 11(12):3249. https://doi.org/10.3390/en11123249
Chicago/Turabian StyleZhang, Chao, and Lixin Yang. 2018. "One-Dimensional Simulation of Synergistic Desulfurization and Denitrification Processes for Electrostatic Precipitators Based on a Fluid-Chemical Reaction Hybrid Model" Energies 11, no. 12: 3249. https://doi.org/10.3390/en11123249