Article

A Centralized Smart Decision-Making Hierarchical Interactive Architecture for Multiple Home Microgrids in Retail Electricity Market

by
Masoumeh Javadi
1,2,
Mousa Marzband
3,4,
Mudathir Funsho Akorede
5,
Radu Godina
6,*,
Ameena Saad Al-Sumaiti
7 and
Edris Pouresmaeil
8
1
Department of Electrical Power Engineering, Guilan Science and Research Branch, Islamic Azad University, Rasht 4147654919, Iran
2
Department of Electrical Power Engineering, Rasht Branch, Islamic Azad University, Rasht 4147654919, Iran
3
Faculty of Engineering and Environment, Department of Maths, Physics and Electrical Engineering, Northumbria University Newcastle, Newcastle upon Tyne NE1 8ST, UK
4
Department of Electrical Engineering, Lahijan Branch, Islamic Azad University, Lahijan 4416939515, Iran
5
Department of Electrical & Electronics Engineering, Faculty of Engineering and Technology, University of Ilorin, P.M.B. 1515 Ilorin, Nigeria
6
Centre for Aerospace Science and Technologies—Department of Electromechanical Engineering, University of Beira Interior, 6201-001 Covilhã, Portugal
7
Electrical and Computer Engineering, Khalifa University, Abu Dhabi 127788, UAE
8
Department of Electrical Engineering and Automation, Aalto University, 02150 Espoo, Finland
*
Author to whom correspondence should be addressed.
Energies 2018, 11(11), 3144; https://doi.org/10.3390/en11113144
Submission received: 3 October 2018 / Revised: 6 November 2018 / Accepted: 10 November 2018 / Published: 14 November 2018
(This article belongs to the Special Issue Communications in Microgrids)

Abstract

:
The principal aim of this study is to devise a combined market operator and a distribution network operator structure for multiple home-microgrids (MH-MGs) connected to an upstream grid. Here, there are three distinct types of players with opposite intentions that can participate as a consumer and/or prosumer (as a buyer or seller) in the market. All players that are price makers can compete with each other to obtain much more possible profitability while consumers aim to minimize the market-clearing price. For modeling the interactions among partakers and implementing this comprehensive structure, a multi-objective function problem is solved by using a static, non-cooperative game theory. The propounded structure is a hierarchical bi-level controller, and its accomplishment in the optimal control of MH-MGs with distributed energy resources has been evaluated. The outcome of this algorithm provides the best and most suitable power allocation among different players in the market while satisfying each player’s goals. Furthermore, the amount of profit gained by each player is ascertained. Simulation results demonstrate 169% increase in the total payoff compared to the imperialist competition algorithm. This percentage proves the effectiveness, extensibility and flexibility of the presented approach in encouraging participants to join the market and boost their profits.

1. Introduction

A home microgrid (H-MG) consists of locally distributed energy resources (DERs) which comprise non-dispatchable renewable energy resources, dispatchable resources, energy storage (ES) and responsive load demand (RLD). It can either supply its local loads independently or connected to the upstream grid. For an optimal use of the DERs present in a H-MG, the mismatch of power between the energy production and consumption must be reduced to the barest minimum [1]. Operating a H-MG optimally would not only contribute to the electric utility profit [2], but also would improve the reliability of the system besides the proper load distribution management [3]. Indeed, the optimum exploitation of H-MGs has become an important topic necessitating further research to achieve better operation of their hybrid energy resources and also their demand management. Hence, hierarchical domination structures have been executed to guarantee a dependable performance of the power flow among DC H-MG groups in a neighborhood system [4] and also connect to an AC bus to adjust the system stability [5]. However, during implementing the economic dispatch in H-MGs, decisions of an energy management system (EMS) could be affected by DER, ES and RLD bids [6]. In addition, achieving a dynamic exploitation and control plans for a hybrid H-MG can assist in providing reactive power and set the voltage [7,8] in order to solve problems of power stability like oscillations in a hybrid multi-system [9], asymmetrical faults [10] and ground fault [11]. Designing an efficient EMS at the residential level depends heavily on the electricity price and necessitates the consideration of households patterns [12]. Furthermore, the remarkable participation of householders whose houses are equipped with renewable energy resources and ES in demand response programs, while reducing carbon emissions would make an impact on the market as they are to reduce their cost [13]. So, for expanding these participators in demand-side management programs, the EMS needs an interactive and user-friendly interface with secure communication [14]. Moreover, H-MGs should be armed with a decision support tool for adopting their initial strategies [15] based on local optimization of DER operation and energy usage by a domestic energy management controller [16] that enable them to engage in the market eagerly.
Consequently, one of the benefits of operating multiple home-microgrid (MH-MG) systems is the concurrent operation and the optimum use of DERs existing in each H-MG. This implies strategies for storing energy in a H-MG during excess generation in other H-MGs and/or supplying the required demand of the H-MG that cannot meet its power demand. In other words, H-MGs can play the role of both a generating player and a consuming player during the time period [17]. Hence, a H-MG could either meet its demand from the energy produced by itself or seek aid from other H-MGs [18]. The H-MG with excess generation (generating player) must supply its power to H-MGs having a power shortage (consuming player) and/or to the upstream grid.
To attain this goal, tools such as the active response of consumers to the demand [19], the implementation of a powerful EMS [20], and the adequate power dispatch in smart grids are required. One of the challenges in this regard is the coordination between energy management functions, having concentrated control or hierarchical systems inside H-MGs [21]. Another challenge is the selection of an adequate formula for the optimization problem considering the keen competition between partakers with contradictory intentions. Although an economic dispatch of DERs in a MH-MG system through applying the Carnot model has been presented in [18], a multi-objective function for reaching the collective payoff within competition between diverse players under game theory procedure has not been studied. Furthermore, reference [22] presented a statical optimization formula but the distributed storage system was not considered in that study. However, dynamic energy storage systems models for the overall energy management of H-MGs were proposed in [23].
In the same vein, a parallel exploitation of H-MGs was investigated in [24], just as the technical frameworks and the economic aspects of this structure was presented in [25]. Results of the investigations showed that in addition to creating a competitive market, the back-to-back connections among H-MGs could provide much better separation and load distribution control relative to the single H-MG structure.
H-MGs receiving power supply and other H-MGs must have the possibility of using an upstream grid, the non-dispatchable units (NDUs) and their local energy storage systems. In addition, H-MGs ought to have access to other neighboring H-MGs for swapping excess electricity while all types of players are satisfied with the best possible way they achieve their defined objective functions. This is the duty of the EMS as it satisfies technical and economic constraints related to each generation and consumption to establish the best choice for power equilibrium in the network [26]. In a system of MH-MGs, the distribution networks (market operator (MO) and a distribution network operator (DNO)), and H-MGs desire the optimum utilization of power generation and consumption resources. To attain higher reliability, the EMSs must have this capability to store the maximum possible energy in ESs of each H-MG. From this viewpoint, the optimum design of a system with MH-MG leads to the coincident optimization of H-MGs and distribution network pay-offs. Such a design has a dynamic programming nature.
In this paper, a retail market optimization structure for multi-ownership systems with MH-MG including players with opposite goals is recommended. Using a non-cooperative game theory approach based on the supply function model assists in analyzing the electricity buyers and sellers’ individual behaviors in the market by enabling a competition in energy trading between H-MGs. Therefore, an active distributed system through the presented method will be provided. The proposed structure can handle the interconnection of MH-MGs with various DER resources capacities and the independent and communal performance of each H-MG. Indeed, this structure is comprehensive in its capability of accepting any DER technology and the participation of distribution companies (retailers) in the market structure. The proposed structure is advantageous as it can improve the economic productivity of the participating H-MGs.
The significant contributions of this study can be described as follows:
  • Persuading further residential users to be equiped with DERs and ES in order to be involved in energy trading and RLD management program;
  • Proposing a retail competition market model to trade distributed energy by ensuring fairness among non-cooperative players through a stochastic, and autonomous decision-making structure;
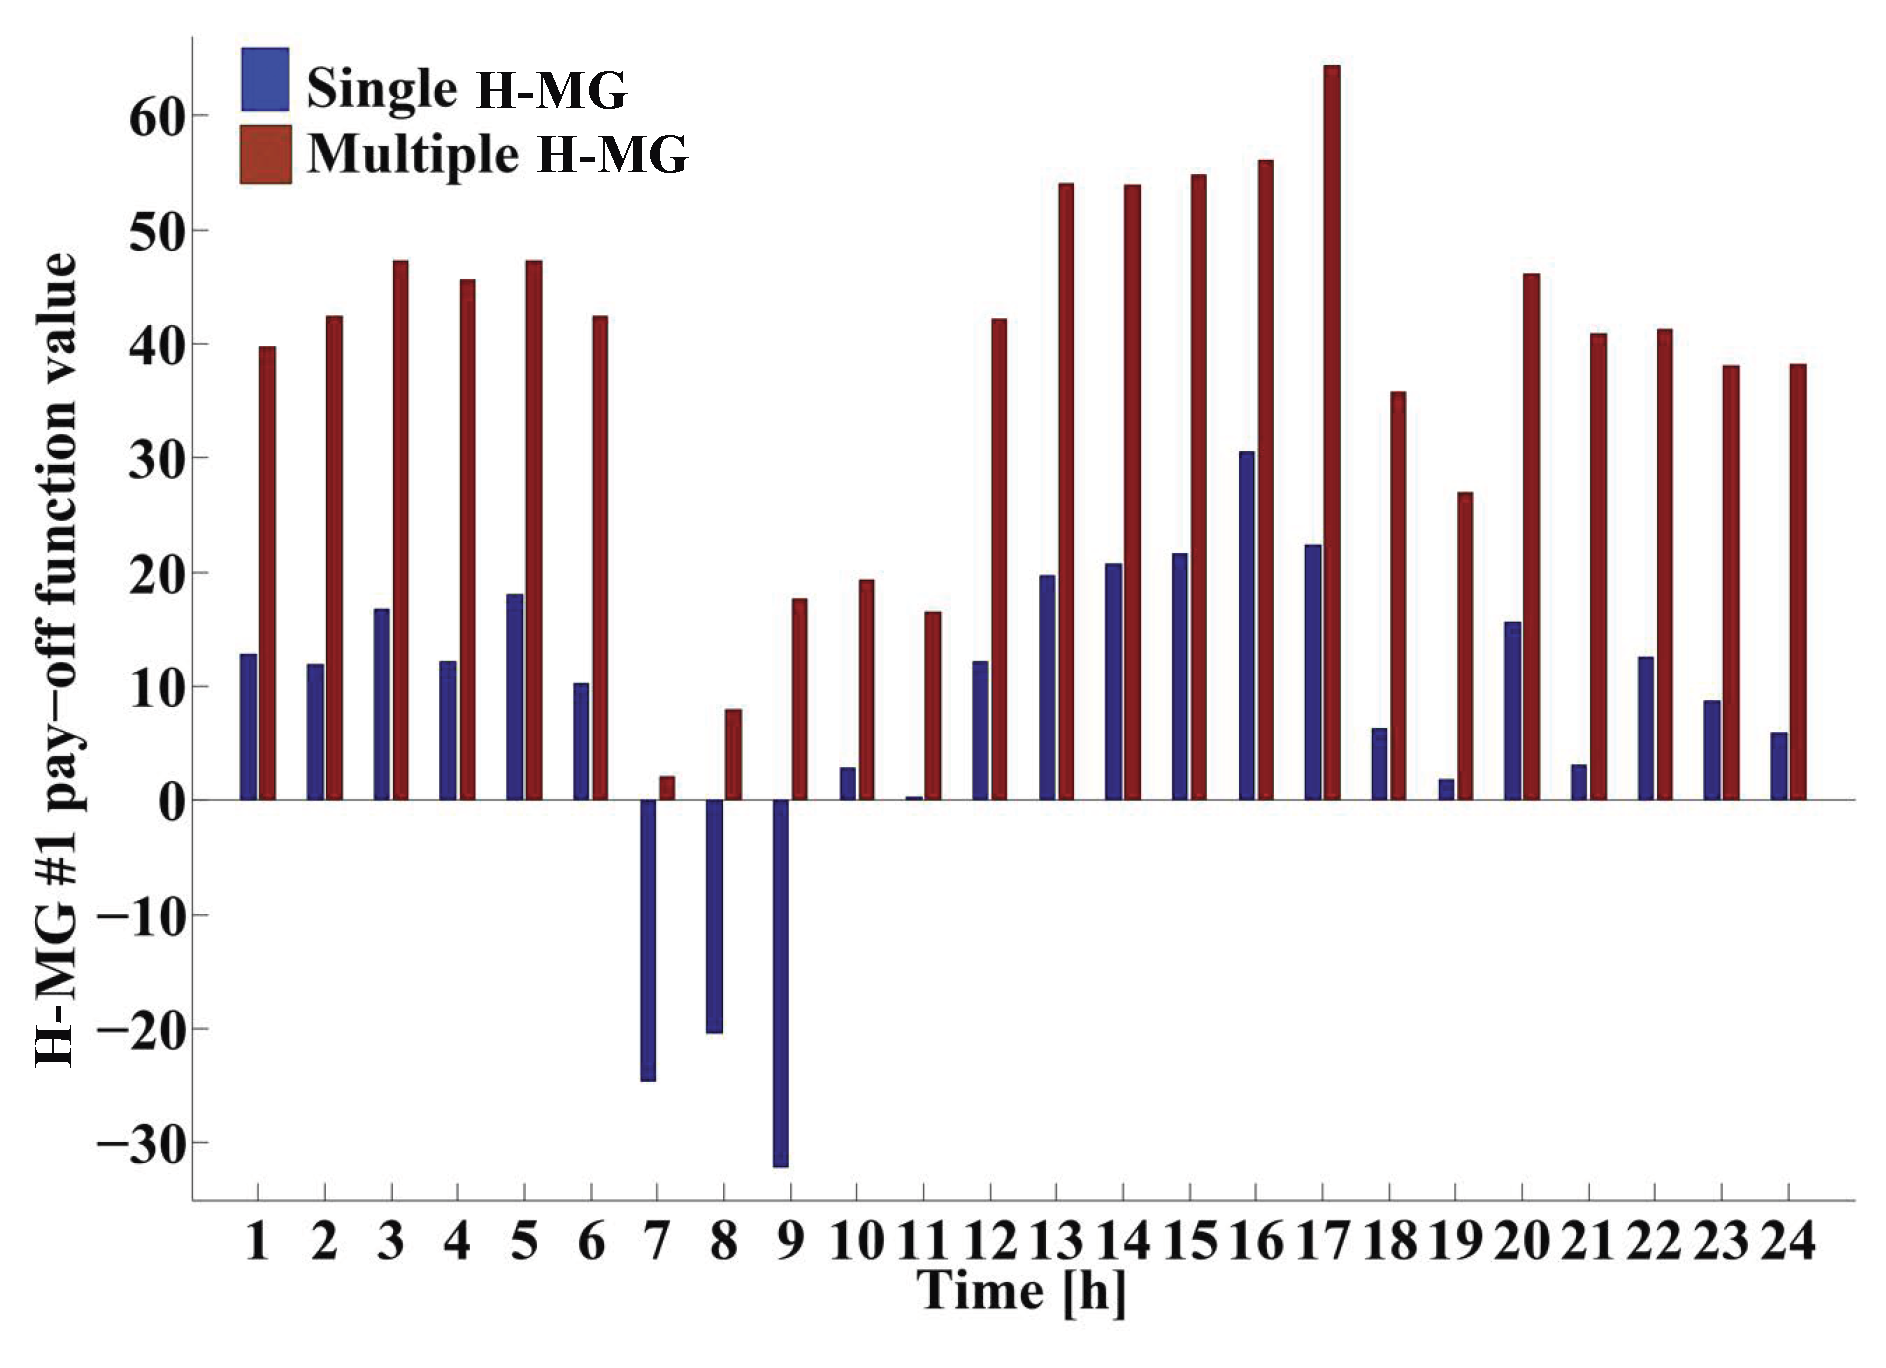
  • Enhancing the economic operation and profitably of all members (about 169% boost in the collective payoff compared with the imperialist competition algorithm (ICA) results [18]).
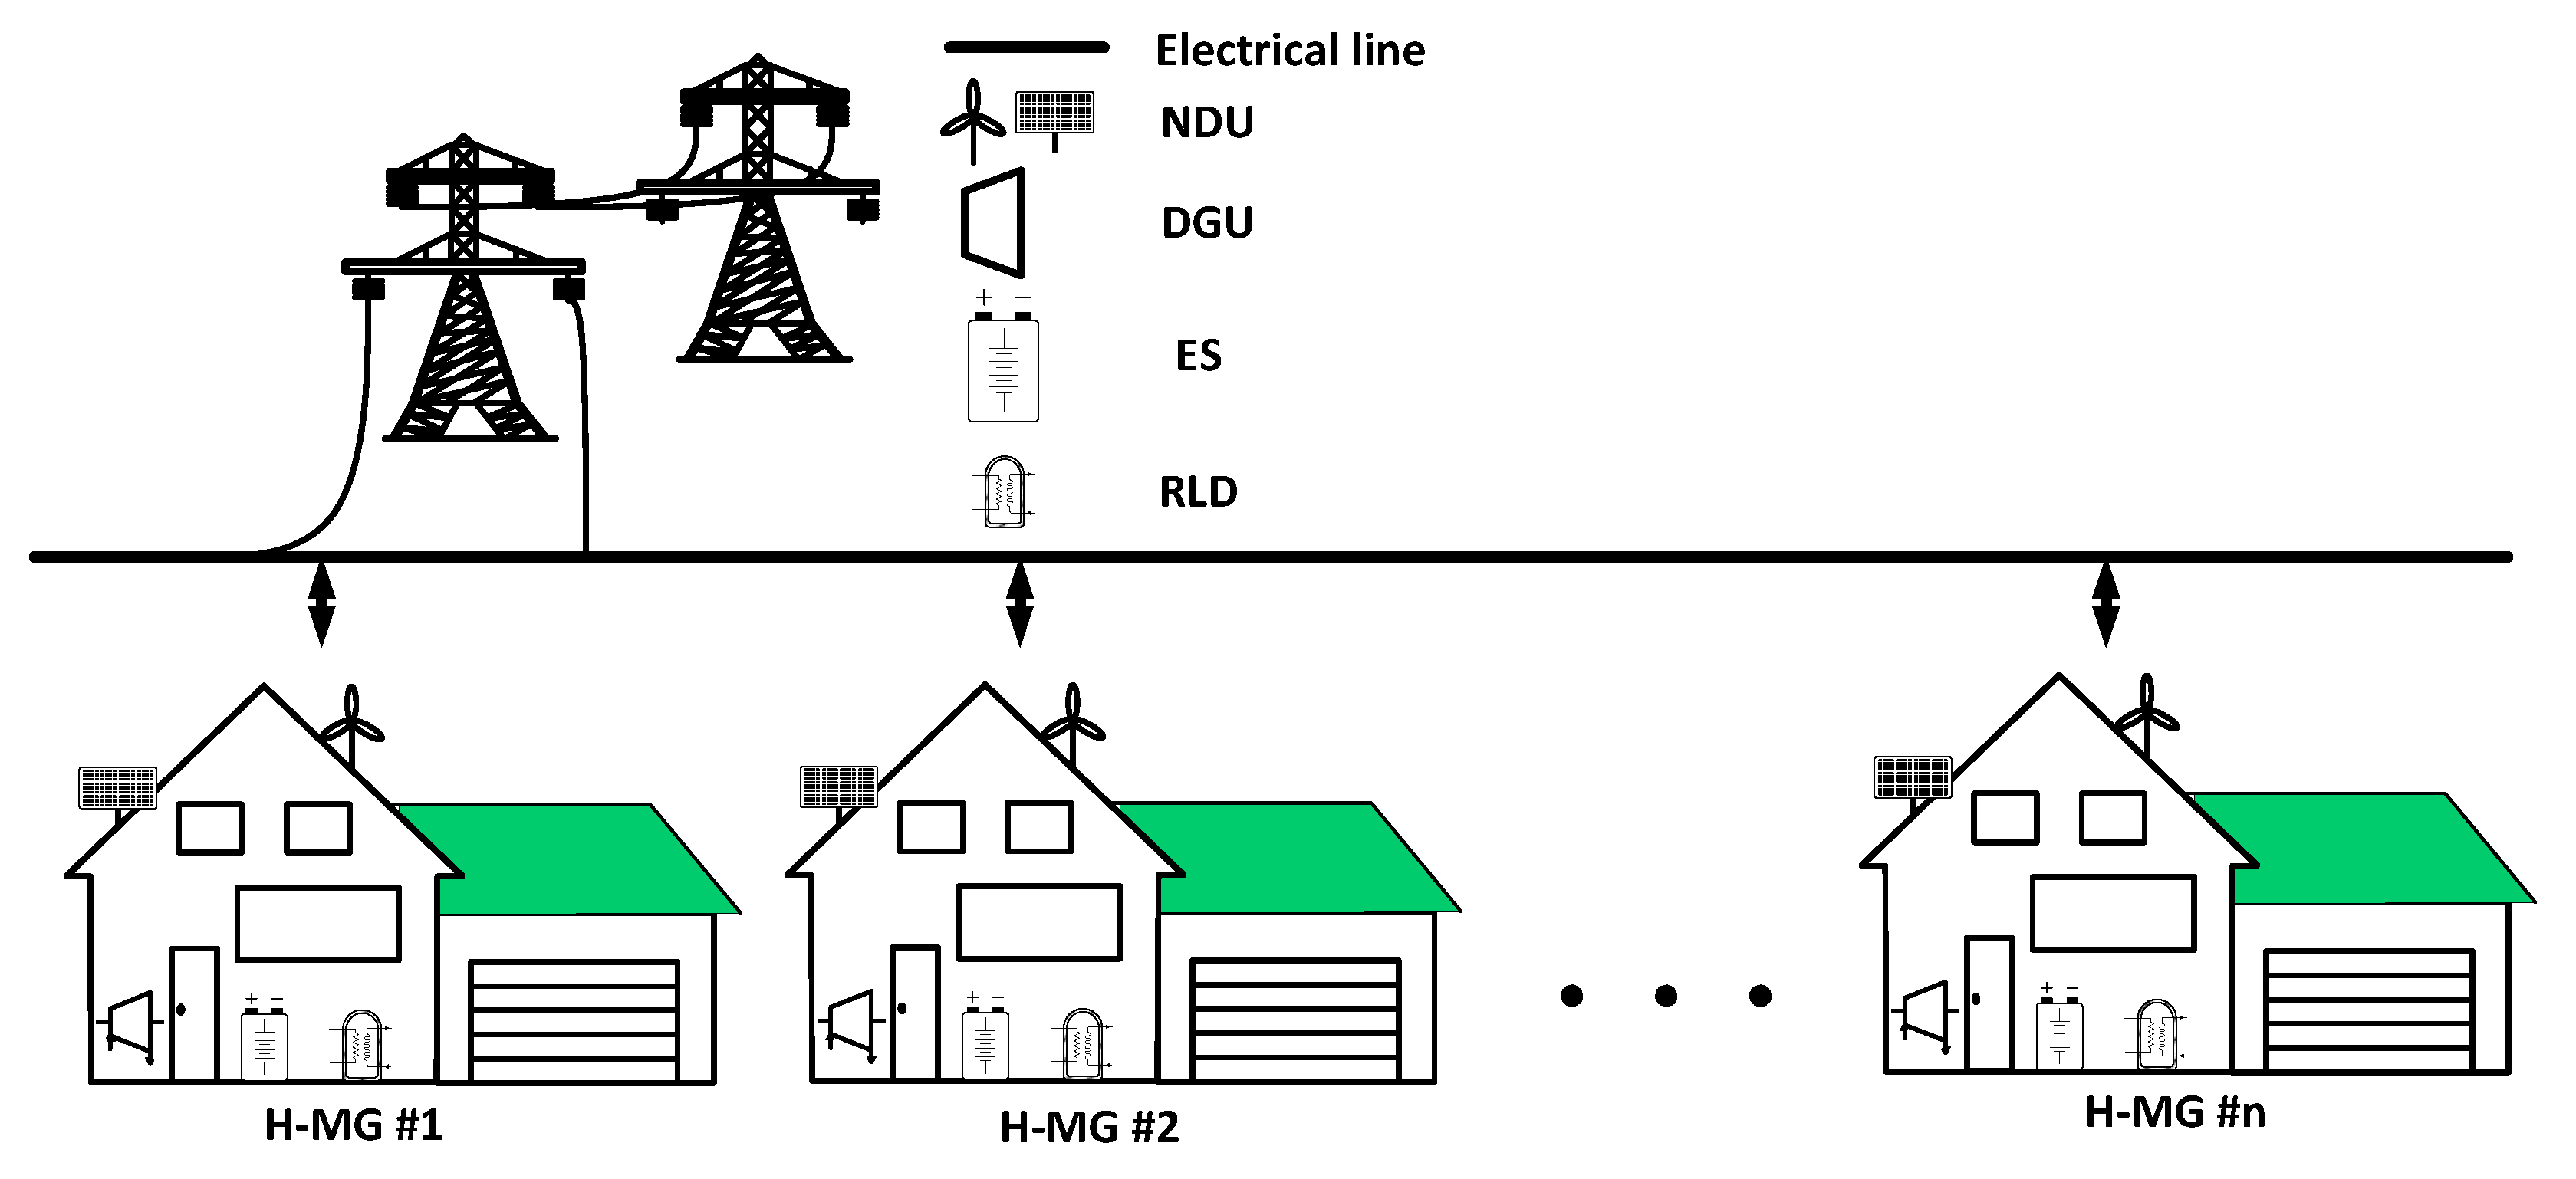
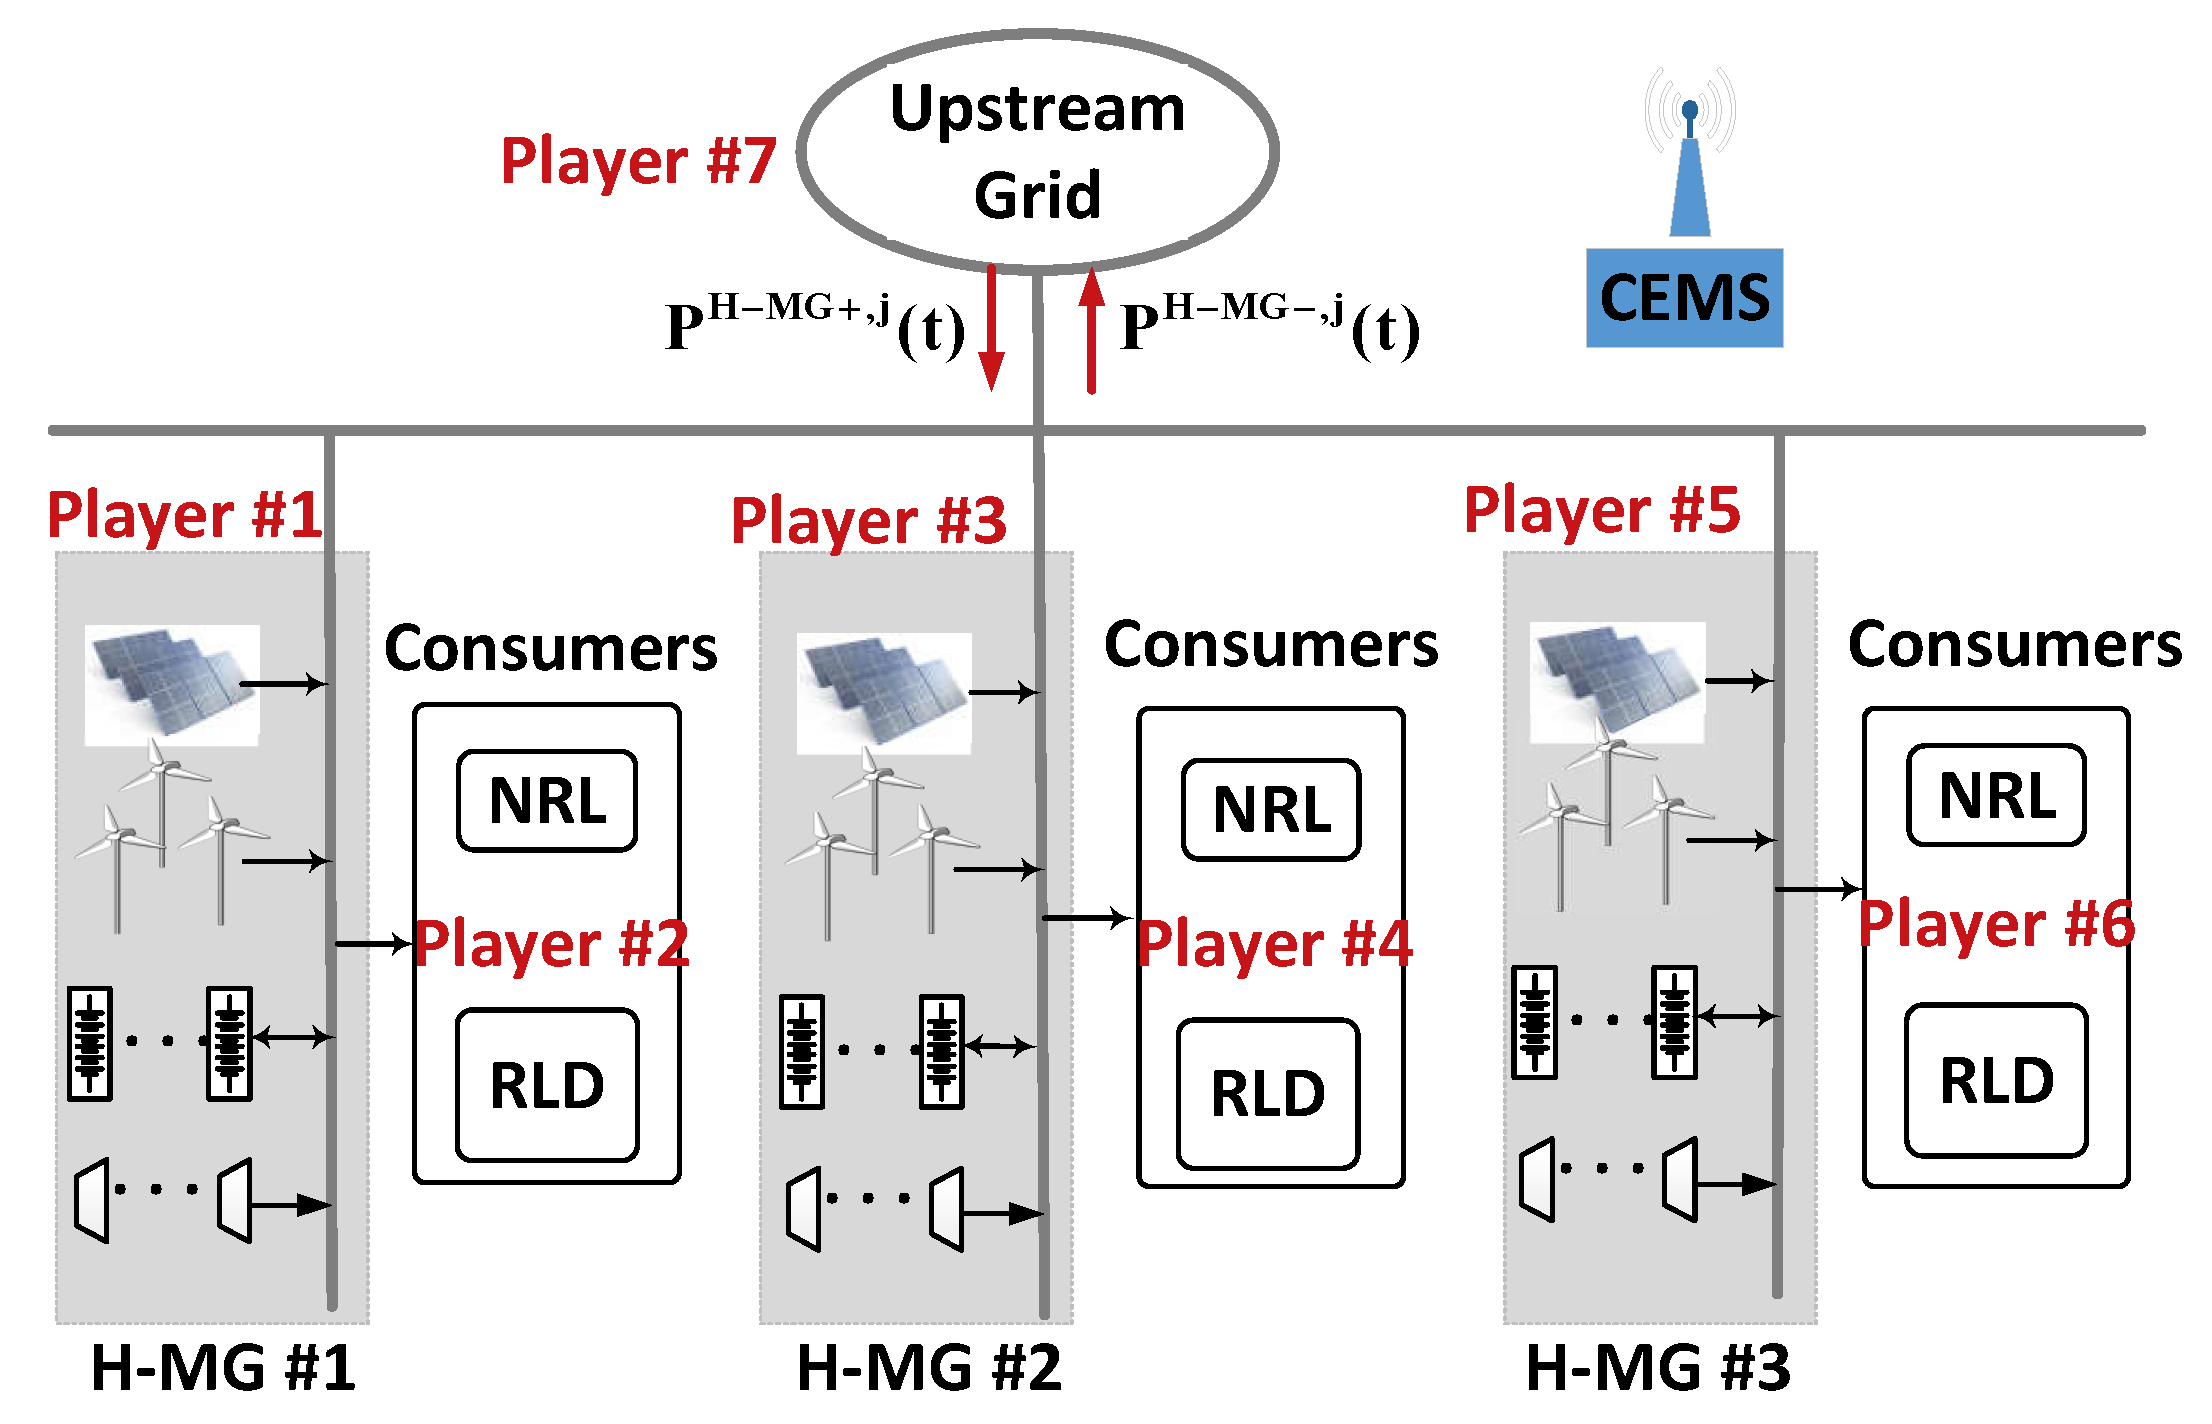
The remainder of the paper is organized as follows: The overview of the MH-MG concept is provided in Section 2. The general outline of the network under study is presented in Section 3. The proposed market structure is described in Section 4. The market optimization problem formulation is explained in Section 5. The procedure of implementing the Nikaido-Isoda/relaxation algorithm (NIRA) is stated in Section 6. Simulation results and discussion of the proposed case study is validated in Section 7. The conclusion is given in Section 8.

2. MH-MG Concept

The MH-MG system in this paper, shown in Figure 1, refers to a network of H-MGs that swap electricity with each other to supply their neighbors’ shortage whereas trying to maximize their own payoffs. Indeed, each individual H-MG is like a green building that consists of local generation resources, ES devices and loads. Similar to conventional MGs, green buildings are able to autonomously support their demand to some extent [27]. These kinds of buildings possess the ability to act as a generation, storage, and demand response unit, in a similar manner to a MG. Also, green buildings can take part in a retail market to trade energy with other green buildings [18]. Since the main focus of this study is on managing local energy networks of a residential district, the concept of MH-MG has been used in this paper as in other research at the residential level [3,28,29,30].
In fact, similar to interoperability of multiple MGs in an integrated system, H-MGs with excess generation are able to supply other H-MGs’ needs that a face power shortage. Thus, some H-MGs act as generators for maximizing their profits resulting from selling energy to the market and others act as consumers for reducing electricity price through demand-side management. On the other hand, like multiple MG network, an EMS for monitoring players’ strategies and therefore adopting fair decisions in energy trading is necessary. Therefore, a central energy management system (CEMS) is an essential element in the MH-MG network.
For participating in electricity deals in the market, each H-MG in this paper is formed of two players including a generator and a consumer. This characteristic is considered here in order to contribute to implementing the market structure related to every ownership condition. For instance, at a time when a H-MG’s tenants are not the possessor of the building, DERs or ES devices, the owner of building is the generating player and the tenant is the consuming player. In this case, the formulation of players’ tactics in a competitive situation is conveniently possible.

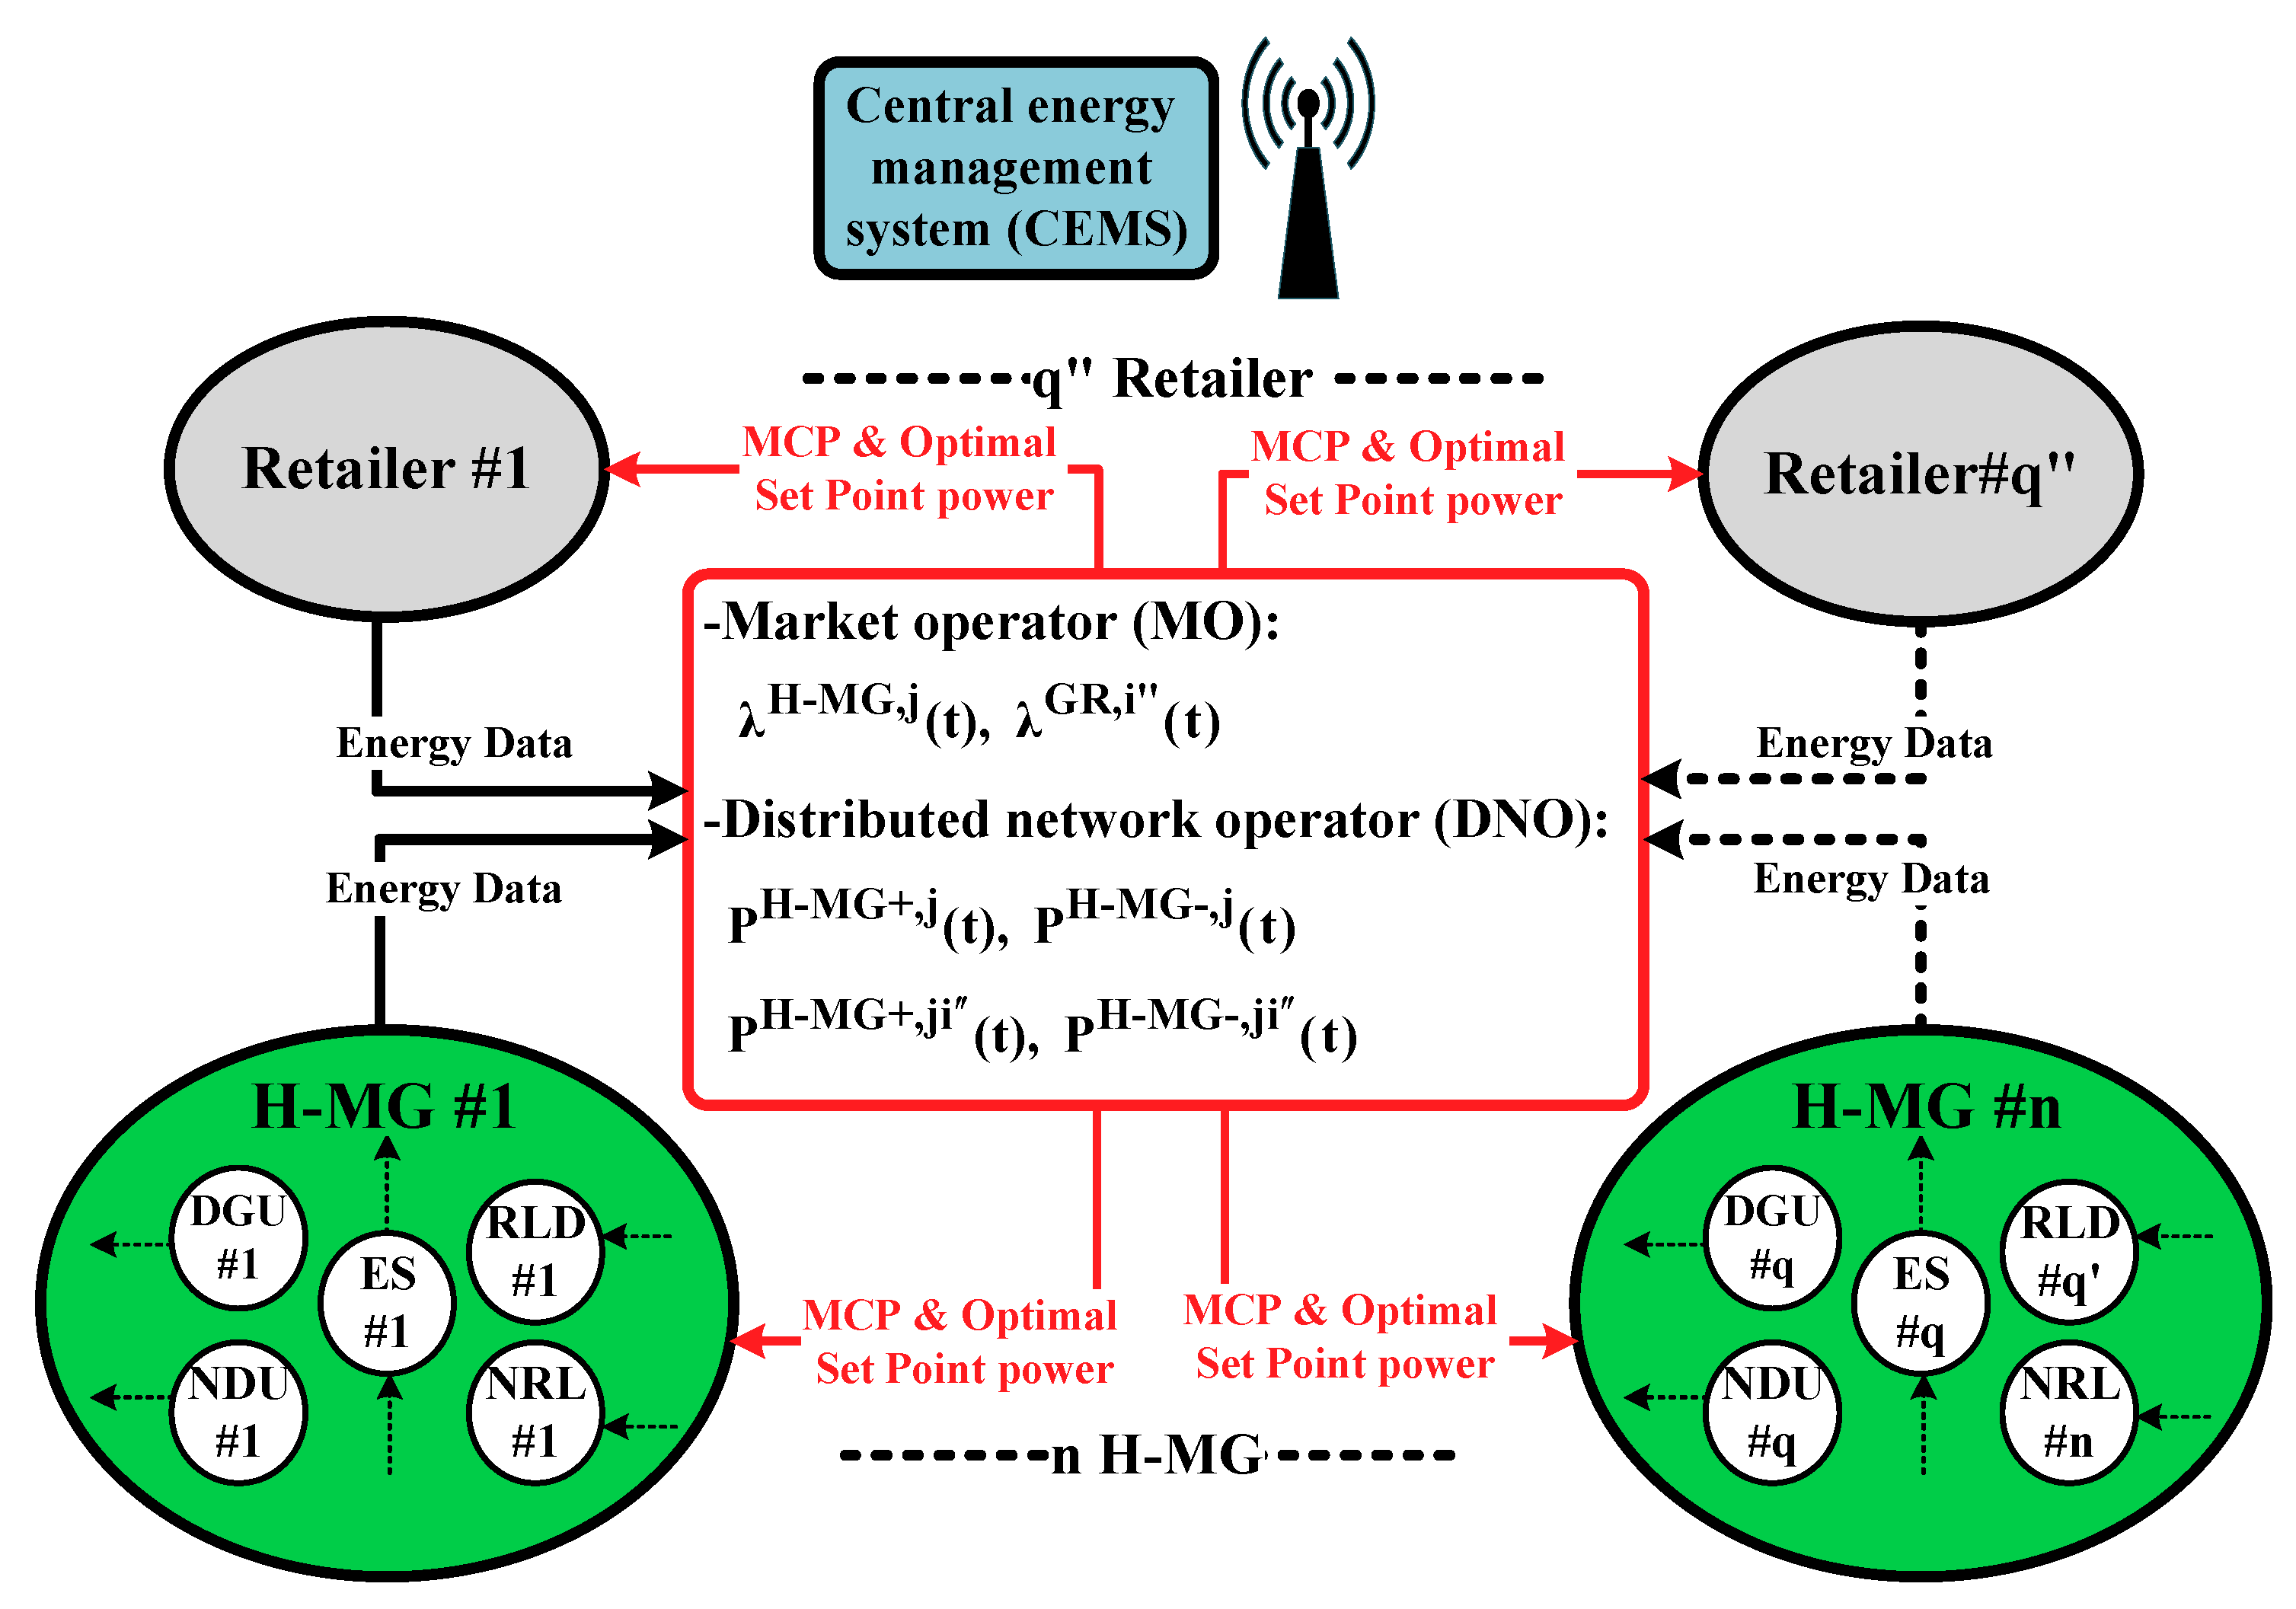
3. General Outline of the Network under Study

A network structure with MH-MG, retailers, a MO and a DNO is proposed as shown in Figure 2. The MH-MGs interact with each other and with retailers for the exchange of power and the optimal utilization of power generation resources. The MO proposes the optimum price upon receiving price suggestions from buyers and sellers and the execution of power dispatch by the DNO. Although the DNO is the owner and exploiter of the equipment and distribution network cables, it is not involved in the act of selling of electricity.
Each H-MG includes non-responsive loads (NRL) and DERs that comprise RLD, ES resources, controllable generation resources and non-controllable generation resources. DERs are grouped into generating players while the consumed resources (i.e., RLD) in each H-MG are grouped as consuming players. Each group is to target an objective function. The power producing (generating) players are to maximize their profit. In comparison, the consuming players are to minimize their cost.
According to the priority included based on the price suggestions of H-MGs, each MH-MG has the duty at the beginning to supply local loads through generation resources. During each time interval, H-MGs may encounter a power generation shortage and/or an excess power generation depending on the amount of power produced by each MH-MG and/or the amount of their local load demand. On the other hand, when each H-MG encounters an excess generation, it tends to sell its power at a higher price to distribution companies or other H-MGs. In other words, if a H-MG encounters a power shortage, it compensates for that by setting a price lower than other alternatives. Therefore, each player must perform a comparison analysis between the proposed prices by other H-MGs and distribution companies for the selection of the optimal price.
Each MH-MG participates with its suggested price in this proposed market which may fail in its excess power transactions due to their higher bids. To encourage further participation of H-MGs in this process, the distribution companies buy the amount of excess generation of each H-MG that has not succeeded in selling to other H-MGs. In addition, power equilibrium is also established in each H-MG and the power network.

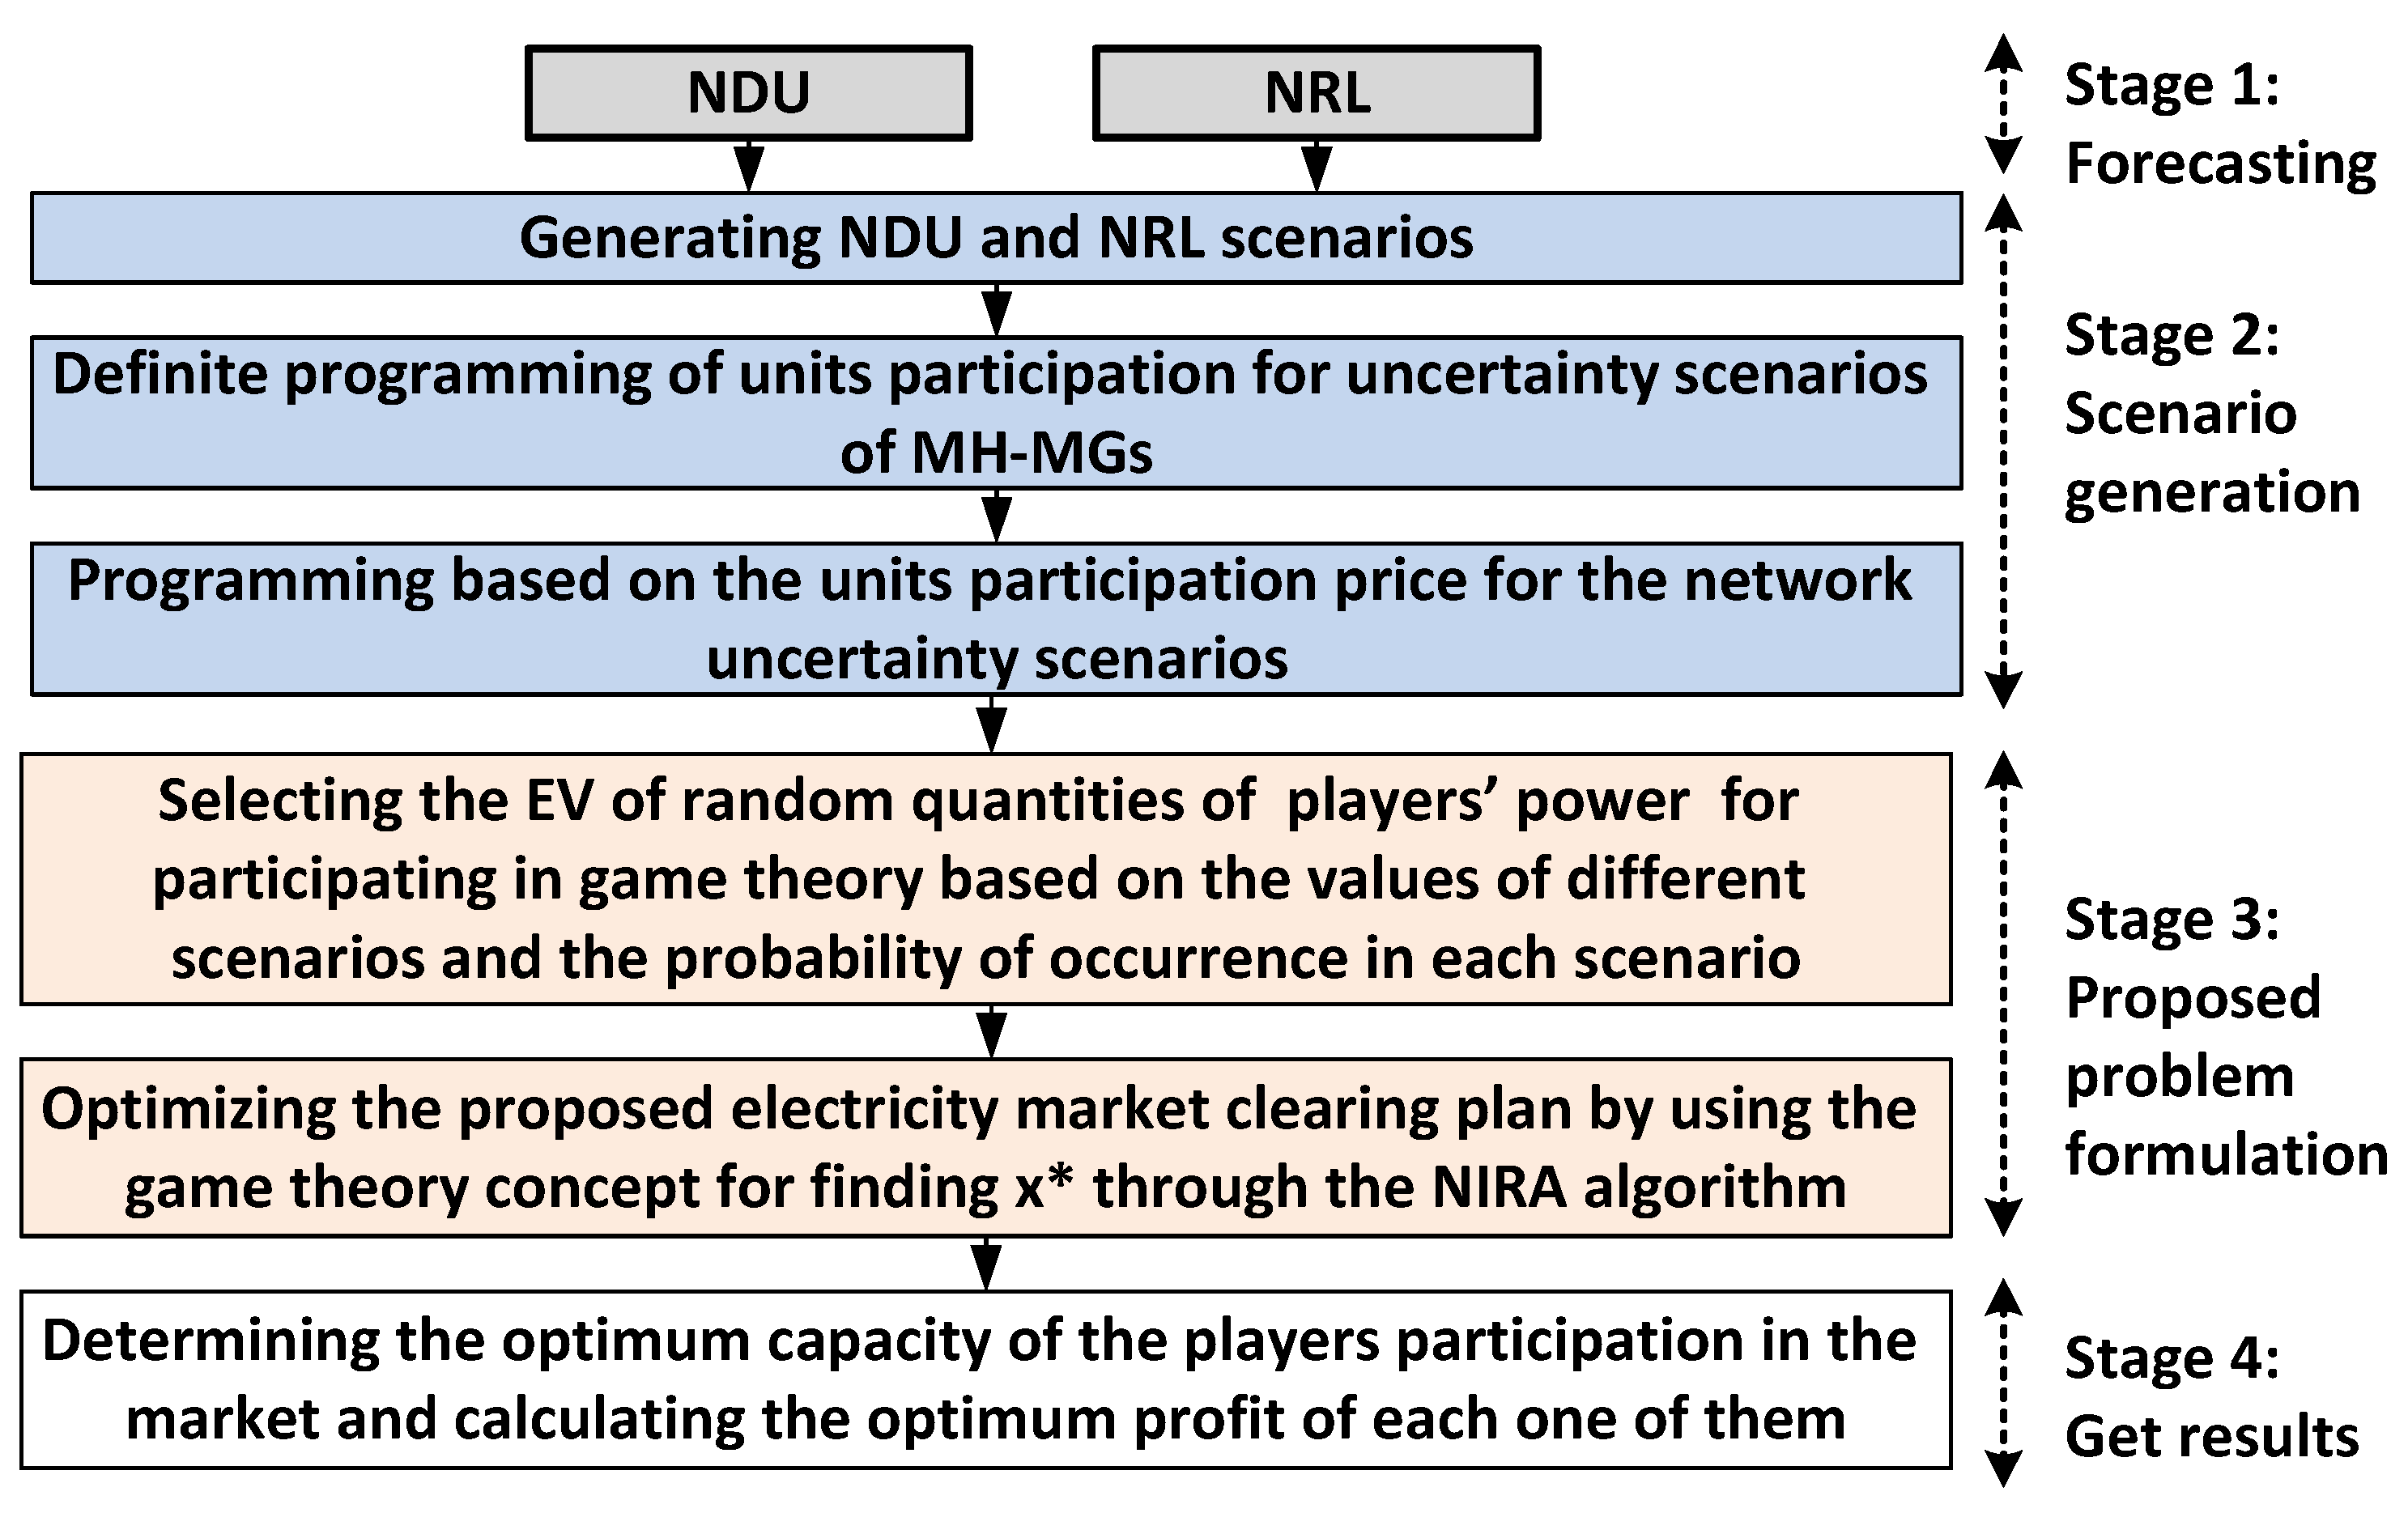
4. The Proposed Market Structure

The proposed retail electricity market structure presents a solution for providing distribution generators with large portions of their capacities to participate in the market. It reduces the electricity price thereby increasing profit alongside their effective and efficient interaction with consumers.
The framework considered in this work provides the exploiters of distribution system and domestic customers with this possibility of properly selecting their energy supply source considering various options such as choosing a comprehensive range of renewable energy resources based on the market clearing price. The recommended market structure is presented in Figure 3. The following stages describe the market operation.
Stage 1
In the first stage, the prediction data of NDU and the consumed load of MH-MG are entered into the scenario generation phase.
Stage 2
Next, stage 2 is focused on generating uncertainty scenarios considering the prediction data of stage 1 with the corresponding occurrence probability. Also in this stage, the participation of generating units and consumers is planned proportionally to the generated scenarios in each MH-MG. Moreover, the optimum programming is handled in this stage based on the units’ participation price (price-based unit commitment) in order to determine the maximum available capacities of players for engaging in the market.
Stage 3
The third stage is to calculate the expected value (EV) of random quantities related to uncertainty scenarios of players for participating in game theory and determining the Nash equilibrium (participation optimum capacity) in market clearing price with random optimization approach based on calculating the value of Nikaido-Isoda function and relaxation algorithm.
Stage 4
The final stage is for determining the optimum capacity of the players for participating in the market and calculating the payoff function of each one of them.

5. The Market Optimization Problem Formulation

The major elements of the proposed market structure include distribution companies and H-MGs of two players (prosumers and consumers). The mathematical model including the objective function and constraints for each category will be explored in this section.

Objective Functions and Problem Constraints

The main elements of the proposed market structure include distribution companies and H-MGs consisting of two players which includes generation and consumption. The objective functions for each one of them can be defined as follows:
  • Power Generation Unit
The power generation resources in the studied MH-MGs are dispatchable generation units (DGUs), NDU and ES. The objective function is to maximize the profit obtained from a generator #i at time t as defined by ( J i ( t ) ) in Equation (1)
max J i ( t ) = R i ( t ) C i ( t ) , t { 1 , 2 , , 24 } , i { 1 , 2 , , q }
R i ( t ) = λ H MG , j ( t ) × [ P DGU , j ( t ) + P NDU , j ( t ) + P ES , j ( t ) P NRL , j ( t ) ] , j { 1 , 2 , , n }
For comprehensibility, the retail electricity price for all players in an H-MG is presumed the same. Therefore, following relations apply.
λ H MG , j ( t ) = ( θ × P NRL , j ( t ) ) + β , θ > 0
C i ( t ) = C DGU , j ( t ) + C NDU , j ( t ) + C ES , j ( t ) + C ES + , j ( t ) + C H MG + , j ( t )
C DGU , j ( t ) = a j · ( P DGU , j ( t ) ) 2 + b j · P DGU , j ( t ) + c j , a j > 0
C ES , j ( t ) = π ES × P ES , j ( t ) , C ES + , j ( t ) = π ES + × P ES + , j ( t )
Should any H-MG face a shortage in satisfying the needs of RLD and NRL loads of its MH-MG, it must compensate the power shortage by buying power from other H-MGs and/or the network by selecting the least cost offer. Thus, C H MG + , j ( t ) can be computed as follows:
C H MG + , j ( t ) = C H MG + , j m ( t ) | m j + C H MG + , j i ( t )
C H MG + , j i ( t ) = ( 1 X H MG + , j ( t ) ) × ( ( P H MG + , j ( t ) m = 1 n ( 1 X H MG , m ( t ) ) × P H MG , m ( t ) ) × λ GR , i ( t ) )
The above expressions are such that its shortage is compensated by comparing the prices and power exchange capacity of other H-MGs. In case the power required by the H-MG #j is not satisfied through the power exchange with other H-MGs (see (9)), the H-MG will compensate the power deficit by buying power from distribution networks. The intention of H-MGs is to minimize the buying cost while satisfying their load demand. Such a goal is made possible by comparing the offer of other H-MGs to that of the distribution grid (i.e., λ GR , i ( t ) )
X H M G , j ( t ) = [ X H MG , 1 ( t ) , X H MG , 2 ( t ) , , X H MG , n ( t ) ]
The surplus and scarcity of power related to each H-MG is stored in a variable as follows:
P H MG , j ( t ) = [ P H MG , 1 ( t ) , P H MG , 2 ( t ) , , P H MG , n ( t ) ]
The offer by each H-MG can also be stored in the following variable:
λ H MG , j ( t ) = [ λ H MG , 1 ( t ) , λ H MG , 2 ( t ) , , λ H MG , n ( t ) ]
The information related to a tertiary block during each time interval in a matrix is stored as follows:
Ω H MG , j ( t ) = λ H MG , 1 ( t ) λ H MG , 2 ( t ) λ H MG , n ( t ) P H MG , 1 ( t ) P H MG , 2 ( t ) P H MG , n ( t ) X H MG , 1 ( t ) X H MG , 2 ( t ) X H MG , n ( t )
The Ω H MG , j ( t ) variable proportional to the offer of each H-MG arranged in ascending order, is defined as follows:
Ω H MG , j ( t ) = λ H MG , 1 ( t ) λ H MG , 2 ( t ) λ H MG , n ( t ) P H MG , 1 ( t ) P H MG , 2 ( t ) P H MG , n ( t ) X H MG , 1 ( t ) X H MG , 2 ( t ) X H MG , n ( t )
where λ H MG , 1 ( t ) < λ H MG , 2 ( t ) < < λ H MG , n ( t ) . The amount of power shortage of H-MG #j can be compensated by other H-MGs proportional to the order of their offer. So, this power shortage must be compared with the excess power generated by other resources and compensated accordingly. The possibility of supplying H-MG #j power shortage through the excess power generated by other H-MGs causes the binary variable matrix condition change. This is indicated by X H MG ( t ) in (14). The component proportional to this matrix becomes one for a total or a partial supply.
X H MG , j ( t ) = [ X H MG , 1 ( t ) , X H MG , 2 ( t ) , , X H MG , n ( t ) ] n j
The least buying cost that H-MG #j bears if encountering a power shortage is computed by (15, 16).
C H MG + , j m ( t ) = X H MG , j ( t ) × λ H MG , j ( t ) × Δ P
Δ P = ( P H MG , j ( t ) P H MG , m ( t ) ) j m
  • Consumers
Consumers are a sort of players with RLD loads in each MH-MG. The aim of this group is to minimize the exploitation cost by managing their distributable loads as represented by the objective function in (17).
min J i ( t ) = λ H MG , j ( t ) × P RLD , j ( t ) , i { 1 , 2 , , q }
  • Upstream Grid
This collection includes the amount of participation of distribution networks in buying the surplus power from H-MGs and also vending power to H-MGs in the case of a lack of power. J GR , i ( t ) is defined as the earnings obtained from swapping the distribution network power at time t. The objective is to maximize it as shown below:
max J GR , i ( t ) = R GR , i ( t ) C GR , i ( t ) , i { 1 , 2 , , q }
R GR , i ( t ) = λ GR , i ( t ) × j = 1 n P H MG + , j i ( t ) , C GR , i ( t ) = j = 1 n λ H MG , j ( t ) × P H MG , j i ( t )
  • Operational Constraints
The operation of players and the system is subject to a variety of constraints. These constraints include power balance constraint (20), the power generation limits on the DGU (Equation (21)) and NDU (Equations (22) and (23)), the ES charging/discharging constraints (Equations (24)–(26)) [3,31], RLD limits (Equation (27)) [3], and the power exchange between H-MGs constraint (Equations (28)–(30)). It is important to emphasize that ξ in (Equation (27)) shows that the value of RLD is considered as a part of NRL.
j = 1 n P DGU , j ( t ) + P NDU , j ( t ) + P ES , j ( t ) + P H MG + , j i ( t ) = j = 1 n P NRL , j ( t ) + P ES + , j ( t ) + P RLD , j ( t ) + P H MG , j i ( t )
P ̲ DGU , j P DGU , j ( t ) P ¯ DGU , j , t
0 P NDU , j ( t ) EV NDU , j ( t ) , t
EV NDU , j ( t ) = s = 1 N s ρ s NDU , j ( t ) × P s NDU , j ( t )
0 P ES , j ( t ) ( P ES + , j ( t ) ) P ¯ ES , j ( P ¯ ES + , j ) , t
SOC ̲ ES , j SOC ES , j ( t ) SOC ¯ ES , j
SOC ES , j ( t + 1 ) SOC ES , j ( t ) = ( P ES + , j ( t ) P ES , j ( t ) ) × Δ t ES Tot ES , j
0 P RLD , j ( t ) ξ × P NRL , j ( t )
0 j = 1 n P H MG + , j i ( t ) ( j = 1 n P H MG , j i ( t ) ) EV H MG + , j i ( t ) ( EV H MG , j i ( t ) )
EV H MG + , j i ( t ) = s = 1 N s ρ s H MG + , j i ( t ) × P s H MG + , j i ( t )
EV H MG , j i ( t ) = s = 1 N s ρ s H MG , j i ( t ) × P s H MG , j i ( t )

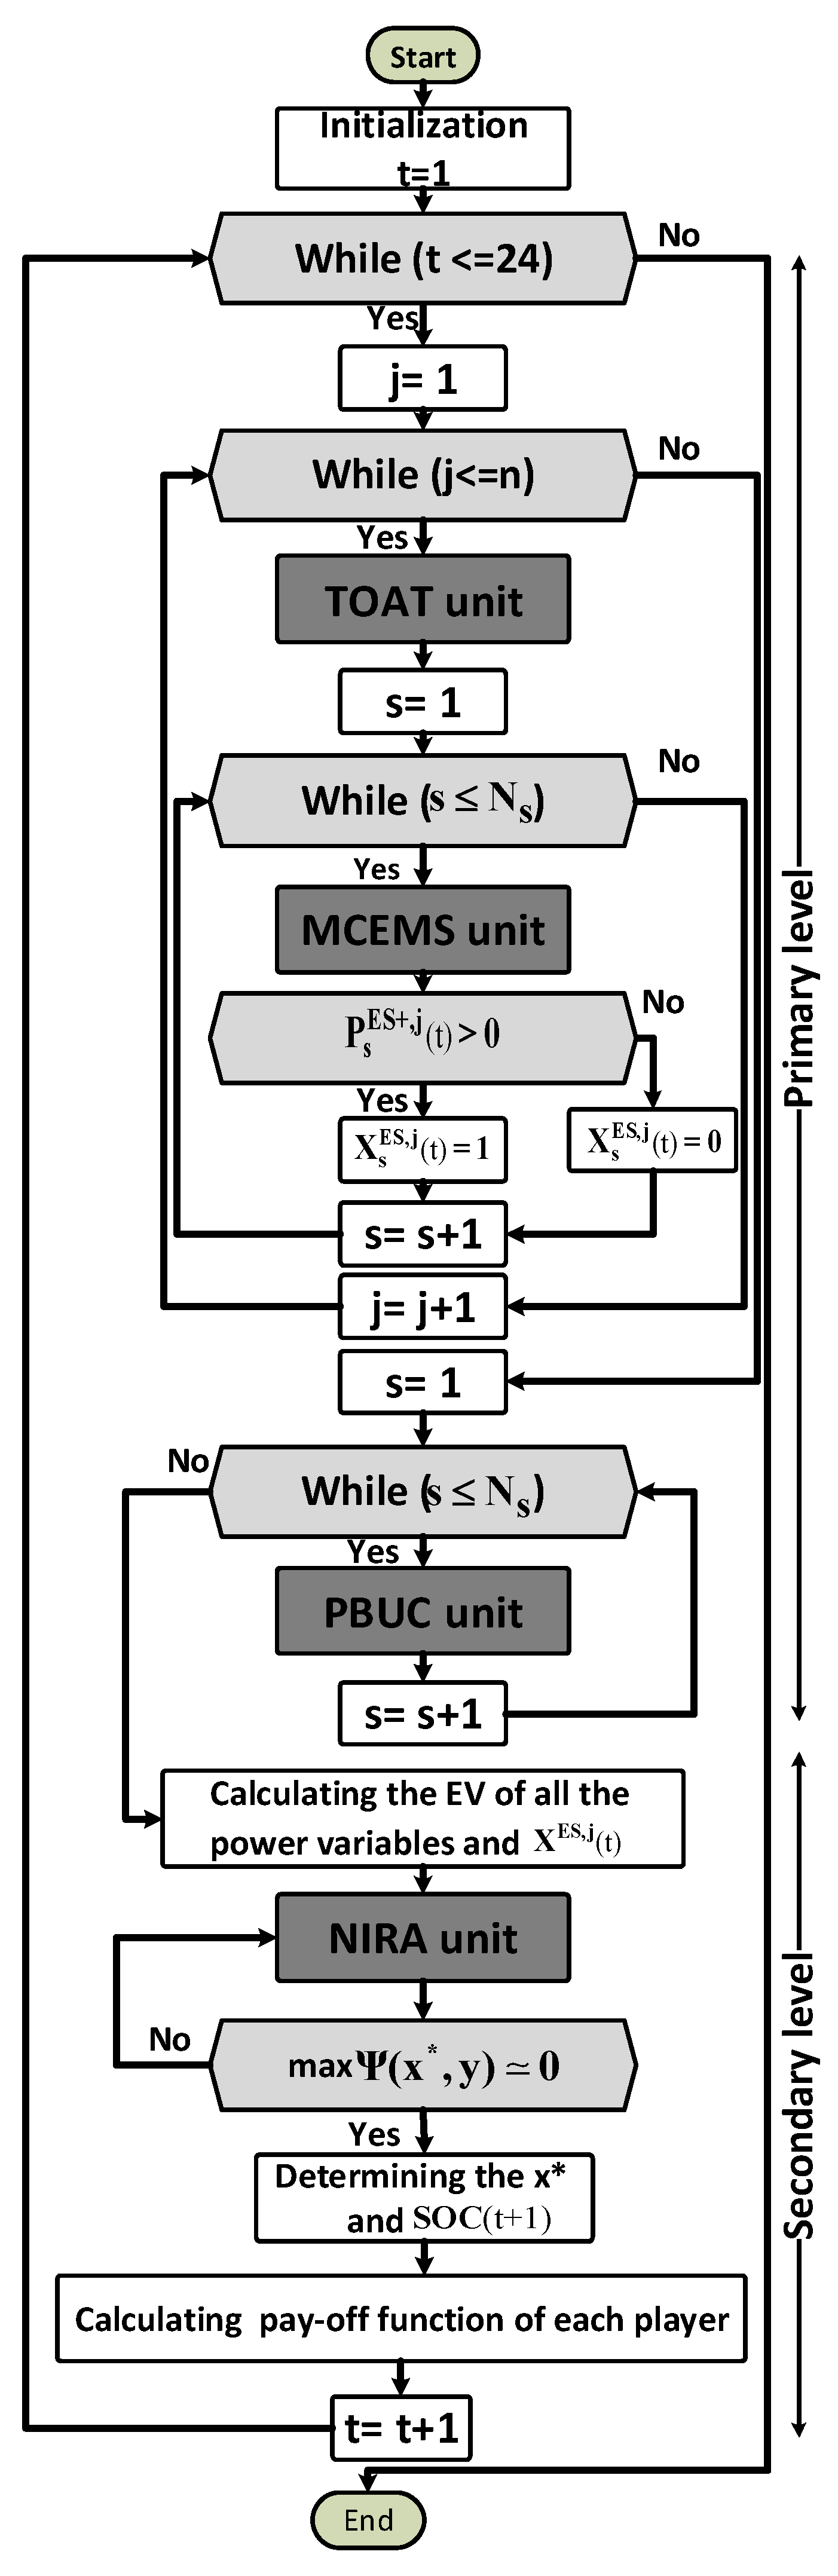
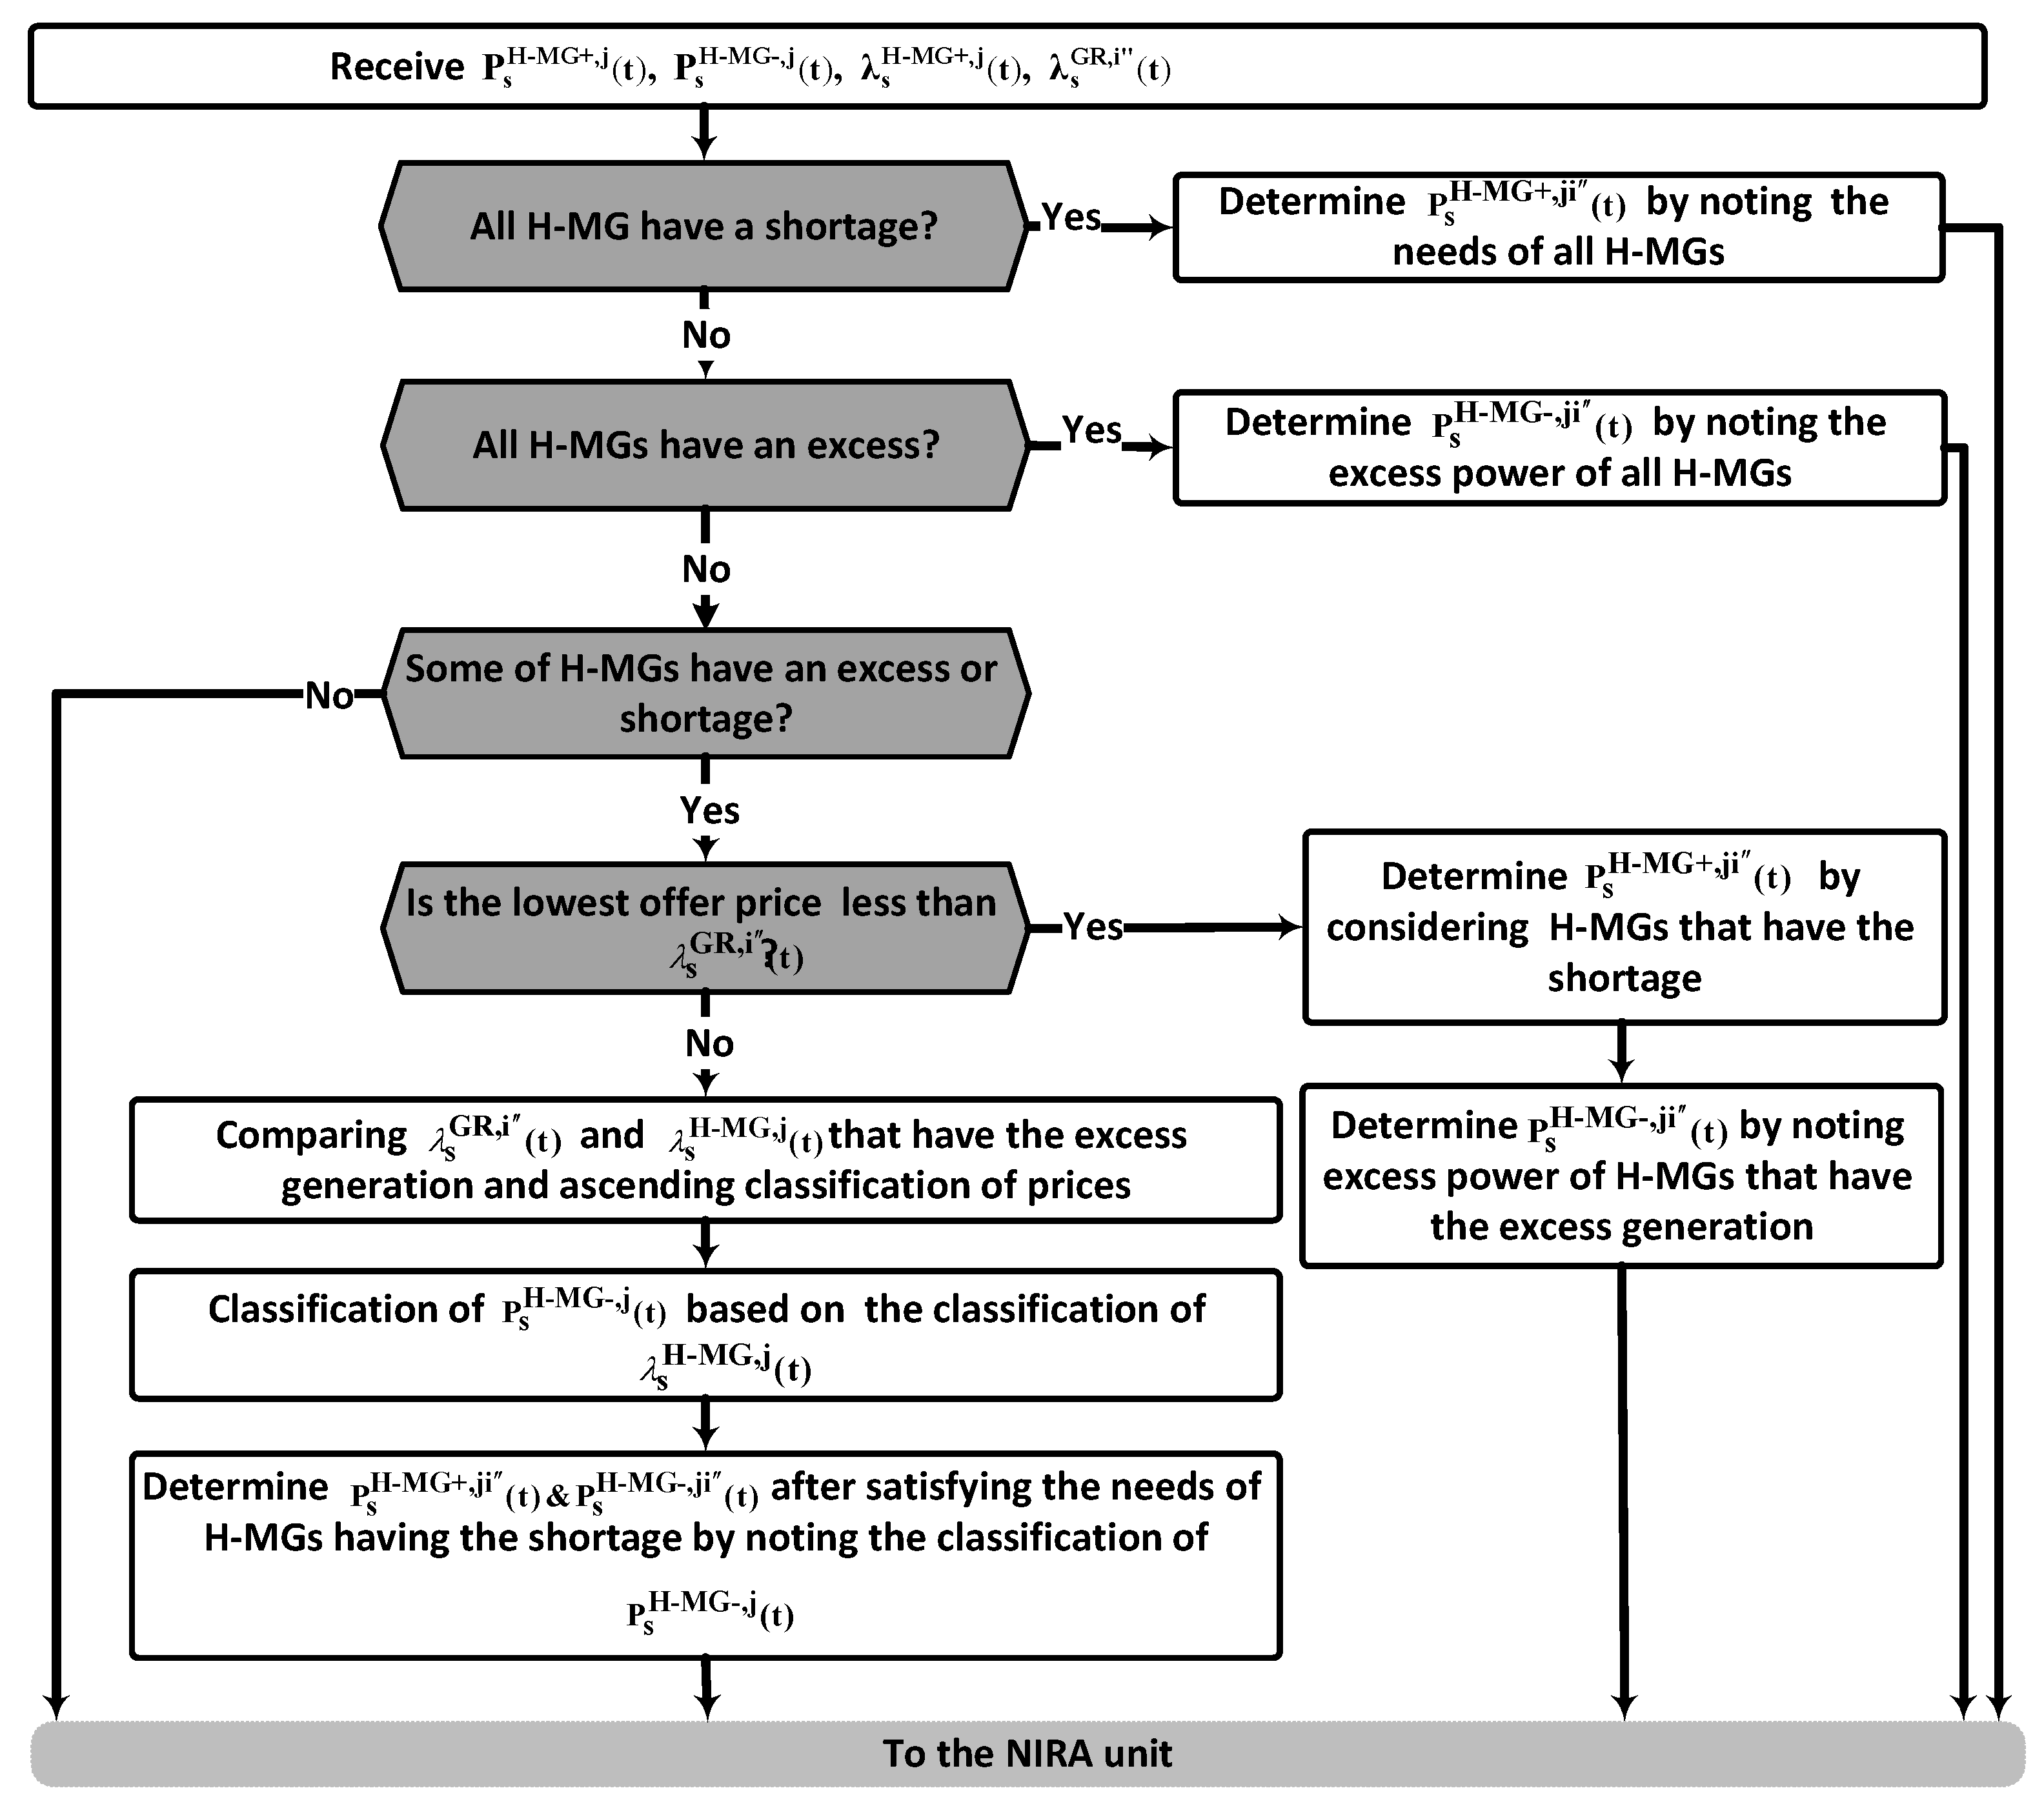
6. Implementing the NIRA Algorithm

A random early retail energy market-based on the Nikaido-Isoda/relaxation (REM-NIRA) algorithm is presented to provide a comprehensive and scalable solution where any number of players can take part in trading energy [32]. The Algorithm will be applied to find an electricity market equilibrium in order to clear the retail electricity market price through analyzing the players’ behavior by using the concept of Nash equilibrium as a solution in the multi-agent interaction problems. A flowchart explaining the algorithm is presented in Figure 4. The flowchart consists of primary and secondary levels. A description of each level is provided in this section.

6.1. Primary Level of REM-NIRA Algorithm

The primary level of REM-NIRA algorithm is composed of three main units: the Taguchi’s orthogonal array testing (TOAT) unit, the modified conventional energy management system (MCEMS) unit, and the price-based unit commitment (PBUC) unit. The primary level is to achieve the following tasks:
  • Determining the amount of power generated by all generation sources along with the corresponding probabilities of each power generation scenario;
  • Determining the power consumed by all RLD and NRL along with their corresponding probabilities of each demand scenario;
  • Estimating the amount of the deficiency and surplus of power related to each H-MG;
  • Defining the grid capacity in terms of power purchase and power sale.
TOAT is an approach which has been applied to choose minimum optimal representative scenarios. Moreover, for local scheduling of initial powers of H-MGs in the proposed structure, the MCEMS algorithm has been used. Since the operation of the TOAT unit and the MCEMS unit is explained in detail in [3,32], only a description of the PBUC unit will be discussed here.
The purpose of the PBUC unit is to establish the grid power set-point with generation resources and consumption of H-MGs. This unit encourages H-MGs to participate in a retail market while satisfying their needs. Taking into consideration the offer price of each H-MG and the grid, the capacity of the distribution network in terms of power purchase and sale uncertainty scenarios are to be determined. The structure of this unit is implemented according to Figure 5. The initial values of participation of grid variables for selling to and buying from H-MGs are determined based on players’ accessible capacities and their bids for the NIRA unit.

6.2. Secondary Level of REM-NIRA Algorithm

The second level of the REM-NIRA algorithm structure consists of a main unit called the NIRA unit (the NIRA algorithm is explained in detail in [32]). The initial guess for the unit is chosen based on the data acquired from the primary level scenarios. In this regard, it is assumed that the nature of the discussed electricity market is proportionate to the game theory with n entrants in a non-cooperative game. In the unit, each player maximizes their benefit through a centralized decision making procedure. The objective of this level is to determine players’ Nash equilibrium by utilizing the game theory specially designed means (NIRA algorithm). Having known the balanced response through continuous iterative loops, the electricity market price can be cleared for a MH-MG having several customers.
Through the NIRA unit, two coupled sub-problems are solved including: (1) Maximizing the Nikaido-Isoda function and (2) employing the relaxation algorithm and improving the optimal response function [32]. Both objectives are followed interactively by the NIRA unit until the contrast in the optimal response function between the two consecutive iterations becomes smaller than a predefined threshold. After the initial value definition and forming a pay-off function for each player based on such values, as well as forming a Nikaido-Isoda function at this level, the Nikaido-Isoda function must be maximized first. Then, gradually, the obtained solution from this function in the first sub-problem meets a new stable state showing the proper results.
After obtaining the intermediate solution in the first sub-problem, It is the second sub-problem’s turn to run. In the second sub-problem, the relaxation algorithm is applied to improve the solution space and update it. If values of the Nikaido-Isoda function reach zero, no players can unilaterally improve their payoff function. Therefore, a balanced (approximate) response is found for the electricity market clearing by following the general and local constraints (Equations (20)–(30). With the repeated improvement of the optimal response function, the values of the payoff function of all the players gradually converge to an equilibrium (approximate) point. The aim of implementing the secondary level is to attain the following:
  • Initial guess based on players’ EVs;
  • x vector (the optimum capacity of players’ participation in the network) based on the Nash equilibrium of players;
  • The optimum amount of profit for players.

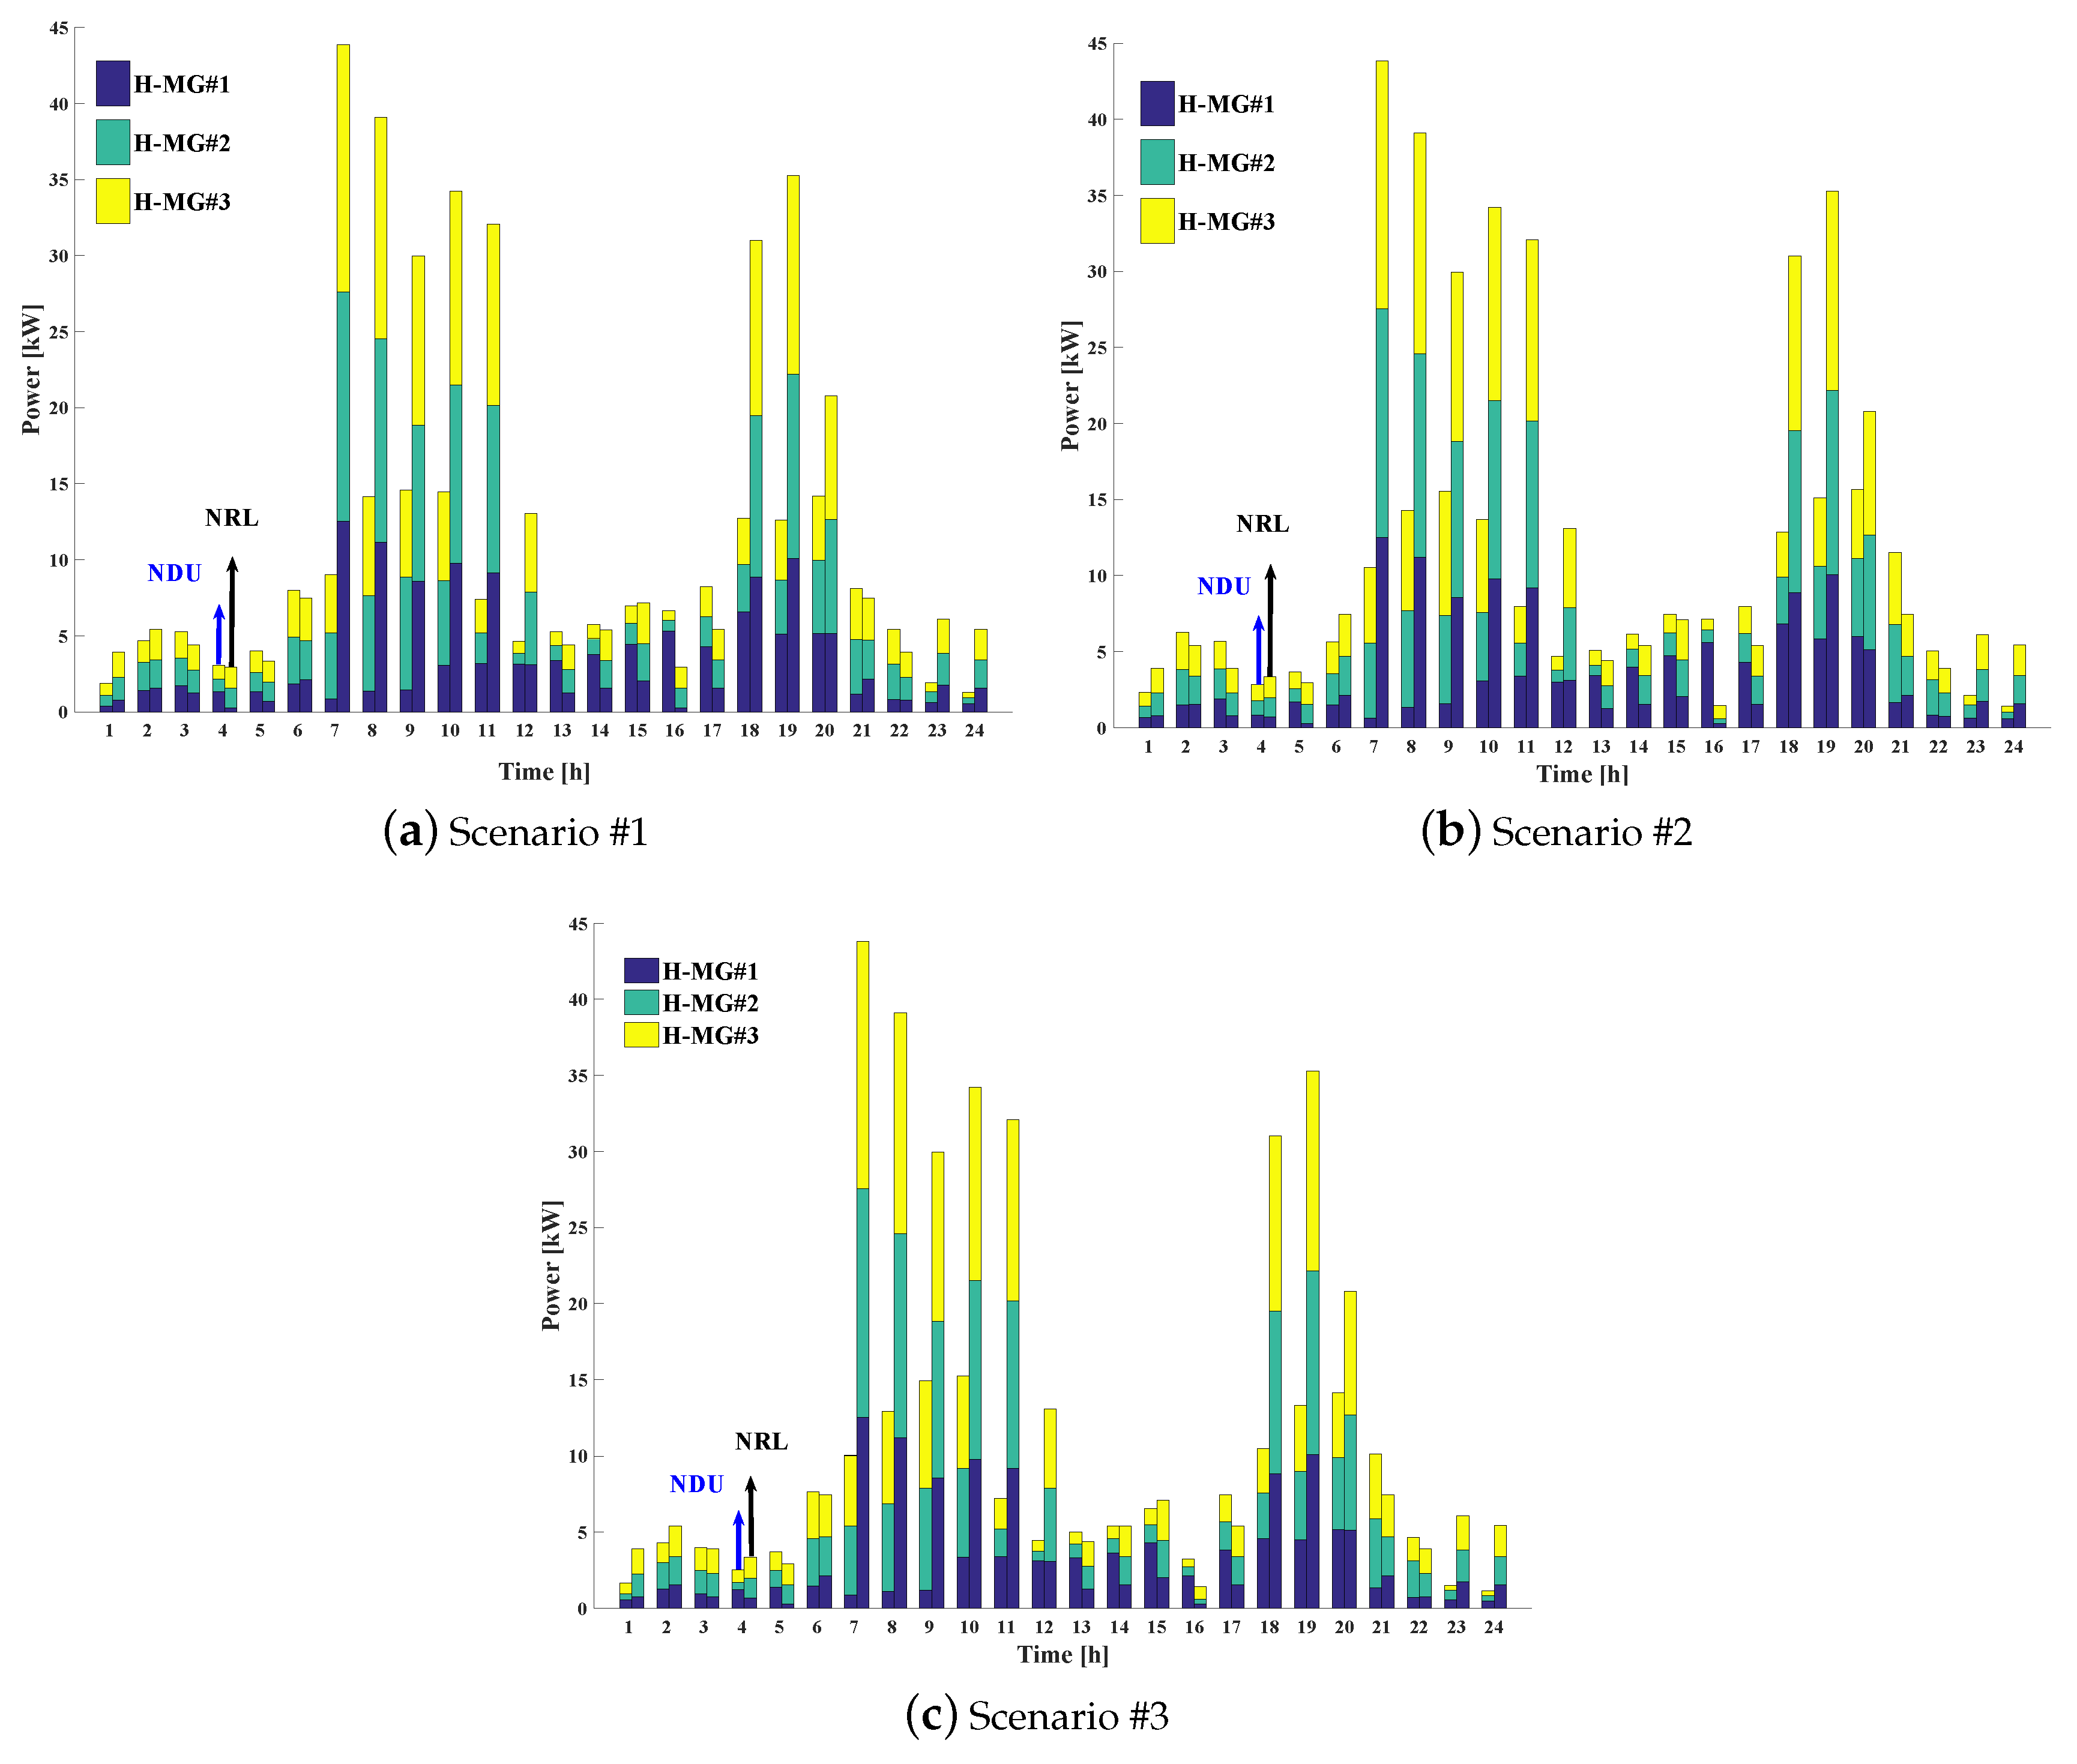
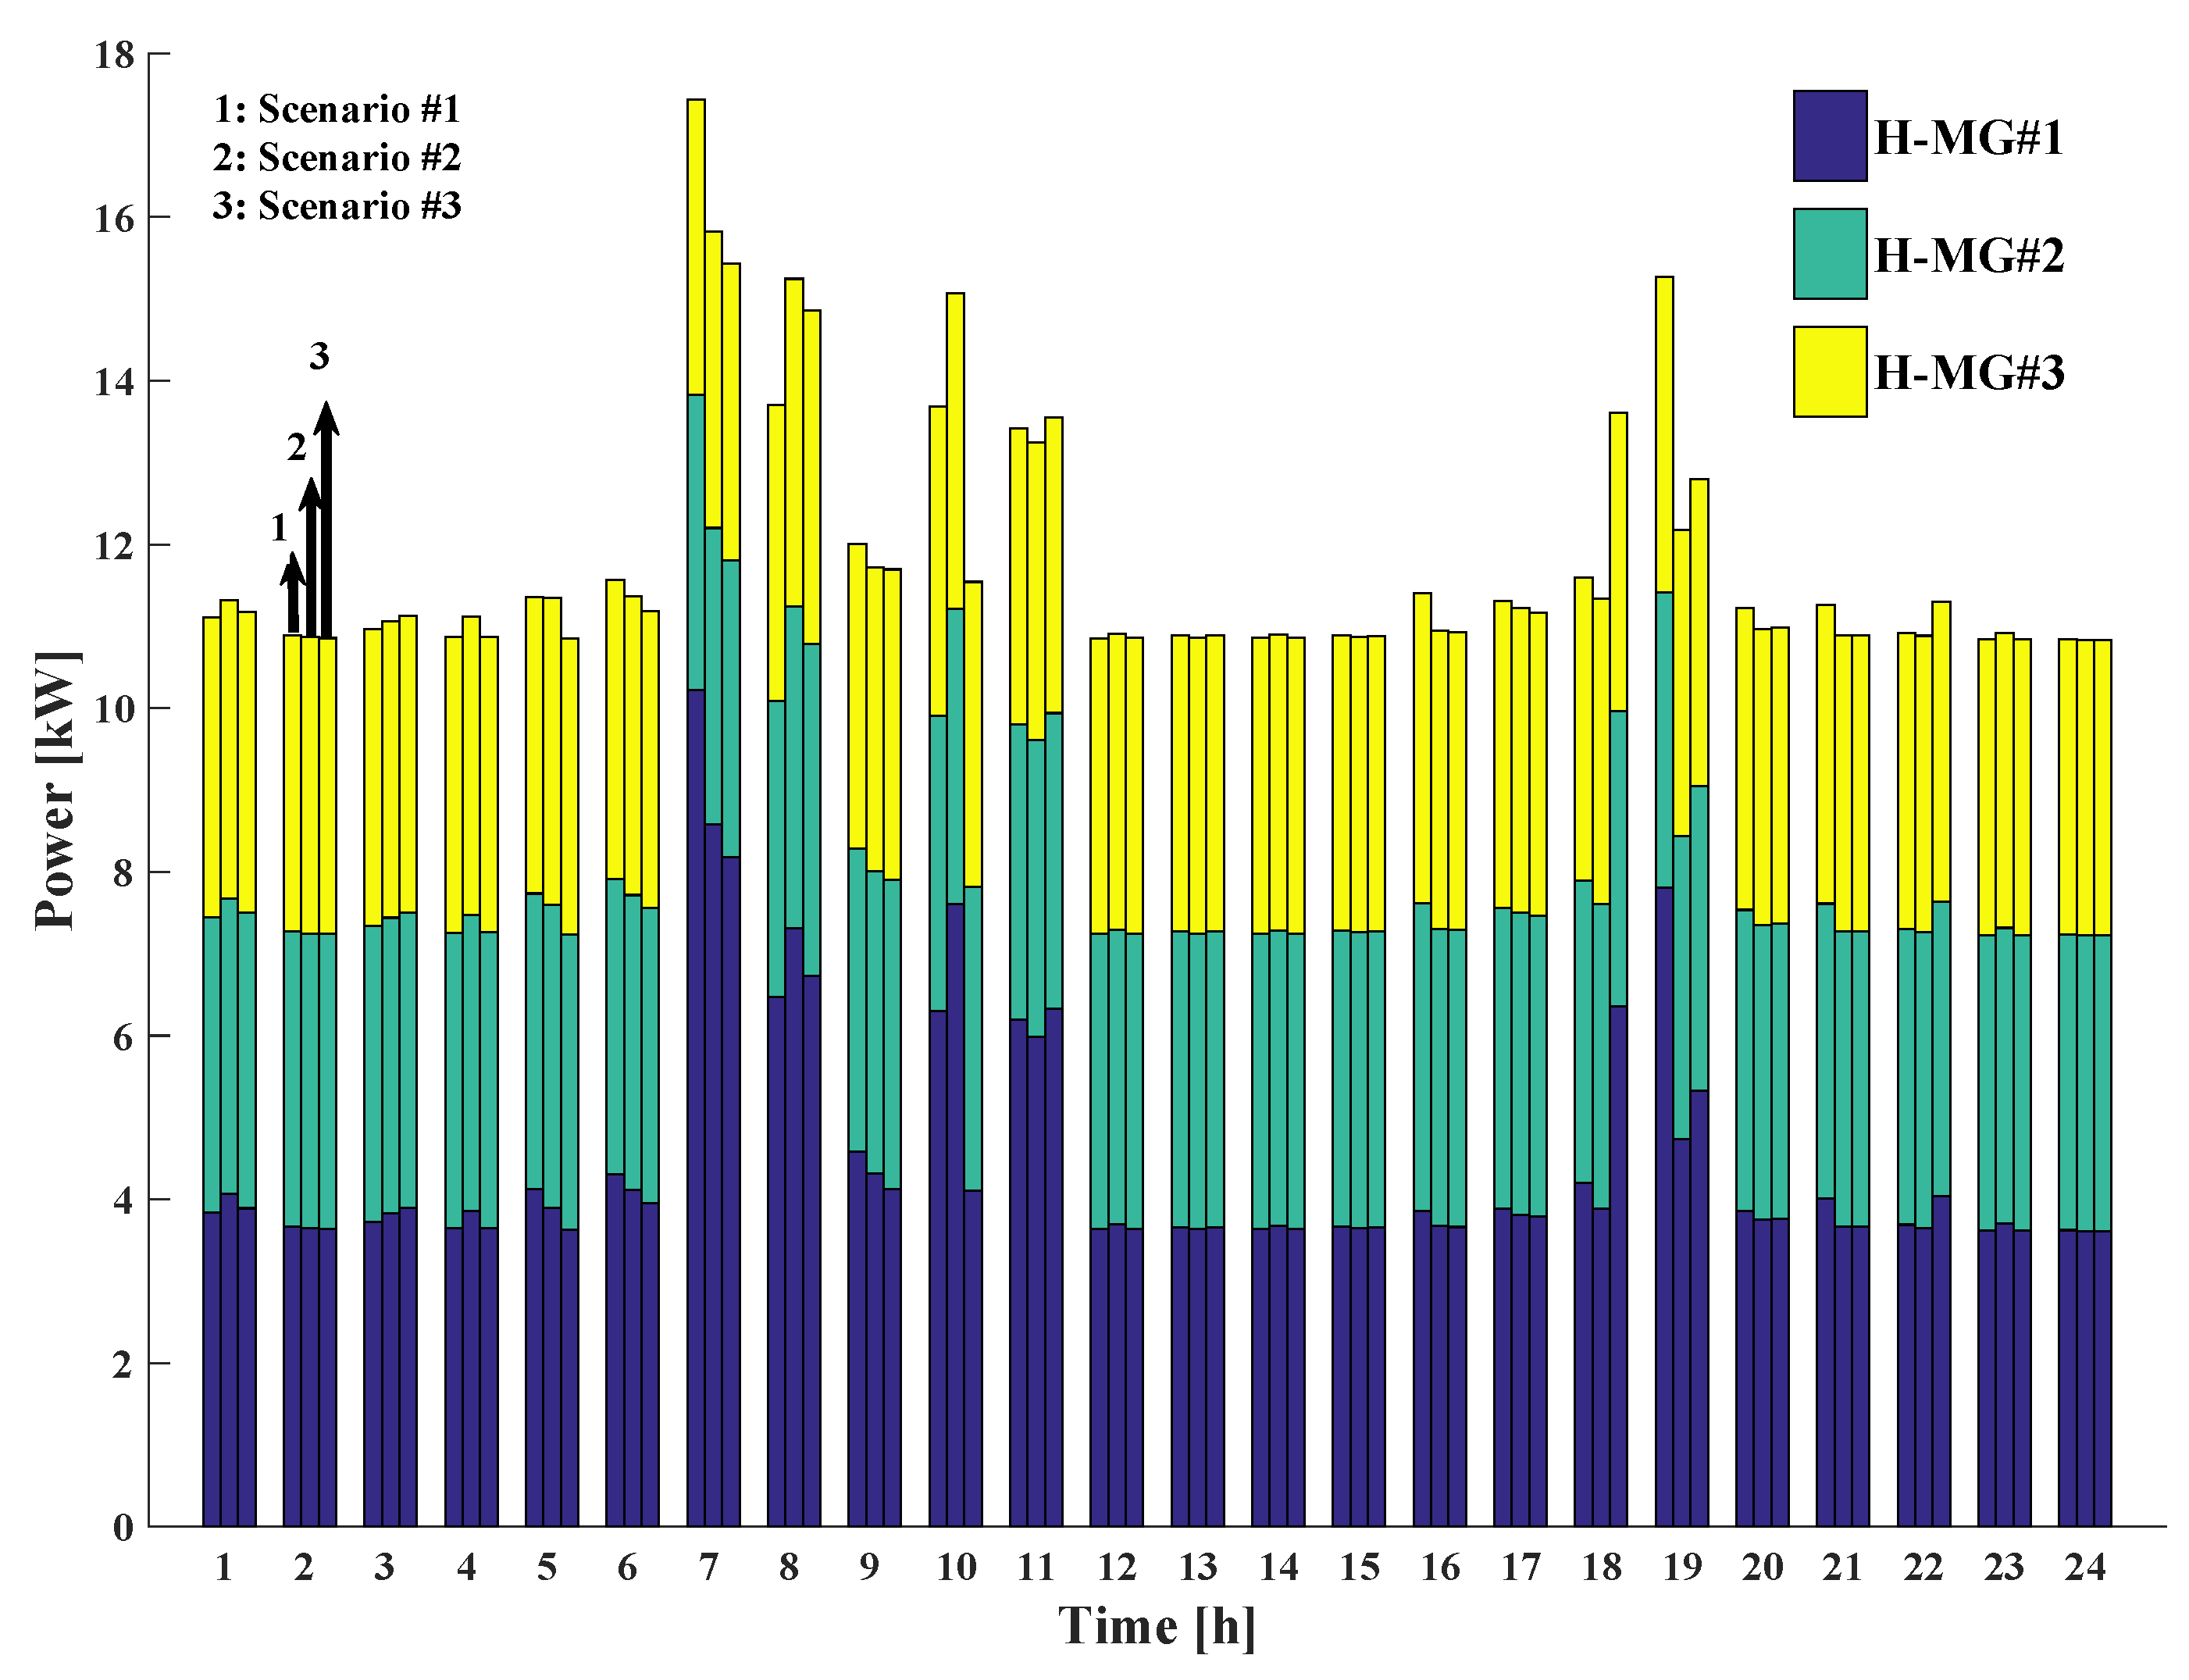
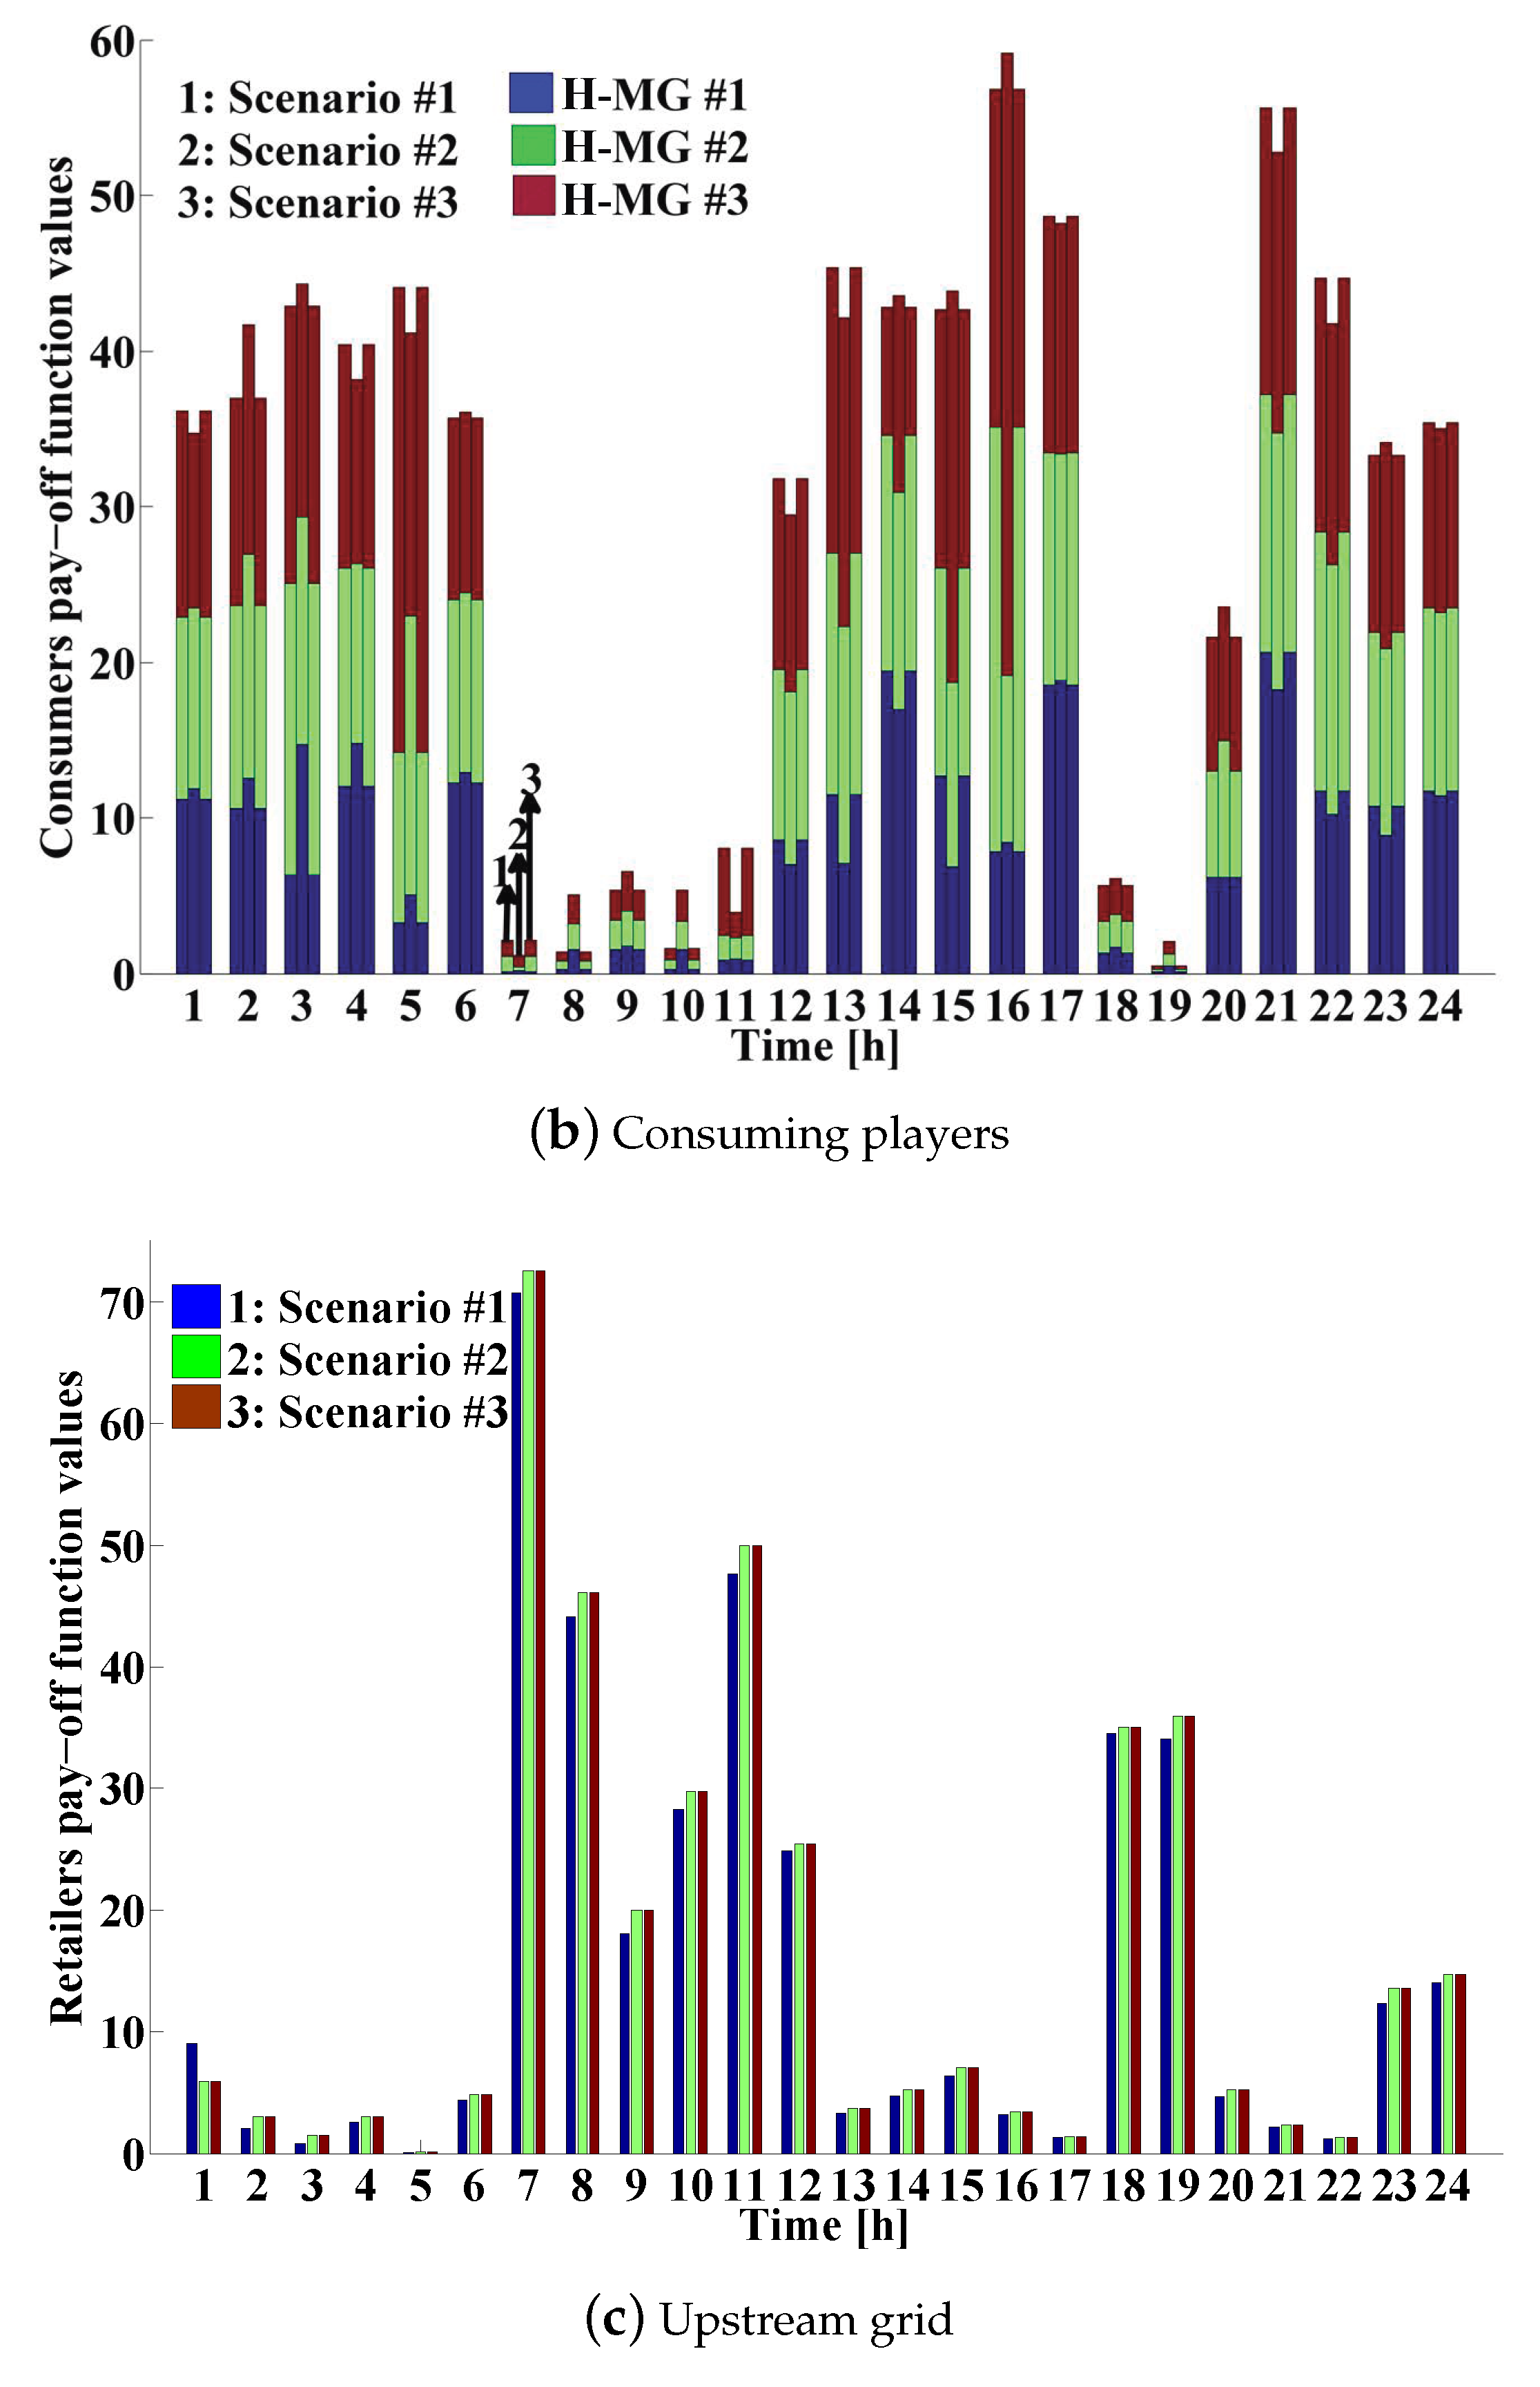
7. Simulation Results and Discussion

In order to test the capability of the proposed method for running the market, a case study has been developed in a MATLAB software simulation environment. The details of the entire system and the principles of the control plan for each of the DERs are presented in Appendix A. The predicted data of NRL, NDU (here, wind turbine and photo-voltaic panel) are taken from [18]. Figure 6 shows the configuration of the system under study which consists of MH-MGs and the network.
Each H-MG is an energy district consisting of a set of generation resources, which include NDU, DGU, ES, NRL, and RLD. The number of MH-MGs and the connected distribution networks are expanded to n and q values. For the system under study, three H-MGs and a distribution network are considered. To investigate the performance of the proposed REM-NIRA algorithm, the following scenarios are considered on the network case study:
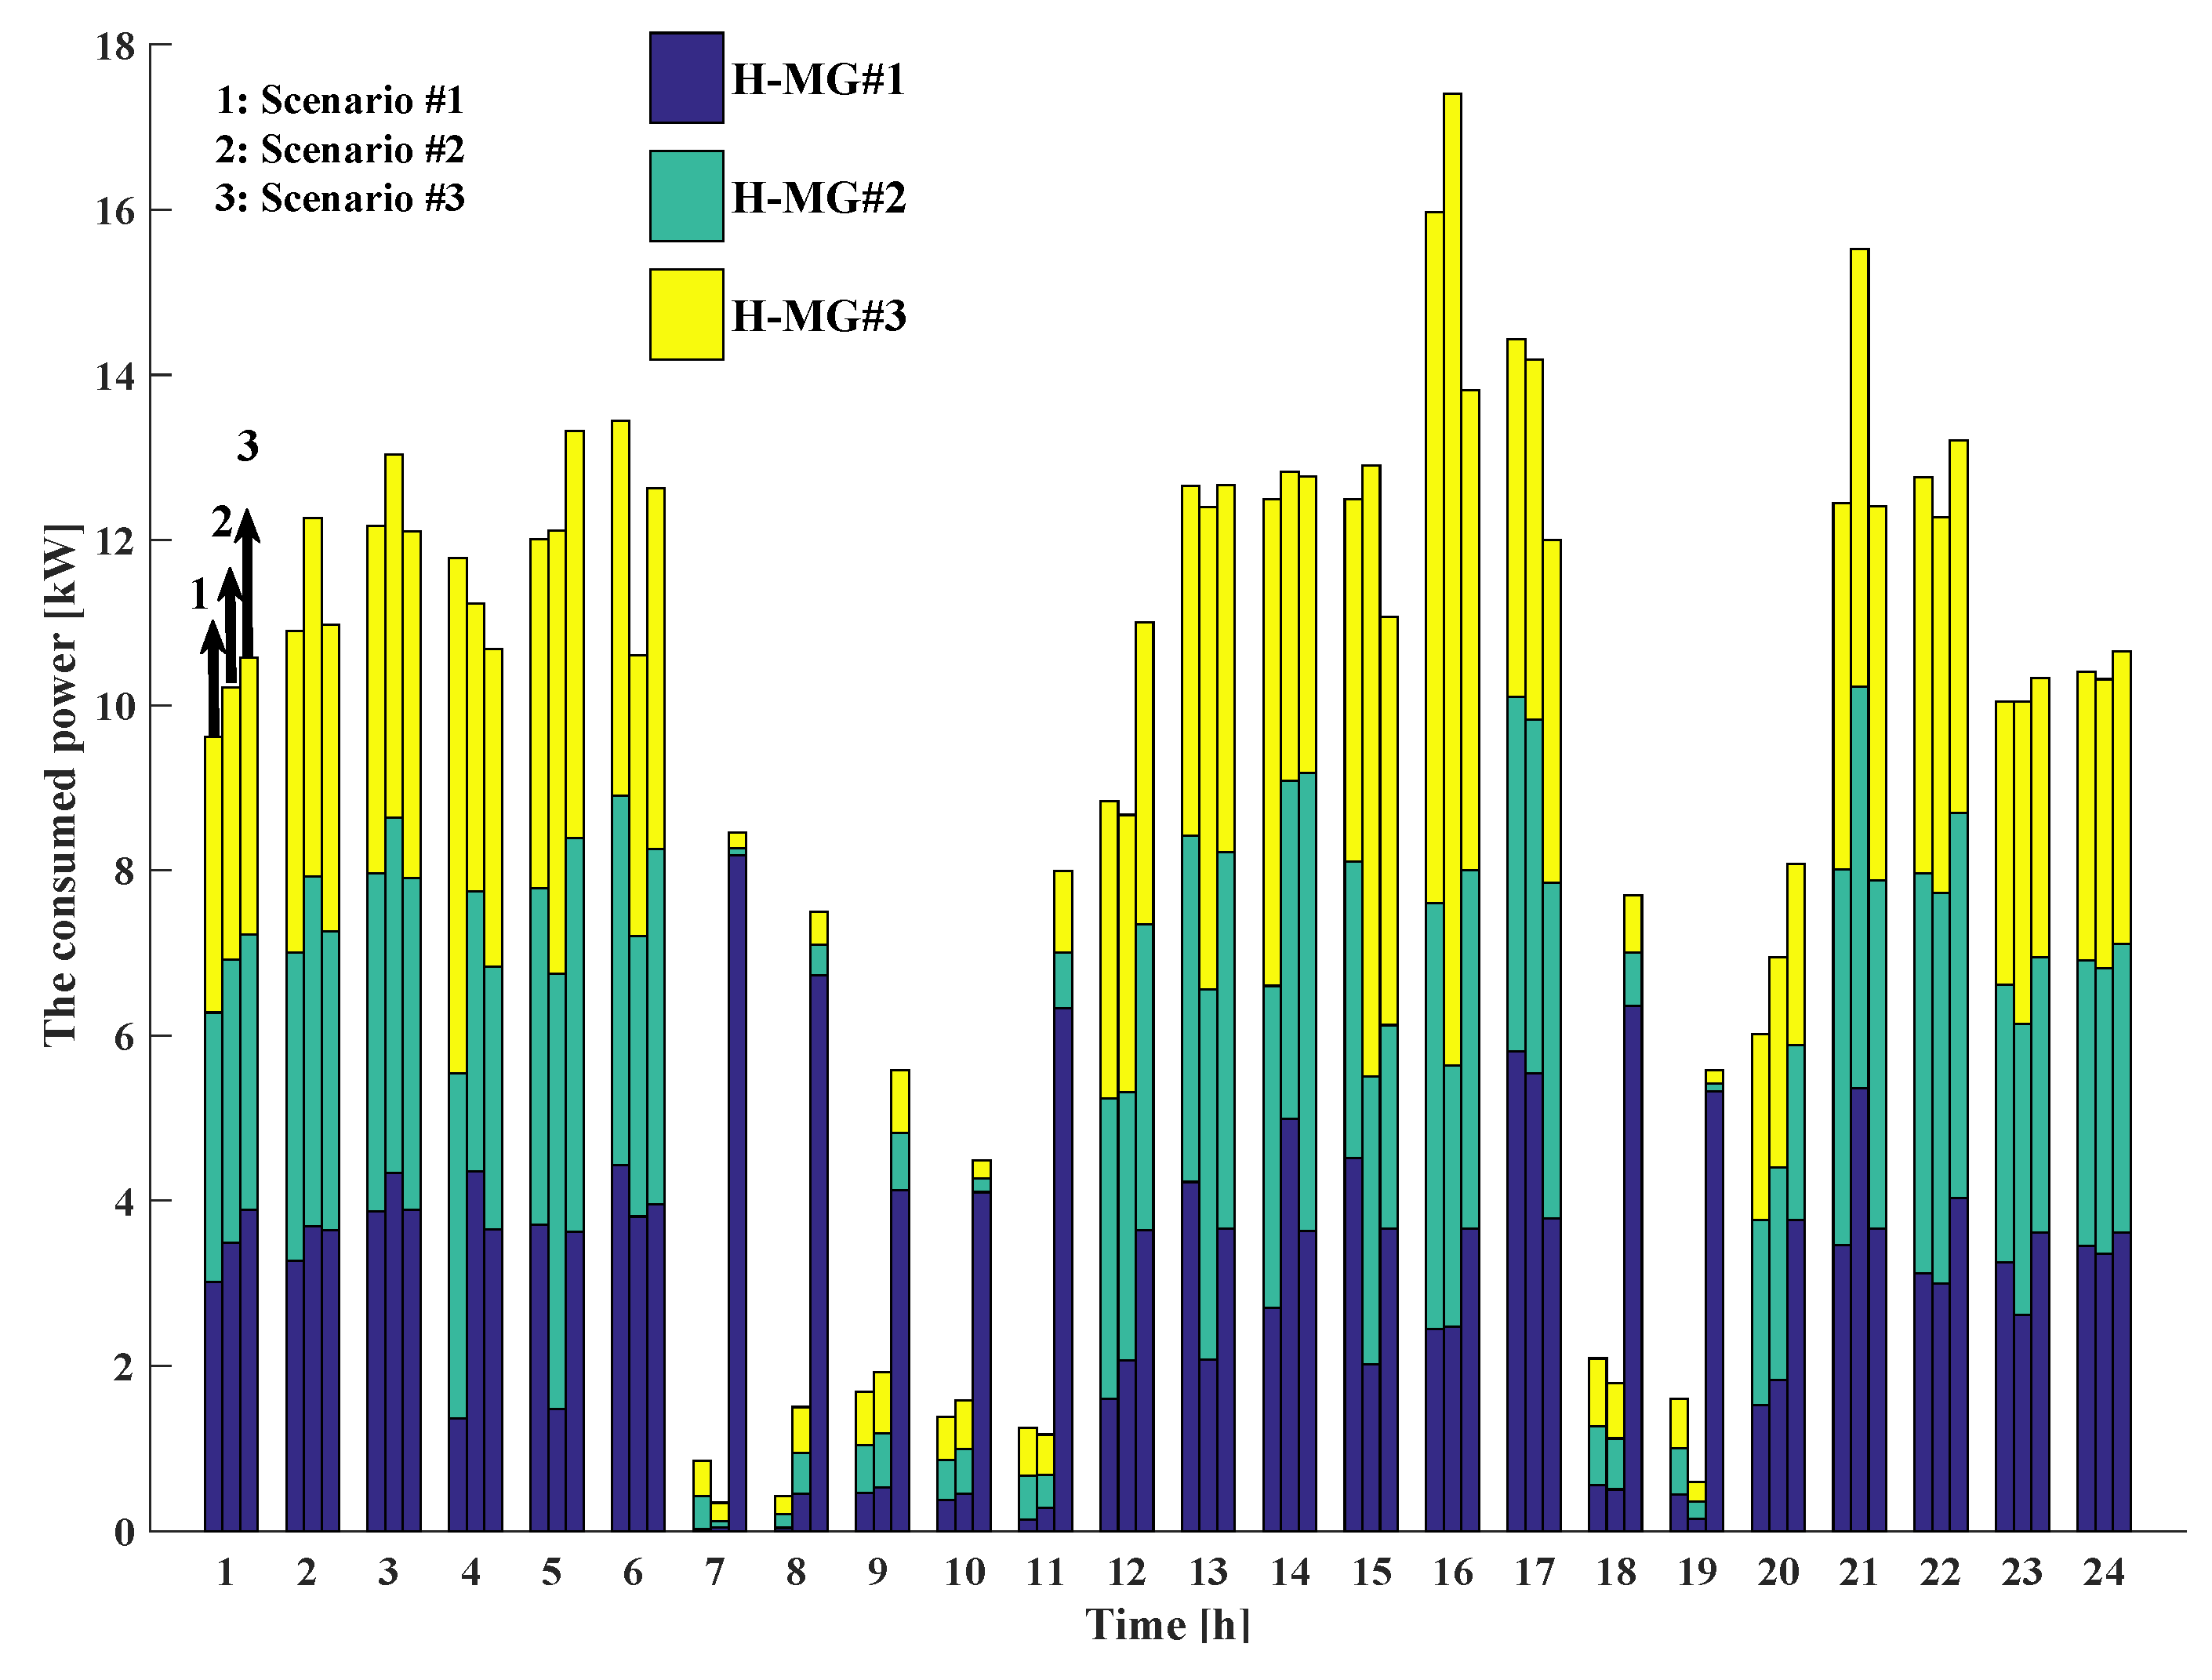
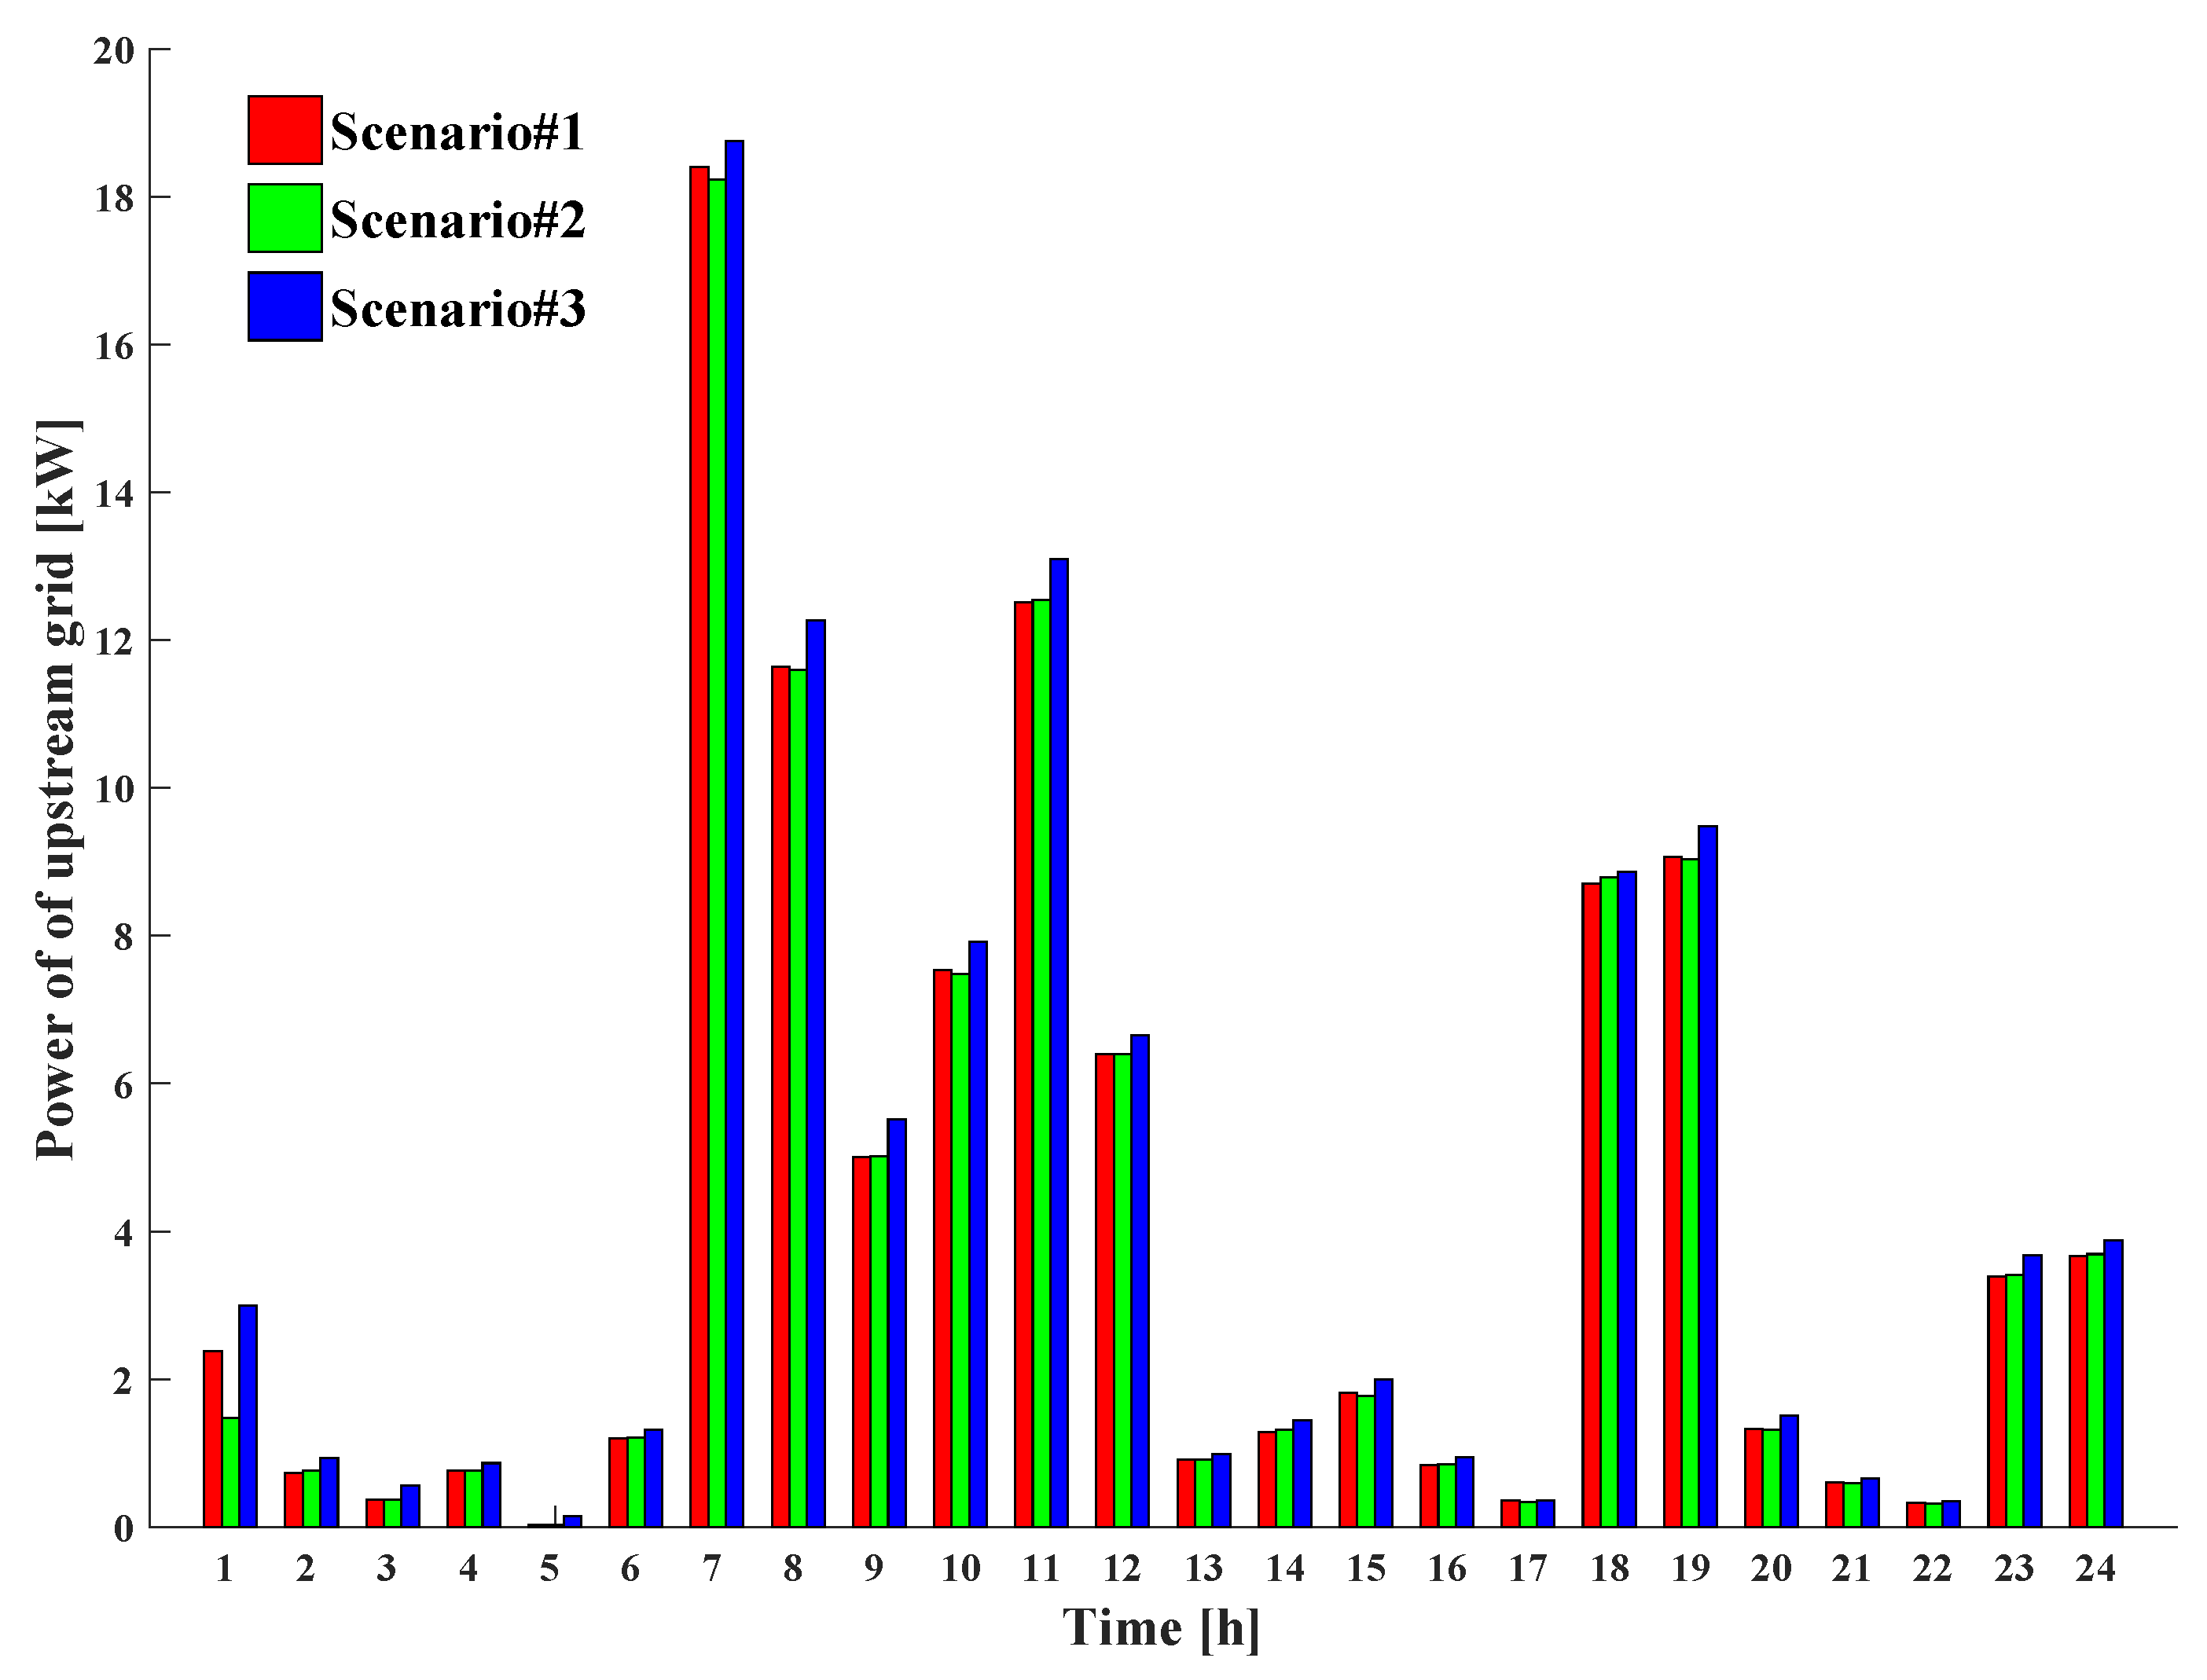
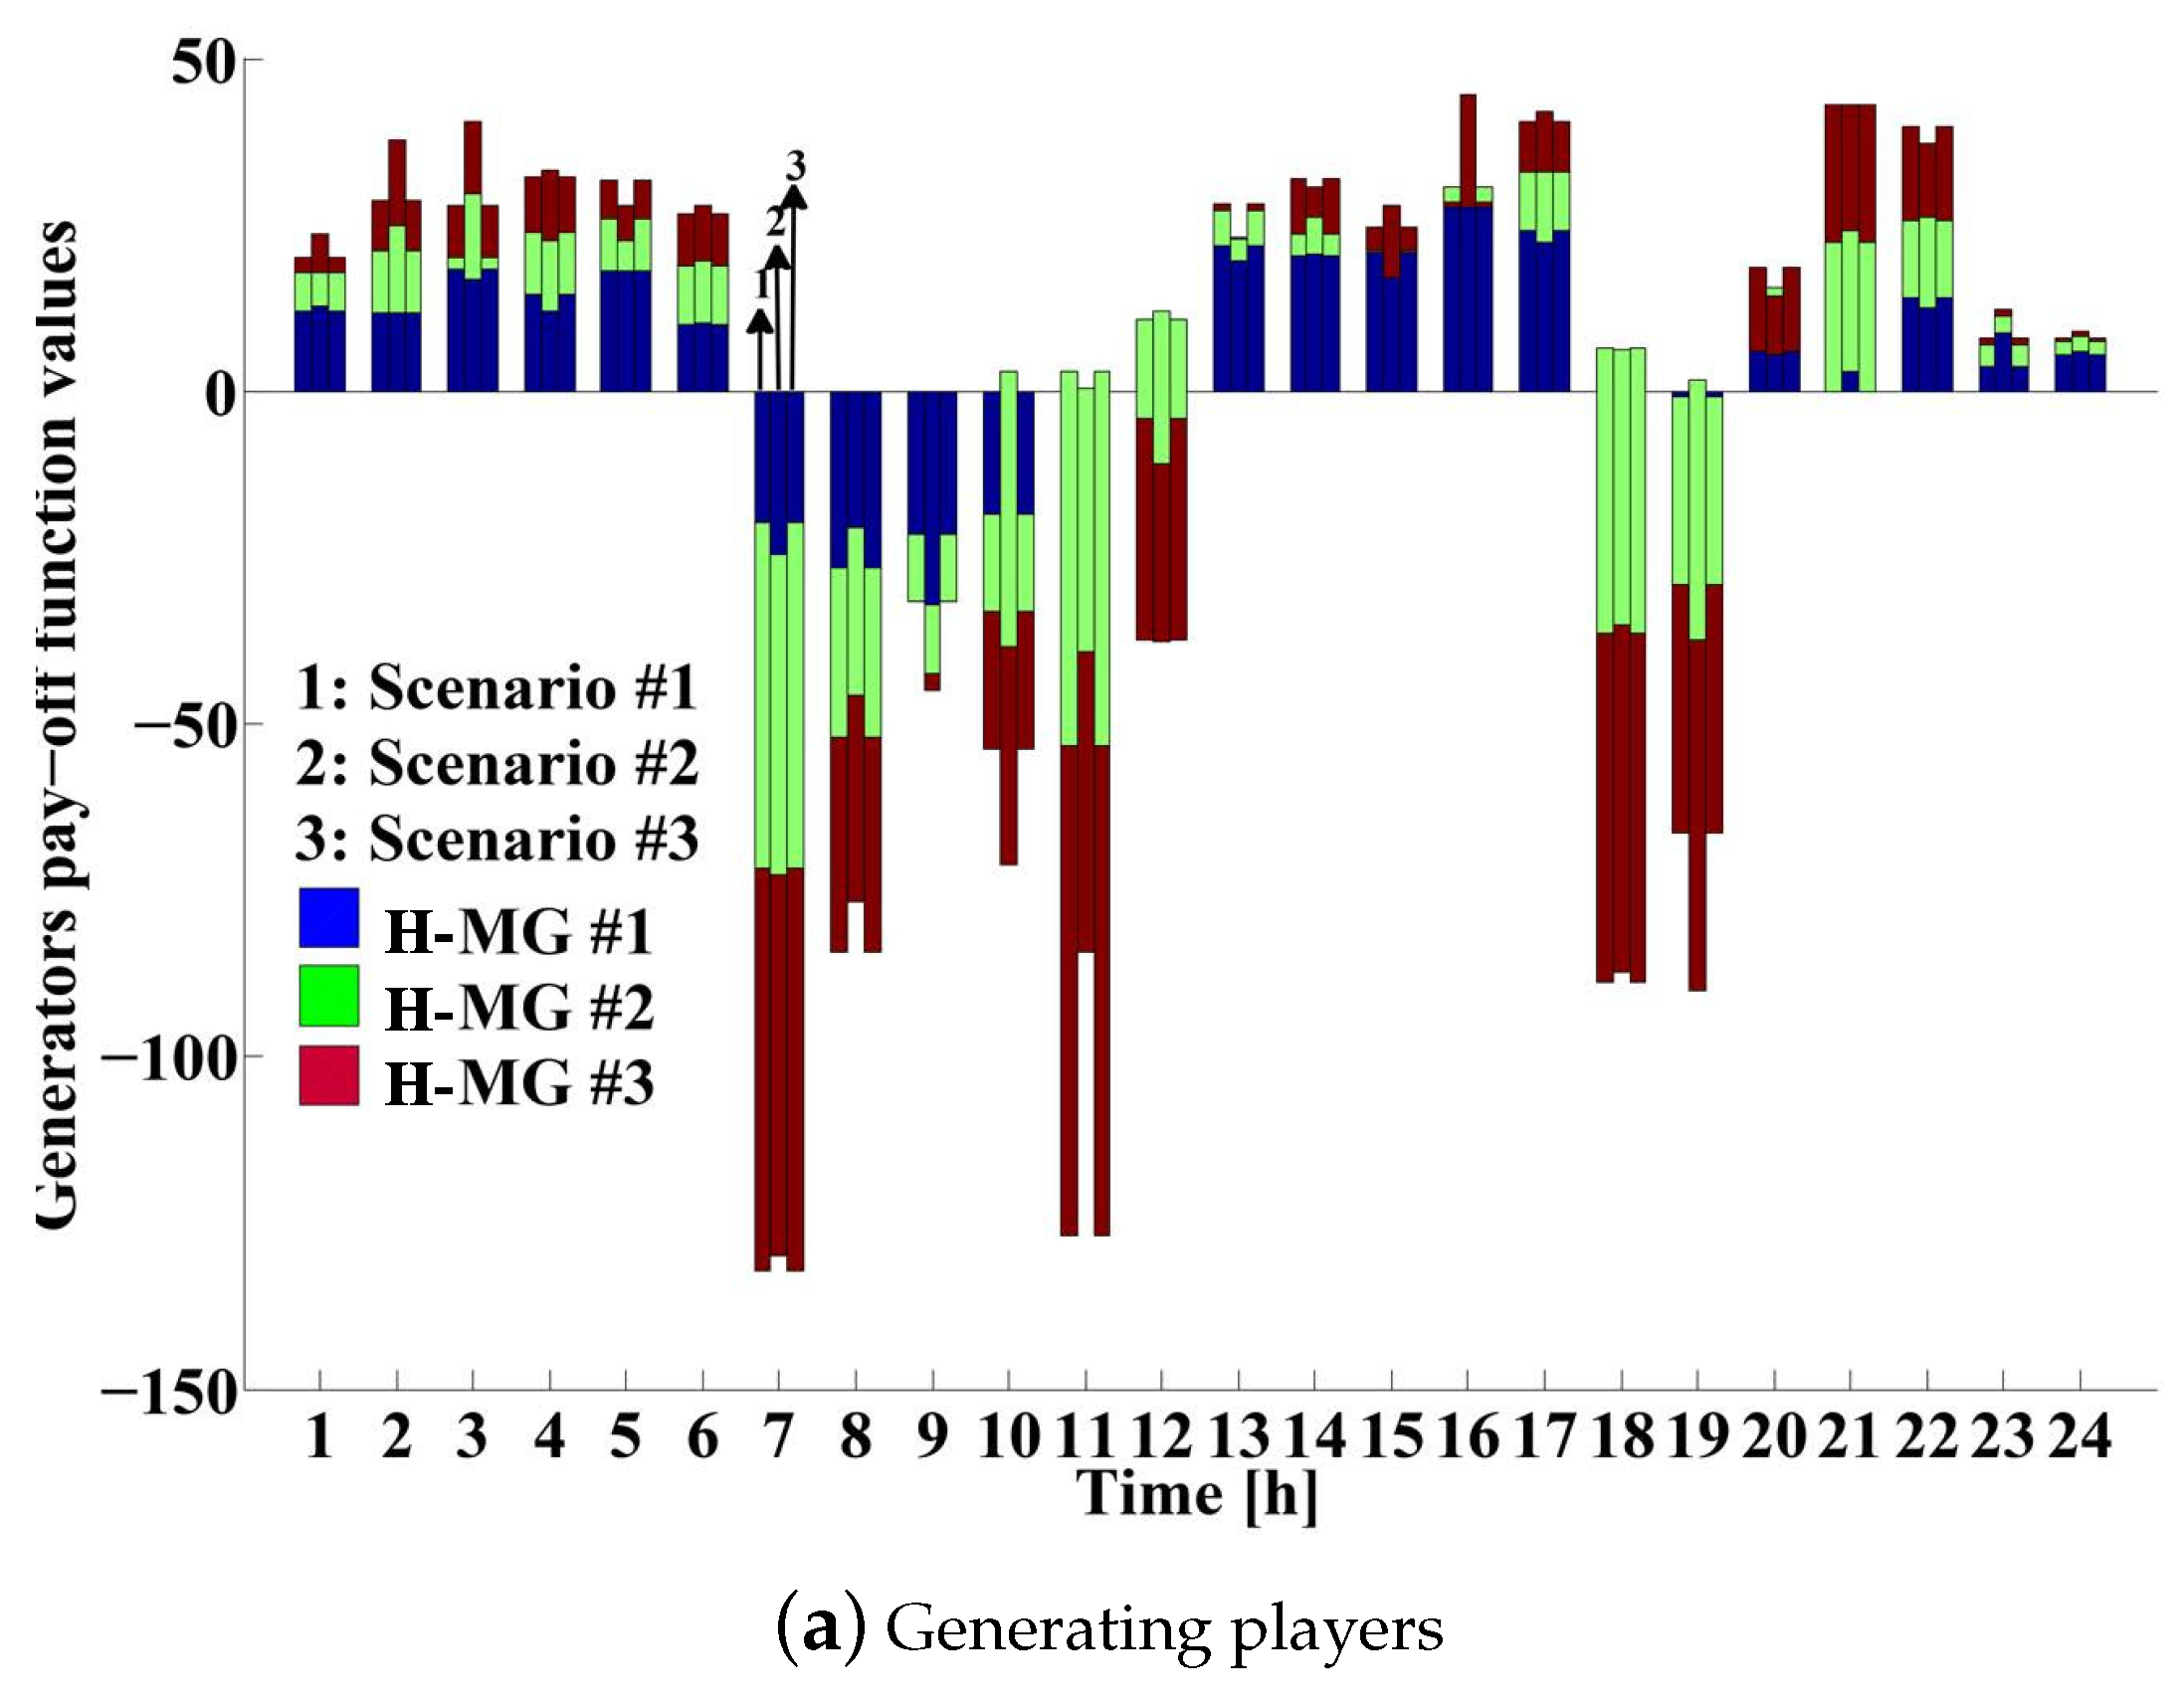
  • Scenario #1: Normal operation.
  • Scenario #2: Sudden NDU generation increase (by 10%).
  • Scenario #3: Sudden NDU generation decrease (by 10%).
For all scenarios, the amount of produced power by NDUs of each H-MG, and also the amount of consumed NRL (after applying the uncertainty) during a day is shown in Figure 7. The peak power consumption of H-MGs is mainly in the early hours of the morning and night as seen in Figure 7. Although, during these hours, the load demand in all H-MGs is far greater than the amount of power that is generated by the NDUs, remaining demand can be met by other options such as the generated power by DGUs, controlling demand by the RLD program, or purchasing power from the upstream grid.
In Figure 8, the generated power by DGUs of each H-MG is illustrated. Despite the higher load in H-MG #2 and #3 compared to H-MG #1, the amount of DGU’s generation by H-MG #1 is much higher than other H-MGs during the early hours of the morning. As can be seen in Figure 7, in these hours, the amount of generated power by NDUs of H-MG #1 is much less than other H-MGs. Therefore, the shortage of H-MG #2 and H-MG #3 is supplied through DGU of H-MG #1. A comparison of the results of DGUs in Scenarios #2 and #3 indicates that according to the increase in the generated power from renewable resources in Scenario #2, the DGUs’ production capacity in this scenario should be less than scenario #3. However, in a few time intervals, the algorithm has decided that the amount of generated power by DGUs in Scenario #2 could be higher than its amount in Scenario #3. This difference is very noticeable at 10 AM. In addition, owing to the fact that the amount of RLD has increased by 71% in Scenario #2, ES of H-MG #1 in Scenario #2 has discharged twice as much as Scenario #3. Indeed, the algorithm has striven to feed it. For the rest of the day, there is no noticeable change in the amount of generated power by DGUs in all H-MGs.
The power of ES in charging/discharging mode during 24-h system operation is shown in Figure 9. At some intervals, due to the sudden decline in the power generation from renewable resources, the algorithm has preferred to use the ES in order to meet the demand of H-MGs. On the other hand, if there is excess power in the system, this surplus power usually is used by the algorithm to charge the ESs in the network in order to maintain the state of charge (SOC) of the batteries at their maximum values. This approach will significantly boost the reliability of the system in response to power shortages or encountered unwanted events at other times. Based on this strategy, all ESs in the system will be set at their maximum value for their operation in the next day.
One of the main advantages of the proposed algorithm is its ability to control the RLD. The amount of RLD at different time intervals of a day is shown in Figure 10. As can be seen, at the early hours of the morning, when the NRL is very high, the algorithm has almost used the produced power by DGUs (Figure 8) and also the purchasing power from the upstream grid (as shown in Figure 11) to cover the NRL. Hence, the algorithm has allocated a small amount of power to feed the RLD.
Figure 12 shows values of the converged pay-off function for the consuming players, generating players and distribution companies under the implemented scenarios. As observed from Figure 12a, during the time interval of 7:00–8:00 am, all H-MGs experience power shortage and accept a cost for compensating the value of power demand from the upstream grid. As a result, they cannot gain revenue by selling power to their consumers and/or other H-MGs as observed in Figure 12b.
However, the amount of revenue of the upstream grid has increased significantly during this time interval as observed in Figure 12c. Also, during some time intervals, some of the H-MGs are observed to gain revenue but other H-MGs are charged for supplying their load demand. During these time intervals, H-MGs having excess power gain revenue by selling the required power to the H-MG encountering a power shortage. Furthermore, the upstream grid also compensates for the remaining power required by H-MGs having a power shortage. Thus, the revenue resulting from selling electricity is obtained.
In Scenario #1 and #2, H-MG #1 gained profit by selling power during 87.5% of the time intervals in a day. However, just during 25% of this time period, its revenue has been obtained from other H-MGs. This is why during this scenario, H-MG #2 gained profit from 62.5% of the time period. This value has reached about 54% for H-MG #3. With the reduction of power generated by renewable resources (in Scenario #3), the amount of H-MG #1 revenue has decreased by about 10%. This reduction in H-MGs #2 and #3 is about 7%. As it is observed from Figure 12b since the payoff function related to the consuming players is based on the reduction of electricity cost (during time intervals which the algorithm has increased the value of RLD demand for all H-MGs), the payoff function of the consumers has also increased.
To evaluate the performance and capability of the proposed algorithm in improving H-MGs pay-off in MH-MGs, its hourly value in the single H-MG system connected to the upstream grid and in the MH-MG network, shown in Figure 13, is evaluated. For this reason, values of the payoff function of H-MG #1 investigated in two case studies (single H-MG and MH-MG network) are evaluated. Although in the range of some intervals, the value of the pay-off in the single H-MG network is more than or equal to its value in the MH-MG network; however, a 78% increase in its value is observed in MH-MG during the 24 h period. It is imperative to state this point because the cost accepted by H-MG #1 during the time intervals for buying power is much less than its value in the single H-MG network.
In addition, to assess the effectiveness of the proposed algorithm, an independent simulation test in comparison to the ICA [18] under the normal operation has been conducted. The total payoff of all players under uncertainties in the network that consists of two H-MGs connected to the upstream grid is reported in Table 1. As the numeric results demonstrate that the REM-NIRA has been successful to achieve approximately a 169% boost in the total payoff related to the ICA. This outcome asserts that the REM-NIRA is able to improve the performance of the market with different ownership and contradictory objectives as well as power distribution in the network. Hence, more stakeholders are persuaded to engage in energy trading and as a consequence, the competition would increase significantly. Furthermore, this structure can assist in reducing electricity cost.

8. Conclusions

A centralized economic structure was proposed for MH-MG systems in this study. The proposed structure connected to the upstream grid was evaluated considering different objective functions including generating and consuming players separately. For each H-MG, the proposed structure provided an optimum scheduling for exchanging power among H-MGs while satisfying the defined objective functions and technical constraints. Presenting a fair non-cooperative structure like this, encourages a wide range of players with different ownership to take part actively in a competition of energy trading that could form the basis for creating an interactive and a powerful structure in the future power networks.
The discussed problem was formulated as a general multi-objective optimization problem and an algorithm based on the NIRA method was presented for solving the problem searching for a way to understand the electricity buyers and sellers’ individual behaviors and discover the optimal strategies which lead to maximizing the pay-off of all these players with contradicting goals in the competitive market. Interestingly, the formulated problem has very simplified formulas with smaller problems and less computational complexities relative to its dimensions. The proposed algorithm has the capability to exchange the optimum power in the H-MG distribution system where power management and extra load sharing functions were at no extra cost. The proposed algorithm increased the H-MGs’ interaction with one another and with the upstream grid by increasing the profit, reducing power mismatch, and reducing the electricity market clearing price. It was argued that the proposed structure can easily be applied to other scenarios with alternative aims and constraints rather than cases discussed in this paper.
The obtained numerical results showed that the presented structure will result in the minimum cost and consequently the maximum profit for players during their performance as consuming and generating players. Moreover, various flexibility resources and numerous players can be accommodated conveniently in order to address the concept of maintaining equilibrium state of a system between the local power supply and load demand, ergo, the proposed algorithm could offer technical advantages for a real-time power management of H-MGs to assure safe exploitation, distribution optimization and demand side management. Additionally, it could be used as an assured and effective programming tool for managing risk and investment studies since it could estimate the power dispatch profile of the generating resources which are either dependent or independent of loads, stochastic power and renewable resources.
In future research, authors are going to make advances on the REM-NIRA performance by providing cooperation opportunities between diverse partakers to join coalitions in the market through a dynamic binding strategy. Furthermore, the optimal power flow restrictions like voltage at different locations and also carbon emission constraints will be considered in the mathematical model.

Author Contributions

All authors jointly contributed to the research model and implementation, results analysis and writing of the paper.

Funding

This research received no external funding.

Conflicts of Interest

The authors declare no conflict of interest.

Nomenclature

Acronyms
CEMScentral energy management system
DERdistributed energy resources
DGUdispatchable generation unit
DNOdistribution network operator
EMSenergy management system
ESenergy storage
ES+, ES−ES during charging/discharging mode
EVexpected value
GRupstream grid
H-MGhome microgrid
H-MG+, H-MG−surplus/shortage power of H-MG
ICAimperialist competition algorithm
MCEMSmodified conventional energy management system
MCPmarket clearing price
MH-MGmultiple home microgrid
MOmarket operator
MTmicro-turbine
NDUnon-dispatchable unit
NRLnon-responsive load
PBUCprice-based unit commitment
PVPhoto-voltaic
SOCstate of charge
REMretail energy market
REM-NIRAREM based on Nikaido-Isoda/relaxation algorithm
RLDresponsive load demand
TOATTaguchi’s orthogonal array testing
WTWind turbine
Sets and Indices
θ , β load demand curve coefficients
a j , b j , c j coefficients of cost function of DGU in H-MG #j
q, q , q number of generating/consuming/distribution companies players
N s the number of the uncertainty
sthe scenario of A
nnumber of H-MGs
π ES , π ES + the supply bids by ES−/ES+ ($/kWh)
Δ t time interval
Constants
P ¯ A , j , P ̲ A , j the maximum /minimum output power of A in H-MG #j (kW)
A ∈ {ES−, ES+, DGU, NDU, H-MG−, H-MG+, NRL, RLD}
SOC ¯ ES , j , SOC ̲ ES , j limit of SOC of ES in H-MG #j (%)
Parameters
λ G R , i ( t ) offer price of distribution grid #i at time t ($/kWh)
P s A , j ( t ) output power of resource A under scenario #s in the H-MG #j (kW)
ρ s A , j ( t ) probability of scenario #s of resource A in the H-MG #j
Functions
C i (t), R i ( t ) , J i ( t ) cost/revenue/profit functions of generating player #i at time t ($) (i { 1 , 2 , , q } )
C A , j ( t ) cost of producing/buying power in H-MG #j ($)
C GR , i ( t ) , R GR , i ( t ) , J GR , i ( t ) cost/revenue/profit functions of distribution grid #i ($) (i { 1 , 2 , , q } )
C H MG + , j m ( t ) | m j , C H MG + , j i ( t ) cost of buying power by H-MG #j from H-MG #m/distribution grid #i ($)
(i { 1 , 2 , , q } )
J i ( t ) profit functions of consuming player #i at time t ($)
λ H MG , j ( t ) offer price of H-MG #j at time t ($/kWh)
EV A , j ( t ) expected value of A in H-MG #j at time t
Δ P amount of shortage power of H-MG #j is supplied partly or totally by the excess
power of H-MG #m
Decision Variables
P A , j ( t ) output power of A in H-MG #j during the time period t (kWh)
X H MG + , j ( t ) decision making variable of H-MG #j (i.e., 0 if H-MG #j is not satisfied through power
exchange with other H-MGs and 1 if otherwise)
P H MG + , j i ( t ) , P H MG , j i ( t ) amount of power which distribution grid #i sells /buys to/from H-MG #j at time t (kW)
x Nash equilibrium
SOC ES , j ( t ) ES SOC of H-MG #j at time t (%)

Appendix A

The details of the test system are presented in Table A1. Also, Table A2 provides the features of the devices of every H-MG and the coefficients related to the load demand prices.
Table A1. The input data of the proposed game structure.
Input DataValue in the Test System
Number of H-MGs3
Number of players7
Type of gamestatic
Players’ dimensions vector[4, 1, 4, 1, 4, 1, 2]
Upper bound level of players
Lower bound level of players0
Termination tolerance1 × 10 5
Maximum number of iterations allowed by the relaxation algorithm100
Table A2. Rated profile of distributed energy resources (DERs).
ParameterValueSymbol
ES System
Maximum ES power during dis/charging modes (kW) P ¯ ES + / P ¯ ES 0.816/3.816
Initial state of charge (SOC) at T (%) SOC I 50
Maximum/minimum SOC (%) SOC ¯ / SOC ̲ 80/20
Initial stored energy in ES (kWh) E I ES 1
Total capacity of ES (kWh) E Tot ES 2
Consumer bid by ES+ ($/kWh) π t ES + 0.145
Photo-Voltaic (PV)
Maximum/minimum instantaneous power for PV (kW) P ¯ PV / P ̲ PV 6/0
Wind Turbine (WT)
Maximum/minimum instantaneous power for WT (kW) P ¯ WT / P ̲ WT 8/0.45
Micro-Turbine (MT)
Maximum/minimum instantaneous power for MT (kW) P ¯ MT / P ̲ MT 12/3.6
Coefficients of cost function of DGUa($/kW 2 h)[6 × 10 6 ,7 × 10 6 , 8 × 10 6 ]
b($/kWh)[0.01, 0.015, 0.013]
c($/h)0
Load Coefficients
Load demand curve coefficients θ 0.001
β 3.4
Maximum coefficient of RLD related to NRL ζ 15

References

  1. Bashir, A.A.; Pourakbari Kasmaei, M.; Safdarian, A.; Lehtonen, M. Matching of Local Load with On-Site PV Production in a Grid-Connected Residential Building. Energies 2018, 11, 2409. [Google Scholar] [CrossRef]
  2. Al-Sumaiti, A.S.; Salama, M.M.; El-Moursi, M. Enabling electricity access in developing countries: A probabilistic weather driven house based approach. Appl. Energy 2017, 191, 531–548. [Google Scholar] [CrossRef]
  3. Marzband, M.; Yousefnejad, E.; Sumper, A.; Domínguez-García, J.L. Real time experimental implementation of optimum energy management system in standalone Microgrid by using multi-layer ant colony optimization. Int. J. Electr. Power Energy Syst. 2016, 75, 265–274. [Google Scholar] [CrossRef] [Green Version]
  4. Shafiee, Q.; Dragičević, T.; Vasquez, J.C.; Guerrero, J.M. Hierarchical Control for Multiple DC-Microgrids Clusters. IEEE Trans. Energy Convers. 2014, 29, 922–933. [Google Scholar] [CrossRef]
  5. Lu, X.; Guerrero, J.M.; Sun, K.; Vasquez, J.C.; Teodorescu, R.; Huang, L. Hierarchical Control of Parallel AC-DC Converter Interfaces for Hybrid Microgrids. IEEE Trans. Smart Grid 2014, 5, 683–692. [Google Scholar] [CrossRef]
  6. Marzband, M.; Azarinejadian, F.; Savaghebi, M.; Guerrero, J.M. An Optimal Energy Management System for Islanded Microgrids Based on Multiperiod Artificial Bee Colony Combined With Markov Chain. IEEE Syst. J. 2017, 11, 1712–1722. [Google Scholar] [CrossRef] [Green Version]
  7. Ou, T.C.; Hong, C.M. Dynamic operation and control of microgrid hybrid power systems. Energy 2014, 66, 314–323. [Google Scholar] [CrossRef]
  8. Acharya, S.; Moursi, M.S.E.; Al-Hinai, A.; Al-Sumaiti, A.S.; Zeineldin, H. A Control Strategy for Voltage Unbalance Mitigation in an Islanded Microgrid Considering Demand Side Management Capability. IEEE Trans. Smart Grid 2018. [Google Scholar] [CrossRef]
  9. Ou, T.C.; Lu, K.H.; Huang, C.J. Improvement of Transient Stability in a Hybrid Power Multi-System Using a Designed NIDC (Novel Intelligent Damping Controller). Energies 2017, 10, 488. [Google Scholar] [CrossRef]
  10. Ou, T.C. A novel unsymmetrical faults analysis for microgrid distribution systems. Int. J. Electr. Power Energy Syst. 2012, 43, 1017–1024. [Google Scholar] [CrossRef]
  11. Ou, T.C. Ground fault current analysis with a direct building algorithm for microgrid distribution. Int. J. Electr. Power Energy Syst. 2013, 53, 867–875. [Google Scholar] [CrossRef]
  12. Koolen, D.; Sadat-Razavi, N.; Ketter, W. Machine Learning for Identifying Demand Patterns of Home Energy Management Systems with Dynamic Electricity Pricing. Appl. Sci. 2017, 7, 1160. [Google Scholar] [CrossRef]
  13. Ahmad, A.; Khan, A.; Javaid, N.; Hussain, H.M.; Abdul, W.; Almogren, A.; Alamri, A.; Azim Niaz, I. An Optimized Home Energy Management System with Integrated Renewable Energy and Storage Resources. Energies 2017, 10, 549. [Google Scholar] [CrossRef]
  14. Yener, B.; Taşcıkaraoğlu, A.; Erdinç, O.; Baysal, M.; Catalão, J.P.S. Design and Implementation of an Interactive Interface for Demand Response and Home Energy Management Applications. Appl. Sci. 2017, 7, 641. [Google Scholar] [CrossRef]
  15. Asaleye, D.A.; Breen, M.; Murphy, M.D. A Decision Support Tool for Building Integrated Renewable Energy Microgrids Connected to a Smart Grid. Energies 2017, 10, 1765. [Google Scholar] [CrossRef]
  16. Hussain, H.M.; Javaid, N.; Iqbal, S.; Hasan, Q.U.; Aurangzeb, K.; Alhussein, M. An Efficient Demand Side Management System with a New Optimized Home Energy Management Controller in Smart Grid. Energies 2018, 11, 190. [Google Scholar] [CrossRef]
  17. Tushar, W.; Yuen, C.; Mohsenian-Rad, H.; Saha, T.; Poor, H.V.; Wood, K.L. Transforming Energy Networks via Peer-to-Peer Energy Trading: The Potential of Game-Theoretic Approaches. IEEE Signal Process. Mag. 2018, 35, 90–111. [Google Scholar] [CrossRef]
  18. Marzband, M.; Parhizi, N.; Savaghebi, M.; Guerrero, J. Distributed Smart Decision-Making for a Multimicrogrid System Based on a Hierarchical Interactive Architecture. IEEE Trans. Energy Convers. 2016, 31, 637–648. [Google Scholar] [CrossRef]
  19. Arun, S.L.; Selvan, M.P. Intelligent Residential Energy Management System for Dynamic Demand Response in Smart Buildings. IEEE Syst. J. 2018, 12, 1329–1340. [Google Scholar] [CrossRef]
  20. Wu, X.; Hu, X.; Yin, X.; Moura, S.J. Stochastic Optimal Energy Management of Smart Home With PEV Energy Storage. IEEE Trans. Smart Grid 2018, 9, 2065–2075. [Google Scholar] [CrossRef]
  21. Jia, L.; Tong, L. Dynamic Pricing and Distributed Energy Management for Demand Response. IEEE Trans. Smart Grid 2016, 7, 1128–1136. [Google Scholar] [CrossRef]
  22. Wei, W.; Liu, F.; Mei, S. Energy Pricing and Dispatch for Smart Grid Retailers Under Demand Response and Market Price Uncertainty. IEEE Trans. Smart Grid 2015, 6, 1364–1374. [Google Scholar] [CrossRef]
  23. Tavakoli, M.; Shokridehaki, F.; Akorede, M.F.; Marzband, M.; Vechiu, I.; Pouresmaeil, E. CVaR-based energy management scheme for optimal resilience and operational cost in commercial building microgrids. Int. J. Electr. Power Energy Syst. 2018, 100, 1–9. [Google Scholar] [CrossRef]
  24. Nunna, H.S.V.S.K.; Doolla, S. Demand Response in Smart Distribution System With Multiple Microgrids. IEEE Trans. Smart Grid 2012, 3, 1641–1649. [Google Scholar] [CrossRef]
  25. Eksin, C.; Deliç, H.; Ribeiro, A. Demand Response Management in Smart Grids With Heterogeneous Consumer Preferences. IEEE Trans. Smart Grid 2015, 6, 3082–3094. [Google Scholar] [CrossRef]
  26. Melgar Dominguez, O.D.; Pourakbari Kasmaei, M.; Lavorato, M.; Mantovani, J.R.S. Optimal siting and sizing of renewable energy sources, storage devices, and reactive support devices to obtain a sustainable electrical distribution systems. Energy Syst. 2018, 9, 529–550. [Google Scholar] [CrossRef]
  27. Marzband, M.; Ghazimirsaeid, S.S.; Uppal, H.; Fernando, T. A real-time evaluation of energy management systems for smart hybrid home Microgrids. Electr. Power Syst. Res. 2017, 143, 624–633. [Google Scholar] [CrossRef] [Green Version]
  28. Valinejad, J.; Marzband, M.; Akorede, M.F.; Barforoshi, T.; Jovanović, M. Generation expansion planning in electricity market considering uncertainty in load demand and presence of strategic GENCOs. Electr. Power Syst. Res. 2017, 152, 92–104. [Google Scholar] [CrossRef]
  29. Marzband, M.; Azarinejadian, F.; Savaghebi, M.; Pouresmaeil, E.; Guerrero, J.M.; Lightbody, G. Smart transactive energy framework in grid-connected multiple home microgrids under independent and coalition operations. Renew. Energy 2018, 126, 95–106. [Google Scholar] [CrossRef]
  30. Marzband, M.; Fouladfar, M.H.; Akorede, M.F.; Lightbody, G.; Pouresmaeil, E. Framework for smart transactive energy in home-microgrids considering coalition formation and demand side management. Sustain. Cities Soc. 2018, 40, 136–154. [Google Scholar] [CrossRef]
  31. Abdelsalam, A.A.; Gabbar, H.A.; Musharavati, F.; Pokharel, S. Dynamic aggregated building electricity load modeling and simulation. Simul. Model. Pract. Theory 2014, 42, 19–31. [Google Scholar] [CrossRef]
  32. Marzband, M.; Javadi, M.; Domínguez-García, J.L.; Mirhosseini-Moghaddam, M. Non-cooperative game theory based energy management systems for energy district in the retail market considering DER uncertainties. IET Gener. Transm. Distrib. 2016, 10, 2999–3009. [Google Scholar] [CrossRef] [Green Version]
Figure 1. A multiple home-microgrid (MH-MG) system. Non-dispatchable unit (NDU), dispatchable generation unit (DGU), energy storage (ES), responsive load demand (RLD).
Energies 11 03144 g001
Figure 2. Interaction of distributed network operator (DNO), market operator (MO) and MH-MGs. Central energy management system (CEMS), non-responsive load (NRL), market clearing price (MCP).
Energies 11 03144 g002
Figure 3. The process of implementing the proposed market structure. Expected value (EV), Nikaido-Isoda/relaxation algorithm (NIRA).
Energies 11 03144 g003
Figure 4. Flowchart of the proposed algorithm for implementing the retail energy market based on Nikaido-Isoda/relaxation algorithm (REM-NIRA). Taguchi’s orthogonal array testing (TOAT) unit, modified conventional energy management system (MCEMS) unit, and price-based unit commitment (PBUC).
Energies 11 03144 g004
Figure 5. PBUC unit.
Energies 11 03144 g005
Figure 6. The network under study.
Energies 11 03144 g006
Figure 7. NDU and NRL power profiles of each H-MG.
Energies 11 03144 g007
Figure 8. DGU power profile of each H-MG.
Energies 11 03144 g008
Figure 9. ES power of each H-MG in charging/discharging mode.
Energies 11 03144 g009
Figure 10. RLD power profile of each H-MG.
Energies 11 03144 g010
Figure 11. Upstream grid’s power profile for selling.
Energies 11 03144 g011
Figure 12. Upstream grid
Energies 11 03144 g012aEnergies 11 03144 g012b
Figure 13. Pay-off function related to H-MG #1 in the single H-MG and MH-MG under Scenario #1.
Energies 11 03144 g013
Table 1. Total payoff values of all players related to REM-NIRA and imperialist competition algorithm (ICA) under Scenario #1.
ObjectiveREM-NIRAICA
Total payoff value18.526.89

