Short-Term Wind Speed Forecasting Based on Signal Decomposing Algorithm and Hybrid Linear/Nonlinear Models


1
The State Key Laboratory of Tribology, Tsinghua University, Beijing 100084, China
2
School of Mathematical Sciences, Capital Normal University, Beijing 100048, China
*
Author to whom correspondence should be addressed.
Energies 2018, 11(11), 2976; https://doi.org/10.3390/en11112976
Submission received: 9 October 2018
/
Revised: 20 October 2018
/
Accepted: 21 October 2018
/
Published: 1 November 2018
(This article belongs to the Section A: Sustainable Energy)
Abstract
:Accurate wind speed forecasting is a significant factor in grid load management and system operation. The aim of this study is to propose a framework for more precise short-term wind speed forecasting based on empirical mode decomposition (EMD) and hybrid linear/nonlinear models. Original wind speed series is decomposed into a finite number of intrinsic mode functions (IMFs) and residuals by using the EMD. Several popular linear and nonlinear models, including autoregressive integrated moving average (ARIMA), support vector machine (SVM), random forest (RF), artificial neural network with back propagation (BP), extreme learning machines (ELM) and convolutional neural network (CNN), are utilized to study IMFs and residuals, respectively. An ensemble forecast for the original wind speed series is then obtained. Various experiments were conducted on real wind speed series at four wind sites in China. The performance and robustness of various hybrid linear/nonlinear models at two time intervals (10 min and 1 h) are compared comprehensively. It is shown that the EMD based hybrid linear/nonlinear models have better accuracy and more robust performance than the single models with/without EMD. Among the five hybrid models, EMD-ARIMA-RF has the best accuracy on the whole for 10 min data, and the mean absolute percentage error (MAPE) is less than 0.04. However, for the 1 h data, no model can always perform well on the four datasets, and the MAPE is around 0.15.
1. Introduction
Wind energy has been growing fast in recent years. By the end of 2017, the worldwide total capacity of wind turbines reached 539 GW (52.6 GW added in 2017) [1]. Because of the stochastic variation of wind speed, wind energy behaves in a more unstable and volatile manner than traditional energy sources. Direct integration of unstable wind power will have a serious impact on the whole grid, especially for the areas with high levels of wind power penetration [2,3,4]. If the wind speed could be predicted accurately, the dispatching plan of the power system could be adjusted to reduce the adverse impact of the wind power on the whole grid. It is also beneficial for the improvement of the power limit of the wind power penetration. Therefore, accurate wind speed forecasting is very important for grid load management and system operation [5,6,7,8,9].
Many efforts have been made on developing accurate wind speed forecasting models. The autoregressive moving average (ARMA) or autoregressive integrated moving average (ARIMA) models are considered to be the most widespread models in wind speed forecasting. Torres et al. [10] first carried out the transformation and standardization of the original wind speed series to allow the use of ARMA models. Shi and Erdem [11] comprehensively evaluated the effectiveness of ARMA-generalized autoregressive conditional heteroscedastic (GARCH) approaches for modeling the mean and volatility of wind speed. Lydia et al. [12] built various ARMA models with and without external variables to predict wind speed at 10-min intervals up to 1 h. Note that the ARIMA models are considered as inherent linear models, although curvilinear (or nonlinear) relations could be incorporated in these models. Besides ARIMA models, machining learning (ML) models, such as artificial neural network (ANN) with back propagation (BP) and radial basis function (RBF) [13,14], support vector machine (SVM) [15], extreme learning machines (ELM) [16], and deep learning networks (DLN) [17,18], have shown excellent potentials in accurate wind speed predictions. Usually, ML models are considered as nonlinear models as they are more flexible compared with linear models, and thus could better deal with nonlinear relations. Despite showing superiority over linear models, the ML models also have their own shortcomings, e.g., dilemma of local minima, the over-fitting problem, poor efficiency with fewer samples. Many studies have shown that single linear or nonlinear models could not give satisfactory results for all situations due to their drawbacks [19]. Therefore, hybrid models, by synthesizing the advantages of single models, are the trend of advanced wind speed forecasting.
Some signal de-noising measures need to be implemented to make the wind speed series less noisy and more stable. Empirical mode decomposition (EMD) [20] is a de-noising method based on local characteristics of the signal. EMD absorbs the advantages of multi-resolution of wavelet decomposition, overcomes the difficulty of determining the wavelet base and decomposition scale, and is more suitable for nonlinear and non-stationary signal sequences [21]. Thus, EMD is usually used to decompose the original wind speed series into a small number of intrinsic mode functions (IMFs) and residuals, which will be respectively studied by various models to formulate a hybrid forecast for original wind speed series. The ANN family is the most commonly used prediction tool in EMD based hybrid forecasting models [22,23,24,25,26,27,28,29,30,31,32]. Guo et al. [22] first proposed a modified EMD-ANN model for multi-step wind speed forecasting. After simulations on the monthly and daily wind speed data in Zhangye of China, the proposed model showed the best accuracy comparing with the single ANN and unmodified EMD-ANN model. By introducing the latest decomposing algorithm, fast ensemble EMD (FEEMD), Multilayer perceptron (MLP) neural networks and Adaptive neuro fuzzy inference system (ANFIS) neural networks, two new hybrid models (FEEMD-MLP, FEEMD-ANFIS) were proposed by Liu et al. [23]. After comparisons with the wavelet packet decomposition (WPD) based hybrid models (WPD-MLP and WPD-ANFIS), they found that the FEEMD-MLP hybrid model has the best performance in the three-step predictions [24]. Liu et al. [25] also used the FEEMD for a secondary decomposition, and found that the FEEMD could further improve the forecasting accuracy of WPD based hybrid models. Xiao et al. [26] and Sun and Wang [27], respectively, adopted the bat algorithm and phase space reconstruction to improve the accuracy of BP models, and then developed new forecasting architectures based on FEEMD and modified BP. Santhosh et al. [28] utilized the adaptive wavelet neural network (WNN) to regress each signal decomposed by EMD. The proposed EMD based hybrid approach was subsequently investigated with respect to the wind farm of south India. In recent years, Wang and his collaborators [29,30,31,32] developed a series of powerful EMD based hybrid forecasting systems. Several ANN models, including Elman neutral network (ENN) [29], WNN [30,32] and generalized regression neural network (GRNN) [31], have been adopted in the systems. Some popular parameter optimization algorithms, such as the multi-objective ant lion optimization algorithm [29], meta-heuristic optimization algorithm [31] and multi-objective sine cosine algorithm [32], were respectively developed to ensure the hybrid forecast models are in the optimal state. The experimental results indicated that the average values of the mean absolute percent errors of the developed model utilizing 10-min, 30-min and 60-min interval data are lower than 8% [29]. ELM is another popular prediction tool in EMD based hybrid forecasting models [33,34,35,36,37]. Liu et al. [33] first introduced the ELM to the hybrid forecasting architecture using EMD and FEEMD as wind signal decomposing algorithms. Their experiments indicated that by using the EMD and FEEMD, all the hybrid algorithms have better performance than the single ELMs. Then, Liu et al. [34] used the outlier correction method to guarantee the robustness of ELM during the forecasting computation. They also developed a multi-decomposing strategy based on the combination of EMD and WPD, and showed that the WPD-EMD-ELM hybrid model has the best predicting performance [35]. Two improved ELM models, named by regularized ELM [36] and composite quantile regression outlier-robust ELM [37], were introduced to model each EMD decomposed sub-series. Besides the ANN and ELM, the SVM also received the attention of some scholars in EMD based hybrid wind speed forecasting [38,39].
Most of the above studies adopted only single nonlinear model (ANN [22,23,24,25,26,27,28,29,30,31,32], ELM [33,34,35,36,37] or SVM [38,39]) to study the IMFs decomposed by the EMD. Because the characteristics of IMFs and residuals are not the same, hybrid strategies with one more different types of forecast models might get even better results. More recently, some scholars have made meaningful attempts in this area. Zhang et al. [40] employed a recent type of EMD to divide the original wind speed data into a finite set of IMFs and residuals, and then utilized five neural networks (including BP, RBF, GRNN, WNN and ENN) to forecast each IMFs and residuals. Experimental results of their study showed that the proposed hybid model can take advantages of individual models and has the best performance. Li et al. [41] developed a novel hybrid forecasting model, which combines EMD and several single models (BP and ENN). A modified SVM was then used to integrate all the results to obtain the final forecasting results. Experimental studies on real 10-min wind speed series showed that the developed hybrid model outperforms other benchmark models. Among the EMD decomposed IMFs and residuals, the low frequency dominated residuals behave more stable and might be more suitable for forecasting with linear models (ARIMA). For the IMFs with higher frequency components, it is better to be modeled by nonlinear prediction models (such as ANN, ELM, SVM, etc.). Thus, combining both linear and nonlinear models for predicting IMFs and residuals with various frequency band components might be a good choice for precise wind speed forecasting. However, such idea has not been realized in current studies.
The above literature review indicates that it is rare to see that two (or more) prediction tools are used in EMD based hybrid wind speed forecasting; this is particularly true for the hybrid linear/nonlinear modeling and prediction of wind speed series. In addition, few efforts have been paid to comprehensively compare the performance and robustness of both linear and nonlinear models in short-term wind speed forecasting. Therefore, the novelty and contributions of this study can be summarised as follows:
- ■
- A framework for short-term wind speed forecasting is introduced based on EMD and hybrid linear/nonlinear models. The EMD is adopted to decompose the original wind speed series into a finite number of IMFs and residuals, i.e., low-frequency residuals (LFR), medium-frequency IMF (MIMF) and high-frequency IMF (HIMF).
- ■
- Several popular linear models (ARIMA) and nonlinear models (SVM, random forest (RF), BP, ELM and convolutional neural network (CNN)) are, respectively, utilized to study each IMFs and residuals. An ensemble forecast for the original wind speed series is then obtained.
- ■
- Various experiments are conducted on the real wind speed data at four wind sites in China. The performance and robustness of various hybrid linear/nonlinear models at two time intervals (10 min and 1 h) are compared comprehensively. The forecasting model with the best performance is then recommended for real applications.
The remainder of this paper is organized as follows. Section 2 explains the structures and procedures of EMD based hybrid models, Section 3 introduces the measurement of wind speed data at four sites in China, Section 4 presents the evaluation of model parameters and compares the performances of various models, and Section 5 summarises the conclusions of the study.
2. Methods
The solution process of EMD is explained in this section. After introduction of both linear (ARIMA) and nonlinear (SVM, RF, BP, ELM and CNN) single models, the structures and procedures for EMD based hybrid linear/nonlinear models are proposed in detail. Several metrics for measuring the forecast accuracy are also introduced briefly.
2.1. EMD
The original wind speed data is processed by EMD, and a finite number of IMFs with different scales or trends are obtained. Compared with the original data series, each IMF has better stability and regularity. The decomposed IMFs should satisfy two conditions [21]: (a) The number of extrema and the number of zero crossings are equal or differ at most by one; (b) At any point, the mean value of the envelope defined by the local maxima and the envelope defined by the local minima is zero. The computation of the EMD can be given as follows [21]:
- (1)
- For wind speed series , all of the local maximal and minimal data points are found and located;.
- (2)
- Two cubic spline lines are used to connect all of the local maximal and minimal points, respectively. Then, upper and lower envelopes and are gained accordingly.
- (3)
- Mean values are calculated.
- (4)
- New time series is defined. If satisfies condition (a) and (b), then the could be considered as a IMF; otherwise, replace by , and repeat step (1)–(4) until the condition (a) and (b) are simultaneously obeyed.
- (5)
- Residuals are then calculated. Replace by , and repeat step (1)–(5) until all the IMFs and residuals are found.
In our study, two IMFs (HIMF and MIMF) and residuals (LFR) are used to represent the original wind speed series, and are respectively studied by both linear and nonlinear models to obtain an ensemble forecast.
2.2. Single Linear Models (ARIMA)
The model is known as ARIMA , where p is the order of the autoregressive part, q is the order of the moving average part, d is the degree of first difference involved. The Augmented Dickey-Fuller (ADF) [42] is used to determine whether the wind speed series is stable or not. If it is unstable, first difference should be applied, i.e., . The autocorrelation function (ACF) and partial autocorrelation function (PACF) [42] plots are then utilized to determine the order of ARIMA model. The maximum likelihood method is utilized to estimate the model parameters. In principle, the ARIMA model with estimated parameters should generate the lowest residuals.
2.3. Single Nonlinear Models
Five nonlinear models (SVM, RF, BP, ELM and CNN) are used in this study. They are briefly introduced as follows:
- (1)
- The SVM model has recently been used in a range of applications such as regression and time series forecasting. The basic idea of SVM for regression is to use a nonlinear mapping model to transform the data into a high-dimensional feature space, and then perform a linear regression in the feature space. Optimal weight and bias values are obtained by solving the quadratic optimization problem [43].
- (2)
- The RF model, which was suggested by Breiman [44], is an ensemble learning method for classification and regression. It is operated by constructing a multitude of decision tress at the training stage and outputting the mean prediction of individual trees. Classification and regression trees (CARTs) [45] in the RF model use the binary rules to divide data samples. CARTs could correct decision trees’ habit of overfitting to their original dataset.
- (3)
- Among many available learning algorithms, BP has been the most popular implemented learning algorithm for all ANN models [46]. The time series data is introduced by the input layer, and the forecast value is produced by the output layer. The layer between the input and output layers is called the hidden layer, where data are processed. The procedure of BP is repeated by adjusting the weights of the connection in the network using the gradient descent. Ref. [47] presented the detailed algorithm.
- (4)
- The ELM’s structure is similar to the single hidden layer feed-forward neural network [48]. The main idea of the ELM model is to randomly set the network weights and then obtain the inverse output matrix of the hidden layer. This concept makes the ELM model operate extremely fast and maintain better accuracy compared with other learning models. The number of hidden nodes, which is the key parameter of ELM model, should be carefully estimated in order to obtain good results [16].
- (5)
- CNN is a class of deep, feed-forward ANNs, most commonly applied to image classification and then generalized for time series prediction. In order to simply the preprocessing, CNN utilizes a variation of multilayer perceptrons. Except that the filter weights need to be shared, there are no other connections between the neurons. Thus, CNN could be trained more efficiently and have reliable abilities to extract the hidden features [49].
2.4. Hybrid Linear/Nonlinear Models
The idea of hybrid linear/nonlinear models is shown in Figure 1. The EMD is first adopted to decompose the linear and nonlinear characteristics of original wind speed data into a finite number of IMFs and residuals (HIMF, MIMF and LFR) as
Usually, the LFR retains more linear characteristics, while the nonlinear characteristics are dominant in HIMF and MIMF. The linear (ARIMA) model is utilized to fit LFR as
By applying the nonlinear models on both HIMF and MIMF, the nonlinear characteristics of wind speed data are extracted as follows
From Equation (1), we can obtain the ensemble prediction results of the hybrid linear/nonlinear model
As five nonlinear models (SVM, RF, BP, ELM and CNN) are adopted, so the hybrid linear/nonlinear models are named by EMD-ARIMA-SVM, EMD-ARIMA-RF, EMD-ARIMA-BP, EMD-ARIMA-ELM and EMD-ARIMA-CNN. In order for comparisons, the obtained HIMF, MIMF and LFR are studied by single linear or nonliear models, which are named by EMD-ARIMA, EMD-SVM, EMD-RF, EMD-BP, EMD-ELM and EMD-CNN. Moreover, single linear or nonlinear models are also directly applied on the original wind speed data to show the effect of EMD on the forecasting accuracy.
2.5. Forecasting Performance Metrics
Three metrics, including root mean square error (RMSE), mean absolute error (MAE) and mean absolute percentage error (MAPE), are utilized to evaluate the forecasting performance. Their mathematical definitions are given as follows
where denote the actual and predicted values, n is the sample number. Using the above three metrics, various models, including the single models (ARIMA, SVM, RF, BP, ELM, CNN) and EMD based single models (EMD-ARIMA, EMD-SVM, EMD-RF, EMD-BP, EMD-ELM, EMD-CNN) and EMD based hybrid linear/nonlinear models (EMD-ARIMA-SVM, EMD-ARIMA-RF, EMD-ARIMA-BP, EMD-ARIMA-ELM, EMD-ARIMA-CNN), will be evaluated for their forecast performance on different wind speed datasets, respectively.
3. Data Descriptions
At a wind observation site, the wind speed data is continuously measured using the anemometers. Four wind sites in China, listed in Table 1, were selected for this study. The wind speed data with two time intervals (10 min and 1 h) are considered, and shown in Figure 2 and Figure 3, respectively. The length for every wind speed series is 1000 points. The first 800 points of data are used for constructing and training the forecasting models, while the remaining 200 points of data are utilized for tests. Descriptive statistics of wind speed data are also given in Table 2.
4. Results and Discussions
Model parameters of various single models should be determined first (i.e., ARIMA, SVM, RF, BP, ELM and CNN). Also, after the EMD, the obtained HIMF, MIMF and LFR are, respectively, studied by the single models (EMD-ARIMA, EMD-SVM, EMD-RF, EMD-BP, EMD-ELM and EMD-CNN). The parameters of the EMD based hybrid linear/nonlinear models (EMD-ARIMA-SVM, EMD-ARIMA-RF, EMD-ARIMA-BP, EMD-ARIMA-ELM, EMD-ARIMA-CNN) are then identified. Finally, short-term predictions are made based on the constructed models.
4.1. Single Models without EMD
4.1.1. ARIMA
In this study, we utilize the “auto.arima” function in R to fit the best ARIMA model to the univariate time series. For instance, ARIMA(1,1,1) is obtained as the best model for the 10 min data of the AnHui (AH) site. The maximum likelihood method is applied to estimate the model parameters, whose values are given in Table 3. In order to verify the obtained model, the parameter significant test is carried out and shown in Figure 4. Obviously, the fitting residuals are random series and the p value is found to be significantly greater than 0.05, indicating that the obtained ARIMA model is reasonable. By applying the “auto.arima” function, the single ARIMA model parameters for both 10 min and 1 h data of four wind speed datasets are determined and given in Table 3.
4.1.2. SVM, RF, BP, ELM and CNN
In the SVM model, two parameters, namely the bandwidth and regularization factor , should be estimated for each of the wind speed sites. Following the suggestions of Zhou et al. [15], we will consider the values of as 0.1, 0.25, 1, 4, 16, 100, 1000 and as 0.25, 1, 4, 16, 256. Single SVM models with different combinations of and are utilized to fit the wind speed time series at the GuangDong (GD) site, and the obtained MAE values are listed in Table 4. Obviously, when , the MAE value of the 10 min data is minimum, i.e., 0.444. For the 1 h data, the minimum MAE value (0.754) is obtained at . For the GD site, the optimal parameters of single SVM model are: (10 min data) and (1 h data). Similarly, the optimal parameters of SVM models for other three wind speed sites could also be determined and shown in Table 5.
For the RF model, the number of trees and number of extracted features should be determined [44]. Here, we consider number of trees to vary from 50 to 700 and number of extracted features to vary from 1 to 4, and use the RF model to fit each wind speed time series. The calculated MAE values at the HeiLongJiang (HLJ) site are given in Table 6. When the number of trees is equal to 100 and the number of extracted features is equal to 2, the MAE of 10 min data reaches the minimum, i.e., 0.8992. For 1 h data, the minimum MAE is obtained for the number of trees equal to 300 and number of extracted features equal to 3. Thus, the optimal parameters of single RF models for the HLJ site are determined. Following the same process, the best RF models for other three wind sites can also be gained and shown in Table 5.
For the single BP model, there is no reliable way to determine the optimal parameters. In this study, we just try four structures, named by s1: 10-10-10-10-10, s2: 10-10-10-10, s3: 10-10-10 and s4: 10-20-50, to see which structure has the lowest MAE value. Table 7 shows the MAE values of the single BP model with different structures for wind speed time series at the AH site. It is shown that either 10 min data or 1 h data, the BP model with structure s4 always has the minimum value of MAE, and thus it is selected as the best single BP model. Similarly, other three wind sites are studied to obtain the best structure for the single BP model, and the results are given in Table 5.
For the single ELM model, the key parameter is the number of hidden neurons (). Here, we set , and take the wind speed data at the GanSu (GS) site as an example. The calculated MAE results are listed in Table 8. It is shown that for the 10 min data, the minimum MAE is obtained at . For the 1 h data, the minimum MAE is gained at . Thus, for the wind speed data at the GS site, the best number of hidden neurons should be 40 (10 min data) and 200 (1 h data). In this way, the best single ELM models for other three wind sites could also be gained and shown in Table 5.
For the single CNN model, we just adopt the structure recommended by Liu et al. [50]. In their study, the CNN model consists of three convolutional layers and a fully connected layer. The channels of the convolutional layers are 4, 16 and 32, respectively. In the following study, the CNN model has the same structure.
4.2. Single Models with EMD
4.2.1. EMD-ARIMA
The EMD is adopted to decompose the original wind speed data into a finite number of IMFs and residuals (HIMF, MIMF and LFR). Figure 5 gives the EMD results of 10 min data at the AH site. Compared with the original data (see Figure 2a), one can find that the LFR retains the trend and low frequency components. The high frequency components are dominant in HIMF and MIMF. Similar to the solution process presented in Section 4.1, the orders and parameters of ARIMA models for HIMF, MIMF and LFR could be determined accordingly. Table 9 gives the results of both 10 min data and 1 h data of four wind sites.
4.2.2. EMD-SVM, EMD-RF, EMD-BP, EMD-ELM, EMD-CNN
In Section 4.1, the single nonlinear models are studied to estimate their parameters and structures. Here, the HIMF, MIMF and LFR obtained by EMD are also analyzed by single nonlinear models following the same solution process with that presented in Section 4.1. The results of both 10 min data and 1 h data of the four wind sites are shown in Table 10.
4.3. Hybrid Models with EMD
As shown in the above section, the idea of hybrid linear/nonlinear models is to use the linear (ARIMA) model to analyze the LFR, while the HIMF and MIMF are studied by nonlinear models. Thus, the ARIMA models in EMD based hybrid linear/nonlinear models have the same orders and parameters with EMD-ARIMA models for LFR, as shown in Table 9. The single nonlinear models with EMD, as shown in Table 10, will also be utilized in the hybrid models to get the nonlinear predictions from the HIMF and MIMF. Then, the ensemble prediction results of the hybrid linear/nonlinear model are obtained according to Equation (1).
4.4. Forecasting Performance Comparisons
Short-term predictions for both 10 min data and 1 h data are made using the estimated single and EMD based hybrid models, respectively. Values of three metrics (RMSE, MAE and MAPE) are calculated for the predictions of the four sites in China. The results of the 10 min data and 1 h data are compiled and shown in Figure 6, Figure 7, Figure 8, Figure 9, Figure 10, Figure 11, Figure 12 and Figure 13, respectively. We can see that:
- (1)
- Single ARIMA models have better prediction accuracy than the single SVM, RF, BP, ELM and CNN models, except for the 1 h data of the GD and HLJ sites. For 1 h data of the GD site (see Figure 11), the RMSE value of RF (1.095) is slightly lower than the ARIMA model (1.128). At the HLJ site (see Figure 13), from the MAPE metric, the RF model (0.2306) is better than the ARIMA model (0.2542).
- (2)
- The introduction of EMD is beneficial to most single models’ prediction accuracy, but there are exceptions. For instance, both RMSE and MAE values of EMD-CNN model on the 10 min data of the AH site (see Figure 6) seem to show little difference from that of the single CNN model. A similar phenomenon could also be found in the EMD-BP model on the 10 min data of the GD site (see Figure 7).
- (3)
- EMD based hybrid linear/nonlinear models (EMD-ARIMA-SVM, EMD-ARIMA-RF, EMD-ARIMA-BP, EMD-ARIMA-ELM and EMD-ARIMA-CNN) always have the top ranked metric (see the minimum value in these figures), which means that the EMD based hybrid linear/nonlinear models generally have better accuracy and more robust performance than the single models with/without EMD. Quantitative comparisons between hybrid models and single ARIMA models are taken as an example. Maximum accuracy increase of RMSE is found at the 10 min data of the GD site (see Figure 7), from 0.2569 of the ARIMA model to 0.121 of the EMD-ARIMA-RF model. The relative accuracy increase is about 52.9%; the maximum accuracy increase of MAE is found at the 10 min data of the GD site (see Figure 7), from 0.2012 of the ARIMA model to 0.088 of the EMD-ARIMA-RF model. The relative accuracy increase is about 56.26%; the maximum accuracy increase of MAPE is found at the 1 h data of the HLJ site (see Figure 13), from 0.2542 of the ARIMA model to 0.1021 of the EMD-ARIMA-RF model. The relative accuracy increase is about 59.83%. Thus, EMD based hybrid models could greatly improve the forecast accuracy (higher than 50%).
- (4)
- Among the five hybrid models, EMD-ARIMA-RF has the best accuracy on the whole for 10 min data. However, for the 1 h data, no model can always perform well on the whole dataset. EMD-ARIMA-CNN seems to be better as it outperforms other hybrid models on the 1 h data of the AH site (see Figure 10) and GD site (see Figure 11). EMD-ARIMA-SVM and EMD-ARIMA-RF have better precision on the 1 h data of the GS site (see Figure 12) and HLJ site (see Figure 13), respectively.
Moreover, we can see that EMD based hybrid linear/nonlinear models perform worse on 1 h data than on 10 min data. Let us consider the metric of MAPE. For the 10 min data, the MAPE is around 0.03 and the worst is no more than 0.04 (see 0.0368 in Figure 8). However, for the 1 h data, the MAPE is around 0.10 and the worst is close to 0.15 (see 0.1427 in Figure 12). This is mainly because the correlation of 10 min data is stronger than that of 1 h data, and thus the 10 min data is easier for forecasting.
4.5. Discussions
From the above analysis, we can see that the proposed hybrid model is mainly composed of the existing mature linear and nonlinear prediction algorithms, so it is very suitable for the promotion of practical engineering applications. The proposed hybrid model performs well in short-term wind speed prediction, and the MAPE can reach 0.03 (10 min data). For the 1 h data, the prediction performance has decreased significantly, and the MAPE has exceeded 0.10. Predictably, in the medium and long term wind speed forecasting, the performance of proposed hybrid model would be even worse. Therefore, future studies will combine weather numerical prediction results to improve the accuracy and performance of hybrid models in the medium and long term wind speed forecasting.
5. Conclusions
A framework for short-term wind speed forecasting is introduced based on EMD and hybrid linear/nonlinear models. The EMD is adopted to decompose the original wind speed series into a finite number of IMFs and residuals, which are studiedby several linear models (ARIMA) and nonlinear models (SVM, RF, BP, ELM and CNN) to obtain the ensemble forecast for the original wind speed series. Forecasting experiments are conducted on real wind speed series at four wind sites in China. The performance and robustness of various hybrid linear/nonlinear models at two time intervals (10 min and 1 h) are compared comprehensively. It is shown that single ARIMA models have better prediction accuracy than the single SVM, RF, BP, ELM and CNN models. The introduction of EMD is beneficial to most single models’ prediction accuracy. The EMD based hybrid linear/nonlinear models generally have better accuracy and more robust performance than the single models with/without EMD. Among the five hybrid models, EMD-ARIMA-RF has the best accuracy on the whole for 10 min data. However, for the 1h data, no model can always perform well on the whole dataset. As the existing mature linear and nonlinear forecast models are adopted, they will greatly enhance the practical utility of the proposed hybrid wind speed forecasting model.
Author Contributions
Q.H., H.W., T.H. and F.C. developed the theoretical framework. Q.H. and H.W. performed the numerical simulation. Q.H. wrote the manuscript with help from H.W., T.H. and F.C. supervised the research.
Acknowledgments
The research work was supported by the NSFC under No. 11472147/51335006, and the SKLT under No. SKLT2015B12. Tao Hu’s work was partly supported by Support Project of High-level Teachers in Beijing Municipal Universities in the Period of 13th Five-year Plan (No. CIT&TCD 201804078) and “Capacity Building for Sci-Tech Innovation-Fundamental Scientific Research Funds” (No. 025185305000/204).
Conflicts of Interest
The authors declare no conflict of interest. The founding sponsors had no role in the design of the study; in the collection, analyses, or interpretation of data; in the writing of the manuscript, and in the decision to publish the results.
Abbreviations
The following abbreviations are used in this manuscript:
| EMD | empirical mode decomposition |
| IMF | intrinsic mode functions |
| ARIMA | autoregressive integrated moving average |
| SVM | support vector machine |
| RF | random forest |
| ANN-BP | artificial neural network with back propagation |
| ELM | extreme learning machines |
| CNN | convolutional neural network |
| MAPE | mean absolute percentage error |
| GARCH | generalized autoregressive conditional heteroscedastic |
| RBF | radial basis function |
| DLN | deep learning networks |
| FEEMD | fast ensemble EMD |
| MLP | Multilayer perceptron |
| ANFIS | Adaptive neuro fuzzy inference system |
| WPD | wavelet packet decomposition |
| WNN | wavelet neural network |
| ENN | Elman neutral network |
| GRNN | generalized regression neural network |
| LFR | low-frequency residuals |
| MIMF | medium-frequency IMF |
| HIMF | high-frequency IMF |
| ADF | Augmented Dickey-Fuller |
| ACF | autocorrelation function |
| PACF | partial autocorrelation function |
References
- Preliminary Statistics Published by WWEA. Available online: https://wwindea.org/blog/2018/02/12/2017-statistics/ (accessed on 12 February 2018).
- Ding, Y.; Shao, C.; Yan, J.; Song, Y.; Zhang, C.; Guo, C. Economical flexibility options for integrating fluctuating wind energy in power systems: The case of China. Appl. Energy 2018, 228, 426–436. [Google Scholar] [CrossRef]
- Jurasz, J.; Mikulik, J.; Krzywda, M.; Ciapala, B.; Janowski, M. Integrating a wind- and solar-powered hybrid to the power system by coupling it with a hydroelectric power station with pumping installation. Energy 2018, 144, 549–563. [Google Scholar] [CrossRef]
- Huang, Y.; Keatley, P.; Chen, H.; Zhang, X.; Rolfe, A.; Hewitt, N. Techno-economic study of compressed air energy storage systems for the grid integration of wind power. Int. J. Energy Res. 2018, 42, 559–569. [Google Scholar] [CrossRef]
- Lee, D. Very short-Term wind power ensemble forecasting without numerical weather prediction through the predictor design. J. Electr. Eng. Technol. 2017, 12, 2177–2186. [Google Scholar]
- Zhang, C.; Zhou, J.; Li, C.; Fu, W.; Peng, T. A compound structure of ELM based on feature selection and parameter optimization using hybrid backtracking search algorithm for wind speed forecasting. Energy Convers. Manag. 2017, 143, 360–376. [Google Scholar] [CrossRef]
- Liu, H.; Duan, Z.; Han, F.; Li, Y. Big multi-step wind speed forecasting model based on secondary decomposition, ensemble method and error correction algorithm. Energy Convers. Manag. 2018, 156, 525–541. [Google Scholar] [CrossRef]
- Liu, H.; Mi, X.; Li, Y. Smart multi-step deep learning model for wind speed forecasting based on variational mode decomposition, singular spectrum analysis, LSTM network and ELM. Energy Convers. Manag. 2018, 159, 54–64. [Google Scholar] [CrossRef]
- Zhou, J.; Sun, N.; Jia, B.; Peng, T. A novel decomposition-optimization model for short-term wind speed forecasting. Energies 2018, 11, 1752. [Google Scholar] [CrossRef]
- Torres, J.; Garcia, A.; De Blas, M. Forecast of hourly average wind speed with ARMA models in Navarre (Spain). Sol. Energy 2005, 79, 65–77. [Google Scholar] [CrossRef]
- Liu, H.; Erdem, E.; Shi, J. Comprehensive evaluation of ARMA-GARCH(-M) approaches for modeling the mean and volatility of wind speed. Appl. Energy 2011, 88, 724–732. [Google Scholar] [CrossRef]
- Lydia, M.; Kumar, S.; Selvakumar, A.; Kumar, G. Linear and non-linear autoregressive models for short-term wind speed forecasting. Energy Convers. Manag. 2016, 112, 115–124. [Google Scholar] [CrossRef]
- Li, G.; Shi, J. On comparing three artificial neural networks for wind speed forecasting. Appl. Energy 2010, 87, 2313–2320. [Google Scholar] [CrossRef]
- Noorollahi, Y.; Jokar, M.; Kalhor, A. Using artificial neural networks for temporal and spatial wind speed forecasting in Iran. Energy Convers. Manag. 2016, 115, 17–25. [Google Scholar] [CrossRef]
- Zhou, J.; Shi, J.; Li, G. Fine tuning support vector machines for short-term wind speed forecasting. Energy Convers. Manag. 2011, 52, 1990–1998. [Google Scholar] [CrossRef]
- Salcedo-Sanz, S.; Pastor-Sánchez, A.; Prieto, L.; Blanco-Aguilera, A.; Garcia-Herrera, R. Feature selection in wind speed prediction systems based on a hybrid coral reefs optimization–Extreme learning machine approach. Energy Convers. Manag. 2014, 87, 10–18. [Google Scholar] [CrossRef]
- Hu, Q.; Zhang, R.; Zhou, Y. Transfer learning for short-term wind speed prediction with deep neural networks. Renew. Energy 2016, 85, 83–95. [Google Scholar] [CrossRef]
- Chen, J.; Zeng, G.; Zhou, W.; Du, W.; Lu, K. Wind speed forecasting using nonlinear-learning ensemble of deep learning time series prediction and extremal optimization. Energy Convers. Manag. 2018, 165, 681–695. [Google Scholar] [CrossRef]
- Tascikaraoglu, A.; Uzunoglu, M. A review of combined approaches for prediction of short-term wind speed and power. Renew. Sustain. Energy Rev. 2014, 34, 243–254. [Google Scholar] [CrossRef]
- Huang, N.E.; Shen, Z.; Long, S. The empirical mode decomposition and the Hilbert spectrum for nonlinear and nonstationary time series analysis. Proc. R. Soc. A 1998, 454, 903–995. [Google Scholar] [CrossRef]
- Boudraa, A.; Cexus, J. EMD-Based Signal Filtering. IEEE Trans. Instrum. Meas. 2007, 56, 2196–2202. [Google Scholar] [CrossRef]
- Guo, Z.; Zhao, W.; Lu, H.; Wang, J. Multi-step forecasting for wind speed using a modified EMD-based artificial neural network model. Renew. Energy 2012, 37, 241–249. [Google Scholar] [CrossRef]
- Liu, H.; Tian, H.; Liang, X.; Li, Y. New wind speed forecasting approaches using fast ensemble empirical model decomposition, genetic algorithm, Mind Evolutionary Algorithm and Artificial Neural Networks. Renew. Energy 2015, 83, 1066–1075. [Google Scholar] [CrossRef]
- Liu, H.; Tian, H.; Li, Y. Comparison of new hybrid FEEMD-MLP, FEEMD-ANFIS, wavelet packet-MLP and wavelet packet-ANFIS for wind speed predictions. Energy Convers. Manag. 2015, 89, 1–11. [Google Scholar] [CrossRef]
- Liu, H.; Tian, H.; Liang, X.; Li, Y. Wind speed forecasting approach using secondary decomposition algorithm and Elman neural networks. Appl. Energy 2015, 157, 183–194. [Google Scholar] [CrossRef]
- Xiao, L.; Qian, F.; Shao, W. Multi-step wind speed forecasting based on a hybrid forecasting architecture and an improved bat algorithm. Energy Convers. Manag. 2017, 143, 410–430. [Google Scholar] [CrossRef]
- Sun, W.; Wang, Y. Short-term wind speed forecasting based on fast ensemble empirical mode decomposition, phase space reconstruction, sample entropy and improved back-propagation neural network. Energy Convers. Manag. 2018, 157, 1–12. [Google Scholar] [CrossRef]
- Santhosh, M.; Venkaiah, C.; Vinod Kumar, D. Ensemble empirical mode decomposition based adaptive wavelet neural network method for wind speed prediction. Energy Convers. Manag. 2018, 168, 482–493. [Google Scholar] [CrossRef]
- Du, P.; Wang, J.; Guo, Z.; Yang, W. Research and application of a novel hybrid forecasting system based on multi-objective optimization for wind speed forecasting. Energy Convers. Manag. 2017, 150, 90–107. [Google Scholar] [CrossRef]
- He, Q.; Wang, J.; Lu, H. A hybrid system for short-term wind speed forecasting. Appl. Energy 2018, 226, 756–771. [Google Scholar] [CrossRef]
- Song, J.; Wang, J.; Lu, H. A novel combined model based on advanced optimization algorithm for short-term wind speed forecasting. Appl. Energy 2018, 215, 643–658. [Google Scholar] [CrossRef]
- Wang, J.; Yang, W.; Du, P.; Niu, T. A novel hybrid forecasting system of wind speed based on a newly developed multi-objective sine cosine algorithm. Energy Convers. Manag. 2018, 163, 134–150. [Google Scholar] [CrossRef]
- Liu, H.; Tian, H.; Li, Y. Four wind speed multi-step forecasting models using extreme learning machines and signal decomposing algorithms. Energy Convers. Manag. 2015, 100, 16–22. [Google Scholar] [CrossRef]
- Mi, X.; Liu, H.; Li, Y. Wind speed forecasting method using wavelet, extreme learning machine and outlier correction algorithm. Energy Convers. Manag. 2017, 151, 709–722. [Google Scholar] [CrossRef]
- Liu, H.; Mi, X.; Li, Y. An experimental investigation of three new hybrid wind speed forecasting models using multi-decomposing strategy and ELM algorithm. Renew. Energy 2018, 123, 694–705. [Google Scholar] [CrossRef]
- Sun, W.; Liu, M. Wind speed forecasting using FEEMD echo state networks with RELM in Hebei, China. Energy Convers. Manag. 2016, 114, 197–208. [Google Scholar] [CrossRef]
- Zheng, W.; Peng, X.; Lu, D.; Zhang, D.; Liu, Y.; Lin, Z.; Lin, L. Composite quantile regression extreme learning machine with feature selection for short-term wind speed forecasting: A new approach. Energy Convers. Manag. 2017, 151, 737–752. [Google Scholar] [CrossRef]
- Hu, J.; Wang, J.; Zeng, G. A hybrid forecasting approach applied to wind speed time series. Renew. Energy 2013, 60, 185–194. [Google Scholar] [CrossRef]
- Zhang, C.; Wei, H.; Zhao, J.; Liu, T.; Zhu, T.; Zhang, K. Short-term wind speed forecasting using empirical mode decomposition and feature selection. Renew. Energy 2016, 96, 727–737. [Google Scholar] [CrossRef]
- Zhang, W.; Qu, Z.; Zhang, K.; Mao, W.; Ma, Y.; Fan, X. A combined model based on CEEMDAN and modified flower pollination algorithm for wind speed forecasting. Energy Convers. Manag. 2017, 136, 439–451. [Google Scholar] [CrossRef]
- Li, H.; Wang, J.; Lu, H.; Guo, Z. Research and application of a combined model based on variable weight for short term wind speed forecasting. Renew. Energy 2018, 116, 669–684. [Google Scholar] [CrossRef]
- Woodward, W.; Gray, H.; Elliott, A. Applied Time Series Analysis; CRC Press: Boca Raton, FL, USA, 2011. [Google Scholar]
- Shi, J.; Guo, J.; Zheng, S. Evaluation of hybrid forecasting approaches for wind speed and power generation time series. Renew. Sustain. Energy Rev. 2012, 16, 3471–3480. [Google Scholar] [CrossRef]
- Breiman, L. Bagging predictors. Mach. Learn. 1996, 24, 123–140. [Google Scholar] [CrossRef] [Green Version]
- Charles, J.; Breiman, L.; Friedman, J.; Olshen, R.A. Classification and Regression Trees; Chapman&Hall: New York, NY, USA, 1984. [Google Scholar]
- Khashei, M.; Bijari, M. An artificial neural network (p,d,q) model for time series forecasting. Expert Syst. Appl. 2010, 37, 479–489. [Google Scholar] [CrossRef]
- Hagan, M.T.; Demuth, H.B.; Beale, M.H. Neural Network Design; PWS Publishing: Boston, MA, USA, 1996. [Google Scholar]
- Huang, G.; Zhu, Q.; Siew, C. Extreme learning machine: Theory and applications. Neurocomputing 2006, 70, 489–501. [Google Scholar] [CrossRef] [Green Version]
- Oehmcke, S.; Zielinski, O.; Kramer, O. Input quality aware convolutional LSTM networks for virtual marine sensors. Neurocomputing 2018, 275, 2603–2615. [Google Scholar] [CrossRef]
- Liu, H.; Mi, X.; Li, Y. Smart deep learning based wind speed prediction model using wavelet packet decomposition, convolutional neural network and convolutional long short term memory network. Energy Convers. Manag. 2018, 166, 120–131. [Google Scholar] [CrossRef]
Figure 1.
Solution process for the empirical mode decomposition (EMD) based hybrid linear/nonlinear models. Intrinsic mode functions (IMF), high-frequency IMF (HIMF), medium-frequency IMF (MIMF), low-frequency residuals (LFR), support vector machine (SVM), random forest (RF), back propagation (BP), extreme learning machines (ELM), convolutional neural network (CNN), autoregressive integrated moving average (ARIMA).

Figure 2.
Wind speed series with 10 min interval at four sites in China: (a) AnHui (AH); (b) GuangDong (GD); (c) GanSu (GS) and (d) HeiLongJiang (HLJ).
Figure 2.
Wind speed series with 10 min interval at four sites in China: (a) AnHui (AH); (b) GuangDong (GD); (c) GanSu (GS) and (d) HeiLongJiang (HLJ).

Figure 3.
Wind speed series with 1 h interval at four sites in China: (a) AH; (b) GD; (c) GanSu (GS) and (d) HLJ.
Figure 3.
Wind speed series with 1 h interval at four sites in China: (a) AH; (b) GD; (c) GanSu (GS) and (d) HLJ.

Figure 4.
Parameter significance test results of single ARIMA(1,1,1) model for 10 min data from the AH site. ACF: Autocorrelation function.
Figure 4.
Parameter significance test results of single ARIMA(1,1,1) model for 10 min data from the AH site. ACF: Autocorrelation function.

Figure 5.
EMD results of 10 min data at the AH site: (a) high-frequency intrinsic mode function (HIMF); (b) medium-frequency intrinsic mode function (MIMF) and (c) low-frequency residuals (LFR).
Figure 5.
EMD results of 10 min data at the AH site: (a) high-frequency intrinsic mode function (HIMF); (b) medium-frequency intrinsic mode function (MIMF) and (c) low-frequency residuals (LFR).
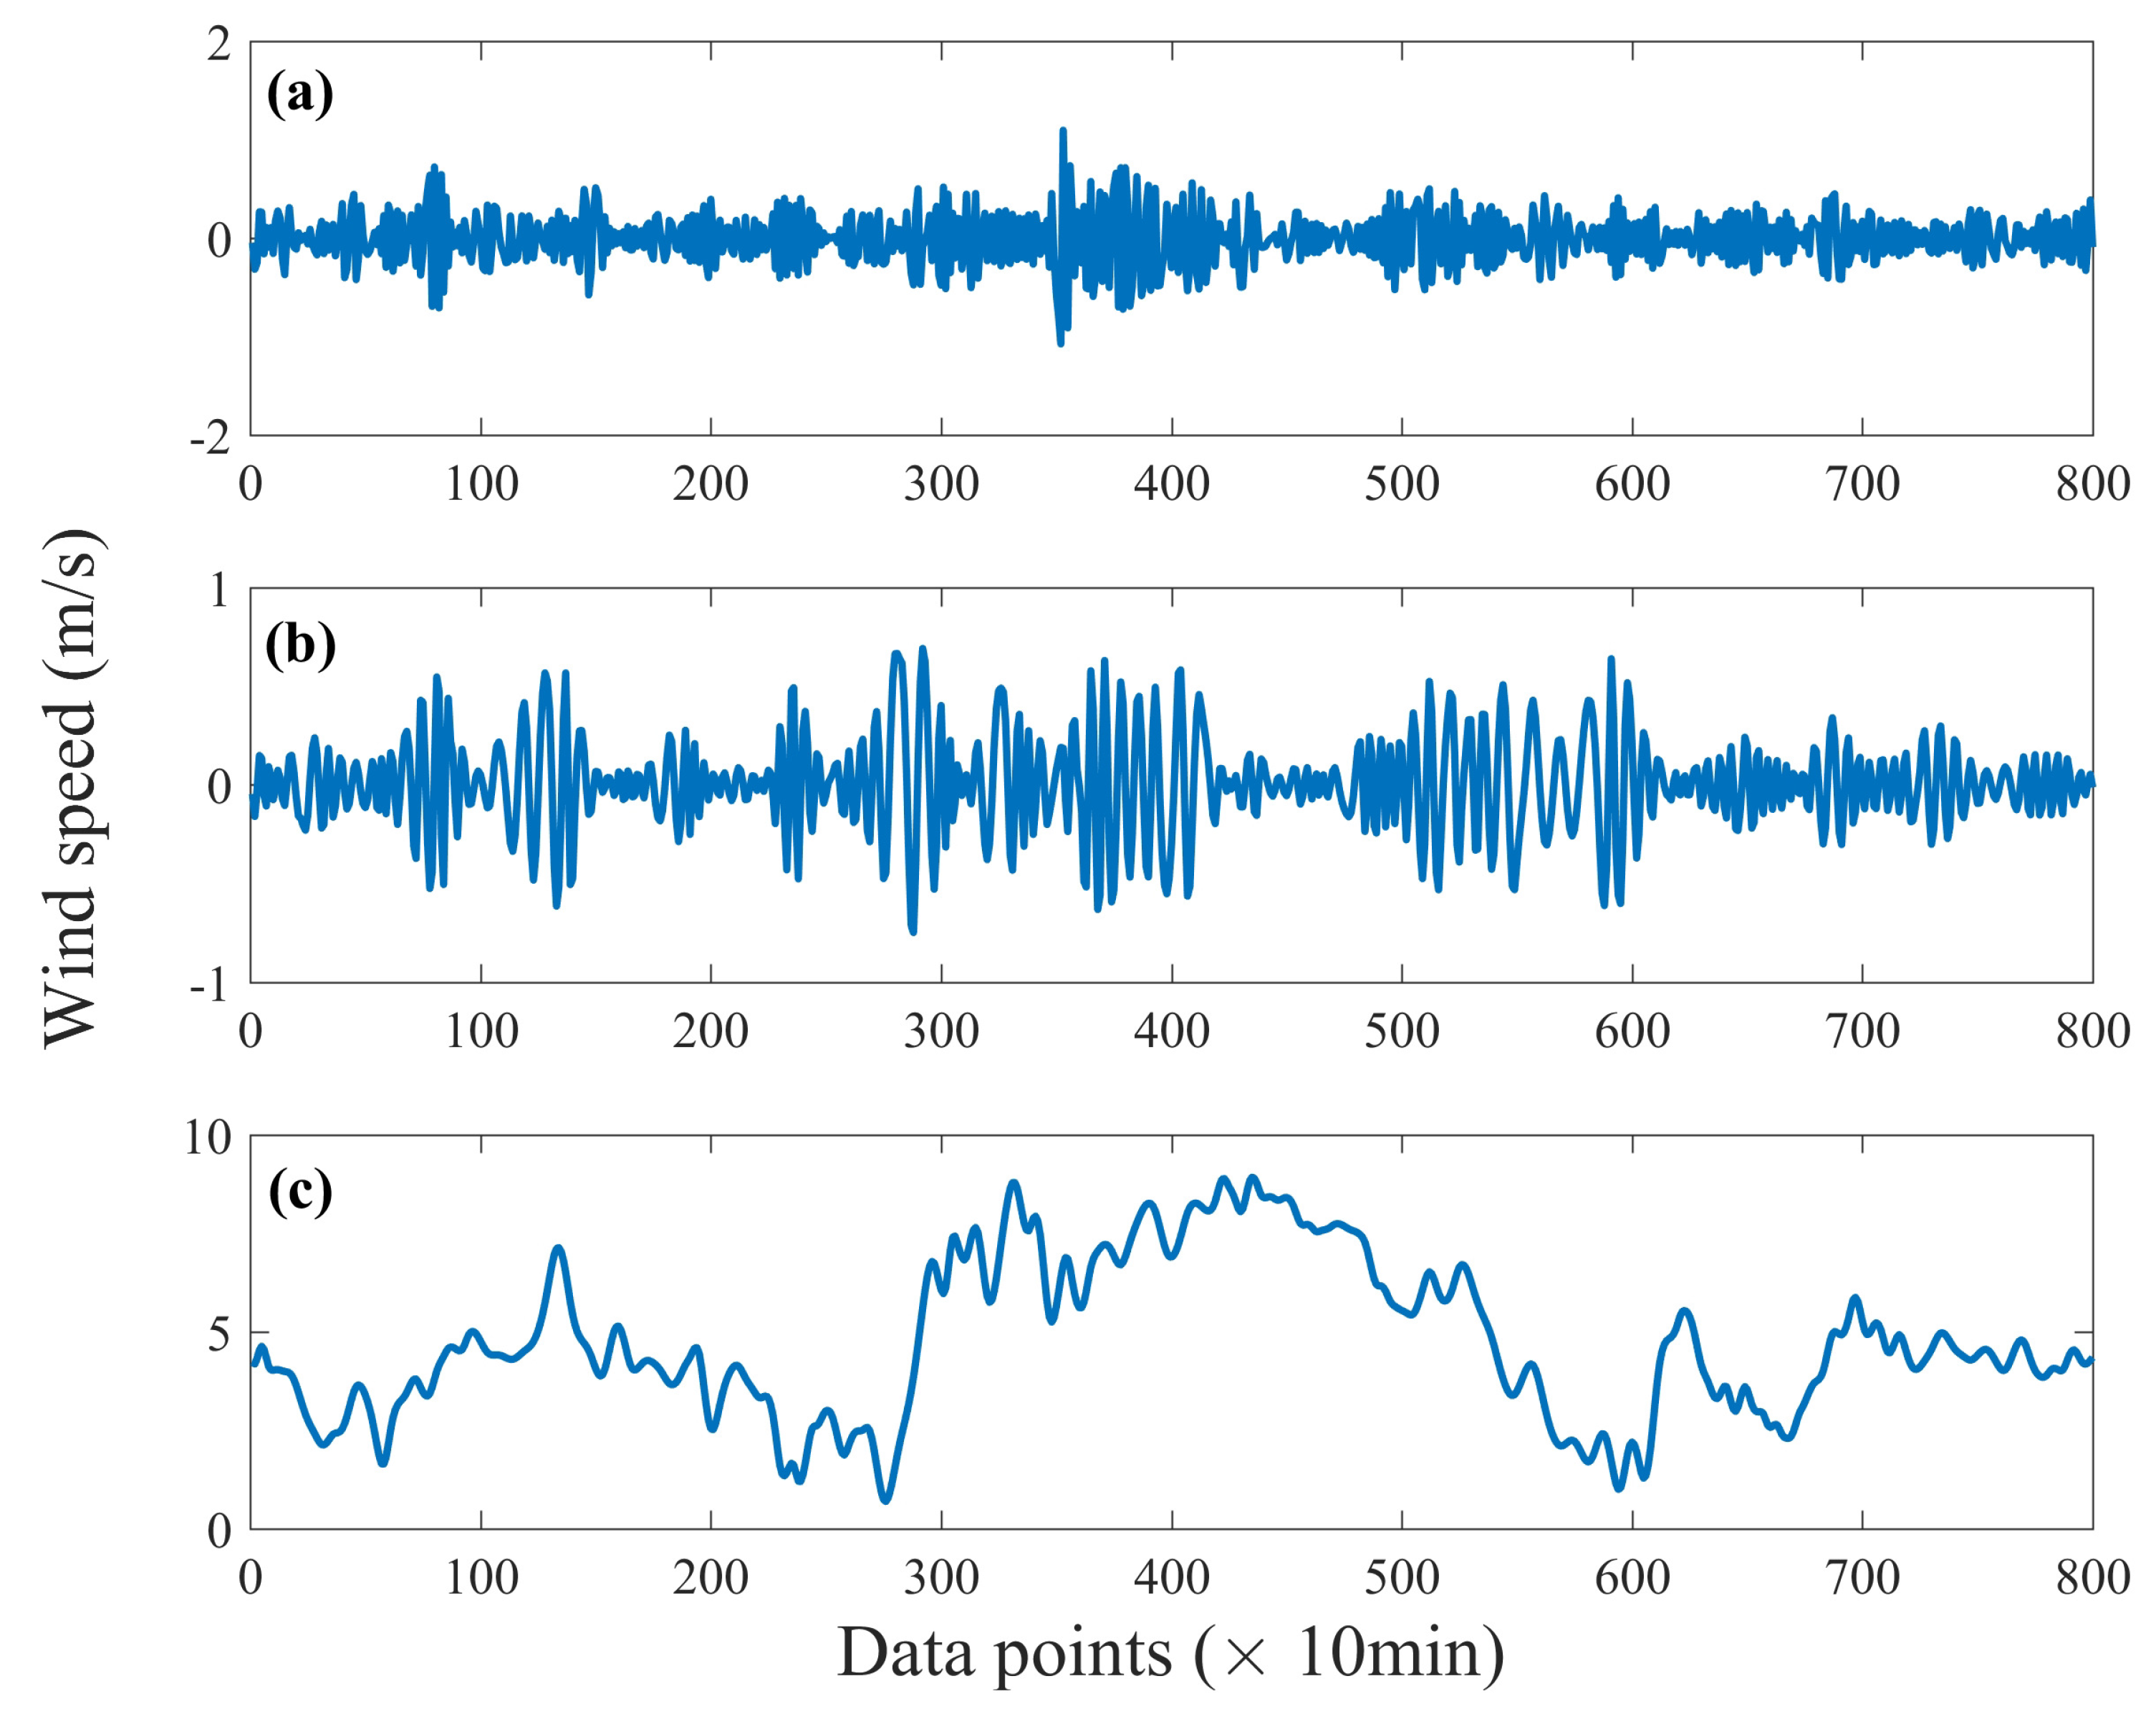
Figure 6.
Wind speed prediction comparisons for the 10 min data at the AH site. Root mean square error (RMSE), mean absolute error (MAE) and mean absolute percentage error (MAPE).
Figure 6.
Wind speed prediction comparisons for the 10 min data at the AH site. Root mean square error (RMSE), mean absolute error (MAE) and mean absolute percentage error (MAPE).

Figure 7.
Wind speed prediction comparisons for the 10 min data at the GD site.

Figure 8.
Wind speed prediction comparisons for the 10 min data at the GS site.

Figure 9.
Wind speed prediction comparisons for the 10 min data at the HLJ site.

Figure 10.
Wind speed prediction comparisons for the 1 h data at the AH site.

Figure 11.
Wind speed prediction comparisons for the 1 h data at the GD site.

Figure 12.
Wind speed prediction comparisons for the 1 h data at the GS site.

Figure 13.
Wind speed prediction comparisons for the 1 h data at the HLJ site.


Table 1.
Locations of four observation stations in China.
| Observation Station | Longitude | Latitude | Altitude (m) |
|---|---|---|---|
| AnHui (AH) | E | N | 20 |
| GuangDong (GD) | E | N | 11 |
| GanSu (GS) | E | N | 1500 |
| HeiLongJiang (HLJ) | E | N | 128 |
Table 2.
Descriptive statistics of wind speed data at four sites in China.
| Max-Min Values (m/s) | Mean (m/s) | Standard Deviation (m/s) | Skewness | Kurtosis | |
|---|---|---|---|---|---|
| AH-10 min | 9.42-0 | 4.8756 | 1.8278 | 0.1328 | 2.5460 |
| AH-1 h | 10.41-0 | 4.6009 | 1.6494 | 0.1648 | 2.9031 |
| GD-10 min | 11.9-3.0 | 7.4867 | 1.7079 | 0.1357 | 2.6211 |
| GD-1 h | 13.05-0 | 6.7162 | 2.3287 | −0.0621 | 2.5962 |
| GS-10 min | 19.15-0 | 7.2653 | 4.1582 | 0.6476 | 2.9146 |
| GS-1 h | 18.54-0 | 5.8787 | 3.3801 | 0.9460 | 3.8657 |
| HLJ-10 min | 15.97-0 | 9.4065 | 2.7275 | −0.9519 | 4.8296 |
| HLJ-1 h | 16.56-0 | 8.5214 | 2.8915 | −0.3391 | 3.0986 |
Table 3.
Single ARIMA model parameters of various wind speed datasets.
| Order | Intercept | ar1 | ma1 | ma2 | ma3 | |
|---|---|---|---|---|---|---|
| AH-10 min | (1,1,1) | 0 | 0.5383 | −0.6908 | - | - |
| AH-1 h | (1,0,1) | 4.6518 | 0.8923 | 0.1126 | - | - |
| GD-10 min | (1,1,1) | 0 | 0.8936 | −0.9664 | - | - |
| GD-1 h | (1,1,3) | 0 | 0.7755 | −0.7402 | −0.0913 | −0.0837 |
| GS-10 min | (0,1,1) | 0 | - | 0.2025 | - | - |
| GS-1 h | (1,1,1) | 0 | −0.1772 | 0.4780 | - | - |
| HLJ-10 min | (0,1,1) | 0 | - | 0.0767 | - | - |
| HLJ-1 h | (1,1,2) | 0 | 0.7807 | −0.8125 | −0.1378 |
Table 4.
Single SVM model selection for wind speed time series at the GD site, mean absolute error (MAE).
Table 4.
Single SVM model selection for wind speed time series at the GD site, mean absolute error (MAE).
| 10 min Data | |||||||
| 0.1 | 0.25 | 1 | 4 | 16 | 100 | 1000 | |
| 0.25 | 0.444 | 0.445 | 0.512 | 1.378 | 1.384 | 1.384 | 1.384 |
| 1 | 0.542 | 0.540 | 0.651 | 1.383 | 1.384 | 1.384 | 1.384 |
| 4 | 0.744 | 0.739 | 0.926 | 1.384 | 1.384 | 1.384 | 1.384 |
| 16 | 1.074 | 1.088 | 1.226 | 1.385 | 1.384 | 1.384 | 1.384 |
| 256 | 1.473 | 1.466 | 1.415 | 1.386 | 1.384 | 1.384 | 1.384 |
| 1 h Data | |||||||
| 0.1 | 0.25 | 1 | 4 | 16 | 100 | 1000 | |
| 0.25 | 0.758 | 0.754 | 0.780 | 1.596 | 1.816 | 1.816 | 1.816 |
| 1 | 0.995 | 0.996 | 1.050 | 1.769 | 1.816 | 1.816 | 1.816 |
| 4 | 1.400 | 1.407 | 1.530 | 1.863 | 1.816 | 1.816 | 1.816 |
| 16 | 1.848 | 1.849 | 1.879 | 1.877 | 1.816 | 1.816 | 1.816 |
| 256 | 1.964 | 1.961 | 1.957 | 1.879 | 1.816 | 1.816 | 1.816 |
Table 5.
Parameter selection results for single nonlinear models.
| Parameters | AH-10 min | AH-1 h | GD-10 min | GD-1 h | GS-10 min | GS-1 h | HLJ-10 min | HLJ-1 h | |
|---|---|---|---|---|---|---|---|---|---|
| SVM | 0.25 | 0.25 | 0.25 | 0.25 | 0.25 | 0.25 | 0.25 | 0.25 | |
| 0.1 | 0.1 | 0.1 | 0.25 | 0.1 | 0.25 | 0.25 | 0.25 | ||
| RF | Tree number | 50 | 200 | 300 | 700 | 200 | 200 | 100 | 300 |
| Feature number | 3 | 4 | 4 | 3 | 3 | 2 | 2 | 3 | |
| BP | Structures | s4 | s4 | s3 | s1 | s4 | s2 | s3 | s1 |
| ELM | 200 | 60 | 200 | 1000 | 40 | 200 | 40 | 100 | |
| CNN | Channels of convolutional layers are 4, 16 and 32 | ||||||||
Table 6.
Single RF model selection for wind speed time series at the HLJ site (MAE).
| 10 min Data | ||||||||
| Feature Number | Tree Number | |||||||
| 50 | 100 | 200 | 300 | 400 | 500 | 600 | 700 | |
| 1 | 0.9346 | 0.9226 | 0.9188 | 0.927 | 0.9154 | 0.9268 | 0.9266 | 0.926 |
| 2 | 0.9018 | 0.8992 | 0.902 | 0.9122 | 0.9024 | 0.9144 | 0.907 | 0.9044 |
| 3 | 0.912 | 0.9302 | 0.9192 | 0.9244 | 0.9186 | 0.9316 | 0.9236 | 0.9242 |
| 4 | 0.9774 | 0.9564 | 0.9702 | 0.9664 | 0.969 | 0.963 | 0.9752 | 0.962 |
| 1 h Data | ||||||||
| Feature number | Tree Number | |||||||
| 50 | 100 | 200 | 300 | 400 | 500 | 600 | 700 | |
| 1 | 1.0764 | 1.0744 | 1.0598 | 1.062 | 1.0632 | 1.0598 | 1.0598 | 1.0568 |
| 2 | 1.034 | 1.0264 | 1.024 | 1.0244 | 1.022 | 1.0236 | 1.0226 | 1.026 |
| 3 | 1.022 | 1.023 | 1.0268 | 1.0194 | 1.0206 | 1.0204 | 1.0206 | 1.0226 |
| 4 | 1.0278 | 1.0212 | 1.0258 | 1.0288 | 1.026 | 1.0302 | 1.025 | 1.0258 |
Table 7.
Single BP model selection for wind speed time series at the AH site (MAE).
| 10 min Data | ||||
| Structures | s1 | s2 | s3 | s4 |
| 0.457 | 0.4544 | 0.483 | 0.4084 | |
| 1 h Data | ||||
| Structures | s1 | s2 | s3 | s4 |
| 1.3316 | 0.6874 | 0.6496 | 0.5652 | |
Table 8.
Single ELM model selection for wind speed time series at the GS site (MAE).
| 10 min Data | ||||||||
| 20 | 40 | 60 | 80 | 100 | 200 | 500 | 1000 | |
| 0.3790 | 0.1133 | 0.4325 | 0.1629 | 0.0915 | 0.1169 | 0.2867 | 0.2203 | |
| 1 h Data | ||||||||
| 20 | 40 | 60 | 80 | 100 | 200 | 500 | 1000 | |
| 0.3287 | 0.7767 | 0.5471 | 0.5139 | 0.8574 | 0.2672 | 0.7078 | 0.7046 | |
Table 9.
EMD-ARIMA model parameters of various wind speed datasets.
| Order | Intercept | ar1 | ar2 | ar3 | ar4 | ar5 | ma1 | ma2 | ma3 | ma4 | |
|---|---|---|---|---|---|---|---|---|---|---|---|
| AH-10 min HIMF | (2,0,2) | −0.0072 | 0.2677 | −0.3288 | - | - | - | −0.6236 | 0.1867 | - | - |
| AH-10 min MIMF | (2,0,4) | 0.0061 | 1.0409 | −0.5285 | - | - | - | 0.7289 | −0.436 | −0.5381 | −0.1572 |
| AH-10 min LFR | (5,1,3) | 0 | 1.0418 | 0.4034 | −1.0128 | 0.3023 | 0.0501 | 1.6185 | 0.7437 | 0.0824 | - |
| AH-1 h HIMF | (2,0,2) | 0 | 0.4791 | −0.3692 | - | - | - | −0.8025 | 0.2692 | - | - |
| AH-1 h MIMF | (5,0,4) | 0 | 1.954 | −1.711 | 0.6172 | −0.0029 | −0.0971 | −0.3561 | −0.7501 | 0.0919 | 0.3172 |
| AH-1 h LFR | (3,0,4) | 4.6149 | 2.2188 | −1.7555 | 0.515 | - | - | 1.2482 | 0.9488 | 0.6001 | 0.2004 |
| GD-10 min HIMF | (1,0,2) | 0 | 0.1935 | - | - | - | - | −0.3955 | −0.2374 | - | - |
| GD-10 min MIMF | (4,0,4) | 0 | 2.2572 | −2.2493 | 1.1458 | −0.2854 | - | −0.5511 | −0.8215 | 0.2857 | 0.3155 |
| GD-10 min LFR | (4,1,1) | 0 | 2.2822 | −2.1974 | 1.0208 | −0.2126 | - | 0.2556 | - | - | - |
| GD-1 h HIMF | (2,0,2) | 0 | 0.9411 | −0.5456 | - | - | - | −1.1692 | 0.4633 | - | - |
| GD-1 h MIMF | (5,0,4) | 0 | −0.0154 | −0.0193 | −0.4017 | −0.0127 | −0.2514 | 1.9025 | 1.4405 | 0.55 | 0.0407 |
| GD-1 h LFR | (4,1,2) | 0 | 2.9386 | −3.5466 | 2.0825 | −0.5146 | - | −0.3667 | −0.3251 | - | - |
| GS-10 min HIMF | (2,0,1) | 0 | 0.3224 | −0.3344 | - | - | - | −0.4286 | - | - | - |
| GS-10 min MIMF | (2,0,4) | 0 | 1.4583 | −0.7165 | - | - | - | 0.7456 | −0.3988 | −0.7145 | −0.28 |
| GS-10 min LFR | (3,1,2) | 0 | 2.2461 | −1.7913 | 0.494 | - | - | 0.6726 | 0.0931 | - | - |
| GS-1 h HIMF | (3,0,3) | 0 | 1.1227 | −0.2833 | 0.0774 | - | - | −1.1755 | −0.0924 | 0.3303 | - |
| GS-1 h MIMF | (3,0,4) | 0 | 0.6329 | 0.0703 | −0.4106 | - | - | 0.9912 | −0.1967 | −0.6348 | −0.2965 |
| GS-1 h LFR | (4,0,1) | 6.0967 | 3.0507 | −3.6816 | 2.0904 | −0.4697 | - | 0.4522 | - | - | - |
| HLJ-10 min HIMF | (2,0,1) | 0 | 0.1808 | −0.2572 | - | - | - | −0.4975 | - | - | - |
| HLJ-10 min MIMF | (3,0,3) | −0.0176 | 1.6717 | −1.1566 | 0.2937 | - | - | 0.2927 | −0.5431 | −0.3069 | - |
| HLJ-10 min LFR | (3,1,1) | 0 | 2.2675 | −1.8836 | 0.5543 | - | - | 0.57 | - | - | - |
| HLJ-1 h HIMF | (2,0,1) | 0.0101 | 0.3971 | −0.3318 | - | - | - | −0.7131 | - | - | - |
| HLJ-1 h MIMF | (2,0,3) | 0 | 1.2475 | −0.7229 | - | - | - | 0.4612 | −0.4266 | −0.3792 | - |
| HLJ-1 h LFR | (5,1,2) | 0 | 3.0145 | −3.533 | 1.8385 | −0.2716 | −0.0681 | −0.2828 | −0.5816 | - | - |
Table 10.
Parameter selection results for single nonlinear models with EMD.
| EMD-SVM | EMD-RF | EMD-BP | EMD-ELM | EMD-CNN | |||
|---|---|---|---|---|---|---|---|
| Tree Number | Feature Number | Structures | Structures | ||||
| AH-10 min HIMF | 16 | 0.1 | 400 | 4 | s4 | 40 | Same with single CNN |
| AH-10 min MIMF | 4 | 0.1 | 600 | 4 | s1 | 80 | |
| AH-10 min LFR | 0.25 | 0.1 | 500 | 4 | s1 | 200 | |
| AH-1 h HIMF | 4 | 0.1 | 200 | 4 | s2 | 1000 | |
| AH-1 h MIMF | 1 | 0.1 | 700 | 4 | s3 | 60 | |
| AH-1 h LFR | 0.25 | 0.1 | 400 | 4 | s3 | 40 | |
| GD-10 min HIMF | 16 | 0.1 | 200 | 3 | s1 | 60 | |
| GD-10 min MIMF | 1 | 0.1 | 500 | 4 | s3 | 80 | |
| GD-10 min LFR | 0.25 | 0.1 | 100 | 4 | s1 | 40 | |
| GD-1 h HIMF | 4 | 0.1 | 200 | 4 | s3 | 80 | |
| GD-1 h MIMF | 0.25 | 0.1 | 100 | 4 | s2 | 40 | |
| GD-1 h LFR | 0.25 | 0.1 | 200 | 4 | s4 | 80 | |
| GS-10 min HIMF | 1 | 0.1 | 400 | 3 | s3 | 200 | |
| GS-10 min MIMF | 0.25 | 0.1 | 500 | 4 | s3 | 1000 | |
| GS-10 min LFR | 0.25 | 0.1 | 300 | 4 | s2 | 60 | |
| GS-1 h HIMF | 1 | 0.1 | 700 | 3 | s1 | 40 | |
| GS-1 h MIMF | 0.25 | 0.1 | 100 | 4 | s1 | 60 | |
| GS-1 h LFR | 0.25 | 0.1 | 400 | 4 | s1 | 80 | |
| HLJ-10 min HIMF | 4 | 0.1 | 100 | 4 | s1 | 40 | |
| HLJ-10 min MIMF | 1 | 0.1 | 700 | 4 | s2 | 80 | |
| HLJ-10 min LFR | 0.25 | 0.1 | 100 | 4 | s1 | 80 | |
| HLJ-1 h HIMF | 0.25 | 0.1 | 50 | 3 | s2 | 500 | |
| HLJ-1 h MIMF | 0.25 | 0.1 | 300 | 4 | s3 | 100 | |
| HLJ-1 h LFR | 0.25 | 0.1 | 500 | 4 | s4 | 100 | |
© 2018 by the authors. Licensee MDPI, Basel, Switzerland. This article is an open access article distributed under the terms and conditions of the Creative Commons Attribution (CC BY) license (http://creativecommons.org/licenses/by/4.0/).
Share and Cite
MDPI and ACS Style
Han, Q.; Wu, H.; Hu, T.; Chu, F. Short-Term Wind Speed Forecasting Based on Signal Decomposing Algorithm and Hybrid Linear/Nonlinear Models. Energies 2018, 11, 2976. https://doi.org/10.3390/en11112976
AMA Style
Han Q, Wu H, Hu T, Chu F. Short-Term Wind Speed Forecasting Based on Signal Decomposing Algorithm and Hybrid Linear/Nonlinear Models. Energies. 2018; 11(11):2976. https://doi.org/10.3390/en11112976
Chicago/Turabian StyleHan, Qinkai, Hao Wu, Tao Hu, and Fulei Chu. 2018. "Short-Term Wind Speed Forecasting Based on Signal Decomposing Algorithm and Hybrid Linear/Nonlinear Models" Energies 11, no. 11: 2976. https://doi.org/10.3390/en11112976
Note that from the first issue of 2016, this journal uses article numbers instead of page numbers. See further details here.