Consequences of the National Energy Strategy in the Mexican Energy System: Analyzing Strategic Indicators with an Optimization Energy Model


 ,
, 
Abstract
:1. Introduction
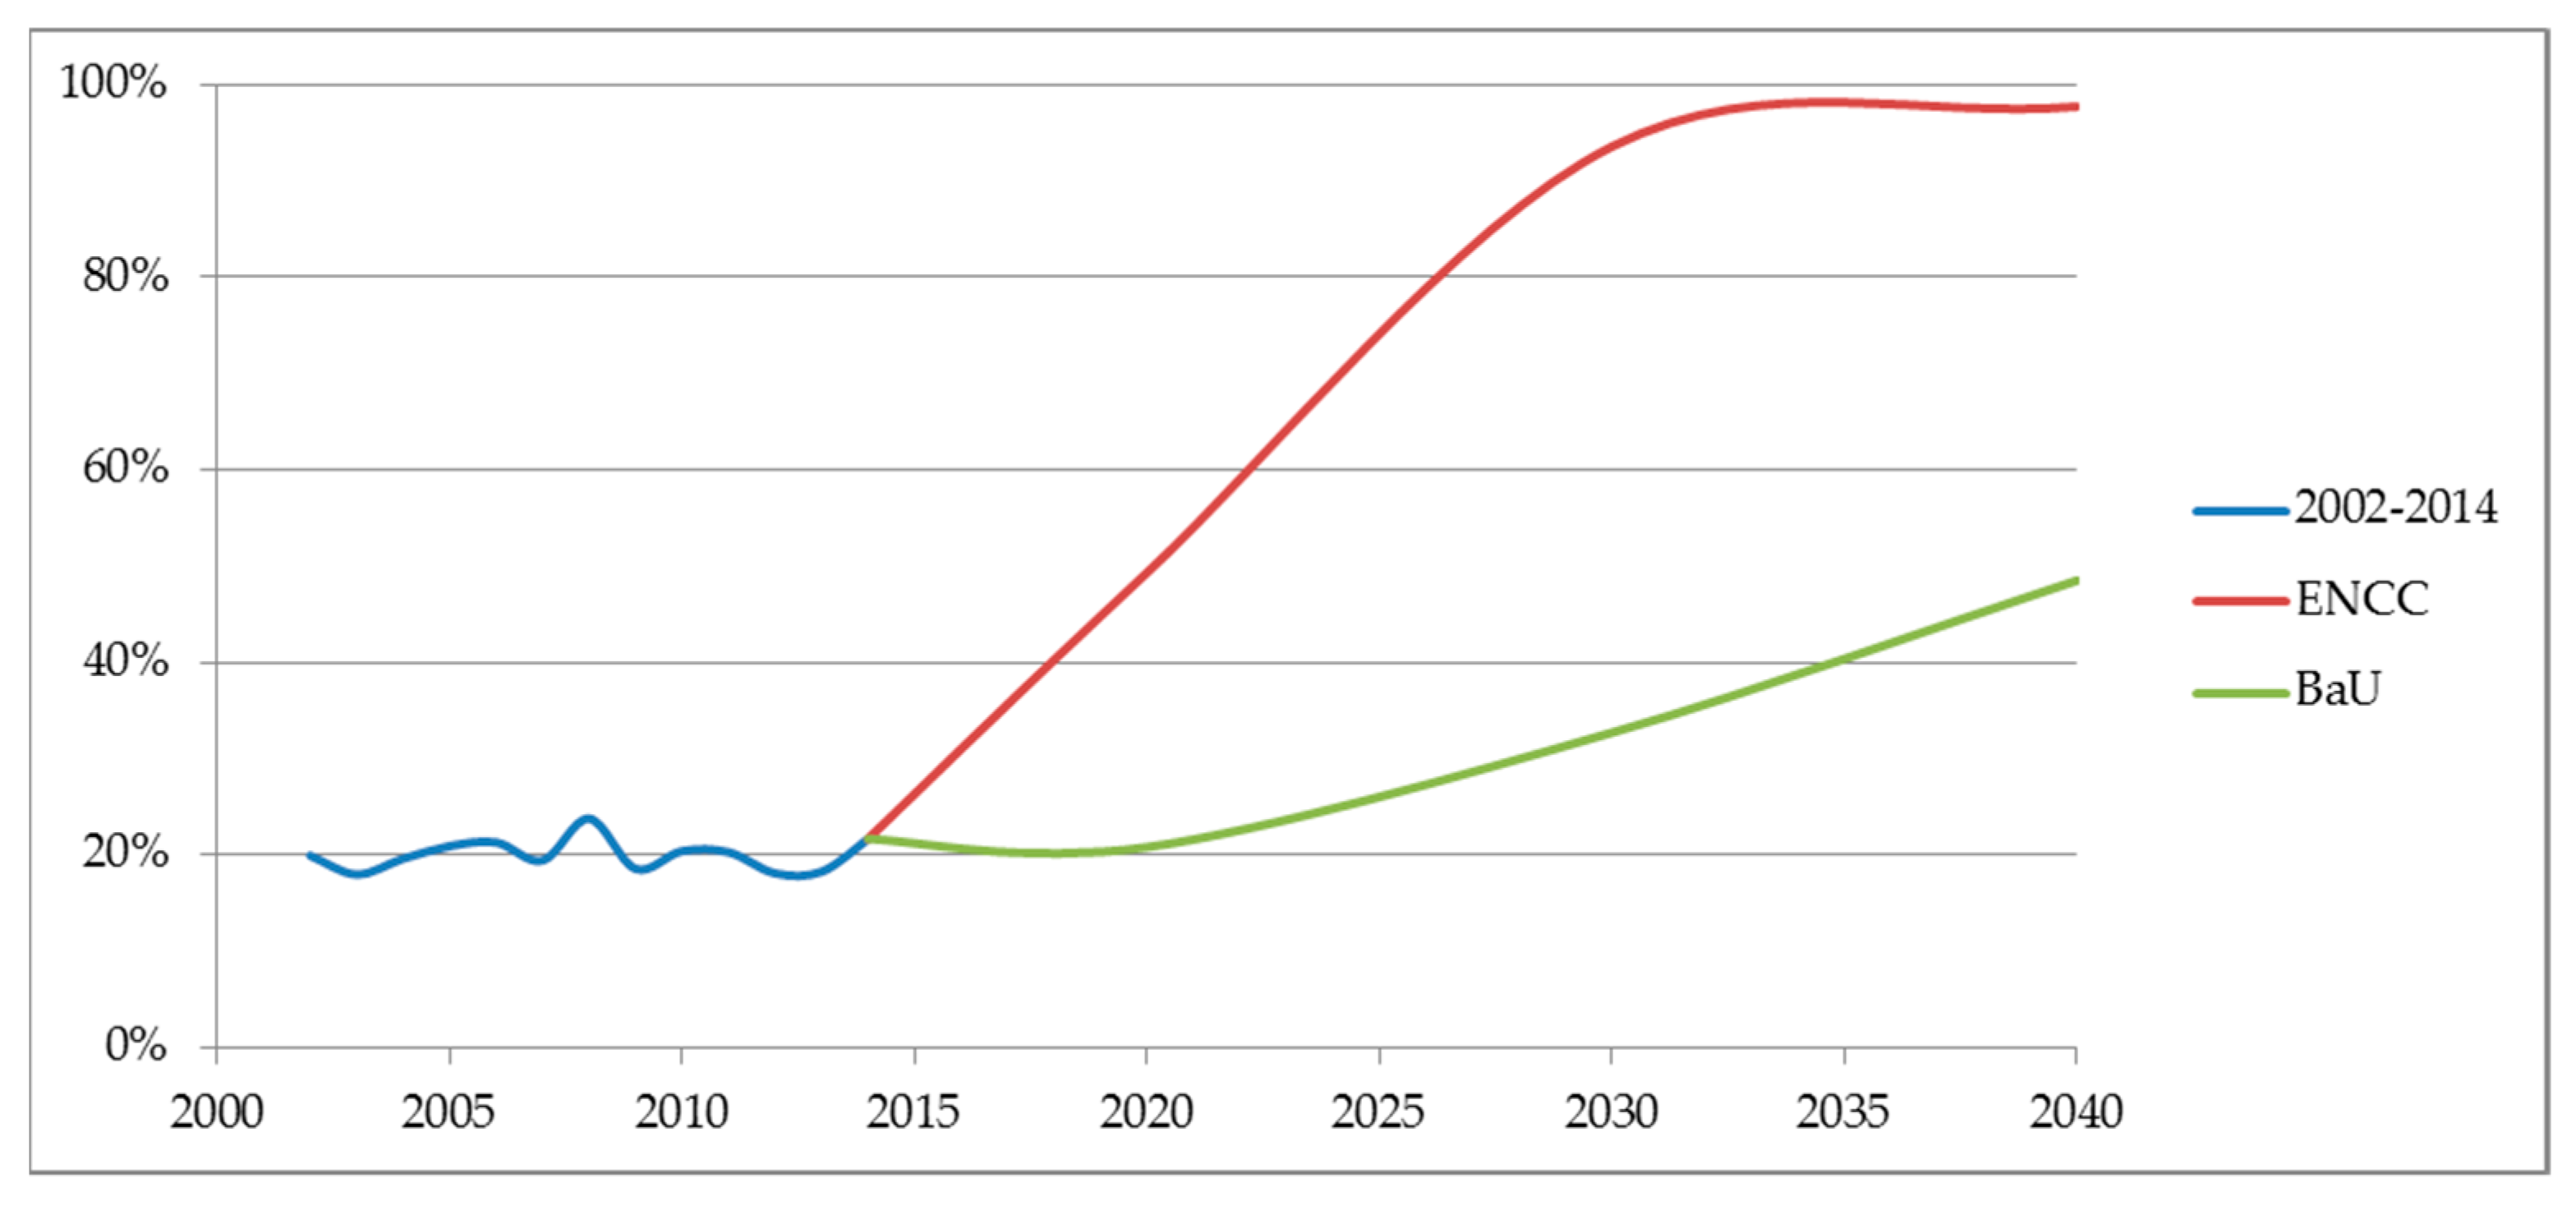
- Non-fossil fuels participation in the electricity generation
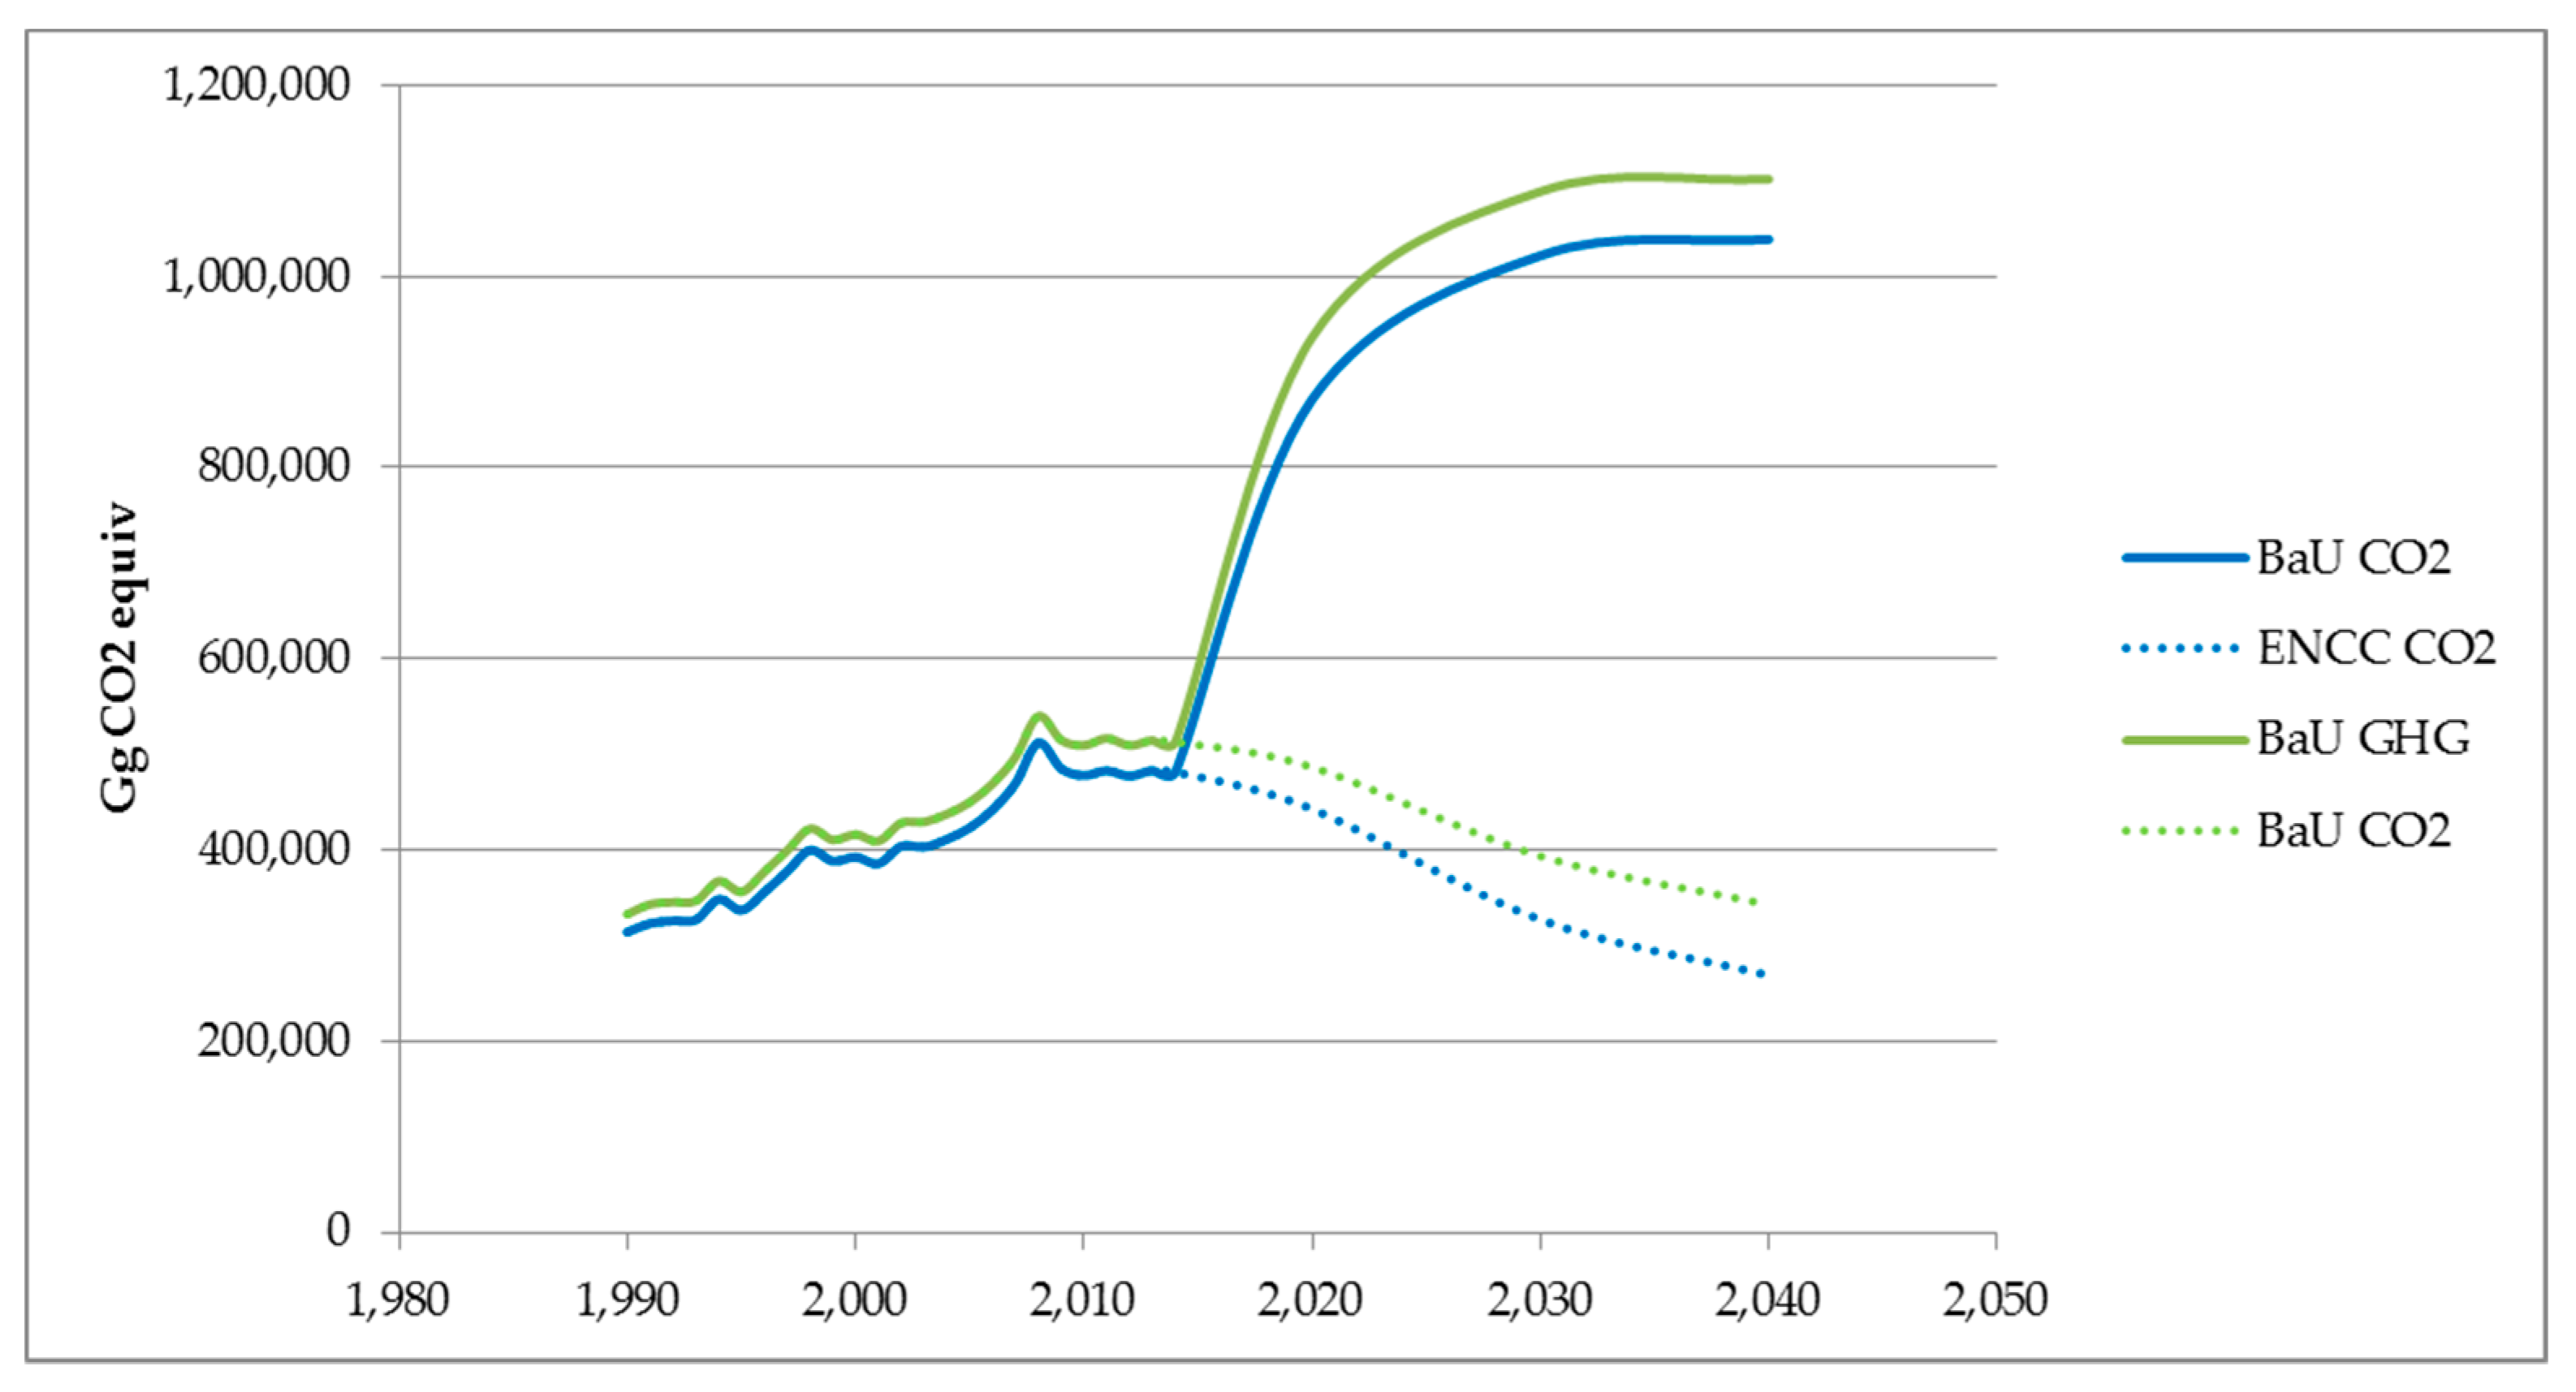
- CO2 emissions
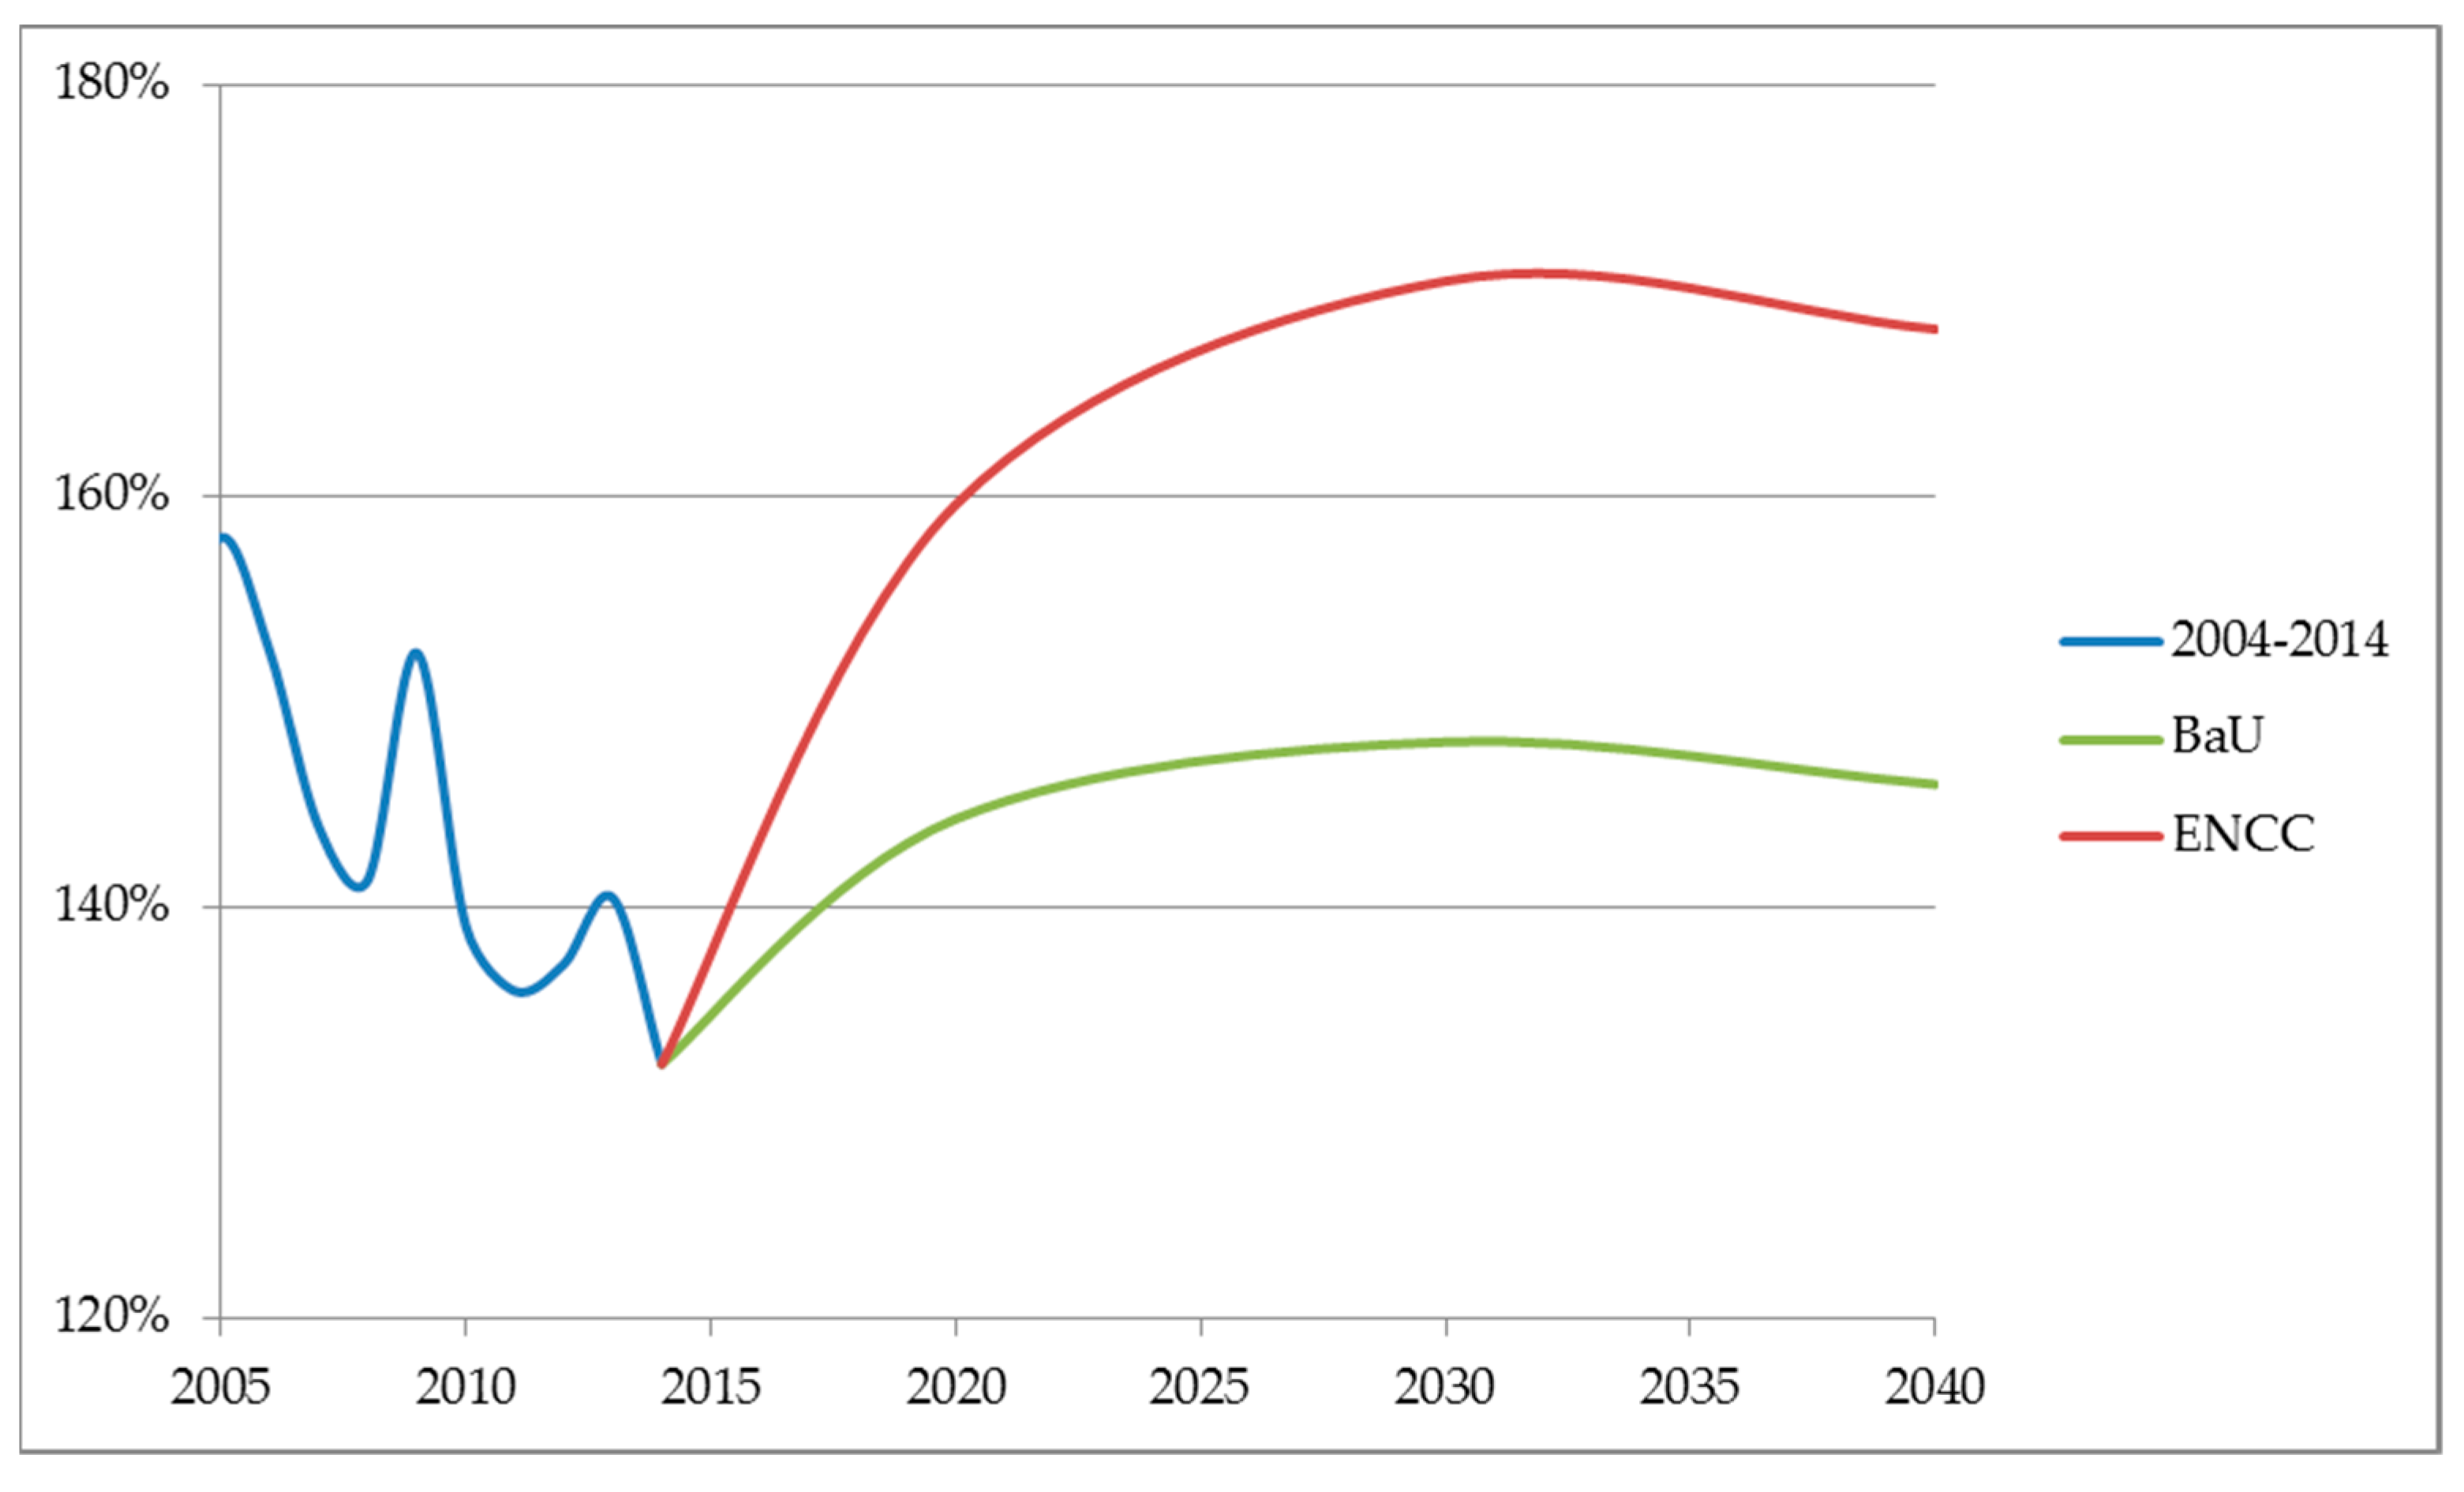
- Energy intensity
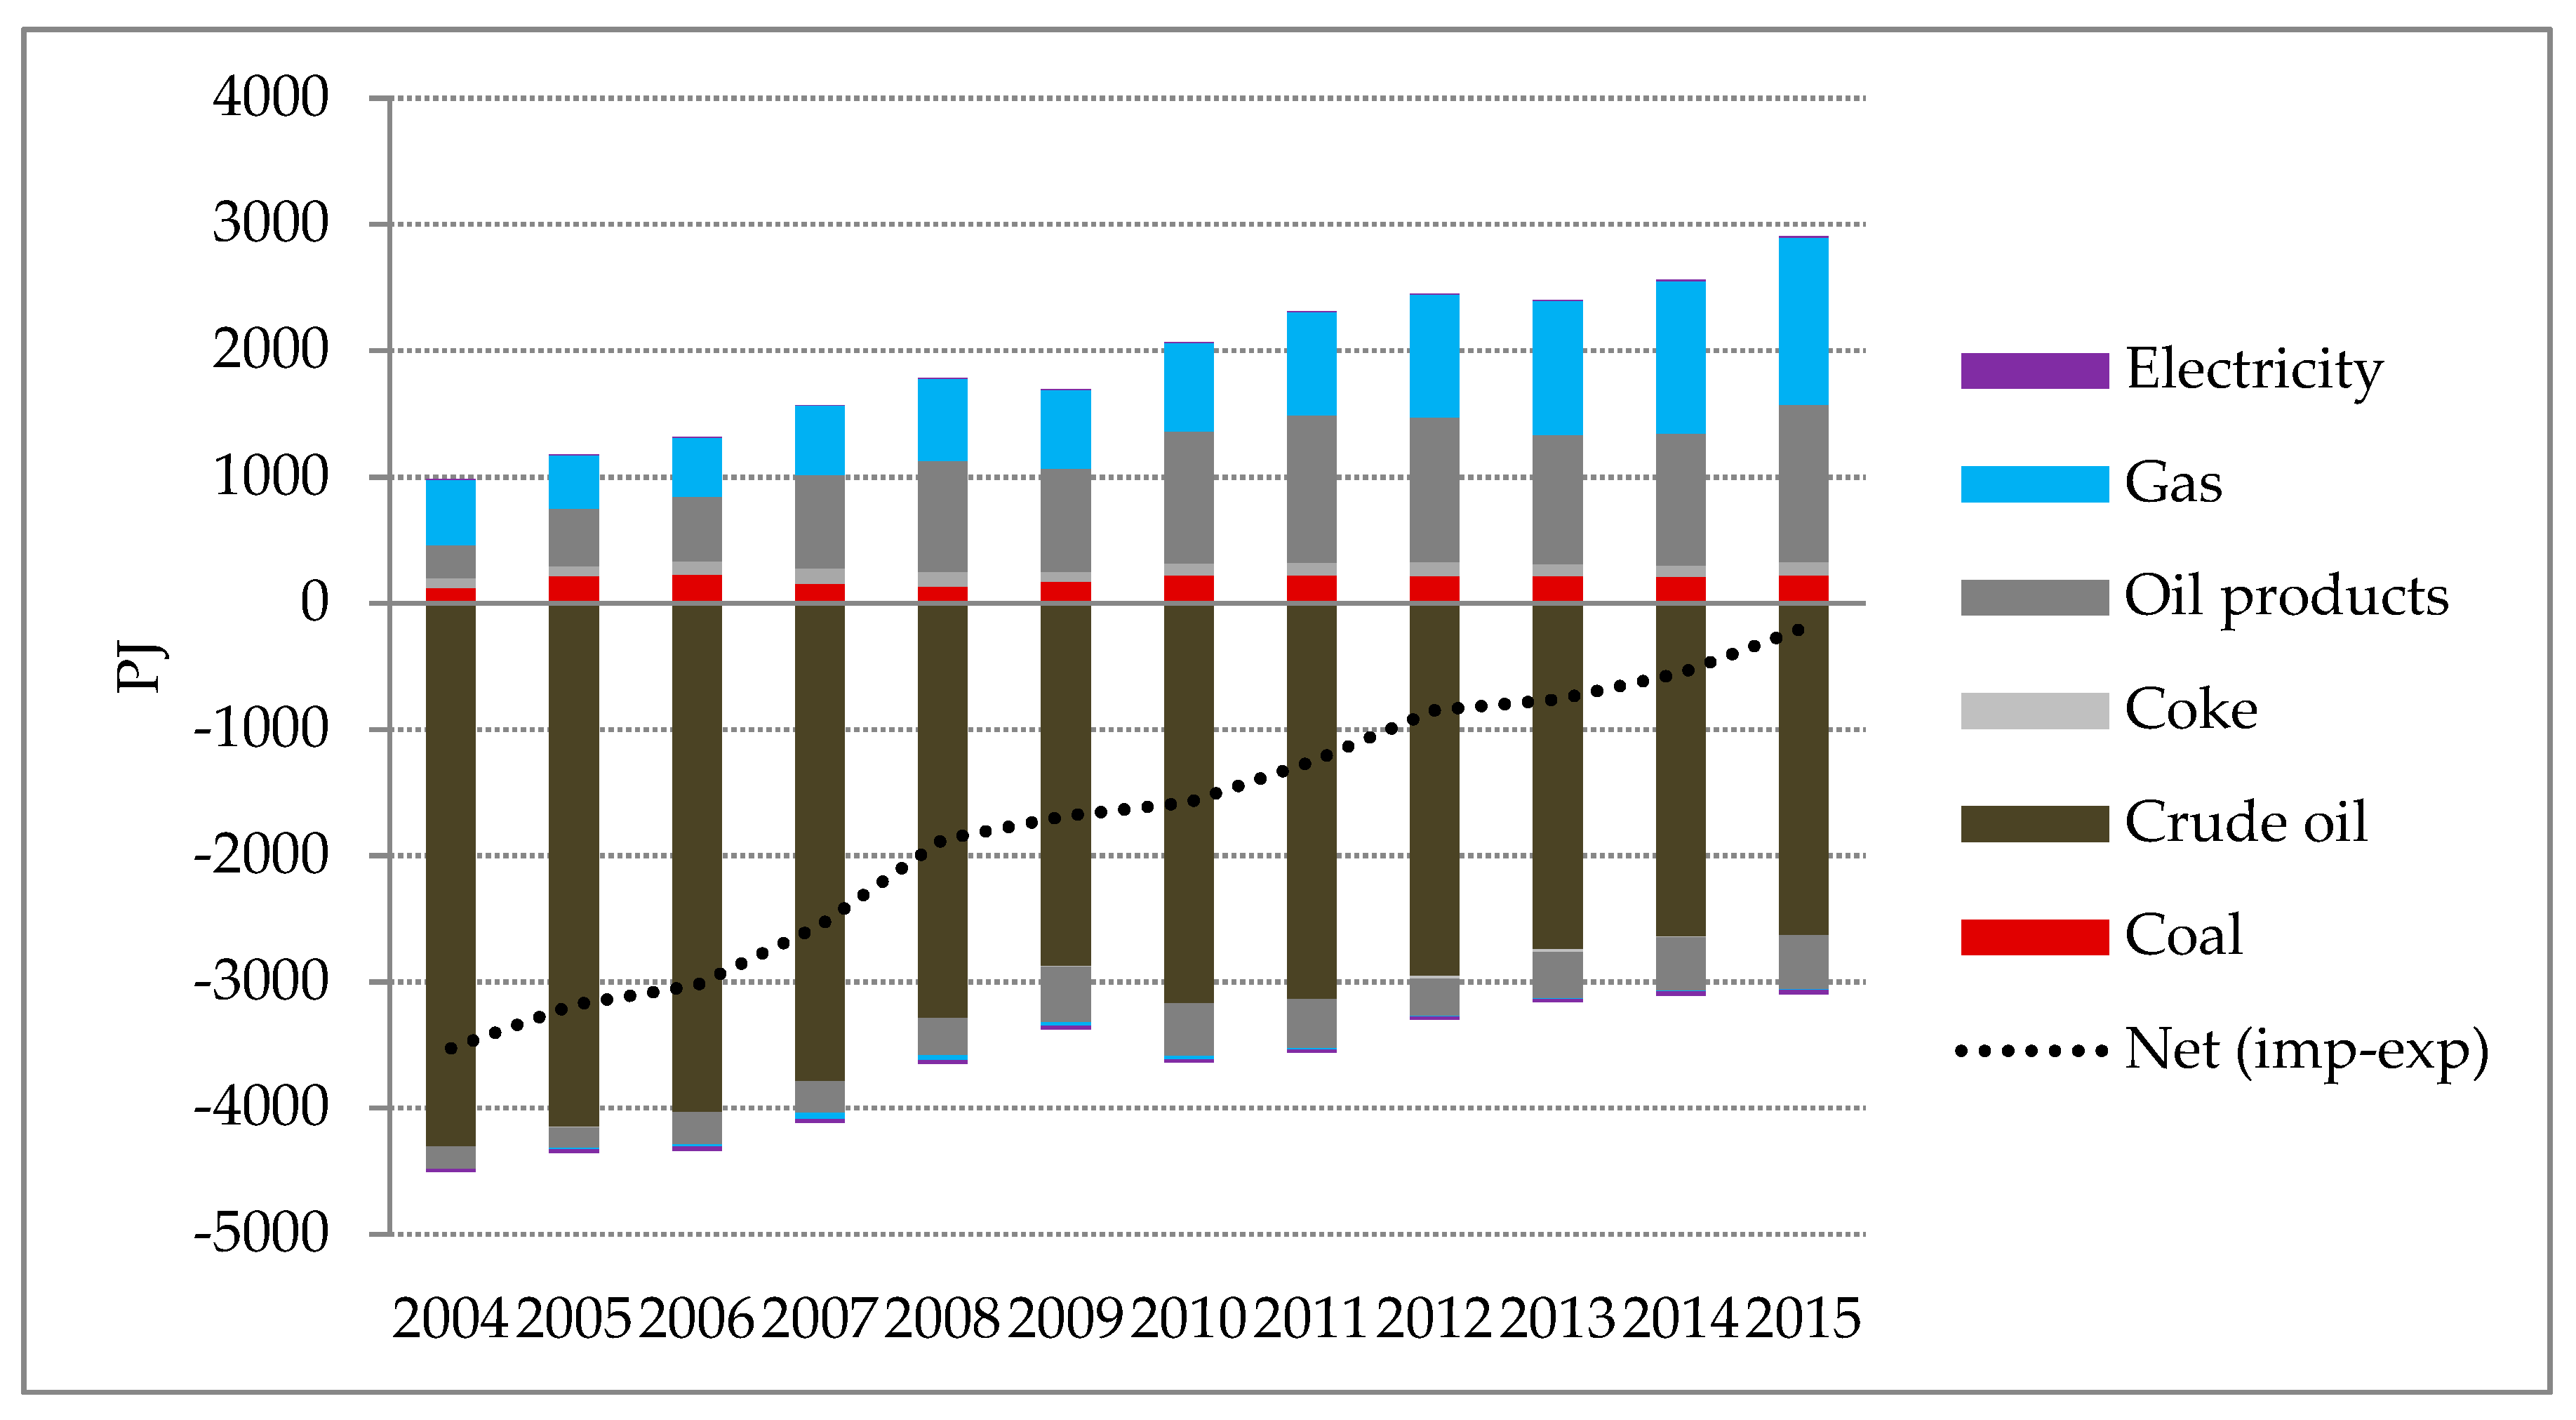
- Energy independence index
- Energy sources diversity
2. Methodology and Scenarios
2.1. EUROfusion Times Model
2.2. Long Term Scenarios
3. Results
3.1. Environmental Sustainability
3.2. Energy Security
3.3. Efficiency
4. Discussion
5. Conclusions
Author Contributions
Funding
Acknowledgments
Conflicts of Interest
References
- Gobierno de México. Reforma Energética; Gobierno de México: Ciudad de México, México, 2013. (In Spanish) [Google Scholar]
- Secretaría de Energía (SENER). Estrategia Nacional de Energía 2014–2028; Secretaría de Energía, Gobierno de México: Ciudad de México, México, 2014. (In Spanish) [Google Scholar]
- SEMARNAT. Estrategia Nacional de Cambio Climático; Secretaría de Medio Ambiente y Recursos Naturales, Gobierno de México: Ciudad de México, México, 2013. (In Spanish) [Google Scholar]
- Gobierno de México. Ley General de Cambio Climático; Diario Oficial de la Federación: Ciudad de México, México, 2012. (In Spanish) [Google Scholar]
- Gobierno de México. Ley de Transición Energética; Diario Oficial de la Federación: Ciudad de México, México, 2015. (In Spanish) [Google Scholar]
- Instituto Nacional de Estadística y Geografía (SENER). Balance Nacional de Energía 2015; Secretaría de Energía, Gobierno de México: Ciudad de México, México, 2015. (In Spanish) [Google Scholar]
- SIE, Sistema de Información Energética, Secretaría de Energía. Available online: http://sie.energia.gob.mx (accessed on 13 July 2018). (In Spanish).
- Instituto Nacional de Estadística y Geografía (SENER). Prospectiva de Energías Renovables, 2017–2031; Secretaría de Energía, Gobierno de México: Ciudad de México, México, 2018. [Google Scholar]
- U.S. Energy Information Administration. Technically Recoverable Shale Oil and Shale Gas Resources: Mexico. 2015. Available online: https://www.eia.gov/analysis/studies/worldshalegas/pdf/Mexico_2013.pdf (accessed on 12 January 2018).
- Instituto Nacional de Ecología y Cambio Climático. Inventario Nacional de Emisiones de Gases y Compuestos de Efecto Invernadero. Available online: https://www.gob.mx/inecc/acciones-y-programas/inventario-nacional-de-emisiones-de-gases-y-compuestos-de-efecto-invernadero (accessed on 6 March 2018).
- Manzini, F.; Islas, J.; Martínez, M. Reduction of greenhouse gases using renewable energies in Mexico 2025. Int. J. Hydrog. Energy 2001, 26, 145–149. [Google Scholar] [CrossRef]
- Long-Range Energy Alternatives Planning (LEAP) System; Stockholm Environment Institute: Somerville, MA, USA. Available online: www.energycommunity.org (accessed on 29 June 2018).
- Islas, J.; Manzini, F.; Martínez, M. Renewable energies in electricity generation for reduction of greenhouse gases in Mexico 2025. AMBIO 2002, 31, 35–39. [Google Scholar] [CrossRef] [PubMed]
- Islas, J.; Manzini, F.; Martínez, M. Cost-benefit analysis of energy scenarios for the Mexican power sector. Energy 2003, 28, 979–992. [Google Scholar] [CrossRef]
- Islas, J.; Manzini, F.; Martínez, M. CO2 mitigation costs for new renewable energy capacity in the Mexican electricity sector using renewable energies. Sol. Energy 2004, 76, 499–507. [Google Scholar] [CrossRef]
- Santoyo-Castelazo, E.; Gujba, H.; Azapagic, A. Life cycle assessment of electricity generation in Mexico. Energy 2011, 361, 1488–1499. [Google Scholar] [CrossRef]
- Sheinbaum-Pardo, C.; Ruiz, B.J. Energy context in Latin America. Energy 2011, 40, 39–46. [Google Scholar] [CrossRef]
- García, E.R.S.; Morales-Acevedo, A. Optimizing the energy portfolio of the Mexican electricity sector by 2050 considering CO2eq emissions and life cycle assessment. Energy Procedia 2014, 57, 850–859. [Google Scholar] [CrossRef]
- Santoyo-Castelazo, E.; Stamford, L.; Azapagic, A. Environmental implications of decarbonising electricity supply in large. Energy Convers. Manag. 2014, 85, 272–291. [Google Scholar] [CrossRef]
- Veysey, J.; Octaviano, C.; Calvin, K.; Martinez, S.H.; Kitous, A.; McFarland, J.; Van der Zwaan, B. Pathways to Mexico’s climate change mitigation targets: A multi-model analysis. Energy Econ. 2016, 56, 587–599. [Google Scholar] [CrossRef]
- Van der Zwaan, B.; Calvin, K.V.; Clarke, L.E. Climate mitigation in Latin America: Implications for energy and land use: Preface to the special section on the findings of the CLIMACAP-LAMP project. Energy Econ. 2016, 56, 495–498. [Google Scholar] [CrossRef]
- Zenón, E.; Rosellón, J. Optimal transmission planning under the Mexican new electricity market. Energy Policy 2017, 104, 349–360. [Google Scholar] [CrossRef]
- Secretaría de Energía (SENER). Programa de Desarrollo del Sistema Eléctrico Nacional 2016–2030, PRODESEN. 2016. Available online: http://base.energia.gob.mx/prodesen/PRODESEN2016/PRODESEN-2016-2030.pdf (accessed on 14 May 2018). (In Spanish).
- Simon, S.; Naegler, T.; Gils, H.C. Transformation towards a renewable energy system in Brazil and Mexico—Technological and structural options for Latin America. Energies 2018, 11, 907. [Google Scholar] [CrossRef]
- Vidal-Amaro, J.J.; Sheinbaum-Pardo, C. A Transition Strategy from fossil fuels to renewable energy sources in the Mexican electricity system. J. Sustain. Dev. Energy Water Environ. Syst. 2018, 6, 47–66. [Google Scholar] [CrossRef]
- Barragán-Beaud, C.; Pizarro-Alonso, A.; Xylia, M.; Syri, S.; Silveira, S. Carbon tax or emissions trading? An analysis of economic and political feasibility of policy mechanisms for greenhouse gas emissions reduction in the Mexican power sector. Energy Policy 2018, 122, 287–299. [Google Scholar] [CrossRef]
- Solano-Rodríguez, B.; Pizarro-Alonso, A.; Vaillancourt, K.; Martin-del-Campo, C. Mexico’s transition to a net-zero emissions energy system: Near term implications of long term stringent climate targets. In Limiting Global Warming to Well Below 2 °C: Energy System Modelling and Policy Development; Giannakidis, G., Karlsson, K., Labriet, M., Gallachóir, B., Eds.; Springer: Cham, Switzerland, 2018. [Google Scholar]
- Loulou, R.; Labriet, M. ETSAP-TIAM: The TIMES integrated assessment model Part I: Model structure. Comput. Manag. Sci. 2008, 5, 7–40. [Google Scholar] [CrossRef]
- Loulou, R. ETSAP-TIAM: The TIMES integrated assessment model. Part II: Mathematical formulation. Comput. Manag. Sci. 2008, 5, 41–66. [Google Scholar] [CrossRef]
- Capros, P.; Van Regemorter, D.; Paroussos, L.; Karkatsoulis, P. GEM-E3 Model Manual. Available online: http://www.e3mlab.eu/e3mlab/GEM%20-%20E3%20Manual/GEM-E3_manual_2015.pdf (accessed on 6 April 2018).
- Hertel, T.W.; Tsigas, M.E. Global Trade Analysis: Modeling and Applications, 1st ed.; Cambridge University Press: Cambridge, UK, 1997. [Google Scholar]
- International Energy Agency. Mexico, Energy Balances. 2018. Available online: http://www.iea.org/statistics/statisticssearch/report/?country=Mexico&product=balances&year=2010 (accessed on 8 January 2018).
- Secretaría de Energía (SENER). Prospectiva del Sector Eléctrico 2015–2029. 2015. Available online: https://www.gob.mx/cms/uploads/attachment/file/44328/Prospectiva_del_Sector_Electrico.pdf (accessed on 1 February 2018). (In Spanish).
- Shannon, C.E.; Weaver, W. The Mathematical Theory of Communication, 10th ed.; University of Illinois Press: Champaign, IL, USA, 1964. [Google Scholar]
- Instituto Nacional de Estadística y Geografía (INEGI). PIB y Cuentas Nacionales de México. 2015. Available online: http://www.inegi.org.mx/est/contenidos/proyectos/cn/pibt/ (accessed on 22 February 2017). (In Spanish).
- Vidal-Amaro, J.J.; Østergaard, P.A.; Sheinbaum-Pardo, C. Optimal energy mix for transitioning from fossil fuels to renewable energy sources—The case of the Mexican electricity system. Appl. Energy 2015, 150, 80–96. [Google Scholar] [CrossRef]


| Instrument | Targets |
|---|---|
| Law for the renewable energies exploit and energy transition financing | Maximum generation with fossil fuels 65% by 2024 60% by 2035 50% by 2050 |
| National Climate Change Strategy | I. Climate objectives GHG emissions reduction 30% by 2020 compared to base line 50% by 2050 compared to 2000 II. Electricity objectives Share of clean technologies in electricity generation 35% by 2024 40% by 2034 50% by 2054 |
| Resources | Geothermal | Small Hydro | Wind | Solar | Biomass |
|---|---|---|---|---|---|
| Possible | 188 | 159 | 315.36 | 23,400.00 | 41.35 |
| Probable | 163 | 83 | - | - | 2 |
| Proven | 9 | 18 | 72 | 90 | 12 |
| Scenario | Assumptions |
|---|---|
| BaU | No energy or climate policies 4.2 GW max new nuclear capacity by 2030 |
| ENCC | I. Climate objectives 442 Mt CO2 total by 2020 (−30% compared to 2000 levels) 210 Mt CO2 total by 2050 (−50% compared to 2000 levels) II. Electricity objectives 35% share clean energies in electricity generation by 2024 40% share clean energies in electricity generation by 2034 50% share clean energies in electricity generation by 2054 III Other 5.6 GW max, new nuclear capacity by 2030 |
© 2018 by the authors. Licensee MDPI, Basel, Switzerland. This article is an open access article distributed under the terms and conditions of the Creative Commons Attribution (CC BY) license (http://creativecommons.org/licenses/by/4.0/).
Share and Cite
Rodríguez-Martínez, A.; Lechón, Y.; Cabal, H.; Castrejón, D.; Flores, M.P.; Romero, R.J. Consequences of the National Energy Strategy in the Mexican Energy System: Analyzing Strategic Indicators with an Optimization Energy Model. Energies 2018, 11, 2837. https://doi.org/10.3390/en11102837
Rodríguez-Martínez A, Lechón Y, Cabal H, Castrejón D, Flores MP, Romero RJ. Consequences of the National Energy Strategy in the Mexican Energy System: Analyzing Strategic Indicators with an Optimization Energy Model. Energies. 2018; 11(10):2837. https://doi.org/10.3390/en11102837
Chicago/Turabian StyleRodríguez-Martínez, Antonio, Yolanda Lechón, Helena Cabal, David Castrejón, Marco Polo Flores, and R.J. Romero. 2018. "Consequences of the National Energy Strategy in the Mexican Energy System: Analyzing Strategic Indicators with an Optimization Energy Model" Energies 11, no. 10: 2837. https://doi.org/10.3390/en11102837